Article

The Power of Sun—A Comparative Cost–Benefit Analysis of Residential PV Systems in Poland

1
Department of Environmental Development and Remote Sensing, Faculty of Civil and Environmental Engineering, Warsaw University of Life Sciences-SGGW, Nowoursynowska 159, 02-776 Warsaw, Poland
2
Faculty of Civil and Environmental Engineering, Warsaw University of Life Sciences-SGGW, Nowoursynowska 166, 02-787 Warsaw, Poland
3
Department of Real Estate Market and Innovative City, Collegium of Business Administration, SGH Warsaw School of Economics, Niepodleglosci 162, 02-554 Warsaw, Poland
*
Authors to whom correspondence should be addressed.
Sustainability 2025, 17(12), 5446; https://doi.org/10.3390/su17125446
Submission received: 7 May 2025 / Revised: 10 June 2025 / Accepted: 10 June 2025 / Published: 13 June 2025

Abstract

This study evaluates the cost-effectiveness and environmental benefits of two residential photovoltaic (PV) on-grid systems in Poland: a 4.35 kWp system (V1) and a 5.70 kWp system (V2). With growing interest in prosumer energy and climate goals, assessing small-scale PV systems is critical for sustainable energy planning. Economic performance was analyzed using net present value (NPV), internal rate of return (IRR), and discounted payback period (DPP). Sensitivity analyses identified key factors affecting investment outcomes. V2 demonstrated superior performance, with an NPV five times higher than that of V1 and annual savings of EUR 1392 compared to EUR 270. V2 also achieved a 15.66% IRR and 7.7-year DPP, outperforming V1′s 5.85% IRR and 17.3-year DPP. CO2 emission reductions were 2.6 and 3.6 Mg/year for V1 and V2, respectively. The findings emphasize the importance of tailored financial incentives and regulatory reforms to support prosumers and optimize grid integration in Poland.

1. Introduction

The need to reduce carbon emissions and decrease the reliance on fossil fuels is still growing, according to the 2030 Agenda for Sustainable Development (SDG-7), especially in response to the climate crisis and more frequent extreme weather events [1].
Solar energy plays a key role in the transition to renewables due to its potential to fulfill the global energy demand [2] and the decline in solar technology costs [3]. Photovoltaic (PV) systems using the sun’s energy have significantly lower carbon emissions than fossil fuel-based energy production [4]. The carbon footprint of PV systemes is estimated in the range of 14–130 g CO2/kWh [5] and is lower than for gas (608 g CO2/kWh), oil (742 g CO2/kWh), and coal-fired (975 g CO2/kWh) power plants [6]. Also, the life cycle carbon emissions of PV systems decreased over time from 1.66 kg CO2/W in 2011 to 0.75 kg CO2/W in 2018 [7]. This reduction highlights improvements in PV technology and manufacturing processes. To demonstrate the substantial environmental benefits of PV, Yadav et al. [8] present a 4 kWp rooftop solar PV system that can reduce CO2 emissions by 113 Mg over its lifetime, equivalent to planting 181 teak trees for a 25-year cycle.
The energy payback time for PV systems has been decreasing, indicating improved efficiency. For example, the energy payback time for PV systems in China decreased from 2.4 years to 2.2 years between 2011 and 2018 [7]. Similarly, a centralized PV power station in China has an energy playback time of 1.89 years, significantly shorter than its expected 25-year lifespan [9]. Greenhouse gas (GHG) emission payback time for residential PV systems in Norway ranges from 3 to 8 years, depending on the system design and grid emission scenarios [10].
Beyond environmental benefits, PV systems are increasingly recognized as economically viable. PV-integrated systems in educational campuses [11] and industrial plants [12] have been shown to reduce grid dependency and enhance voltage security, and they are characterized as cost-effective solutions.
Energy production with CO2 emissions equivalent to a PV on-grid system is highly effective due to a significant reduction in carbon emissions compared to fossil fuels, decreasing energy payback times and indicating improved efficiency, and economic and environmental benefits, making PV systems a sustainable and cost-effective energy source. These factors collectively demonstrate the effectiveness of PV systems in contributing to a low-carbon future and addressing global climate change. Optimizing them to support consumers in enhancing regulations and infrastructure is imperative, especially in countries that are mostly dependent on fossil fuels.
Investments in PV installations and solar power plants are essential in developing renewable energy in Poland [11,12,13,14]. According to the assessment by Igliński et al. [15], PV systems could cover approximately 26% of the country’s demand for electricity at the currently calculated technical potential.
Conversely, the PV panels contain heavy metals like lead, cadmium, and chromium. When panels are discarded improperly, these metals can leach into the soil and water, leading to contamination. Studies have shown that lead and cadmium can be released significantly, potentially exceeding safe limits [16,17]. Recycling and repurposing strategies are crucial in mitigating the ecological footprint of solar panel waste [18]. High recovery rates for metals such as silver, aluminum, and lead (86%, 95%, and 97%, respectively) have been achieved through module delamination, acid etching, and sequential electrodeposition [19]. Additionally, critical elements like tellurium, indium, selenium, and gallium can be recovered from second-generation PVs [20].
The financial viability of residential PV systems across Europe is significantly influenced by the prevailing billing mechanisms, which vary by country. Three primary models are commonly employed: net metering, net billing, and feed-in tariffs (FiTs). Net metering, utilized in countries like the Slovenia, Denmark, and Netherlands (where the system is set to be phased out by 2027), allows prosumers to offset their electricity consumption with their PV generation, often resulting in favorable economic outcomes due to the ability to “bank” excess generation for later use [21]. Net billing, adopted in Poland, Belgium, and Finland, involves selling surplus electricity to the grid at market rates while purchasing electricity as needed, which can lead to less predictable returns due to market price fluctuations [22]. Until 31 March 2022, Poland applied a net metering system allowing prosumers to retrieve 0.8 kWh or 0.7 kWh per 1 kWh fed into the grid, depending on the installation size. This system remains in place for 15 years for those who joined before the cutoff. From 1 April 2022, Poland shifted to a net-billing model, where surplus energy is valued based on day-ahead market prices, eliminating the option to draw back unused energy. This change led to decreased interest in PV micro-installations. FiTs, implemented in Germany, Austria, and France, offer fixed rates for electricity fed into the grid, providing long-term revenue certainty for prosumers [23]. These differing models impact the return on investment and overall attractiveness of PV systems, with net metering and FiTs generally offering more stable and favorable conditions for prosumers compared to net billing systems. Understanding these differences is crucial for assessing the financial viability and policy effectiveness of PV adoption across Europe. This comparative analysis underscores the importance of national policy frameworks in shaping the economic outcomes of residential PV investments and highlights the need for tailored approaches to support prosumer engagement in the energy transition.
The effectiveness of PV systems under the net billing model cannot be directly compared across European countries, even if the same billing framework is applied, because each nation operates under different conditions—such as distinct regulatory environments, levels of financial support, installation costs, and capabilities of their energy grid infrastructures for handling surplus energy from prosumers. The rapid development of distributed energy is driven mainly by prosumers—individuals or businesses that own PV installations to meet their electricity needs. In Europe, Poland ranks second in terms of the total number of prosumers (after Germany) and second in the number of individual prosumers per thousand inhabitants (after the Netherlands) in 2023 [24]. According to the Energy Regulatory Office (ERO), in 2023, the volume of energy they fed into the grid accounted for approximately 80% of the country’s total PV production [25]. PV remains Poland’s undisputed leader among renewable energy sources, accounting for approximately 60% of the installed capacity in the entire renewable energy sector. The installed PV capacity in Poland at the end of 2023 reached an impressive 17.08 GW [24]. In contrast, the installed PV capacity at the end of 2020 reached nearly 4 GW, representing a 200% year-over-year increase [26]. Market growth in 2023 was primarily driven by 1.4 million prosumer micro-installations (below 50 kW), which accounted for 43% of the increase in new capacity and represented 66.3% of the total installed PV capacity [24]. As of the end of 2023, out of 1,403,875 micro-installations registered in the ERO database, as many as 1,403,199 were PV installations [24]. In terms of growth dynamics in 2023, Poland ranked fourth in the European Union (EU), and in terms of cumulative installed capacity, it climbed to sixth place [24].
The rapid expansion of prosumer energy in recent years has led to several challenges, particularly regarding integrating micro-installation capacities into the national electricity system [11]. Generally, the integration of PV systems into the power grid increases the complexity of grid management [27]. The special balancing techniques in an electrical grid required at all times to reach a precise balance between production and consumption during the weather-dependent variability of solar energy, together with load variability, are demanding. The simultaneous development of energy storage systems, smart grids with energy and power management optimization, and methods for forecasting renewable energy production and consumer consumption may be helpful [4]. These issues stem from an imbalance between the development potential of prosumer installations and the legal frameworks implemented at the national level. As a result, there has been a pressing need to revise prosumer energy regulations, leading to significant changes in the design and function of this policy instrument [15].
Therefore, the aim of this study is to perform a detailed cost–benefit assessment of two residential PV on-grid systems—one rated at 4.35 kWp (V1) and the other at 5.70 kWp (V2)—using key financial metrics such as net present value (NPV), internal rate of return (IRR), and discounted payback period (DPP). Additionally, the study evaluates their respective CO2 emission reductions and explores the broader implications of regulatory policies and financial support mechanisms on the adoption of prosumer-based solar energy systems in Poland.
Due to the volatility of energy taxation and the temporary freezing of electricity prices for households in Poland (extending the maximum electricity price at the level of EUR 115/MWh) [28], calculating reliable after-tax values for PV investments is highly uncertain. Frequent regulatory changes make it difficult to apply consistent post-tax comparisons. Therefore, this study relies on pre-tax indicators to maintain transparency, while also acknowledging that PV systems can act as an effective hedge against inflation by reducing the long-term exposure to rising energy prices.

2. Materials and Methods

2.1. Site and Rooftop PV Description

The case study involves a single-family home located approximately 20 km southwest of Warsaw, where the annual energy consumption averages 5700 kWh. The amount of solar radiation falling on a surface in this area ranges from 1022 to 1048 kWh/m2, while for Poland, it is between 950 and 1250 kWh/m2 [29].
The PV on-grid system of 4.35 kWp was installed at the end of 2022.
The selection of the two PV system sizes—4.35 kWp and 5.70 kWp—was guided by both practical constraints and optimal energy demand considerations for a typical Polish household. The first PV system (V1), with a capacity of 4.35 kWp, corresponds to the actual installed on-grid PV system at the end of 2022. This configuration reflects a real-world limitation imposed by the energy supplier, which sets a lower ordered power threshold in the prosumer agreement, thereby restricting the installed capacity. In contrast, the second system (V2), with a capacity of 5.70 kWp, was selected based on a simulation aligned with the household’s full annual energy demand, representing an optimal sizing scenario. This approach enables a comparative analysis between a constrained but typical prosumer installation and a theoretically ideal system that achieves full energy self-sufficiency. Both configurations are realistic within the Polish context, where in 2022 total energy consumption was around 4100 kWh (24% below the EU average), and where regulatory and infrastructure limitations frequently affect installation decisions [30].
For these reasons, we considered three different variants of demand and production of energy:
V0—purchase of electricity from the energy company at the level of 5700 kWh annually;
V1—the variant of installed PV of 4.35 kWp;
V2—perspective variant ensuring complete coverage of energy demand by PV of 5.70 kWp.
The design arrangement of PV modules with the level of shading of the roof is presented in Figure 1. In the case of V2, the installation will be a set of 13 roof panels and 2 ground panels. The technical descriptions of both installations are set in Table 1.

2.2. The Cost–Benefit Analysis of Energy Production with CO2 Emission Equivalent

The cost–benefit analysis (CBA) of the profitability of PV investments was based on the net present value (NPV) calculations (Equation (1)). Also, the internal rate of return (IRR) and discounted payback period (DPP) were calculated using the standard formulas (Equations (1)–(3)):
NPV is the sum of discounted economic effects and costs incurred during project implementation.
N P V = t = 1 n C F t ( 1 + r ) t I 0
where I0 is the initial investment costs [EUR], CF is cash flow [EUR], r is the discount rate [%], and t is time [years]. CF is defined as the difference between the benefits and the costs of PVs.
The internal rate of return (IRR) is the interest rate at which the NPV of all the CFs (positive and negative) from a project or investment equals zero. The IRR is used to evaluate the attractiveness of a project or investment. The IRR can be mathematically calculated using Formula (2).
0 = N P V = t = 1 n C F t ( 1 + I R R ) t I 0
The discounted payback period (DPP) is a method of assessing the profitability of investment projects. It shows the time after which the invested outlays will be returned. The DPP value was determined from the dependence of Equation (3).
D P P k = Y k + N P V k Y C F k ( Y + 1 ) ,
where DPPk is the DPP, designated for option k, [years]; Yk constitutes the number of full years before the total return is determined for option k, [years]; CFk(Y+1) is the discounted cash flow in the year (Y + 1), designated for option k, [EUR]; NPVkY is the unrecovered expenditure, determined at the beginning of the year (Y + 1), selected for option k, [EUR].
All the assumptions for the CBA with cost (C) and benefit (B) matrix for the analyzed variants are set in Table 2.
To assess the risk associated with PV projects (V0–V2) and predict their outcomes, a sensitivity analysis was conducted, using variable parameters that influence the NPV results. These parameters included the discount rate, initial investment cost, cleaning and maintenance costs (C&M costs), electricity prices, and CO2 emission cost. Each parameter—except for discount rate—was varied by ±5%, ±10%, ±15%, and ±20% from the baseline values (Table 2 and Table 3). The discount rate was adjusted only in the positive direction (+5%, +10%, +15%, and +20%). All other assumptions remained consistent with those used in the cost–benefit analysis (CBA).
Also, based on the results, the levelized cost of energy (LCOE) was calculated as a ratio of the discounted sum of investment and maintenance costs during the whole PV lifetime to the sum of produced energy during this time.
L C O E = t = 1 n I 0 + M t ( 1 + r ) t E A
where I0 is the initial investment costs [EUR], Mt is the annual maintenance costs [EUR], r is the discount rate [%], t is time [years], and EA is the annual energy production of PV [kWh].
R O I = P t I 0 I 0 · 100 [ % ]
where Pt is the total profits represent the cumulative net revenue from electricity sales or energy savings over the PV system’s operational lifespan, and I0 is the total initial investment cost in EUR.

2.3. Government Economic Policy Instruments Supporting Prosumers

Three different government programs were considered for prosumer financial support. The subsidy amounts applicable in 2023 have been included in the NPV, IRR, and DPP calculations.
  • Thermal modernization relief—the relief was introduced by the Act of 1 January 2019 [38], and it introduced that a new subjective exemption from personal income tax is deducted from the income tax return according to the tax scale (we assumed a value of 12%) from eligible costs. The program’s beneficiaries are natural persons who are owners or co-owners of single-family residential buildings. Still, the deduction cannot exceed EUR 11,307. In our cases, the relief equaled EUR 568 and EUR 694 for V1 and V2, respectively.
  • “My Electricity” program (variant of 2021–2023)—a government program that involves the purchase and installation of PV micro-installations with an installed electrical capacity of 2 kW to 10 kW, serving the needs of existing residential buildings. The program supports the development of prosumer energy, i.e., energy in which people produce energy for their own needs and transfer any surplus to the power grid. The subsidy can reach up to 50% of eligible costs, but no more than EUR 853 per project. The program started in 2021, and since then, over 560 thousand photovoltaic micro-installations have been completed [39]. In our cases, for both variants, the refund is EUR 853.
  • “Clean Air” program (program variant of 2023)—aims to improve air quality and reduce greenhouse gas emissions by exchanging heating sources and improving energy efficiency in single-family residential buildings. The program supports projects involving the dismantling of inefficient solid fuel heating sources and the purchase and installation of air-to-water or ground source heat pumps to provide heating or both heating and hot water. Additionally, PV micro-systems can also be purchased and installed as part of the program. Currently, the program does not include funding for PV installations. Since 2018, over 870 thousand contracts have been completed [40]. The program refunded up to 50% of the actual costs of purchase and installation of a PV micro-installation (from 2 kW to 10 kW) but not more than EUR 1067. In our cases, for both variants, the refund is EUR 1067.
All other assumptions for the cost–benefit analysis and the NPV calculation are the same as in Section 2.2.

3. Results

3.1. The Energy Production

To better understand the operation of a typical prosumer photovoltaic (PV) installation, Figure 2 presents a schematic diagram of a grid-connected residential PV system. The diagram illustrates the main components and the flow of energy, from the conversion of solar irradiance into electricity by PV panels, through DC-AC conversion, to energy consumption within the household or export to the electricity grid. This setup reflects the system used in the current analysis, operating under the net billing model in Poland.
The PV energy production of the first full year of working with the generated economic effect is shown in Figure 3. The installation produced 4516 kWh during the year, corresponding to EUR 684. The highest energy production was observed during summer, with 846 kWh in July. In December, energy production was more than 47 times lower and equaled only 18 kWh.

3.2. The Cost–Benefit Assessment

Considering 30 years in which the household uses around 5700 kWh/yr with the yearly increasing energy price of inflation (12.4%), the total energy cost equals EUR 256,686.47. To calculate the NPV of V0, the energy cost and the cost of emitted CO2 were taken, giving the value of EUR −93,822.32 (Table 4). The solution to such a situation will help the household reduce energy costs by installing its own PV system. During the first year of operation, the 4.35 kWp PV installation produced around 80% of the household’s yearly demand (V1). The rest of the energy was bought from the energy industry. In the case of V2, where the power of PV increased to 5.70 kWp, the household not only covers its demand but also sells surplus energy. It is well seen in the results of the NPV assessment (Table 4). The NPV results of V2 are almost five times higher than those of V1. In the case of V1, the NPV is EUR 8119, whereas for V2, it is EUR 41,765. Considering these values as annual efficiency, we get EUR 270 and EUR 1392 for V1 and V2, respectively. Although both variants are economically effective, the IRR results showed different points of view. For V1, the IRR value is only 0.85% higher than the discount rate (5%) used for calculation, and this shows that V1 is on the edge of efficiency. In the case of V2, IRR equaled 15.66%, which indicates the higher economic efficiency of such a variant. Regarding the DPP as a payback period of investments, the V1 needs around seventeen years to recover costs, whereas the V2 needs almost eight years (Figure 4).
The summary of discounted costs per produced energy, calculated as LCOE, is presented in Table 5. Notably, the LCOE costs are similar for both variants (the V2 vs. V1 is lower, EUR 0.041/kWh). Also, the calculated ROI shows the high efficiency of both variants, but V2 represents the higher value, proving this solution’s higher effectiveness. The environmental benefits of implemented PV installations are expressed as avoided CO2 emissions that equal 78.7 and 107.5 Mg CO2 during 30 years of PV lifetime for V1 and V2, respectively. Recalculating it to a yearly value gives 2.6 and 3.6 Mg for V1 and V2, respectively.
The sensitivity analysis results with different parameters show that the profitability depends on the variant presented, with the highest economic efficiency for variants V2 (only positive values for NPV), both positive and negative results for V1 NPV, and taking only negative values for V0 (Figure 5).
The comprehensive sensitivity analysis includes variables such as electricity price escalation, installation cost variation, and inflation, providing a robust view of potential investment risks.
Regardless of the tested parameters, the V0 variant always takes negative values. Even increasing the discount rate from 20% does not result in a positive NPV value. The increase in electricity prices and the price of emission allowances have the greatest impact on the NPV value for this variant. As expected, the initial investment cost and C&M costs do not affect the final result in any way. In the case of variant V1, the parameters that have the least impact on the final NPV value are the initial investment costs. Regardless of the value of CO2 emission costs, V1 is also always profitable. The value of the discount rate clearly affects the investment efficiency. Only for discount rate values in the range <0; +5%> is the NPV positive. In turn, a drop or a slight increase in electricity prices in the range <−20%; +5%> causes a lack of profitability, as does an increase in C&M costs above +15%. In the case of V2, the initial investment cost does not influence NPV results significantly. For increasing C&M costs up to +10%, a significant decrease in the efficiency of the variant is observed. Regardless of the value of the discount rate, the NPV for V2 is always positive, and the lower the discount rate, the higher the NPV. The parameters whose increase causes the greatest profitability of V2 are the increase in electricity prices and CO2 emission costs.

3.3. The Opportunities to Support Prosumers

The NPV, IRR, and DPP values for three government support programs for prosumers installing PV systems are presented in Table 6.
While the obtained NPV values are relatively similar across the programs, V2 consistently demonstrates higher economic efficiency than V1, as it meets the household’s full energy demand. In every support program, the IRR for V2 is more than two times higher than that of V1. The payback period, calculated as DPP, ranges from 6.5 to 6.9 years for V2, compared to 14.6 to 16 years for V1. Among the evaluated programs, the “Clean Air” program offers the most favorable conditions for prosumers, yielding the highest NPV and IRR values, both exceeding 5%. From the prosumer’s perspective, the payback period is a crucial metric, and the “Clean Air” program results in the shortest DPP for both V1 and V2. Each program’s assumptions—such as eligibility criteria, maximum reimbursement thresholds, and application conditions based on Polish government regulations—were incorporated into the economic calculations. The impact on the key indicators (NPV, IRR, and DPP) is summarized in Table 6.

4. Discussion

To meet the sustainable development criteria, it is necessary to include in the CBA not only the market values but also the non-market goods involved in the investment process, both on the B (benefit) and C (cost) side. Therefore, it becomes necessary to assign monetary values to all benefits and costs. Assigning monetary values to benefits and costs for non-market goods is a developmental issue that conditions the effective application of the CBA method. The above analyses show that the efficiency of prosumers’ investments in PV installations largely depends on several drivers, which we broadly grouped into economic and environmental factors.

4.1. The Economic Assessment

The NPV analysis is a popular and widespread method of evaluating the economic efficiency of different projects, such as PV installations [41,42,43,44,45,46,47,48]. The results of PV’s NPV analysis depend on many factors, such as the costs of PV power installations, energy tariffs, location and solar radiation, installation size, the complexity of the distributions, the existence or not of smart meters, cash flows of revenues and costs, discount rate, etc. [41,46]. Due to the large number of variables influencing the result of the NPV analysis, it is not easy to compare installations. For these reasons, comparing PV installations with each other is complicated and ambiguous. Also, the lifetime of installation has a crucial role in economic effectiveness. Most PV installations are supposed to be used for 20 [44] to 25 years. In our case, the producer declared a lifetime of 30 years, which also positively influences the economic effect of installations.
This study’s results align with those of studies by Bertsch et al. [49], which reflect the more significant potential for profitability and return on investment when a PV system is designed to exceed the household’s energy requirements and capitalize on surplus energy production. The findings suggest that although both PV installation configurations (V1 and V2) are economically beneficial, the scale of the system plays a critical role in shaping its financial performance and overall efficiency, a conclusion that aligns with the prior research of Panagoda et al. [50].
The higher IRR and NPV of V2 indicate that maximizing PV capacity to produce surplus energy is a more effective strategy for achieving long-term cost savings and economic sustainability, which is also supported by the findings of Tushar et al. [51]. This highlights the importance of optimizing PV system sizing to balance household energy demand with surplus energy generation, ensuring maximum economic and environmental benefits.
Other difficulties with comparing different installations come from the installed PV power. Most of the studies considered large systems of 20, 200 kWp and 1 MWp [42], 216 kWp [44], 100–1500 kWp [52], 20, 40, 60, 80, 100, and 500 kW [45], 628–2645 kW [46], and 1 MW [47]. The assessment of smaller individual installations is rarely considered in the literature, e.g., 3 and 6 kWp, 5.1–8.4 kWp [43].
Spertino et al. [42] considered two residential, small-size PV installations of 3 kWp for Italy and 6 kWp for Germany. Despite the German installation being twice as big as the Italian one because of the significant consumption typical at these latitudes, which have less sunlight, the financial results are more profitable in Italy. The NPV (pu) is a profitability of 134% in Italy and 42% in Germany. Also, the IRR for Italy reached almost 15%, whereas Germany’s is only 6%.
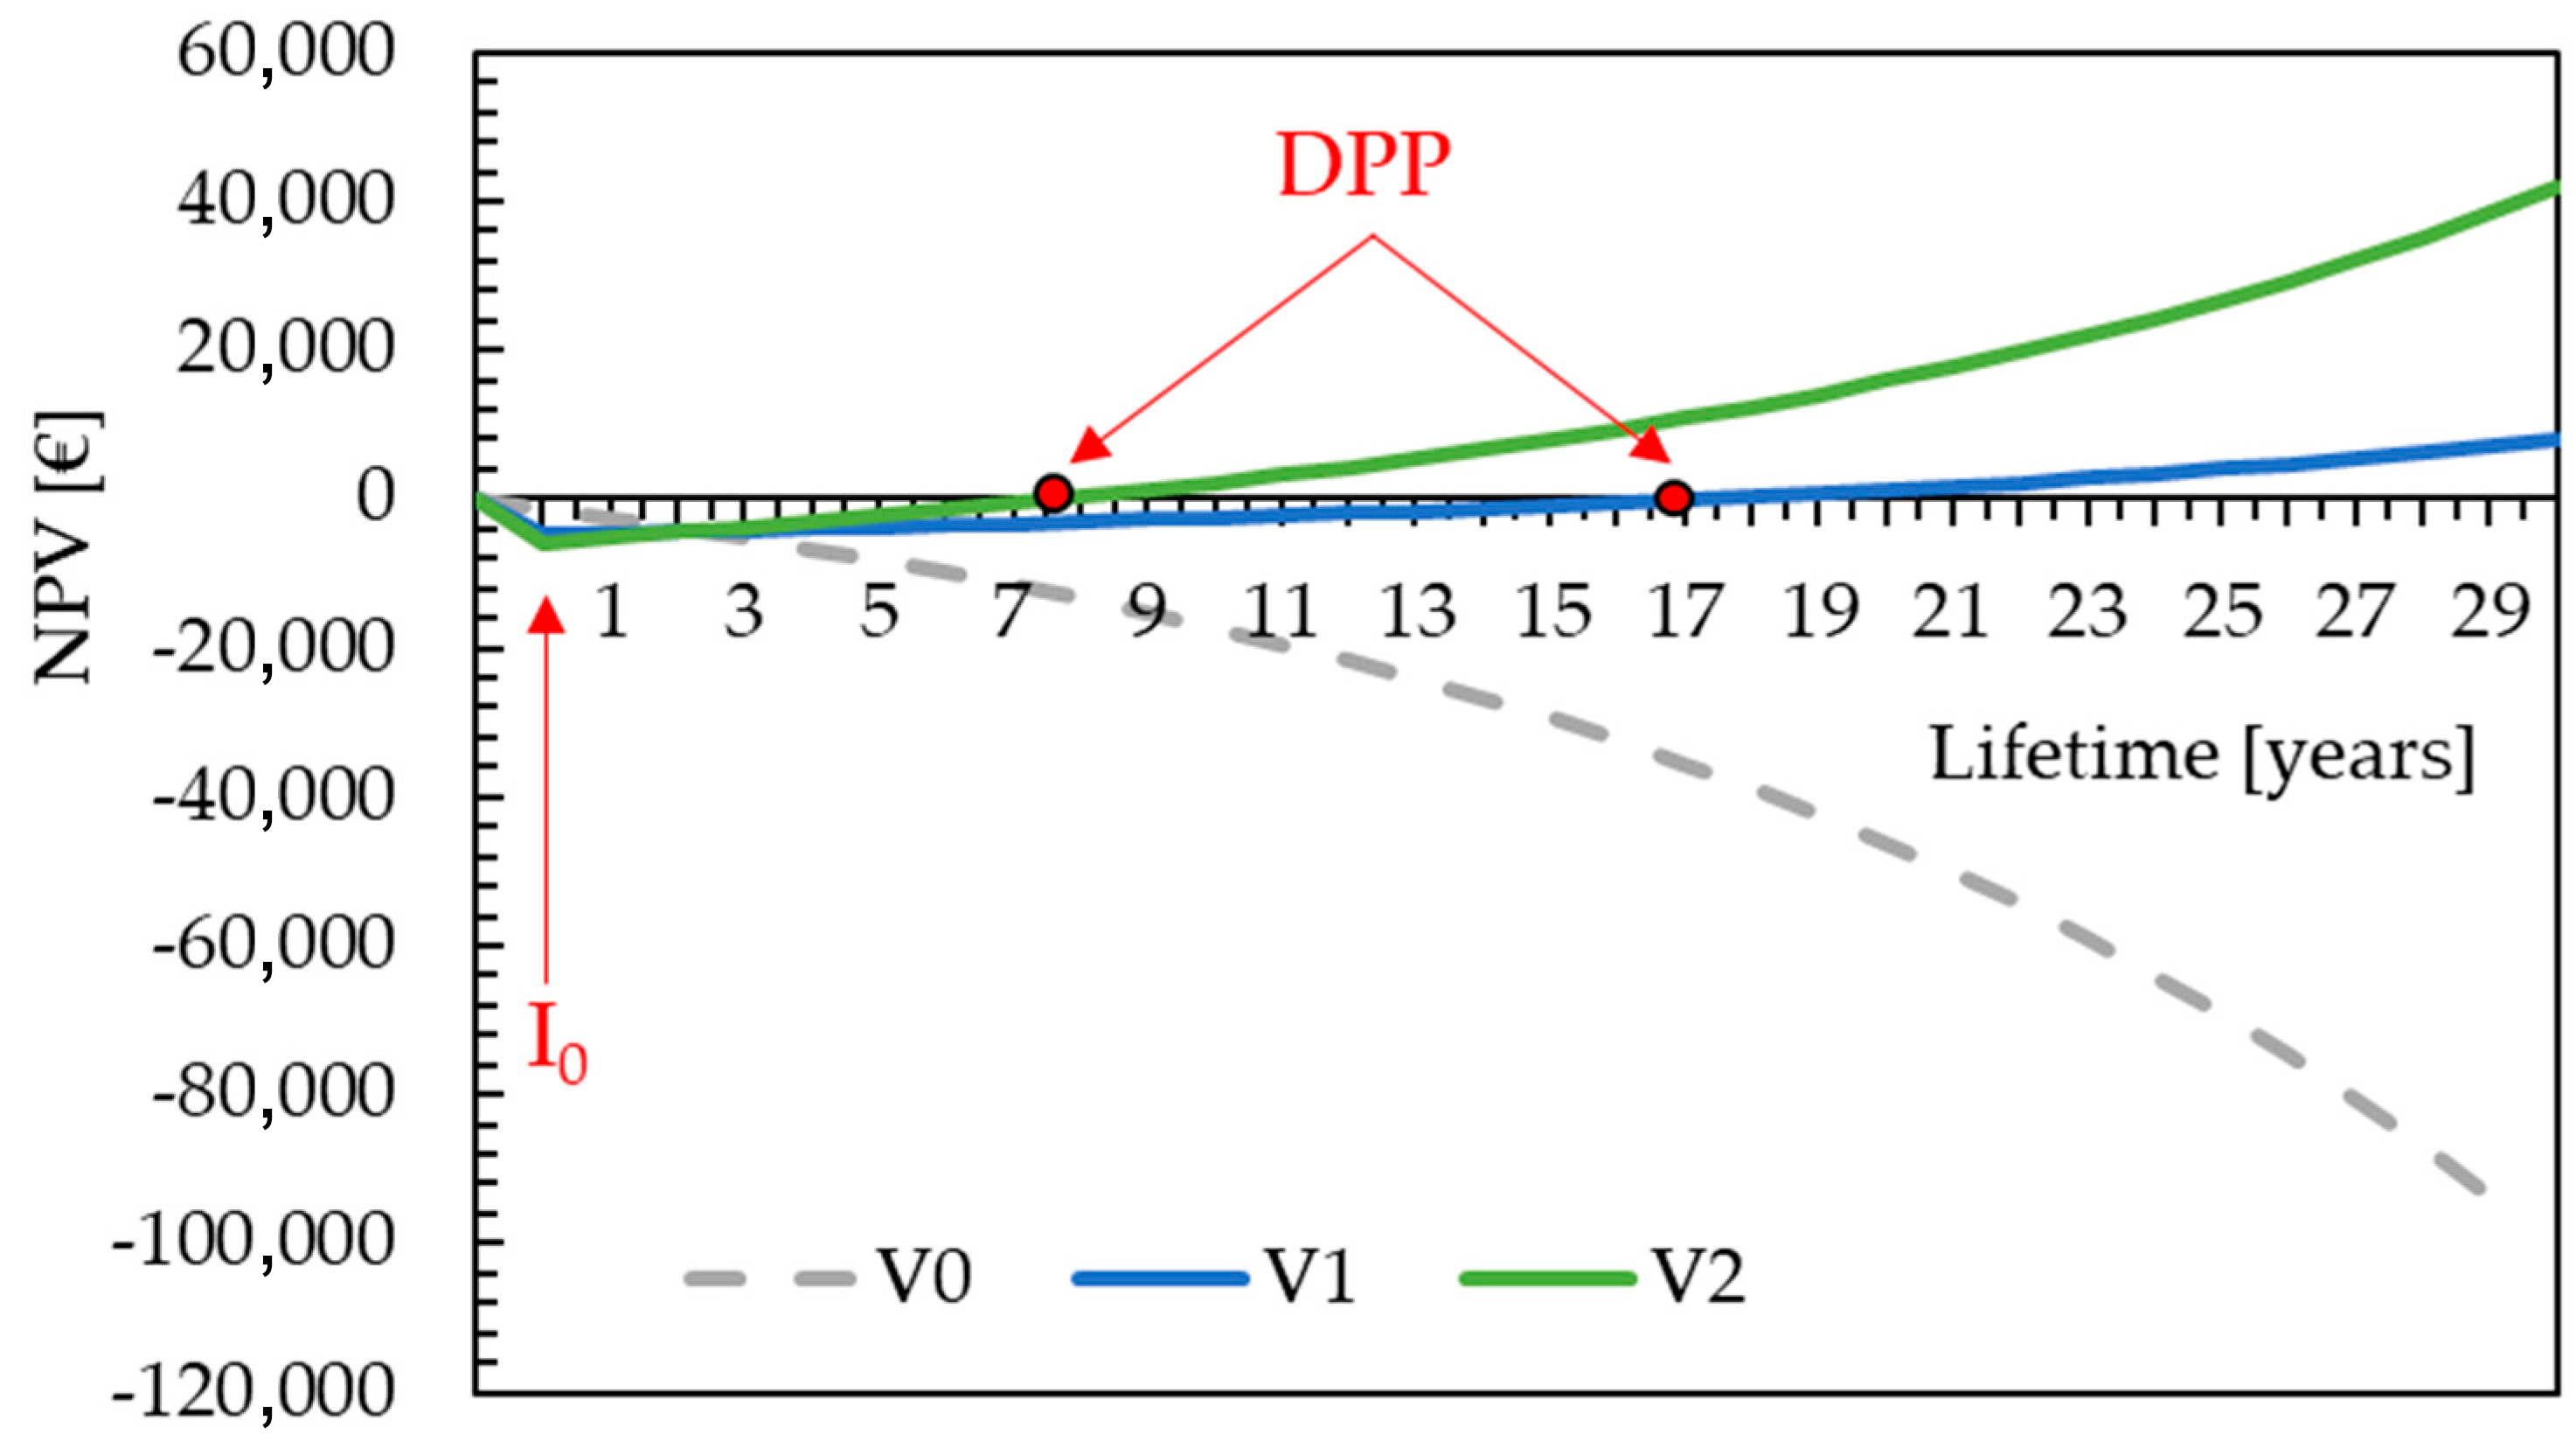
A better indicator used to measure economic efficiency than NPV is DPP. DPP is the time it takes to recover all the money spent on the investment. According to this method, the payback period is when the annual net profit equals the initial investment costs, and a positive net return is achieved [53]. Spertino et al. [42] calculated the equivalent of DPP as Z-NPV-P (zero NPV period). For the Italian installation of 3 kWp, the time equaled 8 years. Two times bigger (6 kWp), the German installation started to be efficient after 13 years. For small installations of 5.1 and 6.8 kWp (apartments) and 5.3 and 8.4 kWp (villas), the DPP is calculated for 27 and 15 years for the apartment and villa, respectively [43]. In our studies, the DPP levels are similar to those obtained by Spertino et al. [42] (7 and 11 years for V1 and V2, respectively).
Another indicator of production energy cost often used is the LCOE [54]. The LCOE is an economic assessment of the average cost to build and operate a power-generating asset over its lifetime, divided by the total energy output of the asset over that lifetime [41]. In Europe, the LCOE for PV systems varies between EUR 0.041 and 0.144/kWh, depending on the type of system and solar irradiation, whereas the LCOE for potentially newly constructed coal-fired power plants (hard coal and lignite) exceeds EUR 0.150/kWh due to rising CO2 certificate prices. For large hard coal power plants, the value decreases and varies between EUR 0.173 and 0.293/kWh [55]. Small power installations installed at apartments (5.1 and 6.8 kWp) and villas (5.3 and 8.4 kWp) with two kinds of roofs (flat and tilted 24°) are considered by [43]. They calculated the PV techno-economic efficiency as the levelized cost of electricity (LCOE) for the Kingdom of Saudi Arabia. The LCOE has similar values for both the apartment and villa. In the case of the apartment, the LCOE value decreases from USD 0.105/kWh to USD 0.060/kWh, increasing the PV lifetime from 15 to 30 years. For the villa, the LCOE decreases from USD 0.108/kWh to USD 0.062/kWh. In both cases, the decrease in the LCOE equaled 57%. The LCOE can also be regarded as the average minimum price at which electricity must be sold to break even over the project’s lifetime. It allows the comparison of different technologies (e.g., wind, solar, natural gas, etc.) of unequal life span, project size, capital cost, risk, return, and capacities [41]. However, attention should be paid to different kinds of formulas to calculate the LCOE: without any discounting [43,56], with discounting the sum of equipment investment and replacement cost and cost of operations and maintenance, but without discounting the energy [46], or with discounting both cost (investment, operations and maintenance) and energy [44,57]. Applying discounting to the amount of energy produced causes a reduction in the LCOE. For those reasons, comparing the values of LCOE can be confusing.
Another issue that has to be considered is the increasing price of energy. The Polish economy has encountered high levels of energy price inflation, especially in 2022, when it stood at 32.5%. Also, prosumers are not subject to any direct tax on the ownership or use of PV. Moreover, the energy produced by prosumers is exempt from income tax, regardless of the billing system applied. This means that individuals using either the net-metering or net-billing system are not required to pay income tax on the electricity generated in their micro-installations. Additionally, all prosumers are exempt from excise duty on electricity, provided that the installation does not exceed 1 MW in capacity and the energy is consumed for their own needs [25]. On the other hand, Sadat et al. [58] emphasize that solar PV can effectively hedge against inflation, particularly when economic feasibility and tax exemptions are in place. Their findings stress the importance of tailoring financial strategies to regional conditions and incorporating inflation projections into long-term PV system evaluations. Moreover, they highlight that even more costly PV systems with battery storage can become economically viable under inflationary pressures. Also, drawing on data from Sweden, Rydehell et al. [59] indicate that complementary tax incentives, such as deductions for self-consumption, were found to further enhance household investment willingness. The EU states that one of the three reasons for energy poverty, apart from low income and energy efficiency, is increased energy prices [60]. Analysis of the Environmental Policy Stringency (EPS) index, presented by Borowiec et al. [61], i.e., established on market-based instruments, non-market-based instruments, and technology support, positively correlates with a reduction in CO2 emissions per capita, and does so more effectively in countries with lower compared to higher per capita emissions.
From a prosumer point of view, the most important factor is the investment cost and the potential savings in energy costs. Several programs have been created to support Poles financially and encourage investment in PV for several years. It is that, combined with media promotion, that has led to the acceleration of PV investments in Poland [15]. Using prosumer support programs can effectively reduce the investment costs of PV installations and the payback time (Table 6). According to the socio-economic analysis by Izdebski and Kosiorek [13], the greatest impact on the development of PV power plants in Poland is the cost of purchasing energy and EU regulations on renewable energy sources. During the lifetime of installation, economic and social conditions may undergo significant changes, including, among others, the prices of electricity purchased by network operators, the prices of purchasing electricity from PV installations fed into the power grid, and tax and legal requirements. The key point is a long-term perspective to improve stability and increase energy security for EU countries and regions. In particular, favorable, predictable financial regulations for prosumers and the optimization of the state’s participation in the economy (institutional governance) and the energy sector are needed [62]. Future uncertainties in electricity prices in Poland pose a significant factor affecting the payback period and overall economic attractiveness of PV investments. A sustained increase in grid electricity prices, driven by inflation, geopolitical instability, or energy market reforms, would accelerate the return on investment by increasing the value of self-consumed solar energy. Conversely, potential regulatory interventions, such as price caps or changes in net billing tariffs, could limit expected savings and extend the discounted payback period (DPP). Since market-based energy pricing is inherently volatile and difficult to forecast, scenario-based modeling and sensitivity analysis are essential for evaluating long-term investment performance in residential PV systems.
The integration of energy storage systems plays a critical role in enhancing the efficiency and profitability of PV systems, particularly in the context of prosumer energy. By storing surplus energy generated during peak sunlight hours, households can increase their self-consumption rate and reduce reliance on the grid during periods of low solar production [63]. Home battery storage enables prosumers to shift energy use to periods with higher electricity prices, thus maximizing savings or revenues. Moreover, storage contributes to grid stability by reducing reverse power flow and evening out demand peaks [64]. As the regulatory landscape in Poland continues to evolve, particularly with the introduction of dynamic tariffs in 2024, the strategic deployment of energy storage becomes increasingly advantageous for prosumers aiming to optimize both economic and environmental outcomes.

4.2. The Environmental Assessment

There is no doubt that, beyond economic benefits, the adoption of PV systems has significant environmental advantages, which are also highlighted by Jathar et al. [65]. PV systems offer benefits beyond those provided by more traditional forms of energy production. In the case of greenhouse gas emissions, the PV systems emit them, especially during the production stage [65]. Also, the PV energy is socially associated with benefits in environmental conservation, such as reducing GHG emissions and conserving natural resources [66]. The dynamics of depletion, availability, and allocation of strategic natural resources are not included in economic analysis. Next, not all of the non-market goods involved in the investment process are incorporated. The strategy of developing energy sources from renewable and inexhaustible resources is not only a green light for zero-emission technologies but also the construction of a distributed critical infrastructure, resistant to destructive actions. The destruction of individual energy modules does not have a major impact on the functioning of the entire network. The realization of the risk of failure does not pose significant threats to life and the environment.
The environmental benefits of V1 and V2 are particularly notable. Also, V2′s larger capacity offsets household energy demands and contributes to surplus energy generation, supporting broader decarbonization efforts. It is an important issue because the Polish energy sector is heavily carbonized and emits the most CO2 per 1 kWh in the EU. In 2023, 1 kWh of energy in Poland corresponded to 622 g CO2 emissions, compared to the EU average of 242 g CO2/kWh [67]. On the contrary, for a year, Poland reduced the CO2 emission of 111 g/kWh, and since 2000, the carbon intensity of the power sector in Poland has decreased by 35% [
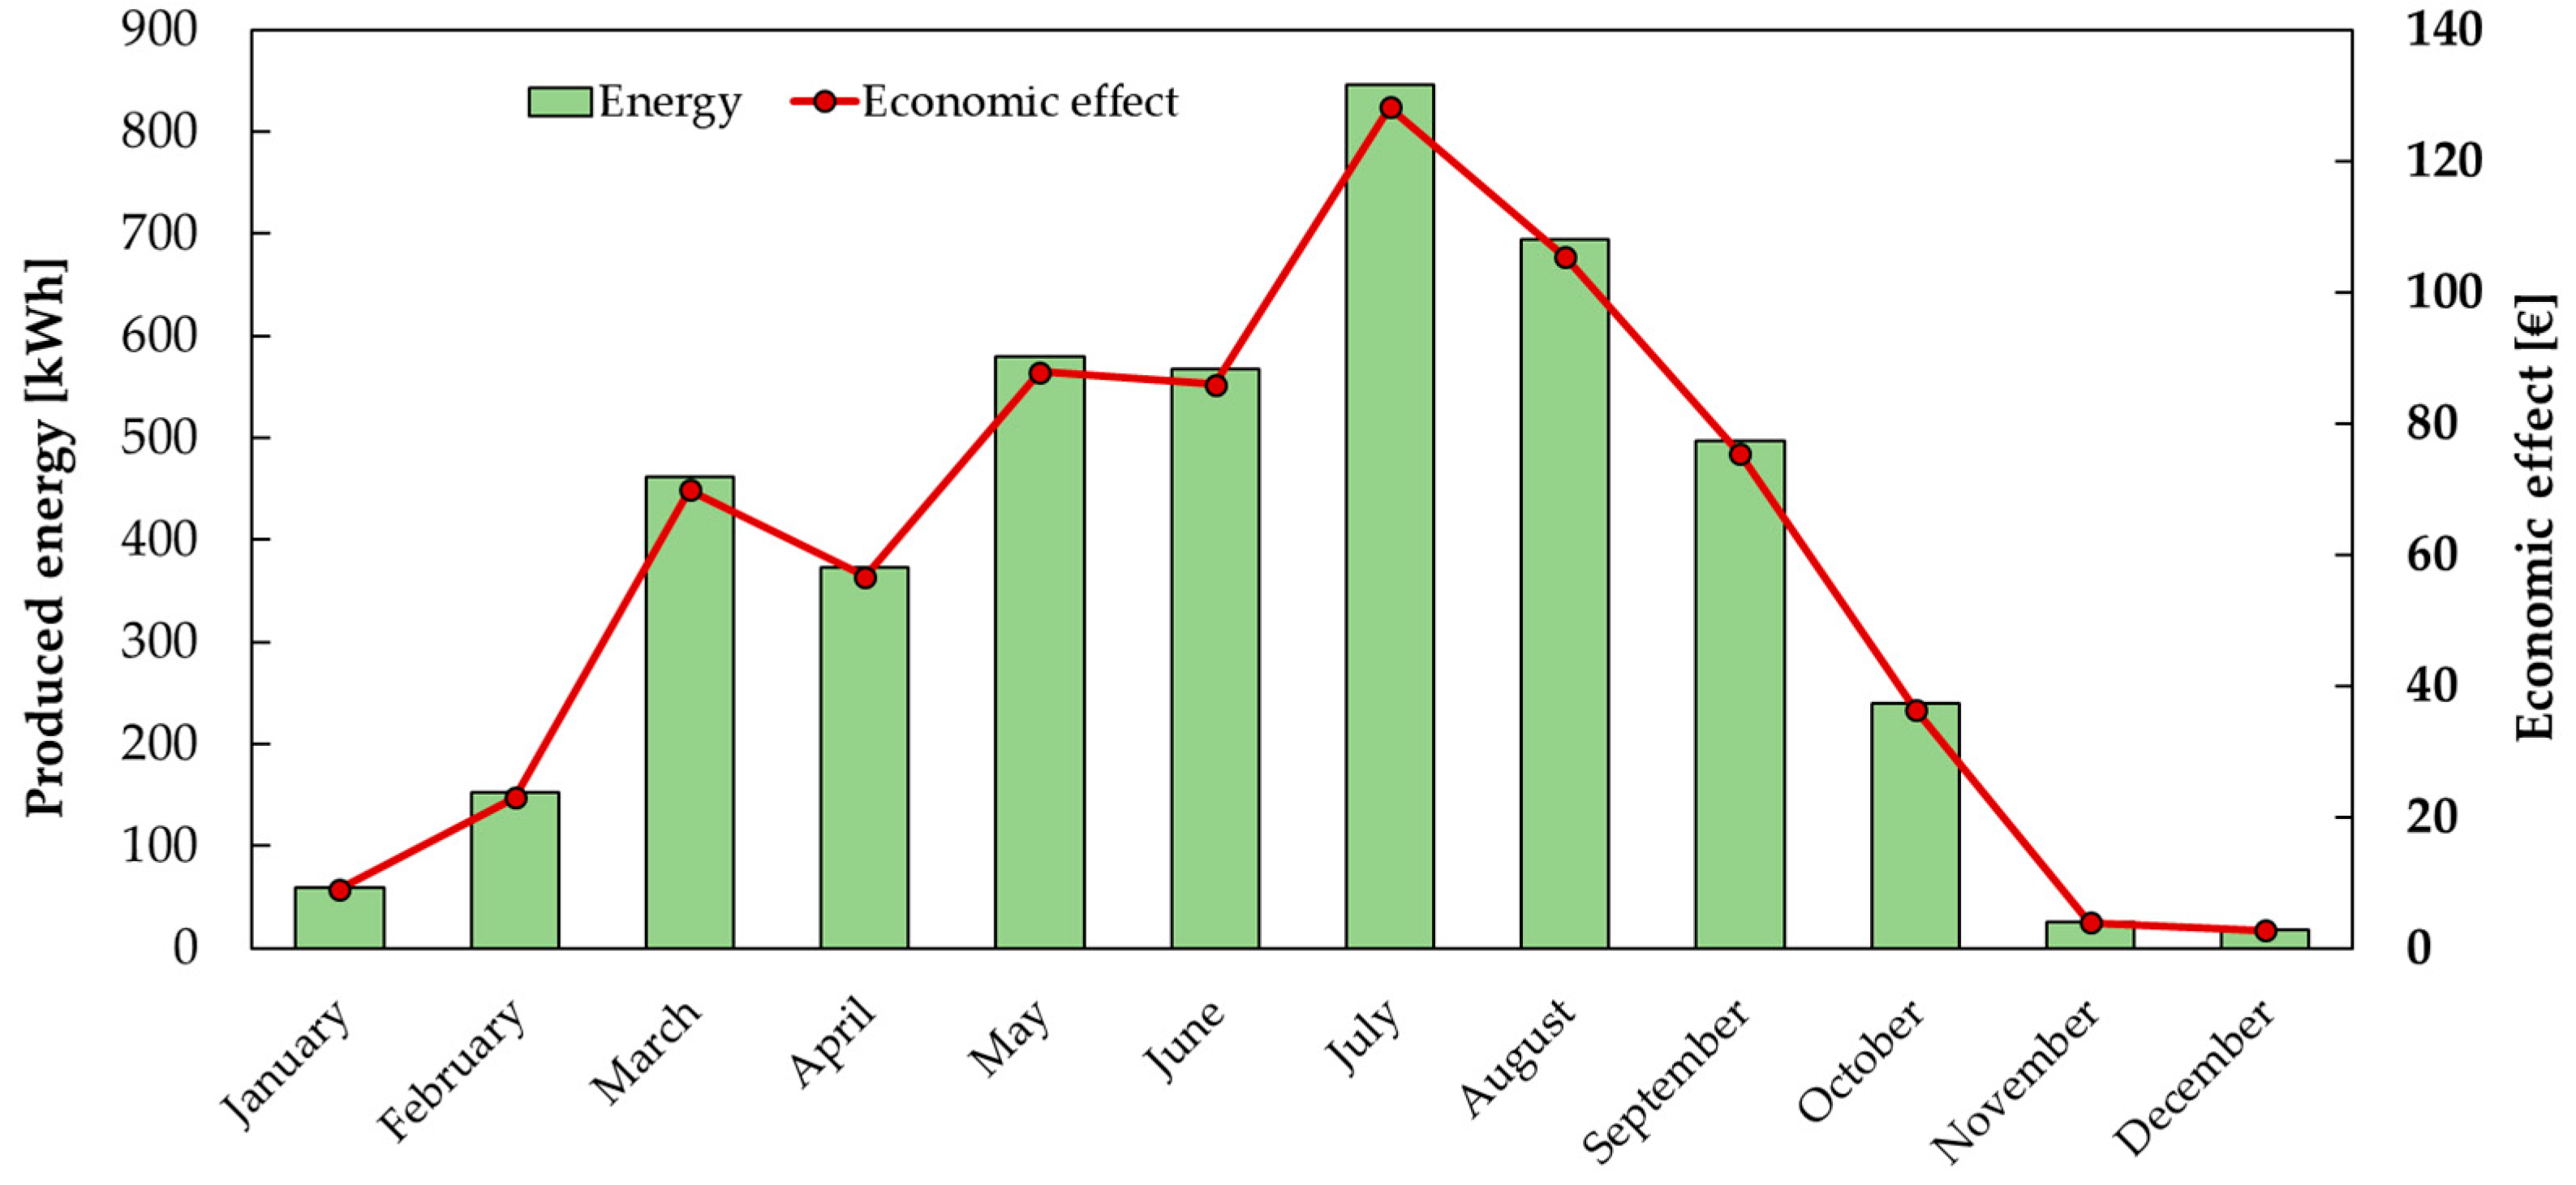
34]. In our study, the possible energy production of PV installation is 4516 kWh and 6169 kWh for V1 and V2, respectively. Taking the difference between the CO2 emissions of Poland’s energy sector and the average lifecycle emissions of PV installation, implementing the PV installation reduces by 2.6 and 3.6 Mg CO2/year for V1 and V2, respectively. Also, producing energy from renewable sources changes the public’s perception. There is growing social support for renewable energy and recognition of the health and environmental benefits of reducing coal dependency [68].
However, there is also a second side of PV regarding the end-of-life stage (EoL). Recycling PV modules is crucial due to the increasing volume of EoL panels. Various recycling technologies (mechanical, thermal, chemical, and hybrid approaches) have been developed to address this need, each with advantages and limitations. The mechanical recycling methods include crushing (effective for glass recovery but limited in retrieving other valuable components like silicon and metals [69,70]), high-voltage pulse crushing (promising, with an 85% recycling rate, offering increased material purity [69]), and the hot knife technique (effective for glass and EVA recycling but requires expert handling and can cause potential damage [69]). The thermal recycling methods include pyrolysis (efficient in breaking down organic materials but energy-intensive [71,72] and thermal delamination (preferred for separating PV glass panels, reducing climate-change impact by 23% compared to mechanical processes [73]). The chemical methods are metal-assisted chemical etching (recovers high-purity silicon wafers with favorable properties for reuse in PV module production [74]) and alkaline solutions with iron chloride (efficiently recovers aluminum and metallic silver with minimal environmental impact [75]). However, it must be taken into account that all of these methods have their limitations. Mechanical methods often fail to recover high-purity silicon, which is crucial for the sustainability of PV recycling [69,71]. Thermal methods like pyrolysis are effective but consume significant energy, making them less environmentally friendly [71,72]. Chemical processes, while adept at recovering high-purity materials, face challenges related to cost and ecological impact [71,75]. Also, the critical issue is advocating for policies mandating producer responsibility for EoL panel collection and recycling. Countries and regions that lack adequate e-waste disposal options could face recycling dilemmas in the near future. According to Lakhouit et al., by 2030, solar PV waste is expected to account for about 14% of the total generation capacity, but this figure could rise dramatically to 80%—approximately 78 million tons—by 2050 [76]. The EU has successfully implemented the Extended Producer Responsibility (EPR) framework [77], which mandates producers to manage the collection and recycling of EoL PV panels. This has led to effective recycling and resource recovery [78]. Moreover, the EU’s Waste Electrical and Electronic Equipment (WEEE) Directive [79] includes PV panels, ensuring high recycling and recovery rates [80].

4.3. Limitations and Future Research

While this study provides a comprehensive economic and environmental assessment of two PV on-grid systems under real and optimized scenarios, several limitations should be acknowledged.
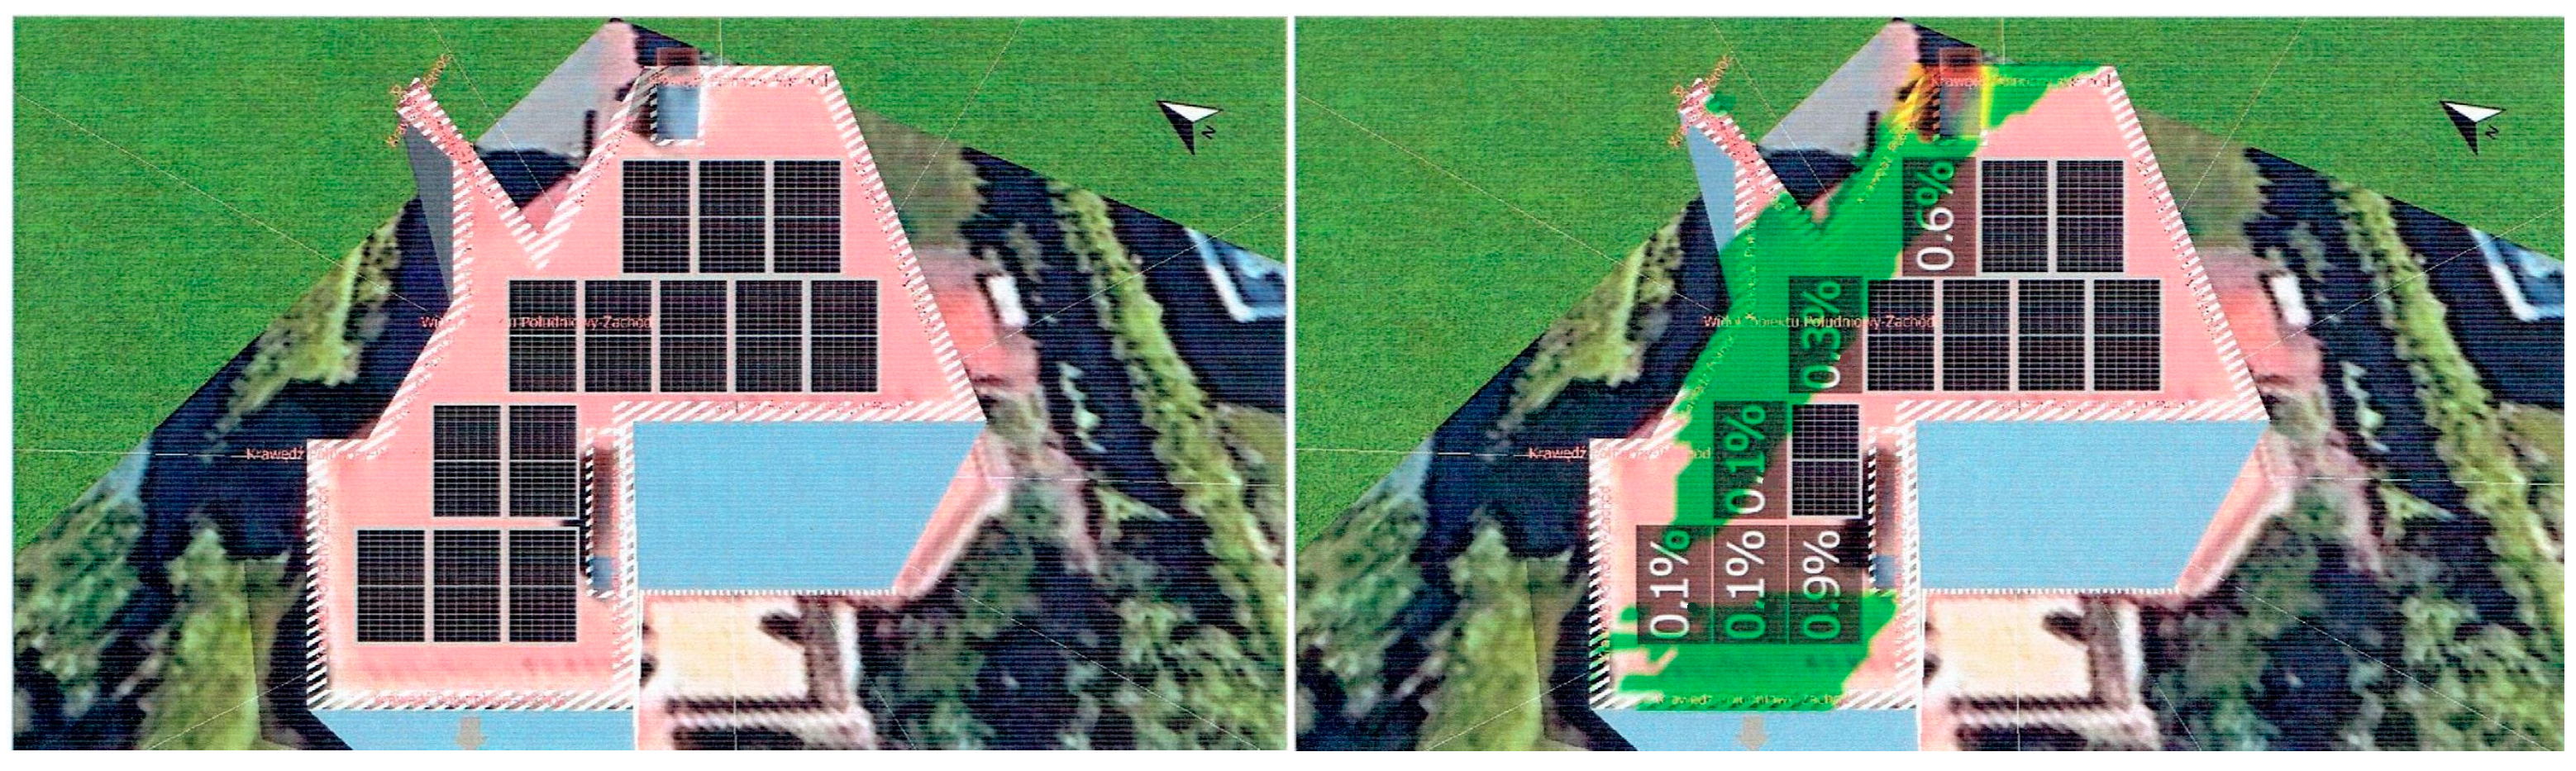
First, the analysis is geographically limited to a single-family household located in central Poland. Although representative, the results may not be generalizable to regions with different climatic conditions, solar irradiance, or grid infrastructure. Future research should extend this analysis to other locations across Poland and Europe to evaluate regional variability in PV performance and financial outcomes. The profitability of photovoltaic systems is influenced by several factors, including the location, roof slope and orientation of the PV panels, level of self-consumption, electricity purchase prices from the grid, electricity sale prices to the grid, installation costs, and amount of subsidies.
Second, the study employs annual energy production estimates and cost assumptions based on current market conditions and government programs. These parameters are inherently dynamic and subject to rapid changes due to inflation, energy market volatility, and evolving regulatory frameworks. For example, in 2024, Poland introduced major changes to its energy settlement rules, including the implementation of dynamic tariffs in July, which allow prosumers to sell surplus energy based on hourly market prices [29]. This reform particularly benefits PV system owners with home energy storage, enabling strategic energy use and sale. Prior to this, a monthly pricing model was used, and the net metering system, allowing the retrieval of 70–80% of produced energy, was maintained only for existing prosumers. These regulatory shifts significantly affect the financial outcomes of PV investments. Therefore, a more dynamic modeling approach incorporating scenario-based projections could improve long-term forecasts and better capture regulatory and market risks.
Third, the modeling assumes ideal PV system operation with standard degradation (0.56% per year) and does not consider variability in self-consumption patterns (the self-consumption was not modeled in this study due to limitations). Incorporating high-resolution consumption profiles and real-time energy usage data would allow a more nuanced analysis of system sizing, return on investment, and energy storage needs.
Additionally, while the analysis touches on regulatory and grid integration challenges, it does not fully explore the technical constraints imposed by distribution system operators (DSOs), such as limits on feed-in capacity, connection delays, or reverse power flow risks. These factors can significantly affect the feasibility and profitability of prosumer installations and merit further exploration.
Finally, although this study evaluates grid-connected systems, future research should examine hybrid or off-grid PV systems, particularly for rural or underserved areas. Comparative assessments of centralized vs. decentralized systems could offer deeper insights into energy resilience and policy prioritization.

5. Conclusions

This analysis demonstrates that while V1 and V2 offer economic and environmental benefits, variant V2 emerges as the superior option in terms of financial returns, efficiency, and environmental impact. The shorter payback period, higher IRR, and greater reduction in energy costs underscore the importance of optimizing PV system capacity to maximize benefits. In addition, the environmental assessment highlights the broader societal value of reducing CO2 emissions, making the adoption of PV systems an economically sound and environmentally responsible decision. The Polish energy market case study further underscores the importance of these findings. Poland is experiencing rising energy costs driven by increasing electricity demand, inflation, and the ongoing costs of transitioning from coal to greener energy sources. As a country heavily reliant on fossil fuels, Poland faces the dual challenge of decarbonizing its energy sector while managing the financial burden of its green transformation. The systematic increase in energy prices, as illustrated in the baseline scenario (V0), is a direct consequence of these dynamics, making energy cost mitigation a pressing issue for Polish households. Notably, this economic analysis does not value the depletion, availability, and allocation of strategic natural resources.
Energy price volatility significantly affects the long-term profitability of PV investments. In Poland, electricity prices have shown substantial fluctuations in recent years, influenced by global energy crises and inflationary pressures. A sharp rise in grid electricity prices tends to increase the net present value (NPV) and shorten the discounted payback period (DPP) of PV systems, making them more financially attractive. Conversely, price declines or regulatory interventions (e.g., capped tariffs) can reduce the expected returns. Incorporating scenario-based models that account for future energy price uncertainty would strengthen financial forecasts and improve investment planning for prosumers. Moreover, the purchase and sale prices of electricity are variable and depend on market rates, which are influenced by a range of geopolitical, legal, climatic, and other external factors. This uncertainty means that any analysis of payback periods remains fundamentally an estimation rather than a precise forecast.
The cost of the green transformation in Poland is significant, involving large-scale investments in renewable energy infrastructure, energy storage, and strategic modernization and expansion of the grid, including the development of off-grid or hybrid systems. However, adopting distributed renewable energy systems, such as household PV installations, can be pivotal in decentralizing energy production and reducing the financial burden on the national grid. By supporting prosumers, Poland can accelerate its transition to a low-carbon economy while reducing the dependence on fossil fuels and mitigating the societal costs of climate change.
In conclusion, adopting PV systems represents a strategic solution to rising energy costs and the cost of green transformation in Poland. While both V1 and V2 offer economic and environmental benefits, the enhanced performance of V2 demonstrates the value of investing in larger, surplus-generating PV systems. These findings emphasize the need for supportive policies and the development of integrated financial mechanisms to enable the widespread adoption of renewable energy, not only as a matter of economic efficiency but also as a critical step toward achieving Poland’s environmental and energy goals.

Author Contributions

Conceptualization, A.B.; methodology, A.B.; data curation, M.H.; writing—original draft preparation, A.B.; writing—review and editing, A.B., A.S., and E.H.; visualization, A.B.; supervision, A.B., A.S., and E.H. All authors have read and agreed to the published version of the manuscript.

Funding

This research received no external funding.

Institutional Review Board Statement

Not applicable.

Informed Consent Statement

Not applicable.

Data Availability Statement

Data are contained within the article.

Acknowledgments

We thank the anonymous reviewers and editors for their valuable comments and suggestions.

Conflicts of Interest

The authors declare no conflicts of interest.

Abbreviations

AbbreviationDescription
CBACost–benefit analysis
CFCash flow
CFk(Y + 1)Discounted cash flow in the year (Y + 1) designated for variant k
C&MCleaning and maintenance
DPPDiscounted payback period
EAAnnual energy production
EoLEnd of life
EUREuro
EROEnergy Regulatory Office
FiTsFeed-in tariffs
GHGGreenhouse gas
GWGigawatt
ieInflation rate of energy
I0Initial investment costs
IRRInternal rate of return
kWhKilowatt-hour
kWpKilowatt-peak
LCOELevelized cost of energy
MtAnnual maintenance costs
NPVNet present value
NPVkYUnrecovered expenditure, determined at the beginning of the year (Y + 1), selected for variant k
PtTotal profits
PVPhotovoltaic
ROIReturn on investment
rDiscount rate
tTime
V0The variant of the purchase of electricity from an energy company
V1The variant of the installed PV of 4.35 kWp
V2The variant of the installed PV of 5.7 kWp
YkThe number of full years before the total return is determined for the option

References

  1. United Nations. United Nations Transforming Our World: The 2030 Agenda for Sustainable Development. 25 September 2015. Available online: https://Documents.Un.Org/Doc/Undoc/Gen/N15/291/89/Pdf/N1529189.pdf (accessed on 20 February 2025).
  2. Blaschke, T.; Biberacher, M.; Gadocha, S.; Schardinger, I. ‘Energy Landscapes’: Meeting Energy Demands and Human Aspirations. Biomass Bioenergy 2013, 55, 3–16. [Google Scholar] [CrossRef] [PubMed]
  3. Kabir, E.; Kumar, P.; Kumar, S.; Adelodun, A.A.; Kim, K.-H. Solar Energy: Potential and Future Prospects. Renew. Sustain. Energy Rev. 2018, 82, 894–900. [Google Scholar] [CrossRef]
  4. Bošnjaković, M.; Čikić, A.; Zlatunić, B. Cost-Benefit Analysis of Small-Scale Rooftop PV Systems: The Case of Dragotin, Croatia. Appl. Sci. 2021, 11, 9318. [Google Scholar] [CrossRef]
  5. Silva, M.; Raadal, H.L. Life Cycle GHG Emissions of Renewable and Non-Renewable Electricity Generation Technologies Part of the RE-Invest Project; Aalborg University: Aalborg, Denmark, 2019; ISBN 978-82-7520-806-2. [Google Scholar]
  6. Hamed, T.A.; Alshare, A. Environmental Impact of Solar and Wind Energy-A Review. J. Sustain. Dev. Energy Water Environ. Syst. 2022, 10, 1–23. [Google Scholar] [CrossRef]
  7. Wang, L.; Qiu, T.; Zhang, M.; Cao, Q.; Qin, W.; Wang, S.; Wang, L.; Chen, D.; Wild, M. Carbon Emissions and Reduction Performance of Photovoltaic Systems in China. Renew. Sustain. Energy Rev. 2024, 200, 114603. [Google Scholar] [CrossRef]
  8. Yadav, R.; Gautam, A.; Pradeepa, P. Design, Performance and Economic Evaluation of a 4kW Grid-Interactive Solar PV Rooftop in Odisha Using Pvsyst. Int. J. Exp. Res. Rev. 2023, 31, 98–107. [Google Scholar] [CrossRef]
  9. Deng, Y.; Wu, J.; Yang, Q.; Chen, W.; Li, P.; Huang, C.; Deng, J.; Ji, B.; Xie, L. Life Cycle-Based Carbon Emission Reduction Benefit Assessment of Centralized Photovoltaic Power Plants in China. Sustainability 2023, 15, 16323. [Google Scholar] [CrossRef]
  10. Kristjansdottir, T.F.; Good, C.S.; Inman, M.R.; Schlanbusch, R.D.; Andresen, I. Embodied Greenhouse Gas Emissions from PV Systems in Norwegian Residential Zero Emission Pilot Buildings. Sol. Energy 2016, 133, 155–171. [Google Scholar] [CrossRef]
  11. Brodziński, Z.; Brodzińska, K.; Szadziun, M. Photovoltaic Farms—Economic Efficiency of Investments in North-East Poland. Energies 2021, 14, 2087. [Google Scholar] [CrossRef]
  12. Bukowski, M.; Majewski, J.; Sobolewska, A. Macroeconomic Electric Energy Production Efficiency of Photovoltaic Panels in Single-Family Homes in Poland. Energies 2021, 14, 126. [Google Scholar] [CrossRef]
  13. Izdebski, W.; Kosiorek, K. Analysis and Evaluation of the Possibility of Electricity Production from Small Photovoltaic Installations in Poland. Energies 2023, 16, 944. [Google Scholar] [CrossRef]
  14. Rataj, M.; Berniak-Woźny, J.; Plebańska, M. Poland as the EU Leader in Terms of Photovoltaic Market Growth Dynamics—Behind the Scenes. Energies 2021, 14, 6987. [Google Scholar] [CrossRef]
  15. Igliński, B.; Piechota, G.; Kiełkowska, U.; Kujawski, W.; Pietrzak, M.B.; Skrzatek, M. The Assessment of Solar Photovoltaic in Poland: The Photovoltaics Potential, Perspectives and Development. Clean Technol. Environ. Policy 2023, 25, 281–298. [Google Scholar] [CrossRef]
  16. Akram Cheema, H.; Ilyas, S.; Kang, H.; Kim, H. Comprehensive Review of the Global Trends and Future Perspectives for Recycling of Decommissioned Photovoltaic Panels. Waste Manag. 2024, 174, 187–202. [Google Scholar] [CrossRef] [PubMed]
  17. Petroli, P.A.; Camargo, P.S.S.; de Souza, R.A.; Veit, H.M. Assessment of Toxicity Tests for Photovoltaic Panels: A Review. Curr. Opin. Green Sustain. Chem. 2024, 47, 100885. [Google Scholar] [CrossRef]
  18. Goh, K.C.; Kurniawan, T.A.; Goh, H.H.; Zhang, D.; Jiang, M.; Dai, W.; Khan, M.I.; Othman, M.H.D.; Aziz, F.; Anouzla, A.; et al. Harvesting Valuable Elements from Solar Panels as Alternative Construction Materials: A New Approach of Waste Valorization and Recycling in Circular Economy for Building Climate Resilience. Sustain. Mater. Technol. 2024, 41, e01030. [Google Scholar] [CrossRef]
  19. Lim, M.S.W.; He, D.; Tiong, J.S.M.; Hanson, S.; Yang, T.C.-K.; Tiong, T.J.; Pan, G.-T.; Chong, S. Experimental, Economic and Life Cycle Assessments of Recycling End-of-Life Monocrystalline Silicon Photovoltaic Modules. J. Clean. Prod. 2022, 340, 130796. [Google Scholar] [CrossRef]
  20. Keerthivasan, T.; Madhesh, R.; Srinivasan, M.; Ramasamy, P. Photovoltaic Recycling: Enhancing Silicon Wafer Recovery Process from Damaged Solar Panels. J. Mater. Sci. Mater. Electron. 2024, 35, 880. [Google Scholar] [CrossRef]
  21. Marcelino, C.G.; Leite, G.M.C.; Wanner, E.F.; Jiménez-Fernández, S.; Salcedo-Sanz, S. Evaluating the Use of a Net-Metering Mechanism in Microgrids to Reduce Power Generation Costs with a Swarm-Intelligent Algorithm. Energy 2023, 266, 126317. [Google Scholar] [CrossRef]
  22. Tomczyk, D.; Łapniewska, Z. Solar Panels on Every Rooftop? Photovoltaics Boom in Poland and the Role of the European Union Funds. Energy Res. Soc. Sci. 2025, 125, 104107. [Google Scholar] [CrossRef]
  23. Benalcazar, P.; Andrade, C.; Guamán, W. Prosumer Policy Options in Developing Countries: A Comparative Analysis of Feed-in Tariffs, Net Metering, and Net Billing for Residential PV-Battery Systems. Polityka Energetyczna–Energy Policy J. 2025, 28, 77–98. [Google Scholar] [CrossRef]
  24. Institute of Renewable Energy. Photovoltaic Market in Poland 2024 (in Polish), Warsaw. 2024. Available online: https://Ieo.Pl/Raport-Rynek-Fotowoltaiki-w-Polsce-2024 (accessed on 12 January 2025).
  25. Energy Regulatory Office. Available online: https://www.Ure.Gov.Pl/Pl/Energia-Elektryczna/Charakterystyka-Rynku/12095,2023.html (accessed on 12 January 2025).
  26. Institute of Renewable Energy. Photovoltaic Market in Poland 2021 (in Polish), Warsaw. 2021. Available online: https://Ieo.Pl/Raport-Pv-2021 (accessed on 12 January 2025).
  27. Notton, G. Importance of Islands in Renewable Energy Production and Storage: The Situation of the French Islands. Renew. Sustain. Energy Rev. 2015, 47, 260–269. [Google Scholar] [CrossRef]
  28. Poland Extends Freeze in Residential Energy Prices to Mid-2025|Enerdata. Available online: https://www.enerdata.net/publications/daily-energy-news/poland-extends-freeze-residential-energy-prices-mid-2025.html (accessed on 30 May 2025).
  29. Poland’s Solar Radiation, Polish Energy Management Agency. Available online: https://paze.pl/ (accessed on 10 February 2025).
  30. Poland Energy Information|Enerdata. Available online: https://www.enerdata.net/estore/energy-market/poland/ (accessed on 30 May 2025).
  31. Communication on the Average Annual Consumer Price Index of Energy Carriers in 2024. Available online: https://Stat.Gov.Pl/Sygnalne/Komunikaty-i-Obwieszczenia/Lista-Komunikatow-i-Obwieszczen/Komunikat-w-Sprawie-Sredniorocznego-Wskaznika-Cen-Konsumpcyjnych-Nosnikow-Energii-w-2024-r-,291,10.html (accessed on 29 April 2025).
  32. Energy Regulatory Office. Average Quarterly Electricity Price. Available online: https://www.Ure.Gov.Pl/Pl/Energia-Elektryczna/Ceny-Wskazniki/11063,Srednia-Kwartalna-Cena-Energii-Elektrycznej-Art-49aa-Ust-2-Ustawy-Prawo-Energety.html (accessed on 29 April 2025).
  33. Monthly Market Price of Electricity. Polish Power Grids. Available online: https://www.Pse.Pl/Oire/Rcem-Rynkowa-Miesieczna-Cena-Energii-Elektrycznej (accessed on 29 April 2025).
  34. Carbon Intensity of the Power Sector in Poland from 2000 to 2023. Available online: https://www.Statista.Com/Statistics/1290449/Carbon-Intensity-Power-Sector-Poland/ (accessed on 15 April 2025).
  35. Schlömer, S.; Hänsel, G.; de Jager, D.; Neelis, M. Technology-Specific Cost and Performance Parameters. In Climate Change 2014: Mitigation of Climate Change. Contribution of Working Group III to the Fifth Assessment Report of the Intergovernmental Panel on Climate Change; Cambridge University Press: Cambridge, UK, 2014. [Google Scholar]
  36. COM (2023) 654 Final Report from the Commission to the European Parliament and the Council on the Functioning of the European Carbon Market in 2022 Pursuant to Articles 10(5) and 21(2) of Directive 2003/87/EC. Available online: https://climate.ec.europa.eu/system/files/2023-10/COM_2023_654_1_EN_ACT_part1_CMR%2BSWD.pdf (accessed on 28 April 2025).
  37. Archived Exchange Rates. Available online: https://www.nbp.pl (accessed on 20 October 2024).
  38. Act of 9 November 2018 Amending the Personal Income Tax Act and the Act on Lump-Sum Income Tax on Certain Incomes Earned by Natural Persons (2018.2246). Available online: https://isap.sejm.gov.pl/isap.nsf/download.xsp/WDU20180002246/O/D20182246.pdf (accessed on 9 June 2025).
  39. My Electricity. Available online: https://mojprad.gov.pl/ (accessed on 30 May 2025).
  40. Narodowy Fundusz Ochrony Środowiska i Gospodarki Wodnej. Clean Air. Available online: https://czystepowietrze.gov.pl/ (accessed on 30 May 2025).
  41. Gómez-Navarro, T.; Brazzini, T.; Alfonso-Solar, D.; Vargas-Salgado, C. Analysis of the Potential for PV Rooftop Prosumer Production: Technical, Economic and Environmental Assessment for the City of Valencia (Spain). Renew. Energy 2021, 174, 372–381. [Google Scholar] [CrossRef]
  42. Spertino, F.; Di Leo, P.; Cocina, V. Economic Analysis of Investment in the Rooftop Photovoltaic Systems: A Long-Term Research in the Two Main Markets. Renew. Sustain. Energy Rev. 2013, 28, 531–540. [Google Scholar] [CrossRef]
  43. Dehwah, A.H.A.; Asif, M.; Budaiwi, I.M.; Alshibani, A. Techno-Economic Assessment of Rooftop PV Systems in Residential Buildings in Hot–Humid Climates. Sustainability 2020, 12, 10060. [Google Scholar] [CrossRef]
  44. Caglayan, N. The Technical and Economic Assessment of a Solar Rooftop Grid-Connected Photovoltaic System for a Dairy Farm. Energies 2023, 16, 7043. [Google Scholar] [CrossRef]
  45. Aleksiejuk-Gawron, J.; Milčiuvienė, S.; Kiršienė, J.; Doheijo, E.; Garzon, D.; Urbonas, R.; Milčius, D. Net-Metering Compared to Battery-Based Electricity Storage in a Single-Case PV Application Study Considering the Lithuanian Context. Energies 2020, 13, 2286. [Google Scholar] [CrossRef]
  46. Zhu, X.; Lv, Y.; Bi, J.; Jiang, M.; Su, Y.; Du, T. Techno-Economic Analysis of Rooftop Photovoltaic System under Different Scenarios in China University Campuses. Energies 2023, 16, 3123. [Google Scholar] [CrossRef]
  47. Gönül, Ö.; Duman, A.C.; Barutçu, B.; Güler, Ö. Techno-Economic Analysis of PV Systems with Manually Adjustable Tilt Mechanisms. Eng. Sci. Technol. Int. J. 2022, 35, 101116. [Google Scholar] [CrossRef]
  48. Mansouri Kouhestani, F.; Byrne, J.; Johnson, D.; Spencer, L.; Hazendonk, P.; Brown, B. Evaluating Solar Energy Technical and Economic Potential on Rooftops in an Urban Setting: The City of Lethbridge, Canada. Int. J. Energy Environ. Eng. 2019, 10, 13–32. [Google Scholar] [CrossRef]
  49. Bertsch, V.; Geldermann, J.; Lühn, T. What Drives the Profitability of Household PV Investments, Self-Consumption and Self-Sufficiency? Appl. Energy 2017, 204, 1–15. [Google Scholar] [CrossRef]
  50. Panagoda, S.; Tilanka, G.; Sandunika, I.; Alwis, S.; Ranasinghe, H.; Perera, V.; Dilka, S. Advancements in Photovoltaic (Pv) Technology for Solar Energy Generation. J. Res. Technol. Eng. 2023, 43, 30–72. [Google Scholar]
  51. Tushar, Q.; Zhang, G.; Giustozzi, F.; Bhuiyan, M.A.; Hou, L.; Navaratnam, S. An Integrated Financial and Environmental Evaluation Framework to Optimize Residential Photovoltaic Solar Systems in Australia from Recession Uncertainties. J. Environ. Manag. 2023, 346, 119002. [Google Scholar] [CrossRef] [PubMed]
  52. Lee, B.; Trcka, M.; Hensen, J.L.M. Rooftop Photovoltaic (PV) Systems: A Cost–Benefit Analysis Study of Industrial Halls. Int. J. Low-Carbon Technol. 2014, 9, 319–326. [Google Scholar] [CrossRef]
  53. Boardman, C.M.; Reinhart, W.J.; Celec, S.E. The Role of the Payback Period in the Theory and Application of Duration to Capital Budgeting. J. Bus. Financ. Account. 1982, 9, 511–522. [Google Scholar] [CrossRef]
  54. European Commission. Final Report Cost of Energy (LCOE). Energy Costs, Taxes and the Impact of Government Interventions on Investments. Rotterdam 2020. Available online: https://energy.ec.europa.eu/system/files/2020-10/final_report_levelised_costs_0.pdf (accessed on 12 January 2025).
  55. Kost, C.; Müller, P.; Sepúlveda Schweiger, J.; Fluri, V.; Thomsen, J. Levelized Cost of Electricity Renewable Energy Technologies; Fraunhofer Institute for Solar Energy Systems ISE: Freiburg, Germany, 2024. [Google Scholar]
  56. Ramadhan, M.; Naseeb, A. The Cost Benefit Analysis of Implementing Photovoltaic Solar System in the State of Kuwait. Renew. Energy 2011, 36, 1272–1276. [Google Scholar] [CrossRef]
  57. Pagnini, L.; Bracco, S.; Delfino, F.; de-Simón-Martín, M. Levelized Cost of Electricity in Renewable Energy Communities: Uncertainty Propagation Analysis. Appl. Energy 2024, 366, 123278. [Google Scholar] [CrossRef]
  58. Sadat, S.A.; Mittal, K.; Pearce, J.M. Using Investments in Solar Photovoltaics as Inflation Hedges. Energies 2025, 18, 890. [Google Scholar] [CrossRef]
  59. Rydehell, H.; Lantz, B.; Mignon, I.; Lindahl, J. The Impact of Solar PV Subsidies on Investment over Time-the Case of Sweden. Energy Econ. 2024, 133, 107552. [Google Scholar] [CrossRef]
  60. Energy Poverty Advisory Hub (EU). Introduction to the Energy Poverty Advisory Hub (EPAH) Handbooks: A Guide to Understanding and Addressing Energy Poverty; Energy Poverty Advisory Hub (EU): Brussels, Belgium, 2022. [Google Scholar]
  61. Borowiec, J.; Papież, M.; Śmiech, S. The Impact of Environmental Regulations on Carbon Emissions in Countries with Different Levels of Emissions. Environ. Sci. Pollut. Res. Int. 2024, 31, 66759–66779. [Google Scholar] [CrossRef]
  62. Łuszczyk, M.; Malik, K.; Siuta-Tokarska, B.; Thier, A. Direction of Changes in the Settlements for Prosumers of Photovoltaic Micro-Installations: The Example of Poland as the Economy in Transition in the European Union. Energies 2023, 16, 3233. [Google Scholar] [CrossRef]
  63. Walichnowska, P.; Kruszelnicka, W.; Tomporowski, A.; Mroziński, A. The Impact of Energy Storage on the Efficiency of Photovoltaic Systems and Determining the Carbon Footprint of Households with Different Electricity Sources. Sustainability 2025, 17, 2765. [Google Scholar] [CrossRef]
  64. Rynska, E. Review of PV Solar Energy Development 2011–2021 in Central European Countries. Energies 2022, 15, 8307. [Google Scholar] [CrossRef]
  65. Jathar, L.D.; Ganesan, S.; Awasarmol, U.; Nikam, K.; Shahapurkar, K.; Soudagar, M.E.M.; Fayaz, H.; El-Shafay, A.S.; Kalam, M.A.; Bouadila, S.; et al. Comprehensive Review of Environmental Factors Influencing the Performance of Photovoltaic Panels: Concern over Emissions at Various Phases throughout the Lifecycle. Environ. Pollut. 2023, 326, 121474. [Google Scholar] [CrossRef]
  66. Mohammad, S.N.; Yusof, M.K.T.M.; Puaad, M.B.F.M.; Zakaria, R.; Baki, A. Exploring Acceptance on Benefit of Solar Farm Implementation in Malaysia. Sci. Rev. Eng. Environ. Sci. (SREES) 2023, 32, 87–98. [Google Scholar] [CrossRef]
  67. Carbon Intensity of the Power Sector in the European Union in 2023, by Country. Available online: https://www.Statista.Com/Statistics/1291750/Carbon-Intensity-Power-Sector-Eu-Country/ (accessed on 28 April 2025).
  68. Kud, K.; Woźniak, M.; Badora, A. Impact of the Energy Sector on the Quality of the Environment in the Opinion of Energy Consumers from Southeastern Poland. Energies 2021, 14, 5551. [Google Scholar] [CrossRef]
  69. Ali, A.; Sahaf, H.; AlZahrani, A.; Khalid, M.; Khan, M.W.; Islam, A. Recycling and Material Extraction from End-of-Life Photovoltaic Modules Waste: Exploring Physical Recovery Techniques. In Proceedings of the 2024 IEEE 1st Karachi Section Humanitarian Technology Conference (KHI-HTC), Tandojam, Pakistan, 8–9 January 2024. [Google Scholar]
  70. Yan, G.; Zhang, M.; Sun, Z.; Zhao, P.; Zhang, B. Recycling Technology of End-of-Life Photovoltaic Panels: A Review. Energy Sources Part A Recovery Util. Environ. Eff. 2023, 45, 10890–10908. [Google Scholar] [CrossRef]
  71. Chen, P.-H.; Chen, W.-S.; Lee, C.-H.; Wu, J.-Y. Comprehensive Review of Crystalline Silicon Solar Panel Recycling: From Historical Context to Advanced Techniques. Sustainability 2024, 16, 60. [Google Scholar] [CrossRef]
  72. Farrell, C.C.; Osman, A.I.; Doherty, R.; Saad, M.; Zhang, X.; Murphy, A.; Harrison, J.; Vennard, A.S.M.; Kumaravel, V.; Al-Muhtaseb, A.H.; et al. Technical Challenges and Opportunities in Realising a Circular Economy for Waste Photovoltaic Modules. Renew. Sustain. Energy Rev. 2020, 128, 109911. [Google Scholar] [CrossRef]
  73. Ravikumar, D.; Seager, T.; Sinha, P.; Fraser, M.P.; Reed, S.; Harmon, E.; Power, A. Environmentally Improved CdTe Photovoltaic Recycling through Novel Technologies and Facility Location Strategies. Prog. Photovolt. Res. Appl. 2020, 28, 887–898. [Google Scholar] [CrossRef]
  74. Xu, X.; Lai, D.; Wang, W.; Wang, Y. A Systematically Integrated Recycling and Upgrading Technology for Waste Crystalline Silicon Photovoltaic Module. Resour. Conserv. Recycl. 2022, 182, 106284. [Google Scholar] [CrossRef]
  75. Alsulami, B.N.N.; Zante, G.; Abbott, A.P.; Feeney, A.; Kettle, J. LCA-Informed Approach for Lower Environmental Impact Recycling of Crystalline Silicon Solar Cells. Available online: https://eprints.gla.ac.uk/332450/ (accessed on 13 February 2025).
  76. Lakhouit, A.; Alhathlaul, N.; El Mokhi, C.; Hachimi, H. Assessing the Environmental Impact of PV Emissions and Sustainability Challenges. Sustainability 2025, 17, 2842. [Google Scholar] [CrossRef]
  77. Directive-2008/98-EN-Waste Framework Directive-EUR-Lex. Available online: https://eur-lex.europa.eu/eli/dir/2008/98/oj/eng (accessed on 13 February 2025).
  78. Kabir, S.E.; Mondal, M.N.I.; Islam, M.K.; Alnaser, I.A.; Karim, M.R.; Ibrahim, M.A.; Sopian, K.; Akhtaruzzaman, M. Adoption and Implementation of Extended Producer Responsibility for Sustainable Management of End-of-Life Solar Photovoltaic Panels. Glob. J. Environ. Sci. Manag. 2023, 9, 251–270. [Google Scholar] [CrossRef]
  79. Directive-2012/19-EN-EUR-Lex. Available online: https://eur-lex.europa.eu/eli/dir/2012/19/oj/eng (accessed on 13 February 2025).
  80. Rubino, A.; Granata, G.; Moscardini, E.; Baldassari, L.; Altimari, P.; Toro, L.; Pagnanelli, F. Development and Techno-Economic Analysis of an Advanced Recycling Process for Photovoltaic Panels Enabling Polymer Separation and Recovery of Ag and Si. Energies 2020, 13, 6690. [Google Scholar] [CrossRef]
Figure 1. Design arrangement of PV modules (on the left) and the annual shading analysis regarding the area of photovoltaic panels (on the right) for an installation with a power of 5.7 kWp [Volt Novavis Group: PV*SOL premium 2021 program (R7) Valentin Software GmbH, Berlin, Germany].
Sustainability 17 05446 g001
Figure 2. Operational scheme of a grid-connected residential photovoltaic (PV) system [https://electricalacademia.com/wp-content/uploads/2018/07/alt24.gif (accessed on 28 May 2025)].
Sustainability 17 05446 g002
Figure 3. The produced energy with an economic effect of 4.35 kWp installation in 2022.
Sustainability 17 05446 g003
Figure 4. The NPV assessment for the analyzed variants. DPP—discounted payback period, I0—initial investment costs.
Sustainability 17 05446 g004
Figure 5. The sensitivity analysis for V0–V2. C&M costs—cleaning and maintenance costs. Note the different scale on the y-axis.
Sustainability 17 05446 g005
Table 1. Technical descriptions of PV installation [producer information].
IndicatorVariant 1 (Installed)Variant 2
PV capacity [kWp]4.355.70
Number of panels [-]1115
PV modules area [m2]23.8732.55
Table 2. The assumptions for the CBA.
Obtained Costs and BenefitsV0V1V2
Energy production-BB
Energy purchaseCC-
Energy sales--B
PV cleaning and maintenance costs-CC
CO2 emissionCC/BB
  • The life expectancy of PV models is 30 years [producer information];
  • The discount rate, r = 5%;
  • The cost of 1 kWh = EUR 0.1536;
  • The electricity prices were converted by the average 5-year inflation rate of energy (ie) carriers = 12.4% [31];
  • The produced and sold energy price was corrected by the balance coefficient for the energy assumed to be 0.43 based on the ratio of the average electricity price [32] to the energy resale price in 2023 [33];
  • The decrease in panel efficiency every year is 0.56% [producer information]. Panel degradation over the system lifetime (30 years) is included in all energy production and economic calculations;
  • The benefits include clean energy production and avoided CO2 emission calculated as the difference between emissions for Poland’s energy sector (622 gCO2/kWh [34]) and the average lifecycle emissions of PV installation (41 gCO2/kWh [35]) multiplied by the annual average price of European Union Emissions Trading System (EU ETS) allowances = 83 EUR/MgCO2 in 2023 [36]. In the case of CO2 emission cost, the value corresponds to emissions for Poland’s energy sector multiplied by the annual average price of EU ETS allowances;
  • The initial investment cost, cleaning, and maintenance costs are set in Table 3;
  • The rate of EUR 1 = 4.6872 PLN [37];
  • All prices were changed yearly by CPI = 3.5%;
  • The household does not use any external sources of financing for the PV model.
Table 3. Cost summary for both PV models [producer information].
CostsVariant 1 (Installed)Variant 2
Initial investment costs [EUR]47375786
Cleaning [EUR/m2]2.35; every year
Maintenance [EUR]75.00 every two years for systems between 3 and 10 kWp
Table 4. The results of the cost–benefit assessment for variants V0, V1, and V2 in a lifetime of 30 years.
VariantNPV [€]IRR [%]DPP [years]
V0−93,822.32--
V18119.505.8517.3
V241,765.8115.667.7
Table 5. ROI, LCOE, and avoided CO2 emissions results for both variants of PV installations.
V1V2
LCOE [EUR/kWh]0.0840.041
ROI [%]327413
Avoided CO2 emission [Mg]78.7107.5
Table 6. The cost–benefit assessment for possible forms of support for prosumers.
VariantNPV [EUR]IRR [%]DPP [years]
Thermo-modernization relief
V18687.666.7516.0
V242,460.1717.306.9
“My Electricity” program
V18972.667.2715.2
V242,619.1717.736.7
“Clean Air” program
V19186.667.7014.6
V242,833.1718.356.5
Disclaimer/Publisher’s Note: The statements, opinions and data contained in all publications are solely those of the individual author(s) and contributor(s) and not of MDPI and/or the editor(s). MDPI and/or the editor(s) disclaim responsibility for any injury to people or property resulting from any ideas, methods, instructions or products referred to in the content.

