Article

Evaluation of Low-Carbon Development in the Construction Industry and Forecast of Trends: A Case Study of the Yangtze River Delta Region

1
China Railway Academy Group Co., Ltd., Chengdu 610031, China
2
School of Environmental Science and Engineering, Southwest Jiaotong University, Chengdu 611756, China
*
Authors to whom correspondence should be addressed.
Sustainability 2025, 17(12), 5435; https://doi.org/10.3390/su17125435
Submission received: 27 April 2025 / Revised: 5 June 2025 / Accepted: 10 June 2025 / Published: 12 June 2025

Abstract

The low-carbon economy is becoming a critical global development paradigm. As the world’s largest carbon emitter, China’s transition toward low-carbon practices in its construction sector is pivotal for achieving its carbon peaking and carbon neutrality goals. Research into the decarbonization pathways and driving factors of this energy- and emission-intensive industry is essential. It not only reduces the sector’s dependence on traditional energy sources but also provides vital support for China’s national energy conservation and emissions reduction strategy. As the construction industry transitions toward low-carbon sustainability, traditional unidimensional assessments based solely on socio-economic and ecological factors are inadequate. This study proposed an integrated evaluation framework using the CRITIC–TOPSIS model, incorporating technological, social, economic, industrial, and energy dimensions. Panel data on energy consumption in the Yangtze River Delta (YRD) region were employed to assess the construction sector’s low-carbon development level and an ARIMA model was utilized to forecast its low-carbon potential. The results indicate that from 2011 to 2022, the sector’s total carbon emissions followed a unimodal trajectory (initial increase followed by decline), with indirect emissions exceeding 90%, primarily from cement, steel, and other building materials. The regional construction industry exhibited a unimodal trajectory in low-carbon development, characterized by an initial increase followed by a decline. Average construction carbon emissions reached 41,637.5877 million tons, with a transient surge (69.67% increase) occurring between 2011 and 2014. This was followed by a 41.83% reduction from 2014 to 2022, with emissions projected to stabilize and gradually increase through 2030. Technological and industrial factors constitute the primary drivers of sectoral low carbon. Quantitative analysis identified the capital utilization rate, industrial structure, and construction industry gross domestic product (GDP) as key impediments to low-carbon transition, with average impedance degrees of 8.713%, 12.280%, and 12.697%, respectively. This study has revealed the key driving factors for the low-carbon development of the construction industry, extending theoretical frameworks for construction industry sustainability. These findings offer empirical support for formulating regionally differentiated carbon mitigation policies.

1. Introduction

As China’s economy continues to grow rapidly, its energy consumption follows a similarly unsustainable trajectory, resulting in significant challenges, such as high energy use, increased pollutant emissions, and escalating environmental pressures. China accounts for over one-quarter of global energy consumption, making it the highest consumer worldwide [1]. This extensive energy use drives greenhouse gas emissions, with China’s carbon emissions reached 12.6 billion tons in 2023, accounting for 33.7% of the global total [2]. The construction industry is a major contributor to carbon emissions, as the total carbon dioxide emissions from the construction process reached 5.13 billion tons in 2022—48.3% of the country’s total carbon emissions [3]. To address the challenges of resource and energy consumption, as well as carbon emissions, the transition of the construction industry to green, sustainable, and low-carbon development has emerged as an inevitable trend [4].
Research on building energy efficiency has spanned nearly 50 years and has encompassed theoretical studies, technological innovations, regulatory frameworks, and other key developments. Technological advancements play a vital role in mitigating carbon emissions from the construction sector. These advancements not only reduce energy use and pollution but also enhance and refine existing technologies [5], ensuring alignment with national, industrial, and sectoral low-carbon development goals [6]. Several developed countries have introduced strategic plans to promote green, low-carbon construction, resulting in relatively mature systems [7]. This progress is largely driven by government policy, the establishment of industry standards, and increased investment in research and development, all supporting the sector’s green and low-carbon transition.
Research on low-carbon development in China’s construction industry is still in its exploratory stage, with existing studies focusing on two main areas. The first is the exploration of green transition pathways, which involves reviewing low-carbon development evaluation methods, constructing a low-carbon evaluation indicator system [8], quantitatively assessing the industry’s low-carbon development level [9], and analyzing the relationship between regional construction industry carbon emissions, energy consumption, and economic growth. The second is the research and development of low-carbon technology solutions, which involves combining international building energy efficiency standards and the carbon reduction potential of new energy sources to propose appropriate energy-saving technologies and policy recommendations [10]. However, systematic research on the driving factors of green and low-carbon development in the construction industry is currently relatively scarce, and the synergistic driving mechanisms between multiple factors such as technology, economy, and society have not been fully explored. Therefore, in-depth identification of the key driving factors of low-carbon development in the construction industry and the construction of a comprehensive evaluation index system will help to accurately formulate emission reduction policies and clarify carbon reduction technology paths [11], which is crucial for promoting the green and low-carbon transformation and upgrading the construction industry.
Extensive research has been conducted in the field of low-carbon development evaluation in the construction industry, with the core focus on identifying key driving factors and establishing a scientific evaluation indicator system to deeply explore the intrinsic mechanisms of low-carbon development in the industry. In terms of evaluation methods, techniques such as TOPSIS and principal component analysis (PCA) have been widely applied. Shen et al. utilized the TOPSIS model to explore the overall demand for green building schemes in Zhejiang Province, ranking and selecting different schemes to provide a scientific basis for the development of green buildings in the region [12]. Kong et al. employed principal component analysis (PCA) based on the theory of high-quality development in the construction industry, constructed an indicator system from an industrial perspective, finding that changes in real estate policies significantly impact the development of the construction industry [13]. Naik et al. employed the Criteria Importance Through Intercriteria Correlation (CRITIC) method to determine indicator weights when constructing a low-carbon development evaluation model for the construction industry [14]. By quantifying the correlation and conflict between indicators, they objectively reflected their importance, demonstrating the unique advantages of this method in sustainability evaluations.
To gain a more systematic understanding of the future trends in the evaluation of low-carbon development in the construction industry, scholars have conducted relevant predictive studies. Lederer et al. utilized regression analysis to predict the development trends of construction materials in the market environment, revealing their future patterns of change [15]. Pourrahimian et al. employed a system dynamics model to predict the sustainable performance of Singapore’s construction industry, simulating the outcomes under different policies and development strategies, providing robust support for making informed decisions regarding the industry’s future sustainable development [16]. These predictive studies not only provide critical data support and a decision-making basis for the construction industry’s low-carbon transition but also reveal industry development patterns through quantitative analysis, enabling proactive optimization of resource allocation and the formulation of differentiated emission reduction strategies.
Although the existing research has made valuable contributions, several limitations remain. First, the selection of evaluation indicators largely depends on expert scoring or semi-quantitative methods for assigning weights, making the evaluation process subjective. Second, many evaluation methods are complex and require considerable time, as well as expertise and specialized knowledge. Further in-depth research is needed to explore the potential for low-carbon development within regional construction industries and to refine the corresponding evaluation indicator systems. Since the effectiveness, validity, and interrelationships of these indicators are critical for comprehensive evaluations, it is essential to develop systems tailored to the structural and developmental characteristics of specific regions.
As a result of the aforementioned insights, this study focused on the YRD region and developed a comprehensive evaluation index system for low-carbon development in the construction industry using the CRITIC-TOPSIS model. This study aimed to optimize resource allocation and enhance the construction sector’s capacity for sustainable low-carbon development under future socioeconomic scenarios. It contributed to existing research in three main ways. First, it established a multi-dimensional comprehensive evaluation system. Addressing the limitations of the existing evaluation system, which is driven by a single factor, we proposed a comprehensive evaluation system based on five dimensions: technology, society, economy, industry, and energy. We used methods such as coefficients of variation and correlation analysis to select indicators, effectively avoiding redundant information and ensuring that the evaluation dimensions cover the key factors of low-carbon development in the industry. Second, the CRITIC-TOPSIS model utilizes the CRITIC model to objectively assign weights based on the information content and conflictive degree of the data, and then combined with the TOPSIS model to perform a comprehensive evaluation of multiple indicators, significantly improving the objectivity and scientific nature of the evaluation results. Third, it introduced obstacle factor diagnosis and prediction models. Through obstacle factor diagnosis models, it accurately identified key obstacles to low-carbon development in the construction industry and addressed the shortcomings of existing research in analyzing the mechanisms of these obstacles. It used ARIMA models to predict trends in low-carbon development in the regional construction industry, providing forward-looking references for policy-making to ensure that policy recommendations are in line with industry development and effectively enhance the practical guidance value of research results for the low-carbon sustainable development of the construction industry. The evaluation process is illustrated in Figure 1.

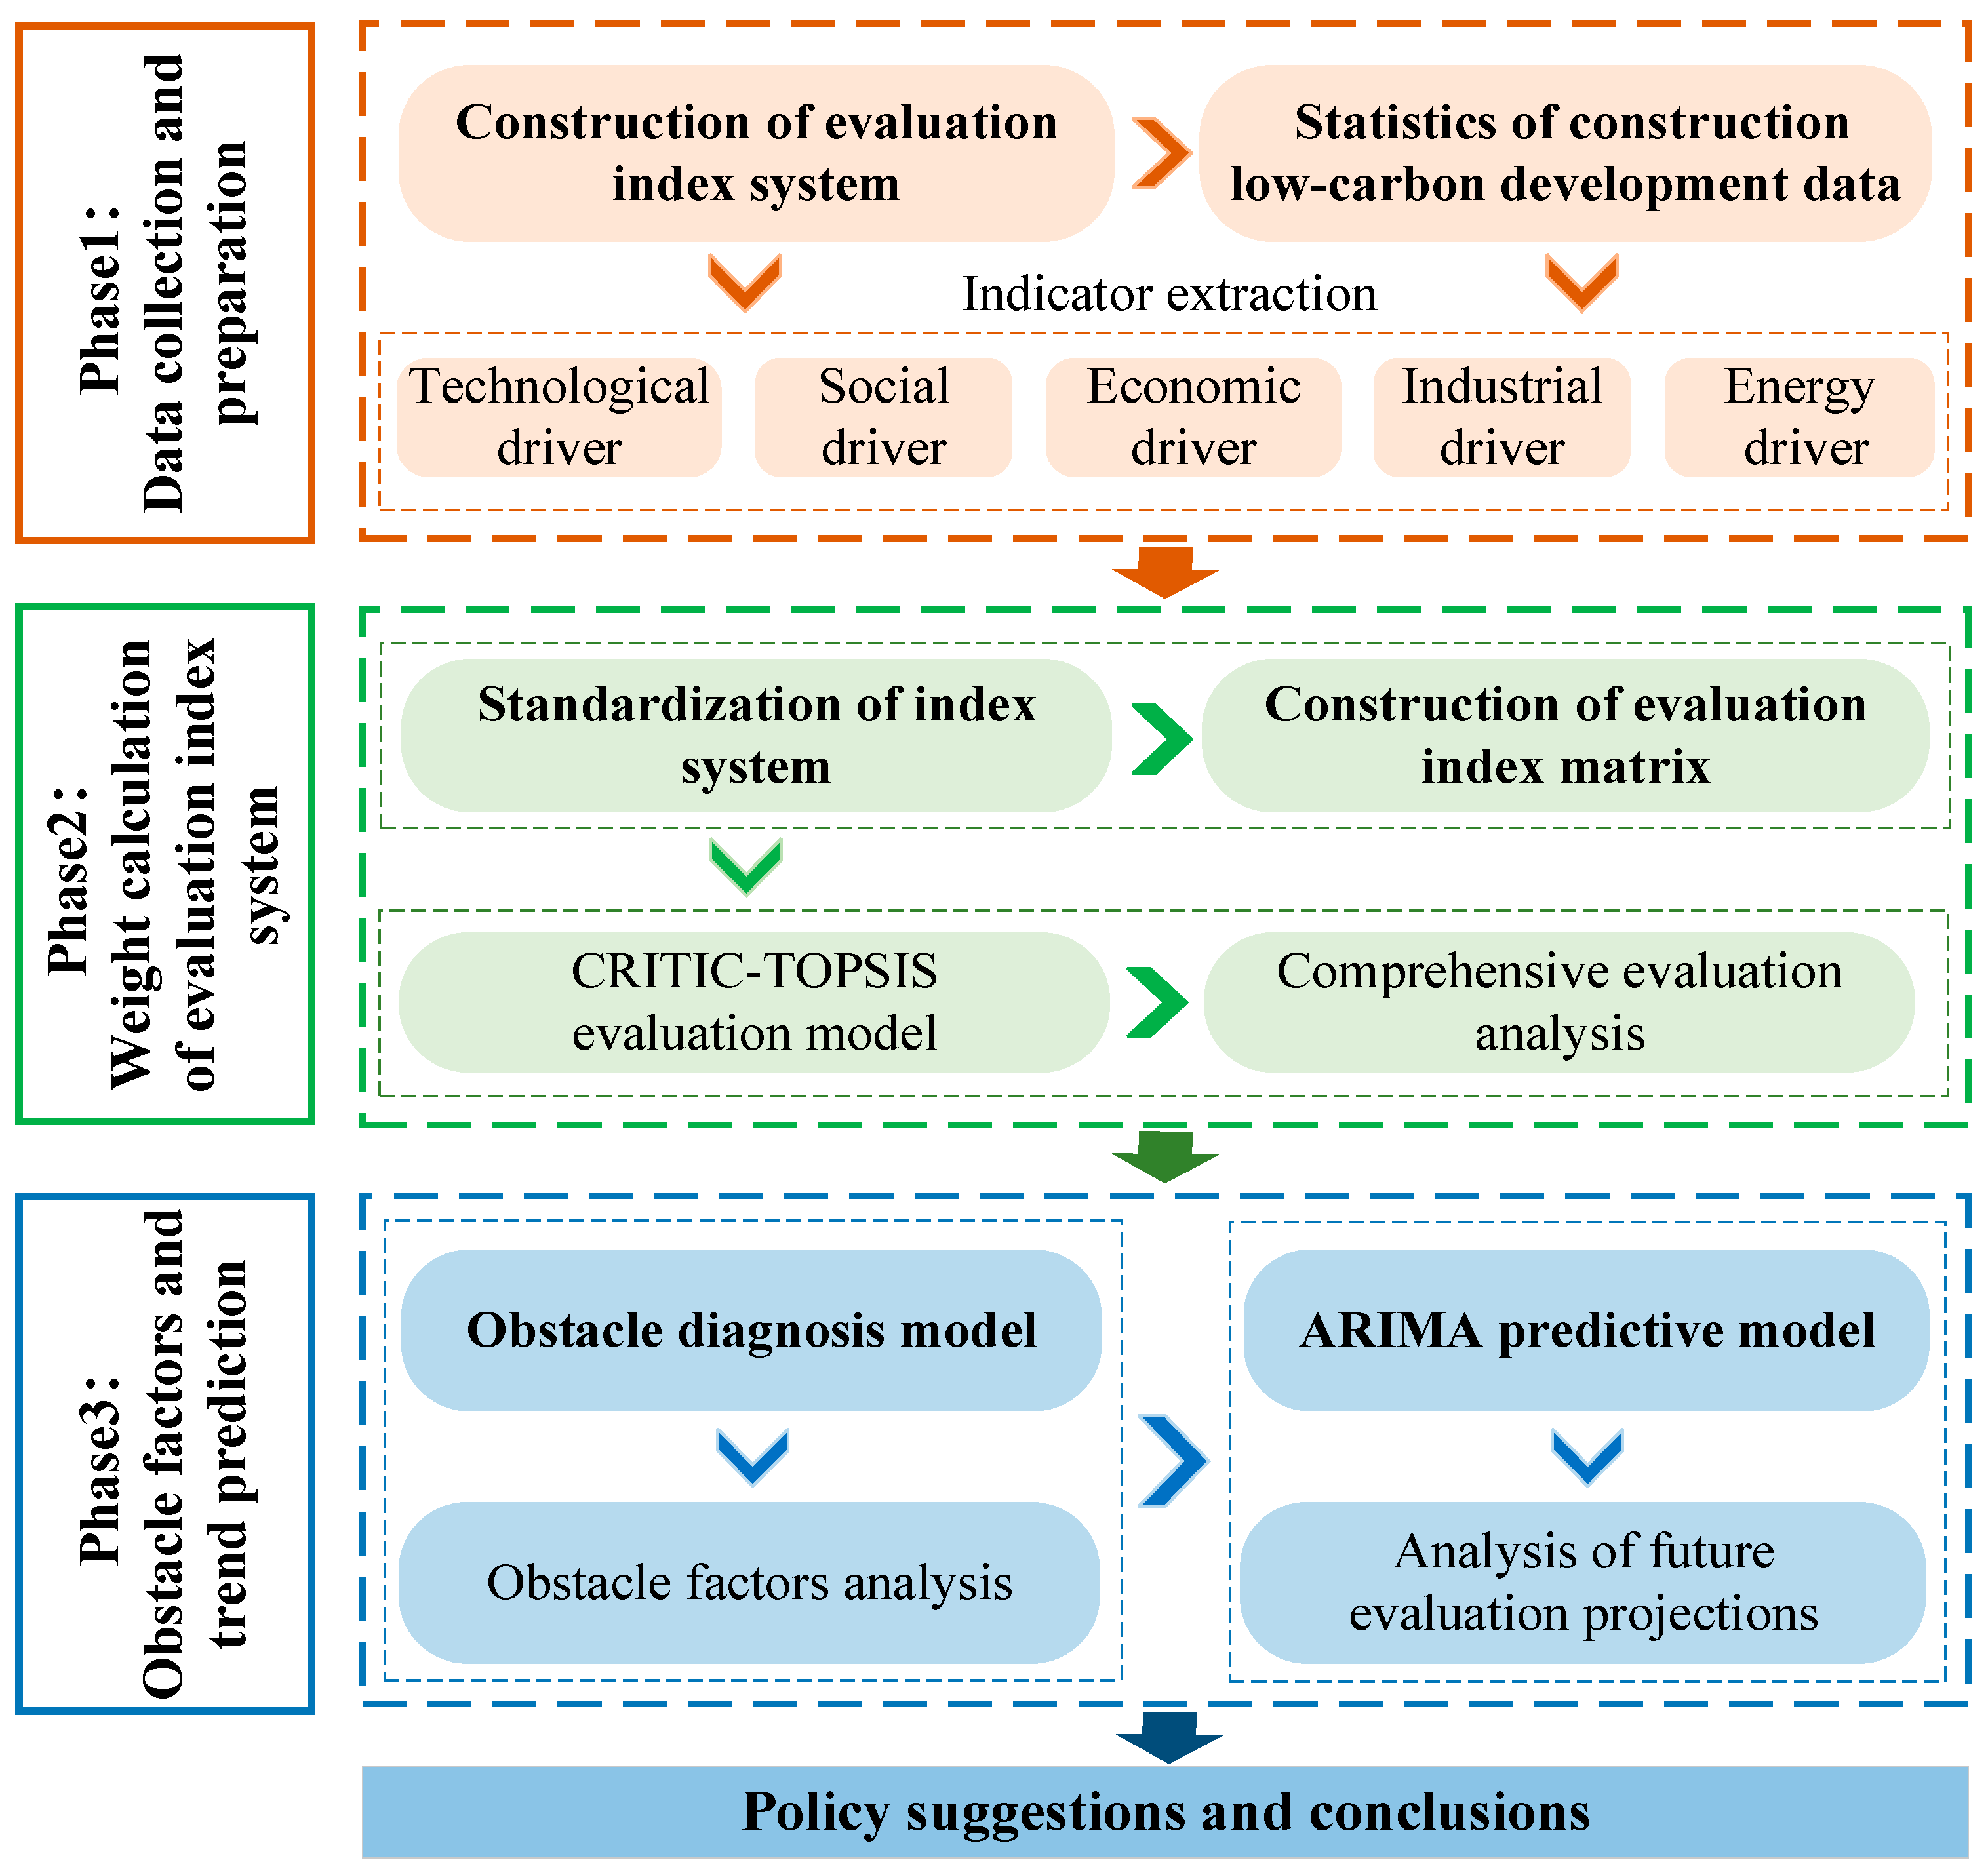
2. Materials and Methods

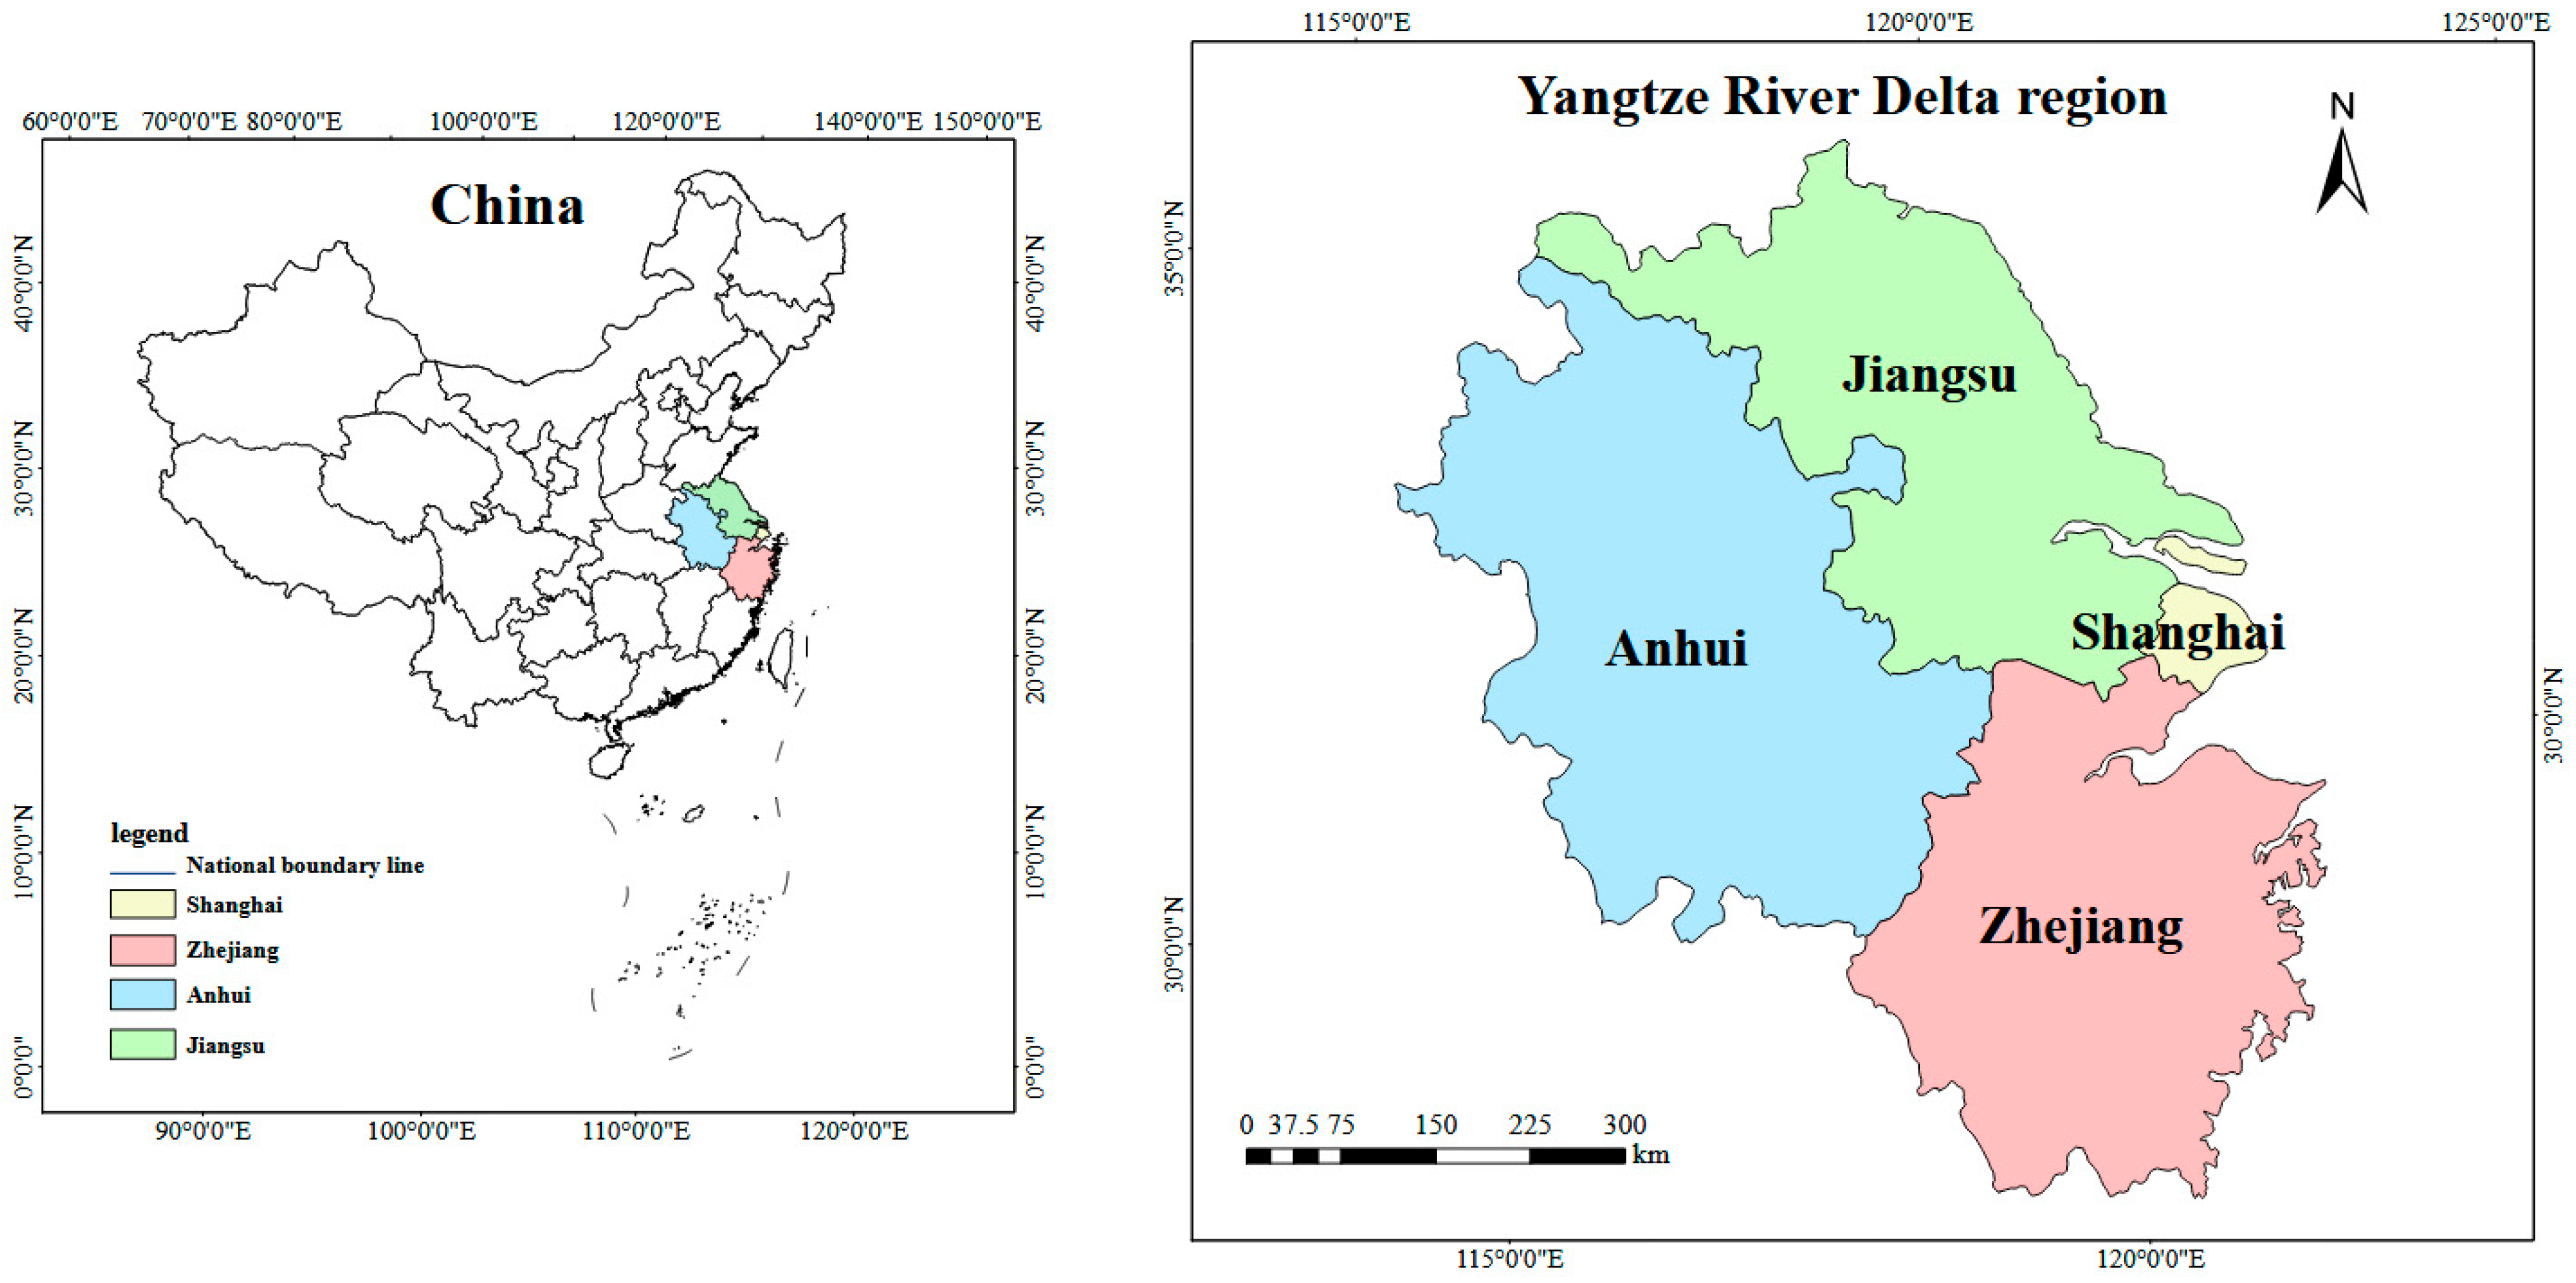
2.1. Study Area and Data Sources

The YRD region encompasses the Shanghai, Jiangsu, Zhejiang, and Anhui provinces (Figure 2). Strategically located at the intersection of the ‘Belt and Road’ Initiative and the Yangtze River Economic Belt, the region serves as a critical hub in China’s national modernization and opening-up strategy. It is not only an important platform for China’s participation in international competition, but also a catalyst for economic and social development, playing a leading role in the Yangtze River Economic Belt [17]. Moreover, the YRD region is among the best-positioned for urbanization. In 2022, the construction industry’s gross output in the region reached approximately RMB 7.72 trillion, accounting for 30% of the national total. In the first half of 2022, the region maintained its leadership in total construction output, with Jiangsu and Zhejiang contributing 11.5% (RMB 148.72 billion) and 8.4% (RMB 1086.66 billion), respectively, to the national construction output. Understanding the evolution of low-carbon development in the regional construction industry not only facilitates the green transformation of the economy but also drives the growth of related industrial chains and creates new economic opportunities. By advancing green building practices and low-carbon technologies, the overall energy efficiency of the construction industry can be enhanced, resource consumption can be minimized, and environmental pollution can be reduced, thereby supporting sustainable economic development.
This study used panel data of the YRD region from 2011 to 2022 for comprehensive evaluation, and all indicator data were obtained from the China Statistical Yearbook, China Energy Statistical Yearbook and China Building Statistical Yearbook on the China National Knowledge Infrastructure (CNKI) platform (https://www.cnki.net/, (accessed on 15 October 2024)), and the neighborhood interpolation method was used to fill in some of the missing data.

2.2. Carbon Emission Assessment in the Construction Industry

Researchers, both domestically and internationally, primarily use three methods to calculate carbon emissions: the material balance method [18], the measured method [19], and the carbon emission factor method [20]. Among these methods, the material balance and direct measurement approaches are the most suitable for assessing carbon emissions in industrial enterprises. This study adopted the IPCC coefficient method [21] due to its broader applicability. Carbon emissions in the construction industry are classified as direct or indirect based on their interactions within the sector and with other energy-intensive industries [22]. Direct carbon emissions refer to the carbon dioxide produced from the direct consumption of primary energy within the construction industry. Indirect emissions, by contrast, are associated with the production and transport of construction materials, which involve upstream and downstream companies. To account for data availability, direct carbon emissions were calculated using eight types of energy involved in the construction industry’s life cycle, including raw coal, petrol, and diesel. These energy types, along with their standard coal coefficients and carbon emission factors, are detailed in Table 1. Indirect carbon emissions were attributed to five major building materials (cement, glass, steel, aluminum, and wood) commonly used throughout the construction process, and their specific carbon emission factors and recovery factors are outlined in Table 2.
The carbon emission calculation model is formulated as follows:
E = E D + E I
E D = 44 12 i = 1 8 C i × f i × α i
E I = i = 1 5 M j × Q j × ( 1 β j )
where E represents the total carbon emissions from the construction industry, E D represents the direct carbon emissions from the construction industry, E I represents the indirect carbon emissions from the construction industry, C i represents the consumption of the i -th type of energy, f i represents the conversion factor of the i -th type of energy to standard coal, α i represents the carbon emission factor of the i -th type of energy, 44/12 represents the conversion factor of the relative molecular mass of carbon and carbon dioxide (the relative atomic mass of carbon is 12, and that of carbon dioxide is 44), M j represents the consumption of the j -th type of construction materials, Q j represents the carbon emission factor of the j -th type of energy, and β j represents the recycling factor of the j -th building material.

2.3. Evaluation Methodology for Low-Carbon Development in the Construction Industry

2.3.1. Construction of the Evaluation Indicator System

An evaluation index system for low-carbon development in the construction industry must be developed based on the region’s current development status and structural characteristics. The system is organized into primary and secondary indicators, as shown in Table 3. The primary indicators consist of five key drivers: technology, society, economy, industry, and energy. The secondary indicators include 20 quantitative measures covering various aspects of low-carbon construction.

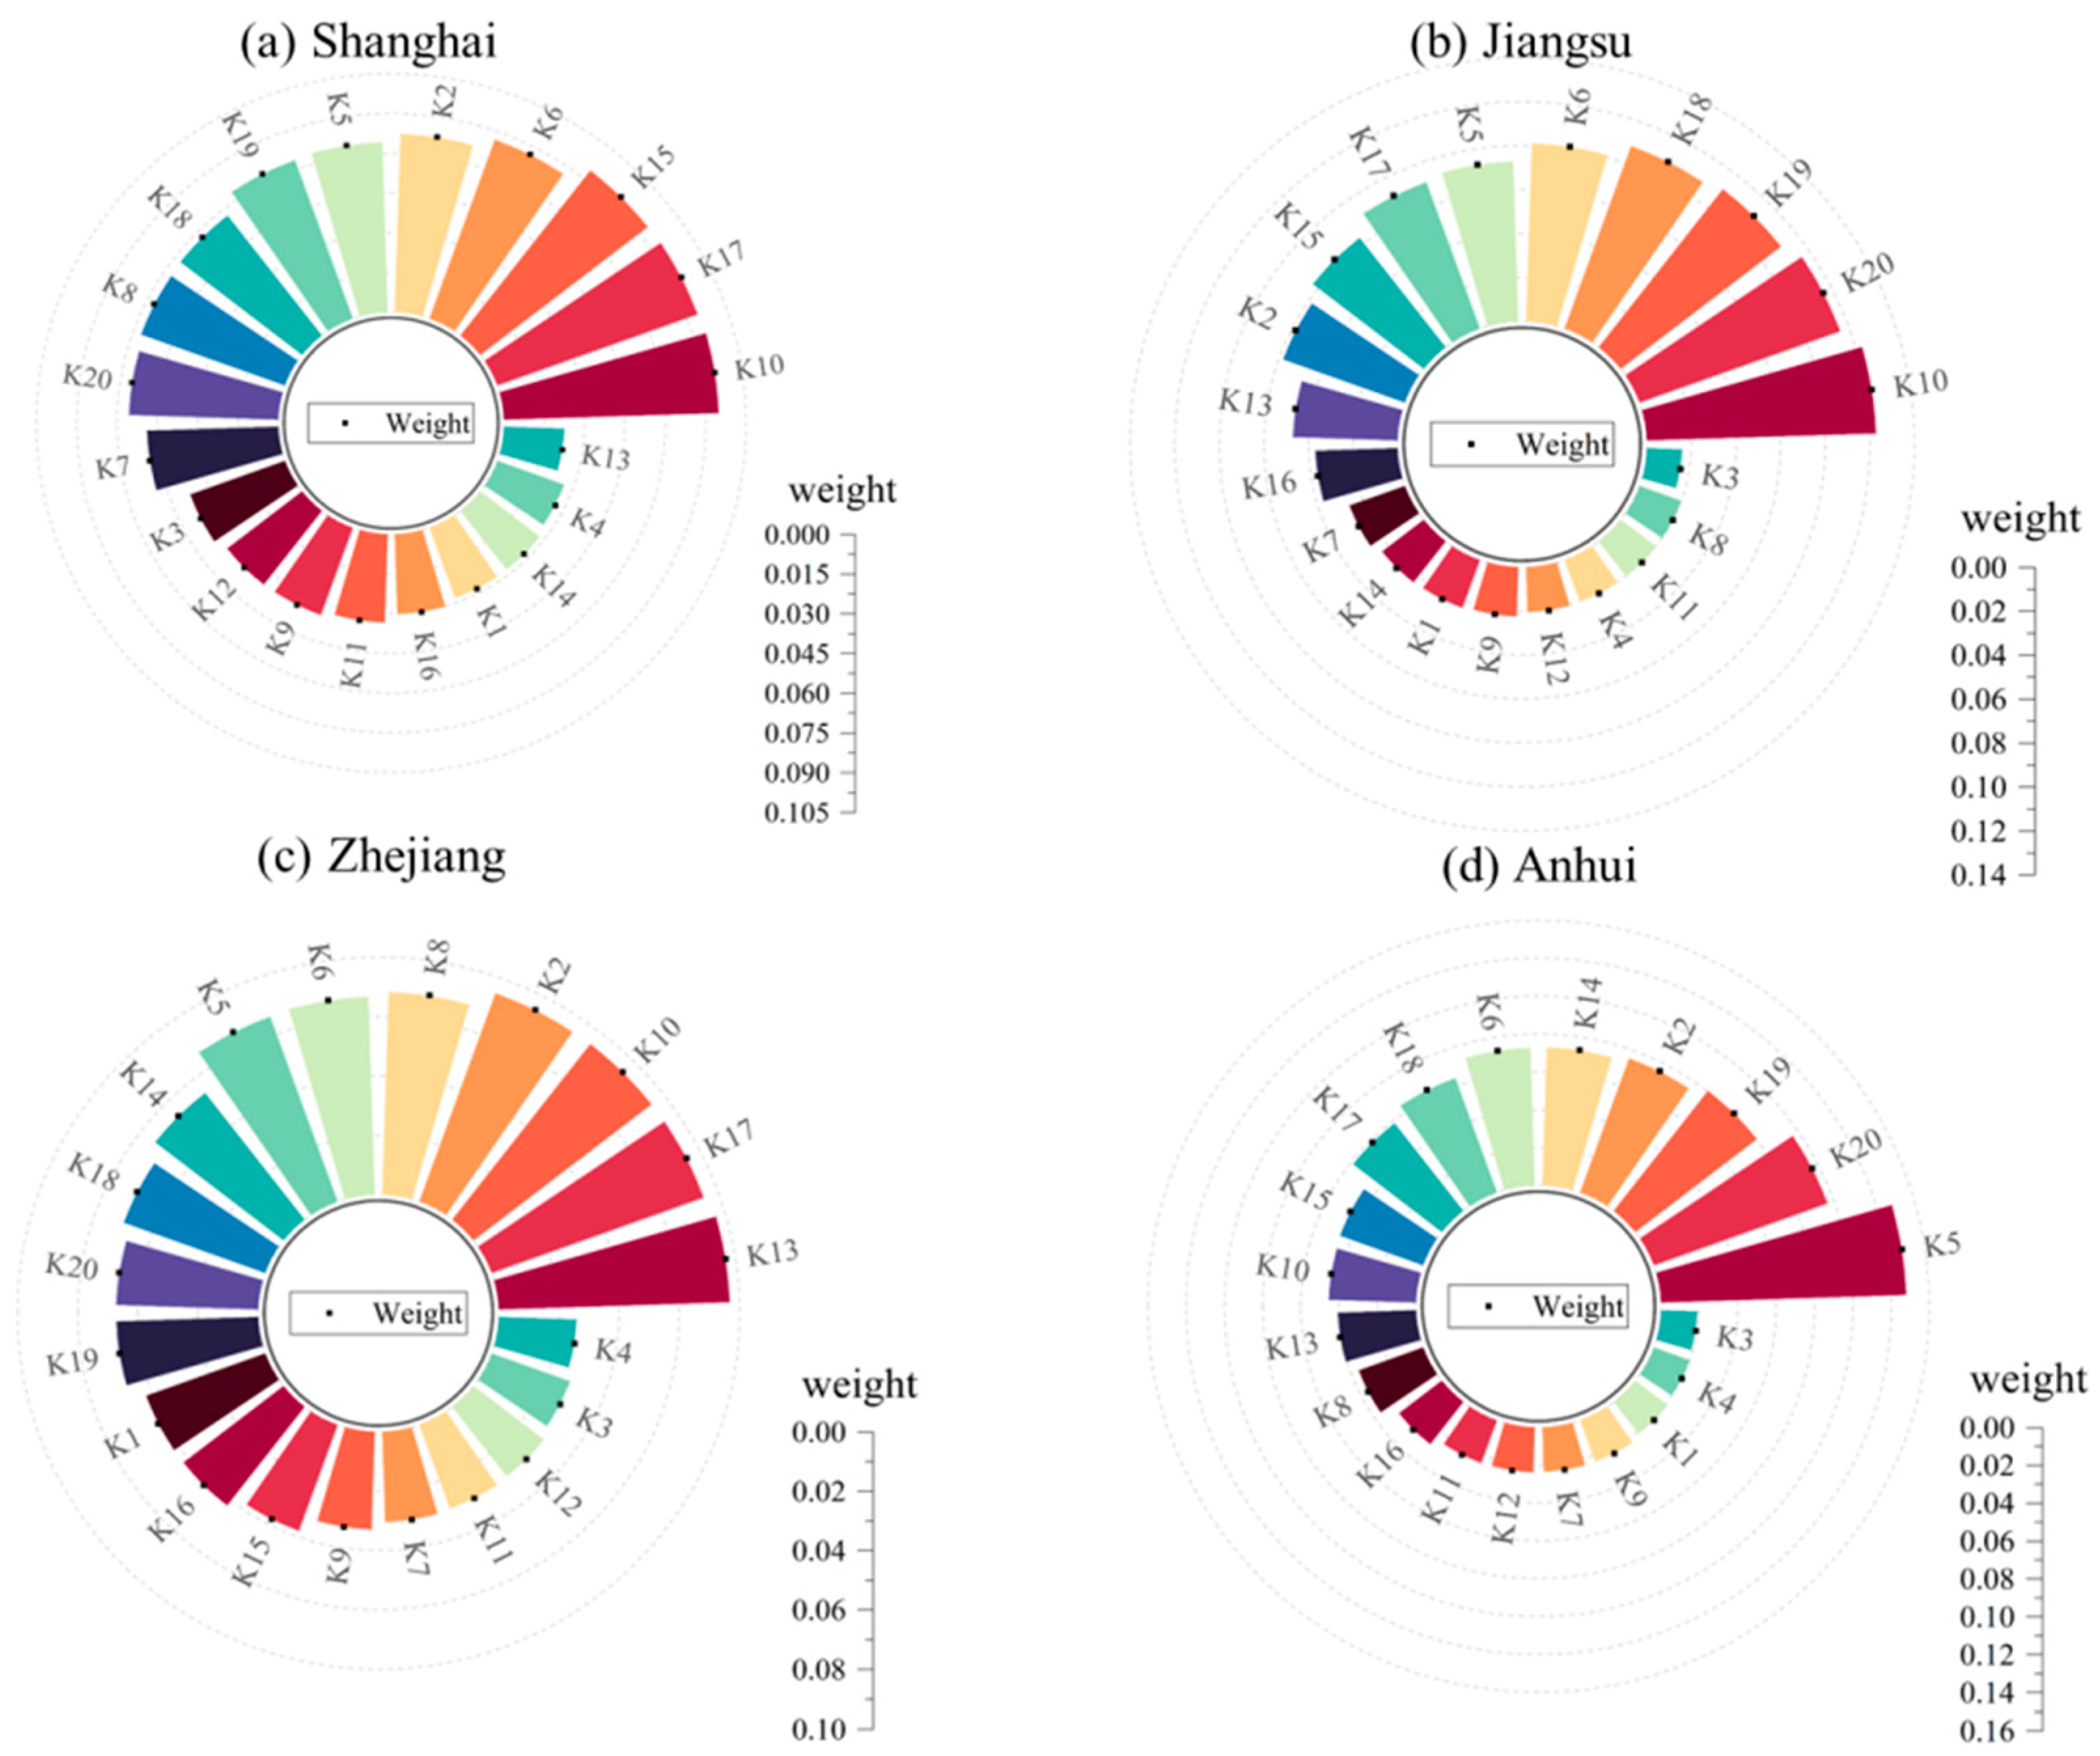
2.3.2. CRITIC-TOPSIS Evaluation Model

The CRITIC-TOPSIS model is a method that combines CRITIC objective weighting with TOPSIS comprehensive evaluation. Its core advantage lies in the use of mathematical methods to eliminate subjective bias. The CRITIC method objectively determines weights through a comparison of strength and conflict analysis [23], with higher weight values assigned to criteria with greater information content or lower correlation. The TOPSIS method ranks evaluation objects based on their relative proximity to positive/negative ideal solutions by calculating the Euclidean distance between them [24]. Combining the two methods avoids subjective weighting biases while accounting for the interactive effects between indicators [25], enabling a systematic and scientific assessment of the low-carbon development capabilities of the construction industry. The key steps in the CRITIC-TOPSIS model are as follows:
1. Given the diverse data types and dimensions of the indicators in comprehensive evaluations, standardization of raw indicator data is necessary to mitigate their impact on the assessment results:
x i j = y i j min y i j max y i j min y i j ( Positive   indicators )
x i j = max y i j y i j max y i j min y i j ( Negative   indicators )
where y i j represents the original data for the j -th indicator of the i -th evaluation object; and x i j is the normalized data: i =1,2,…, m ; j =1,2,… n .
2. To eliminate the influence of the data units and averages on the degree of dispersion, the coefficient of variation is computed for each indicator:
υ j = i = 1 m x i j x j ¯ 2 n 1
where variability is typically measured by the standard deviation, which reflects the fluctuation in the values observed within each indicator; υ j represents the standard deviation of the j -th indicator; x j ¯ represents the mean of the j -th indicator.
3. The conflict between indicators is calculated as follows:
R j = i = 1 n 1 r t j
where R j represents the conflict index of the j -th indicator, with greater conflict leading to less information conveyed; and r t j represents the correlation coefficient between indicator t and indicator j . Since the indicators are all fixed distance variables, the Pearson correlation coefficient is used ( r t j 1 ). A smaller r t j value represents a weaker degree of correlation between the indicators. The correlation coefficient is calculated as follows:
r t j = i = 1 m ( x i t x t ¯ ) ( x i j x j ¯ ) i = 1 m ( x i t x t ¯ ) 2 · i = 1 m ( x i j x j ¯ ) 2
4. The amount of information is calculated for each indicator:
c j = v j R j
where c j represents the information content of the j -th indicator. A larger c j value indicates more information and thus necessitates a larger weight.
5. The calculation of the weighting of each indicator is outlined as follows:
w j = c j / j = 1 n c j
where w j represents the weight value of the j -th indicator.
6. Based on the standardized values and weights of the indicators, the weighted standardization matrix Z is determined as follows:
z i j = w j g i j
where Z represents the weighted normative matrix and w j represents the weight of the j -th indicator. The norm matrix G is obtained using the vector norm method:
G = ( g i j ) m × n
g i j = x i j / i = 1 m x i j 2
The weighted normalized decision matrix Z is then constructed as follows:
Z = z 11 z 12 z 1 n z 21 z 22 z 2 n z m 1 z m 2 z m n = w 1 g 11 w 2 g 12 w n g 1 n w 1 g 21 w 2 g 22 w n g 2 n w 1 g m 1 w 2 g m 2 w n g m n
7. The positive ideal solution Z j + and negative ideal solution Z j are calculated for the j -th indicator, where j = 1 , 2 , , n :
Z j + = max z i j = z 1 + , z 2 + , , z n +
Z j = max z i j = z 1 , z 2 , , z n
8. The distance of the i -th evaluation object from the positive and negative ideal solutions is calculated as follows:
D i + = j = 1 n Z i + z i j 2 = ( D 1 + ,   D 2 + , ,   D n + )
D i = j = 1 n Z i z i j 2 = ( D 1 ,   D 2 , ,   D n )
where D i + represents the distance from the judgment object to the positive ideal solution and D i represents the distance from the judgment object to the negative ideal solution.
9. The comprehensive evaluation indicators are determined as follows:
T i = D i D i + + D i ( 1 i m )
where T i represents the closeness, with a value range of 0 ≤ T i ≤ 1. The T i values are sorted based on their size, where a value closer to 1 indicates a better evaluation of the object and a value closer to 0 indicates a worse evaluation of the object.

2.4. Diagnostic Model for Barriers to Low-Carbon Development

The evaluation of low-carbon development in the construction industry goes beyond assessing the current progress; it also focuses on identifying barriers that hinder advancement. The barrier factor diagnostic model [26] allows for a precise analysis of obstacles impeding low-carbon development in the sector. This approach facilitates targeted policy recommendations to promote low-carbon initiatives in the regional construction industry. The formula is as follows:
J i j = 1 x i j
O i j = w i × J i j / i = 1 n w i × J i j
U i = 1 / m i = 1 n O i j
where J i j represents the degree of deviation of the indicator, indicating the degree of difference between the value of each indicator and the optimal value; x i j represents the standard value of the j -th evaluation object for the i -th indicator obtained through Equations (4) and (5); O i j represents the degree of obstruction of the i -th indicator in the j -th object of evaluation, with larger values representing deeper obstruction; w i represents the factor contribution, which indicates the degree of influence of individual indicators on the overall indicator system and is expressed in this study using the weight values of the indicators obtained from Equation (10); and U i represents the average barrier degree of the i -th indicator over the study period.

2.5. Low-Carbon Development Potential Forecasting Model

To further investigate the future trajectory of low-carbon development in the construction industry, an ARIMA ( p , q , d ) model was employed for trend forecasting. This model classifies time-series data into two primary categories based on stationarity: stationary and non-stationary series [27]. The ARIMA model, a widely used time-series forecasting method [28], is one of the most effective techniques for such analysis. By applying differencing, ARIMA transforms a non-stationary series into a stationary one, allowing for the identification of an optimal model to fit the data. Its underlying principle involves analyzing trends, dynamic characteristics, and the persistence of the timeseries to build a model based on both historical and current data, thereby providing highly accurate predictive results. The formulae for this analysis are as follows:
φ p ( L ) ( 1 L ) d Y t = ϑ q ( L ) ε t
φ p ( L ) = 1 φ 1 L φ 2 L 2 φ p L P
ϑ q ( L ) = 1 + ϑ 1 L + ϑ 2 L 2 + ϑ q L q
ε t ~ W N ( 0 , σ 2 )
where φ p ( L ) and ϑ q ( L ) represent the autoregressive and sliding average coefficient polynomials of the ARIMA model, respectively; L represents the lag operator; φ 1 , , φ p and ϑ 1 , , ϑ q represent the coefficient weights; Y t represents the original time series; ε t represents the white noise series; d represents the difference order; and ( 1 L ) d represents the representation of the sequence order difference by a lag operator.

3. Results and Discussion

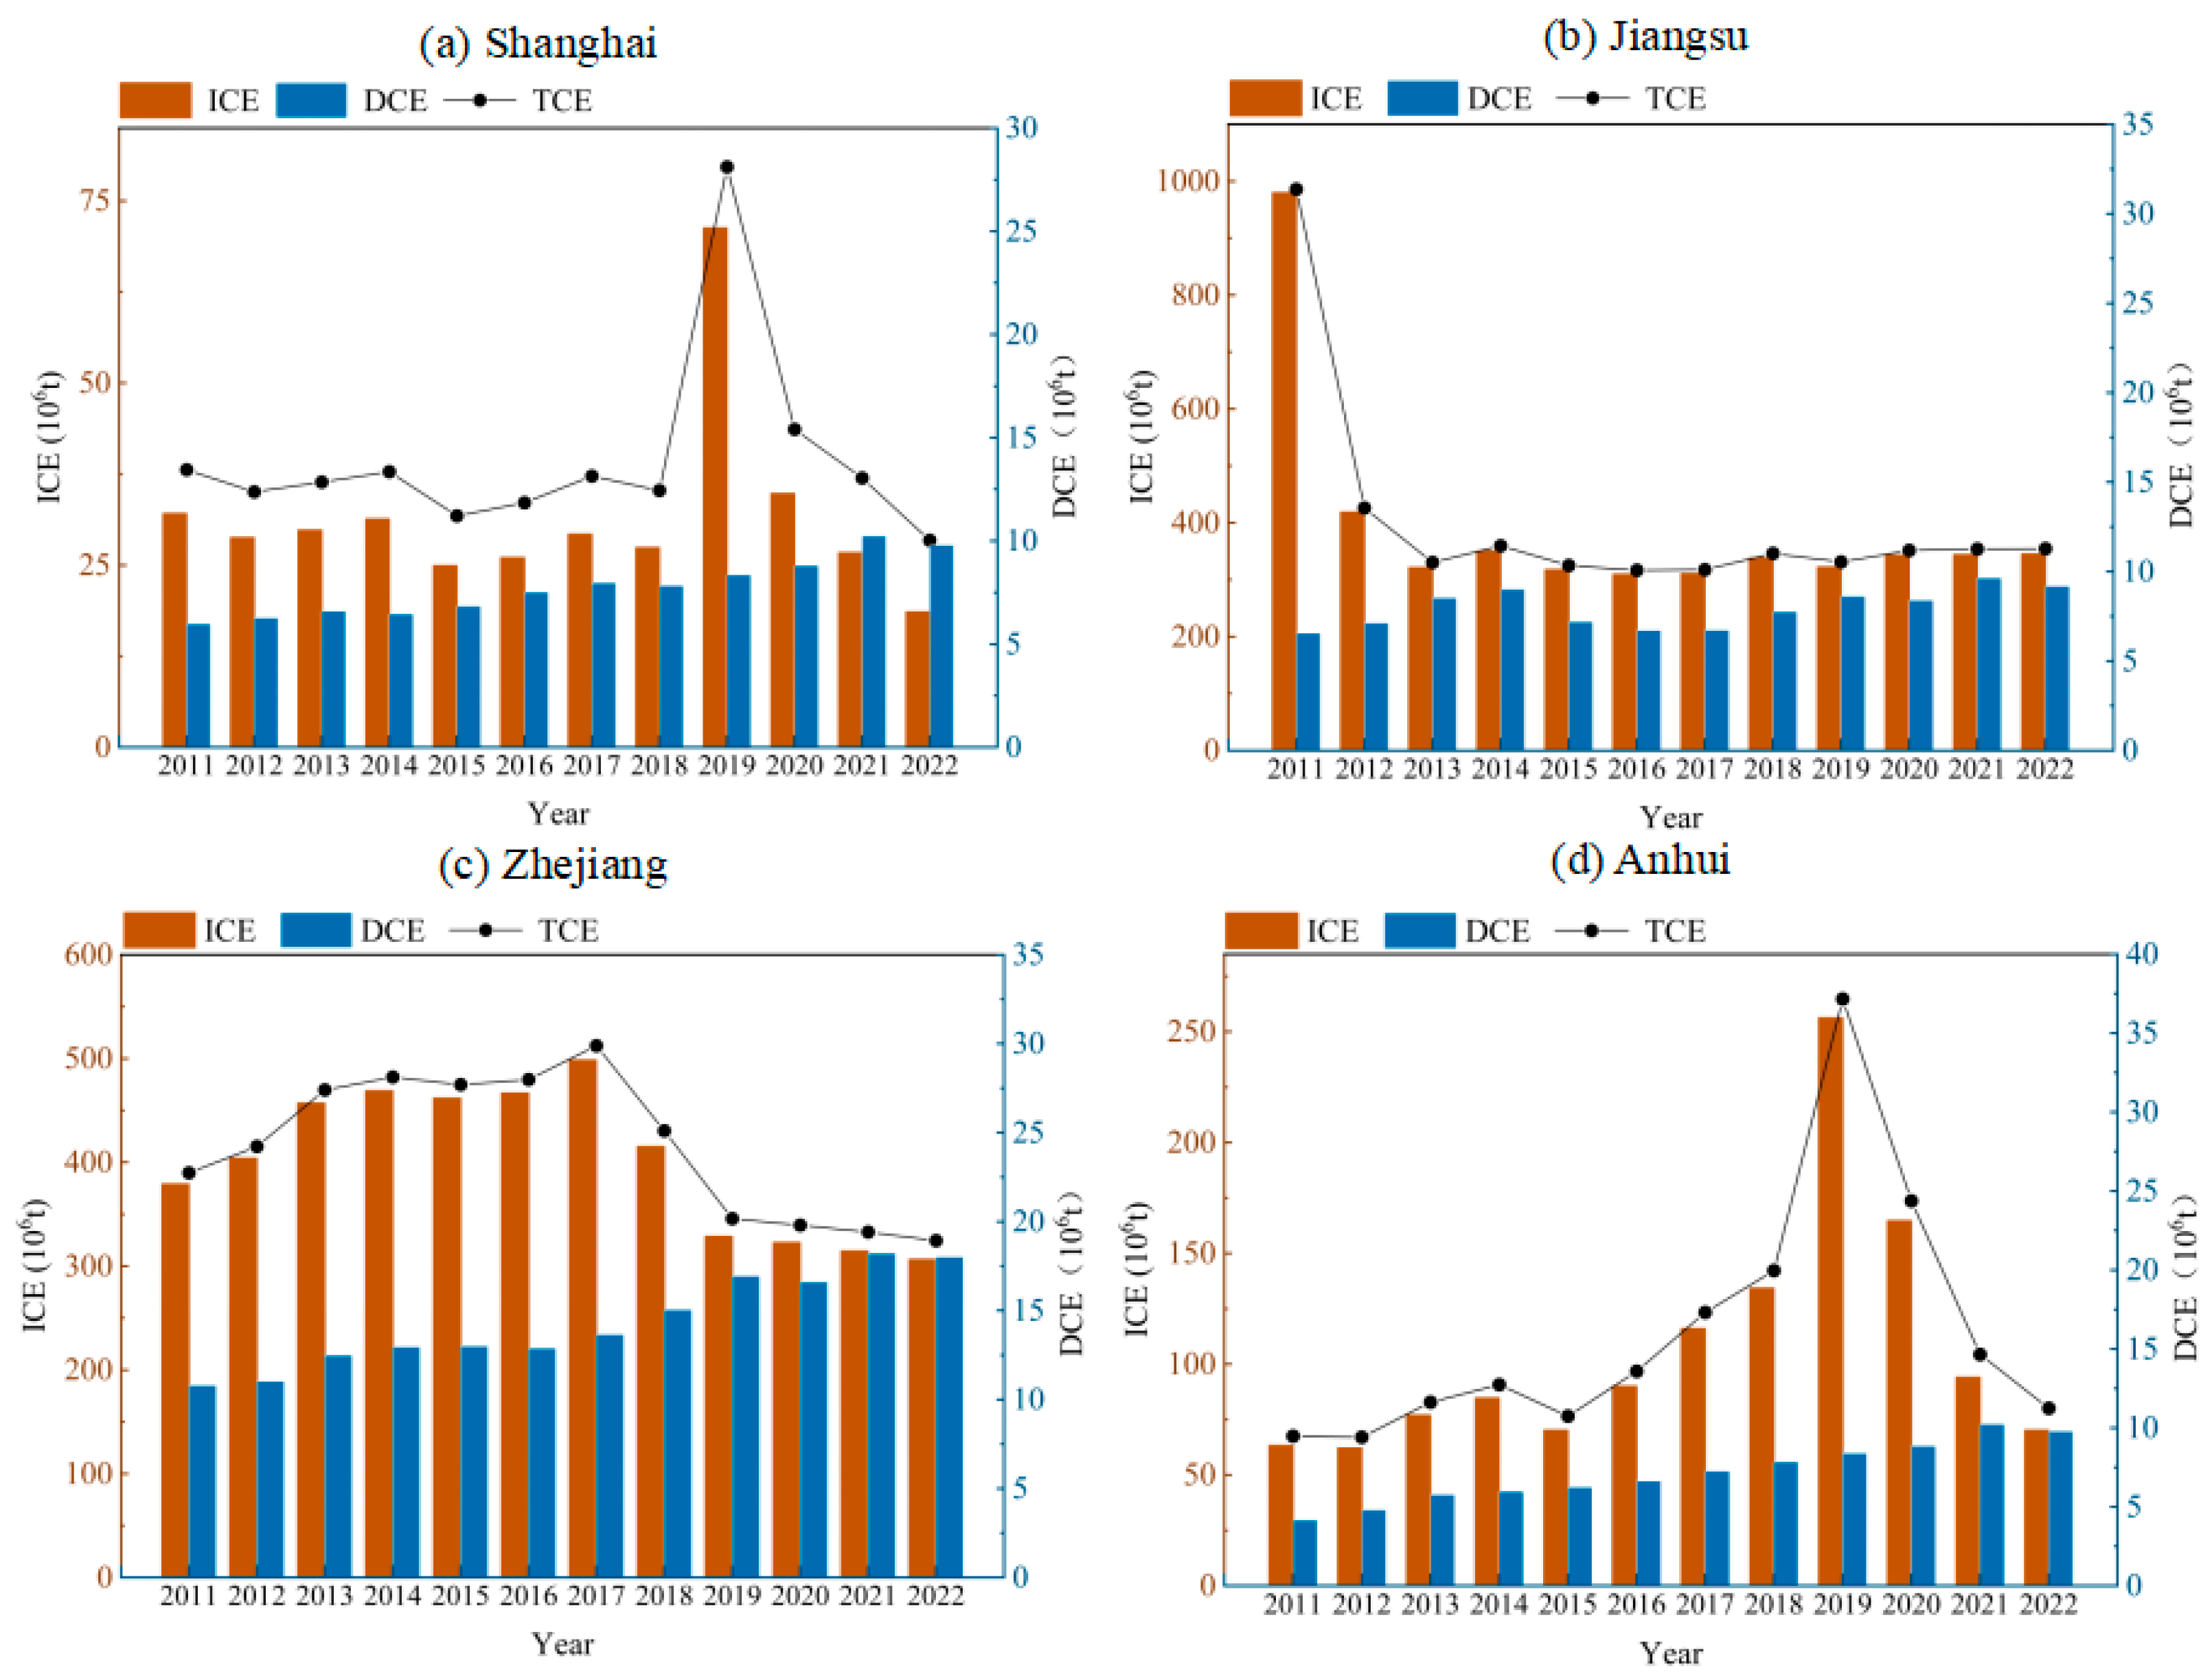
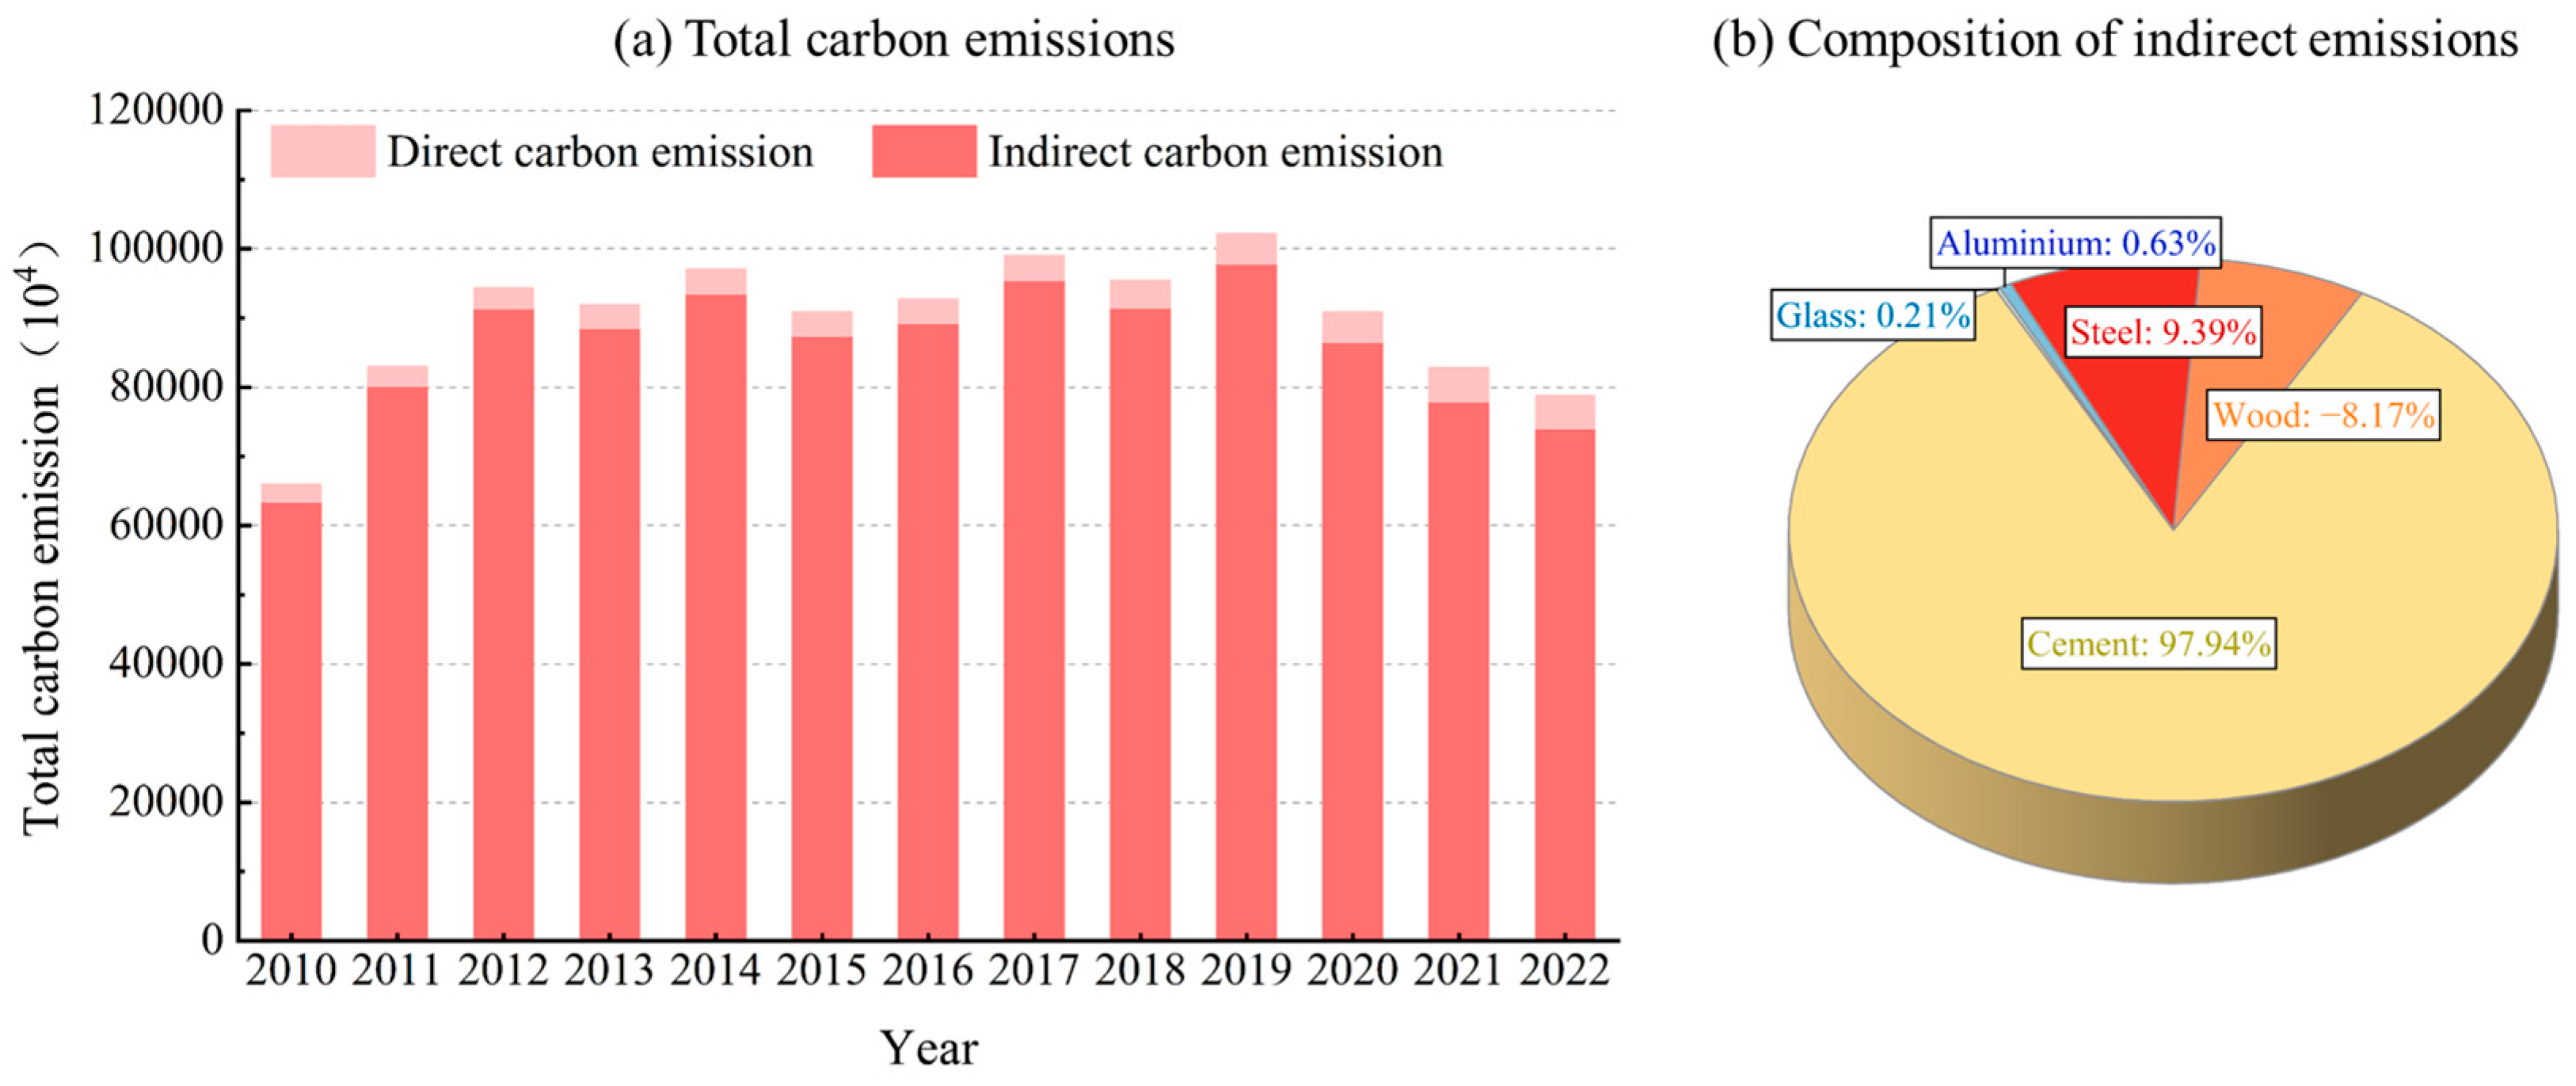
3.1. Characteristics of Carbon Emission Changes

Carbon emissions data for the construction industry in the YRD region from 2011 to 2022 (Figure 3) show that carbon emissions in the four regions generally followed an upward trend followed by a downward trend. Regional differences were due to differences in development stages and policy responses. From 2011 to 2017, carbon emissions increased in line with industry growth. After 2017, driven by the State Council General Office’s Opinions on Promoting the Sustainable and Healthy Development of the Construction Industry [29], the construction industry achieved a rapid decline in carbon emissions by transforming its construction methods. When broken down by region, Zhejiang Province had the highest average carbon emissions in the construction sector, reaching 416.376 million tons during the study period. Jiangsu Province followed with an average of 345.517 million tons, maintaining a high and stable level overall. Shanghai and Anhui both reached their carbon emission peaks in 2019, at 28.402 million tons and 80.066 million tons, respectively. Subsequently, under the guidance of the “Green Industry Guidance Catalog (2019 Edition),” carbon emissions showed a rapid declining trend through the promotion of green transformation in material manufacturing and pollution control [30]. This study indicates that changes in carbon emissions in the construction industry of the YRD region are not only influenced by national policy regulation but are also closely related to the industrial foundation, policy response speed, and transformation pathways of each province and municipality.
Indirect emissions played a dominant role, accounting for over 90% of total carbon emissions (Figure 4). The main contributors to indirect carbon emissions were cement, steel, wood, aluminum, and glass. Among these, cement and steel together accounted for 107.33% of the total due to overlapping emission sources in the calculation, while wood reduced indirect emissions by 8.17%, making it the only renewable, carbon-negative material among the five. Consequently, indirect carbon emissions from the construction industry represent a critical area for emissions reduction. By targeting high-impact materials like cement and steel and improving production processes and resource efficiency, the industry can advance a green, low-carbon transformation and move toward sustainable development.

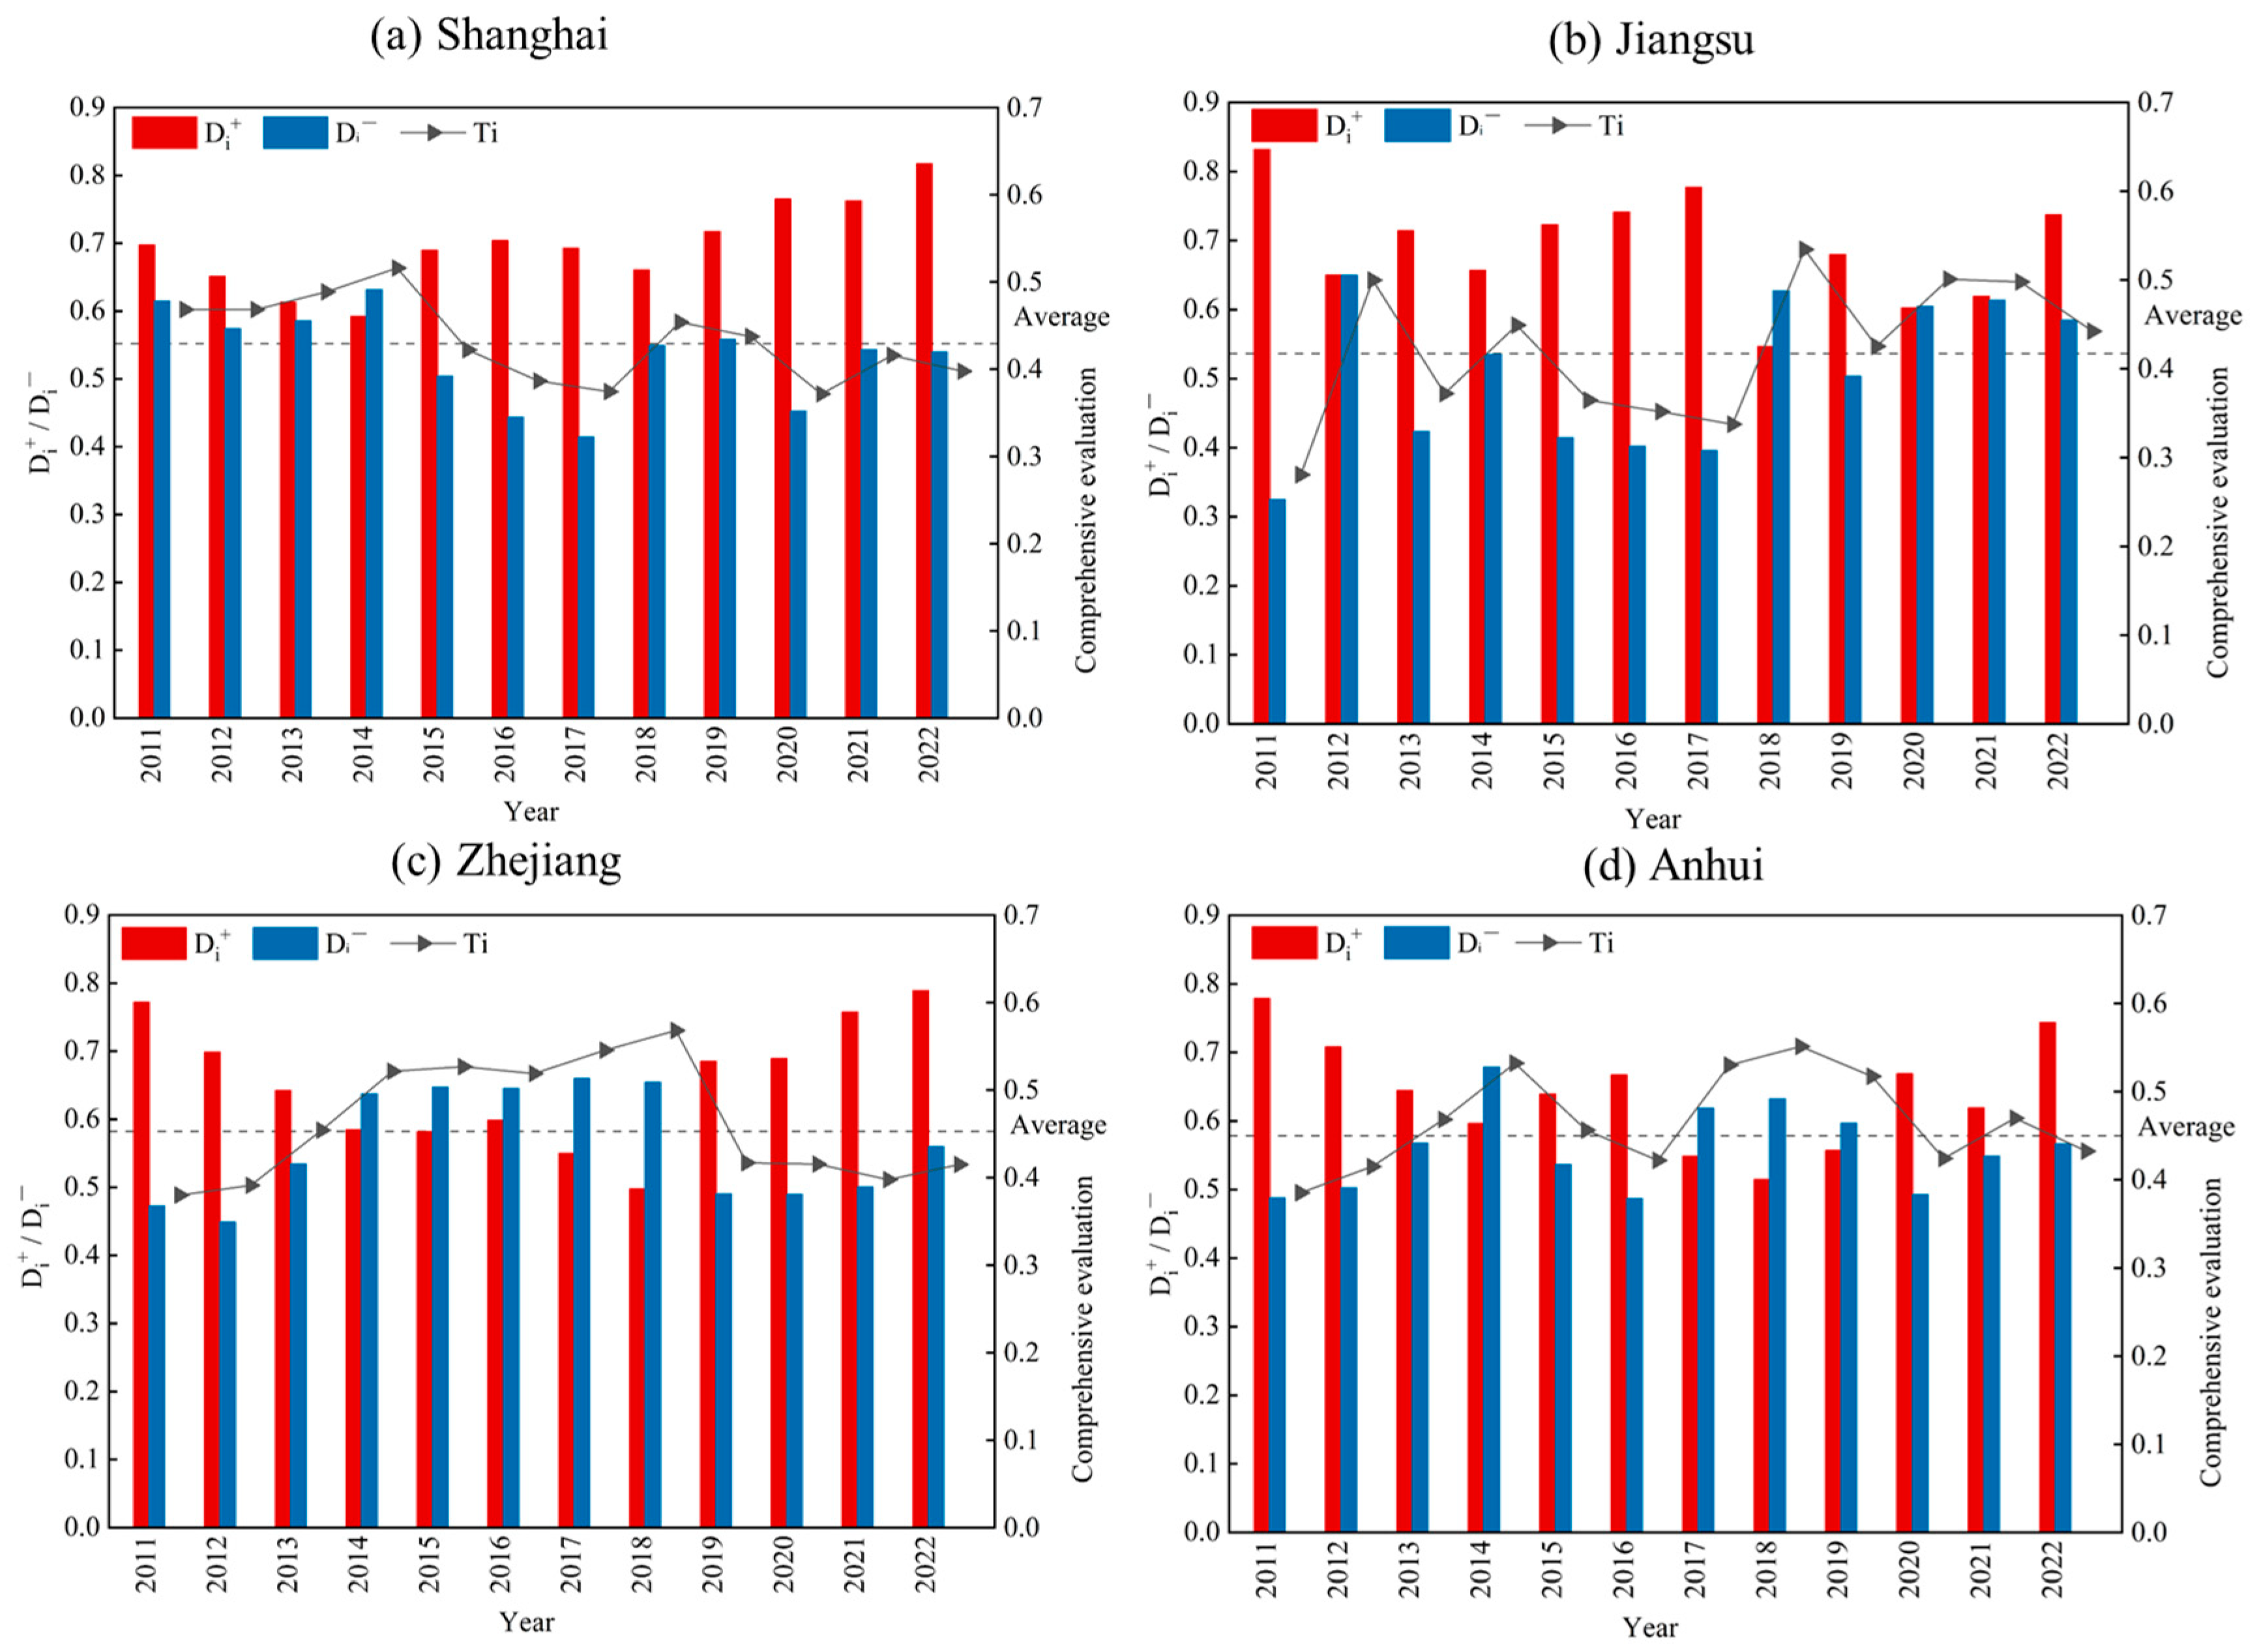
3.2. Low-Carbon Development Evaluation

Based on the weight values of the low-carbon development evaluation index system for the construction industry in the YRD region (Table 4), the indicators with higher weights are technical equipment rate (K5), total output value of the construction industry (K10), and energy intensity (K20), indicating that the core pathways for promoting low-carbon development in this region are through technological innovation and energy efficiency improvements. The relatively low weights of social driving factors suggest that the region relies more on internal industry dynamics to drive development. It is worth noting that although R&D expenditure was prioritized at the policy level, its weight was relatively low. This was primarily due to the construction industry’s short-term results-oriented approach and project-based characteristics, which rely more on the application of existing mature technologies and management optimization. However, R&D investments are subject to time lags between the R&D cycle and the evaluation cycle. In contrast, the Beijing–Tianjin–Hebei region places greater emphasis on policy-driven cross-regional collaborative governance, leveraging government regulatory measures such as administrative constraints and institutional innovations to drive the low-carbon transformation of the construction industry [31]. This phenomenon reflects the differentiated low-carbon development paths chosen by different regions based on their own development conditions.
As shown in Figure 5, Shanghai and Zhejiang provinces show the highest combined weight values for the gross output value of the construction industry (K10), industrial structure (K17), and number of construction enterprises (K15). These indicators, all classified as industry drivers, reflect the robust development of the construction sector in both regions in terms of market size, industry structure, and enterprise composition. In contrast, in Jiangsu and Anhui Provinces, the technical equipment rate (K5), energy intensity (K20), and carbon dioxide emissions (K19) received relatively high weights. This indicates significant energy consumption within the construction sector in these provinces and highlights the urgent need to promote the adoption and diffusion of green construction technologies to support the sector’s modernization and low-carbon transition.
The evaluation results for low-carbon development in the construction industry across the YRD region in the period from 2011 to 2022 are shown in Figure 6. Overall, the trends of positive/negative Euclidean distance changes in the four study regions were inversely related; a positive Euclidean distance exhibited a fluctuating upward trend, whereas a negative Euclidean distance demonstrated a fluctuating downward trend, leading to a declining trend in the comprehensive evaluation results.
The comprehensive evaluation results for low-carbon development in the construction industry across the four regions showed a rapid upward trend between 2011 and 2014. During this time, the total output of the construction industry increased by 207.485 billion yuan. This growth period coincided with the 12th Five-Year Plan [32], which accelerated urbanization and drove strong demand for industrial buildings as well as urban and rural infrastructure. The resulting surge in demand positioned infrastructure development as a key market driver and created substantial opportunities for regional growth in the construction industry.
The comprehensive evaluation of low-carbon development in the construction industry across various regions from 2014 to 2022 shows a pattern of initial growth followed by fluctuating declines. During the 13th Five-Year Plan period, the national government promoted green buildings, while the YRD region actively implemented energy-saving standards and shifted toward the development of prefabricated buildings. However, central and western regions faced slower progress due to factors such as insufficient market drivers and a single-industry structure [33]. However, the construction industry in the YRD region still faces challenges in its transformation: on the one hand, industry standardization efforts remain incomplete, and a unified carbon emissions regulation system for buildings has yet to be established. On the other hand, insufficient investment in technological innovation (K4 and K3) has led to a decline in equipment levels, including a reduction of 50.87 million kilowatts in the total power of self-owned construction machinery and equipment at year end (K3), and a decrease in the technical equipment rate (K5) to 18,578 yuan per person; simultaneously, the number of industry personnel (K8) decreased by 1.03 million, and the completed floor area of buildings (K13) shrunk to 213.492 million square meters, reflecting the phased characteristics of industry structural adjustment. It is worth noting that there is still room for improvement in renewable energy utilization rates [34], indicating that the systematic transition from traditional construction models to green and low-carbon models still requires sustained efforts.
From the results of the weighting of driving factors in various regions (Figure 7), it can be seen that the weighting of technological and industrial driving factors has remained at a relatively high level for a long time, fluctuating within a certain numerical range. The weighting values of social and economic driving factors are relatively low and have remained relatively stable during the study period, indicating that technological innovation and industrial restructuring are the main driving forces in this region, while the influence of socio-economic factors is relatively indirect and stable.
For the technological drivers, all four regions experienced an initial decline followed by growth, with the technology equipment rate (K5) and power equipment rate (K6) having relatively high weight values. This trend is particularly evident in Jiangsu and Anhui provinces, underscoring their critical role in advancing the technological development of the construction industry. Since 2011, the YRD region has actively pursued technological innovation within the sector. The contributions of R&D personnel (K3) and R&D expenditures (K4) were especially notable. This indicates that fostering scientific talent is essential for accelerating the transformation of technological achievements, an important driver of low-carbon development in the regional construction industry.
The social drivers remained low across all four regions with minimal variation, particularly in Jiangsu Province. The contribution of the year-end resident population (K7) and urbanization rate (K9) to social drivers was relatively low. In 2021, birth rates in Shanghai (4.67%), Jiangsu (5.65%), Zhejiang (6.90%), and Anhui (6.38%) showed a clear downward trend. The demographic shift, driven by changes in the population’s age structure, is expected to reduce construction demand, prompting both the government and enterprises to exercise caution in infrastructure investments. As a result, the expansion of the construction market is constrained, limiting the sector’s impact on low-carbon development.
Economic drivers account for a relatively low proportion of the weighting values across the four regions, particularly regional GDP (K11) and per capita GDP (K12), which contribute little to the economic drivers of the construction industry in these regions. This is primarily attributed to regional development disparities and diminishing marginal effects, as construction industry development levels vary across regions. When regional economies reach a higher stage of development, the elasticity coefficient between construction industry growth and total economic output significantly decreases, weakening its direct driving role in the low-carbon development of the construction industry [35]. Meanwhile, the construction industry’s gross output value (K10) has a higher weighting contribution, primarily due to its strong correlation and multifaceted influence. This indicator directly reflects the production scale of the construction industry and is highly correlated with industry energy consumption and carbon emissions levels. Additionally, as a key quantitative indicator of industrial development, it plays a crucial role in promoting industrial structure transformation, resource allocation capabilities, and technological innovation.
The weighted values of the industry drivers across all four regions showed a pattern of increase followed by a decrease, impacting decarbonization efforts in the construction industry. By the end of the study period, the weight values for the industrial drivers were 0.2564, 0.2151, 0.1551, and 0.1459 for SH, ZJ, JS, and AH, respectively. The indicators for industrial structure (K17) and number of construction enterprises (K15) accounted for a substantial proportion of the weight value. These indicators enhance competitiveness among enterprises and improve production efficiency, which is essential for the development of the regional industry.
The energy drivers in the four regions showed an initial increase followed by a decrease, with energy intensity (K20) and carbon dioxide emissions (K19) accounting for a significant share, particularly in JS and AH provinces, where their weights were 0.2750 and 0.2409, respectively. The production, transportation, and construction of building materials generate substantial carbon emissions and adversely impact the environment [36]. Thus, focusing on building materials as a critical area for emission reduction and exploring methods to minimize carbon emissions will be vital. This issue will require global collaboration to achieve substantial progress in decarbonizing the construction industry.
In summary, throughout the evaluation period, the construction industry has established a strong development foundation and gradually transitioned from rapid growth to high-quality, low-carbon development. This transition offers a valuable reference point for regions with relatively low levels of economic development. In addition, the findings of this study are consistent with those of Li et al. [37] who used a DEA model to argue that optimizing industrial structure is a key pathway for promoting low-carbon development in the construction industry [38]. This conclusion provides a scientific basis for the formulation of green innovation and emissions reduction policies in the regional construction industry. However, compared to traditional DEA methods, the CRITIC-TOPSIS model adopted in this study demonstrates significant advantages in multi-dimensional comprehensive evaluation through objective weighting and ideal solution approximation methods. It better aligns with the comprehensive evaluation requirements for low-carbon development in the regional construction industry, offering more operationally feasible research approaches to reveal its phased characteristics and optimization pathways.

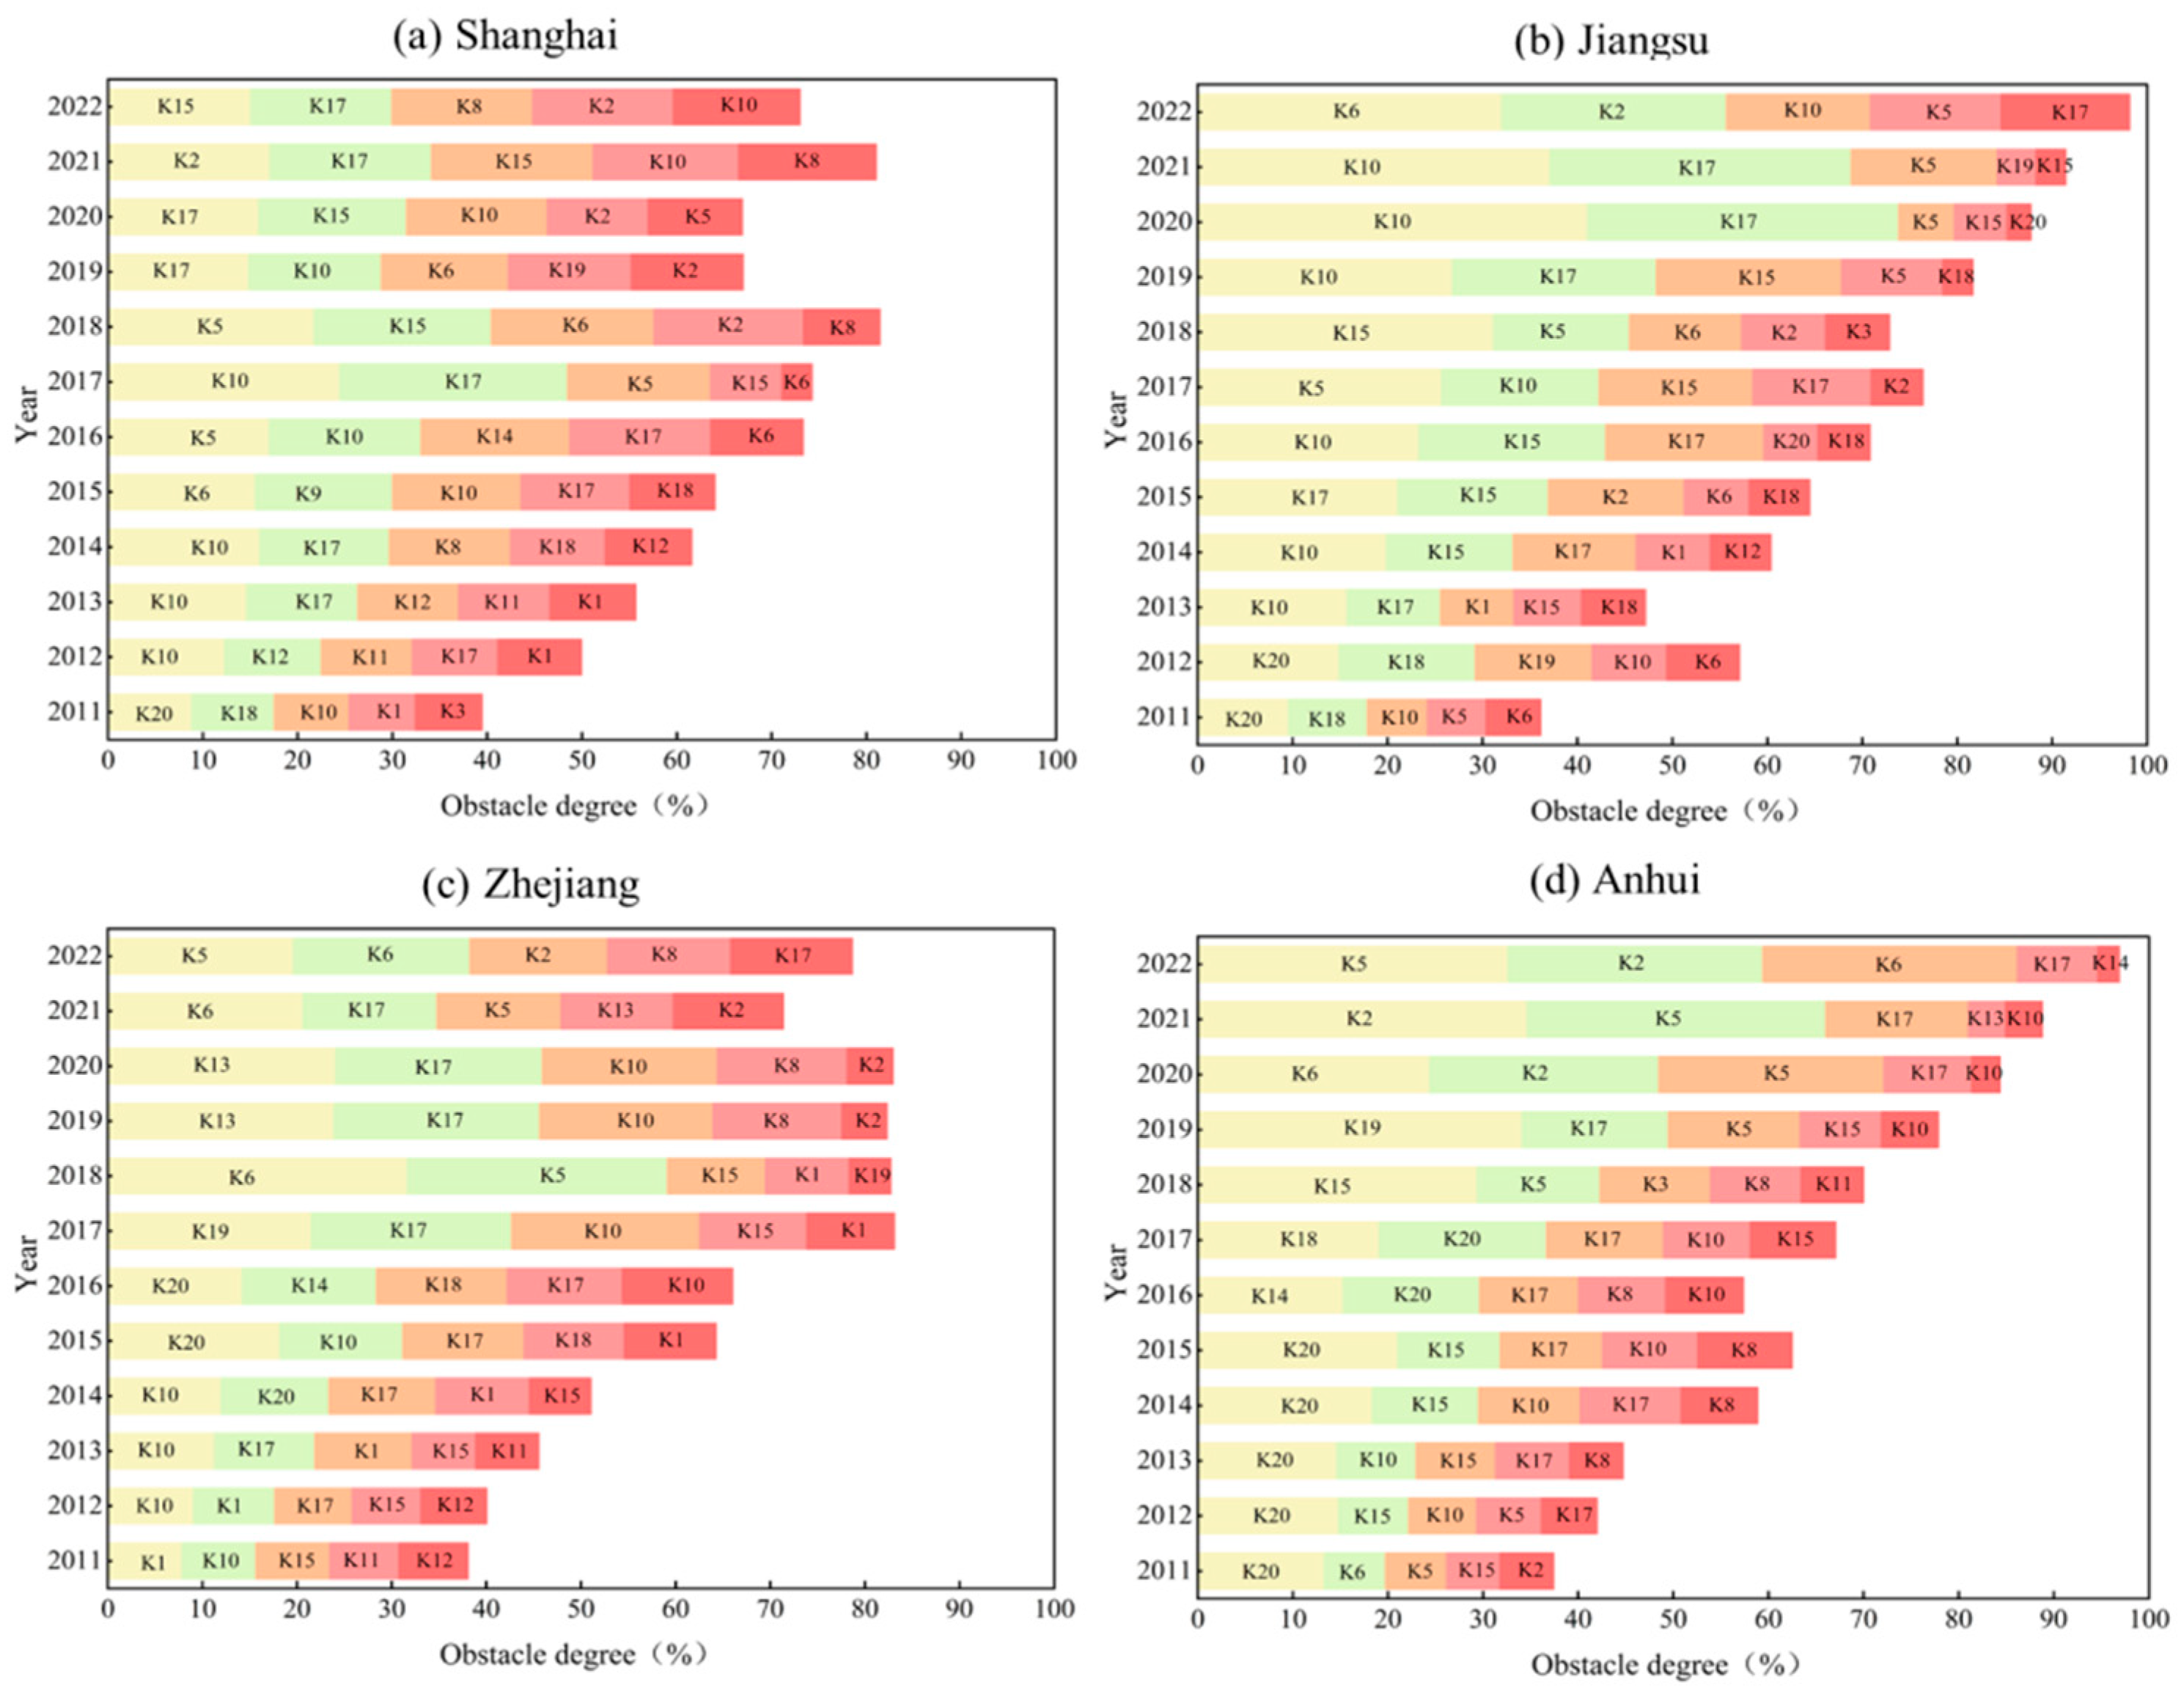
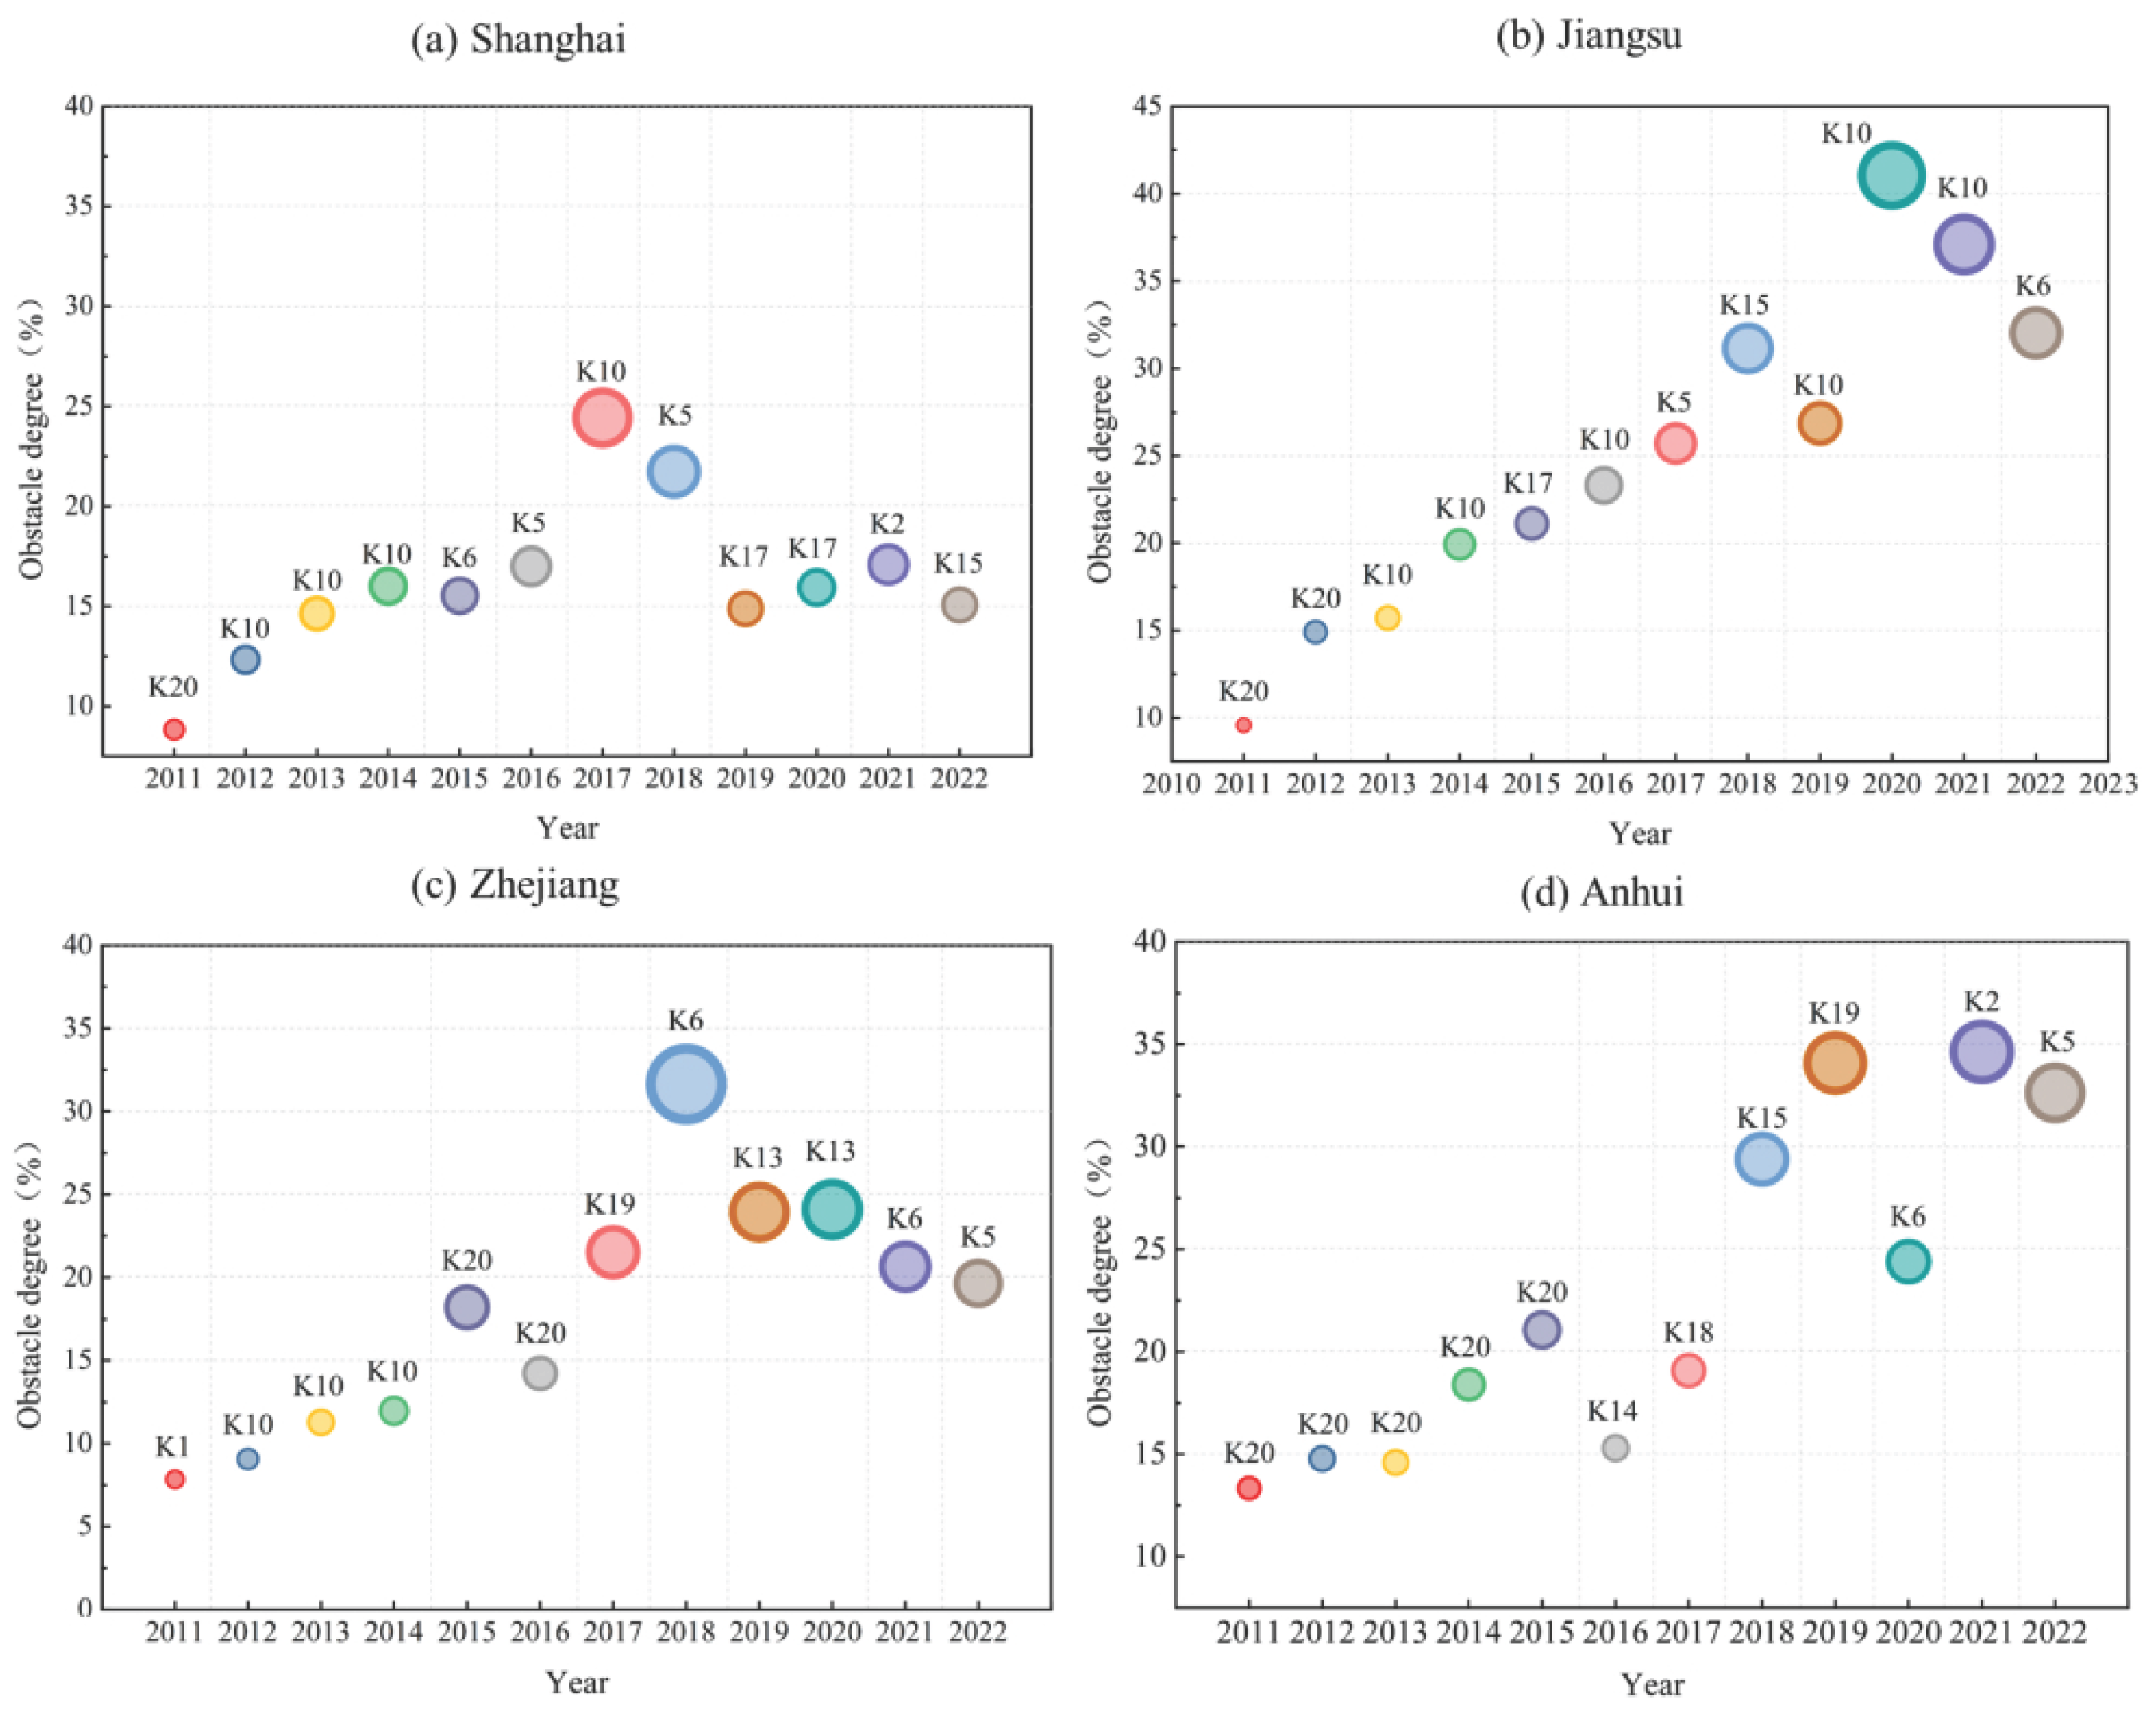
3.3. Analysis of Obstacle Factors in the Low-Carbon Development of the Construction Industry

Based on the diagnostic model analysis of constraint factors (Figure 8), the cumulative constraint degree of the top five constraint factors affecting the low-carbon development of the construction industry in the YRD region from 2011 to 2022 all exceeded 50%, significantly impacting the industry’s transformation process. Among these, the phenomenon of homogeneity in the construction industry within the region is prominent (K17, average value 12.280%). The industrial structure similarity coefficients of SH, JS, and ZJ are relatively high, leading to reduced resource allocation efficiency and directly hindering the growth of total construction output value (K10, average value 12.697%) and technological innovation investment (K5, average value 8.713%). Additionally, the region’s insufficient capacity to absorb industrial transfers has exacerbated imbalances in regional development. Currently, the construction industry in the YRD is concentrated in low-value-added segments of the supply chain, and the absorption of high-energy-consuming and high-polluting projects poses challenges to long-term low-carbon goals. The pressure on carbon dioxide emissions (K19, average value 3.339%) and energy intensity (K20, average value 5.605%) indicators is significant, particularly in provinces such as ZJ and AH, directly affecting the scale and efficiency of industry development. Therefore, optimizing the regional industrial division system and enhancing the capacity to accommodate high-value-added industries are key pathways to breaking through the bottlenecks in the construction industry’s low-carbon development.
In addition, the low-carbon development of the construction industry in the YRD region exhibits significant regional differences (Figure 9). In JS and AH, the average obstacle rate for the number of construction companies (K15) reached 11.825% and 8.258%, respectively. Following the contraction of construction market demand after 2019, operational pressures on enterprises intensified, leading to a slowdown in the growth rate of technological innovation investments. SH and ZJ have relatively high power equipment rates (K6) with average obstacle rates of 8.549% and 7.262%, respectively. This reflects the region’s continued reliance on fixed-asset investment for economic growth, as well as the lack of close integration between the construction industry’s innovation chain and industrial chain [39]. The low rate of industrialization and commercialization of research outcomes has become a key factor constraining technological upgrading.

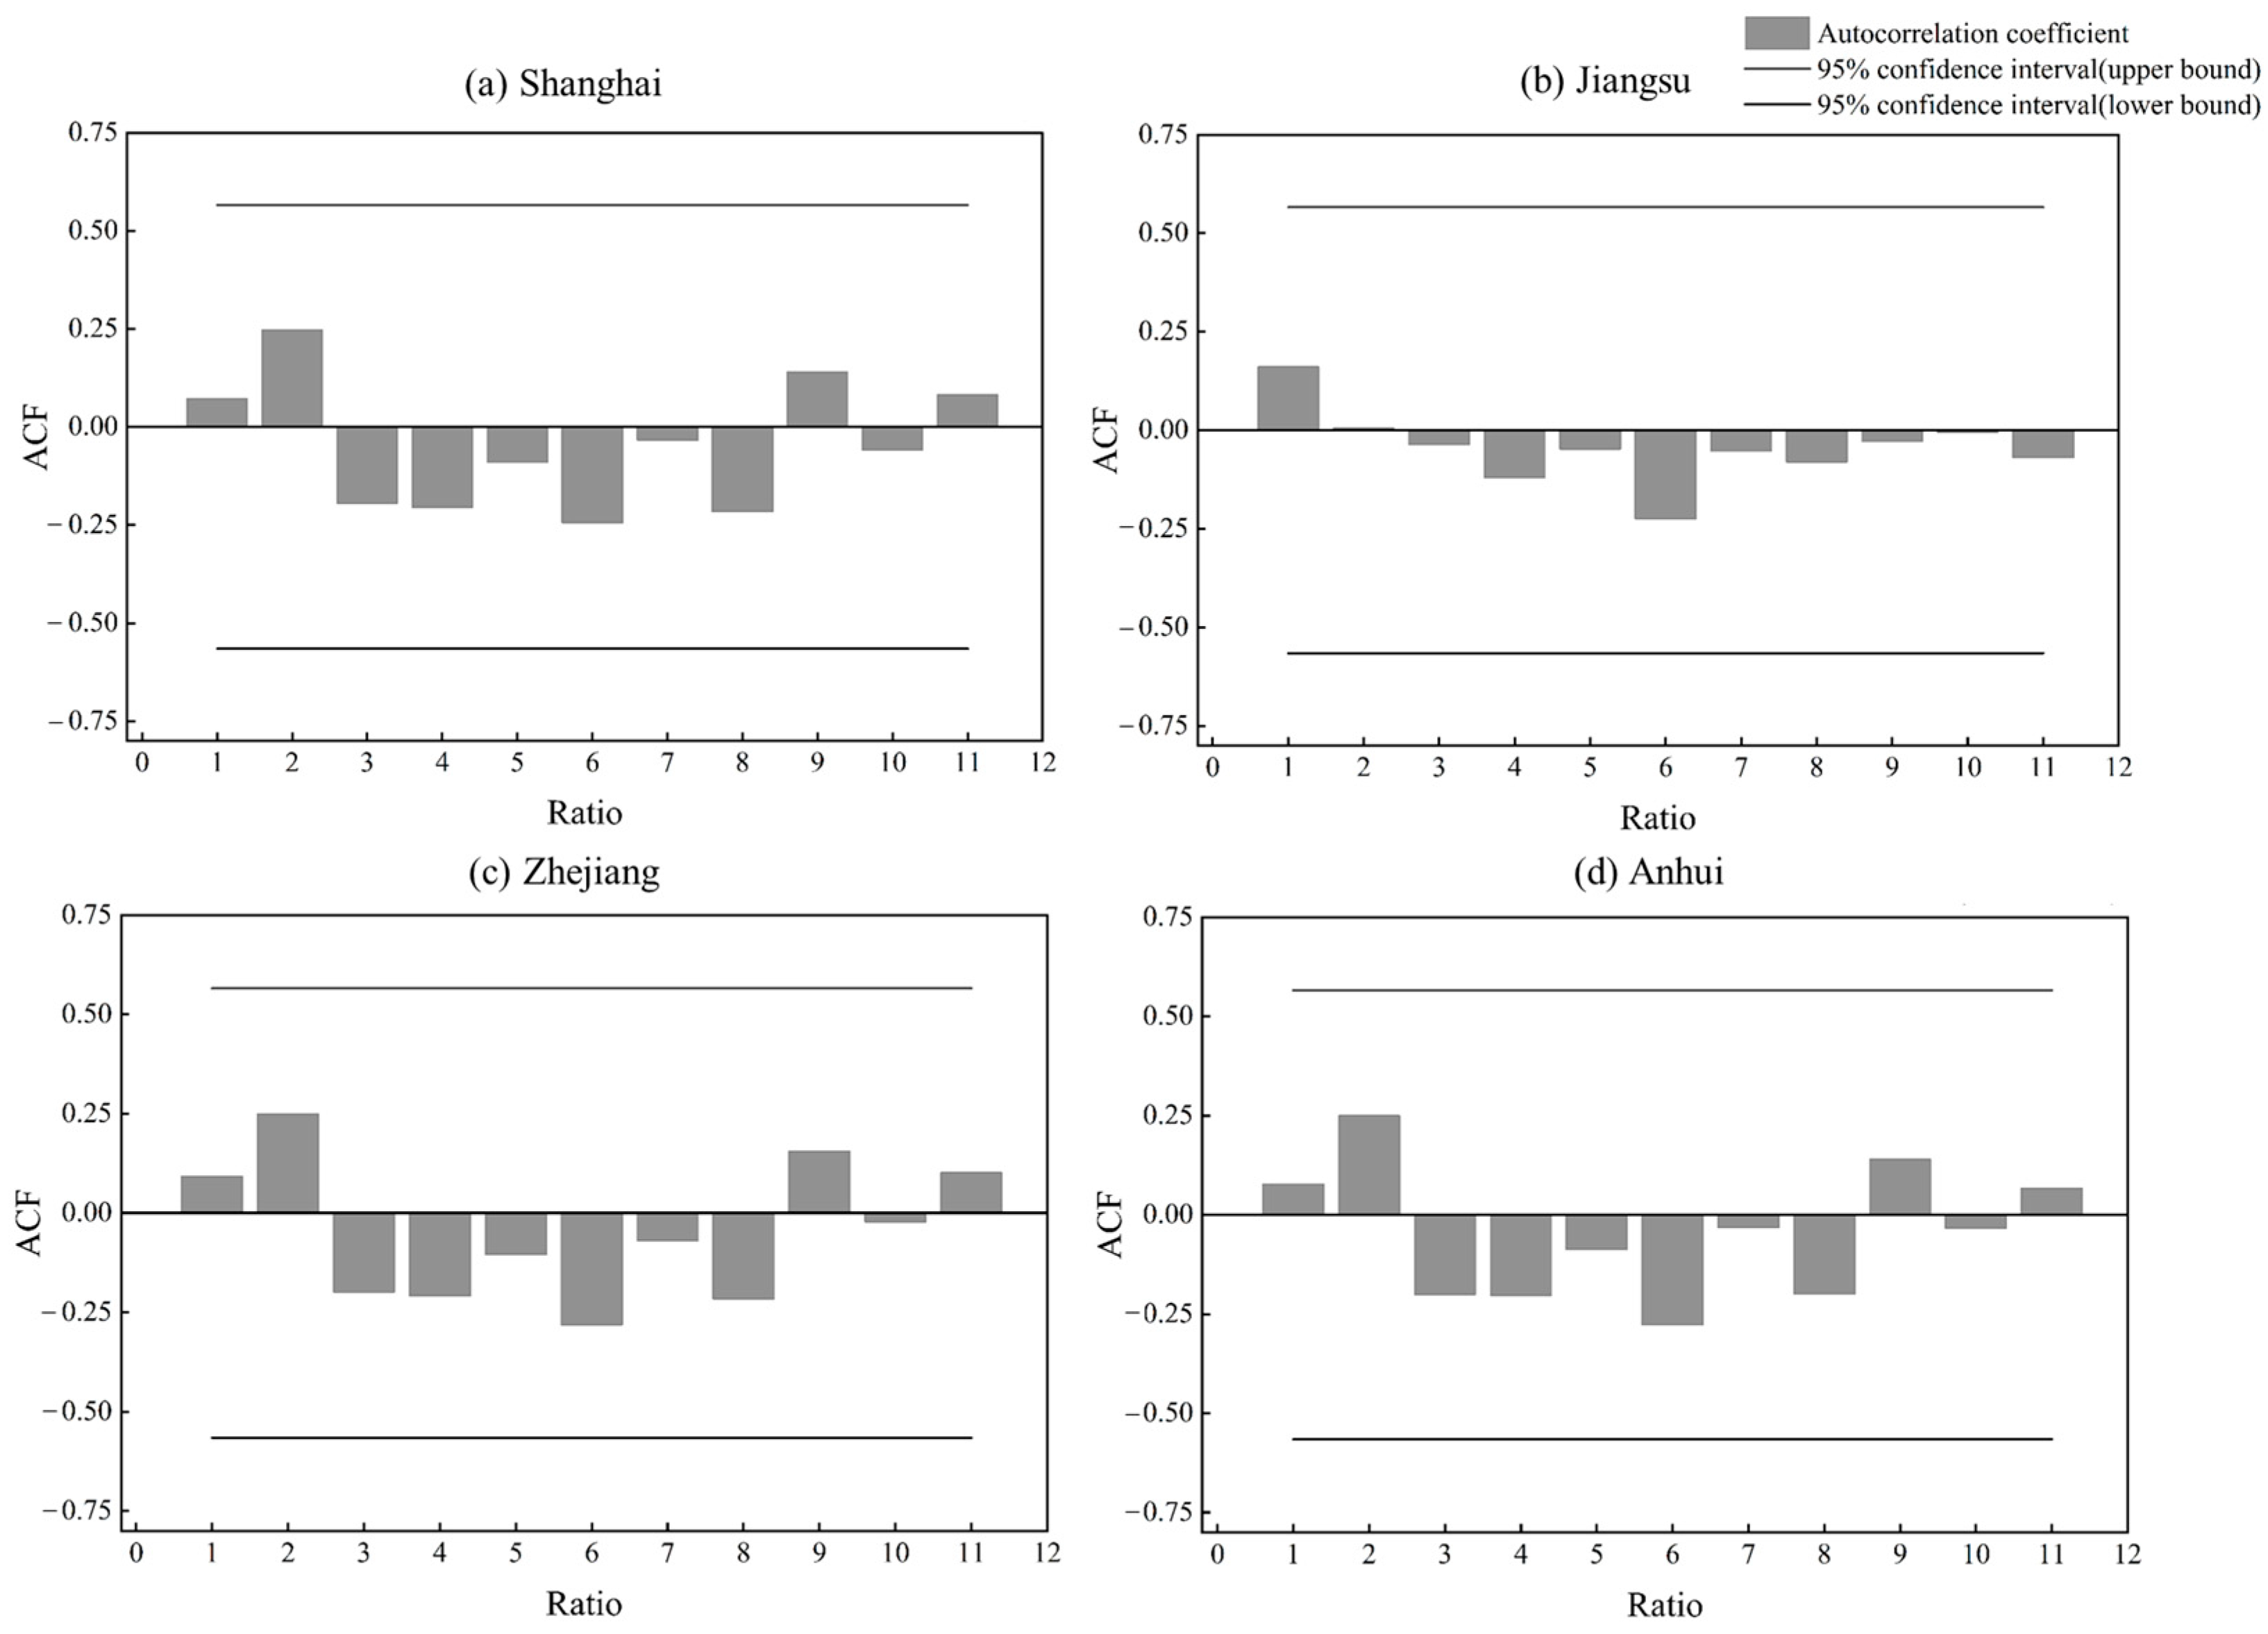
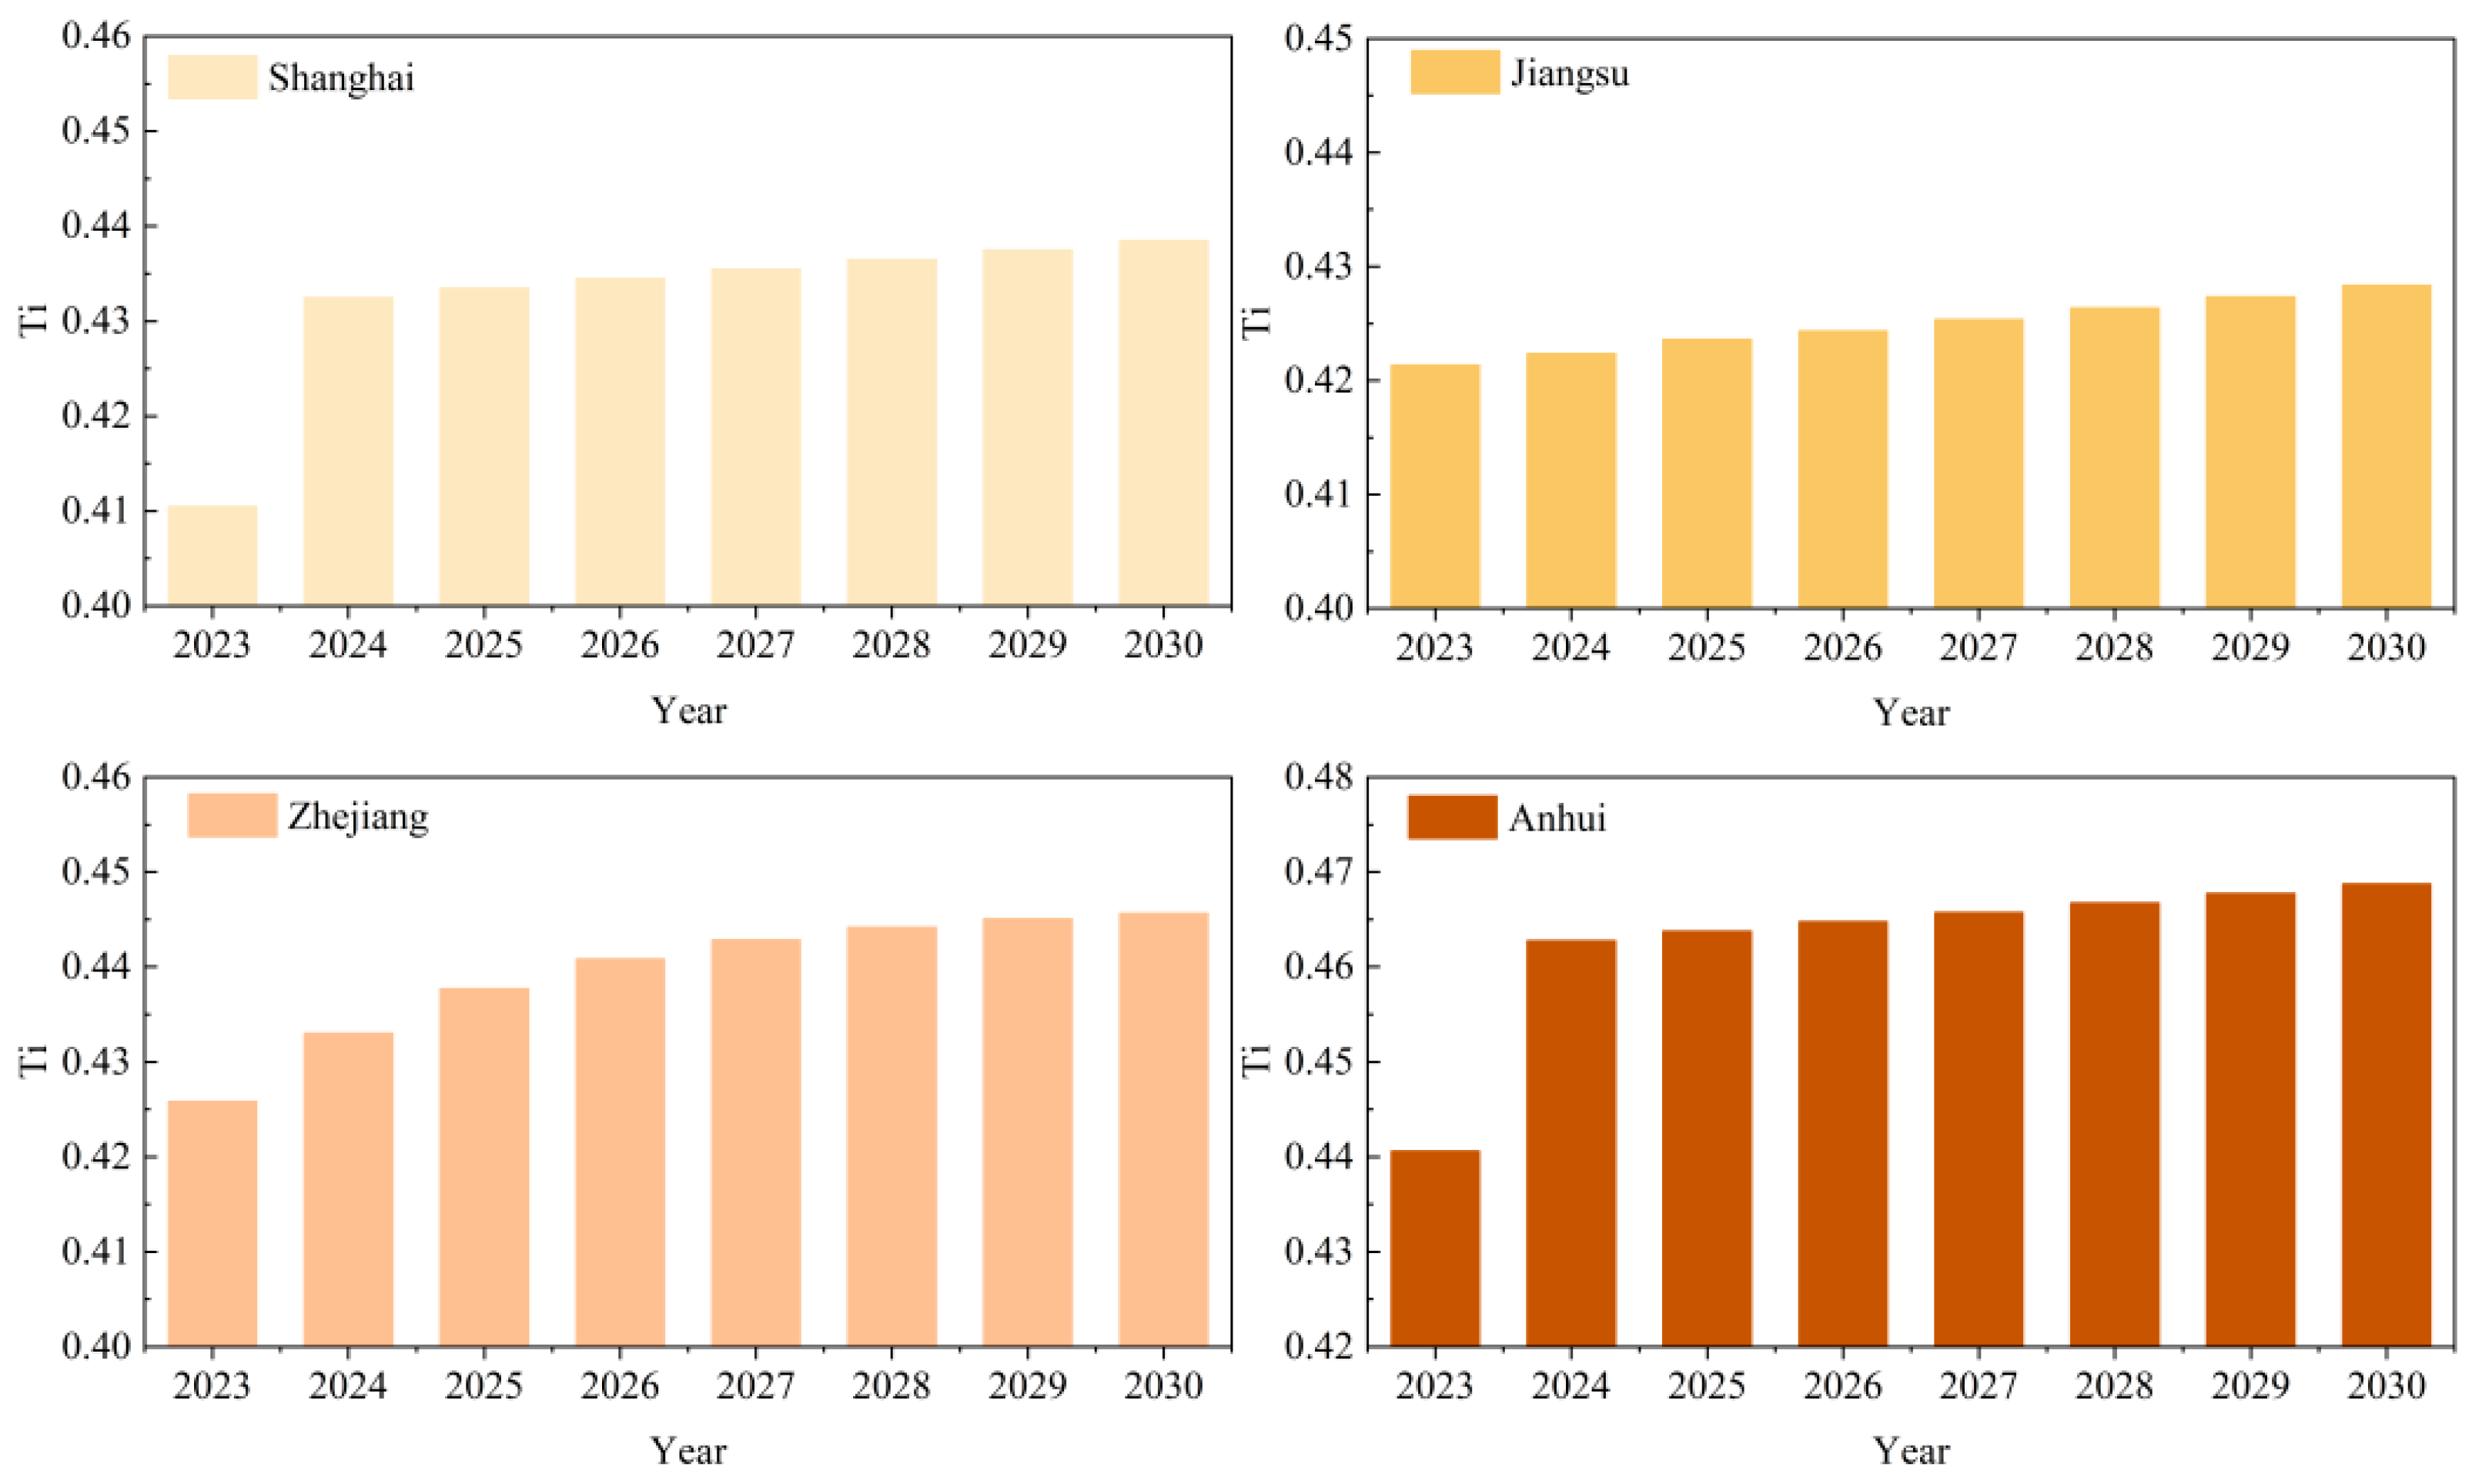
3.4. Trend Forecasting of Low-Carbon Evaluation Drivers in the Construction Industry

This study is based on a low-carbon development evaluation system for the construction industry in the YRD region and used the ARIMA model for time series analysis. First, the original non-stationary series was transformed into a stationary series through differencing operations, effectively extracting the time series characteristics. The ACF plot (Figure 10) shows that the autocorrelation coefficients of the residual series all fall within the 95% confidence interval, indicating that the residuals conform to white noise characteristics, thereby validating the rationality of the model settings [40]. From the model evaluation indicators, the AIC and BIC values for the four regions remain small and stable (Table 5), with an average R2 of 0.8 across all regions, indicating that the model has good explanatory power overall.
As shown in Figure 11, although there are differences in the evaluation results of low-carbon development in the construction industry across the four regions in the future, the overall trend remains stable and upward. Among them, SH saw the most significant increase, with a growth rate of 6.824%, followed by AH Province with a growth rate of 6.389%, while JS Province had the lowest growth rate at 1.661%, indicating a slow but steady growth trend. If estimated using the upper limit of the 95% confidence interval, AH Province’s evaluation results in 2030 may reach the highest value in the region (with a 5% probability of non-confidence), indirectly reflecting the potential of its low-carbon development structure. Since the comprehensive evaluation scores of all four regions are below 0.5, this indicates that the current low-carbon development of the construction industry in the YRD region remains at an intermediate level, and the existing standard system and development model urgently need optimization and improvement. It is necessary to accelerate the establishment of a low-carbon evaluation standard system, taking SH’s “market-oriented, dynamically updated” development principle as a model [41], and focus on promoting benchmark projects such as prefabricated affordable housing and ultra-low energy consumption buildings. To address the 20% unexplained error in the model, increased investment in green and low-carbon technology R&D is needed to overcome technical bottlenecks in emissions reduction during building material production and construction. By deepening regional coordination mechanisms in the YRD, efforts should be made to promote low-carbon transformation across the entire construction industry chain, thereby achieving regional integrated development.

4. Conclusions

This study utilized panel data from the YRD region in the period from 2011 to 2022 to develop a comprehensive evaluation method using the CRITIC-TOPSIS model. Based on the development of the regional construction industry, a comprehensive evaluation index system was established encompassing five dimensions: technology, society, economy, industry, and energy. The barrier factor diagnostic model identified key constraints limiting low-carbon development within the construction sector, while the ARIMA model forecasted trends in low-carbon development evaluations. This study assessed the current status and future trajectories of low-carbon initiatives in the construction industry, yielding the following key findings:
Carbon emissions in the four studied regions generally exhibited an initial increase, followed by a decrease. Zhejiang Province recorded the highest average carbon emissions, amounting to 416.3759 million tons. Indirect carbon emissions accounted for over 90% of the total, primarily driven by the use of building materials such as cement and steel.
The comprehensive evaluation results indicated a fluctuating and declining trend in low-carbon development across the four regions. Two key phases were identified in the development of the regional construction industry. The first phase (2011–2014) was characterized by accelerated urbanization, which created substantial opportunities for industry growth. The second phase (2014–2022) marked a transition, during which the promotion of green building initiatives, stricter building energy efficiency requirements, and adjustments to the industrial structure collectively advanced the YRD region’s low-carbon transformation. During this period, the national focus on the low-carbon transformation of the construction industry led to a fluctuating trend in all regions.
The key obstacles limiting low-carbon development in the YRD region include the technical equipment rate, industrial scale, industrial structure, and energy intensity. Although these factors currently hinder low-carbon progress, they also serve as significant long-term drivers for advancing the sustainable low-carbon transformation.
The results of the prediction model indicate that, despite some fluctuations in low-carbon development evaluation outcomes, the overall trend reflects steady growth. The projections show that Anhui Province is expected to lead the four regions in low-carbon development within the construction industry by 2030. Although the current comprehensive evaluation results for the YRD region place it at a moderate level, there remains substantial potential for further advancement.
Due to limitations in the feasibility of obtaining regional data, this study did not include low-carbon technologies related to the construction industry as evaluation indicators in the evaluation indicator system. However, in terms of indicator selection, alternative indicators such as technical equipment rates and R&D investment were introduced to indirectly reflect the effects of technological innovation, which may help to address some data gaps. Nevertheless, future research will still consider incorporating low-carbon technologies as a key focus in evaluating the low-carbon development of the construction industry. Due to data quality limitations, there is room for improvement of the current prediction accuracy. Future research could incorporate multi-dimensional influencing factors to enhance the simulation accuracy of regional construction industry low-carbon development trends. Finally, in terms of method application, while the analytical methods used in this study are generally applicable, adjustments and optimizations should be made when applying them across regions to ensure that the research methods precisely align with the actual needs of low-carbon development in the construction industry across different regions.

5. Policy Recommendations

The following recommendations are made based on the above conclusions. First, optimize the industrial structure and resource allocation. Given the large scale of the construction industry in provinces such as Jiangsu and Zhejiang, it is necessary to further optimize the industrial structure and promote the transformation of the construction industry from scale expansion to quality and efficiency-oriented development. For example, Jiangsu can leverage its industrial foundation advantages to increase support for high-value-added, low-carbon construction projects, guiding resources from traditional high-energy-consuming sectors toward low-carbon emerging fields to reduce the proportion of indirect carbon emissions. Second, strengthen technological innovation and application promotion. Given that the rate of technological equipment adoption is a key constraint, the YRD region should leverage its abundant scientific and technological resources. For instance, it could establish a low-carbon technology R&D platform for the construction industry by leveraging the concentration of universities and research institutions, accelerating the development of new low-carbon building materials. Third, policy guidance and standard improvement. Anhui Province can develop stricter and more detailed local low-carbon building standards based on its unique construction industry characteristics, clearly stipulating energy consumption indicators and the proportion of green materials used in new buildings. By formulating cross-regional policies for low-carbon development in the construction industry, it can guide enterprises to increase investments in low-carbon technology R&D and industrial structure adjustments.

Author Contributions

Conceptualization, M.L.; methodology, Y.Z. and G.Y.; software, Y.Z.; validation, J.S.; investigation, J.L. and Y.W.; resources, Y.Z.; data curation, M.L.; writing—original draft preparation, Y.Z.; writing—review and editing, M.L. and Y.Z.; supervision, Y.Y. All authors have read and agreed to the published version of the manuscript.

Funding

This research was supported by the Open Fund of Sichuan Province Cyclic Economy Research Center (No. XHJJ-2310), Science and Technology Research and Development Program Project of China railway group limited (No. CRA 2022-Major-01 and 2023-Major-06).

Institutional Review Board Statement

Not applicable.

Informed Consent Statement

Not applicable.

Data Availability Statement

The related data applied in this research are from the China Statistical Yearbook, China Energy Statistical Yearbook, and China Building Statistical Yearbook on the China National Knowledge Infrastructure (CNKI) platform (https://www.cnki.net/), and the neighborhood interpolation method was used to fill in some of the missing data.

Conflicts of Interest

Author Min Li, Yue Zhang, Gui Yu, Jiazhen Sun, Jie Liu, Yinsheng Wang were employed by the company China Railway Academy Group Co., Ltd. The remaining authors declare that the research was conducted in the absence of any commercial or financial relationships that could be construed as a potential conflict of interest.

References

  1. Lyu, L.; Fang, L. A study on EC translation of BP statistical review of world energy 2022 from the perspective of schema theory. J. Linguist. Commun. Stud. 2023, 2, 10–14. [Google Scholar] [CrossRef]
  2. Sun, G.; Liu, Y.; Li, B.; Guo, L. Road to sustainable development of China: The pursuit of coordinated development between carbon emissions and the green economy. J. Clean. Prod. 2024, 434, 139833. [Google Scholar] [CrossRef]
  3. Liu, J.B.; Yuan, X.Y.; Lee, C.C. Prediction of carbon emissions in China’s construction industry using an improved grey prediction model. Sci. Total Environ. 2024, 938, 173351. [Google Scholar] [CrossRef]
  4. Song, M.; Wang, Y.; Wang, C.; Musakwa, W.; Ji, Y. Spatial and Temporal Characteristics of Carbon Emissions from Construction Industry in China from 2010 to 2019. Sustainability 2024, 16, 5927. [Google Scholar] [CrossRef]
  5. Liu, Y.; Gan, L.; Cai, W.; Li, R. Decomposition and decoupling analysis of carbon emissions in China’s construction industry using the generalized Divisia index method. Environ. Impact Assess. Rev. 2024, 104, 107321. [Google Scholar] [CrossRef]
  6. He, J.; Qiao, L. Low Carbon Innovation: The Construction of Green Patent Pools in Guangdong-Hong Kong-Macao Greater Bay Area. IOP Conf. Ser. Earth Environ. Sci. 2020, 529, 012015. [Google Scholar] [CrossRef]
  7. Chen, L.; Huang, L.; Hua, J.; Chen, Z.; Wei, L.; Osman, A.I.; Yap, P.S. Green construction for low-carbon cities: A review. Environ. Chem. Lett. 2023, 21, 1627–1657. [Google Scholar] [CrossRef]
  8. Wang, W.Z.; Shang, X.Y.; Guo, J.; Skibniewski, M.J.; Chen, Z.S. Unveiling the impact of digital transformation on carbon emissions: Evidence from China’s construction enterprises. Enterp. Inf. Syst. 2024, 18, 2437660. [Google Scholar] [CrossRef]
  9. Wang, L.; Chen, L.; Gao, P.; Li, C. Construction and Application of Carbon Performance Evaluation Index System for Chinese Industrial Enterprises From the Perspective of Low-Carbon Transition. J. Int. Dev. 2025, 37, 736–757. [Google Scholar] [CrossRef]
  10. Wei, H.; Jiao, Y.; Wang, Z.; Wang, W.; Zhang, T. Optimal retrofitting scenarios of multi-objective energy-efficient historic building under different national goals integrating energy simulation, reduced order modelling and NSGA-II algorithm. Build. Simul. 2024, 17, 933–954. [Google Scholar] [CrossRef]
  11. Oke, A.E.; Oyediran, A.O.; Koriko, G.; Tang, L.M. Carbon trading practices adoption for sustainable construction: A study of the barriers in a developing country. Sustain. Dev. 2024, 32, 1120–1136. [Google Scholar] [CrossRef]
  12. Shen, Z.; Min, H.; Wang, L.; Zhang, Y. Evaluation of Carbon Neutrality Capacity of Regional Construction Industry Based on the Entropy Weight TOPSIS Model. Buildings 2024, 14, 2363. [Google Scholar] [CrossRef]
  13. Kong, X.; Feng, Z. Evaluation Study on the Level of High-Quality Development of the Construction Industry in Henan Province of China. Open J. Appl. Sci. 2023, 13, 366–382. [Google Scholar] [CrossRef]
  14. Naik, M.G.; Kishore, R.; Dehmourdi, S.A.M. Modeling a multi-criteria decision support system for prequalification assessment of construction contractors using CRITIC and EDAS models. Oper. Res. Eng. Sci. Theory Appl. 2021, 4, 79–101. [Google Scholar] [CrossRef]
  15. Lederer, L.; Ellingerová, H.; Ďubek, S.; Bočkaj, J.; Ďubek, M. Construction Price Forecasting Models in the Construction Industry: A Comparative Analysis. Buildings 2024, 14, 1325. [Google Scholar] [CrossRef]
  16. Pourrahimian, E.; Al Hattab, M.; Khalife, S.; ElMenshawy, M.; AbouRizk, S. Using Simulation-Based Forecasting to Project Singapore’s Future Residential Construction Demand and Impacts on Sustainability. In Proceedings of the 2022 Winter Simulation Conference (WSC), Singapore, 11–14 December 2022; pp. 843–854. [Google Scholar]
  17. Yang, J.; Li, G.; Zhong, Z.; Li, Q.; Du, G.; Guo, J. Current situation, bottlenecks, and path options for the development of capital flows and integration in the Yangtze River Delta region. Front. Sustain. Cities 2023, 5, 1100685. [Google Scholar] [CrossRef]
  18. Oh, H.; Yoon, H.; Park, S.; Kim, Y.; Choi, B.; Sun, W.; Jeong, H. Estimation of CO2 storage capacities in saline aquifers using material balance. Fuel 2024, 374, 132411. [Google Scholar] [CrossRef]
  19. Osei-Yeboah, M.; Grabovsky, V.I.; Agam, N.; Gelfand, I. Water and nitrogen availability define emissions of carbon dioxide and nitrogen oxides from desert soil differently. Soil Biol. Biochem. 2024, 195, 109460. [Google Scholar] [CrossRef]
  20. Zhang, Y.; Zhao, D. A prediction method of regional carbon emission peak based on energy consumption elasticity coefficient. Int. J. Glob. Energy Issues 2024, 46, 678–692. [Google Scholar] [CrossRef]
  21. Cheng, M.; Lu, Y.; Zhu, H.; Xiao, J. Measuring CO2 emissions performance of China’s construction industry: A global Malmquist index analysis. Environ. Impact Assess. Rev. 2022, 92, 106673. [Google Scholar] [CrossRef]
  22. Xian, Y.; Wang, H.; Zhang, Z.; Yang, Y.; Zhong, Y. Driving factors and reduction paths dynamic simulation optimization of carbon dioxide emissions in China’s construction industry under the perspective of dual carbon targets. Environ. Impact Assess. Rev. 2025, 112, 107789. [Google Scholar] [CrossRef]
  23. Paschalidis, I.C.; Li, K.; Estanjini, R.M. An actor-critic method using least squares temporal difference learning. In Proceedings of the 48h IEEE Conference on Decision and Control (CDC) held jointly with 2009 28th Chinese Control Conference, Shanghai, China, 15–18 December 2009; pp. 2564–2569. [Google Scholar]
  24. Fojtíková, L.; Vavrek, R.; Doleželová, P. Road of the least developed countries to sustainable development: Assessing trade participation in the context of the sustainable development goals. Sustain. Dev. 2023, 31, 2492–2506. [Google Scholar] [CrossRef]
  25. Yu, H.; Gao, Y.; Yang, L.; Liu, F.; Gao, X.; Tan, Q. Knowledge reasoning of transmission line component detection using CRITIC and TOPSIS approaches. Soft Comput. 2023, 27, 991–1004. [Google Scholar] [CrossRef]
  26. LLiu, W.; Li, L.; He, X.; Lv, G. Evaluation of soil quality and analysis of barriers of protection forests along Tarim Desert highway based on a minimum data set. Land 2024, 13, 498. [Google Scholar] [CrossRef]
  27. Duran, H.E. The future of regional inequalities: An ARIMA forecast. Lett. Spat. Resour. Sci. 2024, 17, 16. [Google Scholar] [CrossRef]
  28. Kimura, T.; Goto, T.; Shintani, H.; Ishizaka, K.; Arima, T.H.; Tokura, Y. Magnetic control of ferroelectric polarization. Nature 2003, 426, 55–58. [Google Scholar] [CrossRef]
  29. Opoku, A. Construction industry and the sustainable development goals (SDGs). In Research Companion to Construction Economics; Edward Elgar Publishing: Northampton, MA, USA, 2022; pp. 199–214. [Google Scholar]
  30. Miao, H.; Quan, Q.; Yang, M. Study on the Regional Carbon Emissions Reduction Effect of Green Manufacturing—A Policy Experiment Based on the Construction of Green Parks in China. Sustainability 2025, 17, 1527. [Google Scholar] [CrossRef]
  31. Mu, J.; Wang, J.; Liu, B.; Yang, M. Spatiotemporal dynamics and influencing factors of CO2 emissions under regional collaboration: Evidence from the Beijing-Tianjin-Hebei region in China. Environ. Pollut. 2024, 357, 124403. [Google Scholar] [CrossRef]
  32. Li, Z.; Tang, D. Pathways of the Digital Economy’s Impact on Green Total Factor Productivity in the Construction Industry. Sustainability 2024, 16, 11283. [Google Scholar] [CrossRef]
  33. Ni, G.; Fang, Y.; Niu, M.; Lv, L.; Song, C.; Wang, W. Spatial differences, dynamic evolution and influencing factors of China’s construction industry carbon emission efficiency. J. Clean. Prod. 2024, 448, 141593. [Google Scholar] [CrossRef]
  34. Chen, L.; Hu, Y.; Wang, R.; Li, X.; Chen, Z.; Hua, J.; Yap, P.S. Green building practices to integrate renewable energy in the construction sector: A review. Environ. Chem. Lett. 2024, 22, 751–784. [Google Scholar] [CrossRef]
  35. Li, H.; Sun, Y.; Zhang, J.; Liu, D.; Han, Z.; Li, Y. Critical uncertainty analysis of the application of new-generation digital technology in China’s construction industry—A study based on the LDA-DEMATEL-ISM improvement model. Appl. Sci. 2023, 14, 57. [Google Scholar] [CrossRef]
  36. Xue, L.; Li, C.R.; Jin, Y.M. An improved carbon emission calculation framework of precast concrete column in construction stage based on LCA. J. Chin. Inst. Eng. 2023, 46, 220–228. [Google Scholar] [CrossRef]
  37. Li, Q.; Chen, H.; Sharma, S.; Singh, R.; Abbas, M. Optimization countermeasures for high-quality development of green economy driven by environmental regulations, carbon emission reductions, and efficiency enhancements. Stoch. Environ. Res. Risk Assess. 2024, 38, 4169–4191. [Google Scholar] [CrossRef]
  38. Lan, X. Evaluation method for sustainable development of urban carbon ecological cobstruction based on super-efficiency data envelopment analysis (SE-DEA) model. Environ. Eng. Manag. J. (EEMJ) 2024, 23, 2455–2466. [Google Scholar] [CrossRef]
  39. Yang, Z.; Zhang, B.; Yang, Y.; Qin, B.; Wang, Z. Interprovincial inequality between economic benefit and carbon footprint: Perspective from China’s Construction industry. Environ. Impact Assess. Rev. 2024, 104, 107293. [Google Scholar] [CrossRef]
  40. Dong, H.; Liu, S.; Pang, L.; Liu, D.; Deng, L.; Fang, L.; Zhang, Z. A debris-flow forecasting method with infrasound-based variational mode decomposition and ARIMA. J. Mt. Sci. 2024, 21, 4019–4032. [Google Scholar] [CrossRef]
  41. Zhang, C.; Lian, J.; Min, H.; Li, M. Shanghai as a Model: Research on the Journey of Transportation Electrification and Charging Infrastructure Development. Sustainability 2024, 17, 91. [Google Scholar] [CrossRef]
Figure 1. The basic process of the evaluation of low-carbon development in the construction industry and the forecasting of trends.
Sustainability 17 05435 g001
Figure 2. Location of the study region.
Sustainability 17 05435 g002
Figure 3. Trends in carbon emissions from the construction industry in the YRD region (notes: Total Carbon Emissions = TCE; Direct Carbon Emissions = DCE; Indirect Carbon Emissions = ICE).
Sustainability 17 05435 g003
Figure 4. Total carbon emissions (TCE) and indirect carbon emissions composition in the construction industry of the YRD region.
Sustainability 17 05435 g004
Figure 5. Results of weighting values of various indicators for the construction industry in the YRD region.
Sustainability 17 05435 g005
Figure 6. Results of the comprehensive evaluation of low-carbon development of the construction industry in the YRD region.
Sustainability 17 05435 g006
Figure 7. Weight values of construction industry drivers in the YRD region.
Sustainability 17 05435 g007
Figure 8. Barrier factors and their degree of barrier to low-carbon development in the construction industry in the YRD region (top 5).
Sustainability 17 05435 g008
Figure 9. Top barriers to low-carbon development in the construction industry in the YRD region.
Sustainability 17 05435 g009
Figure 10. Model residual autocorrelation plot.
Sustainability 17 05435 g010
Figure 11. Results of the evaluation and forecast of low-carbon development of the construction industry in the YRD region (from 2023 to 2030).
Sustainability 17 05435 g011
Table 1. Standard coal and carbon emission factors for direct carbon-emitting energy categories.
Type of EnergyConversion Factor for Standard Coal (kgce/kg)Carbon Emission Factor (kgCO2/kgce)
Raw coal0.71430.7559
Petrol1.47140.5538
Paraffin1.47140.5714
Diesel oil1.45710.5921
Fuel oil1.42860.6185
Liquefied petroleum gas1.71430.5042
Natural gas1.33000.4483
Electricity0.12290.2900
Table 2. Indirect carbon emissions, carbon emissions from building materials, and recovery factors.
Building MaterialCementGlassSteel Aluminum Wood
Carbon emission factor0.815 kg/kg0.9655 kg/kg1.789 kg/kg2.6 kg/kg−842.8 kg/m3
Recovery factor-0.70.80.850.2
Table 3. Evaluation indicator system for low-carbon development in the construction industry and the characterization of each indicator.
Target LayerFirst IndicatorsSecondary IndicatorsIndicator CharacterizationIndicator PropertiesIndicator
Evaluation of low-carbon development in the construction industryTechnological driverPatents for inventionsMeasuring regional innovation capacity in science and technologyPositiveK1
Total power of construction machinery and equipment owned by the end of the yearMeasuring mechanical construction production capacity in the building industryPositiveK2
Research and Experimental Development (R&D) institution personnelMeasuring the ability to transform regional scientific research resultsPositiveK3
R&D expenditureMeasuring the strength of regional investment in science and technology innovationPositiveK4
Technical equipment rateMeasuring the technological level and productivity of the construction industry in the regionPositiveK5
Power equipment rateMeasuring the ability to provide construction machinery in the construction industryPositiveK6
Social
driver
Year-end resident populationRegional population distributionPositiveK7
Employment in construction enterprisesPeople working in the construction industry in the regionPositiveK8
Urbanization rateRural and urban distribution of the resident population in the regionPositiveK9
Economic driverGross output value of the construction industryRegional economic income capacity of the construction industryPositiveK10
Gross regional productRegional economic situation and development levelPositiveK11
GDP per capitaLiving standard of people in the regionPositiveK12
Industrial driverCompleted floor space of residential buildingsMeasurement of physical output capacity of the construction industryPositiveK13
Industrial scaleMeasures the ratio of gross output value to the number of enterprises in the construction industryPositiveK14
Number of construction enterprisesMeasures the construction industry’s level of development over a period of timePositiveK15
Labor productivity in the construction industryMeasuring the production efficiency of enterprises in the construction industryPositiveK16
Industrial structureMeasuring the ratio of the gross output value of the construction industry to the gross regional productPositiveK17
Energy
driver
Energy consumption in the construction industryRegional energy consumption in the construction sectorNegativeK18
Carbon dioxide emissionsCarbon intensity of an industry in the regionNegativeK19
Energy intensityRatio of energy consumption to economic output in the regional construction industryNegativeK20
Table 4. Weights of the evaluation indicator system for low-carbon development of the construction industry in the YRD region.
Target LayerFirst IndicatorsIndicator Weights Under the SystemSecondary IndicatorsIndicatorCombined Weights
Evaluation of low-carbon development in the construction industryTechnological driver0.0951Patents for inventionsK10.0287
0.2282Total power of construction machinery and equipment owned by the end of the yearK20.0688
0.0831Research and Experimental Development (R&D) institution personnelK30.0251
0.0768R&D expenditureK40.0232
0.2745Technical equipment rateK50.0828
0.2423Power equipment rateK60.0731
Social
driver
0.3047Year-end resident populationK70.0323
0.4269Employment in construction enterprisesK80.0452
0.2684Urbanization rateK90.0284
Economic driver0.5831Gross output value of the construction industryK100.0758
0.2069Gross regional productK110.0269
0.2101GDP per capitaK120.0273
Industrial driver0.1848Completed floor space of residential buildingsK130.0468
0.1764Industrial scaleK140.0447
0.2231Number of construction enterprisesK150.0565
0.1357Labor productivity in the construction industryK160.0344
0.2800Industrial structureK170.0709
Energy
driver
0.3106Energy consumption in the construction industryK180.0650
0.3370Carbon dioxide emissionsK190.0705
0.3524Energy intensityK200.0737
Table 5. Parameters of the four regional prediction models.
RegionInformation GuidelinesGoodness of Fit
AICBICR2
Shanghai−56.800−54.8610.796
Jiangsu−54.728−52.7890.805
Zhejiang−56.903−54.9630.800
Anhui−57.323−55.3830.798
Disclaimer/Publisher’s Note: The statements, opinions and data contained in all publications are solely those of the individual author(s) and contributor(s) and not of MDPI and/or the editor(s). MDPI and/or the editor(s) disclaim responsibility for any injury to people or property resulting from any ideas, methods, instructions or products referred to in the content.

