

Life Cycle Assessment Based on Whole Industry Chain Assessment of FCEVs


Abstract
1. Introduction
- Develop a CEA framework to harmonize multi-scale environmental indicators and systematically evaluate the integrated environmental footprint of products or processes.
- Optimize hydrogen sourcing pathways by analyzing energy efficiency and emission profiles across production methods, with explicit quantification of CCS efficacy in mitigating lifecycle emissions.
- This study evaluates the comprehensive environmental impacts of FCEVs across their entire lifecycle. By employing a Sobol-based sensitivity analysis, the contributions of hydrogen production methods, transportation pathways, and vehicle lifespan to environmental impacts are investigated. This approach identifies key lifecycle stages with the greatest potential for energy conservation and emission reduction.
2. Methodology
2.1. Environmental Indicators
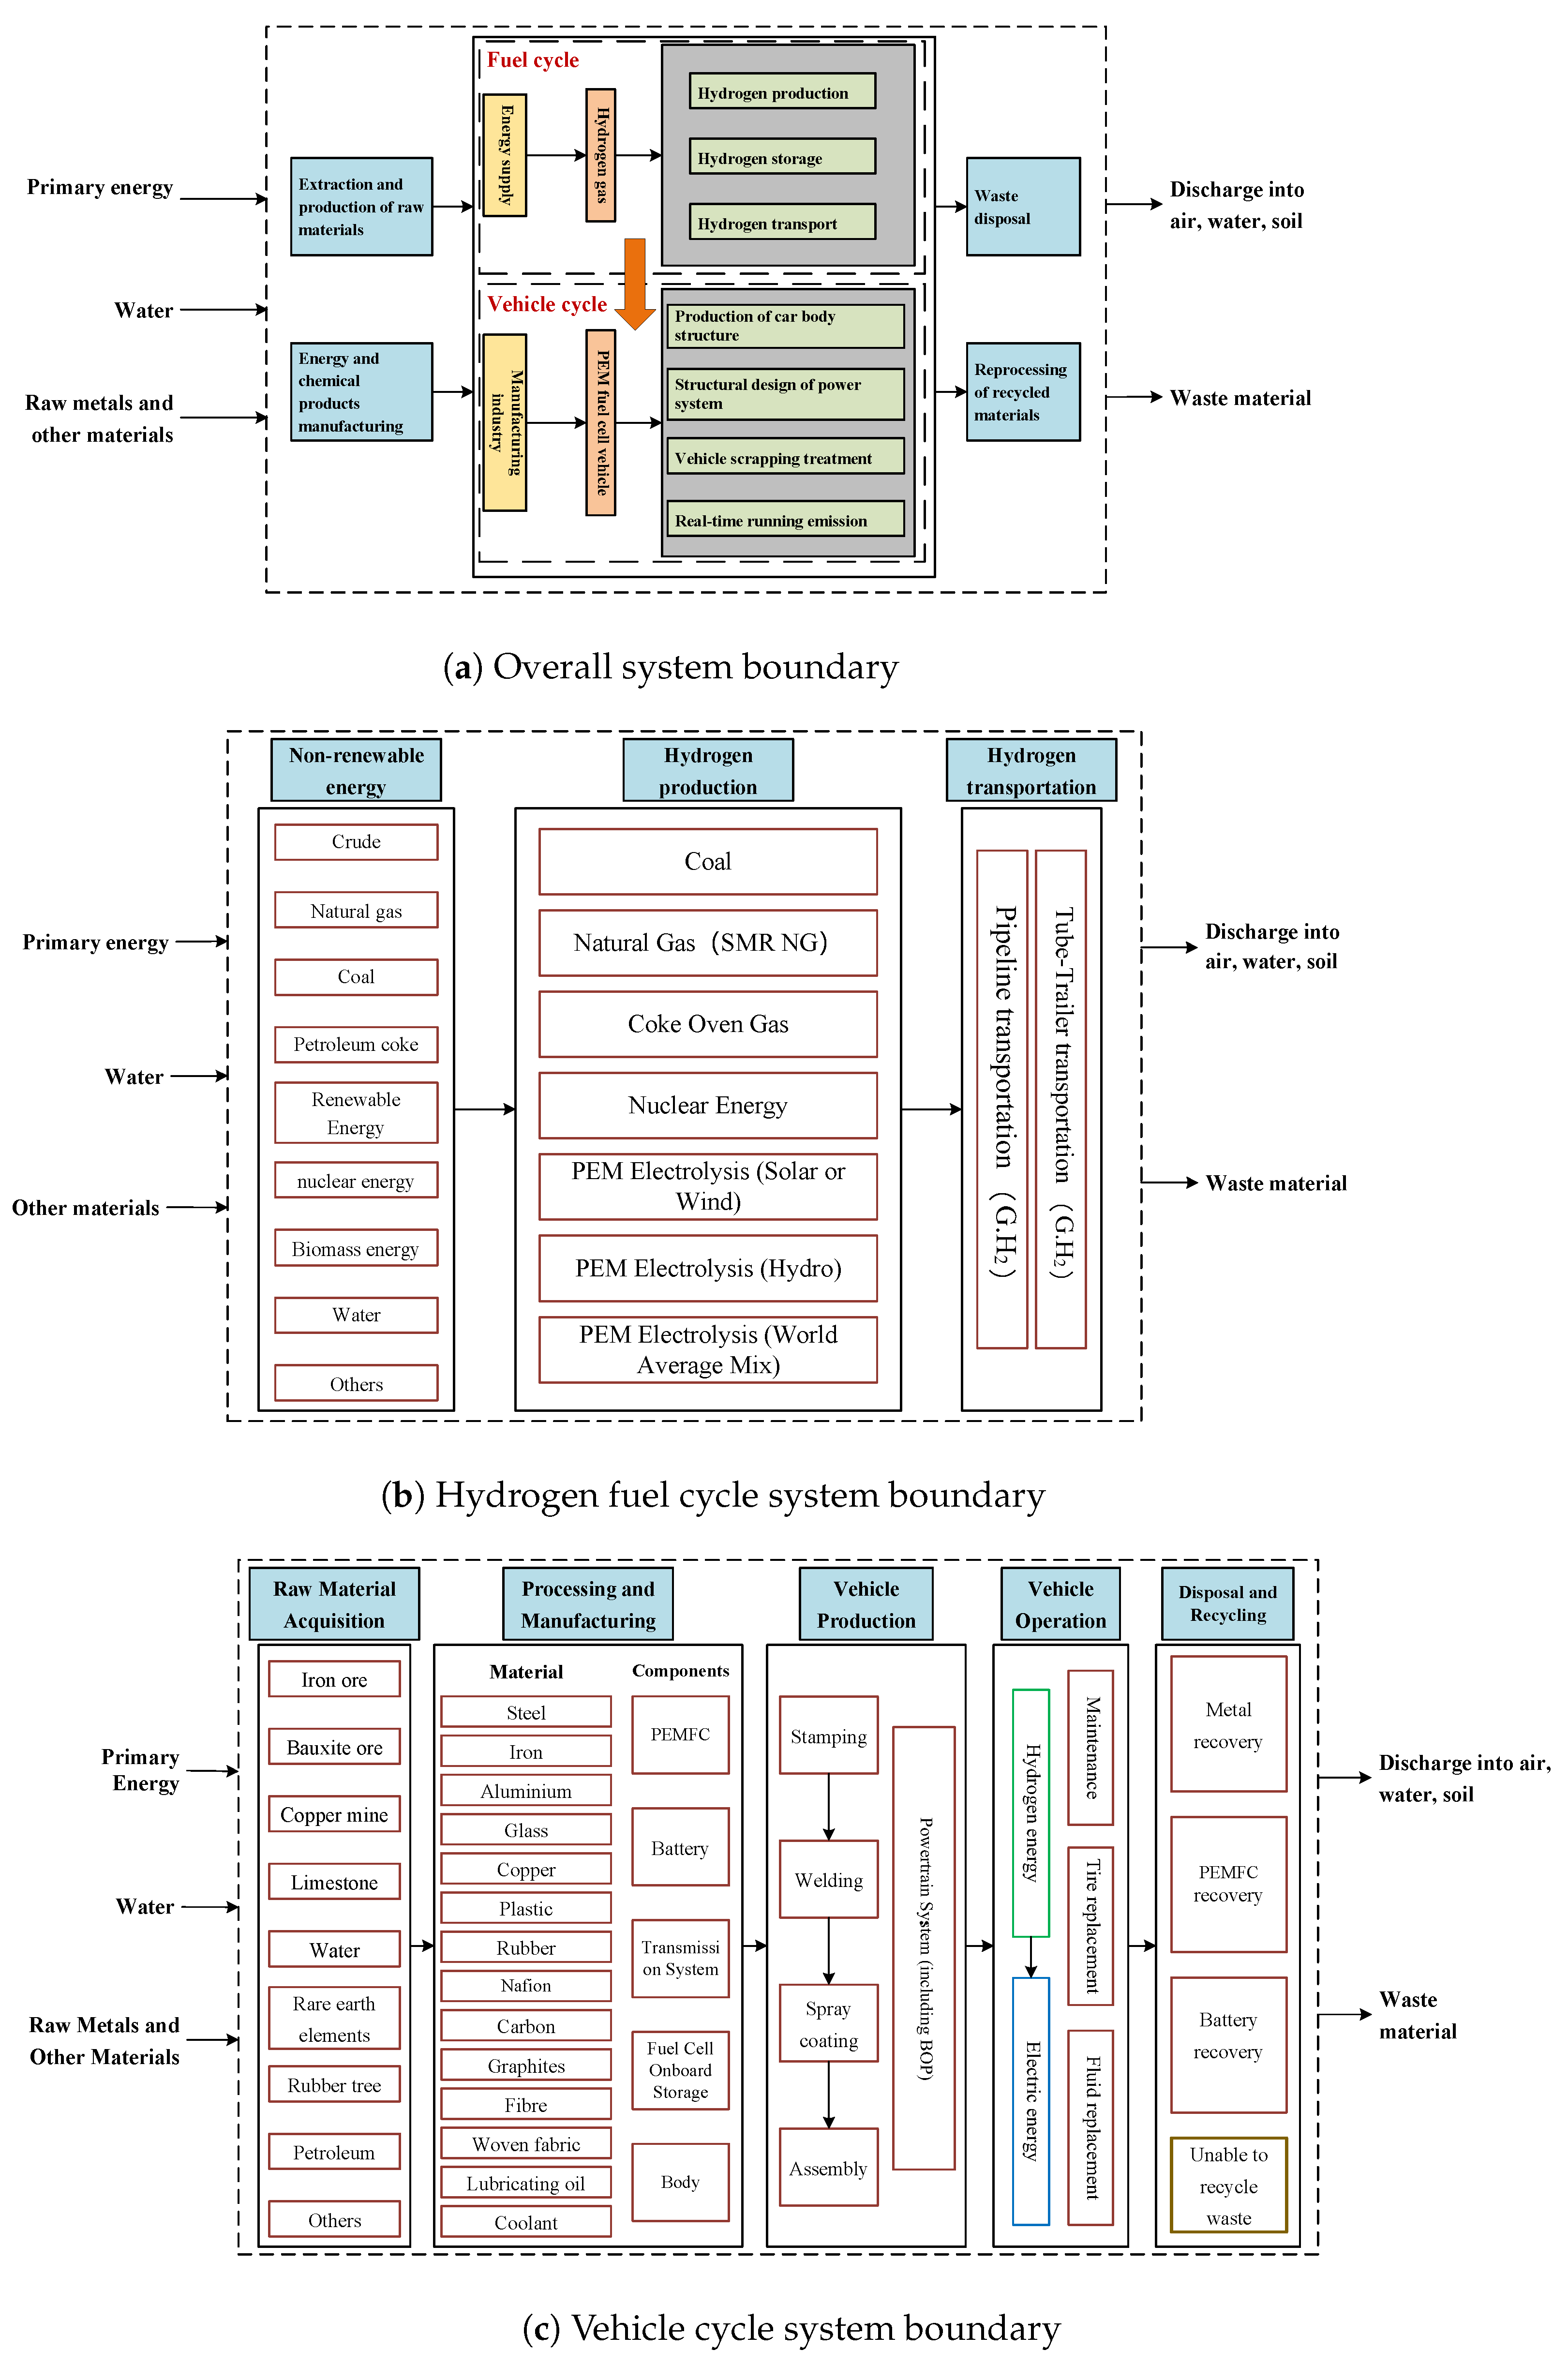
2.2. Life Cycle Assessment
3. Results and Discussion
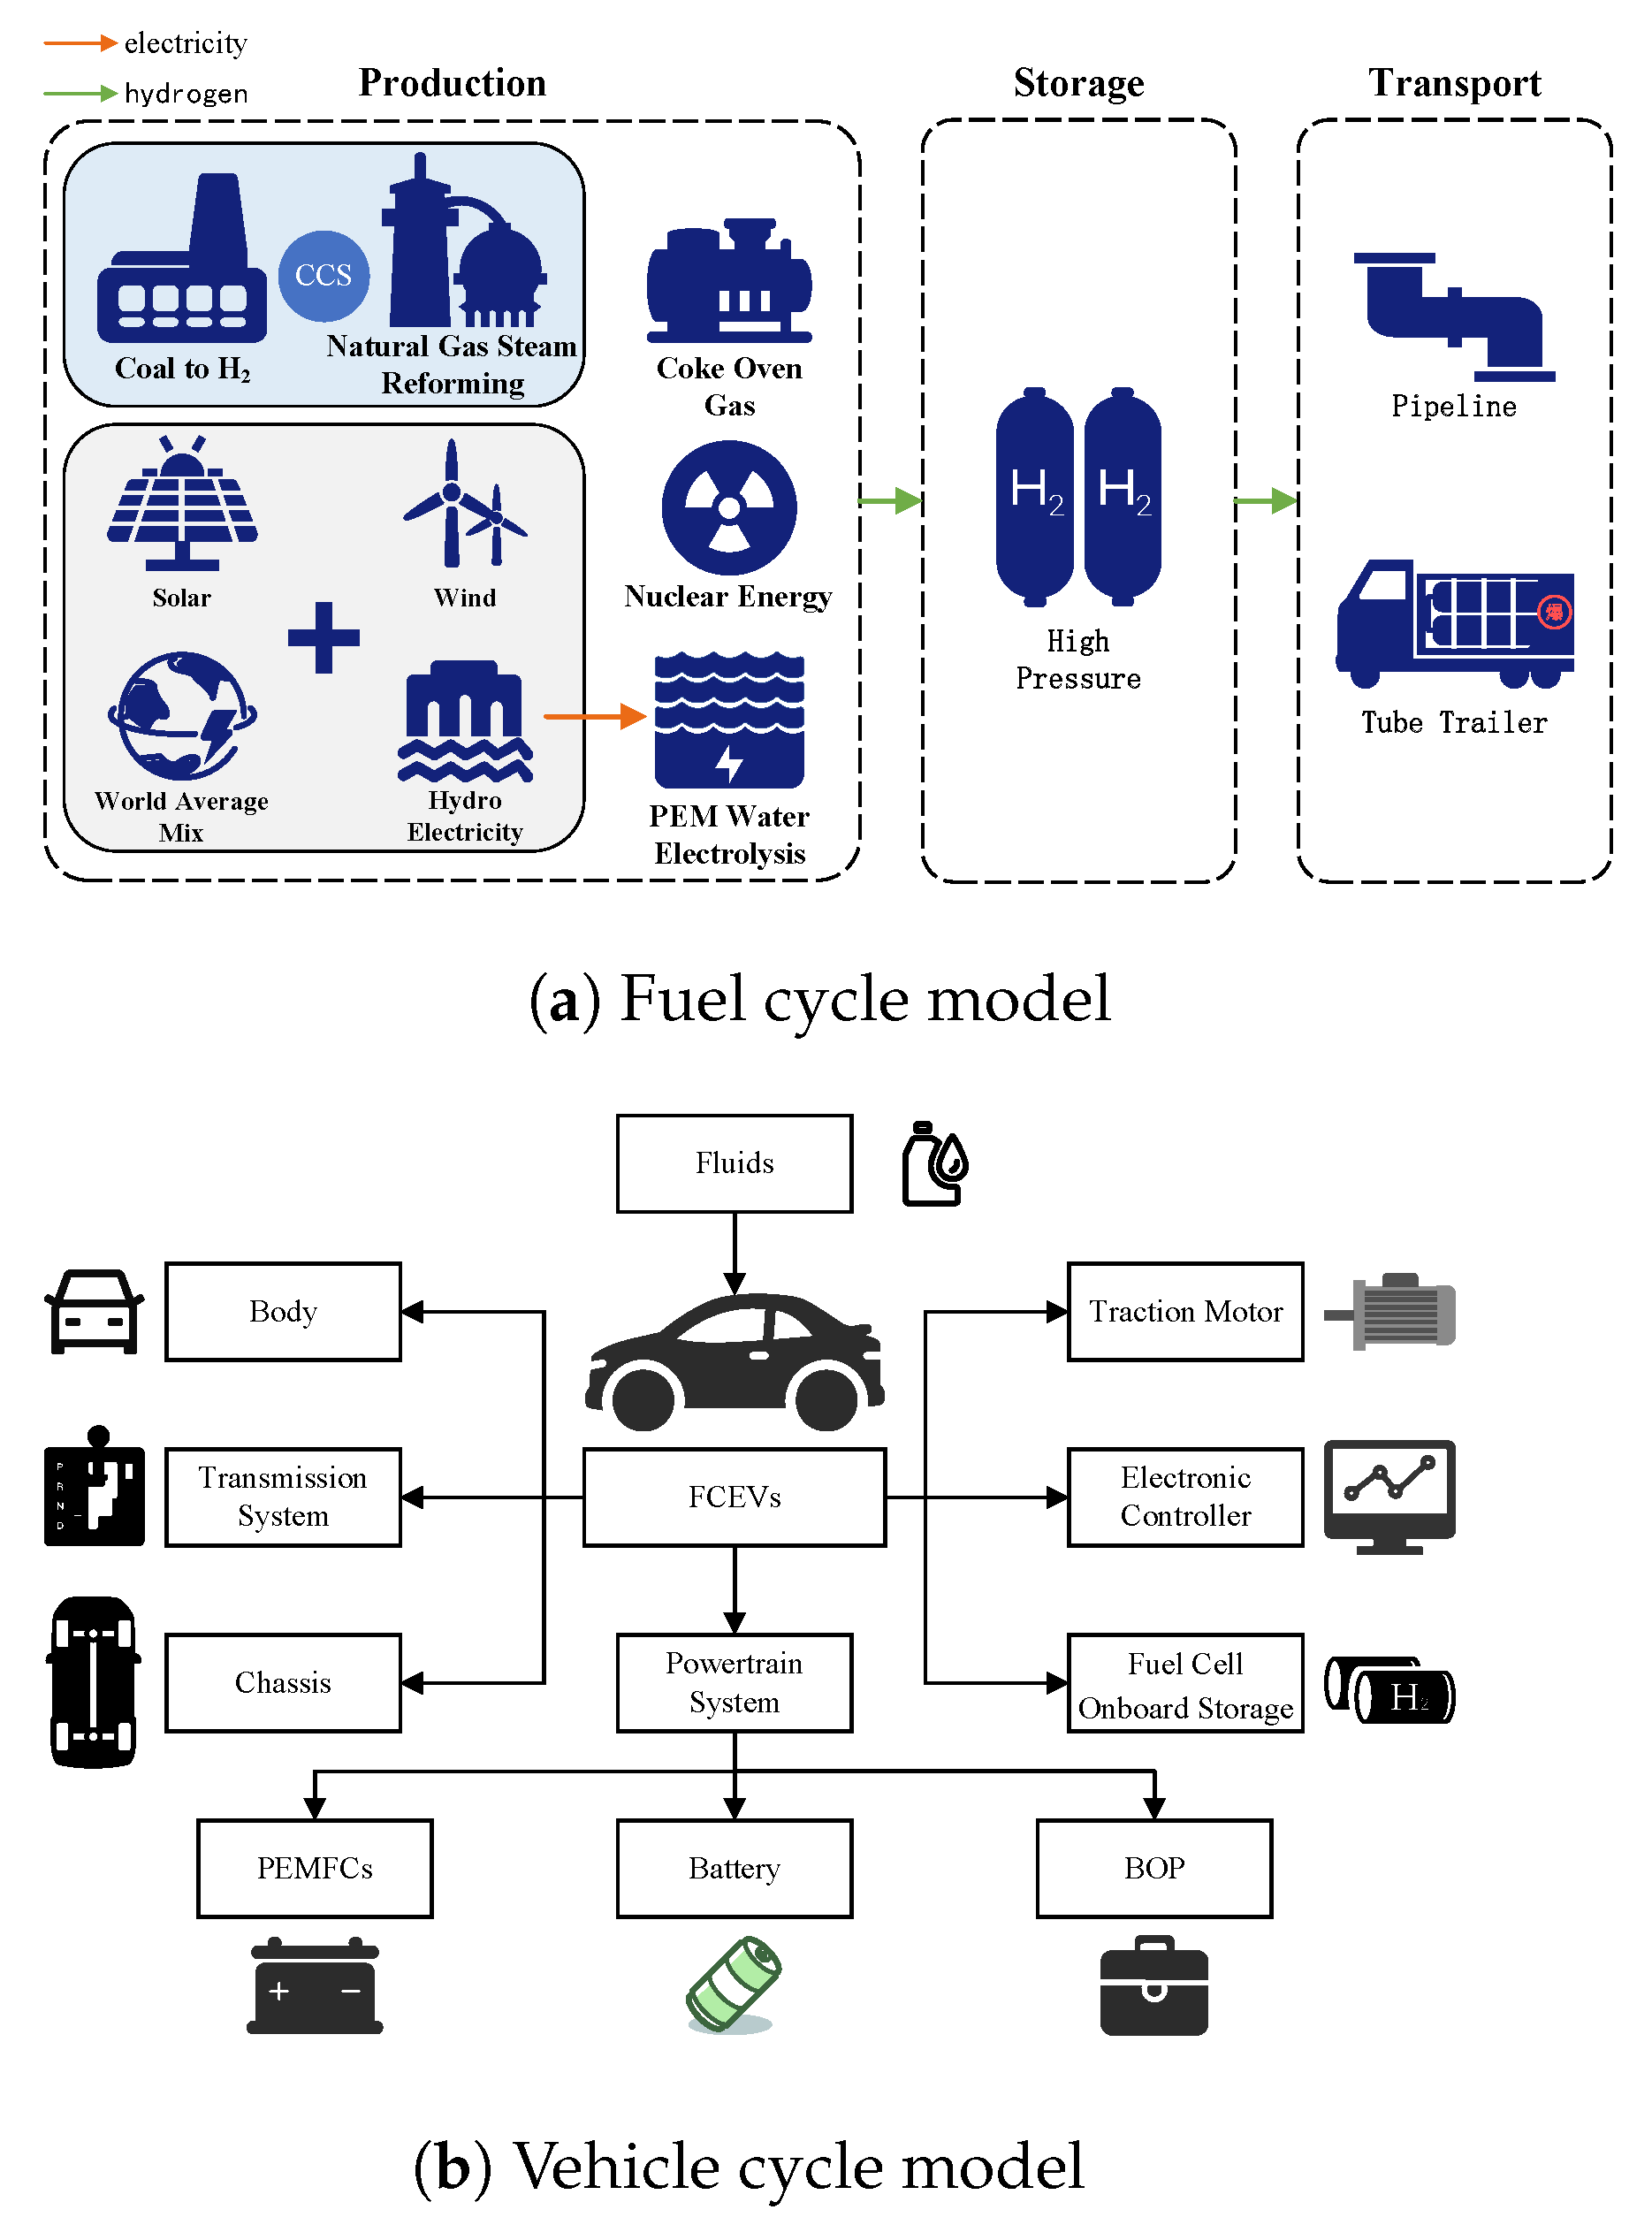
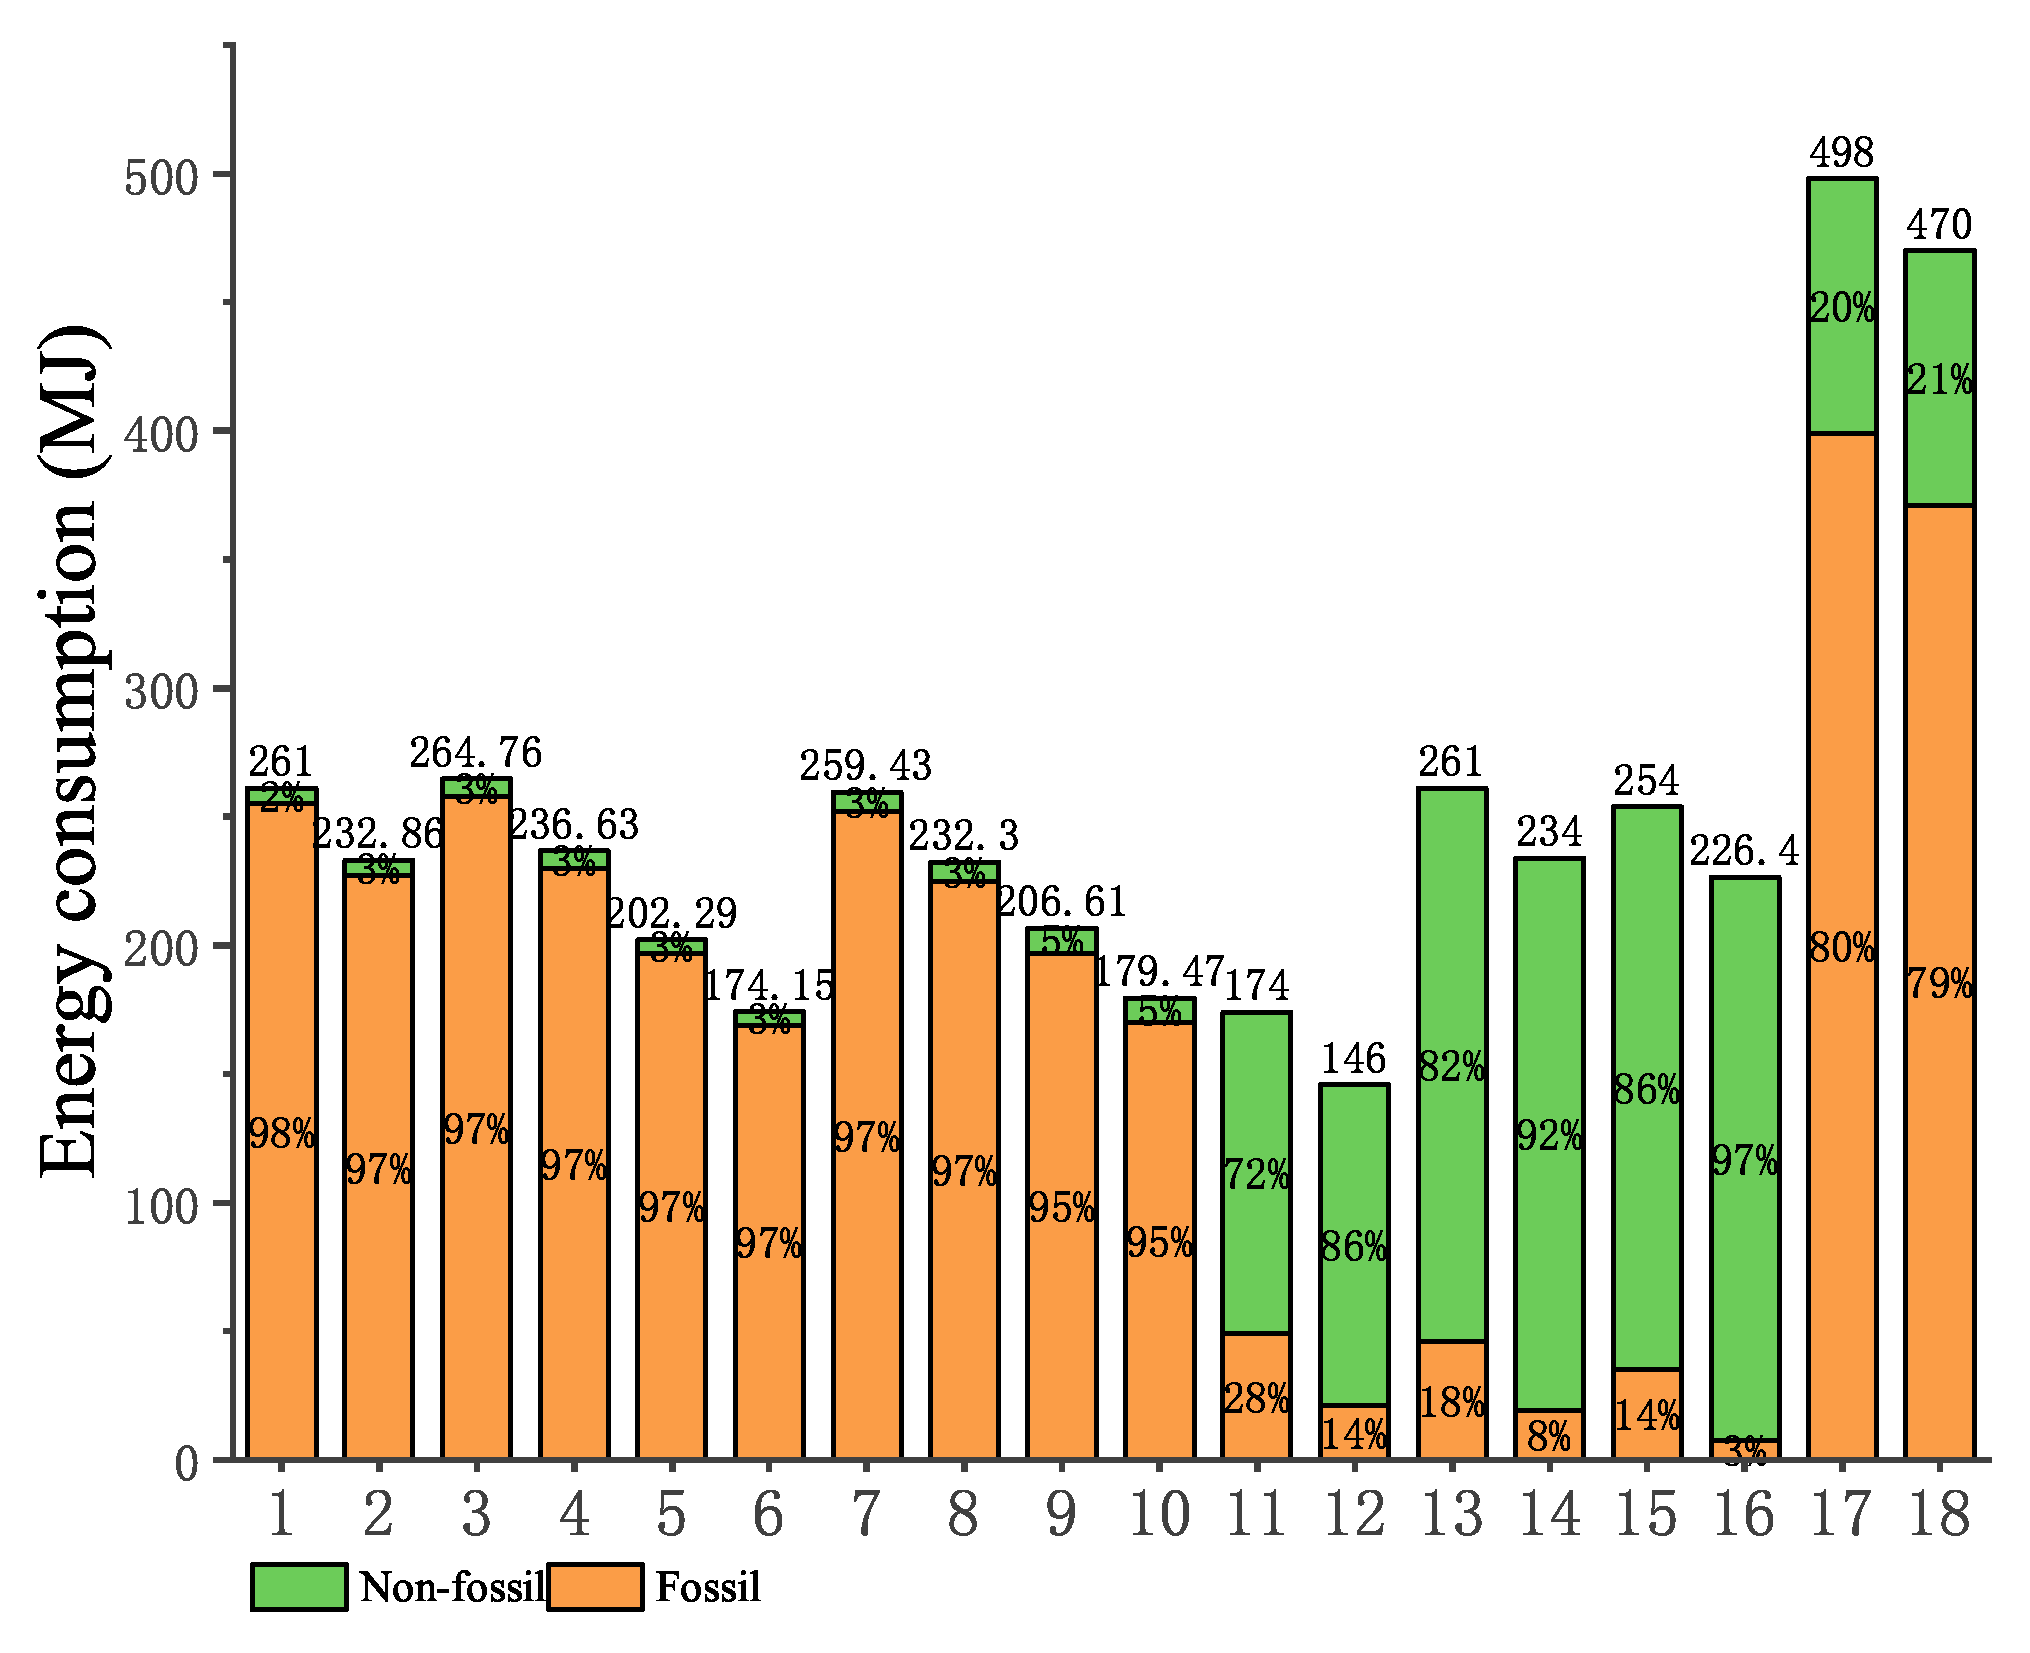
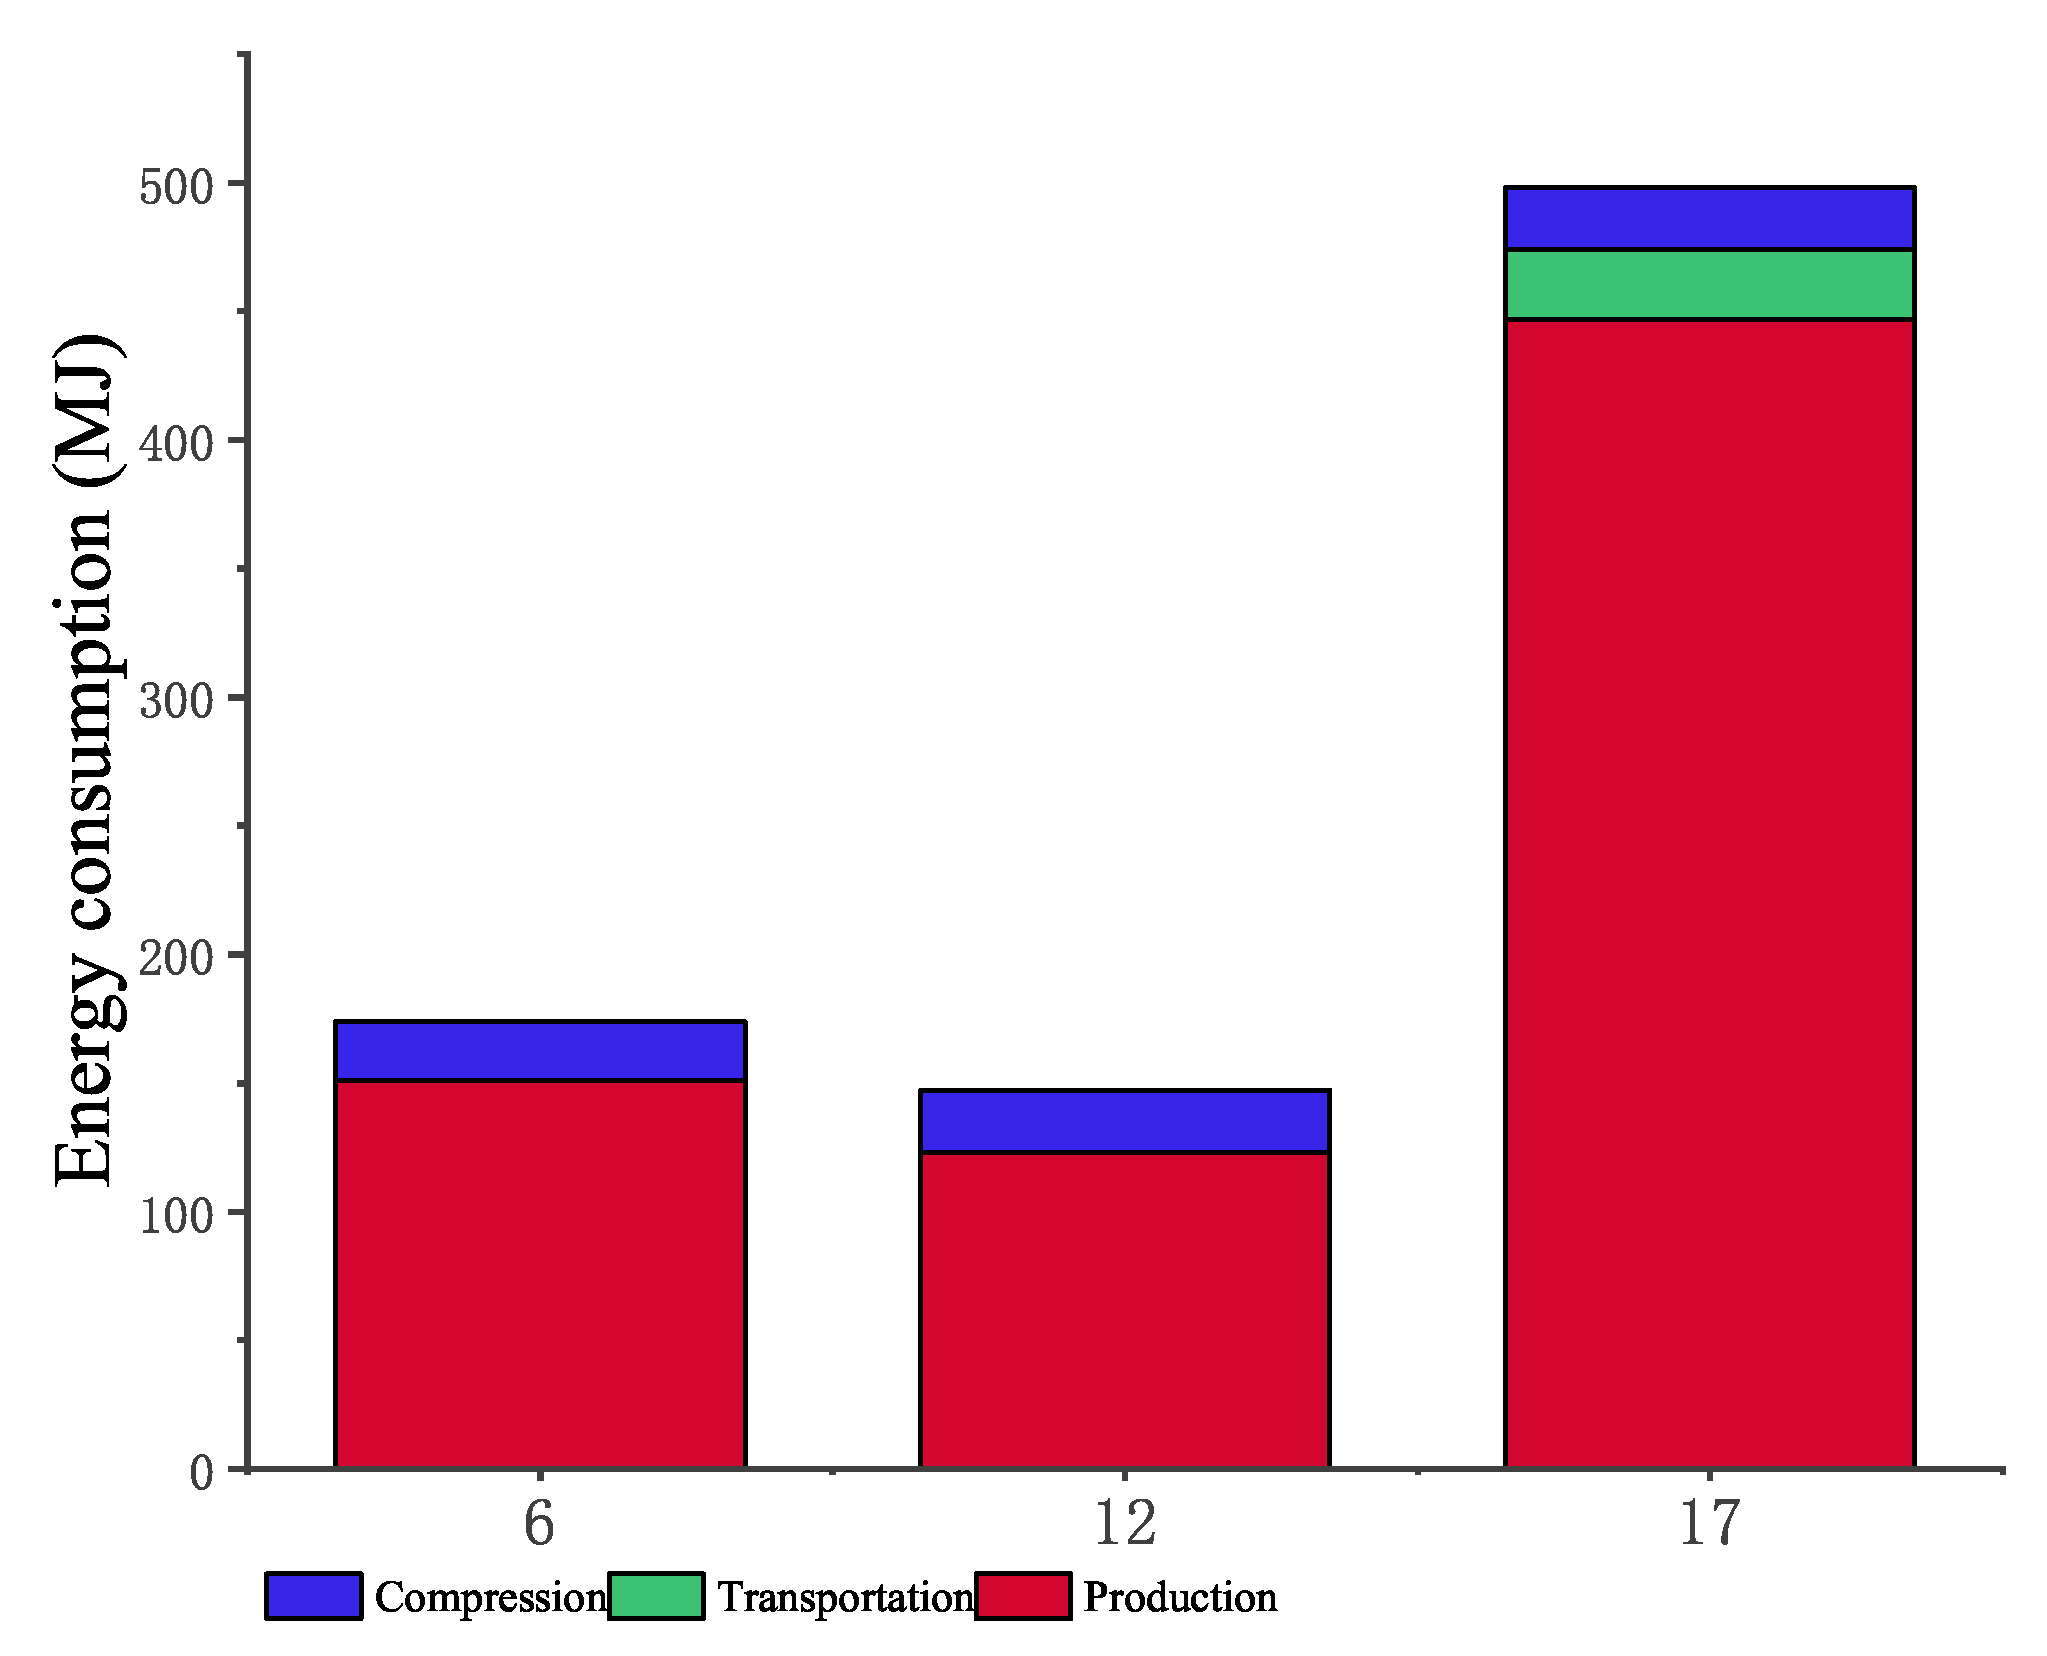
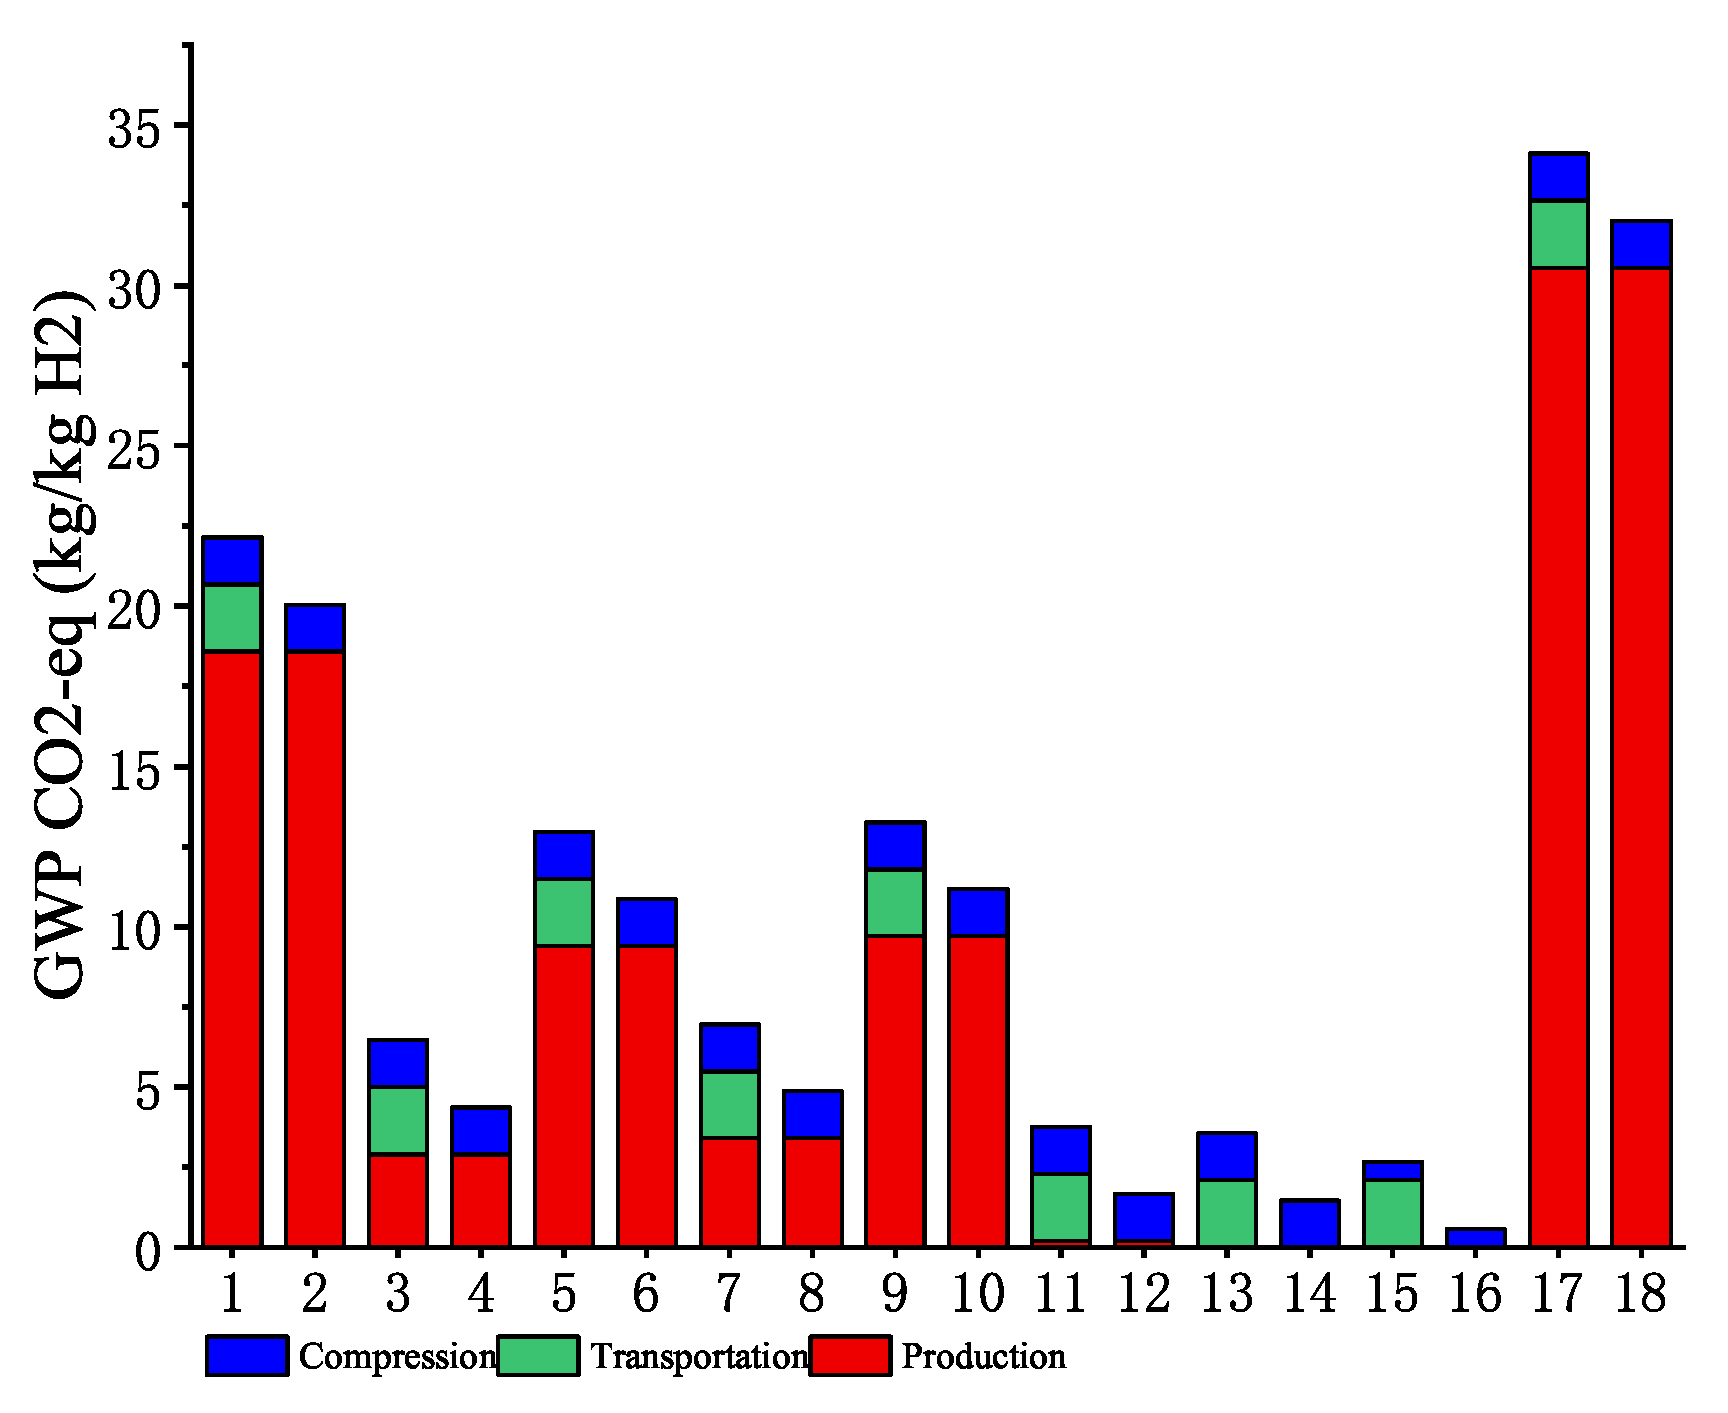
3.1. Fuel Cycle
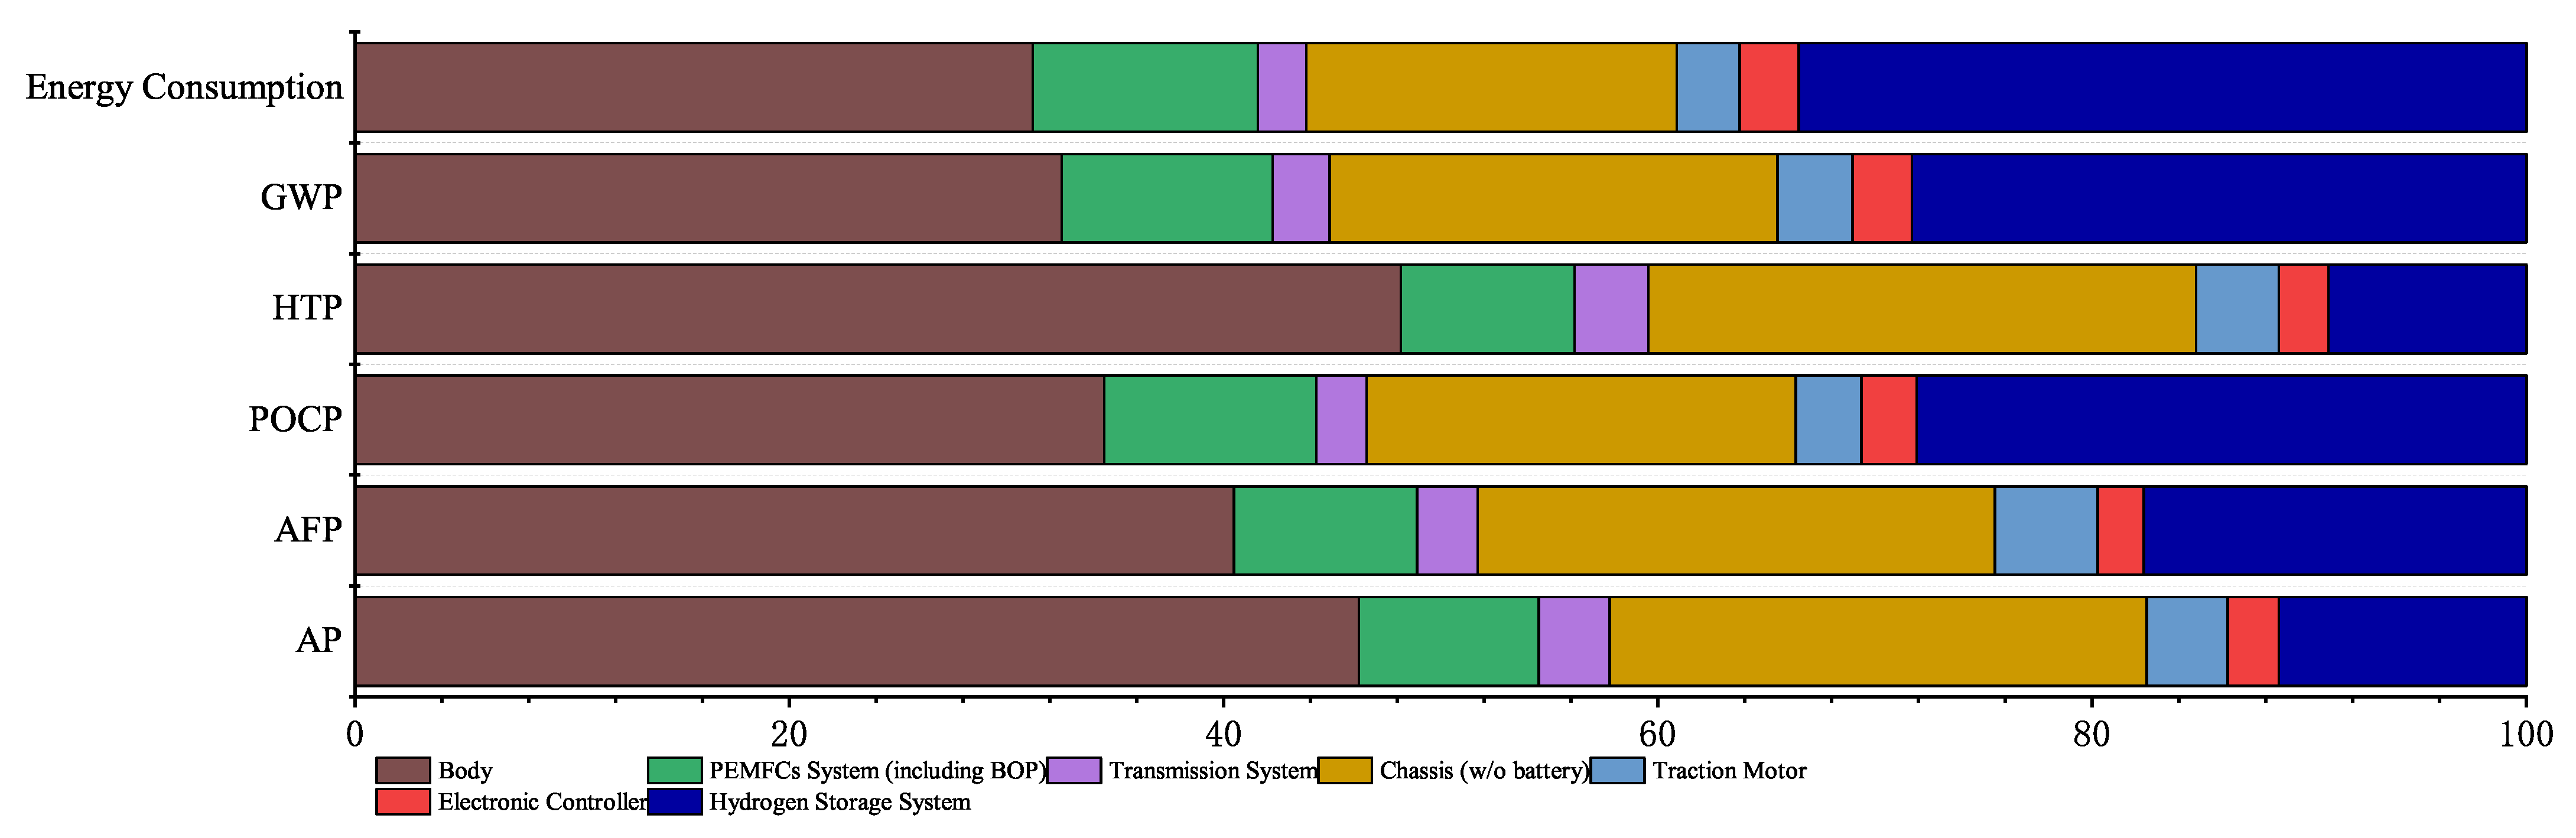
3.2. Vehicle Cycle
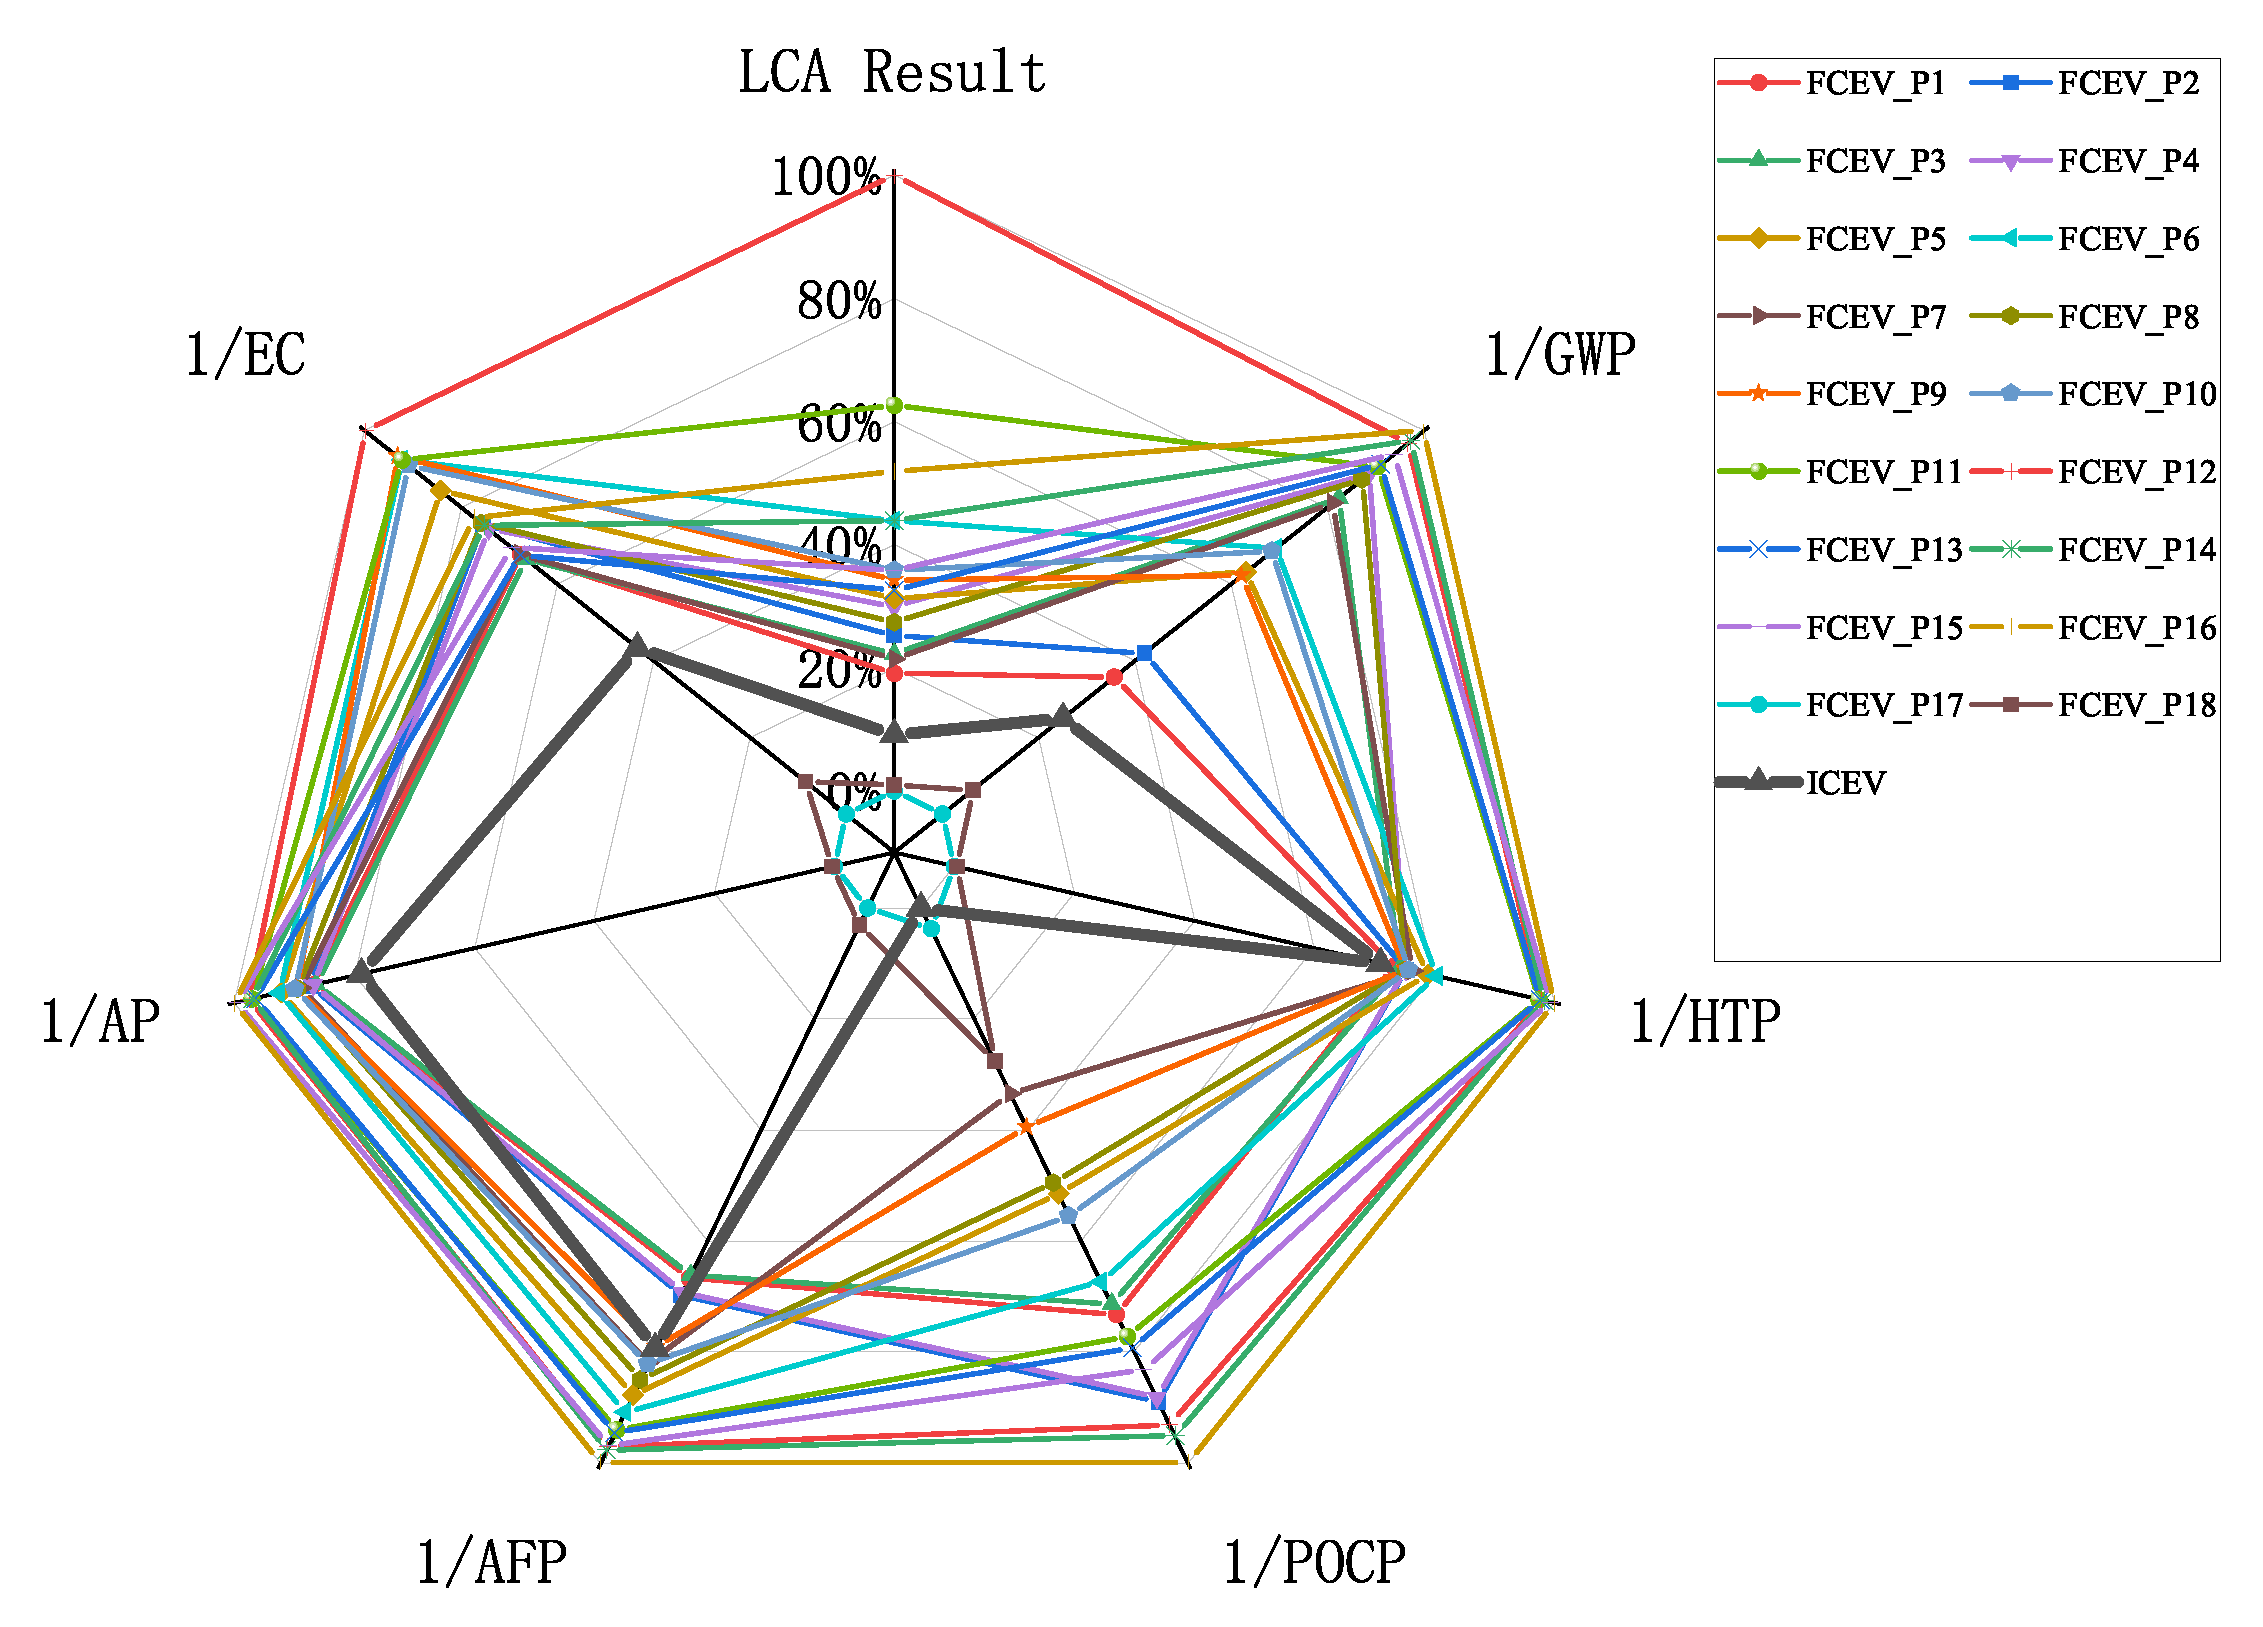
3.3. LCA Result
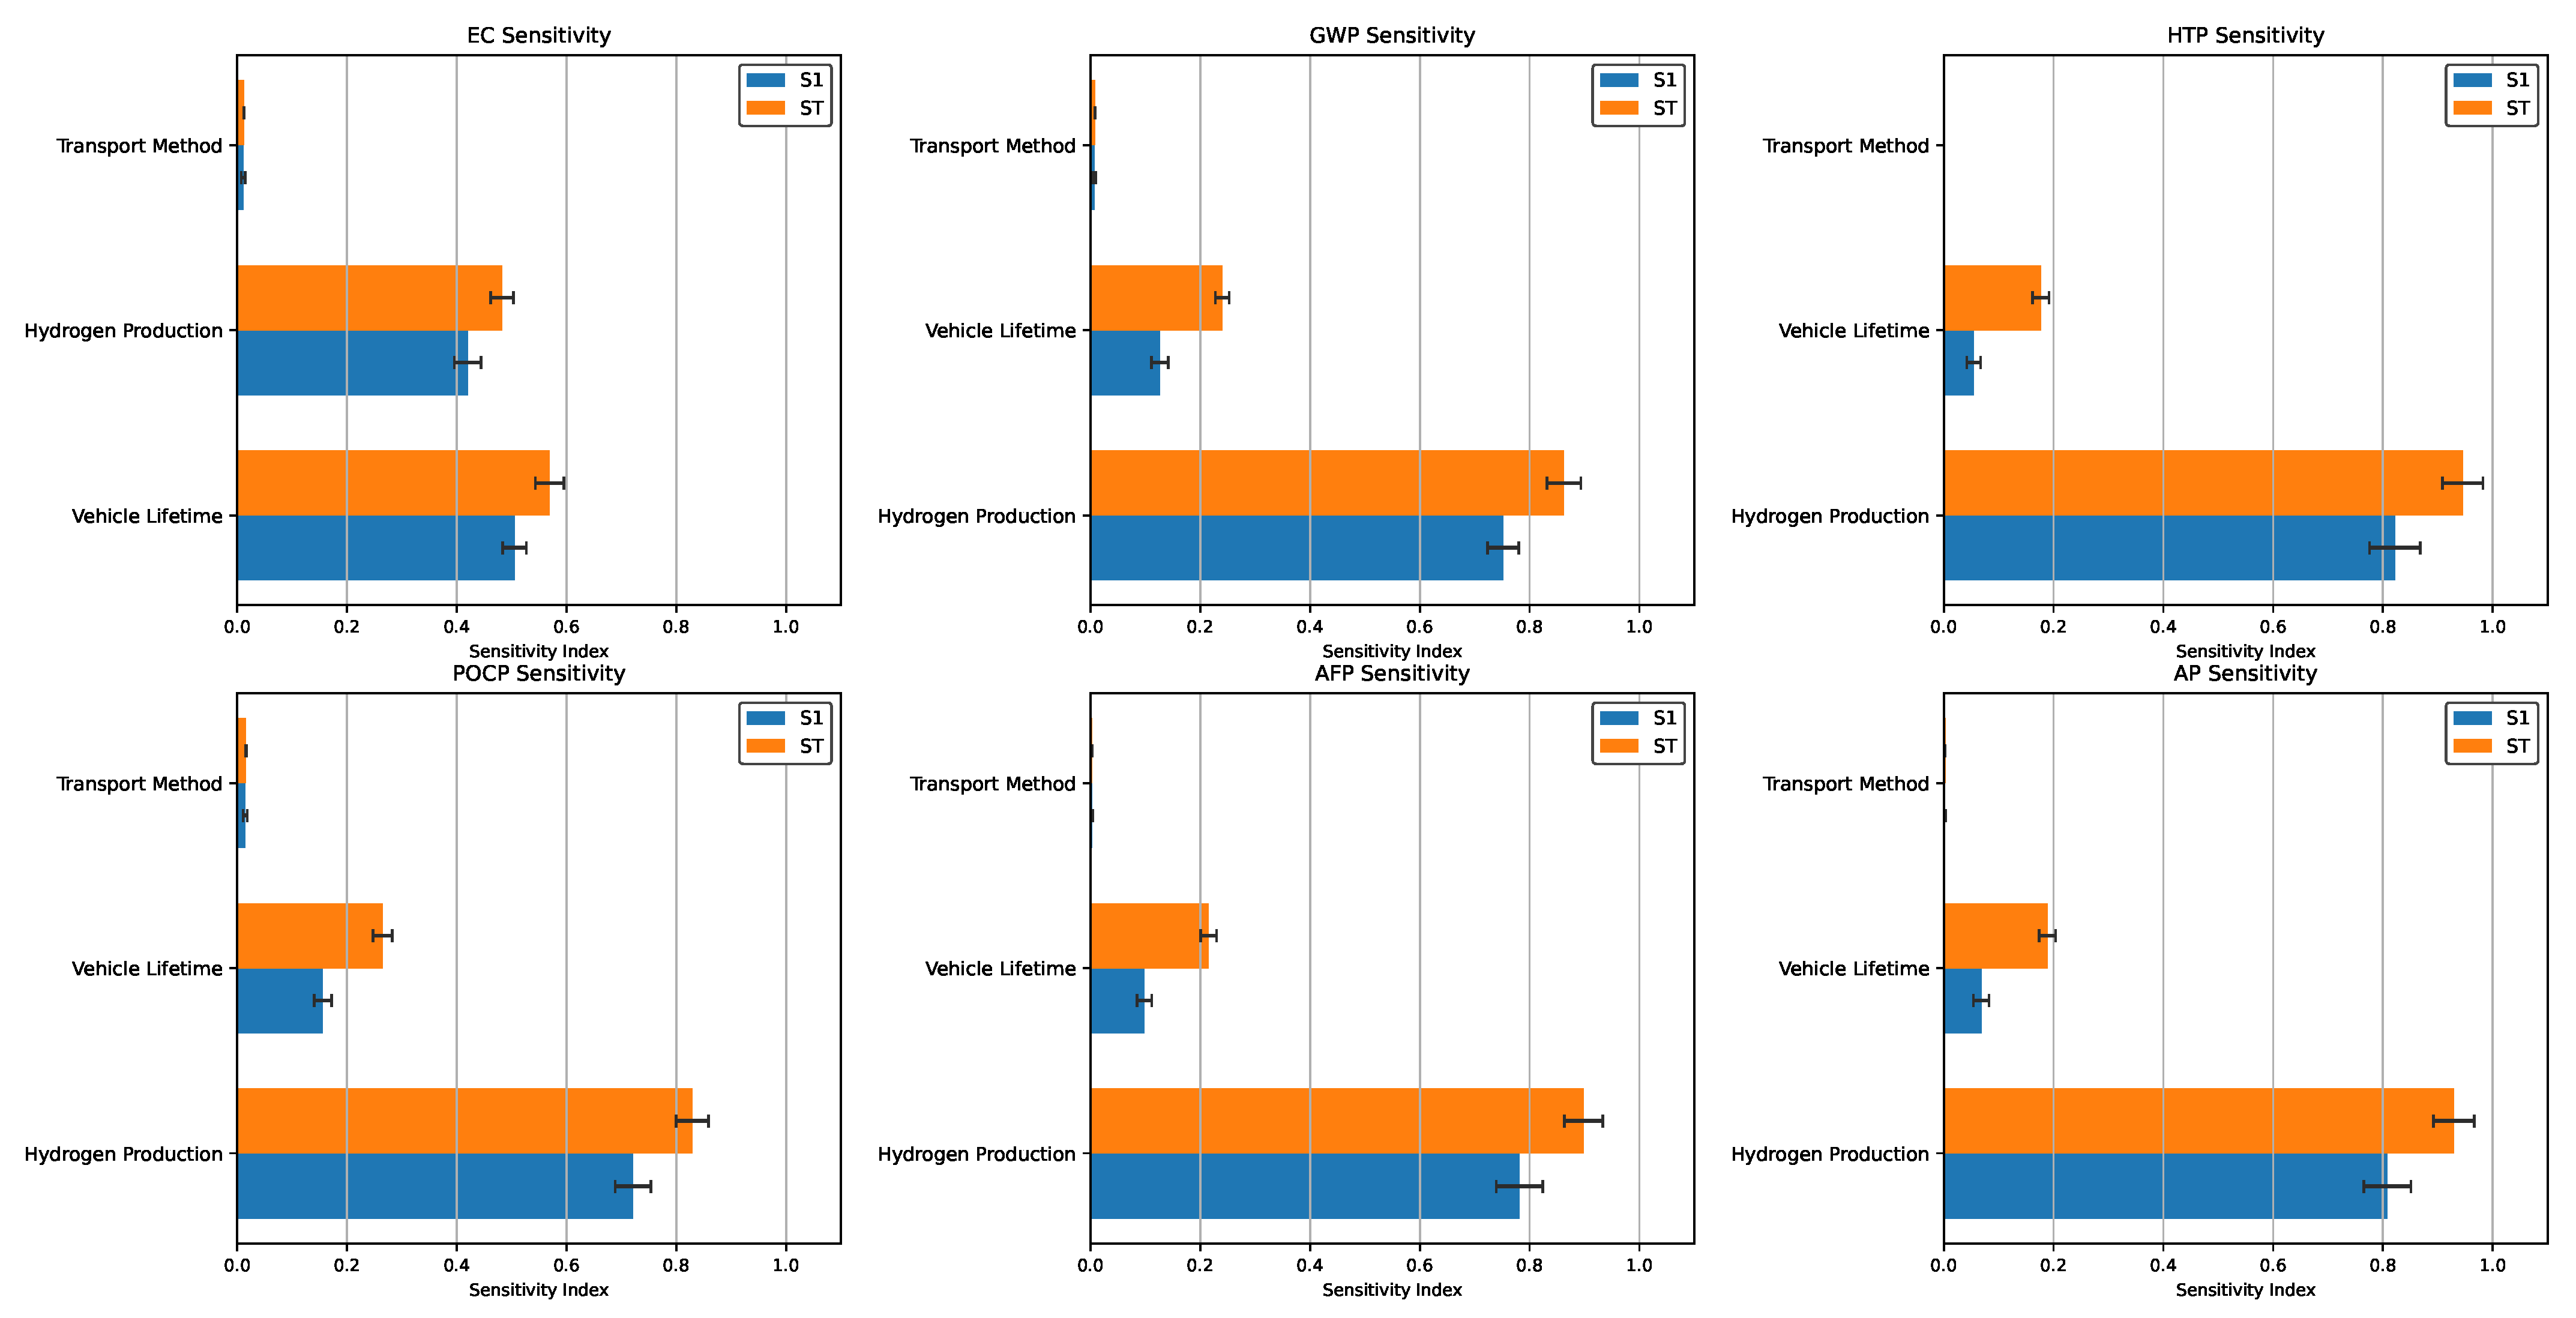
4. Sensitivity Analysis
5. Conclusions
Author Contributions
Funding
Institutional Review Board Statement
Informed Consent Statement
Data Availability Statement
Conflicts of Interest
References
- Lee, H.; Calvin, K.; Dasgupta, D.; Krinner, G.; Mukherji, A.; Thorne, P.; Trisos, C.; Romero, J.; Aldunce, P.; Barret, K. IPCC, 2023: Climate Change 2023: Synthesis Report, Summary for Policymakers. Contribution of Working Groups I, II and III to the Sixth Assessment Report of the Intergovernmental Panel on Climate Change; Core Writing Team, Lee, H., Romero, J., Eds.; IPCC: Geneva, Switzerland, 2023. [Google Scholar]
- Solaymani, S.; Botero, J. Reducing Carbon Emissions from Transport Sector: Experience and Policy Design Considerations. Sustainability 2025, 17, 3762. [Google Scholar] [CrossRef]
- IEA. The Future of Hydrogen. 2019. Available online: https://iea.blob.core.windows.net/assets/9e3a3493-b9a6-4b7d-b499-7ca48e357561/The_Future_of_Hydrogen.pdf (accessed on 7 October 2024).
- Hydrogen Council. Roadmap Towards Zero Emissions: BEVs and FCEVs. 2021. Available online: https://hydrogencouncil.com/wp-content/uploads/2021/10/Transport-Study-Full-Report-Hydrogen-Council-1.pdf (accessed on 7 October 2024).
- FCEV Sales Data. Report, Hydrogen Fuel Cell Partnership. 2025. Available online: https://h2fcp.org/sites/default/files/FCEV-Sales-Tracking.pdf (accessed on 13 October 2024).
- Partnership, H.F.C. FCEV Sales and FCEB Operations in Japan. 2021. Available online: https://www.csis.org/analysis/japans-hydrogen-industrial-strategy (accessed on 14 May 2025).
- Guo, X.; Li, W.; Ren, D.; Chu, J. Prospects for the development of hydrogen fuel cell vehicles in China. Renew. Energy 2025, 240, 122231. [Google Scholar] [CrossRef]
- Burchart, D.; Przytuła, I. Review of Environmental Life Cycle Assessment for Fuel Cell Electric Vehicles in Road Transport. Energies 2025, 18, 1229. [Google Scholar] [CrossRef]
- IEA. Global Hydrogen Review Report. 2024. Available online: https://www.iea.org/reports/global-hydrogen-review-2024 (accessed on 1 October 2024).
- Folęga, P.; Burchart, D.; Marzec, P.; Jursova, S.; Pustejovska, P. Potential environmental life cycle impacts of fuel cell electric vehicles powered by hydrogen produced from Polish coke oven gas. Transp. Probl. 2022, 17, 151–161. [Google Scholar] [CrossRef]
- Yang, Z.; Wang, B.; Jiao, K. Life cycle assessment of fuel cell, electric and internal combustion engine vehicles under different fuel scenarios and driving mileages in China. Energy 2020, 198, 117365. [Google Scholar] [CrossRef]
- Yu, H.; Yin, J.; Wang, C.; Shen, S.; Yan, X.; Zhang, J. Energy consumption, emission and economy analysis of fuel cell vehicle in China. In Proceedings of the 3rd International Conference on Environmental Prevention and Pollution Control Technologies, Zhuhai, China, 15–17 January 2021; IOP Publishing: Bristol, UK, 2021; Volume 687, p. 012191. [Google Scholar]
- Hao, H.; Mu, Z.; Liu, Z.; Zhao, F. Abating transport GHG emissions by hydrogen fuel cell vehicles: Chances for the developing world. Front. Energy 2018, 12, 466–480. [Google Scholar] [CrossRef]
- Maniscalco, M.P.; Longo, S.; Cellura, M.; Miccichè, G.; Ferraro, M. Critical review of life cycle assessment of hydrogen production pathways. Environments 2024, 11, 108. [Google Scholar] [CrossRef]
- Lyu, R.; Wang, Z.; Zhang, Z. Optimal Component Sizing Strategy for Fuel Cell Hybrid Truck Powertrain System Based on Multi-Population Gray Wolf Algorithm. In Proceedings of the 2024 8th CAA International Conference on Vehicular Control and Intelligence (CVCI), Chongqing, China, 25–27 October 2024; pp. 1–6. [Google Scholar]
- Zhang, Z.; He, H.; Quan, S.; Chen, J.; Han, R. Multi-parameter and multi-objective optimization of dual-fuel cell system heavy-duty vehicles: Sizing for serial development. Energy 2024, 308, 132857. [Google Scholar] [CrossRef]
- Bai, F.; Zhao, F.; Liu, X.; Mu, Z.; Hao, H.; Liu, Z. A comparative well-to-wheel analysis of renewable energy pathways for hydrogen and battery electric vehicles. J. Clean. Prod. 2024, 466, 142832. [Google Scholar] [CrossRef]
- Agostini, A.; Belmonte, N.; Masala, A.; Hu, J.; Rizzi, P.; Fichtner, M.; Moretto, P.; Luetto, C.; Sgroi, M.; Baricco, M. Role of hydrogen tanks in the life cycle assessment of fuel cell-based auxiliary power units. Appl. Energy 2018, 215, 1–12. [Google Scholar] [CrossRef]
- Savran, E.; Yavaş, Ö.; Günaslan, S.; Nalbur, B.E.; Karpat, F. Comparison of energy consumption and global warming potential of electric and hydrogen-fueled vehicles across different product size. Environ. Monit. Assess. 2025, 197, 609. [Google Scholar] [CrossRef] [PubMed]
- Chen, Y.S.; Lan, L.B.; Hao, Z.; Fu, P. Life Cycle Assessment and Key Parameter Comparison of Hydrogen Fuel Cell Vehicles Power Systems. Huan Jing Ke Xue 2022, 43, 4402–4412. [Google Scholar] [PubMed]
- Cox, B.; Bauer, C.; Beltran, A.M.; Van Vuuren, D.P.; Mutel, C.L. Life cycle environmental and cost comparison of current and future passenger cars under different energy scenarios. Appl. Energy 2020, 269, 115021. [Google Scholar] [CrossRef]
- Lu, Q.; Zhang, B.; Yang, S.; Peng, Z. Life cycle assessment on energy efficiency of hydrogen fuel cell vehicle in China. Energy 2022, 257, 124731. [Google Scholar] [CrossRef]
- Devanathan, S.; Ramanujan, D.; Bernstein, W.Z.; Zhao, F.; Ramani, K. Integration of sustainability into early design through the function impact matrix. J. Mech. Des. 2010, 132, 081004. [Google Scholar] [CrossRef]
- Moholkar, V.S. Comparative life cycle analysis of hydrogen fuel cell electric vehicles and battery electric vehicles: An Indian perspective. Int. J. Hydrogen Energy 2025, 103, 729–739. [Google Scholar]
- Wackernagel, M.; Rees, W. Our Ecological Footprint: Reducing Human Impact on the Earth; New Society Publishers: Gabriola Island, BC, Canada, 1998; Volume 9. [Google Scholar]
- Wiedmann, T.; Minx, J. A definition of ‘carbon footprint’. Ecol. Econ. Res. Trends 2008, 1, 1–11. [Google Scholar]
- Hammond, G. Time to give due weight to the ’carbon footprint’ issue. Nature 2007, 445, 256. [Google Scholar] [CrossRef]
- Fu, C.; Wang, J.; Shen, Q.; Cui, Z.; Ding, S. Determining the optimal biomass-gasification-based fuel cell trigeneration system in exergy-based cost and carbon footprint method considering energy level. Energy Convers. Manag. 2024, 299, 117802. [Google Scholar] [CrossRef]
- Ahmad, Q. Climate change 1995. Economic and social dimensions of climate change. Contribution of working group III t the second assessment report of the intergovernmental panel on climate change. Glob. Environ. Chang. Hum. Policy Dimens. 1997, 7, 189–190. [Google Scholar] [CrossRef]
- Intergovernmental Panel on Climate Change. Climate change 2007: The physical science basis. Agenda 2007, 6, 333. [Google Scholar]
- Intergovernmental Panel on Climate Change. The Physical Science Basis; Contribution of Working Group I to the Fifth Assessment Report of the Intergovernmental Panel on Climate Change; Intergovernmental Panel on Climate Change: Geneva, Switzerland, 2013; Volume 1535. [Google Scholar]
- Masson-Delmotte, V.; Zhai, P.; Pirani, A.; Connors, S.L.; Péan, C.; Berger, S.; Caud, N.; Chen, Y.; Goldfarb, L.; Gomis, M.; et al. Climate Change 2021: The Physical Science Basis; Contribution of Working Group I to the Sixth Assessment Report of the Intergovernmental Panel on Climate Change; Cambridge University Press: Cambridge, UK, 2021; Volume 2, p. 2391. [Google Scholar]
- ISO 14040; Life Cycle Assessment: Principles and Framework. International Standard Organisation (ISO) Environmental Management: Geneva, Switzerland, 2006.
- ISO 14044; Life Cycle Assessment: Requirements and Guidelines. International Standard Organisation (ISO) Environmental Management: Geneva, Switzerland, 2006.
- Finkbeiner, M.; Inaba, A.; Tan, R.; Christiansen, K.; Klüppel, H.J. The new international standards for life cycle assessment: ISO 14040 and ISO 14044. Int. J. Life Cycle Assess. 2006, 11, 80–85. [Google Scholar] [CrossRef]
- Wang, M.; Elgowainy, A.; Lu, Z.; Baek, K.H.; Bafana, A.; Benavides, P.T.; Burnham, A.; Cai, H.; Cappello, V.; Chen, P.; et al. Greenhouse Gases, Regulated Emissions, and Energy Use in Technologies, Model® (2022.Net). 2022. Available online: https://www.osti.gov/doecode/biblio/81029 (accessed on 14 May 2025).
- Lou, Y.; Corbeau, A.S. China’s Hydrogen Strategy: National vs. Regional Plans. 2023. Available online: https://www.energypolicy.columbia.edu/publications/chinas-hydrogen-strategy-national-vs-regional-plans (accessed on 14 May 2025).
- IEA. Electricity. 2024. Available online: https://www.iea.org/reports/electricity-2024 (accessed on 14 May 2025).
- Zheng, L.; Zhao, D.; Wang, W. Medium and long-term hydrogen production technology routes and hydrogen energy supply scenarios in Guangdong Province. Int. J. Hydrogen Energy 2024, 49, 1–15. [Google Scholar] [CrossRef]
- Safari, F.; Dincer, I. A review and comparative evaluation of thermochemical water splitting cycles for hydrogen production. Energy Convers. Manag. 2020, 205, 112182. [Google Scholar] [CrossRef]
- Sobol, I. Global sensitivity indices for nonlinear mathematical models and their Monte Carlo estimates. Math. Comput. Simul. 2001, 55, 271–280. [Google Scholar] [CrossRef]
- Jiangbo, X.; Xiong, W.; Wei, Q.; Shaowei, W.; Xinyu, C.; Danni, Z.; Xianglong, Z.; Sheng, S. Carbon emission analysis of ecological slope protection based on lifecycle theory and sobol method. Ecol. Eng. 2025, 215, 107584. [Google Scholar] [CrossRef]


| IPCC | Time | CO2 | CH4 | N2O |
|---|---|---|---|---|
| AR4 2007 | GWP20 | 1 | 72 | 289 |
| GWP100 | 1 | 25 | 298 | |
| AR5 2013 | GWP20 | 1 | 85 | 264 |
| GWP100 | 1 | 30 | 265 | |
| AR5 2021 | GWP20 | 1 | 82.5 | 273 |
| GWP100 | 1 | 29.8 | 273 |
| Environmental Indicators | Emissions | Weight Coefficient |
|---|---|---|
| Global Warming Potential (100) | CO2 | 1 |
| CH4 | 29.8 | |
| N2O | 273 | |
| Human toxicity potential | CO | 0.012 |
| 0.780 | ||
| Photochemical smog potential | CH4 | 0.006 |
| 0.028 | ||
| Aerosol formation potential | PM10 | 1.000 |
| PM2.5 | 1.000 | |
| Acidification potential | 2.000 | |
| 0.700 |
| Path | Hydrogen State | Hydrogen Source | Hydrogen Transport |
|---|---|---|---|
| 1 | Gaseous | Coal | Tube trailer |
| 2 | Gaseous | Coal | Pipeline |
| 3 | Gaseous | Coal (with CCS 1) | Tube trailer |
| 4 | Gaseous | Coal (with CCS) | Pipeline |
| 5 | Gaseous | Natural Gas | Tube trailer |
| 6 | Gaseous | Natural Gas | Pipeline |
| 7 | Gaseous | Natural Gas (with CCS) | Tube trailer |
| 8 | Gaseous | Natural Gas (with CCS) | Pipeline |
| 9 | Gaseous | Coke Oven Gas | Tube trailer |
| 10 | Gaseous | Coke Oven Gas | Pipeline |
| 11 | Gaseous | Nuclear Energy (Thermo-Chemical Cracking of Water) | Tube trailer |
| 12 | Gaseous | Nuclear Energy (Thermo-Chemical Cracking of Water) | Pipeline |
| 13 | Gaseous | PEM Electrolysis (Solar or Wind) | Tube trailer |
| 14 | Gaseous | PEM Electrolysis (Solar or Wind) | Pipeline |
| 15 | Gaseous | PEM Electrolysis (Hydro) | Tube trailer |
| 16 | Gaseous | PEM Electrolysis (Hydro) | Pipeline |
| 17 | Gaseous | PEM Electrolysis (World Average Mix) | Tube trailer |
| 18 | Gaseous | PEM Electrolysis (World Average Mix) | Pipeline |
| Vehicle Parameter | Detail |
|---|---|
| Lifetime VMT of a Vehicle | 278,662.7 km |
| Total Vehicle Weight | 1627.03 kg |
| Fuel Cell Stack Size (PEMFC) | 102 kW |
| Battery Size 1 | 38 kW |
| Battery Weight (Li-Ion) | 21.95 kg |
| Battery Weight (Lead-Acid) | 10.02 kg |
| Fluids Weight 2 | 25.23 kg |
| PEMFCs System (including BOP) | 130.02 kg |
| Fuel Cell Onboard Storage | 136.09 kg |
| Transmission System | 44.17 kg |
| Chassis (w/o battery) | 368.46 kg |
| Traction Motor | 66.25 kg |
| Electronic Controller | 57.76 kg |
| Body 3 | 767.13 kg |
| Material | Fraction (%) | Material | Fraction (%) |
|---|---|---|---|
| Body | Traction Motor | ||
| Steel | 65.2777 | Steel | 50.48 |
| Wrought Aluminum | 3.0699 | Stainless Steel | 1.2 |
| Cast Aluminum | 0.1646 | Cast Aluminum | 32.2 |
| Copper/Brass | 1.8986 | Copper/Brass | 10.6 |
| Zinc | 0 | Nd(Dy)FeB magnet | 2.81 |
| Magnesium | 0 | Phenolic resin | 0.05 |
| Glass Fiber-Reinforced Plastic | 0.8491 | Enamel | 0.47 |
| Glass | 4.4419 | Nickel | 0.03 |
| Carbon Fiber-Reinforced Plastic | 0 | PET | 0.32 |
| Average Plastic | 21.6747 | PBT | 0.29 |
| Rubber | 1.7678 | Mica | 0.05 |
| Others | 0.8556 | Fiberglass | 0.01 |
| Silicone | 0.07 | ||
| Powertrain System (including BOP) | Epoxy resin | 0.86 | |
| Steel | 18.7109 | Nylon | 0.01 |
| Stainless Steel | 31.3479 | Methacrylate ester resin | 0.13 |
| Cast iron | 0.0764 | Paint/Varnish | 0.39 |
| Wrought Aluminum | 16.7949 | Zinc | 0.02 |
| Cast Aluminum | 0 | Others | 0.01 |
| Copper/Brass | 1.7275 | Electronic Controller | |
| Magnesium | 0 | Steel | 2.75 |
| Glass Fiber-Reinforced Plastic | 2.5917 | Cast Aluminum | 53.27 |
| Average Plastic | 16.6177 | Copper/Brass | 26.46 |
| Rubber | 6.4616 | Rubber | 1.06 |
| Carbon Fiber-Reinforced Plastic | 0 | Average Plastic | 0.96 |
| PFSA | 0.6198 | Alumina | 0.26 |
| Carbon Paper | 2.1401 | Epoxy resin | 0.26 |
| PTFE | 2.5651 | Fiberglass | 0.67 |
| Carbon & PFSA Suspension | 0 | Gold | 0 |
| Platinum | 0.0177 | Nickel | 0.16 |
| Carbon | 0.2728 | Nylon | 0.07 |
| Nickel | 0.0019 | PET | 3.02 |
| Silicon | 0.0540 | Polypropylene (PP) | 4.33 |
| Others | 0 | Polyurethane | 2.15 |
| Transmission System/Gearbox | Zinc | 1.11 | |
| Steel | 60.5 | Zinc oxide | 0.02 |
| Copper | 18.9 | Others | 3.45 |
| Cast Iron | 0 | Fuel Cell Onboard Storage | |
| Magnesium | 0 | Steel | 9.1529 |
| Wrought Aluminum | 20 | Stainless Steel | 8.0818 |
| Cast Aluminum | 0 | Carbon Fiber-Reinforced Plastic | 65.6280 |
| Carbon Fiber-Reinforced Plastic | 0 | Glass Fiber-Reinforced Plastic | 4.4791 |
| Average Plastic | 0.2 | Wrought Aluminum | 0 |
| Rubber | 0 | Copper | 0 |
| Others | 0.4 | Average Plastics | 7.7897 |
| Chassis (w/o battery) | Rubber | 0 | |
| Steel | 66.8037 | Nickel | 0 |
| Cast Iron | 0 | Silicon | 0.9737 |
| Wrought Aluminum | 1.5068 | Others | 3.8948 |
| Cast Aluminum | 18.5998 | ||
| Copper/Brass | 1.3234 | ||
| Zinc | 0 | ||
| Magnesium | 0.1005 | ||
| Glass Fiber-Reinforced Plastic | 0.1546 | ||
| Average Plastic | 2.3483 | ||
| Rubber | 9.1540 | ||
| Others | 0.0087 | ||
| Path | EC (MJ) | GWP (kg) | HTP (g) | POCP (g) | AFP (g) | AP (g) | CEA | LCA Result |
|---|---|---|---|---|---|---|---|---|
| 1 | 261 | 22.14 | 3.17 | 0.14 | 2.35 | 7.94 | 0.3 | 1.95 |
| 2 | 233 | 20.05 | 3.02 | 0.061 | 2.14 | 7.69 | 0.25 | 2.18 |
| 3 | 265 | 6.47 | 3.28 | 0.15 | 2.39 | 8.24 | 0.22 | 2.1 |
| 4 | 237 | 4.38 | 3.13 | 0.065 | 2.18 | 7.98 | 0.16 | 2.39 |
| 5 | 202 | 12.96 | 2.08 | 0.25 | 0.92 | 5.06 | 0.23 | 2.39 |
| 6 | 174 | 10.87 | 1.93 | 0.17 | 0.71 | 4.81 | 0.18 | 2.74 |
| 7 | 260 | 6.96 | 2.79 | 0.34 | 1.32 | 6.8 | 0.26 | 2.04 |
| 8 | 232 | 4.88 | 2.64 | 0.26 | 1.11 | 6.54 | 0.2 | 2.31 |
| 9 | 207 | 13.27 | 2.67 | 0.31 | 1.51 | 6.48 | 0.28 | 2.23 |
| 10 | 179 | 11.18 | 2.52 | 0.23 | 1.3 | 6.23 | 0.23 | 2.53 |
| 11 | 174 | 3.76 | 0.96 | 0.12 | 0.5 | 2.31 | 0.09 | 3.13 |
| 12 | 147 | 1.67 | 0.81 | 0.04 | 0.29 | 2.06 | 0.04 | 3.74 |
| 13 | 261 | 3.56 | 0.88 | 0.11 | 0.46 | 2.12 | 0.08 | 2.49 |
| 14 | 234 | 1.47 | 0.73 | 0.03 | 0.25 | 1.86 | 0.03 | 2.86 |
| 15 | 254 | 2.67 | 0.44 | 0.09 | 0.31 | 0.99 | 0.06 | 2.6 |
| 16 | 227 | 0.58 | 0.29 | 0.006 | 0.098 | 0.74 | 0 | 3.05 |
| 17 | 498 | 34.11 | 22.06 | 0.49 | 6.88 | 55.58 | 1 | 0.91 |
| 18 | 470 | 32.02 | 21.92 | 0.37 | 6.66 | 55.33 | 0.93 | 0.94 |
| Indicator | Unit | Component | ADR | Battery | Fluid | Total |
|---|---|---|---|---|---|---|
| EC | MJ | 112,501.04 | 15,210.74 | 3627.57 | 2979.11 | 134,318.5 |
| GWP | kg | 6846.22 | 949.5 | 233.86 | 97.49 | 8127.06 |
| HTP | g | 11,441.49 | 332.38 | 511.79 | 147.23 | 12,432.9 |
| POCP | g | 297.76 | 37.36 | 11.41 | 6.18 | 352.7 |
| AFP | g | 3631.72 | 225.65 | 142.62 | 29.17 | 4029.17 |
| AP | g | 33,536.41 | 1424.25 | 1471.5 | 458.15 | 36,890.31 |
| CEA | – | 0.88 | 0.06 | 0.02 | 0 | 1 |
| LCA Result | – | 1.04 | 5.56 | 9.09 | 10 | 0.91 |
| Category | EC (MJ) | GWP (kg) | HTP (g) | POCP (g) | AFP (g) | AP (g) | CEA | LCA Result |
|---|---|---|---|---|---|---|---|---|
| FCEV1 | 858,490.3 | 69,623.69 | 21,251.7 | 742.68 | 10,564.48 | 58,970.15 | 0.33 | 2.33 |
| FCEV2 | 781,717 | 63,844.51 | 19,825.23 | 522.14 | 9978.04 | 58,244.3 | 0.27 | 2.78 |
| FCEV3 | 870,637.1 | 26,099.14 | 20,548.05 | 769.47 | 10,670.6 | 59,798.06 | 0.24 | 2.56 |
| FCEV4 | 792,830.7 | 20,295.21 | 19,831.37 | 533.3 | 10,087.01 | 59,071.5 | 0.18 | 3.13 |
| FCEV5 | 695,752.3 | 44,139.88 | 17,167.09 | 1047.31 | 6587.33 | 50,963.7 | 0.26 | 3.23 |
| FCEV6 | 617,771 | 38,328.32 | 16,054.25 | 825.03 | 6001.86 | 50,260.95 | 0.2 | 4.17 |
| FCEV7 | 856,712.9 | 27,453.19 | 18,991.29 | 1297.37 | 7693.89 | 55,776.18 | 0.28 | 2.5 |
| FCEV8 | 778,938.9 | 21,681.32 | 19,771 | 1075.09 | 7112.22 | 55,057.04 | 0.23 | 2.94 |
| FCEV9 | 608,489.5 | 44,984.76 | 19,768.31 | 1213.62 | 8227.26 | 54,891.96 | 0.31 | 3.45 |
| FCEV10 | 631,827.2 | 39,175.75 | 19,438.42 | 990.73 | 7645.24 | 54,293.79 | 0.26 | 3.57 |
| FCEV11 | 617,772 | 18,580.76 | 3900.26 | 686.11 | 5418.39 | 43,312.45 | 0.09 | 5.56 |
| FCEV12 | 542,753.1 | 12,775.42 | 3496.44 | 463.84 | 4834.94 | 42,611.73 | 0.04 | 8.33 |
| FCEV13 | 858,490.3 | 18,009.19 | 3694.9 | 658.33 | 5307.24 | 44,283.33 | 0.08 | 3.33 |
| FCEV14 | 784,495 | 12,208.82 | 3279.23 | 436.05 | 4725.78 | 43,558.3 | 0.03 | 4.17 |
| FCEV15 | 840,034.2 | 15,553.26 | 2465.41 | 602.76 | 4890.48 | 39,640.95 | 0.06 | 3.57 |
| FCEV16 | 764,884.3 | 9747.2 | 2057.64 | 369.37 | 4301.46 | 38,945.35 | 0 | 4.76 |
| FCEV17 | 151,7970 | 102,919.4 | 73,705.68 | 1714.14 | 231,35.31 | 191,165.6 | 1 | 0.91 |
| FCEV18 | 1,435,185 | 97,058.02 | 73,374.18 | 1379.72 | 22,545.88 | 190,548.2 | 0.93 | 0.98 |
| ICEV | 1,095,552 | 79,631.04 | 22,778.57 | 1766.477 | 8180.757 | 71,262.75 | 0.49 | 1.59 |
| Parameters | Indicators | |||||||
|---|---|---|---|---|---|---|---|---|
| Hydrogen Production [0, 8] | Transport Method [0, 1] | Vehicle Lifetime [100,000, 500,000] | EC | GWP | HTP | POCP | AFP | AP |
| Indicators | Parameters | S1 | S1 Conf | ST | ST Conf |
|---|---|---|---|---|---|
| EC | Hydrogen Production | 0.4201 | 0.0242 | 0.4826 | 0.0208 |
| Transport Method | 0.0112 | 0.0034 | 0.0123 | 0.0005 | |
| Vehicle Lifetime | 0.5054 | 0.0215 | 0.5694 | 0.0261 | |
| GWP | Hydrogen Production | 0.7517 | 0.0283 | 0.8627 | 0.0309 |
| Transport Method | 0.0076 | 0.0026 | 0.0088 | 0.0004 | |
| Vehicle Lifetime | 0.1263 | 0.0152 | 0.2402 | 0.0125 | |
| HTP | Hydrogen Production | 0.8218 | 0.0464 | 0.9452 | 0.0368 |
| Transport Method | 0.0001 | 0.0003 | 0.0001 | 0 | |
| Vehicle Lifetime | 0.0545 | 0.0125 | 0.1768 | 0.0152 | |
| POCP | Hydrogen Production | 0.7213 | 0.0325 | 0.8292 | 0.0295 |
| Transport Method | 0.0146 | 0.0038 | 0.0161 | 0.0008 | |
| Vehicle Lifetime | 0.1562 | 0.016 | 0.2651 | 0.0174 | |
| AFP | Hydrogen Production | 0.7816 | 0.0424 | 0.8984 | 0.0351 |
| Transport Method | 0.0025 | 0.0018 | 0.0027 | 0.0002 | |
| Vehicle Lifetime | 0.0984 | 0.0135 | 0.2153 | 0.0146 | |
| AP | Hydrogen Production | 0.808 | 0.043 | 0.9293 | 0.0372 |
| Transport Method | 0.0024 | 0.0015 | 0.0026 | 0.0001 | |
| Vehicle Lifetime | 0.0683 | 0.0143 | 0.1886 | 0.015 |
Disclaimer/Publisher’s Note: The statements, opinions and data contained in all publications are solely those of the individual author(s) and contributor(s) and not of MDPI and/or the editor(s). MDPI and/or the editor(s) disclaim responsibility for any injury to people or property resulting from any ideas, methods, instructions or products referred to in the content. |
© 2025 by the authors. Licensee MDPI, Basel, Switzerland. This article is an open access article distributed under the terms and conditions of the Creative Commons Attribution (CC BY) license (https://creativecommons.org/licenses/by/4.0/).
Share and Cite
Lyu, R.; Wang, Z.; Zhang, Z. Life Cycle Assessment Based on Whole Industry Chain Assessment of FCEVs. Sustainability 2025, 17, 5431. https://doi.org/10.3390/su17125431
Lyu R, Wang Z, Zhang Z. Life Cycle Assessment Based on Whole Industry Chain Assessment of FCEVs. Sustainability. 2025; 17(12):5431. https://doi.org/10.3390/su17125431
Chicago/Turabian StyleLyu, Renzhi, Zhenpo Wang, and Zhaosheng Zhang. 2025. "Life Cycle Assessment Based on Whole Industry Chain Assessment of FCEVs" Sustainability 17, no. 12: 5431. https://doi.org/10.3390/su17125431
APA StyleLyu, R., Wang, Z., & Zhang, Z. (2025). Life Cycle Assessment Based on Whole Industry Chain Assessment of FCEVs. Sustainability, 17(12), 5431. https://doi.org/10.3390/su17125431