Article

Teaching and Learning About the Ecological Footprint to Primary School Students: A Vehicle for Achieving the 2030 SDGs

by
Nikolaos Galanis
1,*,
Alexandros Amprazis
2 and
Georgios Malandrakis
1
1
Department of Primary Education, Aristotle University of Thessaloniki, 54124 Thessaloniki, Greece
2
Department of Early Childhood Education, University of Western Macedonia, 53100 Florina, Greece
*
Author to whom correspondence should be addressed.
Sustainability 2025, 17(12), 5429; https://doi.org/10.3390/su17125429
Submission received: 27 March 2025 / Revised: 7 May 2025 / Accepted: 5 June 2025 / Published: 12 June 2025

Abstract

:
The educational value of the Ecological Footprint (EF) lies in its ability to facilitate the identification and quantification of individuals’ environmental impacts, stemming from their daily habits and lifestyles, while also supporting the achievement of the 2030 sustainability goals. This study aimed to enhance primary school students’ understanding of their EF through the implementation of specially designed educational materials based on the Greek online EF calculator. A 10 h teaching intervention (TI) on EF was designed and carried out with 112 primary school students aged 10–12 years. The effectiveness of the intervention was assessed using a specially developed questionnaire. The results showed a statistically significant increase in students’ scores from the pre-test to the post-test regarding their understanding of the EF concept. When each EF category was examined individually, the most statistically significant differences were recorded in the categories of Infrastructure/Housing, Goods/Services, and Waste. These findings suggest that primary school students’ understanding of the EF can be effectively improved through a well-structured teaching intervention. This conclusion holds value not only for education for sustainable development (ESD), but also more broadly, in an era where understanding and embracing sustainability is a top priority for all modern educational institutions.

1. Introduction

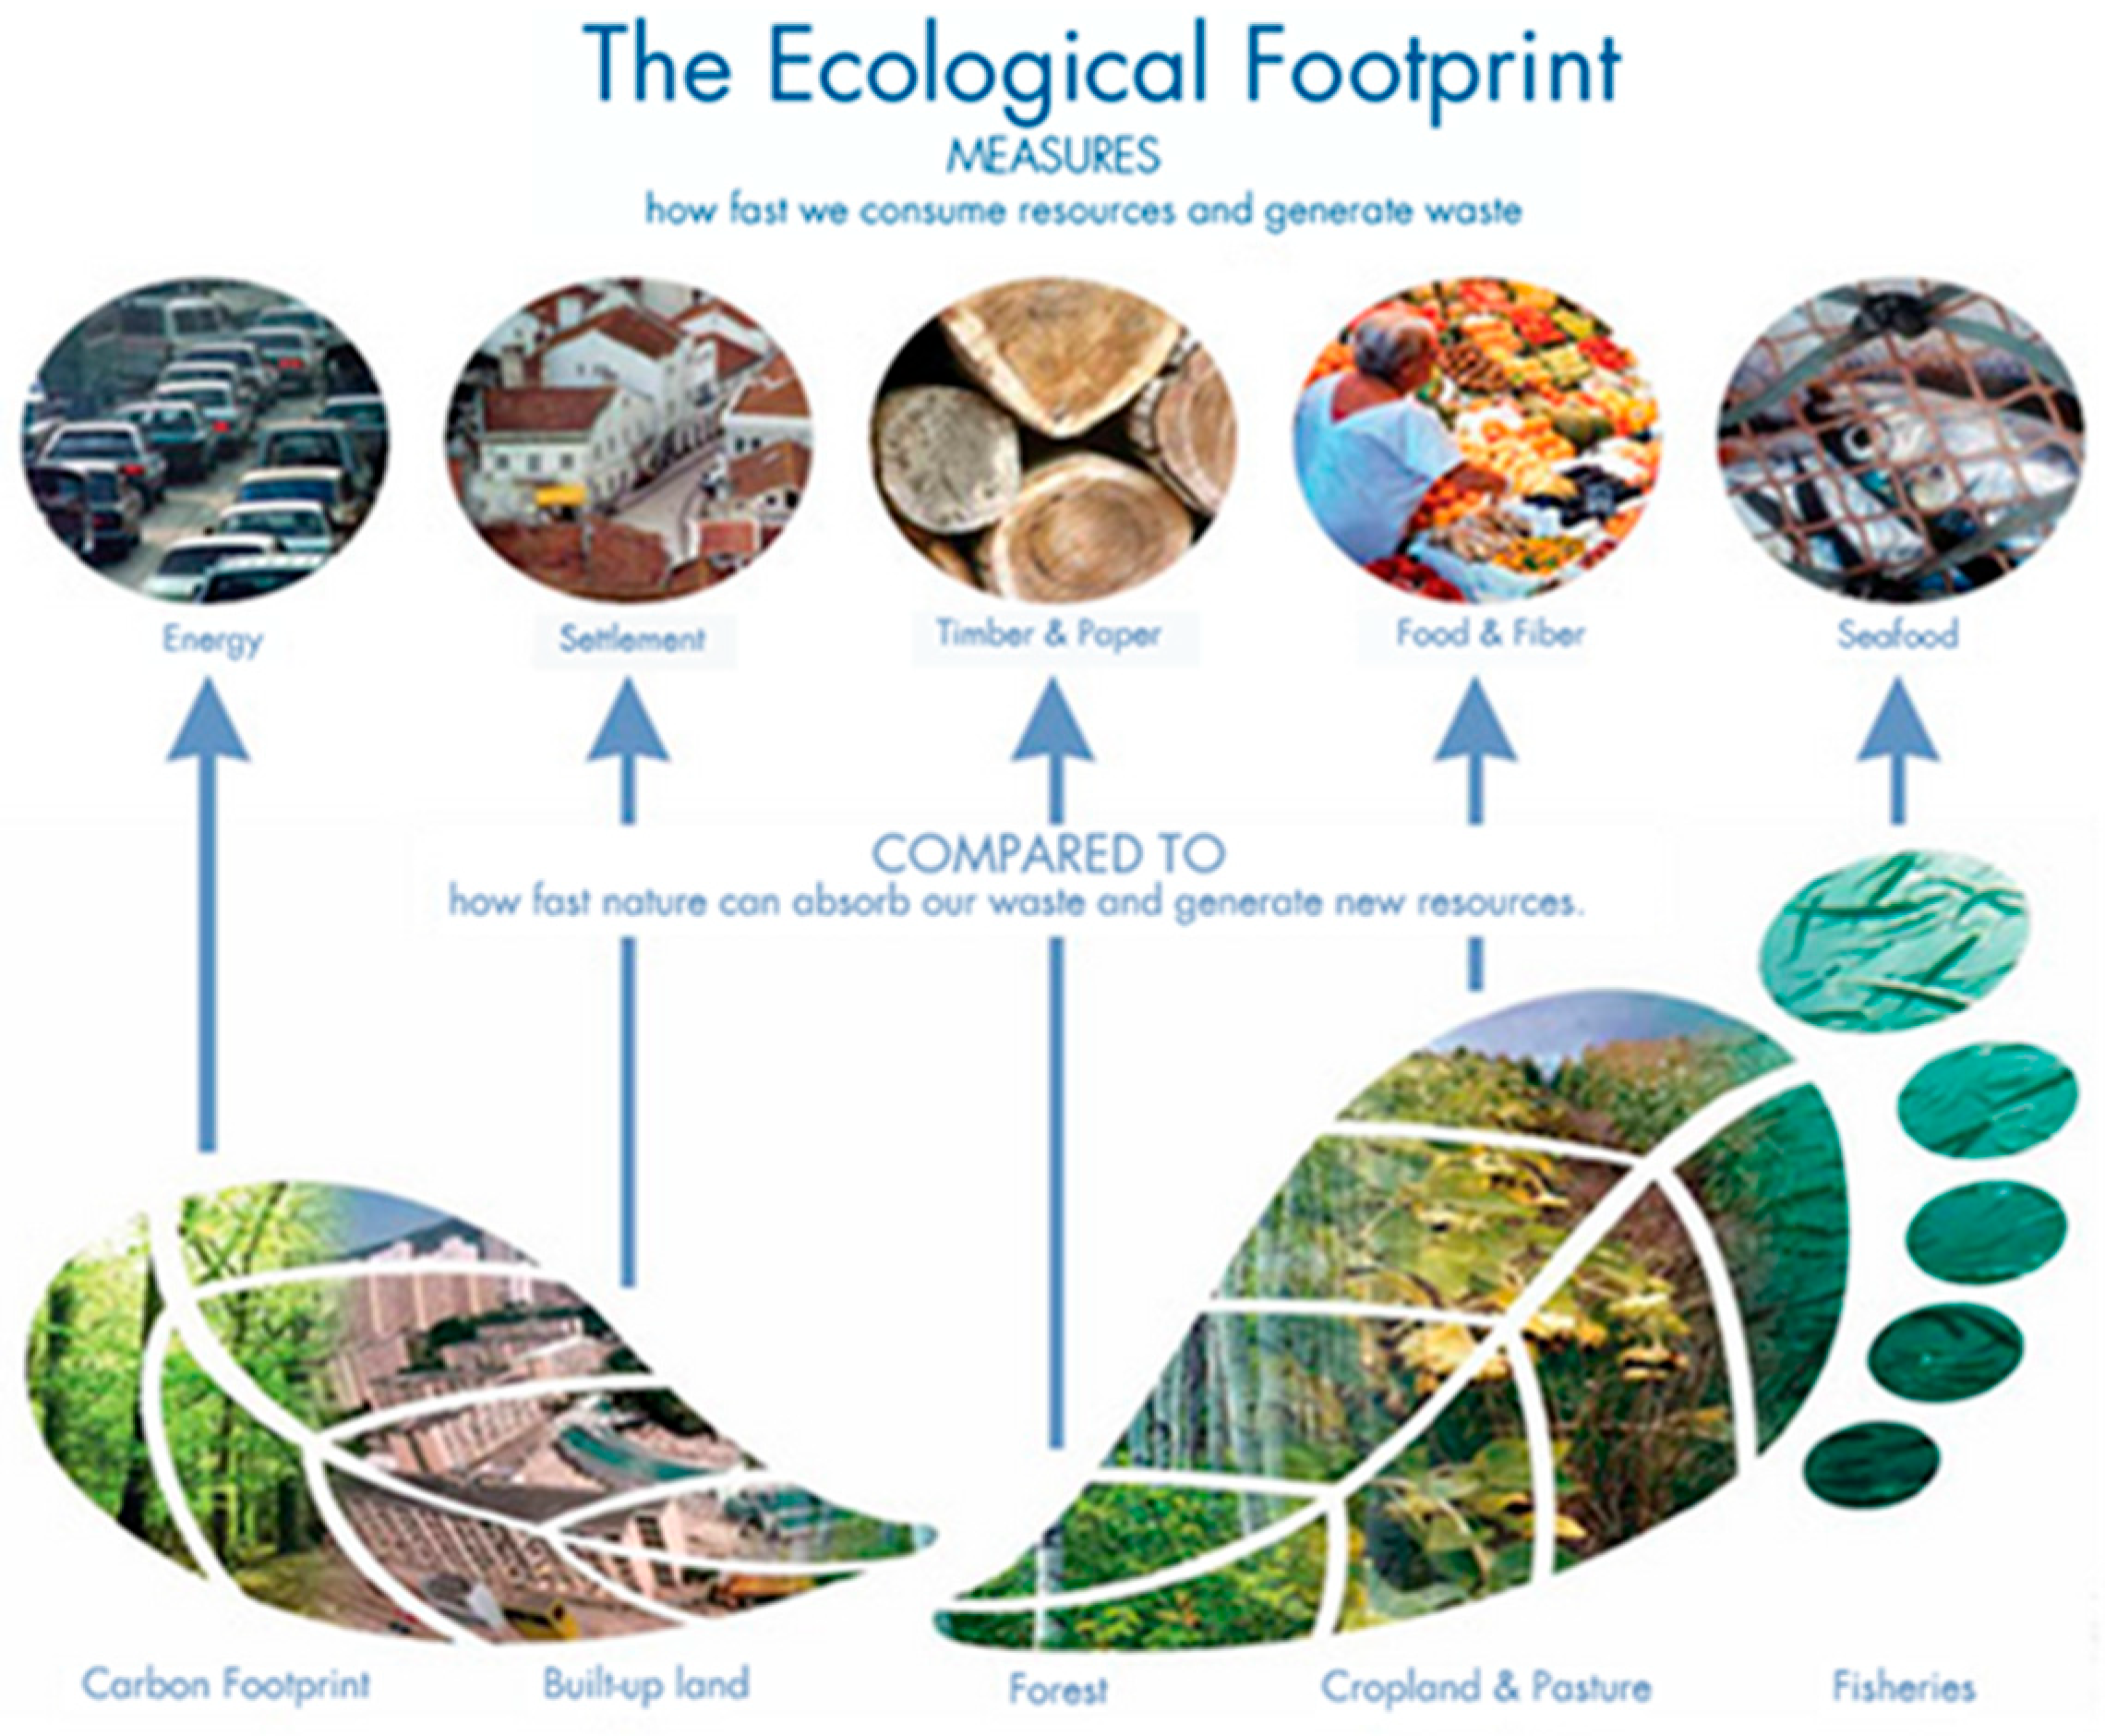
1.1. Concept of Ecological Footprint (EF)

The concept of the Ecological Footprint (EF) is crucial as it provides a comprehensive framework for assessing human impacts on the environment by directly linking everyday activities to environmental burdens [1]. EF is closely associated with sustainability, which comprises three interconnected pillars: environment, society, and economy [2]. Understanding sustainability in simple and concrete terms, such as those defined by the EF, enhances comprehension and establishes a common framework for action [3]. However, while EF offers a distinct perspective on certain aspects of sustainability, it does not encompass its full complexity [4]. Moreover, EF is identified as a powerful communication tool, facilitating the assessment of human impacts and informing environmental decision-making [5,6].
In the broader effort to promote sustainability, it is essential to leverage all available tools to enhance both outcomes and public understanding of why sustainability matters. In this context, the EF has emerged as a particularly valuable metric [7,8,9]. Fundamentally, the EF applies the principles of sustainability by quantifying human demand on Earth’s ecological resources and comparing it to the planet’s biocapacity. This approach highlights the extent to which current lifestyles are environmentally sustainable [10]. As a versatile tool, the EF is widely used to inform sustainable development policies at various levels—ranging from individuals to businesses and national governments—by assessing consumption patterns and their planetary impact [11]. Presented most at the national level, it compares a country’s consumption footprint with its biocapacity, with a deficit indicating ecological unsustainability [12,13]. This country-level framing is also more accessible for educational contexts, enhancing comprehension among students and the public. Moreover, the EF is not only informative but also adaptable, as it accounts for regional heterogeneity in sustainability performance [14]. This adaptability is especially important given critiques that global sustainability metrics often overlook inequalities between nations or tend to favor wealthier countries [15]. Ultimately, the EF provides a meaningful contribution toward the broader goal of fostering sustainable development for both present and future generations, in harmony with the biosphere [16,17].
EF is defined as the total area required to sustain an individual, region, city, country, or the global population by meeting resource consumption needs while accounting for the absorption of the waste produced [18]. This calculation is based on prevailing technology and resource management practices [19]. EF is typically measured in global hectares (gha) [19]. In 2022, Greece’s EF per capita was 3.78 gha, which is lower than the European average (4.65 gha) but significantly higher than the global average (2.58 gha) [20]. This value is also consistent with a similar survey conducted in 2021 among 574 Greek citizens, which reported an EF of 3.4 gha [21]. EF is distributed across six categories of productive land and water: cropland, pasture, forests, built-up land, fisheries, and carbon footprint. It encompasses five main categories of human resource consumption and associated waste generation: energy, housing and infrastructure, timber and paper, food and fiber, and seafood [22] (Figure 1).
By comparing EF per person across the six categories of productive land and water [20,21], we conclude that Greece must implement measures to reduce EF, and especially the carbon part of it (Table 1).

1.2. Previous Teaching Interventions of EF

Integrating the framework of EF into classrooms across all educational levels presents a valuable opportunity to foster rich and immersive learning experiences. Educational interventions can either utilize EF as an assessment tool [23,24] or introduce it as a critical educational asset aimed at raising awareness and promoting sustainable thinking [25,26]. The concept of the EF holds significant educational value, as it provides students with accessible quantitative data to understand, evaluate, and critically reflect on the environmental consequences of their daily behaviors [27]. This approach enables learners to recognize the tangible connection between individual lifestyle choices and broader sustainability challenges. As a result, students are more likely to engage in self-directed efforts to design, implement, and evaluate actions that reduce their ecological impact—motivated intrinsically rather than through external enforcement or instruction [28]. The EF has proven to be an effective tool for monitoring and evaluating environmentally relevant behaviors, even among science and technology students [29], who might be assumed to already possess an awareness of their environmental impact. Beyond raising general environmental awareness, the integration of the EF within educational institutions can support specific objectives, such as addressing climate change [30] and fostering more responsible consumer behavior [31]. Ultimately, the incorporation of EF-based teaching interventions (TI) has the potential not only to influence individual students, but also to stimulate broader organizational change within the institution [32].
The educational value of EF lies in its ability to facilitate the identification and quantification of individuals’ environmental impacts due to their daily habits and lifestyles, such as travel patterns, dietary choices, and consumption behaviors [33]. One of the most significant findings from research on the educational applications of EF is its effectiveness as a tool to foster pro-environmental behavior [34]. In this context, EF contributes in achieving a key objective of education for sustainable development: mitigating global EF [35]. A review of the relevant literature indicates that multiple studies have demonstrated EF’s effectiveness in promoting knowledge, attitudes, and behaviors associated with sustainable lifestyles [34,36]. Additionally, it has been shown to aid in identifying unsustainable practices among students and within educational institutions [37].
In summary, the literature review on EF primarily focuses on national-level assessments (e.g., [38]), city-level studies (e.g., [39]), and applications to university [36,40,41,42,43,44], secondary [34,44,45,46], and primary school students [47]. In the literature review of studies on the measurement of the EF of (a) universities and their students [30,36,40,41,42,43] (b) schools and their students [34,44,45,46,47] and (c) with corresponding TI on EF eleven (11) studies were identified. Six of them involve universities and their students [30,36,40,41,42,43], four studies involve schools and their secondary school students [34,44,45,46], and only one study involves schools and their primary school students [47]. In these eleven studies, the assessment of participants’ EF aimed to raise awareness of their individual EF and attempt to reduce it. The duration of these interventions ranged from 2 to 20 h, with a frequency of 1 h per week over a one-year period.
For instance, in a study with university students from three countries, where the EF methodology, along with the international online personal EF calculator, were used for the teaching of the 17 SDGs, it was realized that the 90% of the participants were “satisfied” or “very satisfied” with the module on EF, while the EF calculator received 92% of satisfaction [48]. Moreover, participants’ own assessed understanding gain, on all sustainability issues included, was above 82%, and especially for the SDGs was 90% [48]. In another study with Australian early childhood school students and the use of the EF methodology, authors stress that the particular approach may be an effective way to educating children on the links between the food they eat, land usage and environmental impact [47].
Moreover, some key common features from the studies with TI that aiming to reduce individual EF, are the following: (a) Assessment of students’ understanding of their own EF in comparison to the global average [30,34,36,40,41,42,43,44,46,47], (b) Calculation of school’s EF, including its distribution across its constituent categories, like food, products, services, and transportation [30,34,36,40,41,42,43,44,46,47], (c) Identification of student’s individual activities that mainly contribute to greenhouse gas emissions, with energy, food, and transportation to be the primary drivers [21,30,34,36,40,41,42,43,44,46,47], (d) Provision of students with hands-on experiences to enhance their understanding on the EF and its implications [30,34,36,43,46,47], (e) Encouragement of attitude and behavior changes among participating students [30,34,36,41,44,45,46,47].
In conclusion, although there are many studies related to EF, only a few of them include TI, and even less are focusing on the personal EF of primary school students.

1.3. Aim of the Study and Research Questions

The aim of this study was to promote primary school students’ understanding about their EF, through the use of properly developed educational material based on the Greek online EF calculator and the exploration of ways to reduce it. Regarding the understanding of EF, particular attention is given to the assessment of conceptual knowledge, focusing on six main categories of EF: food, infrastructure/housing, energy consumption, goods and services, waste, and transportation. Our goal was students’ realization of their burden to the environment, and their turn to more sustainable ways of living and reduced individual EF, which will be within the limits of one planet and will put into praxis the 2030 sustainability goals. Though, the research question that guided this study was as follows:
  • To what extent primary school students’ understanding of the EF concept can be enhanced following a relevant teaching intervention?
The originality of this study is based on the combination of the topic (EF), the approach adopted (use of EF calculator) and the age of the participants (primary school students). In particular, EF is related, directly or indirectly, to most of the aspects of sustainability and the respective 2030 SDGs. More specifically, it is directly linked to the environmental oriented SDGs, like Responsible consumption and production (SDG 12), Sustainable cities and communities (SDG 11), Climate action (SDG 13), Affordable and clean energy (SDG 7), Clean water and Sanitation (SDG 6), Life below water (SDG 14) and on Land (SDG 15). However, it is also indirectly related to the social and economic aspects of sustainability through, for example, the unequal distribution of natural resources among countries in a given period (intrageneration justice) and among generations (intergeneration justice). These indirect relations with social and economic aspects can easily be linked with several SDGs, like the Zero Poverty (SDG 1) and Hunger (SDG 2), Good health and wellbeing (SDG 3), Gender equality (SDG 5), Decent work and economic growth (SDG 8), Reduced inequalities (SDG 10), Industry, innovation and infrastructure (SDG 9), and Peace, justice and strong Institutions (SDG 17). Last, but not least in this study, the teaching of EF is closely related to Quality education (SDG 4) and especially the need to “ensure that all learners acquire the knowledge and skills needed to promote sustainable development” (Target 4.7). This is the case not only for the primary school students who were taught about the EF, but also for the undergraduate teachers who performed the teaching (Indicator 4.7.1c, see Section 2.1).
The use of the EF calculator is another innovative aspect of the study as it comprehensively illustrates participants’ individual demand for natural resources, and the extent to which this is within the regeneration capacities of the ecosystems. The age of the participants (10–12 years old) is also critical, as most of the existing studies focuses either to university or secondary school students and there is limited research on primary school students [47]. Even and in this case ([47]), researchers were focused on the EF of the students within their early learning center, and not on their overall EF.
The TI was informed by the scientific findings of this section, which guided the development of the corresponding instructional educational material. Beyond its overarching aim of fostering understanding of EF concept and promoting behavioral shifts toward more sustainable practices, specific sub-objectives were established to enhance its effectiveness. These include: (a) assessing the specific impact of the use of the Greek EF online calculator on students’ conceptual understanding, and (b) identifying potential changes in students’ attitudes toward sustainable consumption across all six EF categories.
Though, in order to address the above research question, the Greek online EF calculator and corresponding educational materials for primary school students, comprising ten teaching hours (outlined in Section 2.1), were developed and implemented.

2. Materials and Methods

2.1. Participants

Participants in this study were 112 primary school students (10–12 years old) from Grades 5 (47%) and 6 (53%) across three primary schools of Thessaloniki metropolitan area, Greece. Additionally, 54% of the participants were girls, and 46% were boys. None of the students had previously been taught the concept of EF, as the topic it is not included in the obligatory Greek Curricula for Primary Schools, and only exists as an option in the “Skills Workshops” activities. The teachers who implemented the TI were 4th year undergraduate primary school teachers (last year of their study), as part of their teaching practice and other academic obligations, within the framework of an advanced university sustainability education course. In each class of primary school, students were assigned a group of three undergraduate teachers who were rotating (in every session) in the teaching of the EF until its completion. In the same university course, and prior to teaching, the undergraduate teachers had been further educated on the EF topic, and they had been familiarized with the educational material during routine university meetings, while during their teaching they also receive regular (weekly) feedback and guidance if needed. They had also successfully accomplished, in the earlier years of their studies, at least one more university course on the fundamentals of sustainability education (principles, methods, pedagogies). Based on the above, the senior undergraduate teachers were considered sufficiently capable to teach such topics to primary school students.

2.2. Procedures

Teaching interventions lasted 10 teaching hours (10 × 45′) in a period of 4 weeks (2–3 h per week), took place between April and November 2023 and was implemented as part of the school curricula regarding Skills Workshop titled “Caring for the Environment” [49]. For the intervention, the educational material (module) titled “How Much Do I Affect the Environment: How Many Planets Do I Need to Live?” was implemented, which are mainly based on the use of the Greek online EF calculator. An overview of the topics and activities included in the teaching intervention is provided in Table 2. Furthermore, a purpose-designed questionnaire was employed as the research instrument for evaluating the TI. At the regular administration of the questionnaire, all participants received standardized instructions for its completion, and the teachers were available to provide guidance and clarifications if needed. The mean completion time was approximately 20–25 min, and all students filled the questionnaire in a paper and pencil format during routine classes. They were assured about their anonymity and that their school achievement will not be affected by their participation to the study.

2.3. Instruments

The research employed a quasi-experimental pre/post research design, with no control group. Participants’ learning gain was assessed using a specifically developed questionnaire comprising 18 items, 12 of which were closed-ended, and 6 were open-ended. The items were organized into six thematic areas, each one corresponding to an EF framework main categories: food, infrastructure/housing, energy consumption, goods and services, waste, and transportation [22] (Appendix A). One more section, regarding students’ demographics, was at the beginning of the questionnaire (i.e., School and Grade of study, gender, date of birth, and date of questionnaire filling).
In each thematic area the primary question was: “In your opinion, what impact does each of the following have on the environment?”, followed by two (2) closed-ended statements, relevant to the thematic area under focus, and one (1) open-ended question. The latter was asking participants to justify their response to the final closed-ended statement within the particular thematic area, aiming to elicit a qualitative aspect of their understanding (Figure 2). Students were asked to indicate whether each statement affected the environment negatively (by increasing the EF) or positively (by decreasing the EF). The order of these “negative” and “positive” statements was randomized within each thematic category. An additional response option, “I do not know,” was also available. Regarding the open-ended questions, half required participants to justify a negative impact on the environment (i.e., an increased EF), while the other half asked them to justify a positive impact (i.e., a decreased EF). The order of these open-ended questions was alternated systematically, with one prompt requesting a justification for a negative impact followed by one for a positive impact.
In developing the questionnaire, the established literature on the main stages of questionnaire construction was taken into consideration [50]. Initially, a literature review was conducted focusing on the theoretical framework of EF, its categories, and relevant research on teaching interventions related to EF. To ensure content validity, the questionnaire was subsequently reviewed by three academics with expertise in EF and its pedagogy. Furthermore, to assess the appropriateness of the language and concepts in relation to the students’ grade level, the instrument was evaluated by three primary school teachers with experience in environmental education. A pilot study was then conducted with students of the target age group to examine the clarity (face validity), readability, and comprehensibility of the questionnaire items, which led to the implementation of minor revisions. Throughout these stages, additional refinements were made to vocabulary, conceptual clarity, and syntactic structure to ensure the highest possible quality of the final questionnaire.

2.4. Data Analysis

The assessment of students’ learning gain was conducted internally, by comparing their responses before and after intervention on the questionnaire (pre- and post-test). Specifically, the evaluation involved the analysis of differences between students’ initial and final responses, to both closed- and open-ended items, aiming to assess changes in their conceptual understanding of the topic. Gender and date of birth data were served to ensure the matching of pre- and post-assessment questionnaires for each student.
For data analysis, all students’ responses were entered into Microsoft Excel (version 2402), where lines corresponded to students (1 line/student) and columns to questionnaire items. Individual student information, including participant coding number, gender, and date of birth, along with his/her responses to the questionnaire before and after the TI, were entered in the same line, but in consecutive columns. To facilitate comparison, responses to each question, before and after the TI, were entered in adjacent columns (e.g., Column C: Food-Question 1-BEFORE TI, Column D: Food-Question 1-AFTER TI).
For the closed-ended statements, the following coding took place: 0= Incorrect or “Don’t know “ response, 1= Correct response. Based on this coding scheme, for each student, a mean score and a mean percentage achievement score was calculated in each question (0 or 1 and 0% or 100%) and in each of the six EF thematic areas (range 0–2 and 0%–100%), both before and after the TI. In addition, aggregated total scores (12 items, range 0–24) and total achievement percentage scores (0%–100%) were calculated and used to generate the corresponding visual representations (Figure 3 and Figure 4). In such coding, higher scores indicate better students’ understanding about everyday actions and habits that either decrease or increase each of the six EF categories and the overall EF. Though, these scores can be served as a reliable measure of students’ understanding about the EF and the human burden on the environment.
In addition to descriptive statistics, students’ scores were analyzed using significance testing to examine potential differences in their learning outcomes following intervention, employing SPSS software (version 28.00). More specifically, the normality of the data was assessed using Q-Q plots. Visual inspection of the Q-Q plots for all students’ EF scores and for the independent variable of gender, indicated that the data were approximately normally distributed, as the points closely followed the diagonal reference line. Given this, along with the interval scale of measurement of students’ scores (both total and per thematic area), and the relatively large number of participants (N = 112), the parametric paired-sample t-test was considered as appropriate for comparing the means of pre- and post-test EF scores. For the examination of whether there were statistically significant differences in students’ EF scores based on gender, the parametric t-test for independent samples was adopted.
Regarding the open-ended questions, where students had to explain and justify their answers, a qualitative analysis was conducted [51]. Students’ responses were collected and systematically organized. Initial codes were generated, and the data were repeatedly reviewed and regrouped until recurring themes and patterns emerged [52]. To enhance the reliability of the analysis, a second coder independently categorized all students’ answers, and the results were subsequently discussed. The inter-coder agreement rate exceeded 80%, and in the case of discrepancies discussions between the two coders took place until a full consensus was reached (Table 3). The first and the second authors were the main coders, while the 3rd author served as referee In the case of complete disagreement.

3. Results

3.1. Descriptive Statistics

The results are organized into two sections: those related to closed-ended statements and those related to open-ended questions. Regarding the first (closed-form statements), the mean achievement percentage score for the total EF (sum of all six EF categories) increased from 56% to 65% following the TI (Figure 3).
In particular, in all six individual EF categories an increase in the mean achievement percentage scores of students was exhibited, ranging from 5% (Food) to 17% (Housing) (Figure 4). More specifically, the “Infrastructure/Housing” category exhibited the most significant increase, rising from 57% to 74% (+17%), followed by the “Goods/Services” (from 63% to 75%) and “Waste” categories (from 65% to 77%), each of which increased by 12%. Likewise, the “Transportation” category presented an increase of 11% (from 71% to 82%), while the “Energy” category experienced a small increase of 8%, rising from 65% to 73%, and the “Food” category an even smaller increase of 5% (from 73% before the TI to 78% it) (Figure 4).
Table 3 presents the results of the content analysis (open-ended questions), which explores students’ justifications for their responses to the closed-ended questions about whether specific actions increase or decrease the EF. The table highlights the primary recurring themes found in students’ explanations, both for correct and incorrect responses. In some categories, such as Waste, correct answers were more frequent, which is reflected in the dominance of themes aligned with accurate reasoning. In contrast, in categories like Transportation, most responses were incorrect, and the recurring themes in students’ justifications correspond predominantly to these misconceptions. It is also worth noting that certain recurring themes appeared consistently in both the pre-and post-tests. For example, the idea that “eating meat is good for humans”—a theme found within the Food category—indicates persistent core ideas among students regarding factors influencing the EF.

3.2. Significance Testing

Paired-sample t-test results showed a significant increase in students’ scores from pre-test (M =7.85, SD =3.02) to post-test (M =9.17, SD =2.51) [t (111)=−5.107, p < 0.001, Table 4]. When analyzing each EF category independently, statistically significant increases were observed in five out of the six of them, and only in the ‘’Food” category the recorded increase was not significant.
Independent-samples t-tests were conducted to compare pre-test and post-test EF scores between boys and girls. In the pre-test, girls (M = 8.57, SD = 2.53) had significantly higher scores than boys [(M = 6.98, SD = 3.35), t (110) = −2.867, p = 0.005]. However, in the post-test, the difference between boys (M = 8.75, SD = 2.95) and girls (M = 9.52, SD = 2.04) was not statistically significant [t (110) = −1.646, p = 0.103]. These results indicate that while there was a statistically significant difference in pre-test scores between boys and girls, this difference was no longer present in the post-test.

4. Discussion

Students’ learning progression on the EF concept was assessed using a structured questionnaire, and data analysis revealed an average gain of 9.5% across the six EF categories. These findings indicate that, with the support of the educational material and the corresponding TI, students demonstrated an improved comprehension of EF, as reflected in the increased gain learning across all six categories. The importance of these six EF categories in understanding environmental issues is well documented in the literature [34,36,41,43,44,45,46,47,53]. However, even though students presented a significant improvement to their understanding, most of their final scores remain below 80%. We consider that this is mainly due to the difficulty level of the very same EF concept, the large number of EF categories and subcategories that it includes and studied, and the time allocated. Notable exception emerged that merit further examination. Specifically, the “Diet” category did not show statistically significant gains, and qualitative data revealed the persistence of certain misconceptions—such as the belief that “eating meat is good for humans”—in both pre-and post-test responses. These findings indicate that while the intervention successfully enhanced understanding in several areas, it may have been less effective in influencing complex, culturally embedded conceptions such as dietary habits. This reinforces the notion that certain domains, particularly those tied to personal values and lifestyle, may require deeper and more nuanced educational approaches to foster meaningful conceptual change.
Based on these EF categories, scientific literature proposes corresponding measures to enhance students’ ability to effectively address each category. Specifically, prior research suggests measures related to food [41,44,46,47,53], infrastructure and housing [36,47], energy consumption [34,41], goods and services [44,46], waste management [43,45], and transportation [36,43,44,45,46,47]. For instance, recent studies emphasize the substantial impact of resource consumption, particularly within the food and transportation categories, on individual environmental impacts [54]. Moreover, a cross-sectional study identified a positive association between awareness of EF reduction behaviors and adherence to a Mediterranean diet, as well as the selection of climate-friendly foods [53].
Regarding students’ justifications on the ways that various actions and habits affect EF, several noteworthy conclusions emerged. More specifically, students, after TI, provided more specific explanations, and abandoned their general and abstract initial justifications. For example, in the “Food” category, they progressed from a general explanation like “animals are dying”, to a more precise reasoning, recognizing that animals are not only dying, but are “threatened with extinction”. Similarly, in the “Waste” category, their reasoning evolved from the broad statement “less environmental pollution” to identifying a specific cause, stating that “factories work less”.
Another pattern we recorded in the “Energy” category after the teaching intervention was a general shift from the earlier emphasis on “electricity saving” toward a broader understanding of “energy saving.” This change did not occur within the same individuals, but reflects a shift in the overall responses, suggesting that the earlier pattern of isolating electricity is no longer prominent. This evolution in reasoning also highlights the economic dimension of the issue, as discussions on energy costs are prevalent in Greek households due to ongoing economic challenges (Example: Energy consumption is strongly associated with economic factors [55], particularly income level, which plays a crucial role in the adoption of conservation measures and the likelihood of experiencing fuel poverty [56].
A third main point is that already established dietary students’ habits are difficult to be changed. This is apparent to the EF category of “Food” and the meat consumption, as students both before and after the TI maintained the reasoning that “meat is good for humans” in order to justify their wrong perception that its consumption positively affects the environment. This finding underscores the influence of modern Greek food consumption trends in shaping dietary choices that deviate a lot from the sustainable and healthy mediterranean nutrition, and cause serious health issues, with the country having among the top overweight and obese populations of adults and children in Europe (see, https://data.worldobesity.org/country/greece-80/, accessed on 26 March 2025, and this paper https://www.mdpi.com/2072-6643/12/9/2858, accessed on 26 March 2025).
A final, fourth conclusion Is that In the “Transport” category, the social dimension of the issue was evident. Both before and after the TI, students expressed concerns that traveling by bus is perceived as dangerous due to “the risk of disease dissemination”. This perception may be developed by their early childhood experiences, and particularly during the COVID-19 pandemic, where strong social distance measures had been implemented, especially in schools and in public transportation, and the ways in which the virus is spread was dominated in the public discussions.

5. Conclusions

The primary objective of this study was to assess the extent to which primary school students’ understanding of the concept of EF could be enhanced through proper teaching intervention. To this end, an educational module was developed and implemented, along with the GFN-based Greek online EF Calculator. Students’ learning progression on the topic was assessed using a structured questionnaire, and data analysis revealed an average gain of 9.5% across the six EF categories. Students’ learning progression on the topic was evaluated using a structured questionnaire, and the data analysis indicated an improvement in their understanding of the EF concept.
In respect of the limitations of the study, the primary one is the inclusion of students exclusively from primary schools in North Greece. It is recommended that the research should be extended to additional schools and geographic regions, including rural ones, where students may have a better understanding of the human–nature relationship. A second limitation is the availability of time, due the suffocating school daily schedule. In the present study we intentionally limited teaching to 10 teaching hours, as this is the time that a regular teacher usually can allocate for the teaching of “Skills Workshops” activities. Subsequently, our latent intention was to examine what can be learned in such time frame. Furthermore, several methodological limitations may have contributed to the observed gaps in learning outcomes. The intervention was of relatively short duration, which may not have provided sufficient time to challenge or transform well rooted beliefs, especially in cognitively and emotionally charged topics like food consumption. Additionally, some questionnaire items may have been subject to response bias, either due to their phrasing or their susceptibility to socially desirable answering patterns. These factors may have affected the internal validity of the findings. However, the sample size and its composition may limit the generalizability of the results to broader populations. These limitations underscore the need for cautious interpretation and signal the importance of refined methodological strategies in future work.
Future research should consider implementing longer-term and more immersive interventions that allow for greater engagement with complex sustainability topics, particularly those involving lifestyle and consumption. Integrating more interactive and reflective activities—such as structured debates, personal goal-setting, or longitudinal tracking of behavioral intentions—could enhance conceptual retention and personal relevance. Additionally, improving the design of research instruments to minimize response bias and better capture nuanced understanding will be critical. Expanding the sample to include a more diverse and representative population will also enhance the robustness and applicability of future findings. In particular, future interventions may need to spend more time on activities relating EF categories with students’ everyday habits and actions. A reflection of this relatively low progress and of the conceptual difficulties that students may face is the “Food” category, where their scores increased only 5%, which is non-significant progress. Students were collecting data about their daily nutrition for a whole week, but it seems that more emphasis needs to be paid in the ways that their food affects the environment. This is critical since food, along with transportation, are the main drivers of EF (see https://www.nature.com/articles/s43016-023-00843-5#Fig1, accessed on 26 March 2025).
Conclusively, findings are encouraging regarding the teaching of EF in primary school and the link, through the EF calculator, of students’ individual habits and patterns of living with their impact on the environment. However, emphasis should be given in the ways that our actions affect our EF and the environment. Furthermore, the observed gains in students’ understanding and awareness of the EF may serve as a critical first step in fostering sustainable behavior. According to transformative learning theory and sustainability education literature [57,58], cognitive engagement and conceptual understanding are essential precursors to long-term behavioral change. While our study did not assess such outcomes directly, the improved justifications and broadened perspectives we recorded can be interpreted as foundational elements that, if reinforced through continued engagement, may lead to more ecologically responsible practices over time.

Author Contributions

Investigation, N.G., A.A. and G.M. All authors have read and agreed to the published version of the manuscript.

Funding

This research received no external funding.

Institutional Review Board Statement

Students from Departments of Education in Greece have, by Law, access to schools for their practice and there is no need to take any other special permission. Teaching and research was conducted within the framework of students’ regular and obligatory school practice. No special authorisation or approval is needed from the Ethics Committee.

Informed Consent Statement

Collected data were anonymous and took place through regular class meetings, as part of children’s routine classwork, and as part of the regular assessment of their learning gain on the topic. Parents of students are aware of the regular teaching practice that takes place in the schools and they do not interfere or participate to its implementation and organization.

Data Availability Statement

Data are contained within the article.

Conflicts of Interest
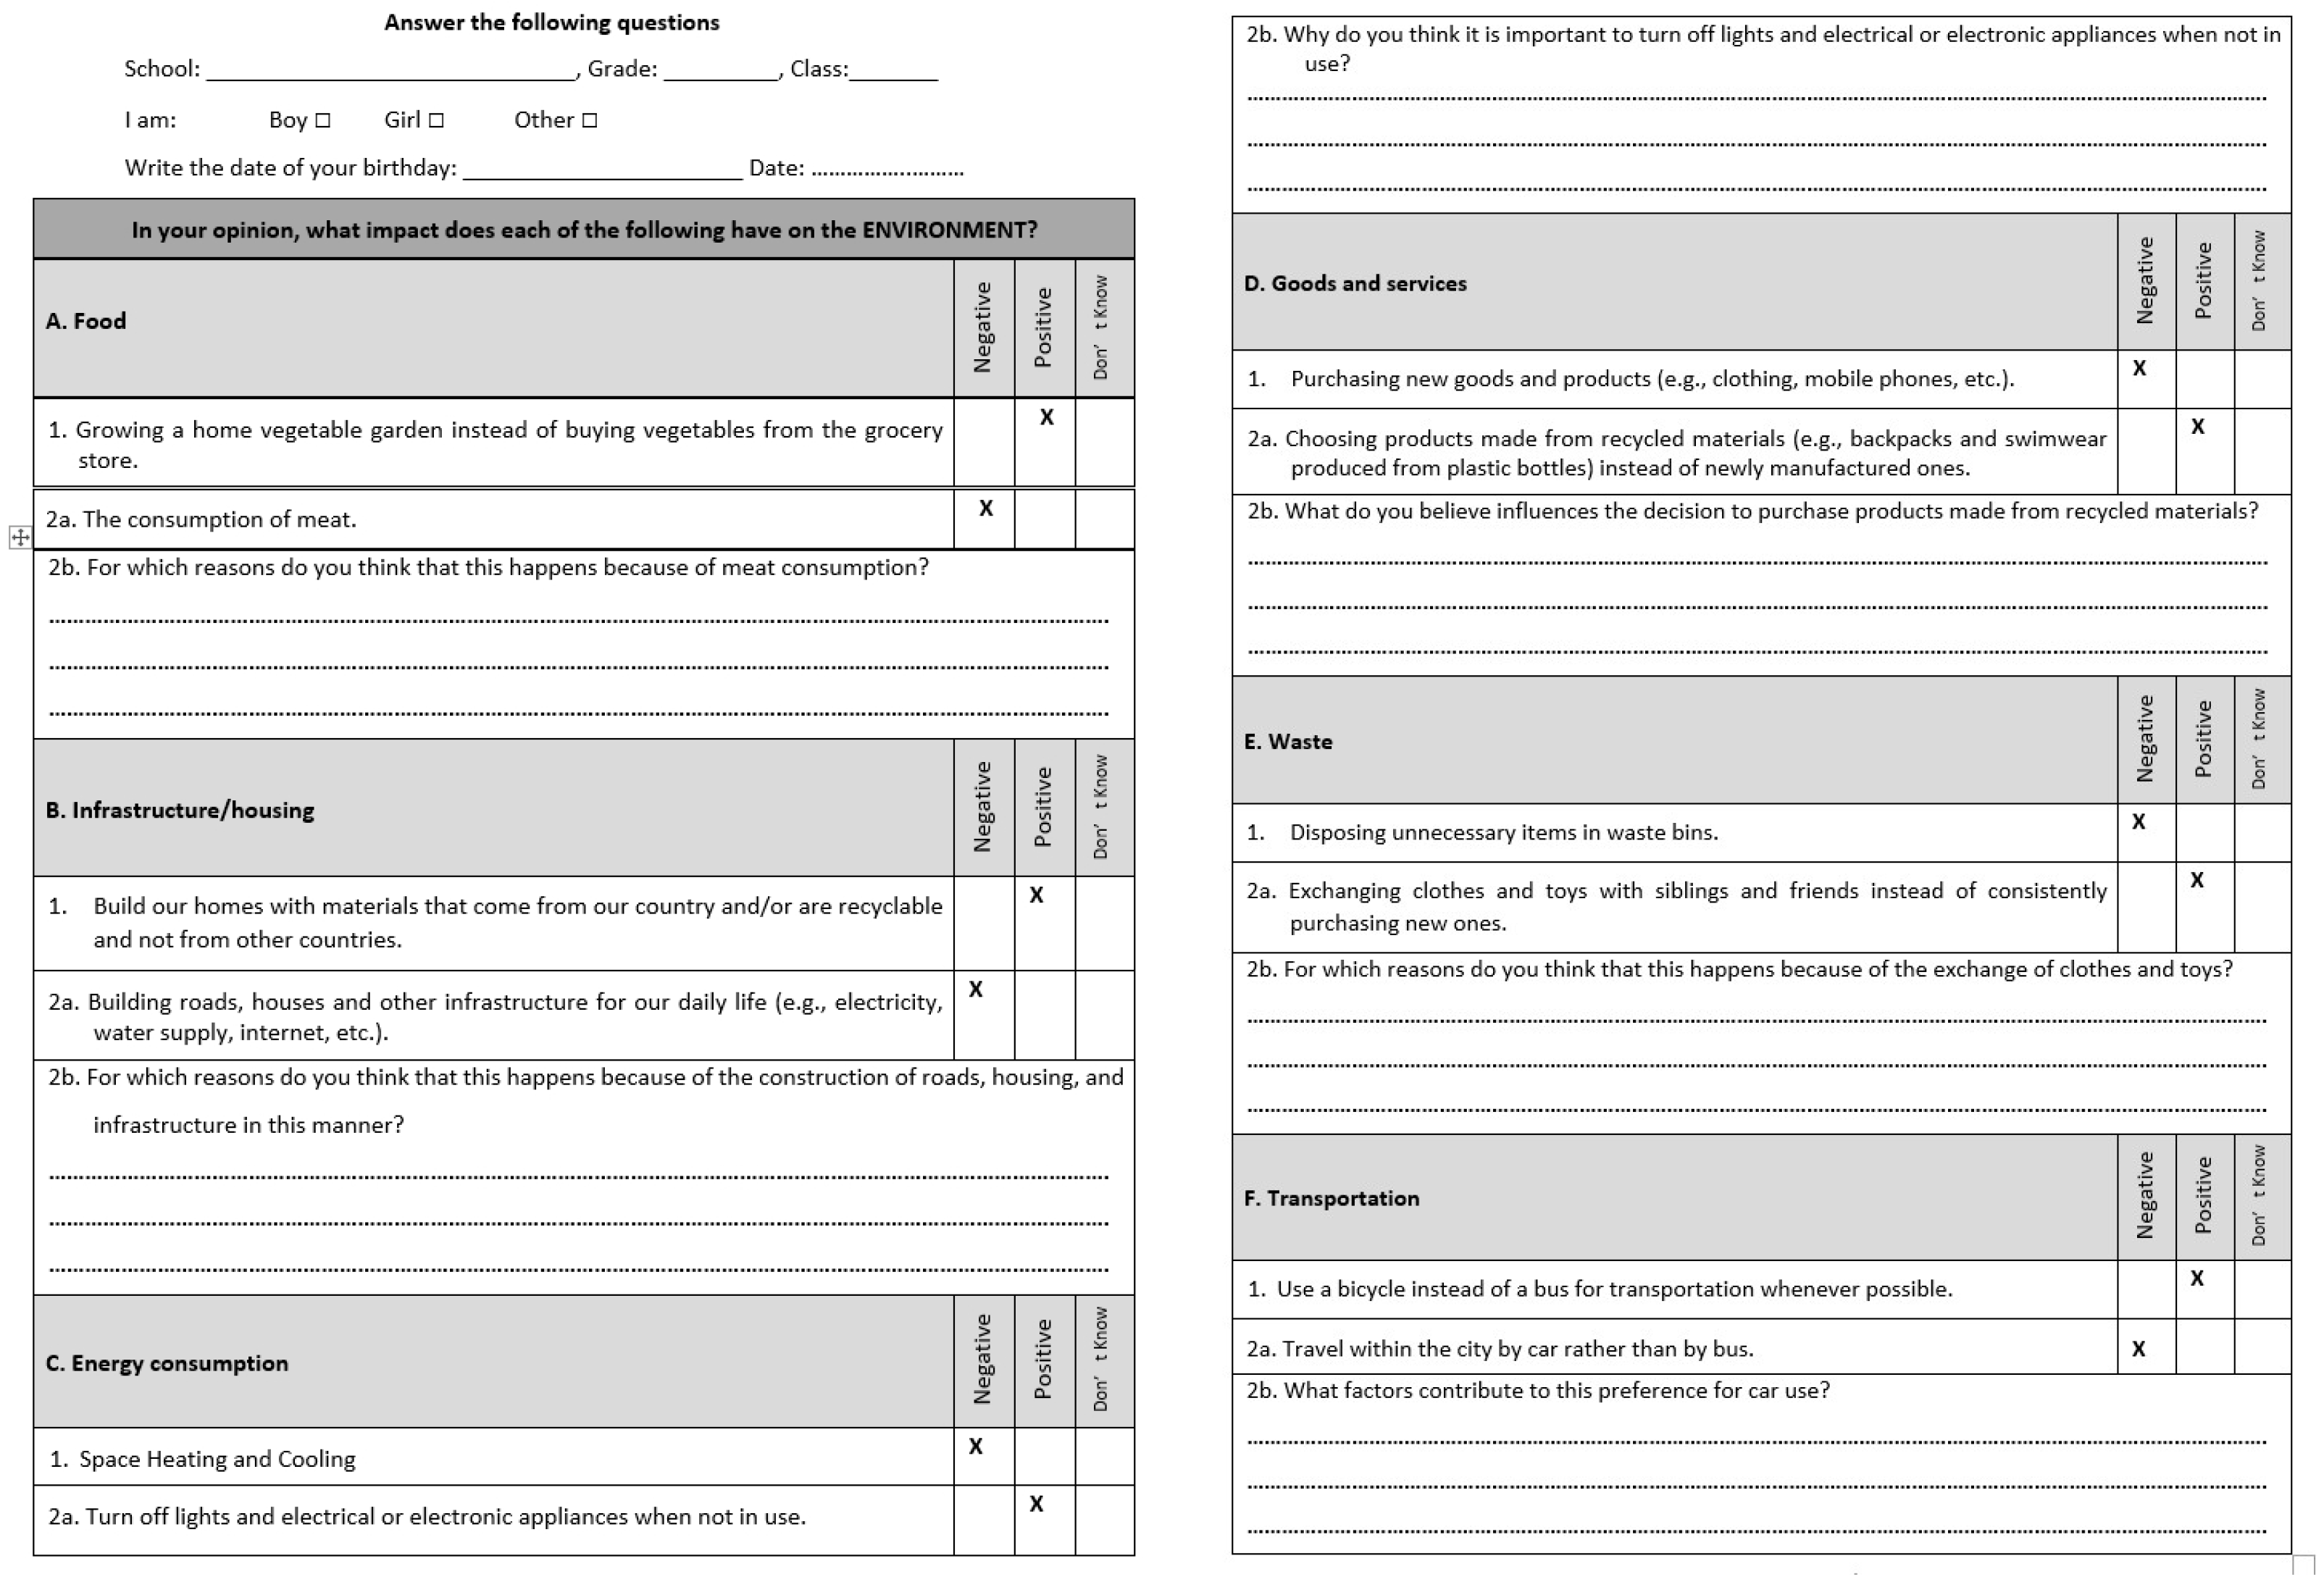
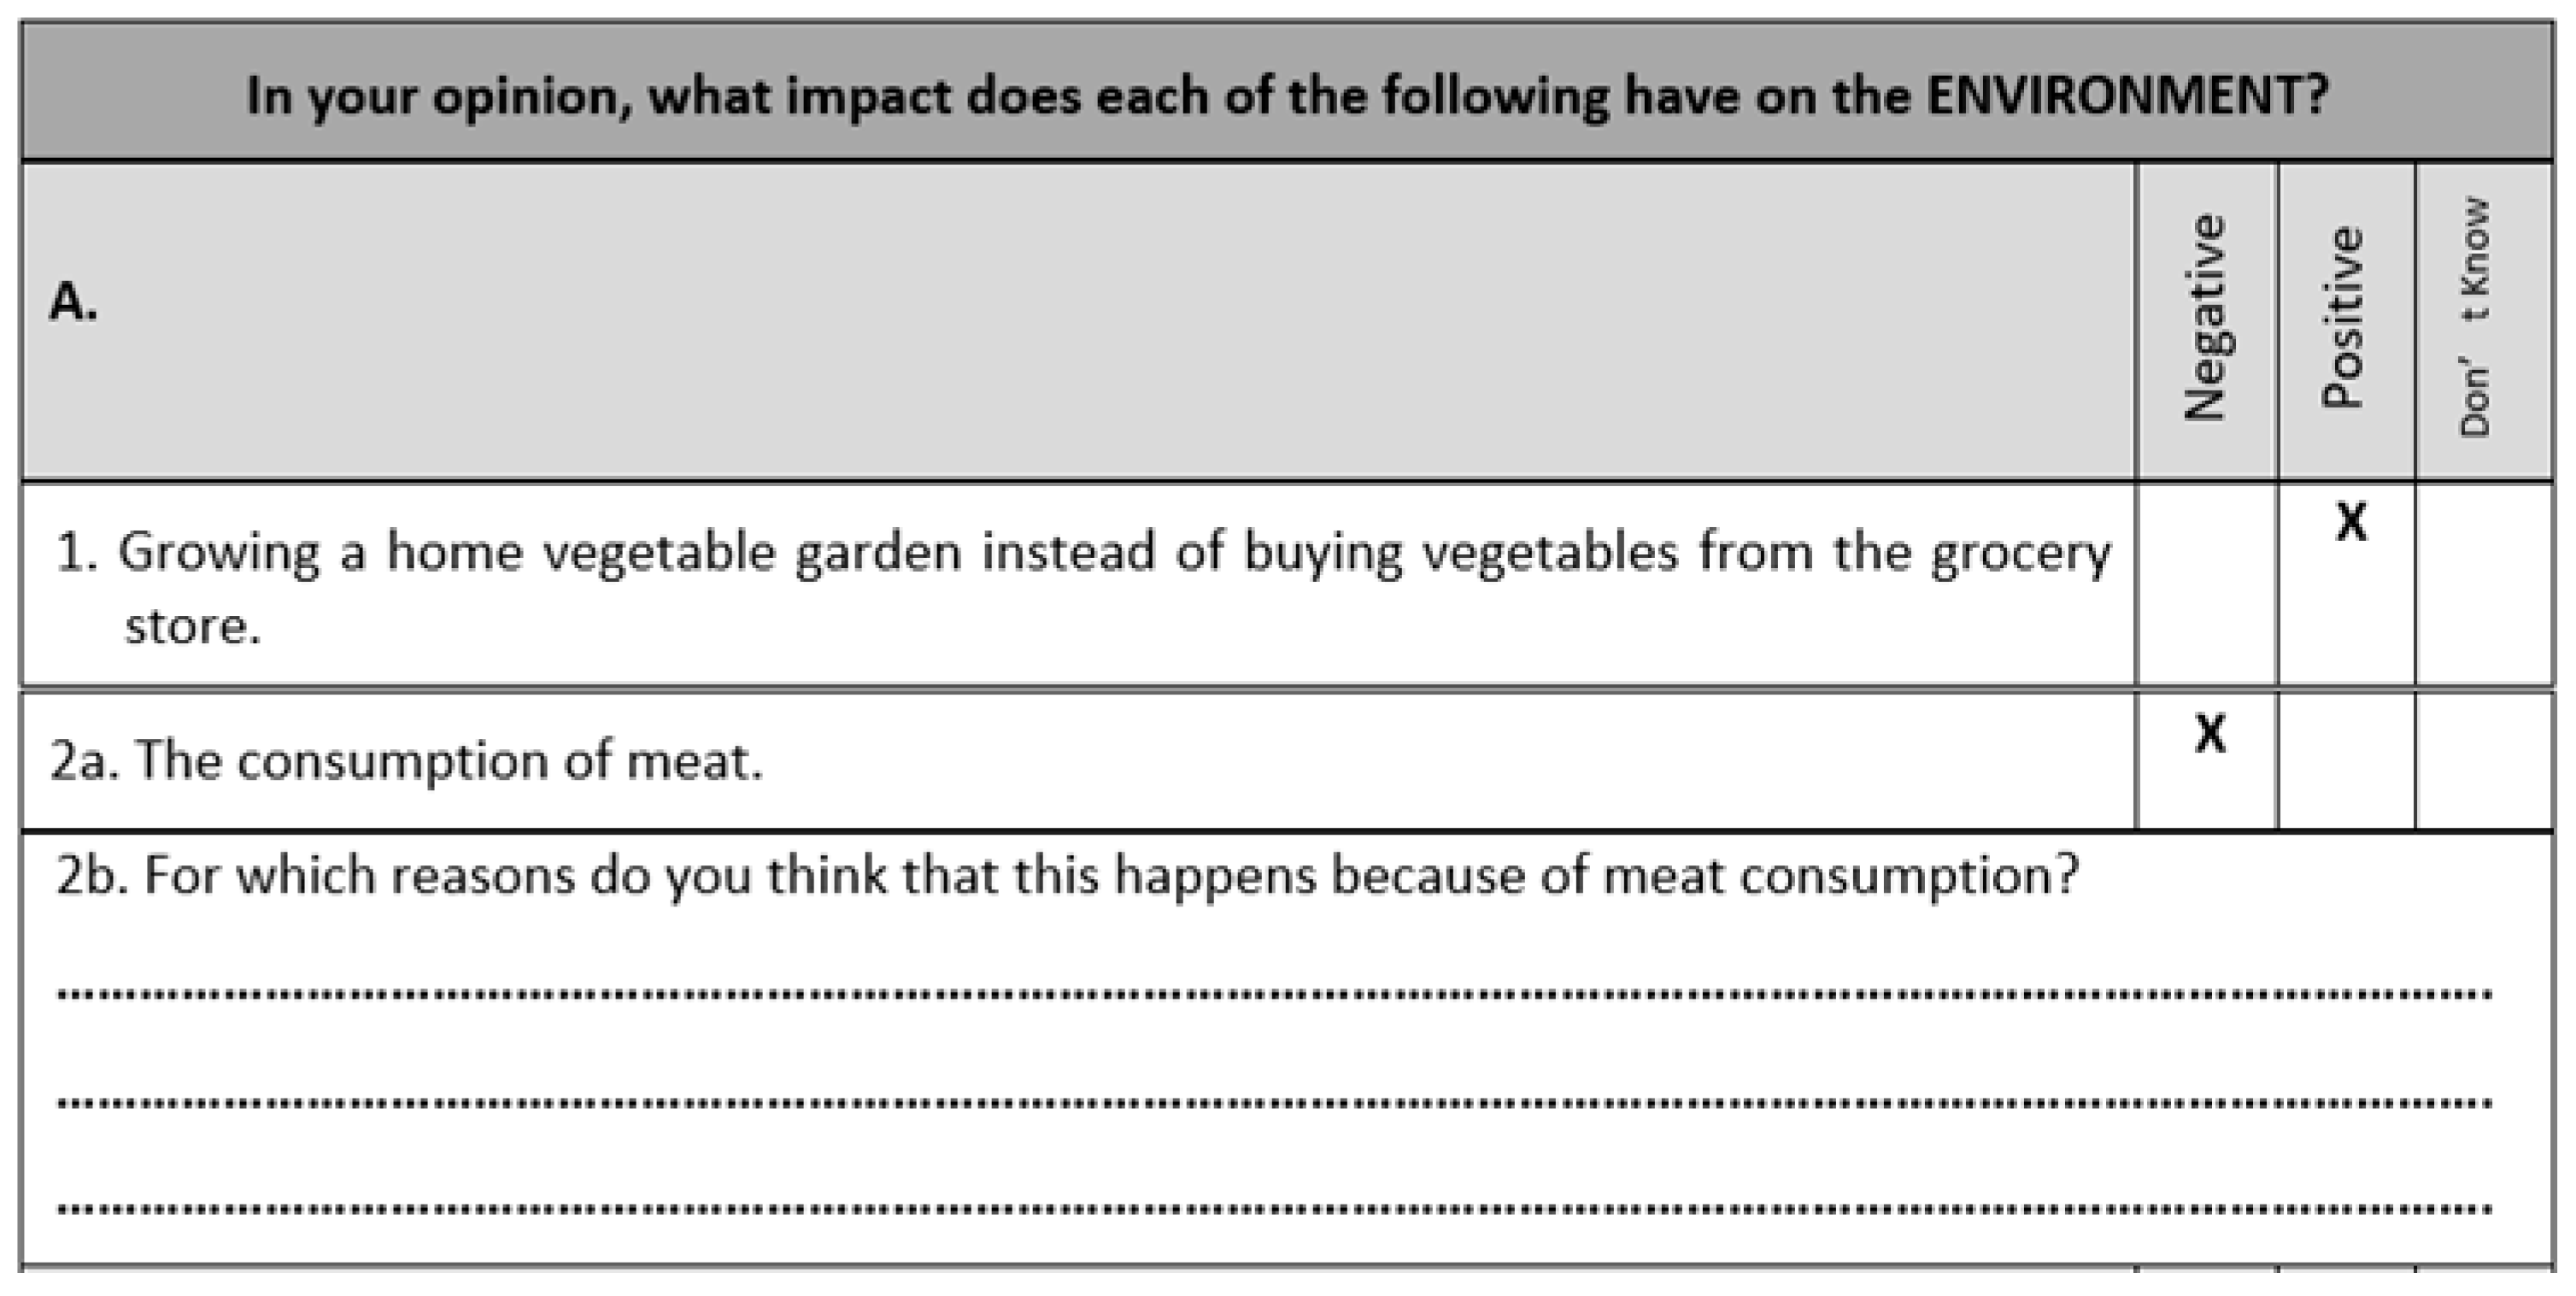
The authors declare no conflict of interest.

Appendix A

Figure A1. The research tool- questionnaire with correct answers.
Sustainability 17 05429 g0a1

References

  1. GFN (Global Footprint Network). Footprint Futures—A Teaching Module on Human Dependence on the Biosphere 2016. Available online: https://www.footprintnetwork.org/2016/05/01/footprint-futures/ (accessed on 26 March 2025).
  2. Purvis, B.; Mao, Y.; Robimson, D. Three pillars of sustainability: In search of conceptual origins. Sustain. Sci. 2019, 14, 681–695. [Google Scholar] [CrossRef]
  3. Wackernagel, M. Ecological Footprint and Appropriated Carrying Capacity: A Tool for Planning Toward Sustainability. Ph.D. Thesis, The University of British Columbia, Vancouver, BC, Canada, 1994. [Google Scholar]
  4. Galli, A.; Giampietro, M.; Goldfinger, S.; Lazarus, E.; Lin, D.; Saltelli, A.; Muller, F. Questioning the Ecological Footprint. Ecol. Indic. 2016, 69, 224–232. [Google Scholar] [CrossRef]
  5. Weidmann, T.; Barrett, J. A Review of the Ecological Footprint Indicator—Perceptions and Methods. Sustainability 2010, 2, 1645–1693. [Google Scholar] [CrossRef]
  6. Fang, K.; Heijungs, R.; de Snoo, G.R. Theoretical exploration for the combination of the ecological, energy, carbon, and water footprints: Overview of a footprint family. Ecol. Indic. 2014, 36, 508–518. [Google Scholar] [CrossRef]
  7. Dasgupta, P.; Dasgupta, A.; Barrett, S. Population, ecological footprint and the sustainable development goals. Environ. Resour. Econ. 2023, 84, 659–675. [Google Scholar] [CrossRef]
  8. Holmberg, J.; Lundqvist, U.; Robert, K.H.; Wackernagel, M. The ecological footprint from a systems perspective of sustainability. Int. J. Sustain. Dev. World Ecol. 1999, 6, 17–33. [Google Scholar] [CrossRef]
  9. Zhang, L.; Dzakpasu, M.; Chen, R.; Wang, X.C. Validity and utility of ecological footprint accounting: A state-of-the-art review. Sustain. Cities Soc. 2017, 32, 411–416. [Google Scholar] [CrossRef]
  10. Wackernagel, M.; Galli, A. An overview on ecological footprint and sustainable development: A chat with Mathis Wackernagel. Int. J. Ecodynamics 2007, 2, 1–9. [Google Scholar] [CrossRef]
  11. Bastianoni, S.; Niccolucci, V.; Neri, E.; Cranston, G.; Galli, A.; Wackernagel, M. Sustainable development: Ecological footprint in accounting. In Encyclopedia of Environmental Management; Jorgensen, S.E., Ed.; CRC Press: Boca Raton, FL, USA, 2012; pp. 2467–2481. [Google Scholar]
  12. Kovshun, N.; Doroshenko, O.; Zhydyk, I.; Nalyvaiko, N.; Vashai, Y.; Skakovska, S. Global measurement of ecological footprint in the context of sustainable development. IOP Conf. Ser. Earth Environ. Sci. 2023, 1269, 012032. [Google Scholar] [CrossRef]
  13. Syrovatka, M. On sustainability interpretations of the Ecological Footprint. Ecol. Econ. 2020, 169, 106543. [Google Scholar] [CrossRef]
  14. Li, X.; Xiao, L.; Tian, C.; Zhu, B.; Chevallier, J. Impacts of the ecological footprint on sustainable development: Evidence from China. J. Clean. Prod. 2022, 352, 131472. [Google Scholar] [CrossRef]
  15. Kopnina, H. Education for the future? Critical evaluation of education for sustainable development goals. J. Environ. Educ. 2020, 51, 280–291. [Google Scholar] [CrossRef]
  16. Moffatt, I. Ecological footprints and sustainable development. Ecol. Econ. 2000, 32, 359–362. [Google Scholar]
  17. Ruzevicius, J. Ecological footprint as an indicator of sustainable development. Econ. Manag. 2010, 15, 711–718. [Google Scholar]
  18. Wackernagel, M.; Rees, W. Our Ecological Footprint: Reducing Human Impact on the Earth; New Society Publishers: Gabriola Island, Canada, 1996. [Google Scholar]
  19. GFN (Global Footprint Network). Glossary 2025a. Available online: https://www.footprintnetwork.org/resources/glossary/ (accessed on 26 March 2025).
  20. GFN (Global Footprint Network). National Footprint Accounts 2019 edition 2025b. Available online: https://data.footprintnetwork.org/?_ga=2.28364668.1543056325.1686042711-1970917240.1686042711#/ (accessed on 26 March 2025).
  21. Amprazis, A.; Galanis, N.; Malandrakis, G.; Panaras, G.; Papadopoulou, P.; Panaras, G.; Galli, A. The Ecological Footprint of Greeks: Main drivers of consumption and influencing factors. Sustainability 2023, 15, 1377. [Google Scholar] [CrossRef]
  22. GFN (Global Footprint Network). How the Footprint Works 2025c. Available online: https://www.footprintnetwork.org/our-work/ecological-%20%20footprint/ (accessed on 26 March 2025).
  23. Sayhan, H.; Sayhan, S.; Demirbas, O.C. Ecological footprints of primary school students and recommendations to diminish them. Am.—Eurasian J. Agric. Environ. Sci. 2013, 13, 521–530. [Google Scholar]
  24. Zeqir, V.; Shahin, B. Ecological footprint as a tool for change of individual attitudes toward the environment and better education for sustainability. Tech. Soc. Sci. J. 2022, 30, 727. [Google Scholar]
  25. Karakas, H. An activity to increase ecological footprint awareness of primary school teacher candidates: Educational drama. Res. Pedagog. 2019, 9, 16–27. [Google Scholar] [CrossRef]
  26. .Malandrakis, G.; Papadopoulou, P.; Gavrilakis, C.; Mogias, A. An education for sustainable development self-efficacy scale for primary pre-service teachers: construction and validation. Journ. Environm. Educ. 2019, 50, 23–36. [Google Scholar] [CrossRef]
  27. Fernandez, M.; Cebrián, G.; Regadera, E.; Fernandez, M.Y. Analysing the relationship between university students’ ecological footprint and their connection with nature and pro-environmental attitude. Int. J. Environ. Res. Public Health 2020, 17, 8826. [Google Scholar] [CrossRef]
  28. Wagner, C.; Gibberd, J. Reducing students’ ecological footprints through self-developed interventions. S. Afr. J. Psychol. 2022, 52, 533–544. [Google Scholar] [CrossRef]
  29. Keles, O.; Aydogdu, M. Application and Evaluation of Ecological Footprint as an Environmental Education Tool. Int. Online J. Educ. Sci. 2010, 2, 65–80. [Google Scholar]
  30. Cordero, E.C.; Todd, A.M.; Abellera, D. Climate change education and the ecological footprint. Bull. Am. Meteorol. Soc. 2008, 89, 865–872. [Google Scholar] [CrossRef]
  31. Alvarez-Suarez, P.; Vega-Marcote, P.; Garcia Mira, R. Sustainable consumption: A teaching intervention in higher education. Int. J. Sustain. High. Educ. 2013, 15, 3–15. [Google Scholar] [CrossRef]
  32. Adjei, R.; Addaney, M.; Danquah, L. The ecological footprint and environmental sustainability of students of a public university in Ghana: Developing ecologically sustainable practices. Int. J. Sustain. High. Educ. 2021, 22, 1552–1572. [Google Scholar] [CrossRef]
  33. Barrett, J.; Birch, R.; Cherrett, N.; Simmons, C. An Analysis of the Policy and Educational Applications of the Ecological Footprint; Stockholm Environment Institute: Heslington York, England, UK, 2004. [Google Scholar]
  34. Gottlieb, D.; Vigoda-Gadot, E.; Haim, A. Encouraging ecological behaviors among students by using the ecological footprint as an educational tool: A quasi experimental design in a public high school in the city of Haifa. Environ. Educ. Res. 2013, 19, 844–863. [Google Scholar] [CrossRef]
  35. UNESCO (United Nations Educational Scientific and Cultural Organization). UNESCO World Conference on Education for Sustainable Development: Proceedings. In Proceedings of the UNESCO World Conference on Education for Sustainable Development, Bonn, Germany, 31 March–2 April 2009; Available online: http://unesdoc.unesco.org/images/0018/001850/185056e.pdf (accessed on 26 March 2025).
  36. Ryu, H.; Brody, S.D. Examining the impacts of a graduate course on sustainable development using ecological footprint analysis. Int. J. Sustain. High. Educ. 2006, 7, 158–175. [Google Scholar] [CrossRef]
  37. Dawe, G.F.M.; Vetter, A.; Martin, S. An overview of ecological footprinting and other tools and their application to the development of sustainability process: Audit and methodology at Holme Lacy College, UK. Int. J. Sustain. High. Educ. 2004, 5, 340–371. [Google Scholar] [CrossRef]
  38. Galli, A.; Wackernagel, M.; Iha, K.; Lazarus, E. Ecological footprint: Implications for biodiversity. Biol. Conserv. 2014, 173, 121–132. [Google Scholar] [CrossRef]
  39. Scotti, M.; Bondavalli, C.; Bodini, A. Ecological footprint as a tool for local sustainability: The municipality of Piacenza (Italy) as a case study. Environ. Impact Assess. Rev. 2009, 29, 39–50. [Google Scholar] [CrossRef]
  40. Fernandez, M.; Alferez, A.; Vidal, S.; Fernandez, M.Y.; Albareda, S. Methodological approaches to change consumption habits of future teachers in Barcelona, Spain: Reducing their personal Ecological Footprint. J. Clean. Prod. 2016, 122, 154–163. [Google Scholar] [CrossRef]
  41. Conway, T.M.; Dalton, C.; Loo, J.; Benakoun, L. Developing ecological footprint scenarios on university campuses: A case study of the University of Toronto at Mississauga. Int. J. Sustain. High. Educ. 2008, 9, 4–20. [Google Scholar] [CrossRef]
  42. O’Gorman, L.; Davis, J. Ecological footprinting: Its potential as a tool for change in preservice teacher education. Environ. Educ. Res. 2013, 19, 779–791. [Google Scholar] [CrossRef]
  43. Venetoulis, J. Assessing the Ecological impact of a university: The ecological footprint for the University of Redlands, USA. Int. J. Sustain. High. Educ. 2001, 2, 180–196. [Google Scholar] [CrossRef]
  44. Gottlieb, D.; Kissinger, M.; Vigoda-Gadot, E.; Haim, A. Analyzing the ecological footprint at the institutional scale- The case of an Israeli high-school. Ecol. Indic. 2012, 18, 91–97. [Google Scholar] [CrossRef]
  45. Lin, S. Reducing students’ carbon footprints using personal carbon footprint management system based on environmental behavioural theory and persuasive technology. Environ. Educ. Res. 2016, 22, 658–682. [Google Scholar] [CrossRef]
  46. Collins, A.; Galli, A.; Patrizi, N.; Pulselli, F.M. Learning and teaching sustainability: The contribution of Ecological Footprint calculators. J. Clean. Prod. 2018, 174, 1000–1010. [Google Scholar] [CrossRef]
  47. McNichol, H.; Davis, J.M.; O’Brien, K.R. An ecological footprint for an early learning centre: Identifying opportunities for early childhood sustainability education through interdisciplinary research. Environ. Educ. Res. 2011, 17, 689–704. [Google Scholar] [CrossRef]
  48. Pires, S.M.; Mapar, M.; Nicolau, M.; Patrizi, N.; Malandrakis, G.; Pulselli, F.M.; Nicolau, P.B.; Caeiro, S.; Niccolucci, V.; Theodossiou, N.P.; et al. Teaching sustainability within the context of everyday life: Steps toward achieving the Sustainable Development Goals through the EUSTEPs Module. Front. in Educ. 2022, 7, 1–17. [Google Scholar]
  49. Government Gazette B’ 3567/(4.8.2021) Law 3567/4-8-2021. Curriculum Framework for Skills Workshops for All Types of Schools, Kindergartens, Primary and Secondary Schools. Available online: https://www.e-nomothesia.gr/kat-ekpaideuse/protobathmia-ekpaideuse/upourgike-apophase-94236-gd4-2021.html (accessed on 26 March 2025).
  50. Cohen, L.; Manion, L.; Morrison, K. Research Methods in Education, 5th ed.; Routledge Falmer: London, UK, 2000. [Google Scholar]
  51. Silverman, D. Doing Qualitative Research, 3rd ed.; Sage Publications: Thousand Oaks, CA, USA, 2010. [Google Scholar]
  52. Patton, M.Q. Qualitative Research and Evaluation Methods, 3rd ed.; Sage Publications: Thousand Oaks, CA, USA, 2014. [Google Scholar]
  53. Cetin, A.K.; Sen, G.; Aksaray, B. Examining the association of climate change worry and awareness of ecological footprint reduction behaviours with Mediterranean diet adherence and climate-friendly food choices. Br. Food J. 2024, 127, 168–181. [Google Scholar] [CrossRef]
  54. Giannetti, B.F.; Agostinho, F.; Almeida, C.M.V.B.; Pinto, M.J.A.P.; Marroquin, M.C.; Paredes, M.D. A quantitative assessment model for students’ sustainability: Evidence from a Peruvian university. Int. J. Sustain. High. Educ. 2023, 24, 1744–1767. [Google Scholar] [CrossRef]
  55. Spiliotis, E.; Arsenopoulos, A.; Kanellou, E.; Psarras, J.; Kontogiorgos, P. A multi-sourced data based framework for assisting utilities identify energy poor households: A case-study in Greece. Energy Sources Part B Econ. Plan. Policy 2020, 15, 49–71. [Google Scholar] [CrossRef]
  56. Santamouris, M.; Paravantis, J.A.; Founda, D.; Kolokotsa, D.; Michalakakou, P.; Papadopoulos, A.M.; Kontoulis, N.; Tzavali, A.; Stigka, E.; Ioannidis, Z.; et al. Financial crisis and energy consumption: A household survey in Greece. Energy Build. 2013, 65, 477–487. [Google Scholar] [CrossRef]
  57. Kyle, W.C., Jr. Expanding our views of science education to address sustainable development, empowerment, and social transformation. Discip. Interdiscip. Sci. Educ. Res. 2020, 2, 2. [Google Scholar] [CrossRef]
  58. Wals, A.E.; Brody, M.; Dillon, J.; Stevenson, R.B. Convergence between science and environmental education. Science 2014, 344, 583–584. [Google Scholar] [CrossRef]
Figure 1. Categories of productive land and water used in EF, classified according to their respective consumption categories [20].
Sustainability 17 05429 g001
Figure 2. A section of the questionnaire illustrating an example from the first EF category on food. Expected answers to the closed-form statements are also indicated.
Sustainability 17 05429 g002
Figure 3. Mean achievement percentage total scores before and after teaching.
Sustainability 17 05429 g003
Figure 4. Mean achievement percentage scores across all six EF categories, before and after teaching.
Sustainability 17 05429 g004
Table 1. Mean personal ecological footprint and its analysis by land type.
Mean Personal EFPersonal EF by Land Types
Gha/PersonBuilt-Up LandCarbon FootprintCroplandFishing GroundsForest LandGrazing Land
Greece *3.78 gha1.8%50.9%26.4%3.2%7.9%9.8%
Europe *4.65 gha2.3%55.3%21.8%3.9%12.4%4.3%
World *2.58 gha2.6%60.3%18.6%3.1%10.4%5%
Greek research **3.4 gha1.6%56.2%24.6%3%6.9%7.7%
* [20]. ** [21].
Table 2. Summary of teaching intervention characteristics regarding the implementation of the module titled “How Much Do I Affect the Environment: How Many Planets Do I Need to Live?”.
Session
(Duration)
TopicMain ActivitiesMaterials
1
(2 × 45′)
What do we need to live?
Needs and Desires
Where do we find all we need to live?
Fill of worksheets
Classroom discussion
Power point
Worksheets
2
(2 × 45′)
Food (Weekly Food calendar, processed, packed and locally produced foods)
HOMEWORK: Fill of the table with the weekly consumption of food
CLASSWORK: Taxonomy of recorded food by:
type (e.g., meat, fish, milk)
frequency
degree of procession
locality
Power point
Worksheets
Table of weekly consumption of food
3
(2 × 45′)
Residence/Energy
Purchase of goods
HOMEWORK: Collection of information about students’:
house (materials construction, size, energy efficiency, and renewable energy use),
purchase of goods (e.g., pants, shirts)
CLASSWORK: Organization of recorded information into tables
Worksheets
4
(2 × 45′)
Wastes and Recycling
Transportations
Calculation of waste produced
Frequency of recycling
Fill of the table with the weekly transportation for school and other activities
Calculation of:
mean weekly distance covered
type and frequency of vehicle used
frequency of car sharing
Worksheets
5
(2 × 45′)
Measurement of personal EF
Suggestions for reducing EF
Entering of collected data to the online EF calculator
Calculation of personal EF (gha, planets needed, overshot day, distribution of EF by type of activity and land)
Identification of EF categories with the greatest impact
Suggestions for reducing EF
2nd round of personal EF calculation based on suggestions
Discussion of results.
Worksheets
EF online calculator
Table 3. Students’ primary justifications for their answers to open-ended questions in each EF category.
Ecological Footprint CategoryStudents’ Main Justifications
Pre TestPost Test
Food* Animals die
* Μeat is wrapped in plastic ** Eating meat is good for humans
* Animals are threatened with extinction
** Eating meat is good for humans
Infrastructures/Housing* Gas emissions
** Fast transportation
* Environmental pollution
** Making human life easier
** Fast transportation
* Deforestation
Energy** Making human life easier
* Electricity saving
* Energy saving
* Electricity saving
Goods/Services* Less garbage
* Factories are working less
* Less environmental pollution
* Factories are working less
* Less environmental pollution
Waste* Less environmental pollution, * Helping other people* Factories are working less
* Fewer purchases of new things
Transportation** Faster transportation by car
** Buses produce more emissions ** Risk of catching a disease in a bus
** Faster transportation by car
* Less emissions when choosing a bus
** Risk of catching a disease
in a bus
* justifications for correct answers. ** justifications for wrong answers.
Table 4. Paired-Samples t-Test for Ecological Footprint (EF) categories (N = 112).
EF CategoriesMeantp
FoodPre1.46−1.2410.217
Post1.56
Infrastructures and HousingPre
Post
1.13
1.48
−4.201p < 0.001
EnergyPre
Post
1.29
1.45
−2.3830.019
Goods and ServicesPre
Post
1.25
1.50
−3.982p < 0.001
WastePre
Post
1.29
1.54
3.0230.003
TransportationPre
Post
1.41
1.63
−2.7250.007
Total EFPre
Post
7.85
9.17
−5.107p < 0.001
Disclaimer/Publisher’s Note: The statements, opinions and data contained in all publications are solely those of the individual author(s) and contributor(s) and not of MDPI and/or the editor(s). MDPI and/or the editor(s) disclaim responsibility for any injury to people or property resulting from any ideas, methods, instructions or products referred to in the content.

