Article

Innovative Wastewater Treatment Using 3D-Printed Clay Bricks Enhanced with Oyster Shell Powder: A Life Cycle Assessment

by
Wathsala Benthota Pathiranage
1,2,
Hunain Alkhateb
1,2 and
Matteo D’Alessio
1,2,*
1
Department of Civil Engineering, University of Mississippi, Carrier Hall, University, MS 38677, USA
2
Center for Graphene Research and Innovation, University of Mississippi, University, MS 38677, USA
*
Author to whom correspondence should be addressed.
Sustainability 2025, 17(12), 5428; https://doi.org/10.3390/su17125428
Submission received: 16 May 2025 / Revised: 4 June 2025 / Accepted: 10 June 2025 / Published: 12 June 2025

Abstract

:
With growing global concerns over sustainable wastewater treatment, there is a pressing need for low-cost, eco-friendly filtration solutions. This study conducted a life cycle assessment (LCA) to evaluate the potential of improving slow sand filtration efficiency by integrating alternative materials like clay and oyster shell powder (OSP), while minimizing the environmental footprint. Additionally, the adaptability of three-dimensional (3D) printing was explored to incorporate these materials into innovative filter designs, assessing scalability for broader wastewater applications. Ten filter configurations, including a slow sand filter (SSF) enhanced with OSP (90:10) and 3D-printed clay–OSP bricks (ratios of 90:10, 85:15, 80:20), were assessed across three sourcing distances: local (in situ), regional (161 km), and distant (1609 km). The results showed that SSFs with OSP consistently delivered lower environmental impacts, reducing freshwater ecotoxicity, eutrophication, and human toxicity by up to 4% compared to conventional SSFs, particularly when transport was minimized. Among brick-based systems, single-brick columns offered the best balance of performance and impact, while three-brick columns had the highest environmental burden, largely due to the increased electricity use. Economic analysis reinforced the environmental findings: SSFs with OSP were the most cost-effective option, followed closely by SSFs, while brick-based systems were slightly more expensive, with costs rising sharply when sourcing distances exceeded 161 km. Overall, integrating OSP into SSFs offers an optimal balance of sustainability and affordability, while single-brick columns (90:10) present a promising alternative. Future research should further optimize material blends and design configurations to align with long-term environmental and economic goals.

Graphical Abstract

1. Introduction

As the world faces increasing water scarcity, the necessity of water reuse, reclaiming water from different sources, adequately treating it, and reusing it [1], has become crucial. Due to the growing population, industrial developments, climate change, and unsustainable management practices, there is an increasing demand for freshwater. In contrast, the available freshwater sources on Earth are inadequate for all human needs [2]. Therefore, water reuse represents one of the valuable approaches to attenuating water scarcity [3]. Recently, water reuse has been considered for various applications, including the irrigation of edible and non-edible plants, domestic applications, including toilet flush, garden irrigation, and recreational activities, like park and golf course irrigation [4]. However, public perception is recognized as one of the main challenges to the widespread application of water reuse. For example, according to the results of a survey conducted in the Southeast United States regarding the public perception towards water reuse, while less than 12% of the participants disagreed with the idea of implementing water reuse for outdoor activities, only 35%, 34%, 22%, and 18% were willing to use water reuse for golf course irrigation, watering private yards, watering livestock feed crops, and watering edible crops, respectively. To further increase their willingness to implement water reuse, additional treatments can be implemented [5]. Effective filtration systems are essential to ensure the quality and safety of reclaimed water for various applications. Traditional filtration methods, while effective, often require optimization and post-treatments to improve efficiency and sustainability, particularly at the household level.
Among the different additional treatments available, three-dimensional (3D) printing represents an emerging solution [6,7,8]. Three-dimensional printing involves creating three-dimensional structures by depositing materials based on digital models, such as 3D computer-aided design (CAD) models. The desired geometries are printed layer by layer after printing-parameter optimization [7]. This technology has disrupted various industries due to its capability to create complex and customized geometries, cost-effectiveness, minimal waste production, and applicability for a variety of materials including plastics, ceramics, metals, and biopolymers. Three-dimensional printing includes multiple techniques such as material extrusion, selective laser sintering, inkjet printing, and direct ink-wetting or gel printing [6,7]. This approach, in addition to being effective, is also environmentally sustainable. By integrating alternative low-cost materials into 3D-printed filtration units, this study explored how 3D printing can enhance conventional slow sand filtration systems while minimizing environmental footprints. This study specifically examined the application of 3D printing to develop a sustainable, domestic-scale filtration system designed to treat water needed to irrigate an average private yard in the United States for a week. A slow sand filter (SSF) system integrated with 3D-printed clay bricks enhanced with oyster shell powder (OSP) was selected as the primary design based on successful preliminary results [8,9].
To fully assess and validate the environmental benefits of this approach, it is essential to utilize robust analytical tools. Among the different tools, life cycle assessment (LCA) has been used to assess a product or a service and identify the most ecologically friendly option, considering all the life cycle stages from raw material extraction to disposal [10]. LCA has been used in previous studies to evaluate water-treatment approaches for various needs, including investigating environmental impacts and energy demand by comparing different technologies and product development and making business decisions [11,12]. For instance, LCA has been applied to compare four different water-treatment methods (boiling, ceramic water filters, biosand filters, and point-of-use chlorination) used in a rural community in South Africa in terms of the environmental impacts, including global warming, water use, energy use, smog formation, and land use [12]. In a study related to an innovative enzyme-coated membrane filtration system designed to remove micropollutants from drinking water, non-renewable energy use and climate change were evaluated using the ReCiPe midpoint assessment and European databases and compared with conventional granulated activated carbon filtration. Through this study, it was found that a membrane system with covalent binding that uses less than 0.2 kWh/m3 of filtered water and undergoes monthly enzyme coating can outperform conventional activated carbon systems regardless of the electricity source. These conclusions have helped membrane producers in making their business decisions [11].
In a separate study, a commercial sand filter used for micro-irrigation was compared with two other filters: one with the same dimensions as the commercial filter but with 30% operational energy reduction and the other with a reduced filter size and reduced raw materials by 25%. LCA was also conducted to evaluate the impacts of dimension and energy reduction in a sand filter [13]. The environmental impacts, expressed in terms of climatic change, fossil depletion, eco-toxicity, ozone depletion, and water depletion, of a reverse osmosis (RO) system were analyzed based on the consumption of electricity, fresh water, and materials in RO systems with different capacities [14]. A conventional activated sludge system was compared with or without integrating membrane biological reactors (MBRs) using impact assessment methods like CML 2 baseline 2000, Eco-Points 97, and Eco-Indicator 99. This study helped us to understand that the higher environmental impacts of MBRs are not that significant and can be justified by their performance [15]. An LCA-based study was used to evaluate the water footprint for a nano-CeO2 modified ceramic filter designed for point-of-use under high- and low-tech scenarios. The LCA approach was beneficial in finding that the raw materials accounted for the largest share of the water footprint in the high-tech scenario, while staff consumption was the primary contributor in the low-tech scenario [16]. An LCA was also used to compare an innovative biochar filter, with a conventional biofilter in aquaculture systems to treat fish wastewater. The innovative system is not yet commercially available, similar to the system proposed in the current study, making it challenging to perform an environmental LCA or a cost analysis. However, the LCA has been helpful in early detection and reduction in possible environmental effects, promotes sustainable design, and aids in making well-informed choices with opportunities for development [17].
LCA has played a crucial role in guiding sustainable and cost-effective decisions for water-treatment systems by evaluating their environmental impacts and resource efficiency. Its application has enabled researchers and policymakers to optimize technologies for long-term viability and ecological benefits. While previous studies have applied LCA to assess diverse water-treatment technologies, including conventional sand filtration, biosand filtration, ceramic filters membrane reactors, and reverse osmosis, to the best of our knowledge, no study has examined the integration of 3D printing with alternative materials, such as clay and OSP, within a slow sand filtration system. By introducing 3D-printed clay bricks enhanced with OSP and systematically evaluating their environmental and economic viability through LCA, this study represents a novel and pioneering approach that expands the potential of sustainable filtration technologies.
Among the various LCA tools available, OpenLCA [18] has emerged as an accessible and comprehensive platform for conducting environmental impact assessments in wastewater-treatment processes. This study utilized OpenLCA to systematically assess the sustainability of an innovative wastewater-treatment system. Several studies have employed OpenLCA to analyze the energy use and environmental burdens associated with different wastewater-treatment techniques [19,20].
The primary goal was to comprehensively evaluate the environmental impacts of the proposed filters across several categories, including freshwater ecotoxicity and eutrophication, fossil fuel depletion, ozone depletion, fine particulate matter formation, and global warming, under different configurations (e.g., different numbers of 3D-printed bricks, different clay/OSP ratios, etc.). Additionally, the impact of the distance between the site with the available raw materials, the manufacturing site, and the site implementing the proposed wastewater-treatment units was investigated.
The need for this study arises from the growing global water scarcity and the potentially high operational costs and energy consumption linked to conventional wastewater-treatment methods [21]. Developing low-cost, efficient, and sustainable treatment solutions is crucial for communities that lack access to advanced technologies. Additionally, utilizing natural and waste materials like OSP contributes to a circular economy and reduces environmental impacts. By investigating the environmental and economic impacts of the proposed wastewater-treatment systems, the study aims to provide a viable solution for producing treated water that can be safely used for irrigating private yards. This research could potentially lead to broader applications in both rural and urban settings, promoting sustainable water reuse practices and enhancing water resource management.

2. Materials and Methods

2.1. Life Cycle Assessment in Wastewater Treatment

LCA is a systematic method for evaluating the environmental impacts of a product, process, or system throughout its entire life cycle. LCA can be applied to wastewater-treatment systems to quantify the impacts of the particular systems on human health and the environment and determine the sustainable options [22]. Initially, the complex processes can be broken down into simple unit processes, which facilitates the inventory analysis to determine the process inputs and outputs [23]. The LCA methodology consists of four key phases (Figure 1). The first phase, goal and scope definition, is crucial as the quantification of wastewater’s environmental impacts through LCA is carried out based on the criteria established during this phase. The goal and scope definition phase is followed by the inventory analysis, impact assessment, and interpretation. During the inventory phase, necessary input and output data are gathered to achieve the LCA objectives. The third phase (impact assessment) involves classifying emissions (outputs) and resources (inputs) into impact categories, then characterizing their potential effects using scientific models. Essentially, it helps to quantify the magnitude of environmental burdens, such as global warming, toxicity, and resource depletion, to guide sustainable decision-making [22]. During the fourth and final phase, the evaluated options can be compared to identify the most sustainable option. In alignment with this approach, the current study was designed following LCA principles and adheres to the ISO 14040 [24] and ISO 14044 standards [25] to ensure methodological accuracy in assessing the environmental impacts of the selected filtration units.

2.2. Goal and Scope of the LCA

This LCA aims to determine the environmental impacts of an SSF integrated with OSP media or 3D-printed clay bricks enhanced with OSP for wastewater treatment. Ten scenarios have been simulated to compare this innovative approach with conventional SSFs to identify the most environmentally favorable option for sustainable wastewater treatment. Nine of the ten simulated scenarios were obtained by varying the number of 3D-printed bricks (1 brick, 2 bricks, and 3 bricks) and clay/OSP (80:20, 85:15, and 90:10) used. The selection of clay/OSP ratios (90:10, 85:15, and 80:20) was based on the findings from a previous laboratory-scale study examining the integration of clay and crawfish powder using a 90:10 ratio into a brick-based SSF system [8,9] to assess its filtration performance. While no significant differences were observed between SSF, pure clay bricks, and 90:10 clay/crawfish powder bricks, some improvements were noted in the composite material. Based on this, the 90:10 ratio was retained in the present study as a benchmark. Assuming increased OSP might enhance performance, 5% increments of OSP were considered for the LCA. The tenth scenario included a traditional SSF with OSP mixed with sand (10:90). An SSF without any brick and/or OSP was also investigated (control system). Additionally, the environmental impacts of varying the transportation distances between raw materials, manufacturing, and installation sites from localized (in situ) scenarios to 161 km (100 miles) and 1609 km (1000 miles) were investigated.

2.3. Functional Unit

The functional unit (FU) of this study was the treatment of wastewater needed to irrigate a private yard daily. In the U.S., residential lawns average 4046.86 m2 (approximately a quarter of an acre) [26]. To irrigate a quarter-acre lot for a week, approximately 26 m3 of water is required [27]. For this study, the volume of water to be filtered daily was approximately 4 m3. The quantities of materials, energy sources, and technology to build a system to treat 4 m3 daily were considered for the LCA. Once the system was built, the operational impact on the environment was minimal due to its low maintenance requirements. Maintenance activities, such as backwashing and removing biofilm, are infrequent and have negligible environmental effects.

2.4. Product Systems and Its Components

2.4.1. System Boundaries

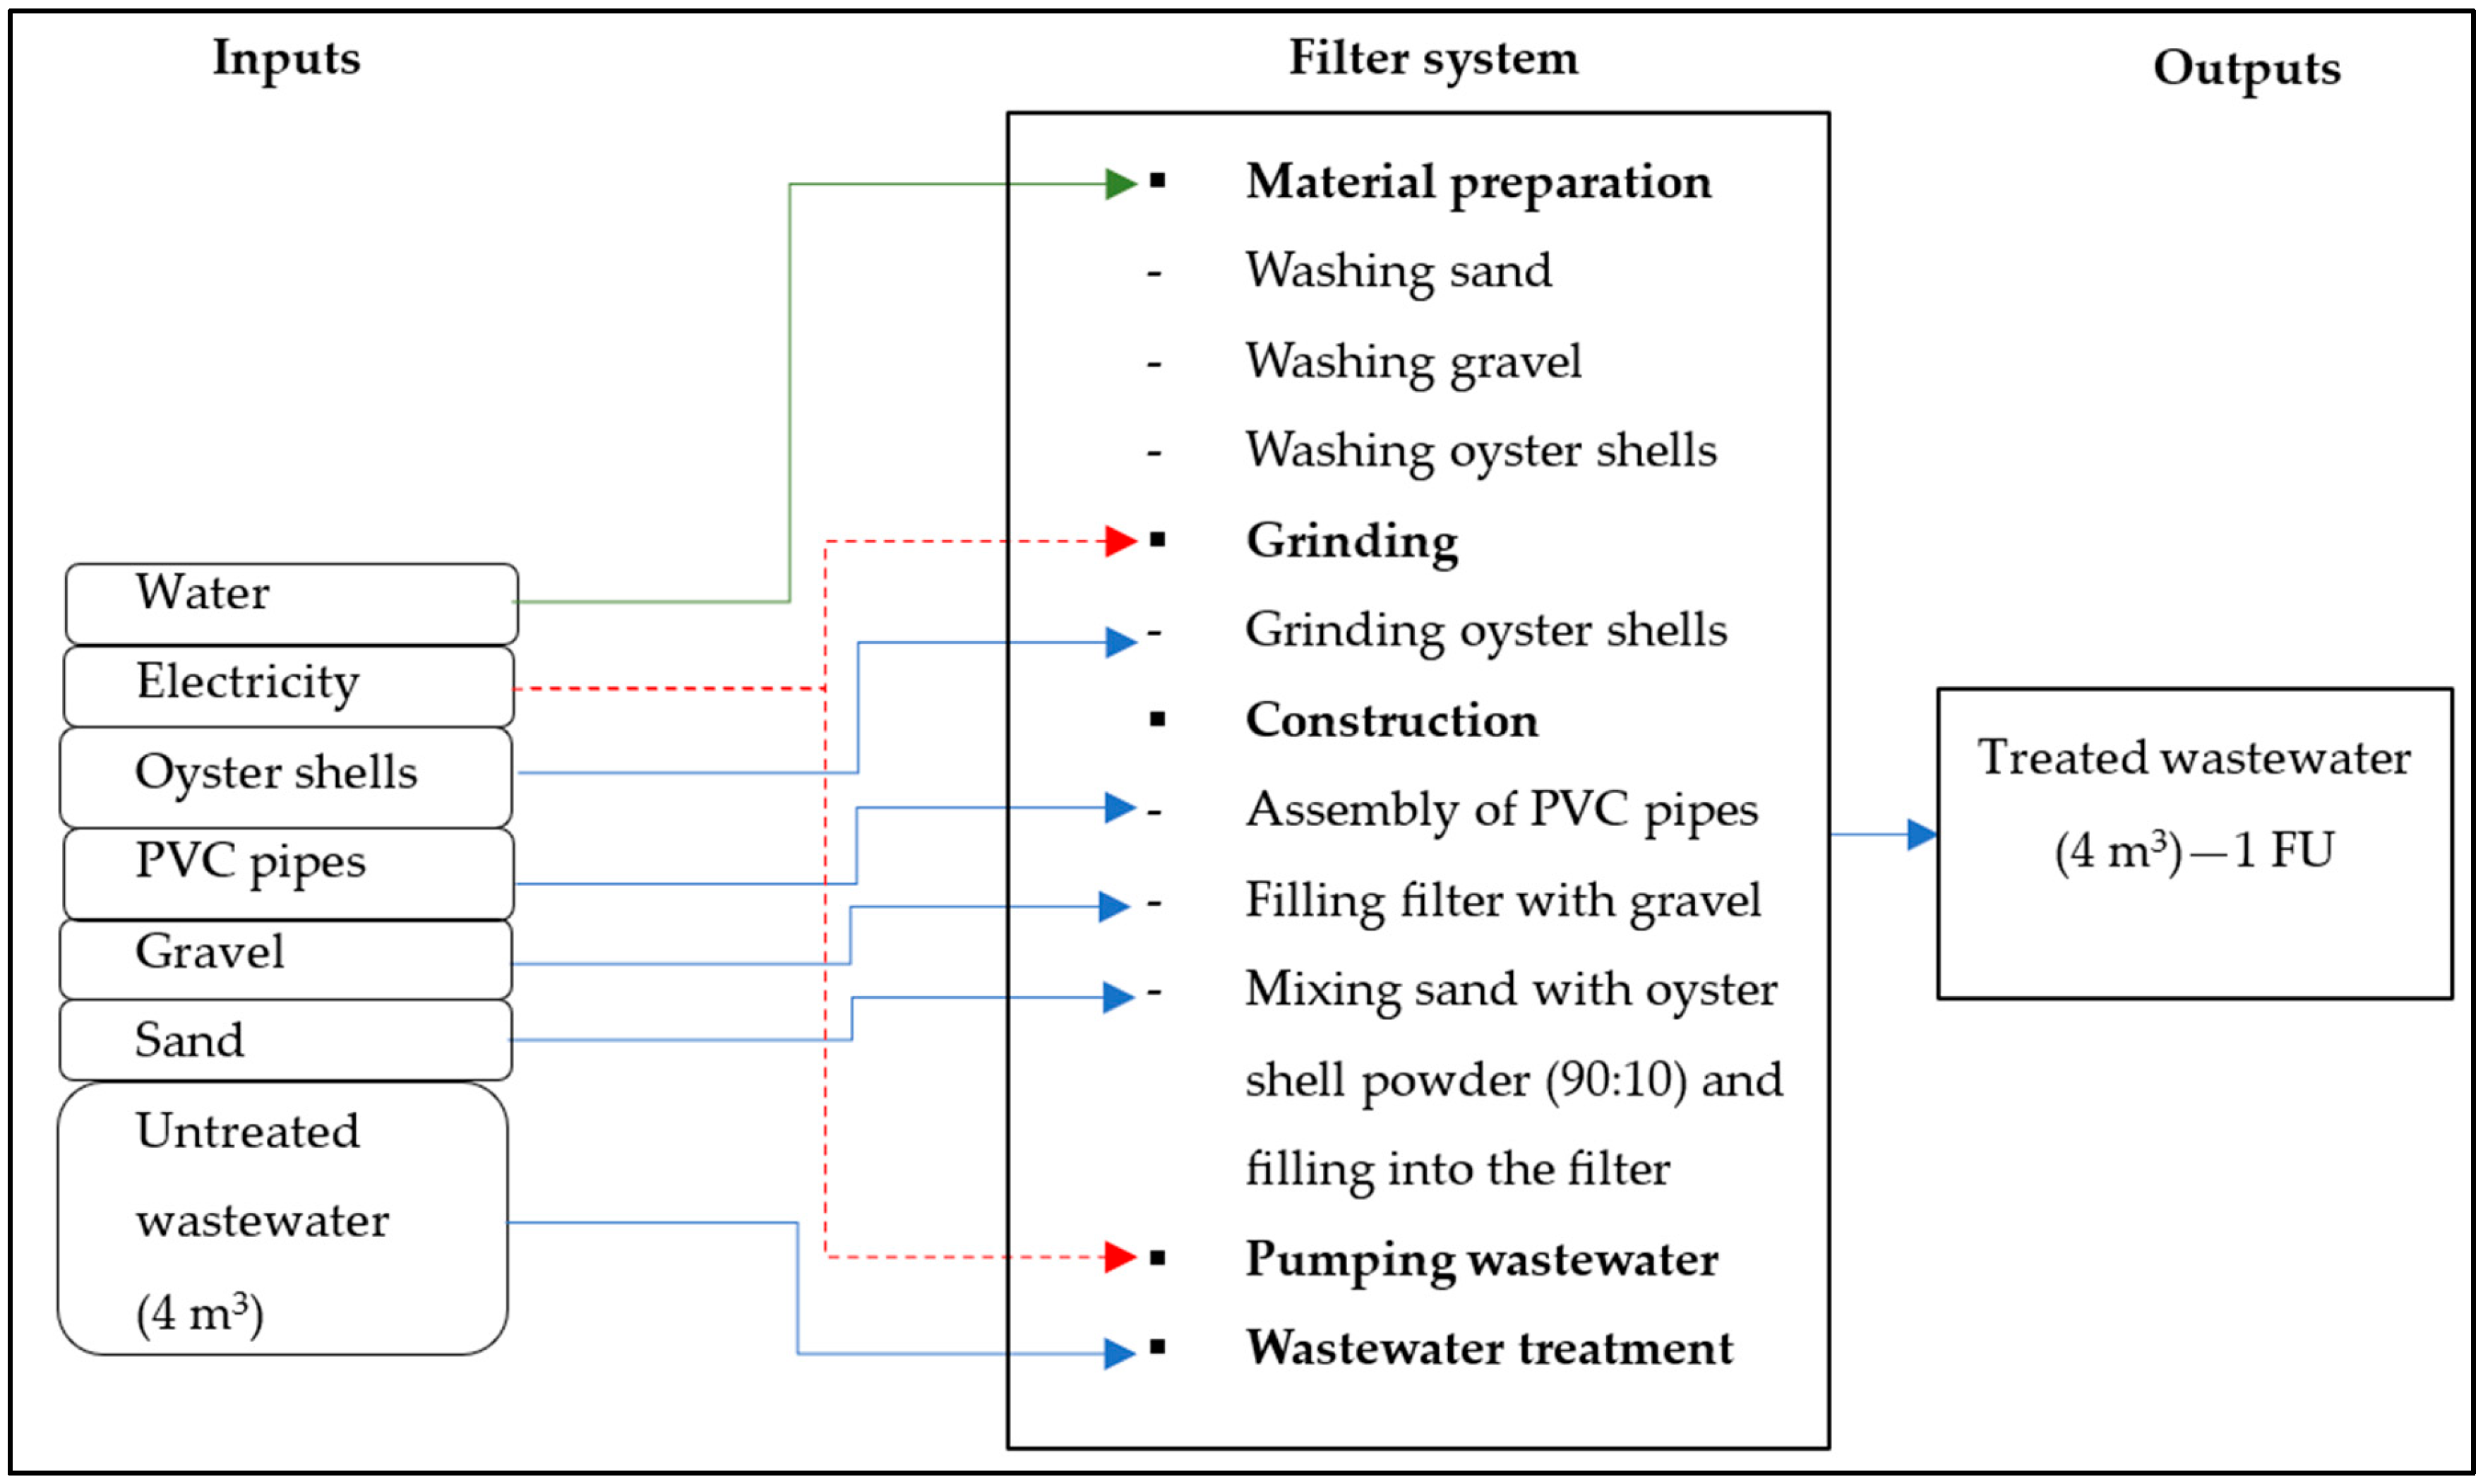
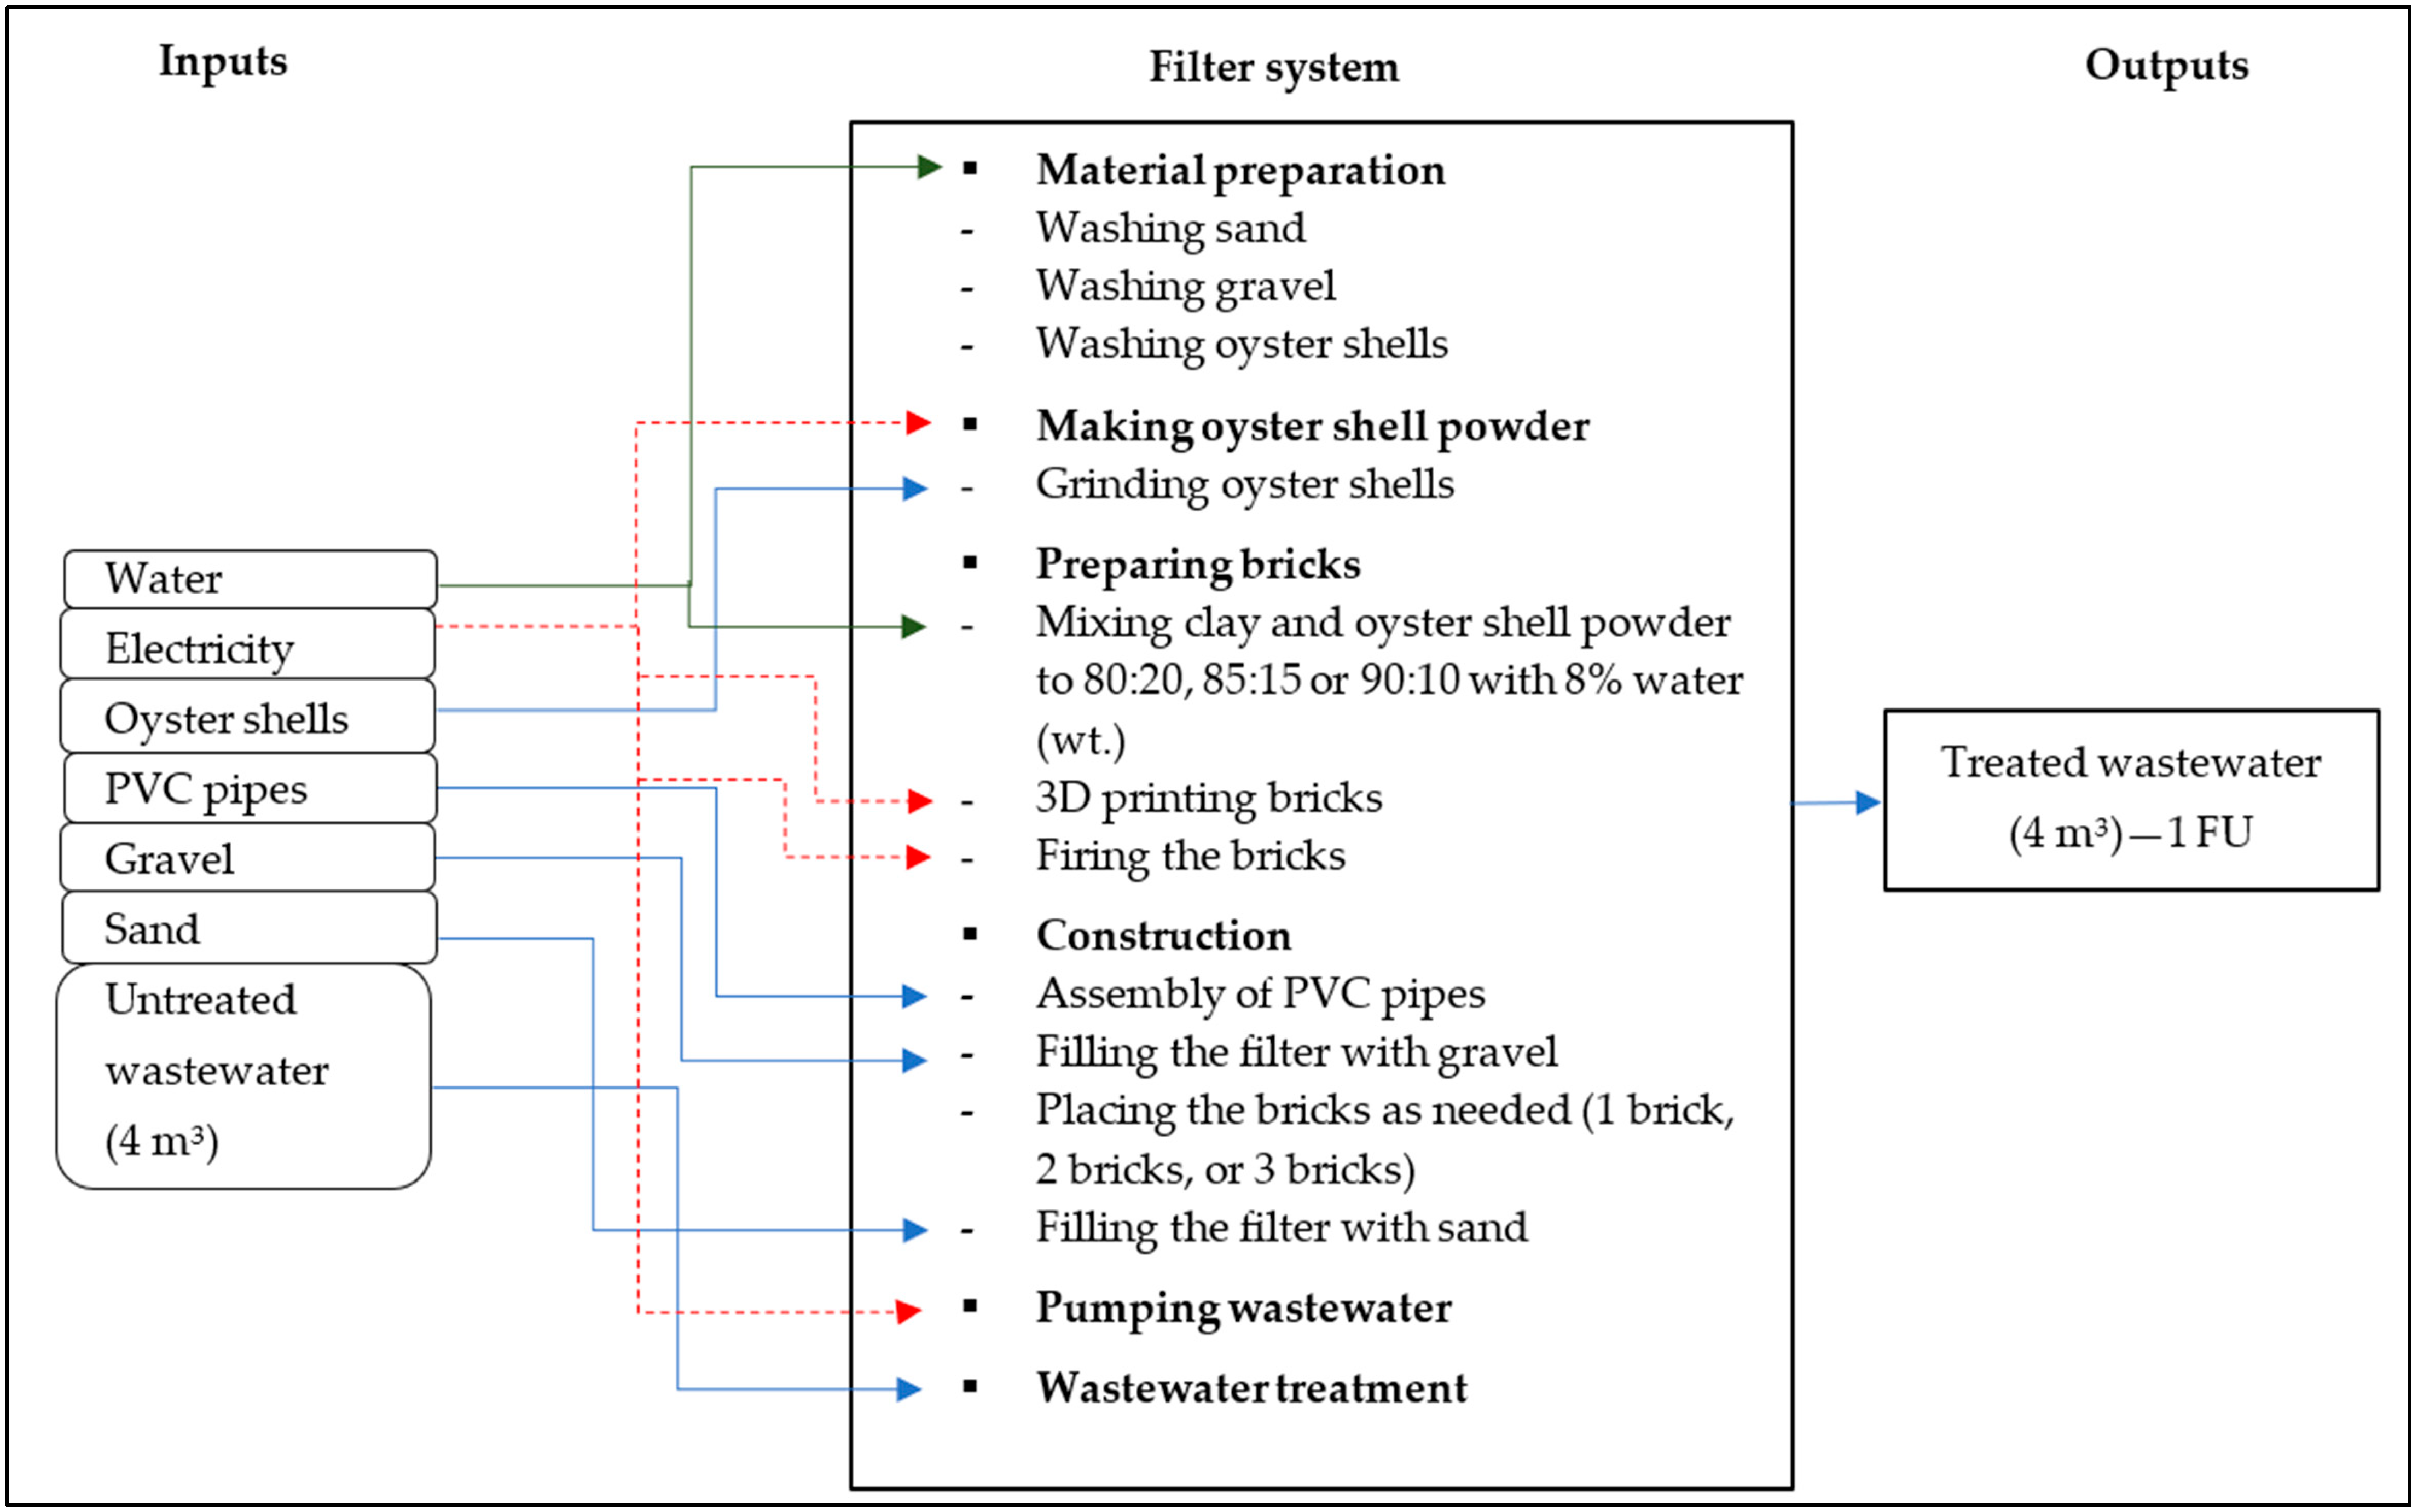
The system boundaries of the study encompass the crucial stages involved in manufacturing a conventional SSF (Figure S1), an SSF with sand and oyster shell mixed to a ratio of 90:10 (Figure 2), an SSF with 3D-printed bricks under nine different scenarios (Figure 3), and an SSF with graphene-coated bricks with the same nine different scenarios (varying number of bricks and ratios) (Figure 4) used with traditional bricks. The main inputs during the material preparation and construction phases are water, oyster shells, sand, and gravel, as well as PVC pipes to build the filters. Electricity is used to power the equipment for crushing the oyster shells, 3D printing the bricks, and firing them. Untreated wastewater (4 m3 daily) is the only input during the use phase. The final output of each filter represents one functional unit (FU), 4 m3 of cleaned and treated water ready for watering a private yard daily.

2.4.2. Calculation Procedure and Assumptions

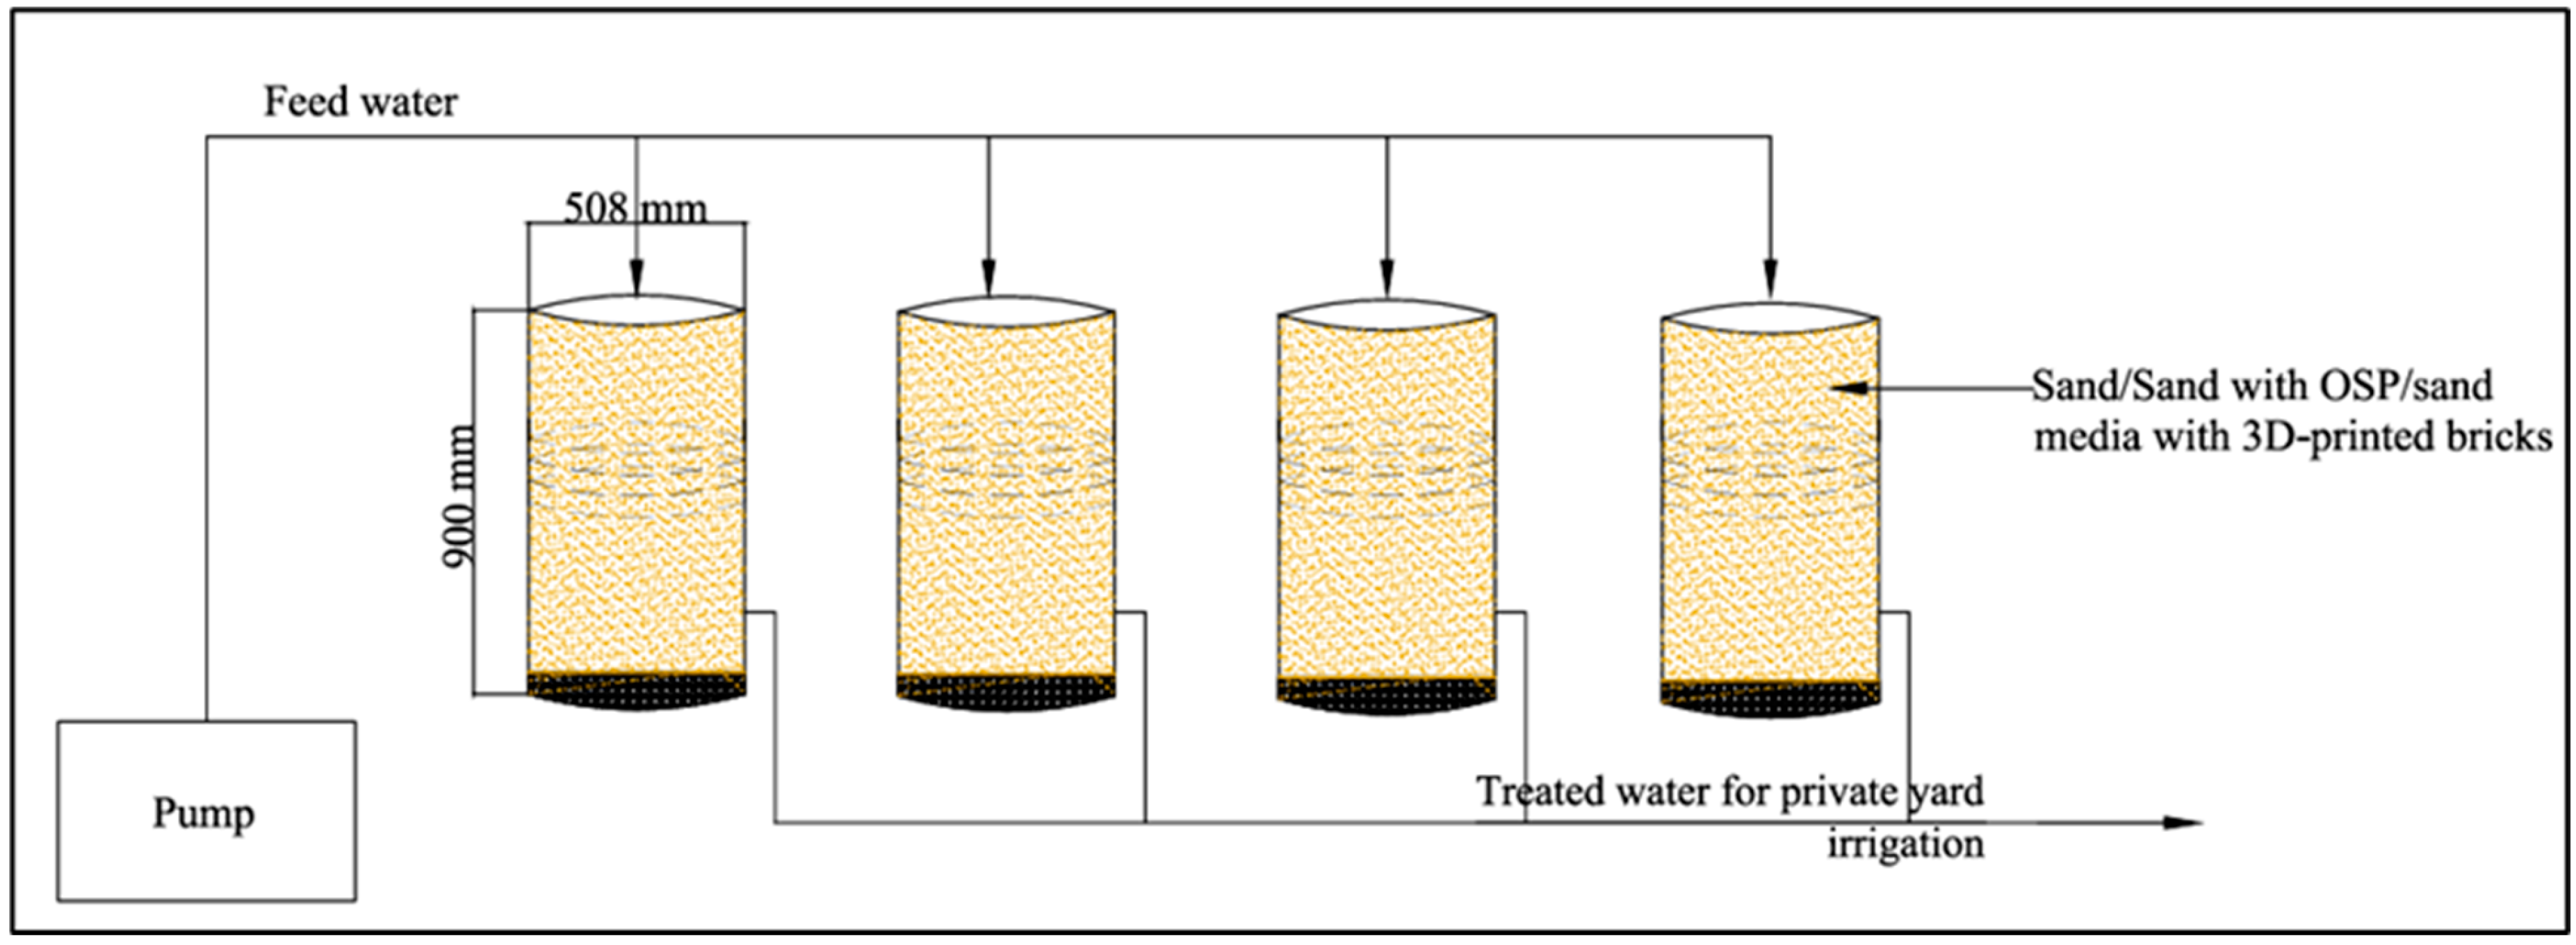
The design of a conventional SSF involves several key parameters to ensure effective water treatment. In this scenario, the assessed SSF included the following specifications: a flow rate of 0.167 m3/h (4 m3/d), an empty bed contact time (EBCT) of 4 h, and a hydraulic loading rate (HLR) of 0.2 m3/m2/h. These values fall within the common design ranges for SSFs (EBCT: 3 to 10 h and HLR: 0.1 to 0.3 m3/m2/h) [28]. Based on commercially available PVC standard pipes, four 0.254 m pipes, 0.9 m (common media depth: 0.75 to 1.25 m) high, were placed in parallel to achieve the necessary volume (0.67 m3) and area (0.83 m2) (Figure 4). With the proposed configuration, the system volume was 0.73 m3 while the area was 0.81 m2. Outer and inner radii were first determined to calculate the weight of the PVC needed for the slow sand filter system. The outer radius was 25.4 cm (from a 20-inch pipe), and the inner radius, accounting for the wall thickness of 1.5 cm, was 23.9 cm. Considering a PVC density of 1.4 g/cm3, the required PVC weight was ~118.73 kg. The volume of sand needed to fill the PVC pipe (cylindrical pipe) was 0.612 m3 and the weight was found to be ~979 kg for a density of 1600 kg/m3 [29]. For a mixture with a 90:10 ratio (in weight) of sand to oyster shells, the respective masses were calculated at about 881 kg of sand and 98 kg of oyster shells. To determine the weight of the gravel needed for the SSF, the volume of the gravel layer was first calculated using the inner radius (23.9 cm) and the layer’s height (0.05 m layer per column) and then converted to cubic meters. Consequently, the weight of the gravel required was 60.38 kg for a density of 1680 kg/m3 [30].
Crushing 1 kg of OSP requires ~0.044 kWh of electricity for a hammer crusher [31]. Based on previous lab experience, it takes approximately 6 L of water to wash 1 kg of oyster shells or 1 kg of sand, and about 10 L to wash 1 kg of gravel. The weight of the clay needed for bricks (5 cm thick) was calculated using a density of ~1800 kg/m3 [30]. Based on a previous study [8] and considering the proposed brick volume, 10–12 h are required to print a brick with a large-scale printer, featuring a printing volume of Ø600 mm in diameter and 1000 mm in height (h), consuming ~12 kWh of power per brick; however, this time can vary depending on the speed used [32]. After printing, each brick should be fired in a furnace at ~1000 °C. For example, a furnace with a maximum temperature of 110 °C would use 3.5 kW of power for 6 h to fire one brick at a time [33]. If a 0.5 HP submersible pump that consumes ~960 W can be used to pump the influent reused water to the filter columns, ~23 kWh would be required to continuously operate for 24 h [34].
This study initially assumed that raw materials, manufacturing, and installation were co-located. To reflect more typical scenarios, two additional cases were analyzed: (1) installation 161 km (100 miles) from extraction and manufacturing, and (2) installation 1609 km (1000 miles) away (Table S2). These variations highlight the environmental impacts of different transportation distances in real-world logistics.

2.5. Inventory Analysis and Data Collection

The raw materials for the filters, such as water, sand, gravel, clay, and PVC, and energy sources like electricity, were obtained from the freely available database on the OpenLCA nexus, European Life Cycle Database (ELCD) 3.2 [35]. Oyster shell waste, unavailable in the database, was added as a new waste flow. The input data were calculated based on various filter models using standard values, estimations, and previous lab experience as explained in the Calculation Procedure and Assumptions Section (Table S1). ELCD 3.2 was selected for this wastewater-treatment LCA study based on its availability (free-access database) and the necessary inputs from providers relevant to the study. While acknowledging that it is not region-specific to the USA, the database’s reliability represents a suitable choice. To maintain accuracy and relevance, efforts were made to align the data as closely as possible with local conditions.

2.6. Environmental Metrics and Impact Assessment

The different filter models were evaluated using OpenLCA (version 2.1.1), an LCA software [18]. The OpenLCA LCIA methods 2.4.2 database tool assessed the environmental impacts of the proposed filter models. Among the different impact assessment methods available under this database, ReCiPe 2016 Midpoint (H) was used in the study to include metrics concerning the ecosystems, human health and resource depletion. ReCiPe 2016 includes impact categories representing the global scale, such as freshwater ecotoxicity, freshwater eutrophication, fine particulate matter formation and fossil resource scarcity [36]. Out of the 18 impact categories under ReCiPe 2016 Midpoint (H), the current study targeted nine of them including freshwater ecotoxicity (kg 1,4-DCB), freshwater eutrophication (kg P eq), global warming (kg CO2 eq), terrestrial acidification (kg SO2 eq) for ecosystem assessment, fine particulate matter formation (kg PM2.5 eq), human carcinogenic toxicity (kg 1,4-DCB), human non-carcinogenic toxicity (kg 1,4-DCB), ozone depletion (kg CFC11 eq) for human health assessment and fossil resource scarcity (kg oil eq)for resource assessment based on the importance of the impact categories. Table 1 summarizes the key environmental impact indicators used in this study, along with their respective definitions and units [36].

2.7. Evaluating Economic Sustainability

The economic sustainability of the filter was evaluated by assessing the cost-effectiveness of the proposed options compared to existing methods, considering material, energy, labor, and maintenance costs within the system boundary. Material costs included gravel, sand, and PVC pipe, with prices set at USD 12.20 per ton for sand and gravel [37] and USD 0.89 per kg for PVC [38]. Energy costs accounted for electricity at USD 0.17 per kWh [39] and fuel at USD 3.50 per gallon, with an assumed consumption rate of 7 miles per gallon [40,41]. Clay and water were classified as elementary flows, entering the process without transformation, while oyster shell waste was considered a waste flow and excluded from material costs. Labor costs were primarily associated with sand and gravel washing, oyster shell grinding, and filter assembly, as 3D printing and firing required minimal supervision. Operational and maintenance costs were minimal, involving debris and biofilm removal and occasional backwashing. This comprehensive cost assessment ensures economic sustainability by incorporating all relevant expenses from material acquisition to operation and maintenance.

3. Results and Discussion

This section discusses the findings from the detailed analysis of the different filter options, including a conventional SSF, an SSF with OSP, and 3D printed clay brick scenarios and presents the comparisons between the various options. The discussion is focused on nine targeted environmental metrics: freshwater ecotoxicity (kg 1,4-DCB), freshwater eutrophication (kg P eq), global warming (kg CO2 eq), terrestrial acidification (kg SO2 eq), fine particulate matter formation (kg PM2.5 eq), human carcinogenic toxicity (kg 1,4-DCB), human non-carcinogenic toxicity (kg 1,4-DCB), ozone depletion (kg CFC11 eq), and fossil resource scarcity (kg oil eq).

3.1. Environmental Impacts of the Selected Filtration Units

3.1.1. SSF

The targeted impact categories were evaluated for each filter option under three scenarios: two transport distances of 160.9 km and 1609 km, and a scenario with no material transport (in situ) using the LCA methodology detailed in Section 2.5 and Section 2.6. Briefly, raw material inputs, energy consumption, and transport distances were modeled using inventory data from ELCD 3.2, supplemented by laboratory estimates for specific processes such as oyster shell crushing and brick firing. Using the impact assessment, the raw emissions like CO2, SO2, and P coming from the input calculations were converted to the impact categories global warming potential, acidification, and eutrophication.
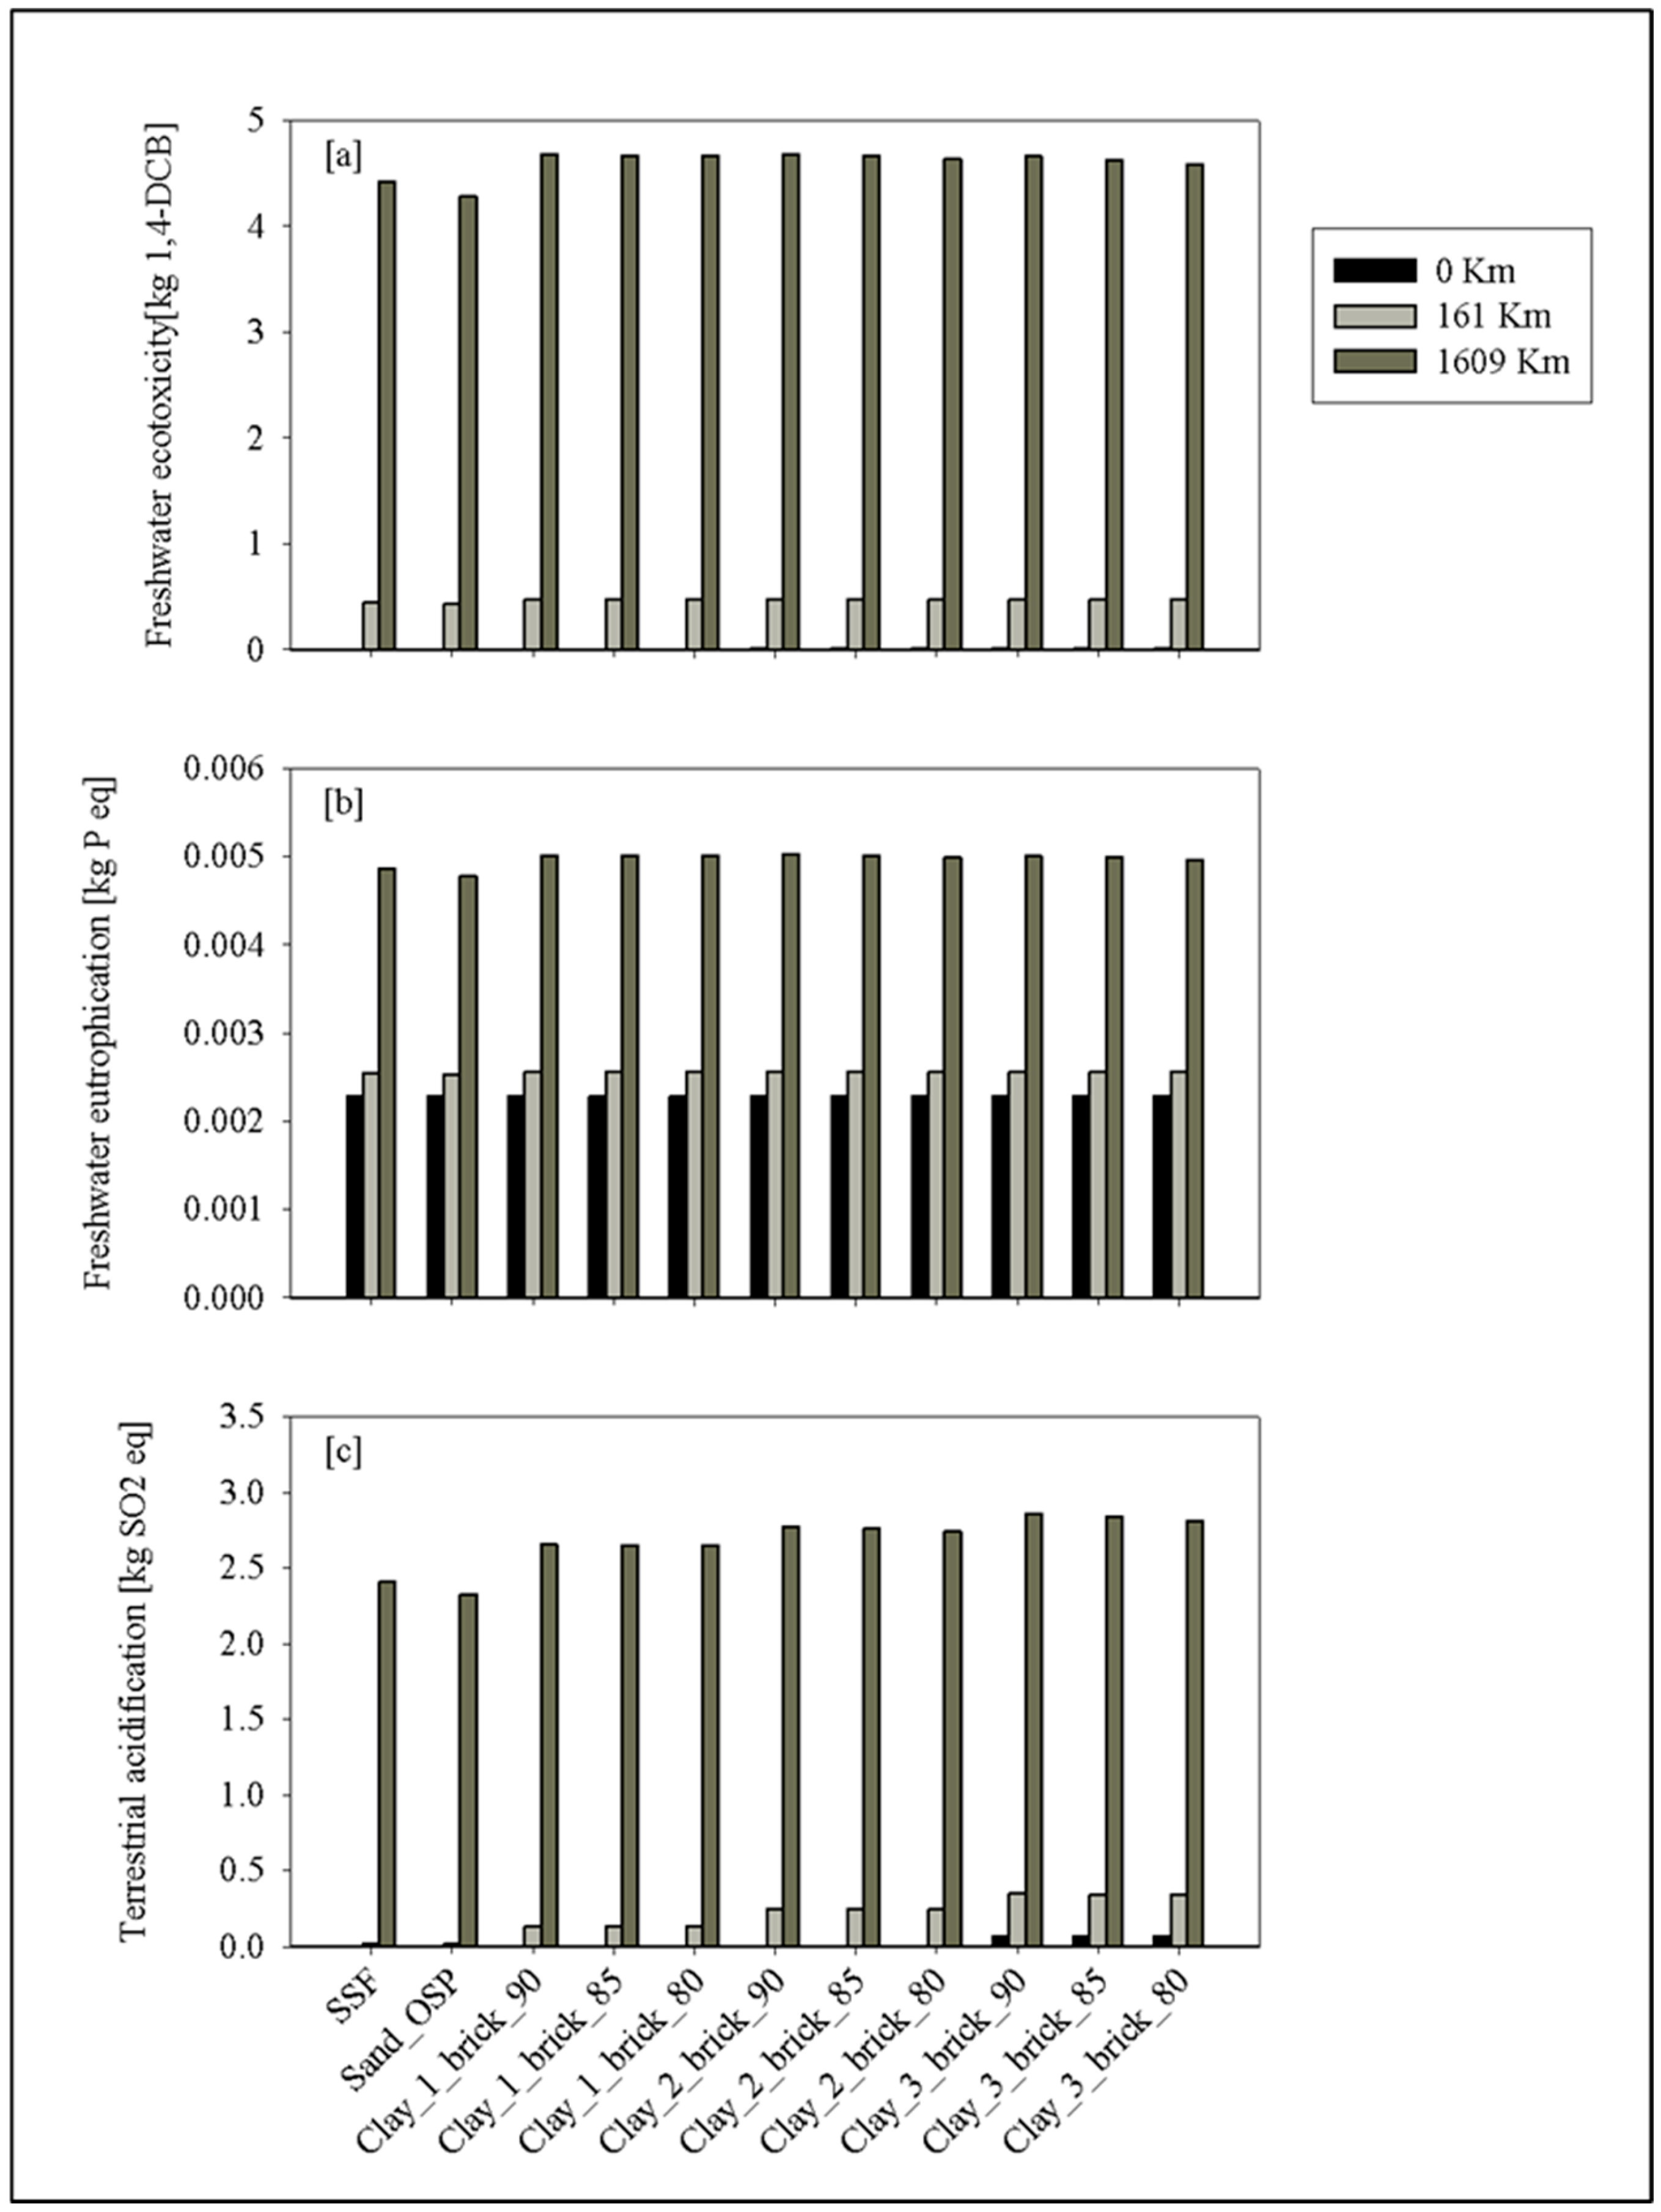
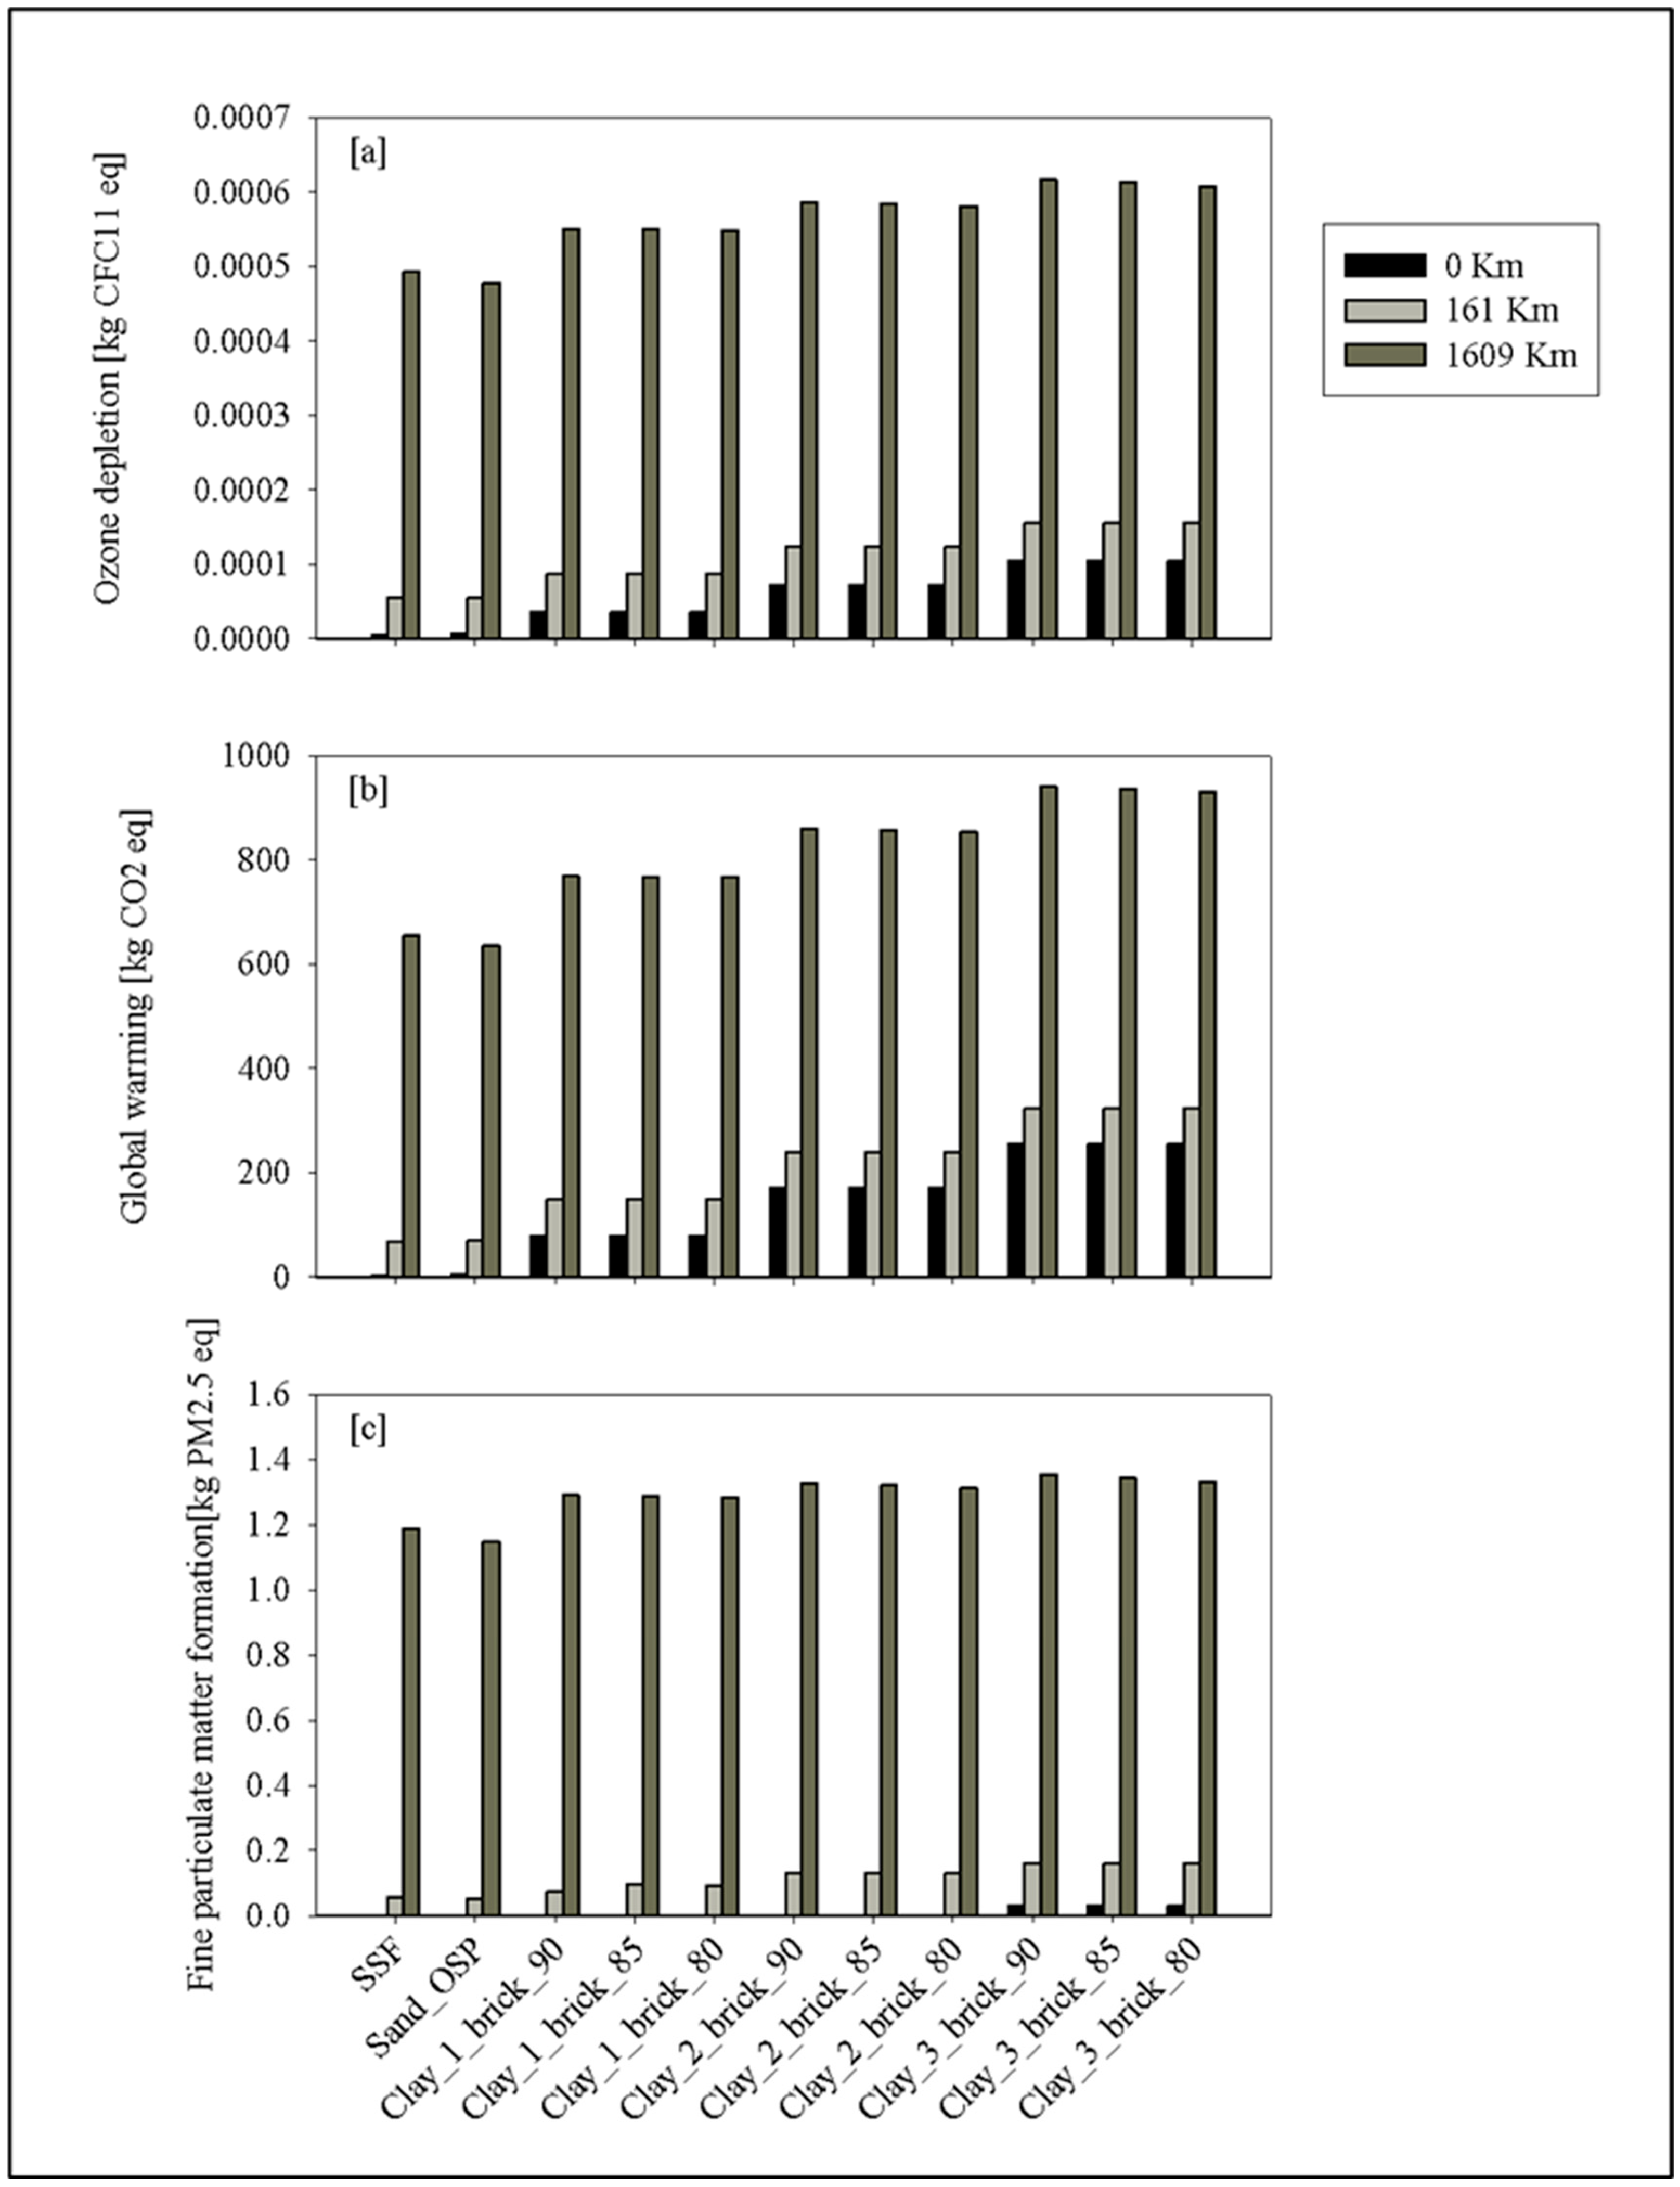
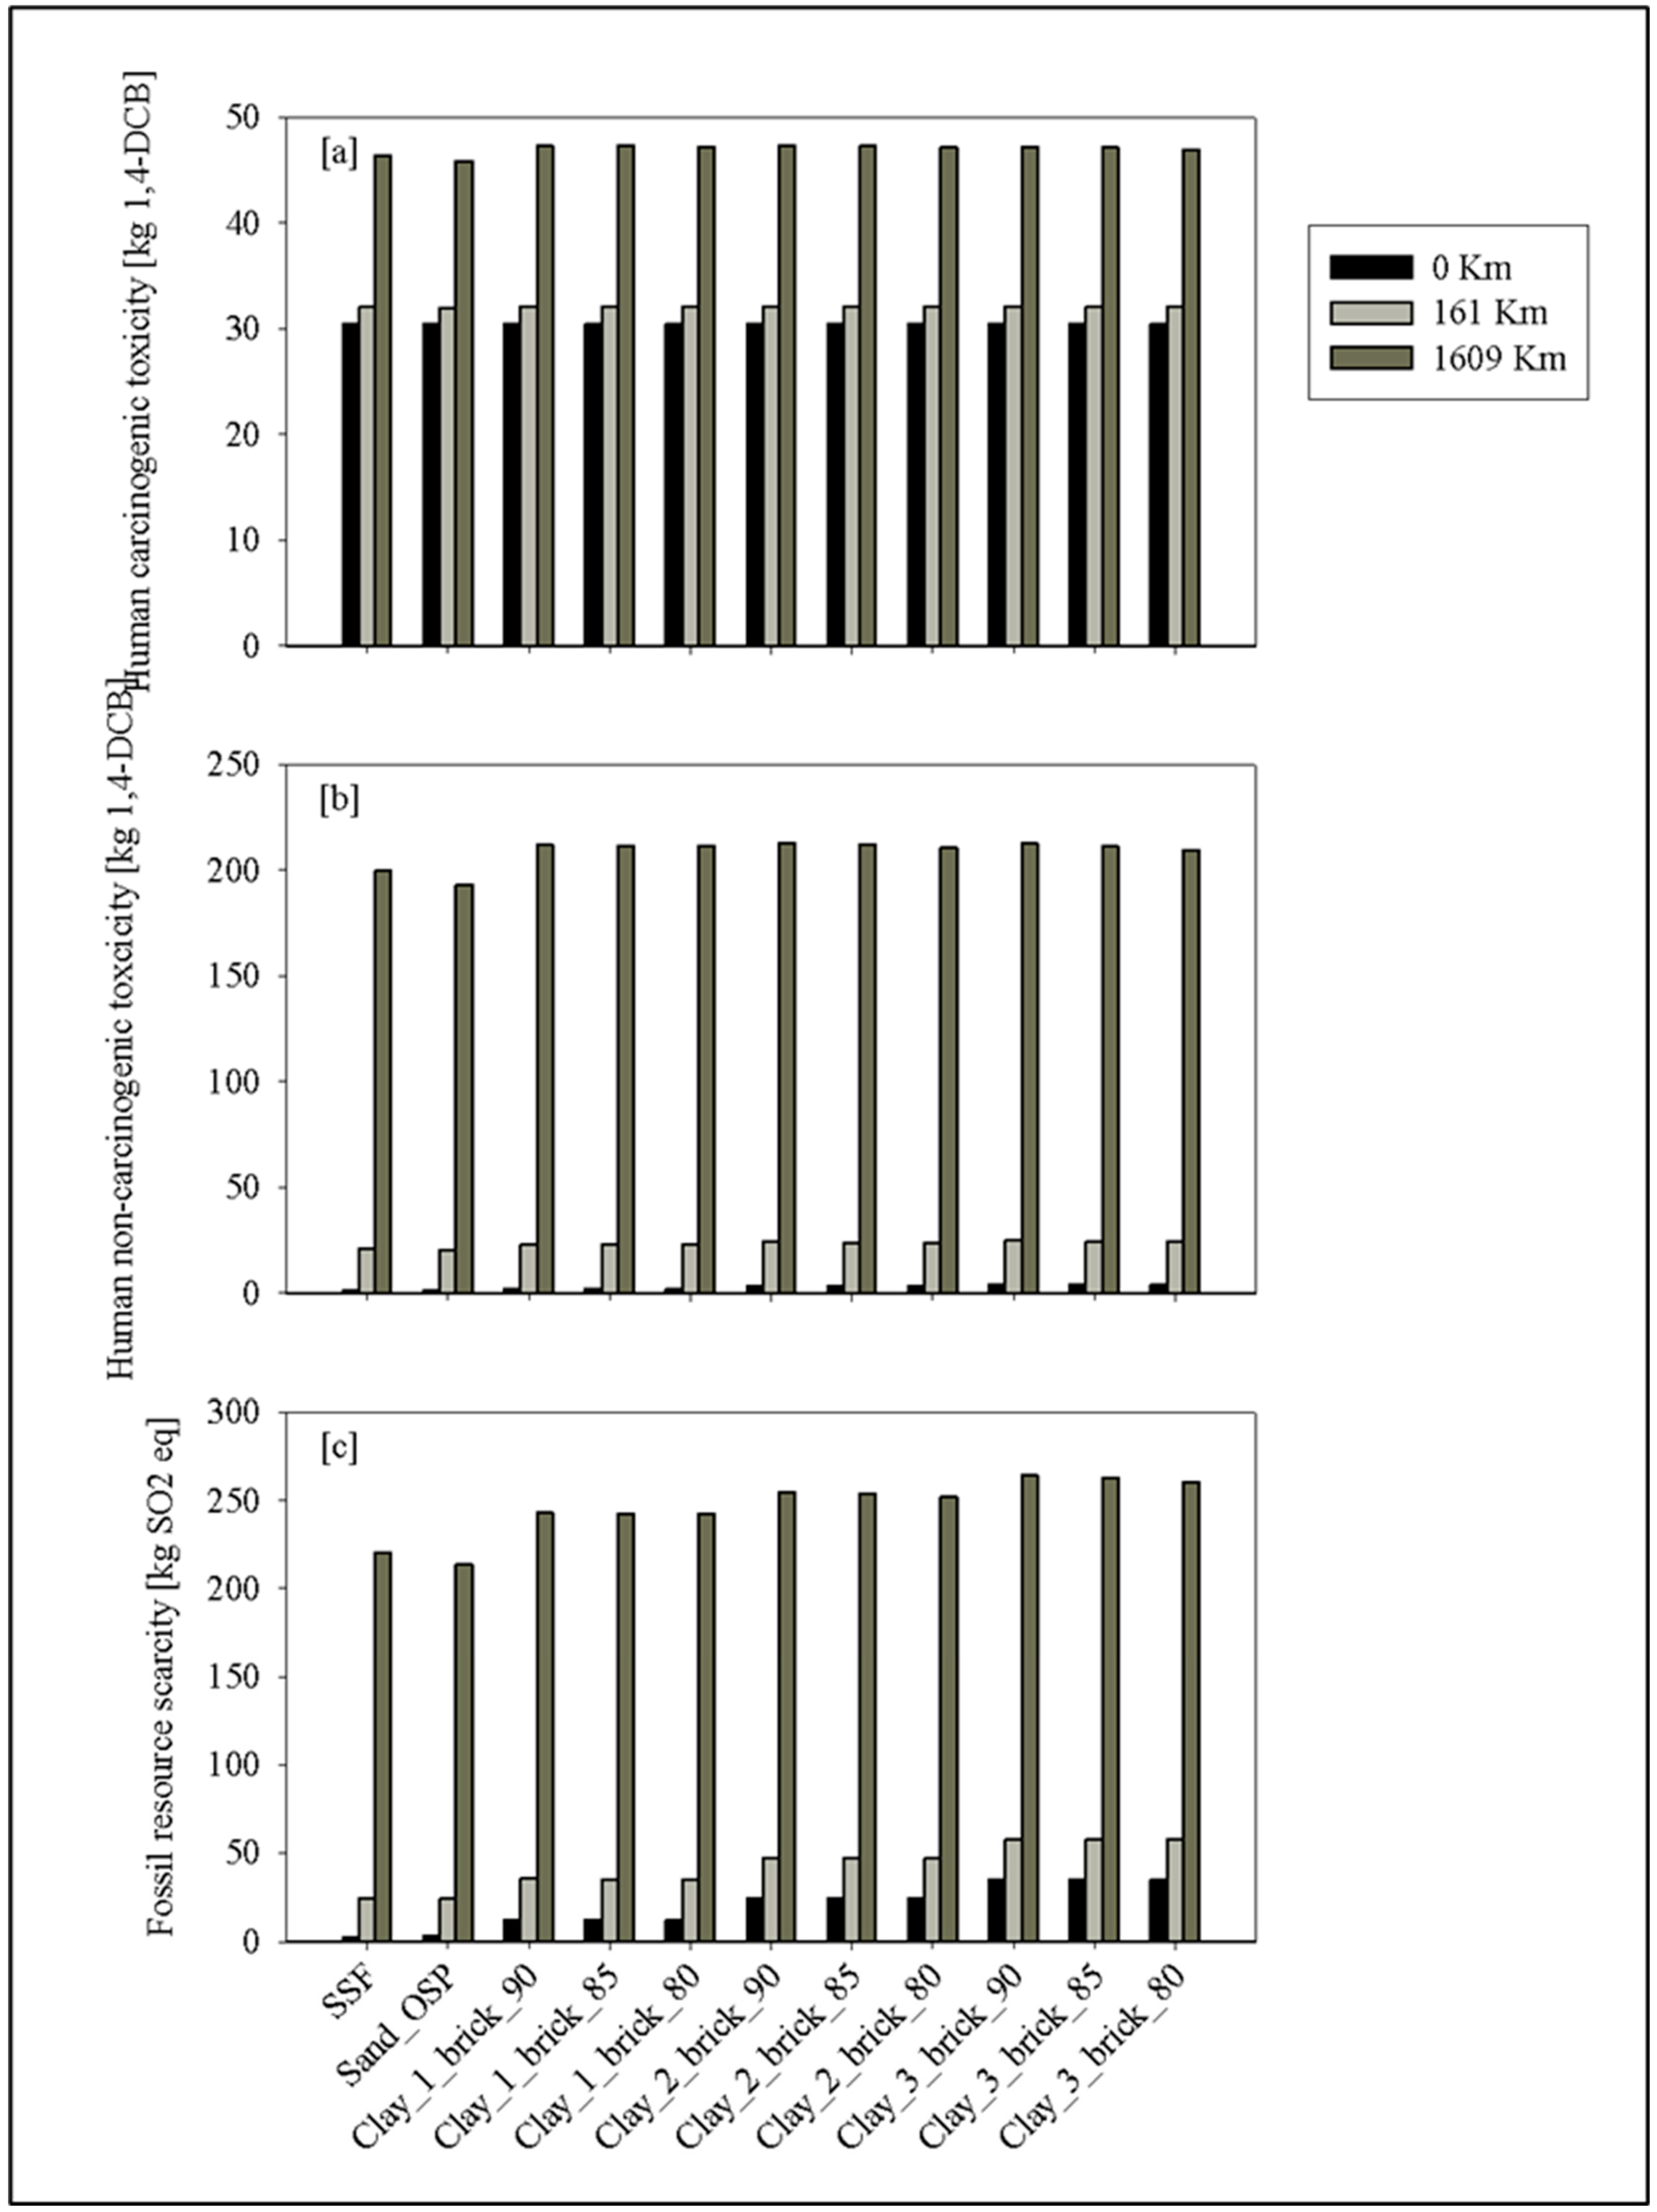
Overall, the SSF exhibited lower environmental impacts under no transport compared to the other filter options. The impacts were negligible for several categories, including freshwater eutrophication (0.002281 kg P eq), ozone depletion (0.00000642 kg CFC11 eq), and human non-carcinogenic toxicity (1.168064 kg 1,4-DCB). The values were negative in categories like freshwater ecotoxicity (−0.00108 kg 1,4-DCB), terrestrial acidification (−0.243414 kg SO2 eq), and fine particulate matter formation (−0.069501 kg PM2.5 eq) (Figure 5 and Figure 6), implying that the SSF could provide a positive environmental impact in the corresponding impact categories, potentially contributing to their reduction. The reason for the higher impacts in the filters with oyster shell powder or bricks could be linked to the higher electricity demand compared to the SSF alone. Other filters needed more electricity for crushing oyster shells, 3D printing bricks, or firing the bricks, which were energy-intensive processes, depending on the size and the number of bricks needed. The SSF consumed electricity only to pump the influent water into the columns. Since electricity generation involves burning fossil fuels, higher electricity consumption directly translates to higher environmental impacts in categories like global warming, ozone depletion, and fossil resource scarcity (Figure 6 and Figure 7).
As the material transportation distance increased, the environmental impacts of the SSF also increased significantly. For instance, under the no transport scenario, the global warming impact factor for SSF was reduced by 95% compared to 161 km transport and by 99% relative to 1609 km transport, highlighting the significant emissions contribution of material transportation. However, the impacts did not exceed those of the brick filter, while those impacts were higher than the SSF with OSP during both 161 km and 1609 km scenarios. This pattern was observed across all the targeted impact categories. Since the material transportation impact was calculated in ton*kilometers (t*km), the sand and clay loads transported for each filter option influenced the impacts. The gravel and the PVC weight remained consistent across all filter options, causing the transport impact to vary based on each filter’s sand and clay weight. Despite these variations, the SSF consistently demonstrated lower impacts than all brick filters, but higher than the SSF with OSP.

3.1.2. SSF with OSP

The targeted impact values for this filter were almost similar to those observed for the SSF under no-material transport conditions, except for a 42% increase in global warming impacts for the SSF with OSP compared to the SSF alone. Some impact category values, including freshwater ecotoxicity, terrestrial acidification and fine particulate matter formation (Figure 5 and Figure 6) showed negative values due to their contribution to reducing these impacts. In contrast, the SSF with OSP exhibited lower impacts than the SSF under both evaluated material transport distances. For the 161 km transport scenario, other than global warming, all other impact categories exhibited reductions. The impact reductions ranged from 0.2% to 32.0%, with the maximum observed in terrestrial acidification and the minimum in human carcinogenic toxicity. For the 1609 km transport scenario, slight impact reductions were observed in all categories, which ranged between 1.1% and 4.0%, where the maximum and minimum reductions were observed in acidification and carcinogenic toxicity, respectively.
Oyster shells accumulate in large amounts as waste in the food industry, creating environmental issues. Using waste like oyster shells to replace sand represents a sustainable approach for mitigating waste disposal issues and conserving natural resources. Replacing sand with OSP could reduce the required amount of sand and potentially lower the impact category values. In a previous LCA study related to the application of waste oyster shell in construction materials, replacing fine aggregates with oyster shells in mortar production accounted for a reduction in nine impact categories out of the twelve targeted categories including global warming, ozone depletion, and acidification [31]. In a separate study, using oyster shell waste as a drainage material reduced CO2 emissions by 19% compared to natural sand [42].
Due to the electricity consumption in the SSF with OSP to crush the oyster shell, the expected impact reduction from the sand replacement was not observed under the no-material transport scenario. When material transport was considered, the transport impact was higher in the SSF with more sand and increased with the travel distance. Consequently, the transport impacts may have surpassed the electricity consumption impacts, especially in impact categories (e.g., terrestrial acidification, human non-carcinogenic toxicity, and fine particulate matter formation) where the SSF with OSP demonstrated a reduction compared to the SSF. The reductions for the SSF with OSP ranged between 0.15% and 32.0% for a 161 km distance, while it ranged between 1.0% and 3.5% for a 1609 km distance. The impact of all other options using bricks was higher than that of the SSF with OSP.

3.1.3. SSF with Bricks

Single-brick filters with any clay/OSP ratio (90:10, 85:15, and 80:20) exhibited the lowest impact across all targeted categories under no-material transport, with only negligible increases as the OSP content rose. Two-brick and three-brick filters followed the same trend but had higher overall impacts, ranging from 0.2 to 62.0% and 0.3 to 76.0% more than single-brick filters, respectively. Single- and two-brick filters showed reductions in terrestrial acidification and fine particulate matter formation, while three-brick filters had the highest overall impact. Compared to the SSF and the SSF with OSP, single-brick filters showed 43.0–96.0% and 42.0–93.0% higher impacts in categories like global warming, ozone depletion, and fossil resource scarcity (Figure 6 and Figure 7).
For material transport within 161 km, single-brick filters maintained lower impacts, with the 80:20 clay/OSP ratio performing best. Two- and three-brick filters had 0.03–75.0% and 0.03–82.0% higher impacts than single-brick filters. The largest deviation was observed in terrestrial acidification, where single-brick filters exceeded the SSF and the SSF with OSP by 83.0% and 89.0%, respectively. In other categories, single-brick filters showed 0.3–54.0% and 0.5–53.0% higher impacts than the SSF and the SSF with OSP.
For material transport within 1609 km, single-brick filters remained lower in categories such as terrestrial acidification, global warming, and fine particulate matter formation (Figure 5 and Figure 6). However, impacts on human carcinogenic toxicity, freshwater ecotoxicity, and freshwater eutrophication (Figure 5 and Figure 7) decreased as the brick number and OSP content increased, with the three-brick filter (80:20) showing the lowest impact in these categories. In other categories, two- and three-brick filters showed 2.0–10.0% and 4.0–17.0% higher impacts than single-brick filters. Unlike at 161 km, at 1609 km, single-brick filters had the highest increase in global warming impacts (15–17% higher than the SSF and the SSF with OSP) and 2–13% higher in other impact categories.

3.2. Economic Sustainability

Economic sustainability was assessed based on the cost per filter unit required to treat 1 FU. The final cost for each filter scenario was derived from the values and assumptions detailed earlier in the paper (Table 2). The labor cost of USD 200 was included as a one-time expense covering the initial installation and material preparation of the filtration units. This estimate accounts for tasks such as assembling the filtration columns, preparing and loading filter media (e.g., sand, gravel, OSP), and setting up the system for operation. Due to the innovative nature of the system and the absence of directly comparable installation cost references in the literature, we based this estimate on conservative assumptions. Operational and maintenance labor costs were not included, as they are minimal in comparison and do not significantly affect the overall cost analysis. According to the calculations, the SSF with OSP was the most cost-effective option, approximately USD 1 cheaper than the SSF. The key difference between the two systems was the electricity cost needed to crush the oyster shells for the SSF with oyster shell powder. Filters incorporating bricks showed a slightly higher cost than the SSF and the SSF with OSP. The total costs increased with the number of bricks used. This rise in cost was primarily due to the increasing electricity expenses associated with grinding oyster shells, 3D printing, and firing the bricks. Nonetheless, the increase in costs with more bricks was minimal, amounting to only USD 20–40. Consequently, the highest total cost was observed for the three-brick filter columns. The differences in total costs among the three clay/OSP ratios for the three-brick filter columns were negligible. The transportation cost for 161 km is ~USD 50.02, while for 1609 km it is ~USD 500.01. To yield overall economic benefits from any option evaluated, it would be better if the transportation distance did not exceed 161 km.

3.3. Filtration Performance: Basis for LCA

Assessing filtration efficiency is essential for understanding the viability of alternative materials in slow sand filtration. Previous studies have demonstrated that clay, OSP, and 3D-printing technologies enhance filtration performance, making them promising solutions for sustainable wastewater treatment. Given their potential benefits, an LCA was conducted to evaluate their environmental and economic implications. This section presents filtration efficiency results, serving as a foundation for broader sustainability analysis.
There are minimal studies where clay and oyster shell powder have been used together or in 3D-printed form, specifically within slow sand filters for wastewater treatment. However, both materials have been proven effective in removing various contaminants from water or wastewater in different forms. Clay minerals can act as natural barriers to trap contaminants and immobilize bacteria due to benefits like a high specific area, small grain size, availability, affordability, and high sorption capacity [43,44,45]. Clay-based materials effectively eliminate various pollutants through mechanisms such as ion exchange, electrostatic attraction, and hydrogen bonding [46].
Recently, 3D printing has been incorporated into molding clay, commonly into ceramic filters for water treatment. These ceramic filters are effective at removing suspended solids and pathogens, thanks to their adjustable pore size and porosity [47]. The ceramic membranes fabricated with inkjet printing, which provides advantages such as cost efficiency, precise geometry control, and homogeneous microstructure, exhibited 83% turbidity removal from pond water [48]. The 3D-printed high-surface honeycomb substrates showed considerable removal of total suspended solids (TSS), biological oxygen demand (BOD), and chemical oxygen demand (COD) in sewage treatment [49]. In another study, a high-resolution 3D printer was used to print zeolite clay paste into a hyperboloid-like structure, achieving a high surface area and maintaining structural integrity when calcined at 600 °C. The clay structure successfully removed over 90% of lead (Pb) and copper (Cu) from wastewater [50].
Oyster shell waste has often been used as an adsorbent, photocatalyst, or nanomaterial to remove contaminants like heavy metals [51], antibiotics [52], and phosphorus [53,54]. In a previous study, unburned oyster shell waste was used as a filler in an up-flow filter to treat drinking water. Oyster shell media removed contaminants mainly through adsorption until the biofilm was created after 45 days of use. High turbidity removal efficiencies (>60%) were obtained in the filter. The effluent pH could be maintained at a stable value of 7.5 due to the buffering capacity of the oyster shell media [55]. A comparison of the effectiveness of calcined oyster shell (COS) and granular activated carbon (GAC) in biofilters was performed in a previous experiment. According to the results, the turbidity removal by COS was 38%, while it was 29% for GAC. COS was more effective in pH stabilization. Additionally, it was found that the COS could colonize a more diverse and rich microbial community [56]. Calcined OSP produces calcium oxide (CaO) when fired at temperatures above 600 °C, making it highly active. CaO is helpful for pH adjustments in water or wastewater. Furthermore, calcium ions from calcined OSP can form calcium-based compounds and organic complexes with harmful anions, aiding in the removal of heavy metals and nutrients like phosphates from water. Calcination also enhances contaminant removal through improved porous microstructure and specific surface area [57,58].
The benefits of clay, OSP, and 3D-printing technology in water treatment demonstrated in the previous studies suggest that exploring these innovative approaches is worthwhile and holds significant potential beyond traditional SSFs in treating wastewater for reuse.

4. Conclusions

In this study, we conducted a life cycle assessment (LCA) to evaluate the environmental and economic impacts of innovative wastewater-treatment systems utilizing low-cost, eco-friendly materials such as oyster shell powder (OSP). The results showed that SSFs with OSP consistently exhibited the lowest environmental impact among the simulated scenarios, particularly in no-transport scenarios, positioning them as a valuable sustainable alternative. In contrast, brick-based filters had higher impacts due to electricity consumption for 3D printing and firing them, even though three-brick columns showed low toxicity effects in long-distance transport scenarios. Cost analysis confirmed SSFs with OSP as the most cost-effective option (USD 321.80), followed closely by SSFs (USD 322.26), with single-brick columns (90:10) balancing impact and cost among brick-based alternatives. Future research should refine system performance and ensure transport distances remain under 161 km to maintain economic feasibility. Overall, SSFs with OSP remain the preferred choice, while single-brick columns (90:10) offer a viable alternative when balancing impact, cost, and effectiveness.
While this study provides valuable insights into the environmental and economic impacts of innovative wastewater-treatment systems, certain limitations should be acknowledged. As mentioned earlier, there was a limitation with the database selected for the evaluation. The ELCD 3.2 database was selected for this LCA study based on its availability (free-access database) and the relevance of its inputs for the study. While it is not region-specific to the USA, its reliability and the availability of the providers connected to input flows needed for the impact calculations made ELCD 3.2 a suitable choice. Efforts were made to align the data as closely as possible with local conditions to maintain accuracy and relevance. In future studies, it is advisable to use region-specific databases to enhance the precision of the results. Future research should also incorporate sensitivity analysis to assess the impact of varying assumptions, such as energy consumption, transportation distances, and material sourcing, to further refine environmental assessments and enhance the robustness of sustainability evaluations.
To the best of our knowledge, there are no similar experimental approaches used before. This lack of comparable data made it difficult to benchmark the performance and validate the findings. As a result, systems representing more effective alternatives than conventional SSFs were suggested in the study, with the recommendation to conduct future research to provide more comprehensive comparisons and understanding of the OSP’s performance in various configurations. However, due to the unique features of clay and OSP beneficial to water treatment and the promising results these materials have shown in previous studies under different configurations, SSFs with OSP or brick columns represent a promising and effective alternative to SSFs alone. Additionally, the long-term performance and maintenance frequency of these filters could influence their sustainability over an extended period. This study focused on the construction and operation stages of the filtration systems, without considering long-term maintenance, degradation, or end-of-life disposal impacts. Future studies should address these considerations, evaluating how material durability and maintenance requirements might alter environmental outcomes over a longer system life.

Supplementary Materials

The following supporting information can be downloaded at: https://www.mdpi.com/article/10.3390/su17125428/s1, Figure S1. System boundaries for the slow sand filter (SSF); Table S1. Process inventory for the raw materials and energy sources of the selected filter designs per functional unit (Treating 4 m3 of wastewater to irrigate a private yard daily); Table S2. Process inventory for the transportation when materials are transported from various distances (161 km and 1609 km).

Author Contributions

Conceptualization, W.B.P., H.A. and M.D.; Methodology, W.B.P.; Investigation, W.B.P.; Writing—original draft, W.B.P.; Writing—review & editing, W.B.P., H.A. and M.D.; Visualization, W.B.P. and M.D.; Supervision, H.A. and M.D. All authors have read and agreed to the published version of the manuscript.

Funding

This research received no external funding.

Institutional Review Board Statement

Not applicable.

Informed Consent Statement

Not applicable.

Data Availability Statement

The original contributions presented in this study are included in the article. Further inquiries can be directed to the corresponding author.

Acknowledgments

The authors would like to acknowledge Trane Technologies Foundation and its efforts that contributed to a grant to increase sustainability learning, job readiness, and community engagement. In particular, the first author has been supported through this grant.

Conflicts of Interest

The authors declare no conflict of interest.

References

  1. EPA U.S. Basic Information about Water Reuse. 2023. Available online: https://www.epa.gov/waterreuse/basic-information-about-water-reuse#basics (accessed on 9 July 2023).
  2. Gebreeyesus, M.; Gwenzi, W.; Mwamila, T.B.; Noubactep, C. Mitigating freshwater supply shortages in regions of high demand in Ethiopia: Integrated water resources management approach. Environ. Earth Sci. 2025, 84, 99. [Google Scholar] [CrossRef]
  3. Gude, V.G. Desalination and water reuse to address global water scarcity. Rev. Environ. Sci. Bio/Technol. 2017, 16, 591–609. [Google Scholar] [CrossRef]
  4. Florides, F.; Giannakoudi, M.; Ioannou, G.; Lazaridou, D.; Lamprinidou, E.; Loukoutos, N.; Spyridou, M.; Tosounidis, E.; Xanthopoulou, M.; Katsoyiannis, I.A. Water Reuse: A Comprehensive Review. Environments 2024, 11, 81. [Google Scholar] [CrossRef]
  5. Pathiranage, W.B.; Bray, L.; Jones, K.; Redwine, N.; Saralvarez, J.; D’Alessio, M. Perception and acceptance towards water reuse in the Southeast United States: A public survey. Sci. Total Environ. 2024, 908, 168224. [Google Scholar] [CrossRef]
  6. Barman, S.; Gavit, P.; Chowdhury, S.; Chatterjee, K.; Nain, A. 3D-Printed Materials for Wastewater Treatment. JACS Au 2023, 3, 2930–2947. [Google Scholar] [CrossRef]
  7. Fijoł, N.; Aguilar-Sánchez, A.; Mathew, A.P. 3D-printable biopolymer-based materials for water treatment: A review. Chem. Eng. J. 2022, 430, 132964. [Google Scholar] [CrossRef]
  8. Pathiranage, W.B.; Sharp, C.; Hong, Y.; Williams, C.; Algharibeh, O.; McKnight, A.; Williams, C.; Alkhateb, H.; D’Alessio, M. Enhancing slow sand filtration with 3D-printed eco-friendly bricks. Clean. Water 2025, 3, 100061. [Google Scholar] [CrossRef]
  9. Pathiranage, W.B.; Sharp, C.; Williams, C.; McKnight, A.; Algharibeh, O.; Hong, Y.; Williams, C.; Rushing, G.; Alkhateb, H.; D’Alessio, M. Enhanced ability of 3D-printed bricks to treat wastewater under variable conditions. J. Environ. Manag. 2025, 386, 125690. [Google Scholar] [CrossRef]
  10. Ramjeawon, T. Introduction to Sustainability for Engineers; CRC Press: Boca Raton, FL, USA, 2020. [Google Scholar]
  11. Manda, B.K.; Worrell, E.; Patel, M.K. Innovative membrane filtration system for micropollutant removal from drinking water–prospective environmental LCA and its integration in business decisions. J. Clean. Prod. 2014, 72, 153–166. [Google Scholar] [CrossRef]
  12. Walsh, T.; Mellor, J. Comparative life cycle assessment of four commonly used point-of-use water treatment technologies. J. Water Sanit. Hyg. Dev. 2020, 10, 862–873. [Google Scholar] [CrossRef]
  13. Bové, J.; Pujol, J.; Arbat, G.; Duran-Ros, M.; de Cartagena, F.R.; Puig-Bargués, J. Environmental assessment of underdrain designs for a sand media filter. Biosyst. Eng. 2018, 167, 126–136. [Google Scholar] [CrossRef]
  14. Bhakar, V.; Kumar, D.H.; Sai, N.K.; Sangwan, K.S.; Raghuvanshi, S. Life cycle assessment of filtration systems of reverse osmosis units: A case study of a university campus. Procedia CIRP 2016, 40, 268–273. [Google Scholar] [CrossRef]
  15. Ortiz, M.; Raluy, R.; Serra, L. Life cycle assessment of water treatment technologies: Wastewater and water-reuse in a small town. Desalination 2007, 204, 121–131. [Google Scholar] [CrossRef]
  16. Yang, X.; Huang, G.; Zhang, P.; An, C.; Yao, Y.; Li, Y.; Zhou, S. Life cycle-based water footprint analysis of ceramic filter for point-of-use water purification in remote areas. Sci. Total Environ. 2021, 786, 147424. [Google Scholar] [CrossRef]
  17. Behjat, M.; Svanström, M.; Peters, G.; Wennberg, N. Life Cycle Assessment of recirculating aquaculture systems with innovative biochar filter for enhanced nutrient recirculation. Resour. Environ. Sustain. 2025, 21, 100233. [Google Scholar] [CrossRef]
  18. OpenLCA. 2007. Available online: https://www.openlca.org/ (accessed on 15 May 2025).
  19. Anang, S.; Nasr, M.; Fujii, M.; Ibrahim, M.G. Synergism of life cycle assessment and sustainable development goals techniques to evaluate downflow hanging sponge system treating low-carbon wastewater. Sustainability 2024, 16, 2035. [Google Scholar] [CrossRef]
  20. Allami, D.M.; Sorour, M.T.; Moustafa, M.; Elreedy, A.; Fayed, M. Life cycle assessment of a domestic wastewater treatment plant simulated with alternative operational designs. Sustainability 2023, 15, 9033. [Google Scholar] [CrossRef]
  21. Longo, S.; d’Antoni, B.M.; Bongards, M.; Chaparro, A.; Cronrath, A.; Fatone, F.; Lema, J.M.; Mauricio-Iglesias, M.; Soares, A.; Hospido, A. Monitoring and diagnosis of energy consumption in wastewater treatment plants. A state of the art and proposals for improvement. Appl. Energy 2016, 179, 1251–1268. [Google Scholar] [CrossRef]
  22. Sabeen, A.H.; Noor, Z.Z.; Ngadi, N.; Almuraisy, S.; Raheem, A.B. Quantification of environmental impacts of domestic wastewater treatment using life cycle assessment: A review. J. Clean. Prod. 2018, 190, 221–233. [Google Scholar] [CrossRef]
  23. Li, X.; Zhu, Y.; Zhang, Z. An LCA-based environmental impact assessment model for construction processes. Build. Environ. 2010, 45, 766–775. [Google Scholar] [CrossRef]
  24. ISO 14040:2006; Environmental Management—Life Cycle Assessment—Principles and Framework. ISO: Geneva, Switzerland, 2006.
  25. ISO 14044:2006; Environmental Management—Life Cycle Assessment—Requirements and Guidelines. ISO: Geneva, Switzerland, 2006.
  26. Rose Law Group Reporter. Stacking up Yard Sizes by State. 2018. Available online: https://roselawgroupreporter.com/2018/10/stacking-up-yard-sizes-by-state/#:~:text=The%20average%20residential%20lawn%20in,Share%20this! (accessed on 2 February 2025).
  27. Lipford, D.; Perry, C. How To Calculate Lawn Irrigation Water Usage and Costs. 2024. Available online: https://todayshomeowner.com/lawn-garden/guides/calculating-lawn-irrigation-costs/ (accessed on 1 March 2024).
  28. Partinoudi, V.; Collins, M.R.; Unger, M.; Dwyer, P. Integrating Biological Filtration Treatment Systems. 2006. Available online: https://www.unh.edu/wttac/Presentations/partinoudi_biological_filtration_treatment.pdf (accessed on 15 May 2025).
  29. The Engineering Tool Box. Densities of Common Products. 2010. Available online: https://www.engineeringtoolbox.com/density-materials-d_1652.html (accessed on 25 February 2025).
  30. The Engineering Tool Box. Dirt and Mud—Densities. 2010. Available online: https://www.engineeringtoolbox.com/dirt-mud-densities-d_1727.html (accessed on 1 June 2025).
  31. Shao, W.-C.; Lu, C.-L.; Dong, Y.-W.; Chen, J.-W.; Chiang, Y.-T. Research on Innovative Green Building Materials from Waste Oyster Shells into Foamed Heat-Insulating Bricks. Clean. Mater. 2024, 11, 100222. [Google Scholar] [CrossRef]
  32. WASP. 60100 HDP Large Scale Printing with Granular Materials. 2024. Available online: https://www.3dwasp.com/wp-content/uploads/dlm_uploads/2023/09/60100-HDP-Technical-Sheet.pdf (accessed on 15 May 2025).
  33. TEquipment. Thermo Scientific LBM Moldatherm. Available online: https://www.tequipment.net/Thermo-Scientific/LBM-Moldatherm-1.99L/Laboratory-Oven/ (accessed on 26 July 2024).
  34. Nelson, D. How Much Does It Cost to Operate my Submersible Well Pump? 2018. Available online: https://www.rcworst.com/blog/How-Much-does-it-Cost-to-Operate-my-Submersible-Well-Pump#:~:text=The%20power%20consumption%20of%20the,is%20$0.15%20per%20kilowatt%20hour (accessed on 1 January 2025).
  35. European Commission Joint Research Centre. European Reference Life Cycle Database (ELCD) III; The Joint Research Centre: Brussels, Belgium, 2013. [Google Scholar]
  36. Huijbregts, M.A.; Steinmann, Z.J.; Elshout, P.M.; Stam, G.; Verones, F.; Vieira, M.; Zijp, M.; Hollander, A.; Van Zelm, R. ReCiPe2016: A harmonised life cycle impact assessment method at midpoint and endpoint level. Int. J. Life Cycle Assess. 2017, 22, 138–147. [Google Scholar] [CrossRef]
  37. Jaganmohan, M.; Average U.S. Price of Construction Sand and Gravel 2010–2023. 2024. Available online: https://www.statista.com/statistics/219381/sand-and-gravel-prices-in-the-us/#:~:text=In%20the%20United%20States%2C%20the,per%20metric%20ton%20in%202023 (accessed on 26 July 2024).
  38. Business Analytiq. PVC Price Index. 2025. Available online: https://businessanalytiq.com/procurementanalytics/index/pvc-price-index/ (accessed on 25 January 2025).
  39. Choose Energy. Electricity Rates by State. 2024. Available online: https://www.chooseenergy.com/electricity-rates-by-state/ (accessed on 26 July 2024).
  40. U.S. Department of Energy. Average On-Road Fuel Economy for Medium/Heavy Trucks Ranged from 4.0 mpg to 10.1 mpg in 2021. 2024. Available online: https://www.energy.gov/eere/vehicles/articles/fotw-1342-may-13-2024-average-road-fuel-economy-mediumheavy-trucks-ranged-40#:~:text=The%20average%20fuel%20economy%20of,electrification%20or%20other%20alternative%20fuels (accessed on 20 February 2025).
  41. U.S. Energy Information Administration. Gasoline and Diesel Fuel Update. 2025. Available online: https://www.eia.gov/petroleum/gasdiesel/ (accessed on 20 February 2025).
  42. Jeon, J.; Son, Y.; Kim, D.; Kim, T. Estimation of Life Cycle CO2 emissions using oyster shells and bottom ash as materials for soil-mixing and a drainage layer. J. Clean. Prod. 2020, 270, 122477. [Google Scholar] [CrossRef]
  43. Nayak, P.S.; Singh, B.K. Removal of phenol from aqueous solutions by sorption on low cost clay. Desalination 2007, 207, 71–79. [Google Scholar] [CrossRef]
  44. De Gisi, S.; Lofrano, G.; Grassi, M.; Notarnicola, M. Characteristics and adsorption capacities of low-cost sorbents for wastewater treatment: A review. Sustain. Mater. Technol. 2016, 9, 10–40. [Google Scholar] [CrossRef]
  45. ElSayed, E.; Ibrahim, L.A.; Ghandour, A.; Zelenakova, M.; Vranayova, Z.; Abu-Hashim, M. Efficiency of natural clay mineral adsorbent filtration systems in wastewater treatment for potential irrigation purposes. Sustainability 2021, 13, 5738. [Google Scholar] [CrossRef]
  46. Gopal, G.; Mukherjee, A. Removal of emerging pollutants by clay and clay-nZVI nanocomposites-A review. Environ. Technol. Rev. 2023, 12, 476–492. [Google Scholar] [CrossRef]
  47. Akowanou, A.V.O.; Deguenon, H.E.J.; Groendijk, L.; Aina, M.P.; Yao, B.K.; Drogui, P. 3D-printed clay-based ceramic water filters for point-of-use water treatment applications. Prog. Addit. Manuf. 2019, 4, 315–321. [Google Scholar] [CrossRef]
  48. He, Z.; Shanmugasundaram, T.; Singh, G. Inkjet 3D printing of clay ceramics for water treatment. Prog. Addit. Manuf. 2018, 3, 215–219. [Google Scholar] [CrossRef]
  49. Biswas, P.; Mamatha, S.; Varghese, K.; Johnson, R.; Vijay, R.; Kumar, R. 3D printing of high surface area ceramic honeycombs substrates and comparative evaluation for treatment of sewage in Phytorid application. J. Water Process Eng. 2020, 37, 101503. [Google Scholar] [CrossRef]
  50. Khalil, A.; Hashaikeh, R.; Hilal, N. 3D printed zeolite-Y for removing heavy metals from water. J. Water Process Eng. 2021, 42, 102187. [Google Scholar] [CrossRef]
  51. Xu, X.; Liu, X.; Oh, M.; Park, J. Oyster shell as a low-cost adsorbent for removing heavy metal ions from wastewater. Pol. J. Environ. Stud 2019, 28, 2949–2959. [Google Scholar] [CrossRef] [PubMed]
  52. Yang, X.-G.; Fu, X.; Cui, Y. Removal of tetracycline from wastewater by Fe-modified oyster shell. Ferroelectrics 2021, 581, 73–81. [Google Scholar] [CrossRef]
  53. Xu, C.; Liu, R.; Chen, L. Removal of phosphorus from domestic sewage in rural areas using oyster shell-modified agricultural waste–rice husk biochar. Processes 2023, 11, 2577. [Google Scholar] [CrossRef]
  54. Yamashiro, K.; Ikemoto, R.; Ogata, F.; Tanei, S.; Kawasaki, N. Evaluation of the Mechanism of Phosphate Removal Using Oyster Shell Powder in Aqueous Environments. Chem. Pharm. Bull. 2023, 71, 655–660. [Google Scholar] [CrossRef]
  55. Lin, H.; Hou, Q.; Luo, Y.; Hu, G.; Yu, J.; Yu, R. Reutilization of waste oyster shell as filler for filter for drinking water pretreatment: Feasibility and implication. J. Environ. Manag. 2022, 315, 115142. [Google Scholar] [CrossRef]
  56. Lin, H.; Hou, Q.; Sun, X.; Hu, G.; Yu, R. Oyster shell for drinking water filtration compared with granular activated carbon: Advantages and limitations. Environ. Sci. Pollut. Res. 2023, 30, 121475–121486. [Google Scholar] [CrossRef]
  57. Hao, L.; Gao, W.; Yan, S.; Niu, M.; Liu, G.; Hao, H. Preparation and characterization of porous ceramics with low-grade diatomite and oyster shell. Mater. Chem. Phys. 2019, 235, 121741. [Google Scholar] [CrossRef]
  58. Wang, H.; Zhang, M.; Luo, Z.; Wang, Y.; Wen, X.; Wang, Z. Effects of calcined oyster shell powder composited with iron salt on the simultaneous removal of phosphorus and arsenic during algal bloom control process. Algal Res. 2024, 80, 103546. [Google Scholar] [CrossRef]
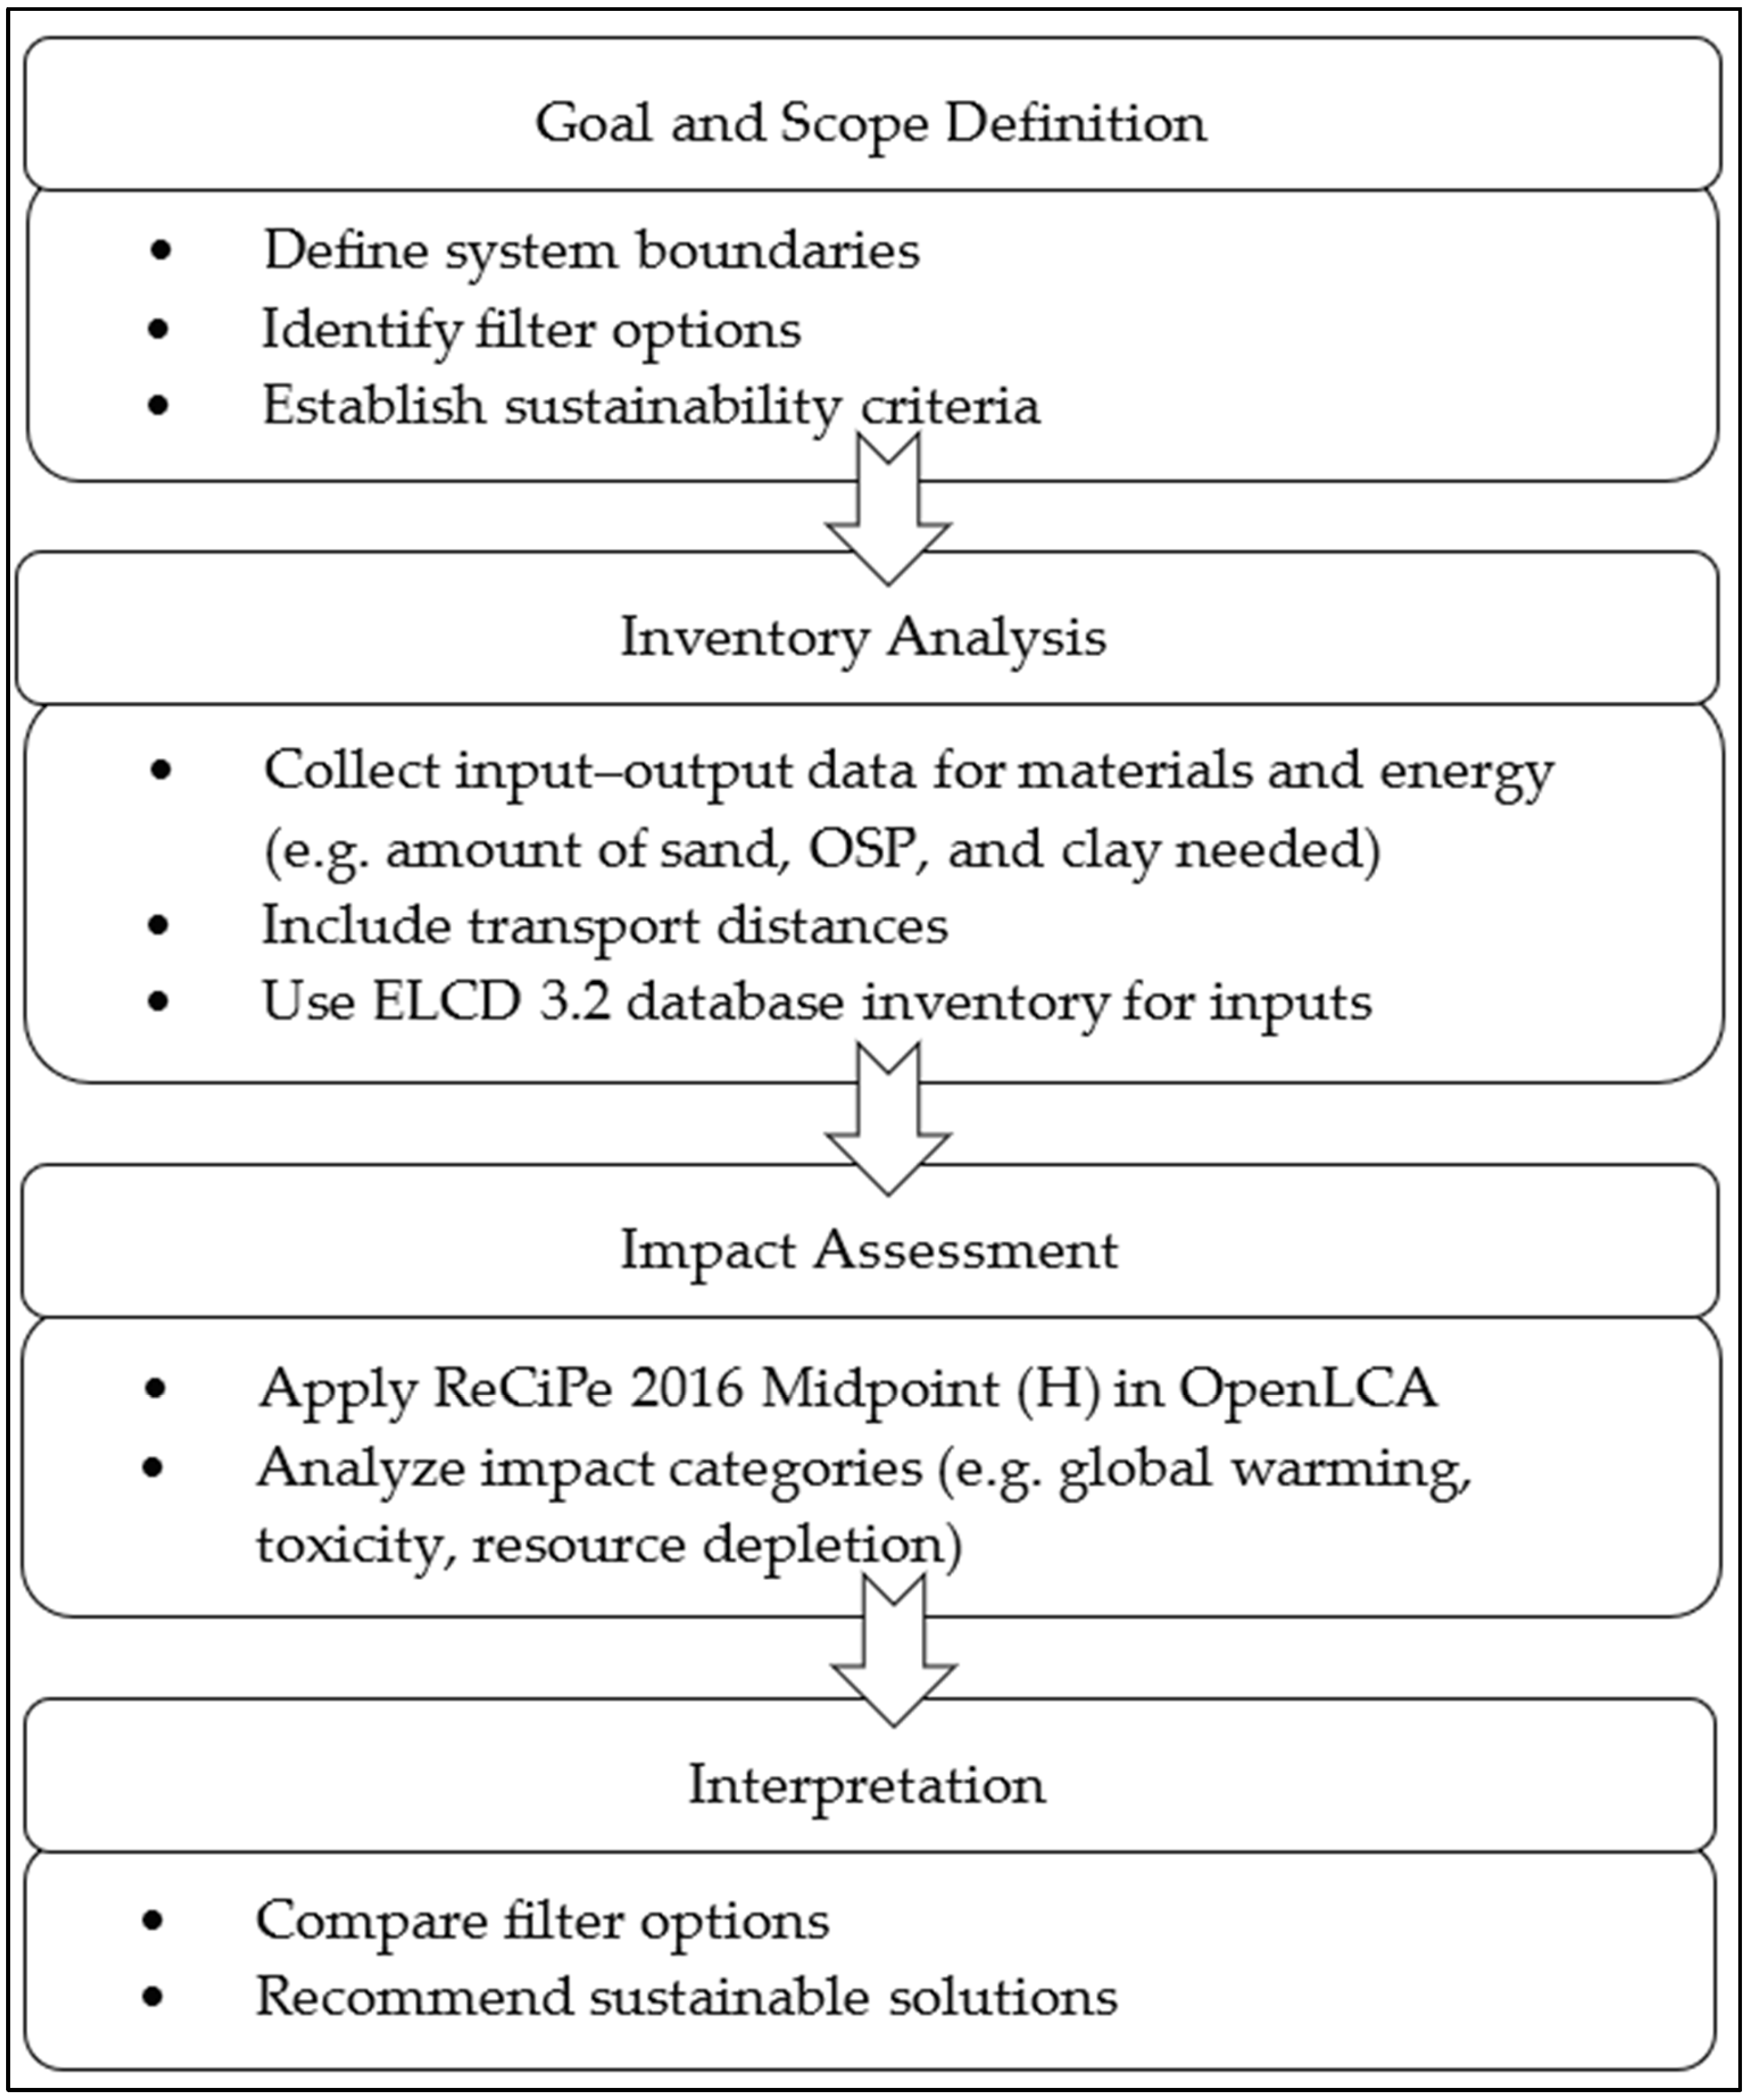
Figure 1. LCA framework for the study.
Sustainability 17 05428 g001
Figure 2. System boundaries for the SSF with sand and OSP mixture (90:10).
Sustainability 17 05428 g002
Figure 3. System boundaries for the nine scenarios using 3D-printed bricks with varying ratios of clay to OSP (Scenarios include: 1 brick (80:20, 85:15, and 90:10), 2 bricks (80:20, 85:15, and 90:10), 3 bricks (80:20, 85:15, and 90:10)).
Sustainability 17 05428 g003
Figure 4. Proposed system to treat the daily need (4 m3) for watering a private yard.
Sustainability 17 05428 g004
Figure 5. Comparison of (a) freshwater ecotoxicity, (b) freshwater eutrophication, and (c) terrestrial acidification of the targeted filter options at different material transportation distances. Note: The notations ‘sand_OSP’ and ’clay_1_brick_90’ refer to the SSF with OSP and a single brick with a clay/OSP ratio of 90:10, respectively. Other labels follow the same pattern.
Sustainability 17 05428 g005
Figure 6. Comparison of (a) ozone depletion, (b) global warming, and (c) fine particulate matter formation of the targeted filter options at different material transportation distances.
Sustainability 17 05428 g006
Figure 7. Comparison of (a) human carcinogenic toxicity, (b) human non-carcinogenic toxicity, and (c) fossil resource scarcity of the targeted filter options at different material transportation distances.
Sustainability 17 05428 g007
Table 1. Environmental impact indicators used in this study, along with their definitions and units [36].
Impact IndicatorUnitMeaning in the Context of the LCA
Freshwater ecotoxicitykg 1,4-DCB eqIndicates the rise in environmental risks associated with freshwater contamination and is expressed in kg of 1,4-dichlorobenzene equivalent (kg 1,4-DCB eq) [36]
Freshwater eutrophicationkg P eqIndicates the phosphorus (P) increase in freshwater and is expressed in kg phosphorus equivalent (kg P eq) [36]
Global warming potentialkg CO2 eqMeasures the overall increase in infrared radiative forcing caused by a greenhouse gas and is expressed in kg carbon dioxide equivalent (kg CO2 eq) [36]
Terrestrial acidificationkg SO2 eqQuantifies the acidifying pollutants in the soil and atmosphere and is expressed in kg sulfur dioxide equivalent (kg SO2 eq) [36]
Fine particulate matter formationkg PM2.5 eqQuantifies the human population intake of particulate matter with a diameter of 2.5 mm or less (PM2.5) and is expressed in Kg PM2.5 eq [36]
Human carcinogenic toxicitykg 1,4-DCB eqIndicates the increased risk of developing cancer and is expressed in kg of 1,4-dichlorobenzene equivalent (kg 1,4-DCB eq) [36]
Human non-carcinogenic toxicitykg 1,4-DCB eqIndicates the increased risk of developing non-cancer diseases and is expressed in kg of 1,4-dichlorobenzene equivalent (kg 1,4-DCB eq) [36]
Ozone depletion potentialkg CFC11 eqIndicates the long-term cumulative decline in stratospheric ozone concentration and is expressed in Kg of trichlorofluoromethane (CFC11) equivalent [36]
Fossil resource scarcitykg oil eqDefined as the ratio of a fossil resource’s higher heating value to the energy content of crude oil (fossil fuel potential) and it expressed in Kg of oil equivalent [36]
Table 2. Comprehensive cost estimation for various filter scenarios with material, energy, and labor costs (no material transport).
ScenarioClay/OSPSand CostPVC CostGravel CostElectricity CostLabor CostTotal Cost
Single-brick columns90:10USD 11.22USD 105.67USD 0.74USD 24.38USD 200USD 342.01
Single-brick columns85:15USD 11.22USD 105.67USD 0.74USD 24.41USD 200USD 342.04
Single-brick columns80:10USD 11.22USD 105.67USD 0.74USD 24.44USD 200USD 342.07
Two-brick columns90:10USD 10.54USD 105.67USD 0.74USD 48.92USD 200USD 366.87
Two-brick columns85:15USD 10.54USD 105.67USD 0.74USD 48.97USD 200USD 366.92
Two-brick columns80:10USD 10.54USD 105.67USD 0.74USD 49.01USD 200USD 366.96
Three-brick columns90:10USD 9.76USD 105.67USD 0.74USD 71.41USD 200USD 387.58
Three-brick columns85:15USD 9.76USD 105.67USD 0.74USD 71.48USD 200USD 387.65
Three-brick columns80:10USD 9.76USD 105.67USD 0.74USD 71.55USD 200USD 387.72
SSF with OSP-USD 10.74USD 105.67USD 0.74USD 4.65USD 200USD 321.80
SSF -USD 11.93USD 105.67USD 0.74USD 3.92USD 200USD 322.26
Disclaimer/Publisher’s Note: The statements, opinions and data contained in all publications are solely those of the individual author(s) and contributor(s) and not of MDPI and/or the editor(s). MDPI and/or the editor(s) disclaim responsibility for any injury to people or property resulting from any ideas, methods, instructions or products referred to in the content.