
Risk Assessment of Cryptojacking Attacks on Endpoint Systems: Threats to Sustainable Digital Agriculture

 , , , ,
  ,
, 
Abstract
1. Introduction
- It increases the load on energy resources, which increases energy costs and reduces its availability for agricultural purposes, increasing carbon emissions, which negatively affects the environment and ecosystems and contradicts the principles of sustainable development.
- System recovery from cryptojacking attacks negatively affects the financial viability of agricultural enterprises.
- Reduces data security: cryptojacking malware can disrupt the operation of information systems, which will lead to data loss and reduced management efficiency in agriculture.
2. Literature Review
- -
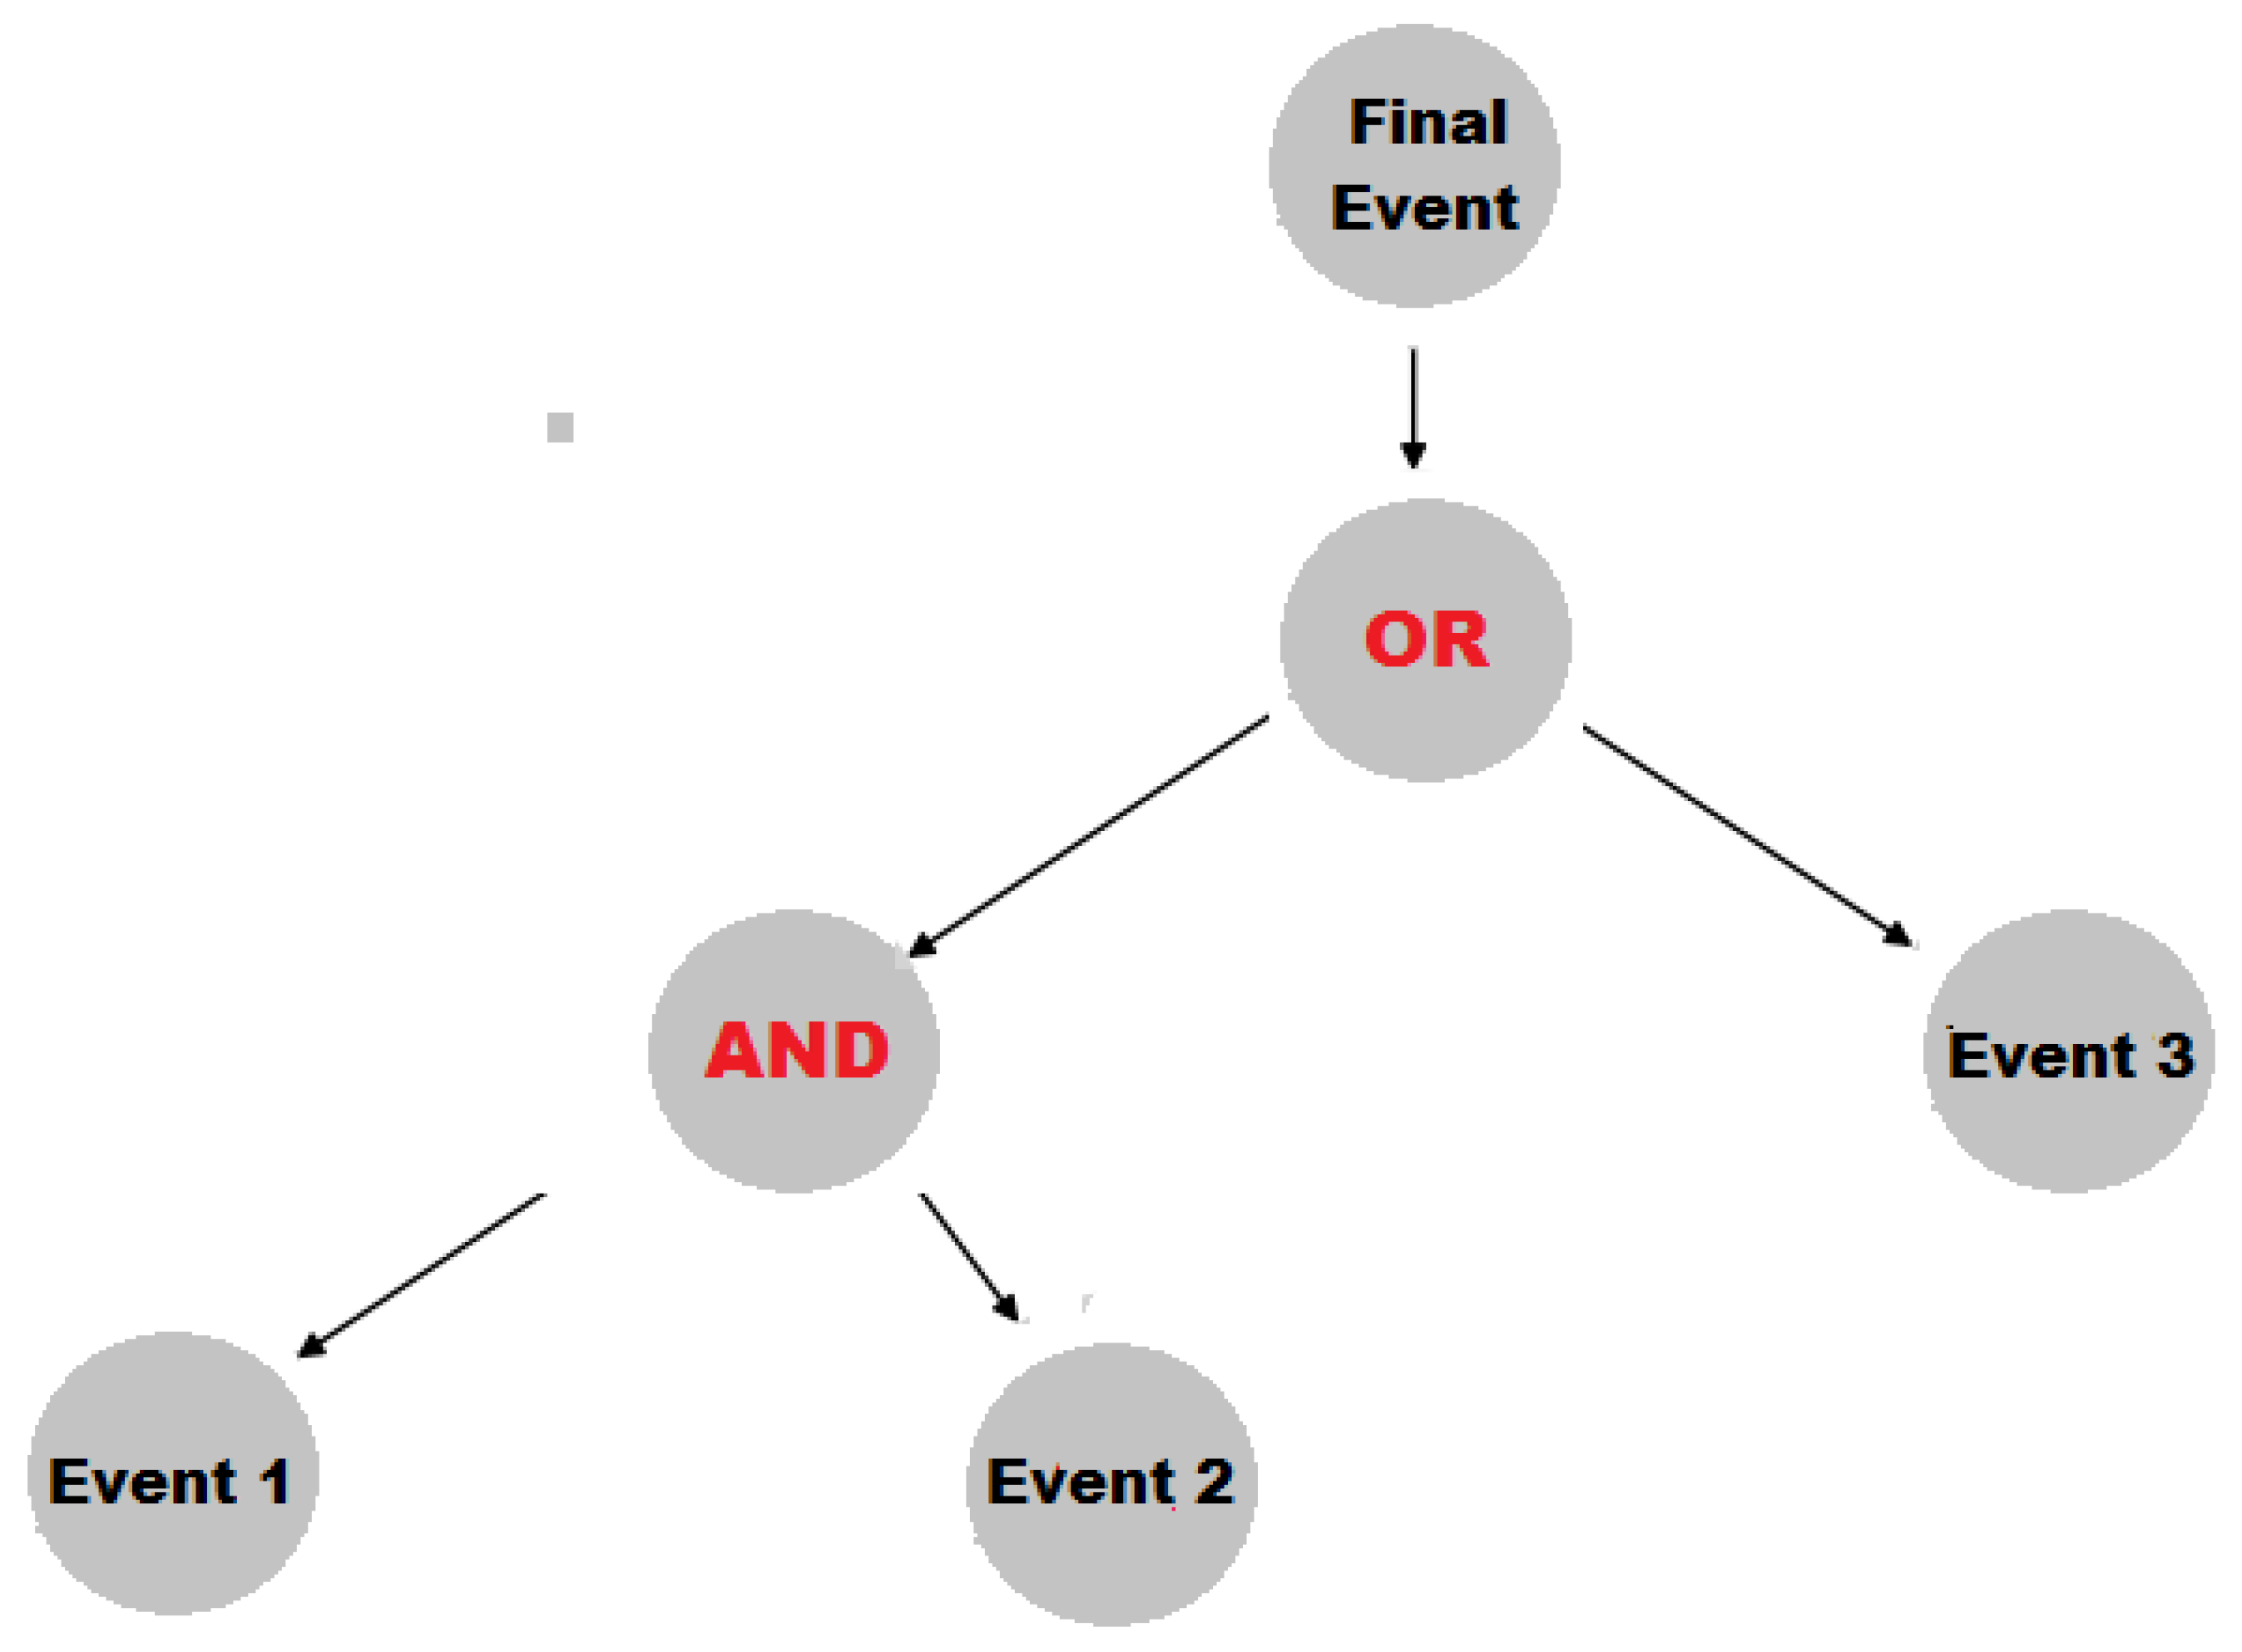
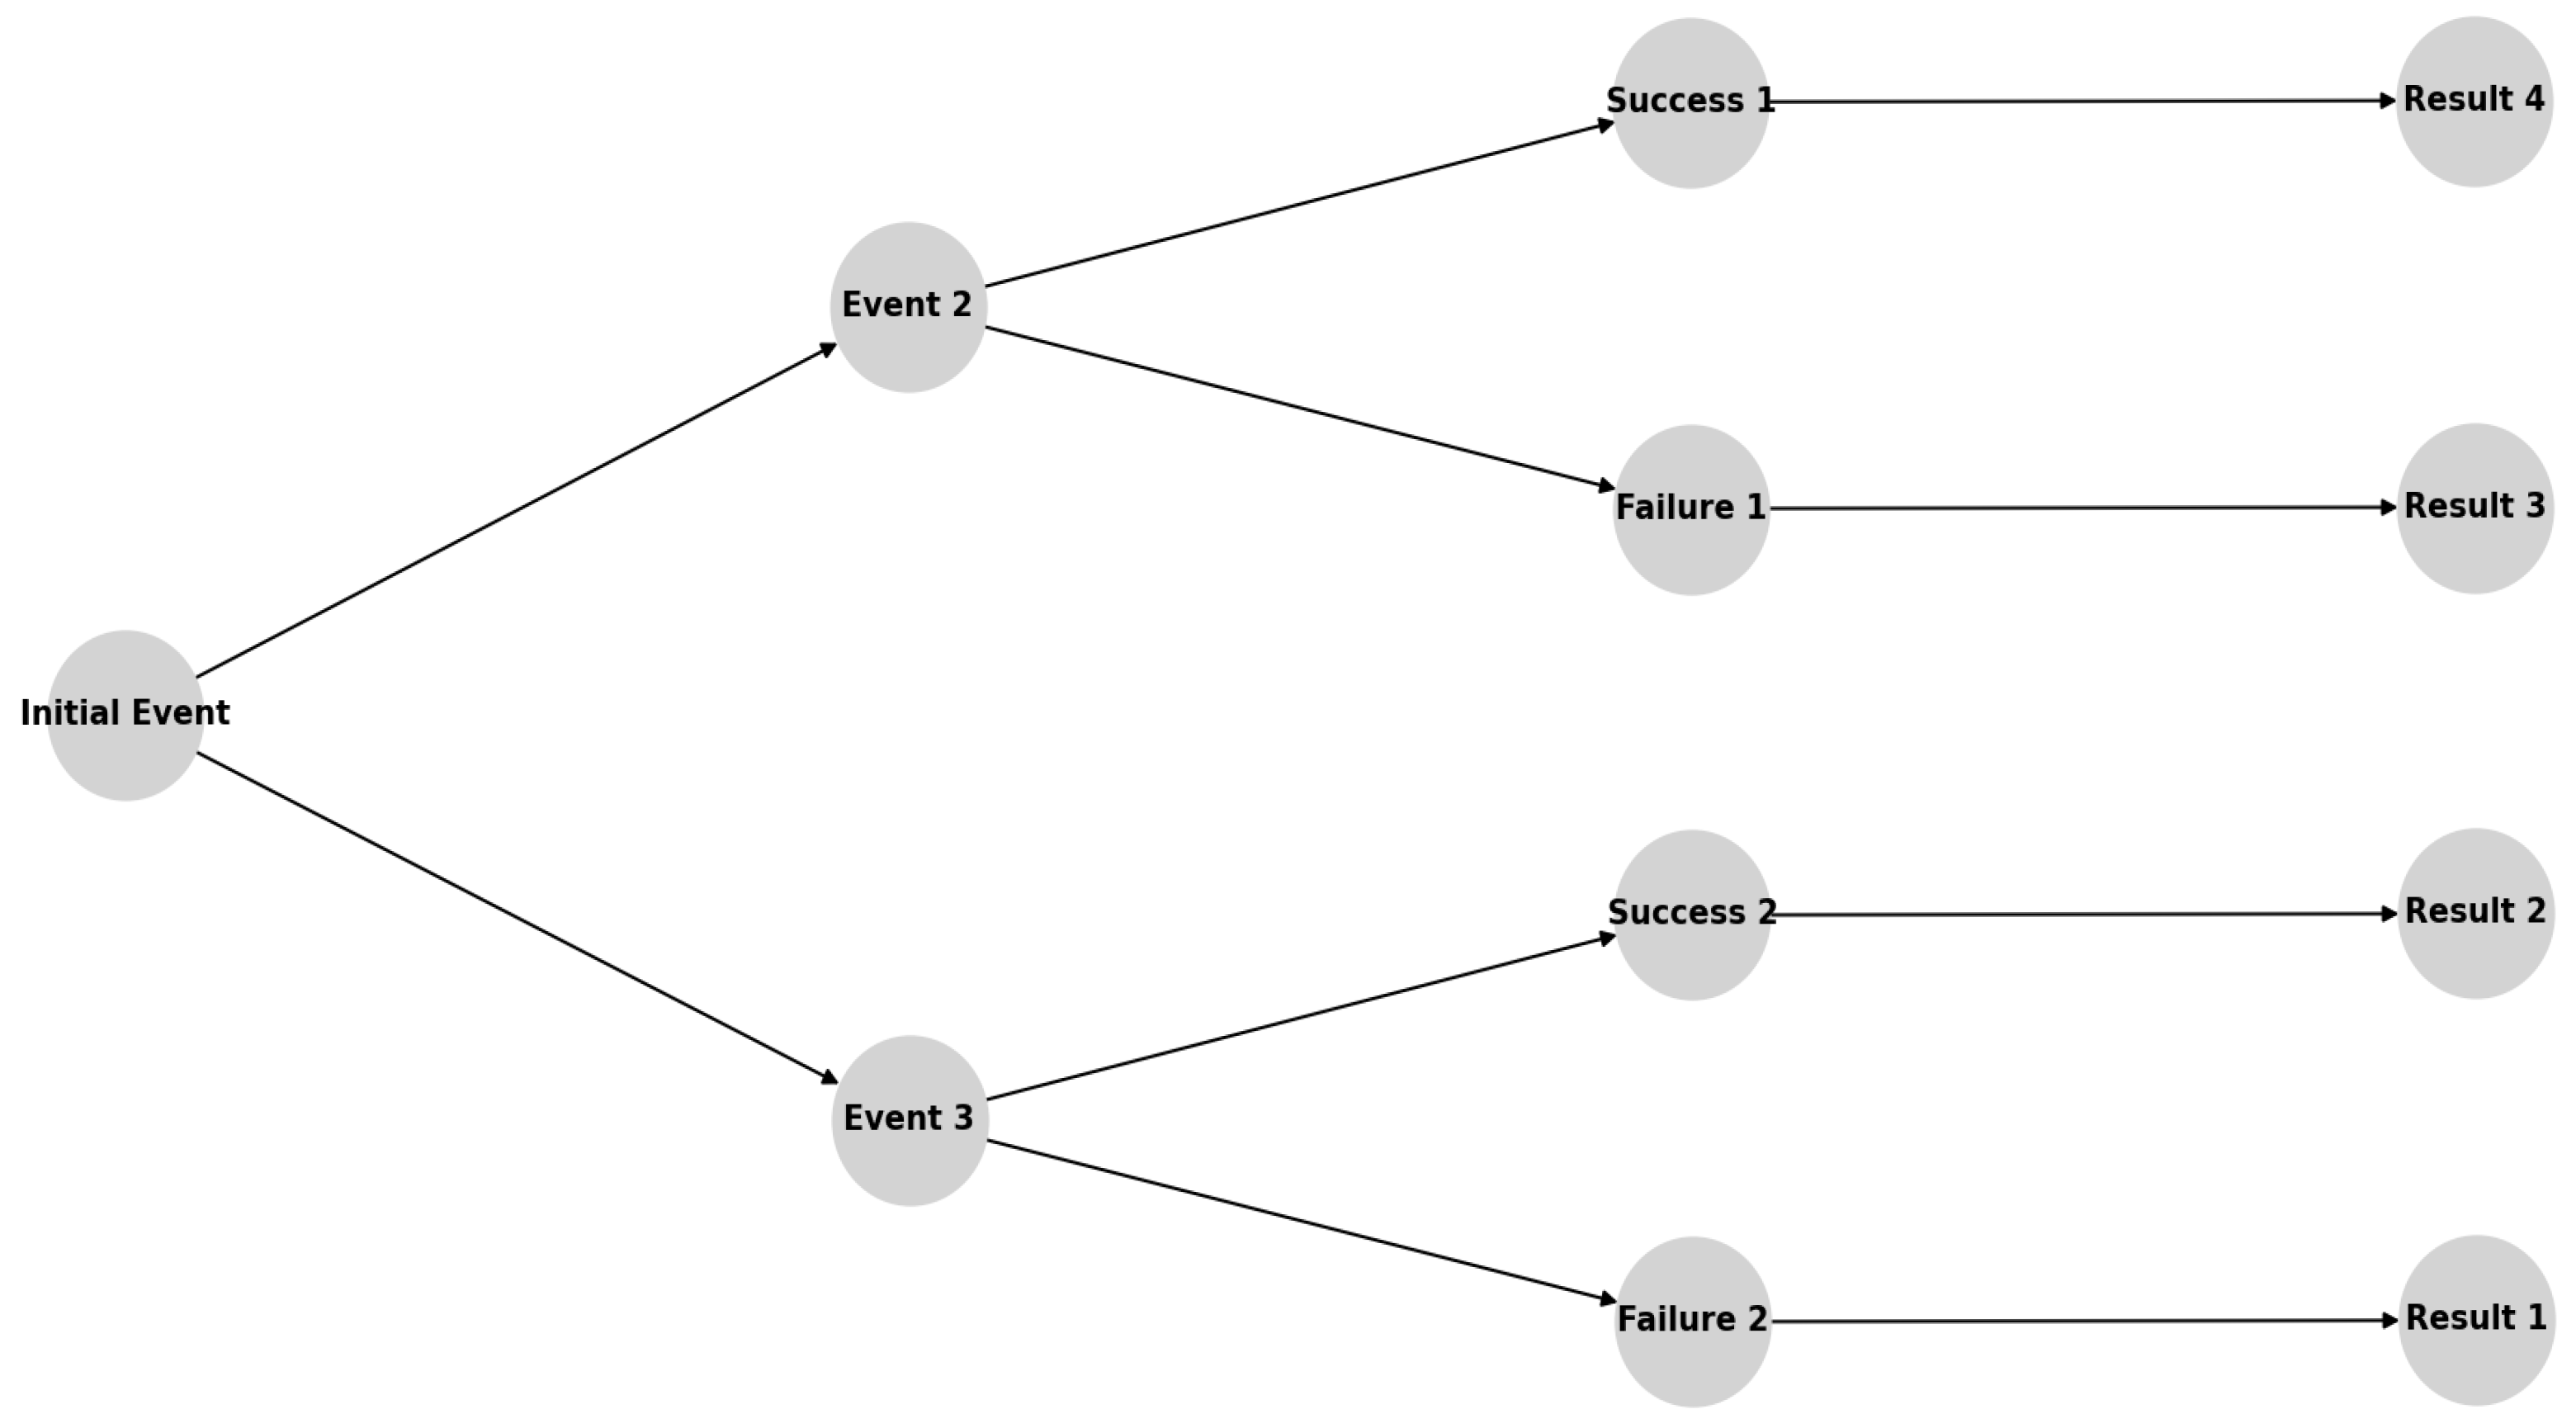
- A graphical attack tree analysis method to determine the probability of cryptojacking attacks;
- -
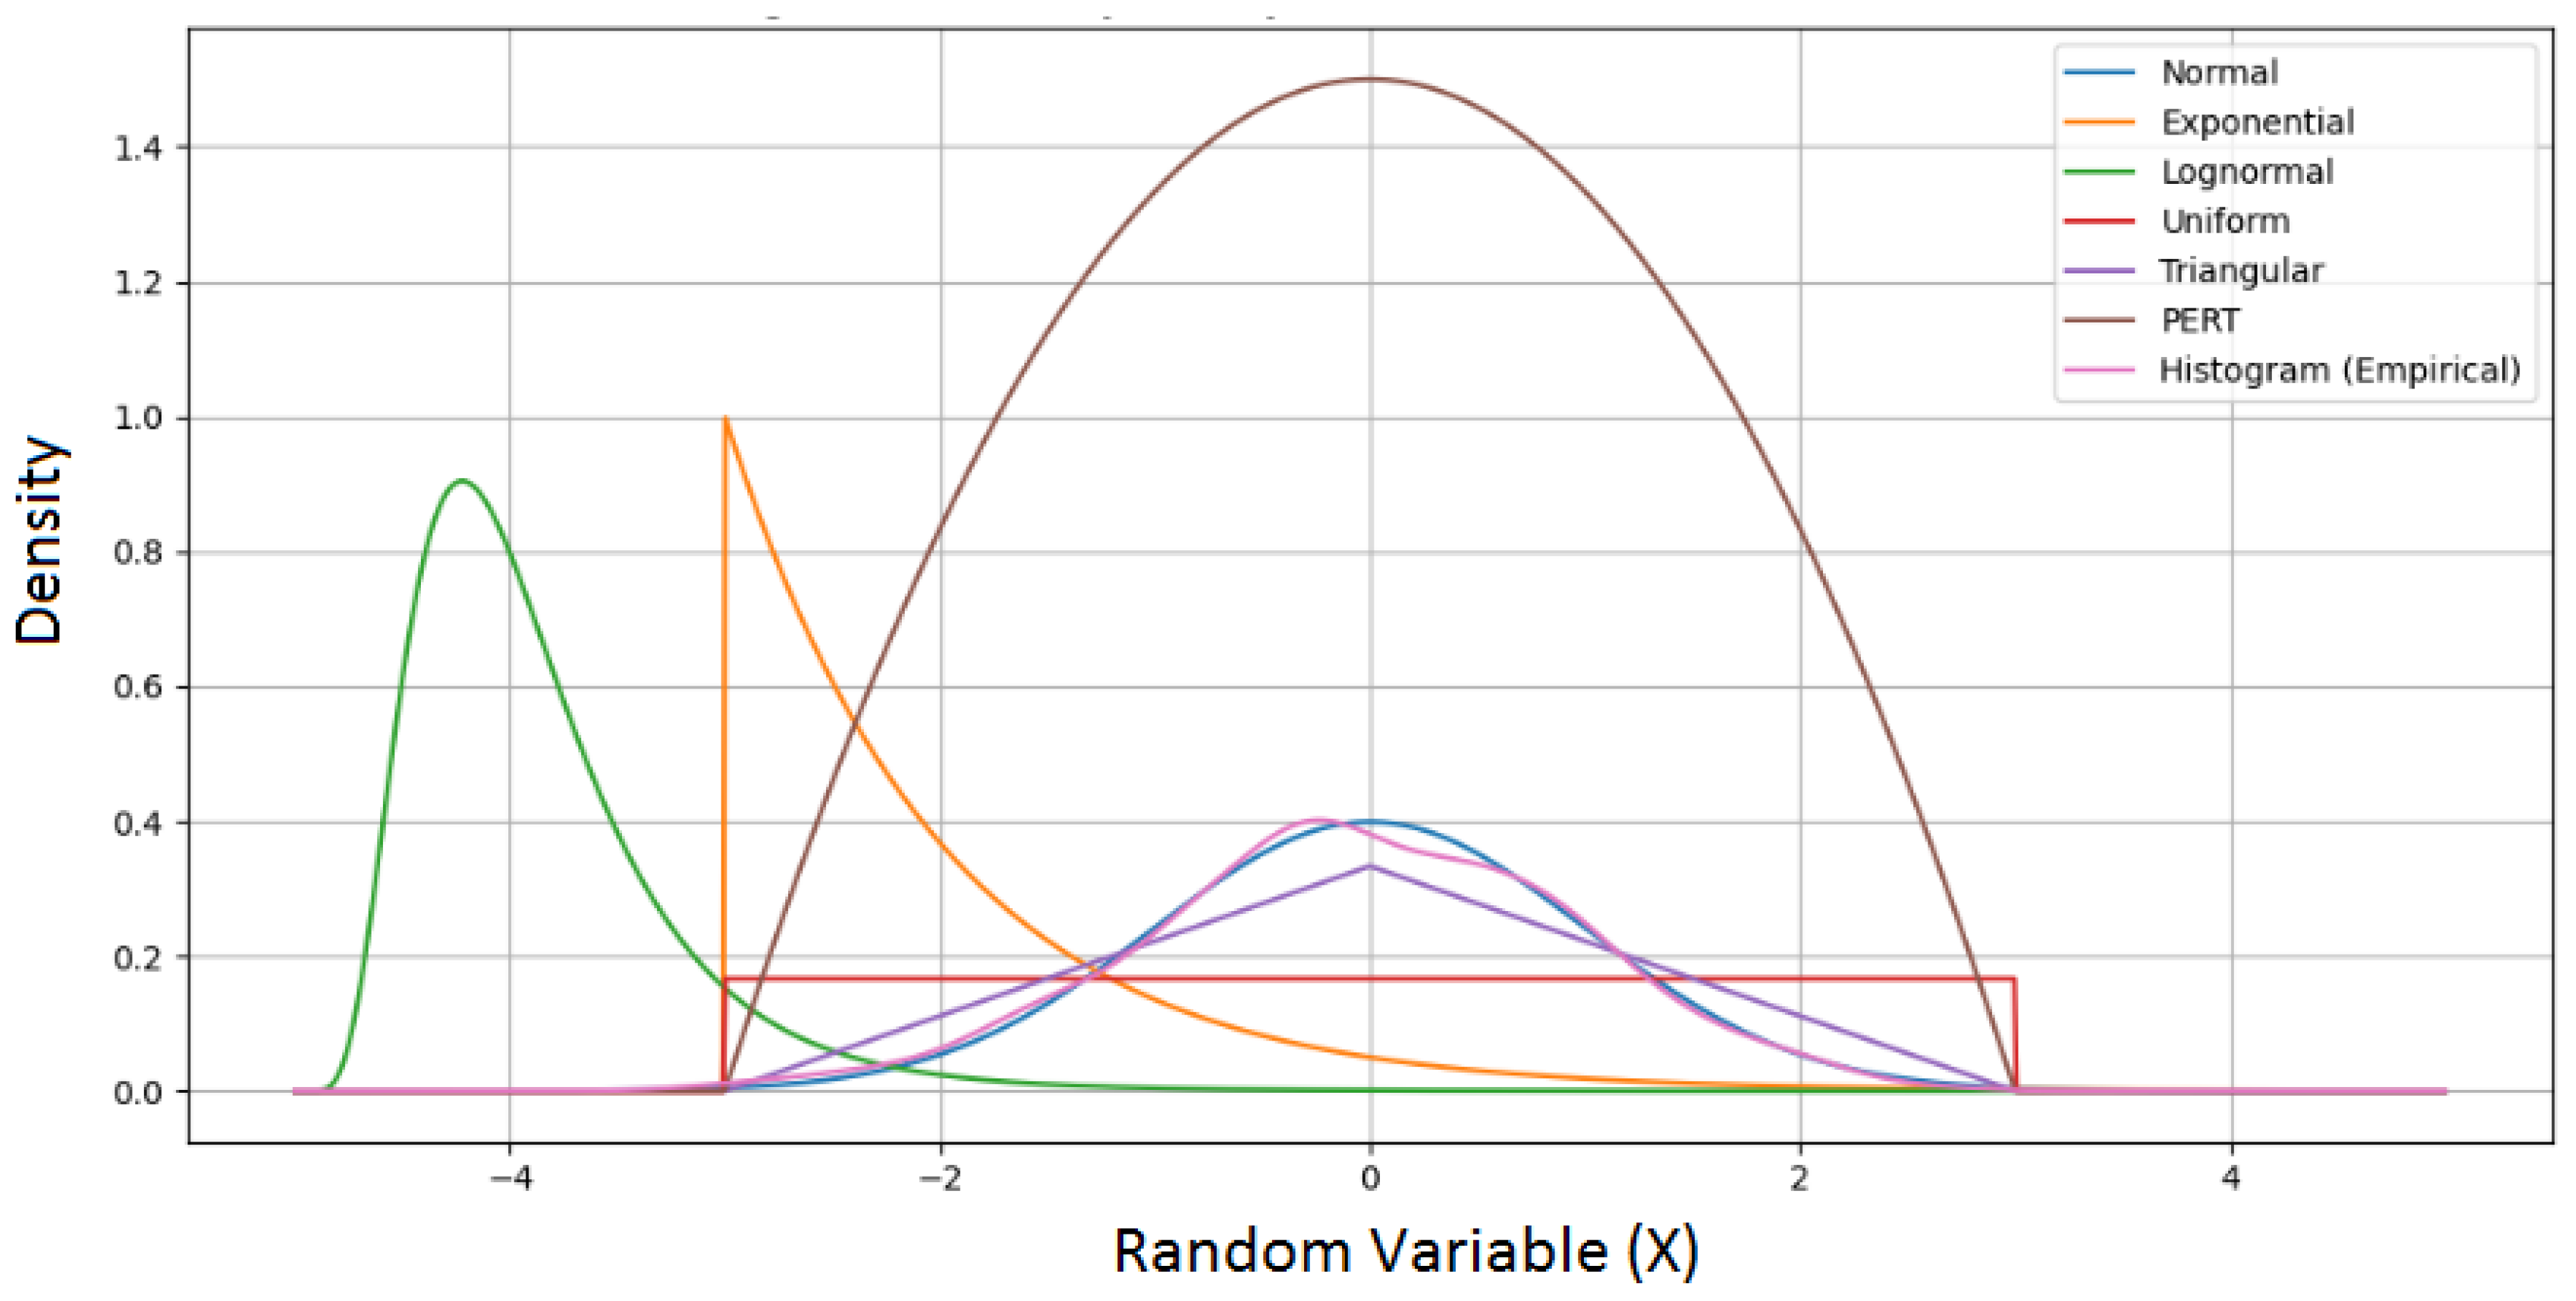
- A Monte Carlo method to obtain the final risk assessment results (in particular, by predicting potential losses through the generation of random cost values).
3. Method
3.1. Algorithm for Cryptojacking Risk Assessment and Forecasting
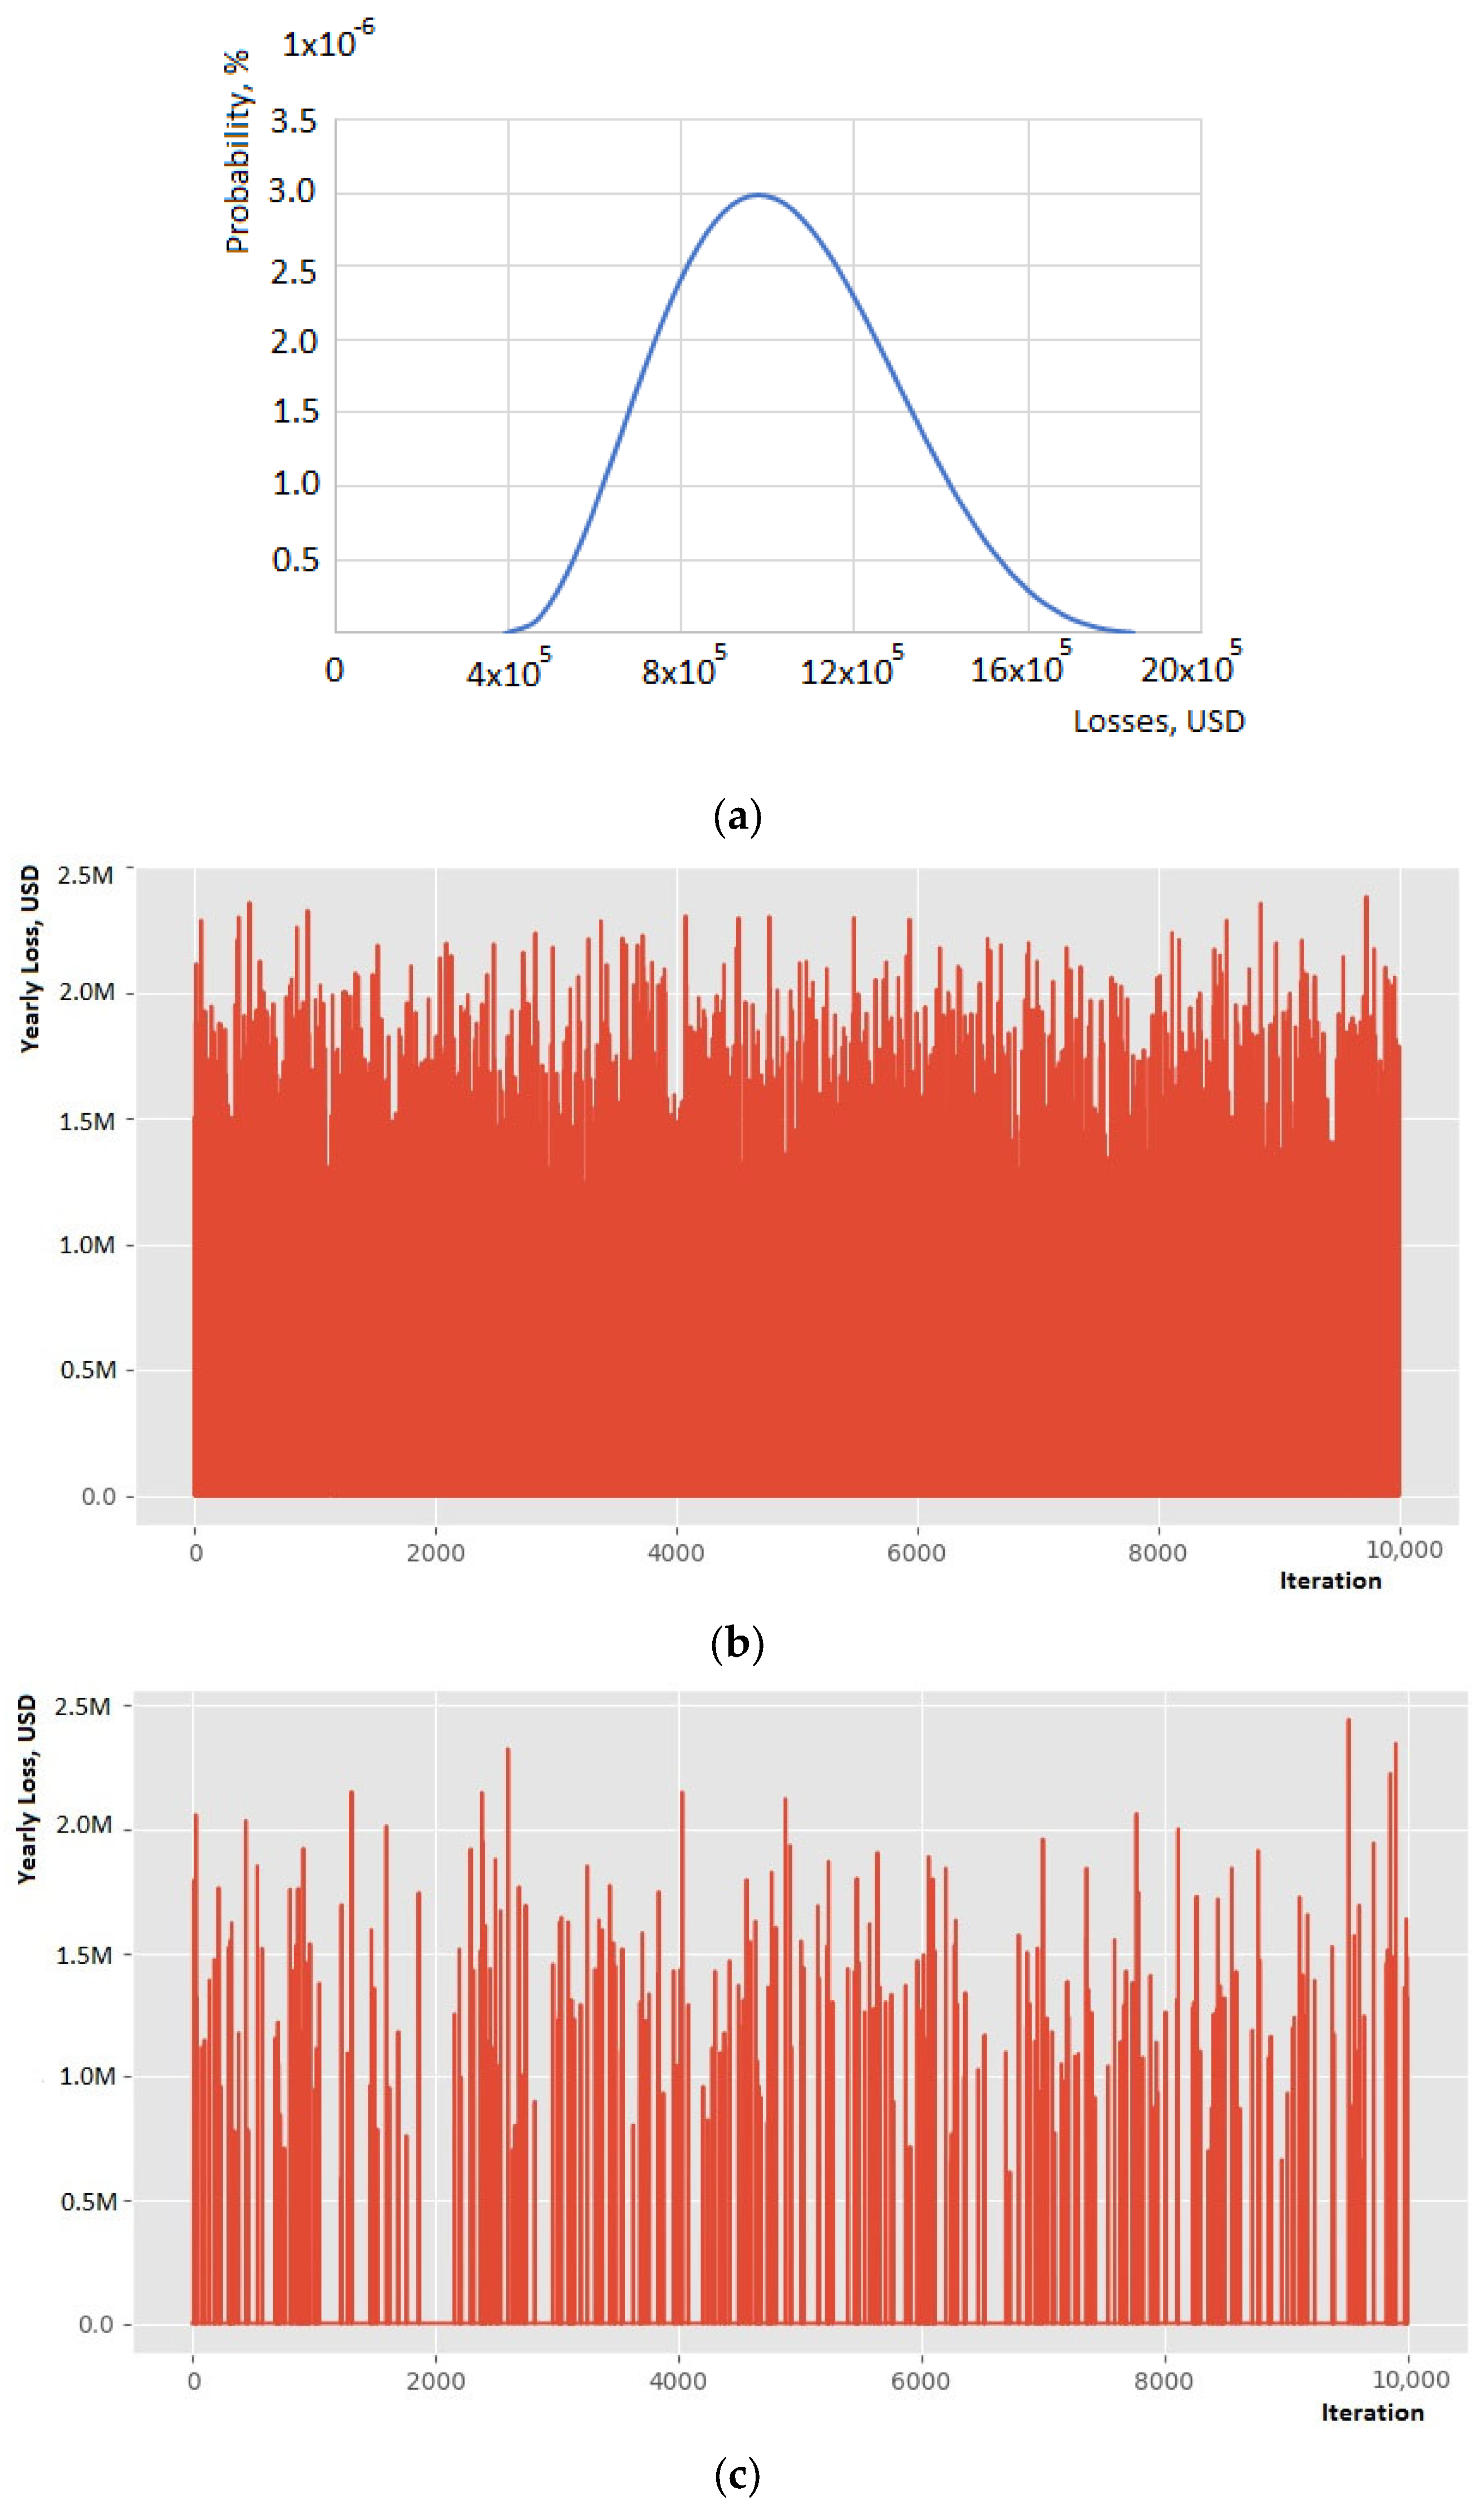
3.2. Evaluation of Input Data in the Context of Forecasting and Risk Analysis
4. Results
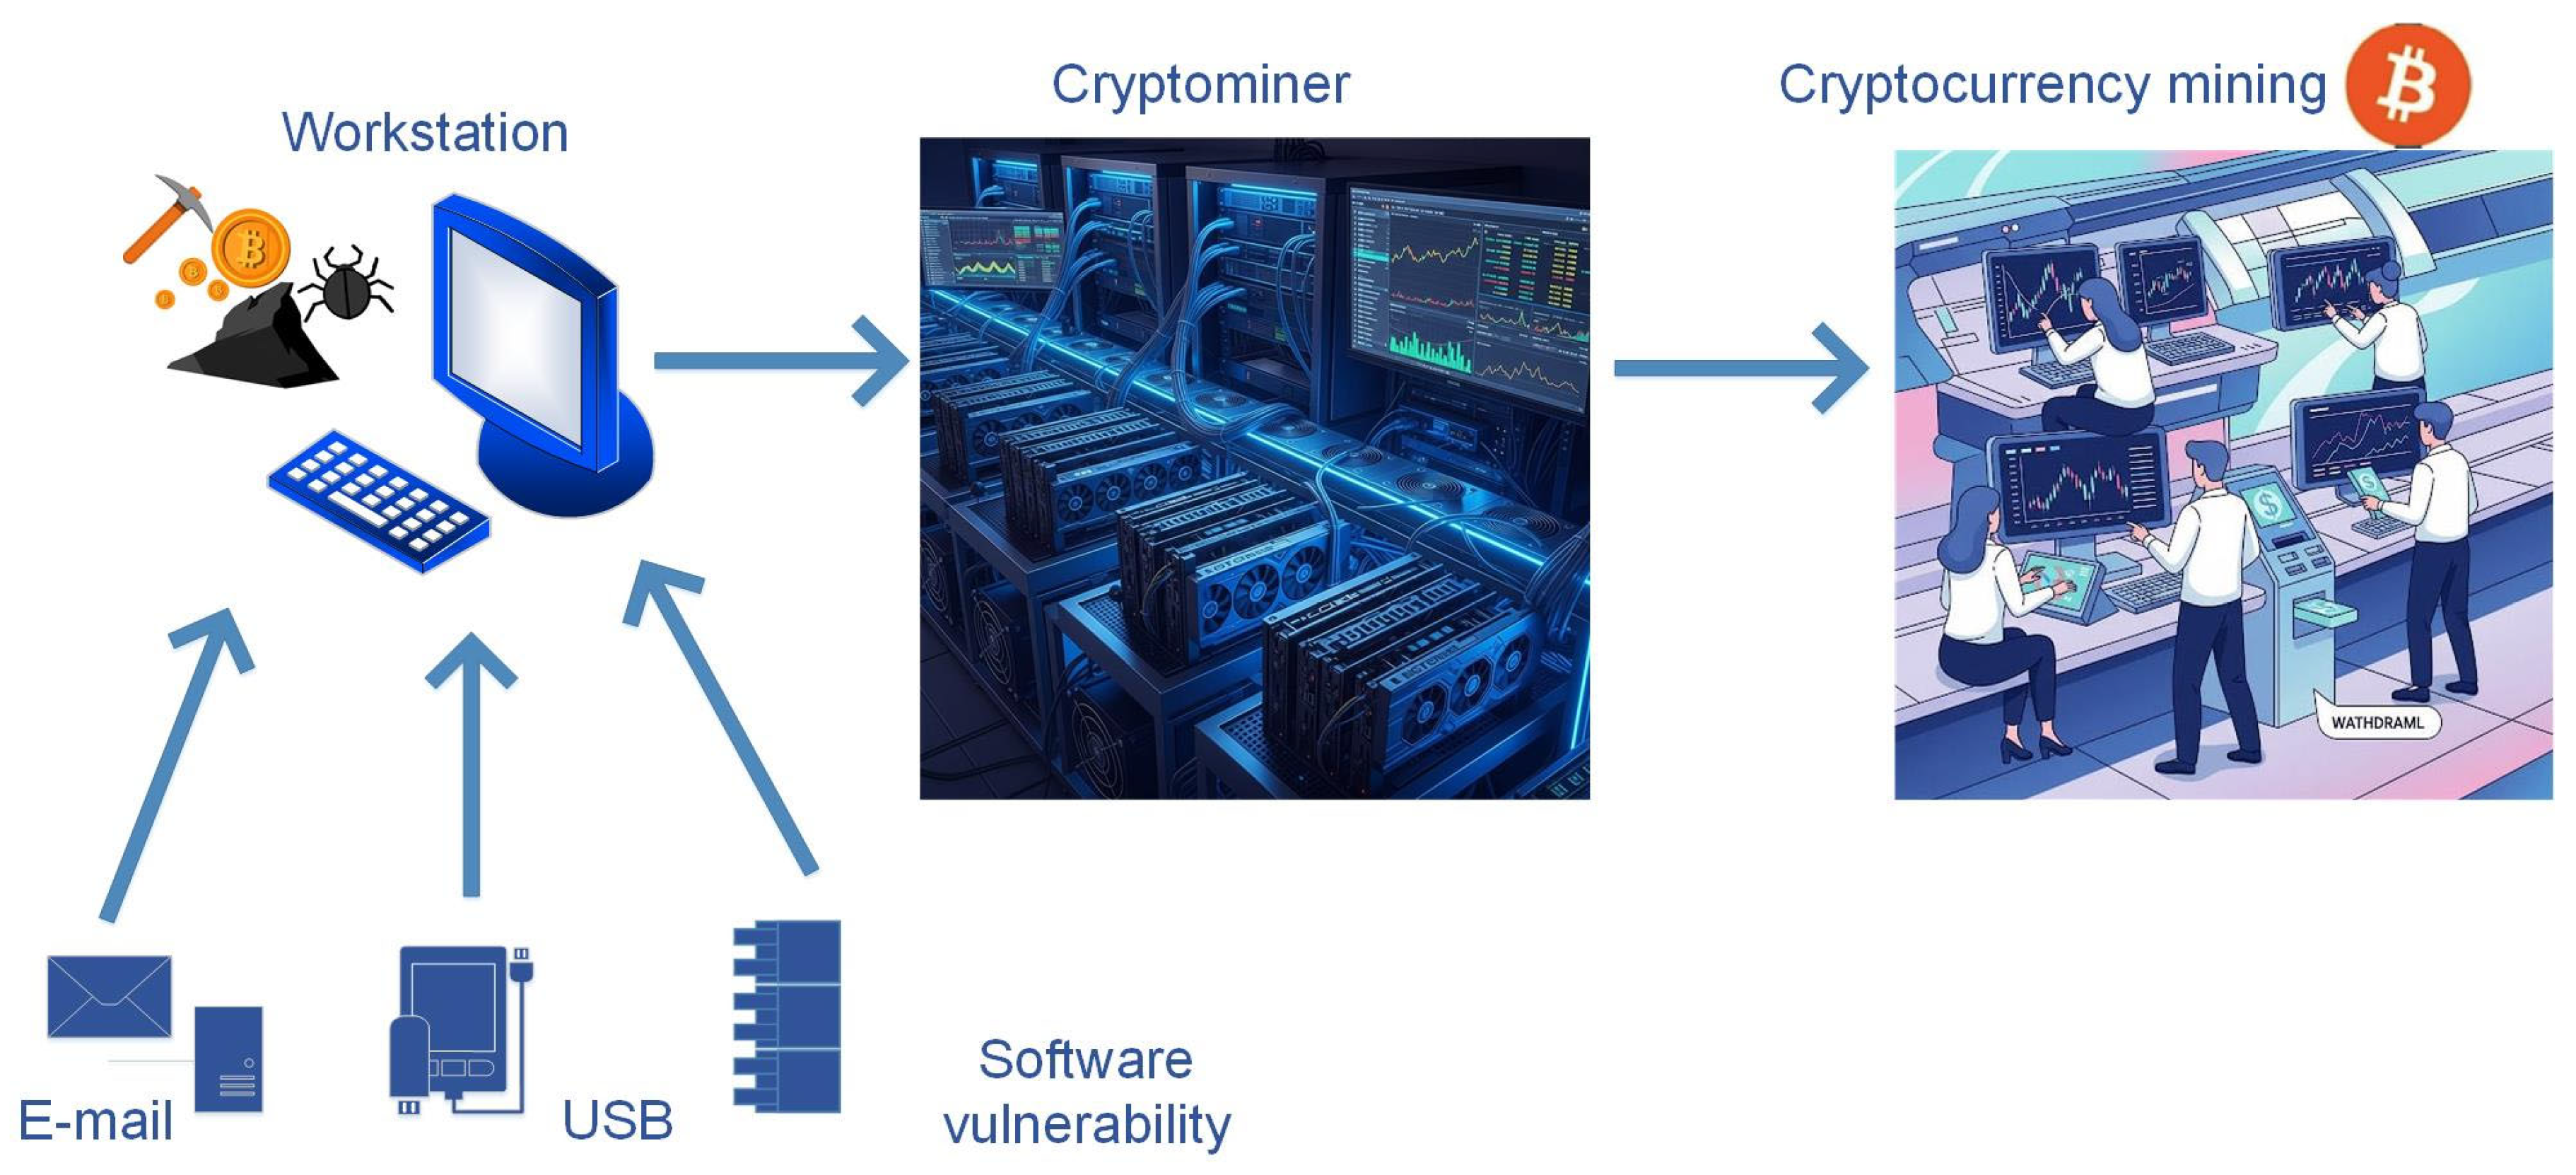
- The first scenario involves cryptomining restricted to a single workstation, offering insight into a relatively contained compromise.
- The second scenario envisions malicious scripts spreading across all workstations, amplifying both direct and indirect losses.
- The third scenario again targets a single endpoint but emerges from a different attack vector, enabling comparison of how cryptojacking might arise under varied infiltration methods.
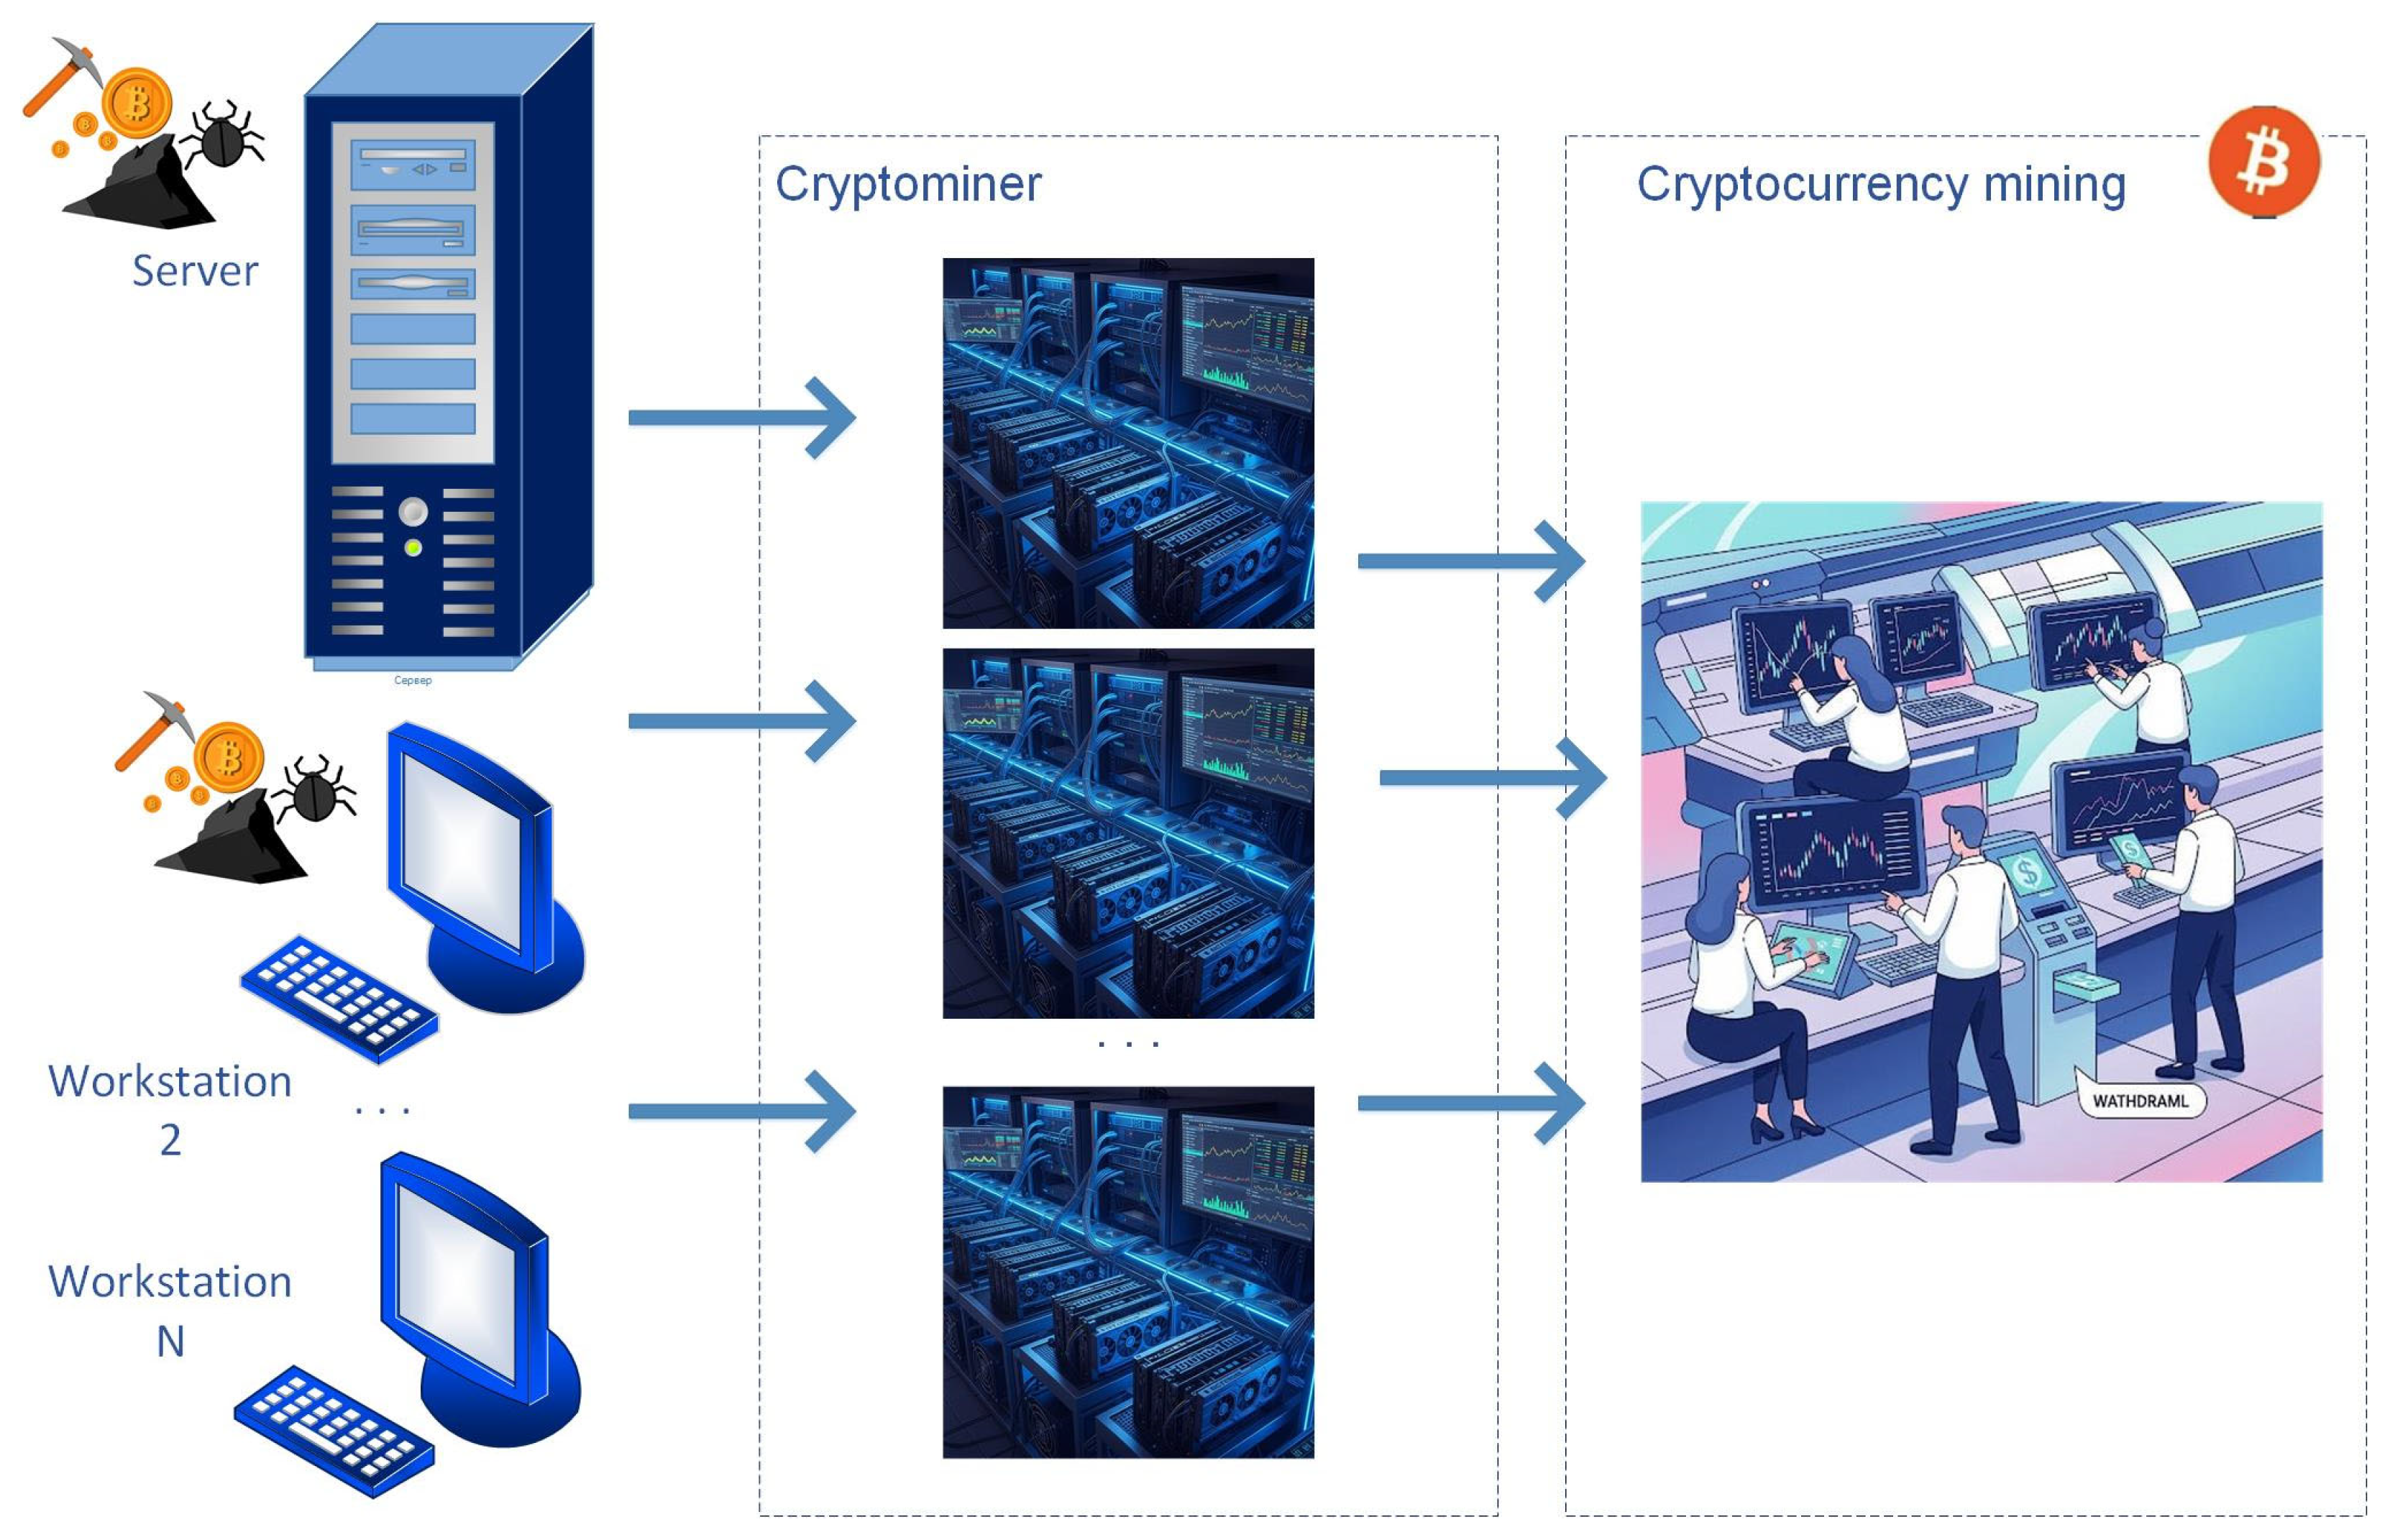
- The fourth scenario expands the scope by adding the central server to the compromised environment, thereby illustrating the impact of lateral movement and high-value assets on overall risk.
- The fifth scenario explores an insider threat, demonstrating how cryptomining can proliferate if a user with privileged or specialized knowledge enables unauthorized resource usage on selected endpoints.
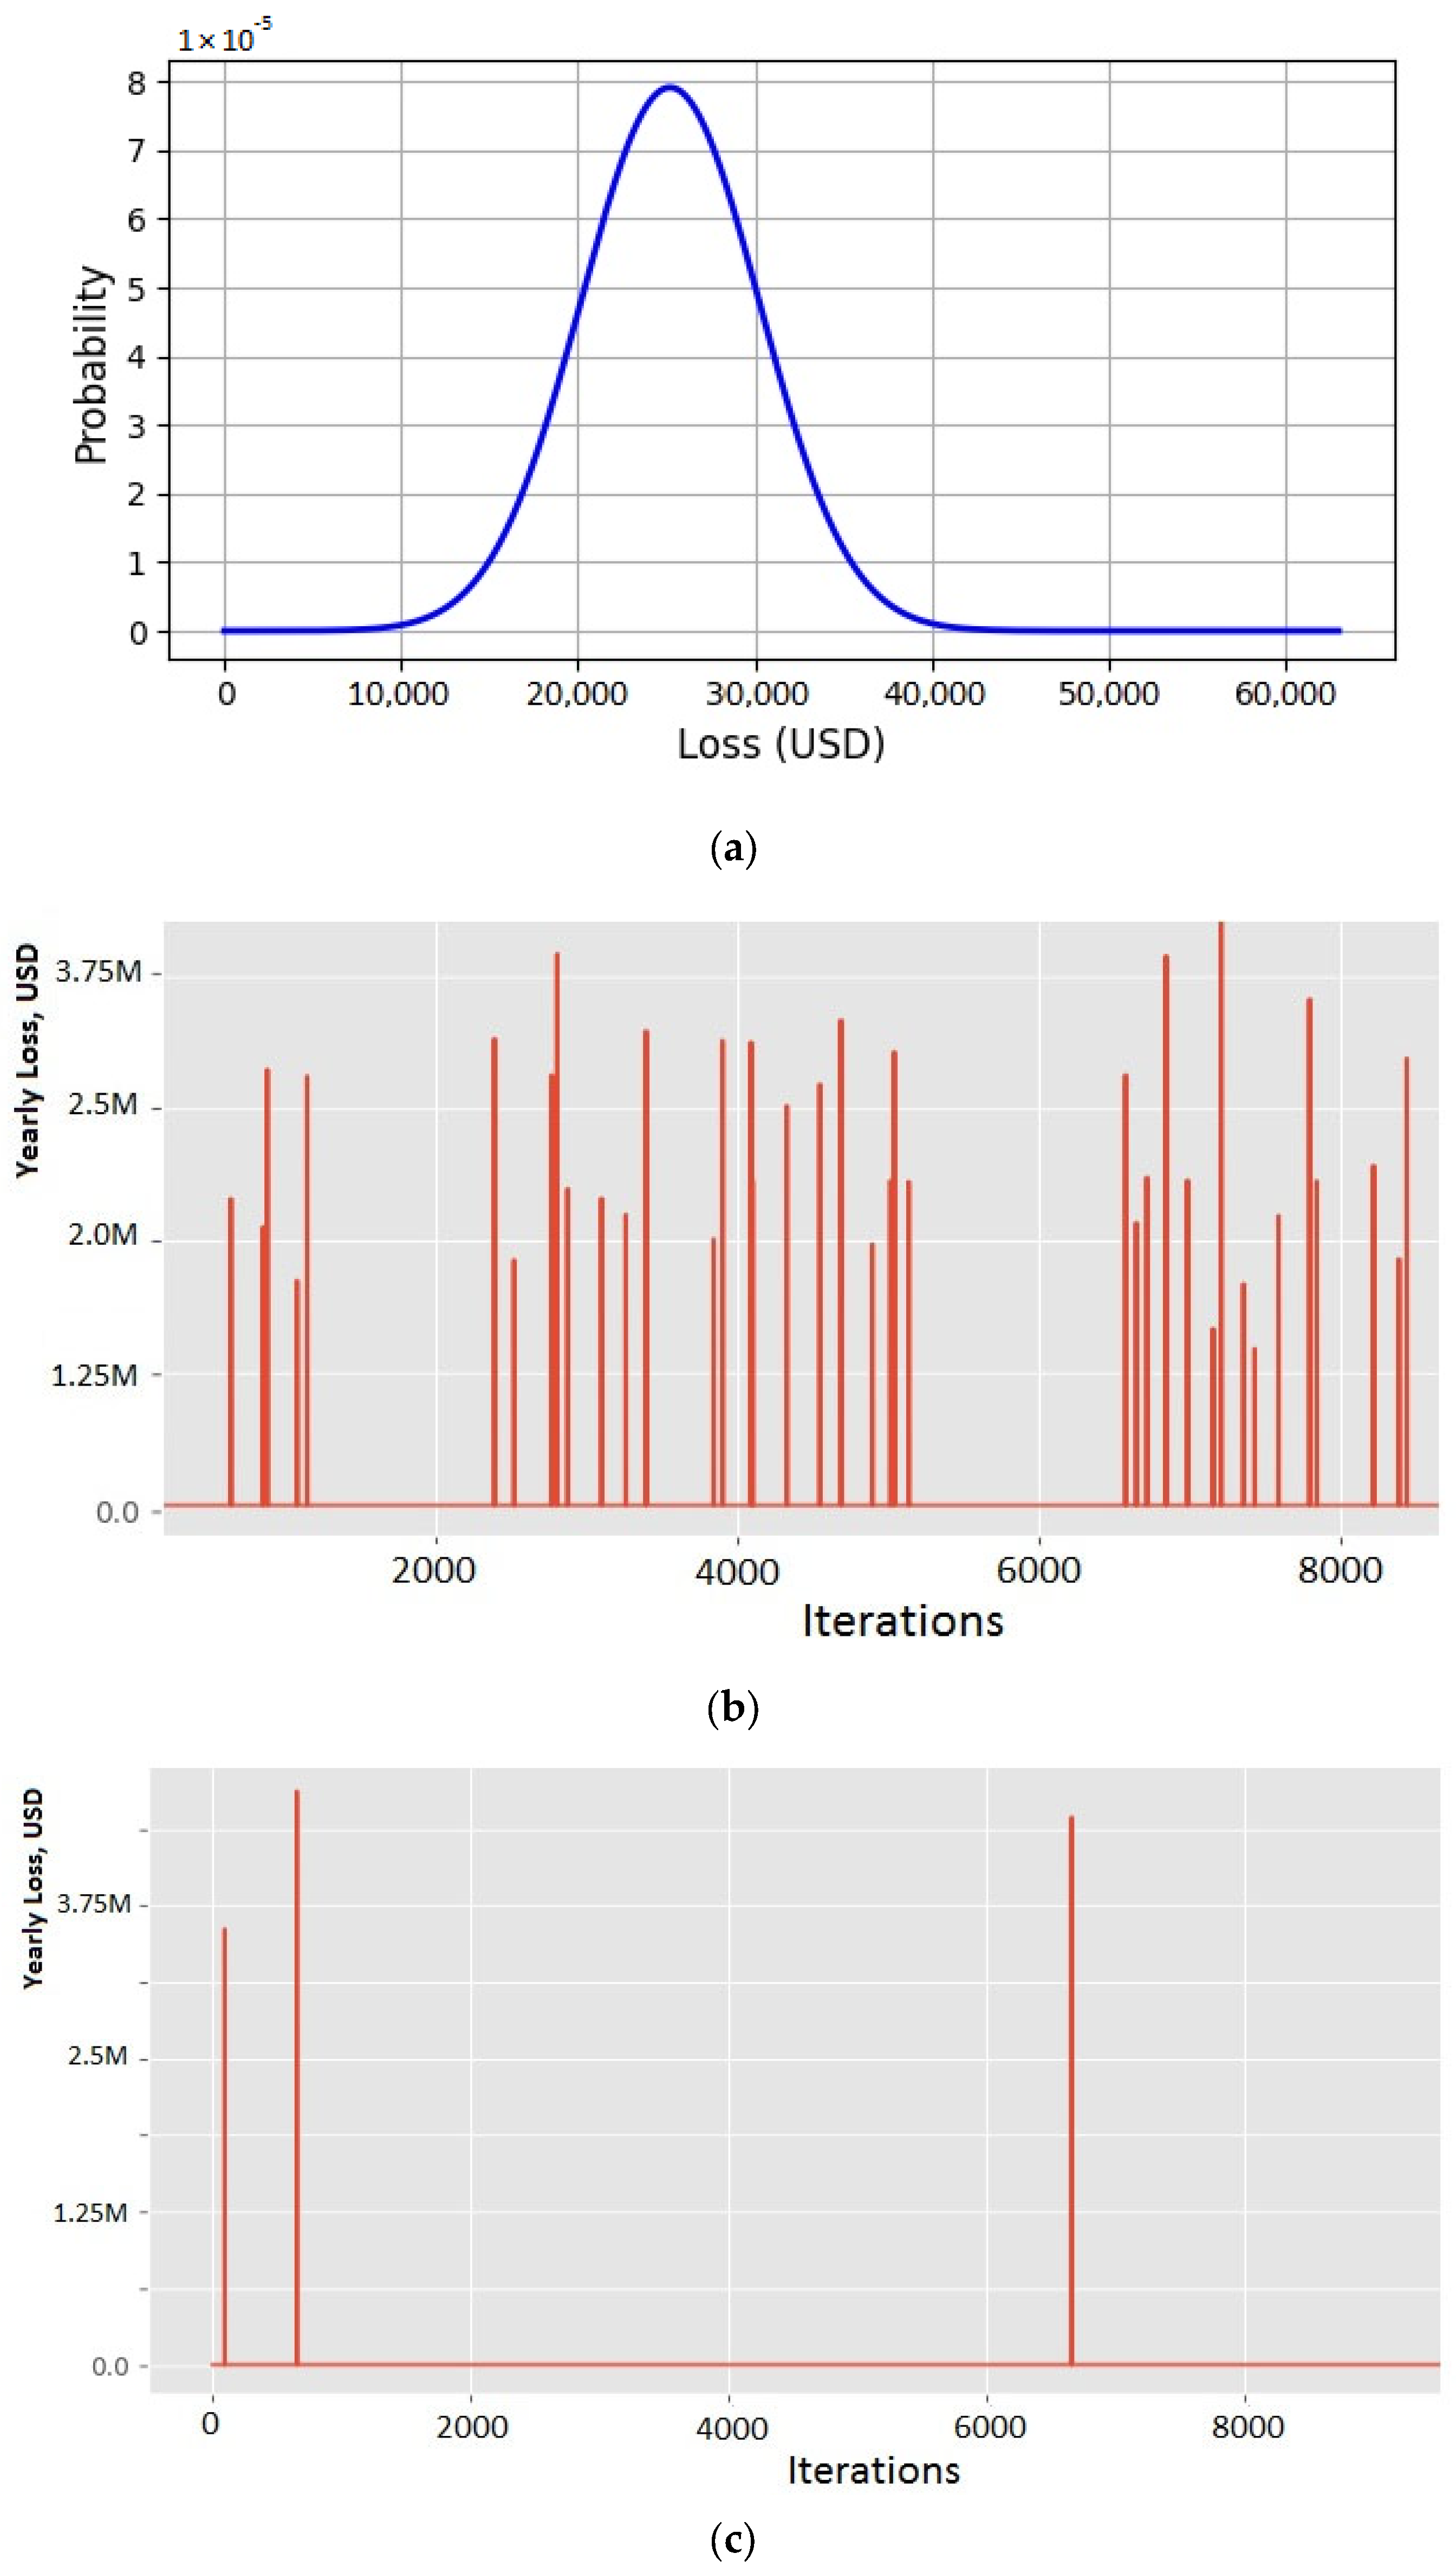
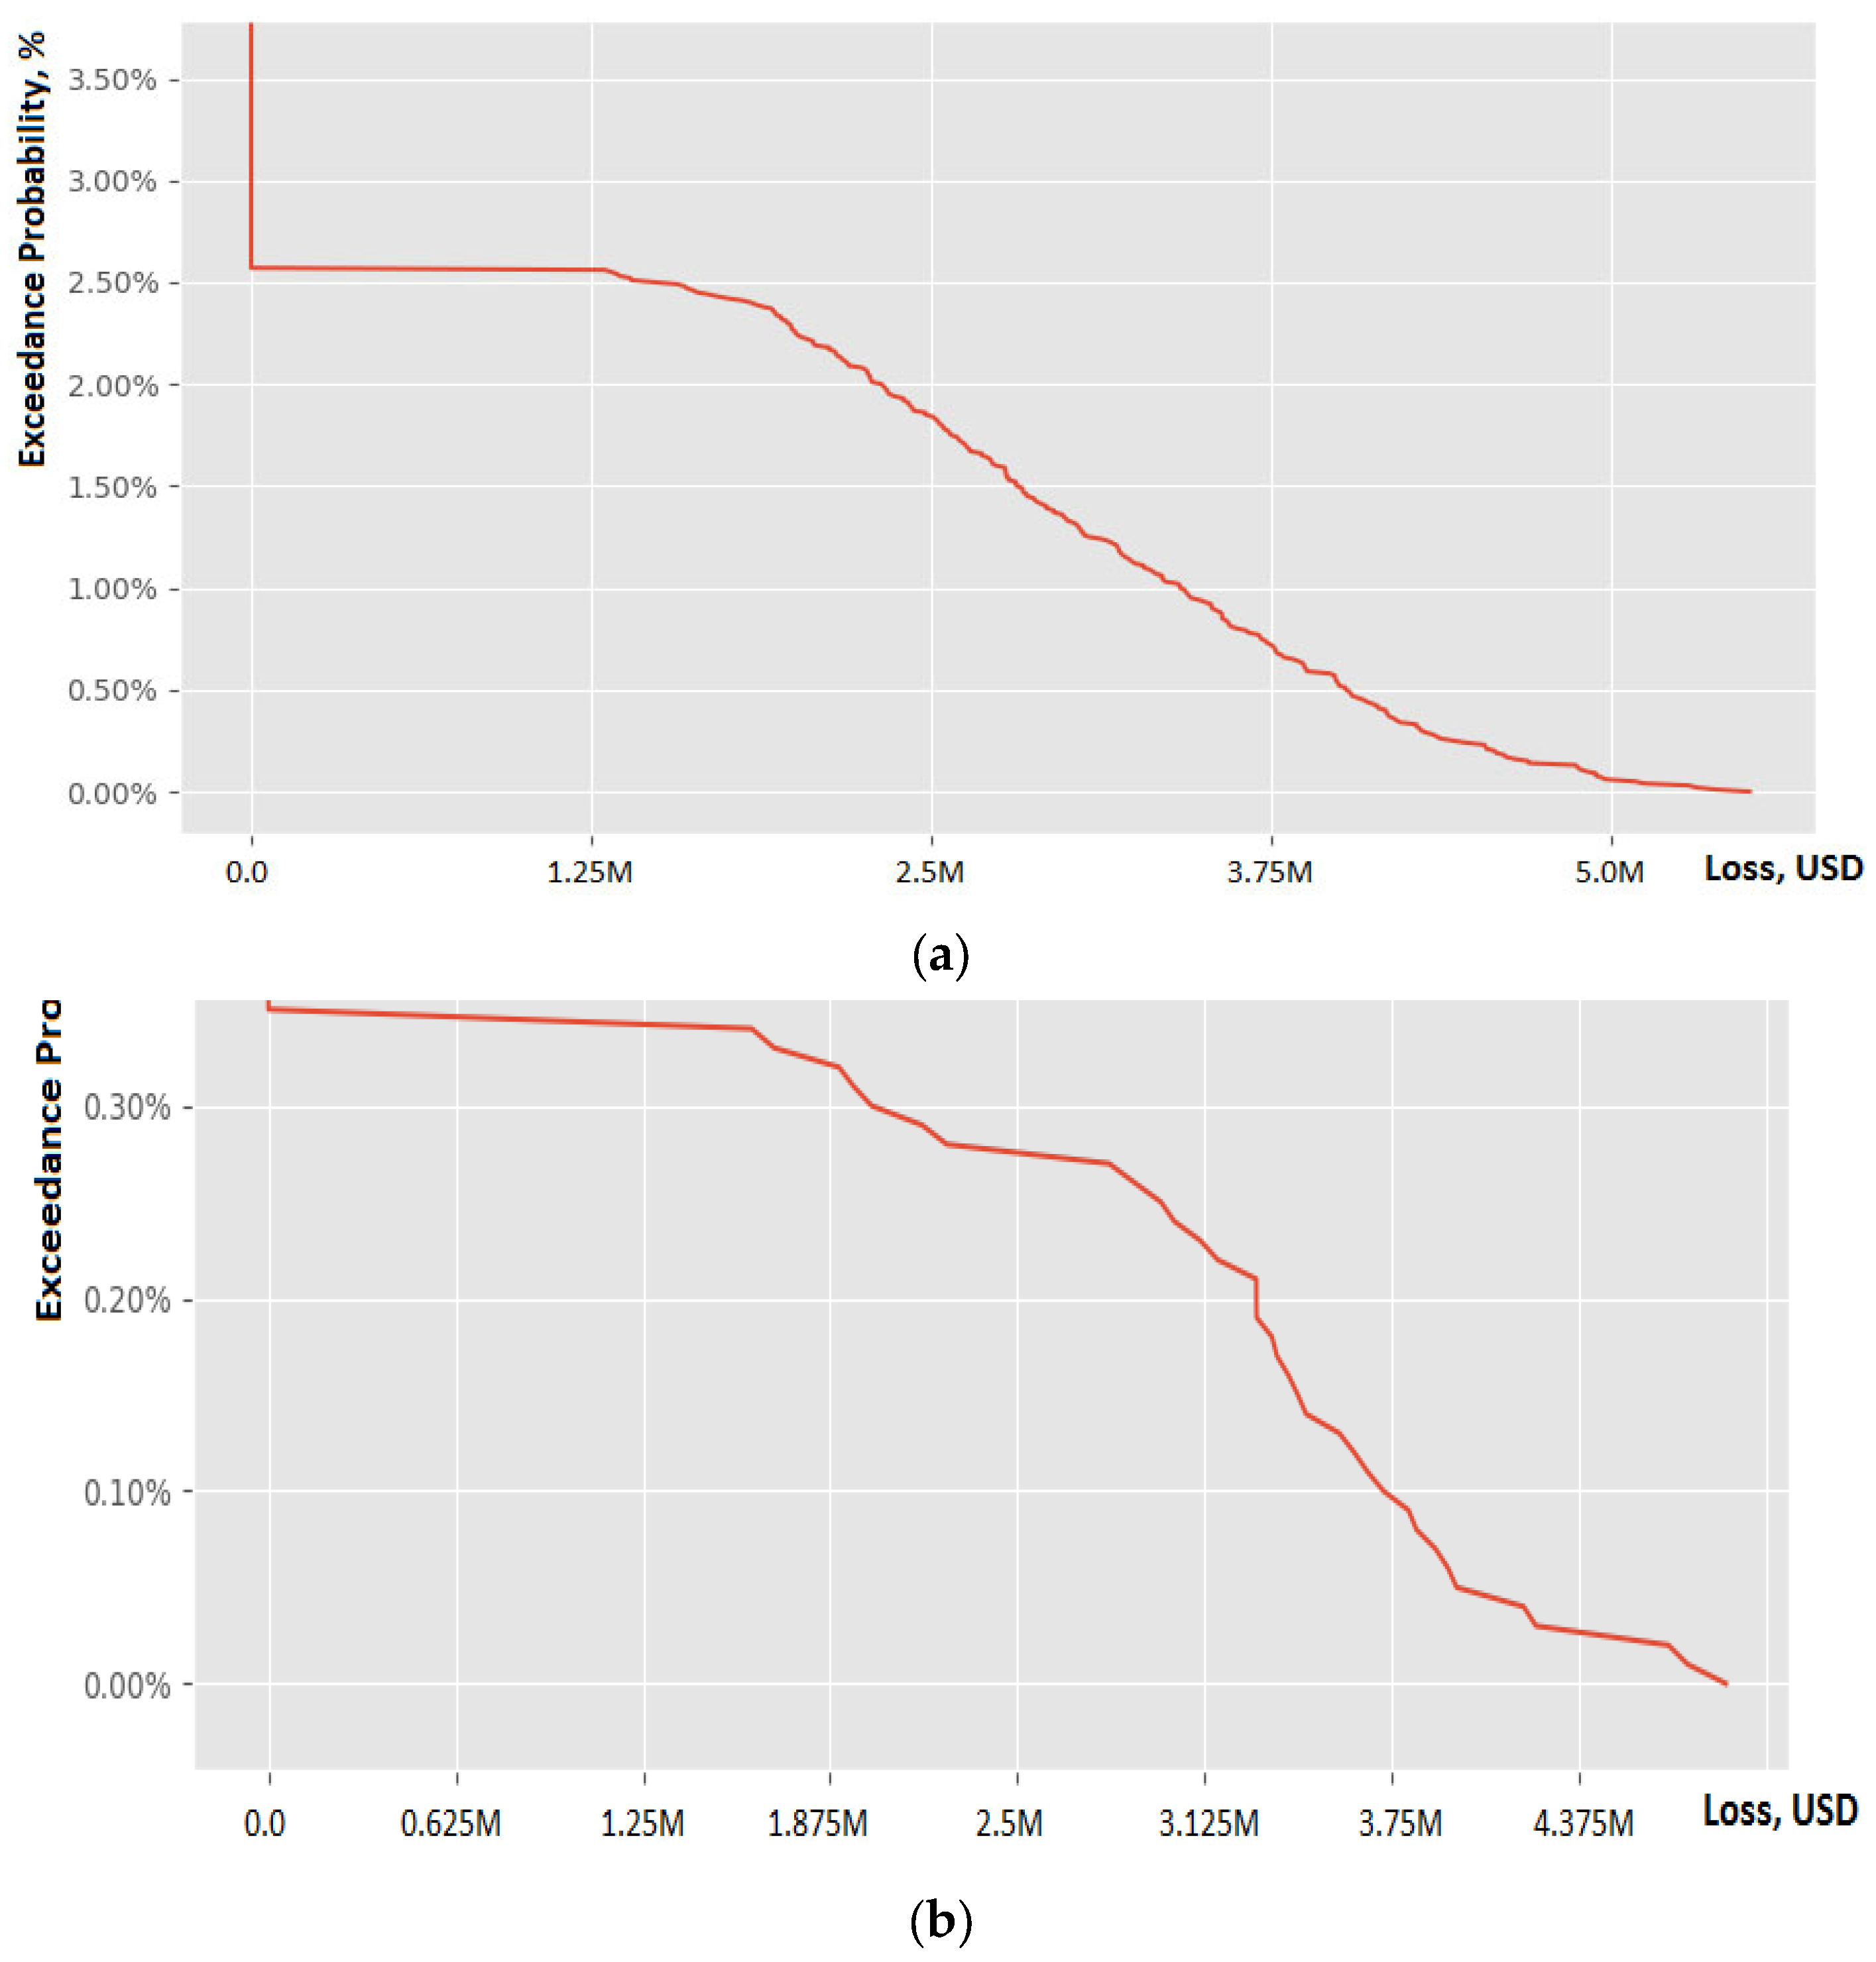
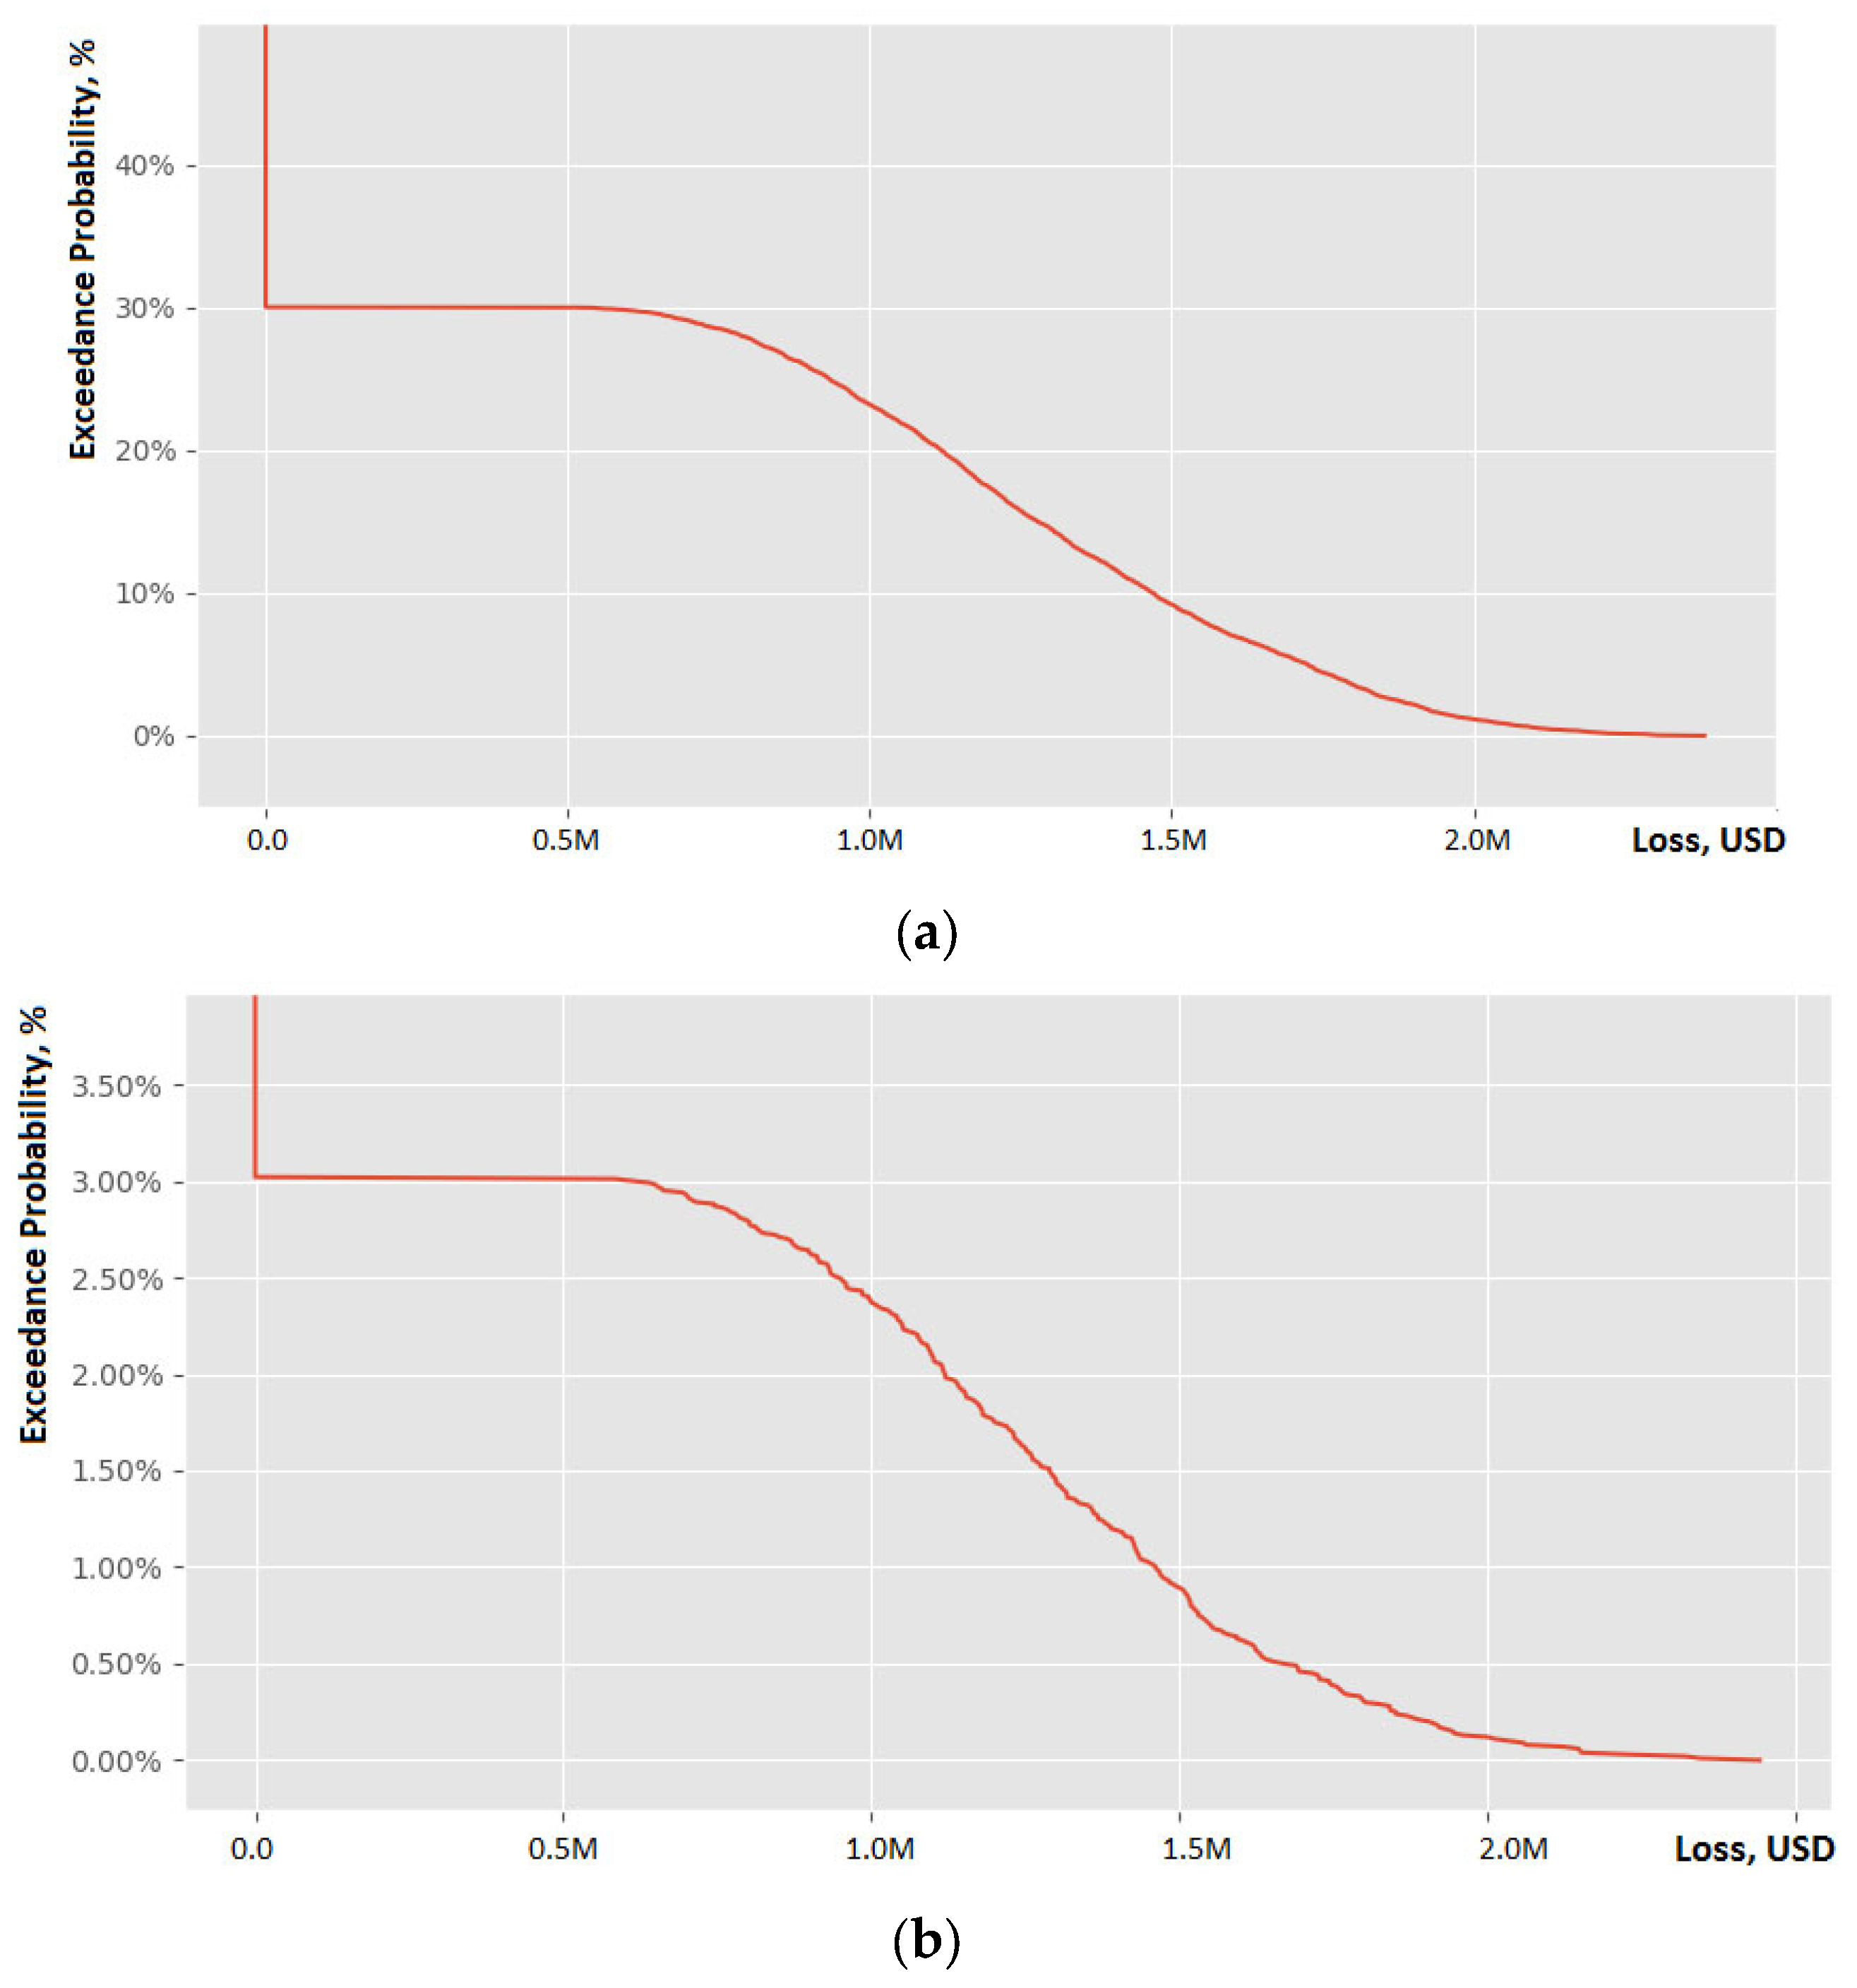
4.1. Scenario 1
4.2. Scenario 2
4.3. Scenario 3
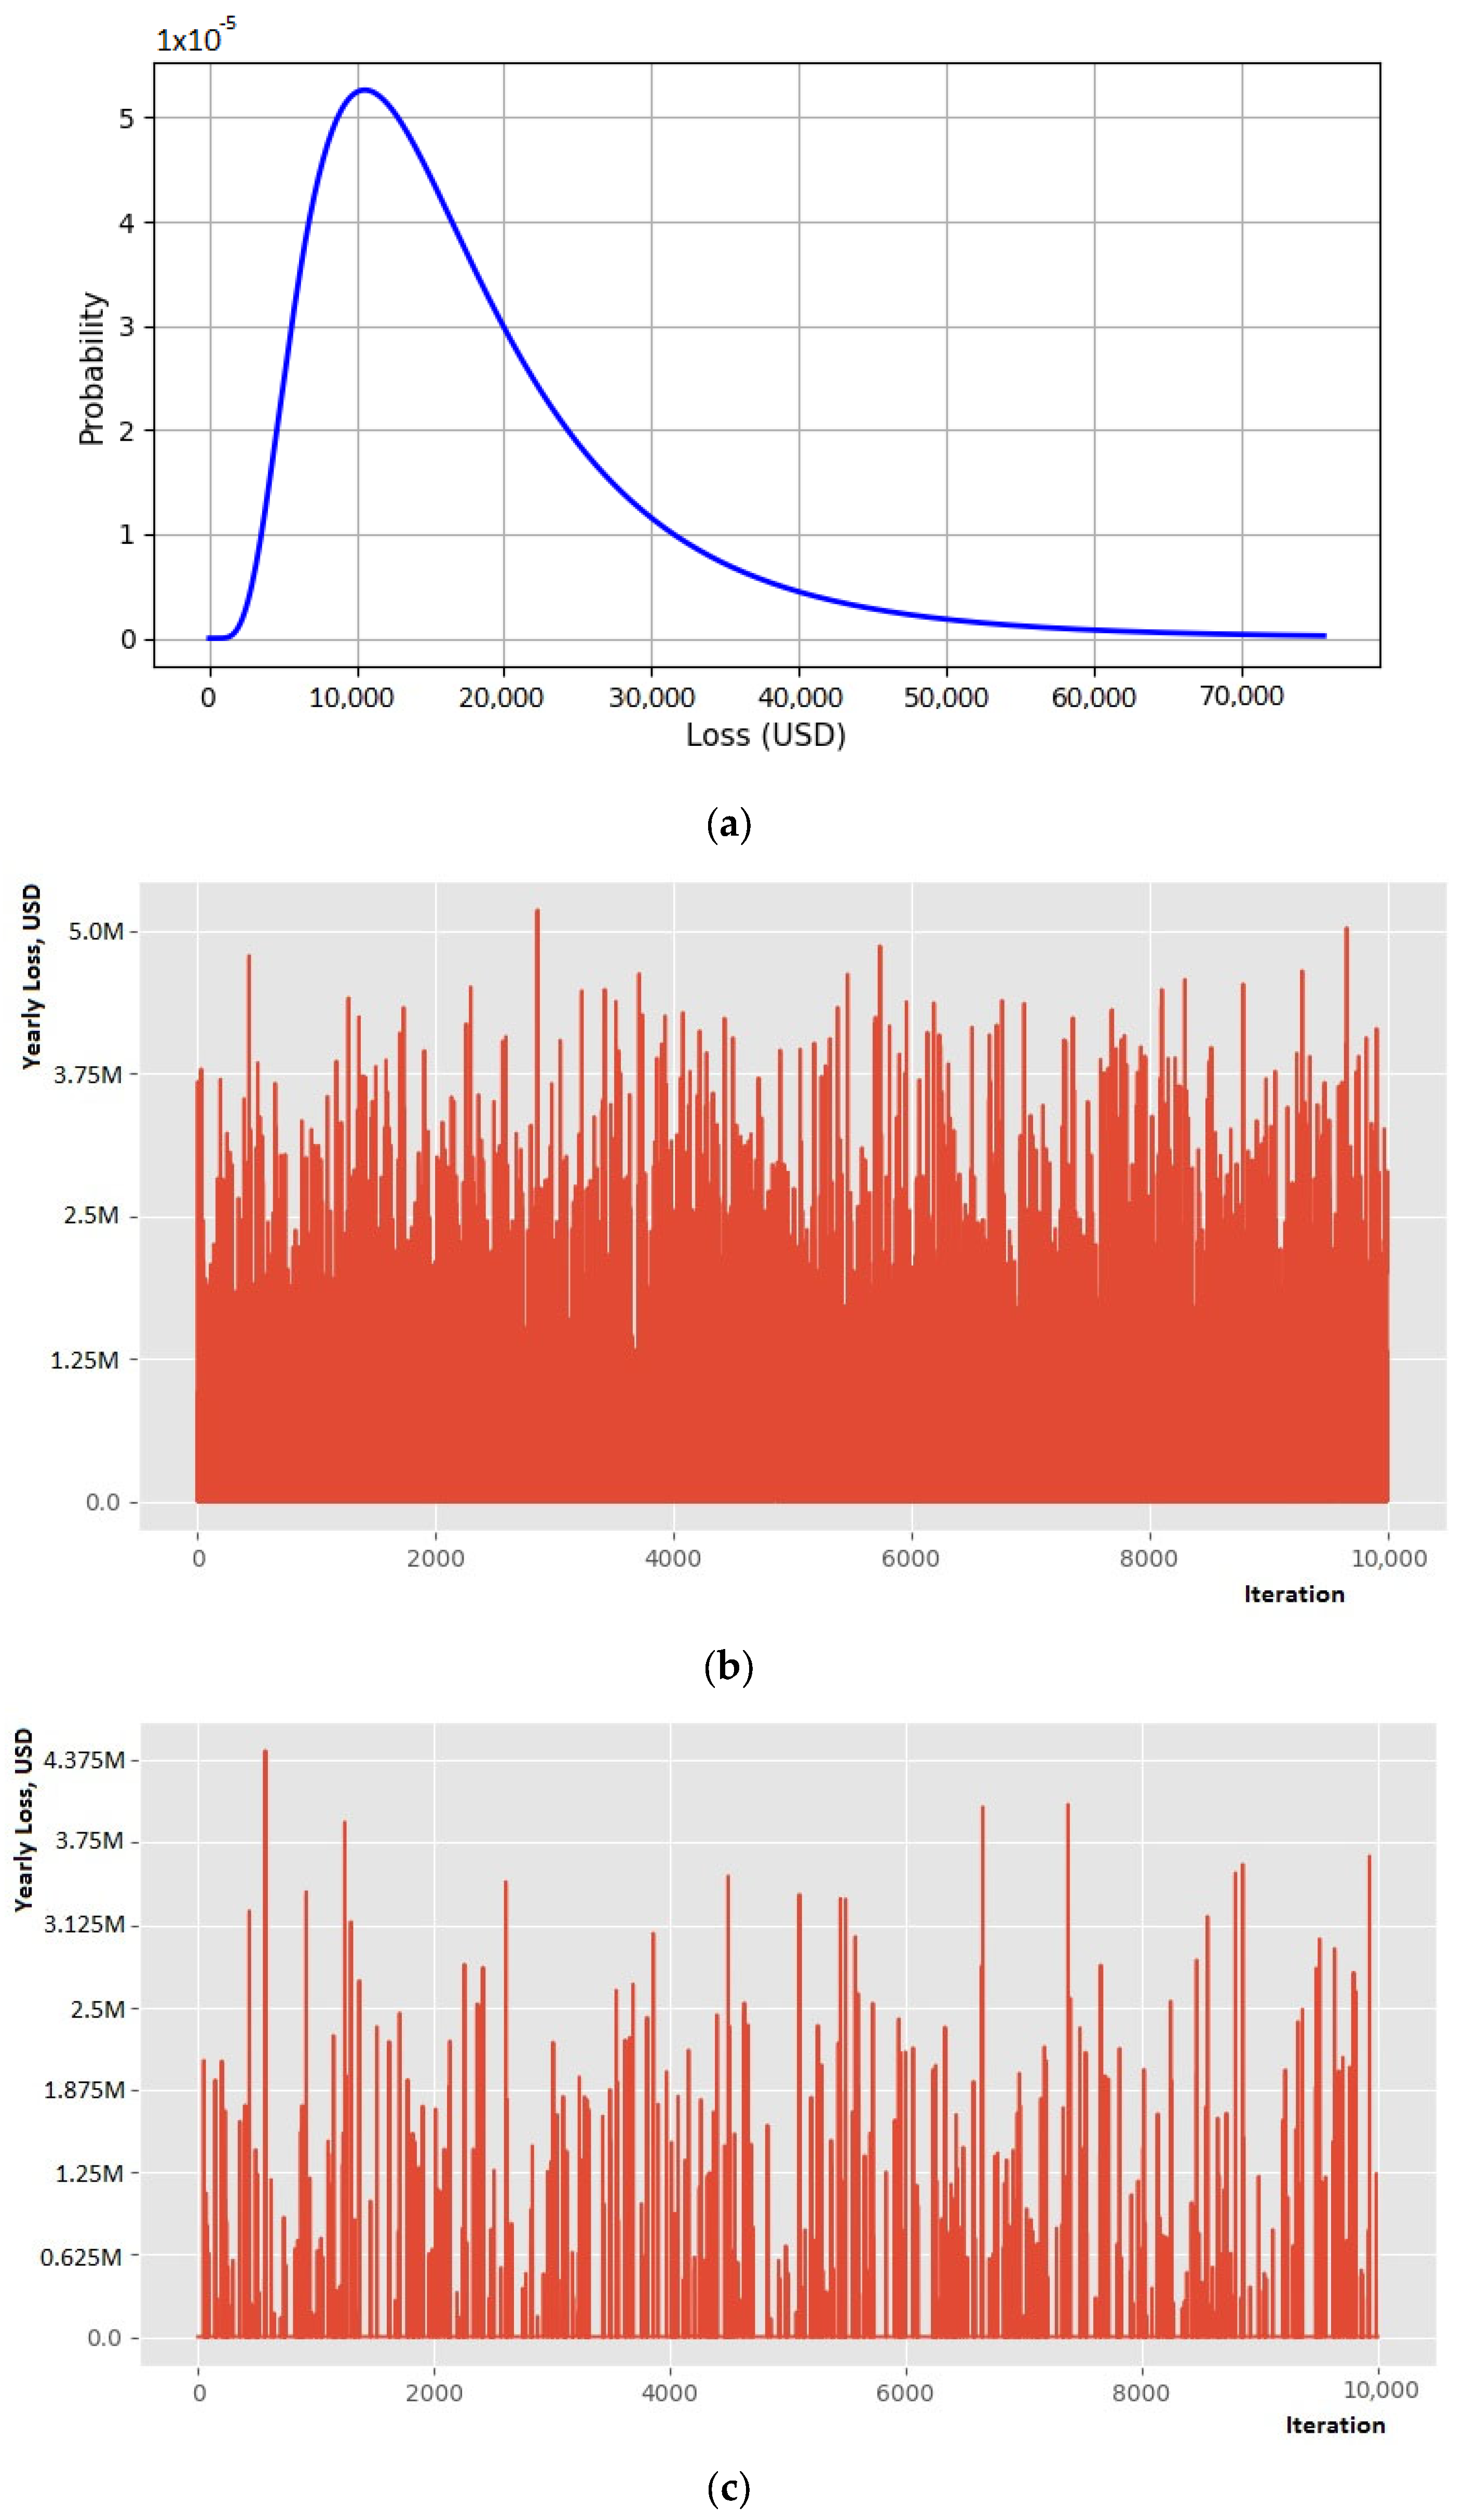
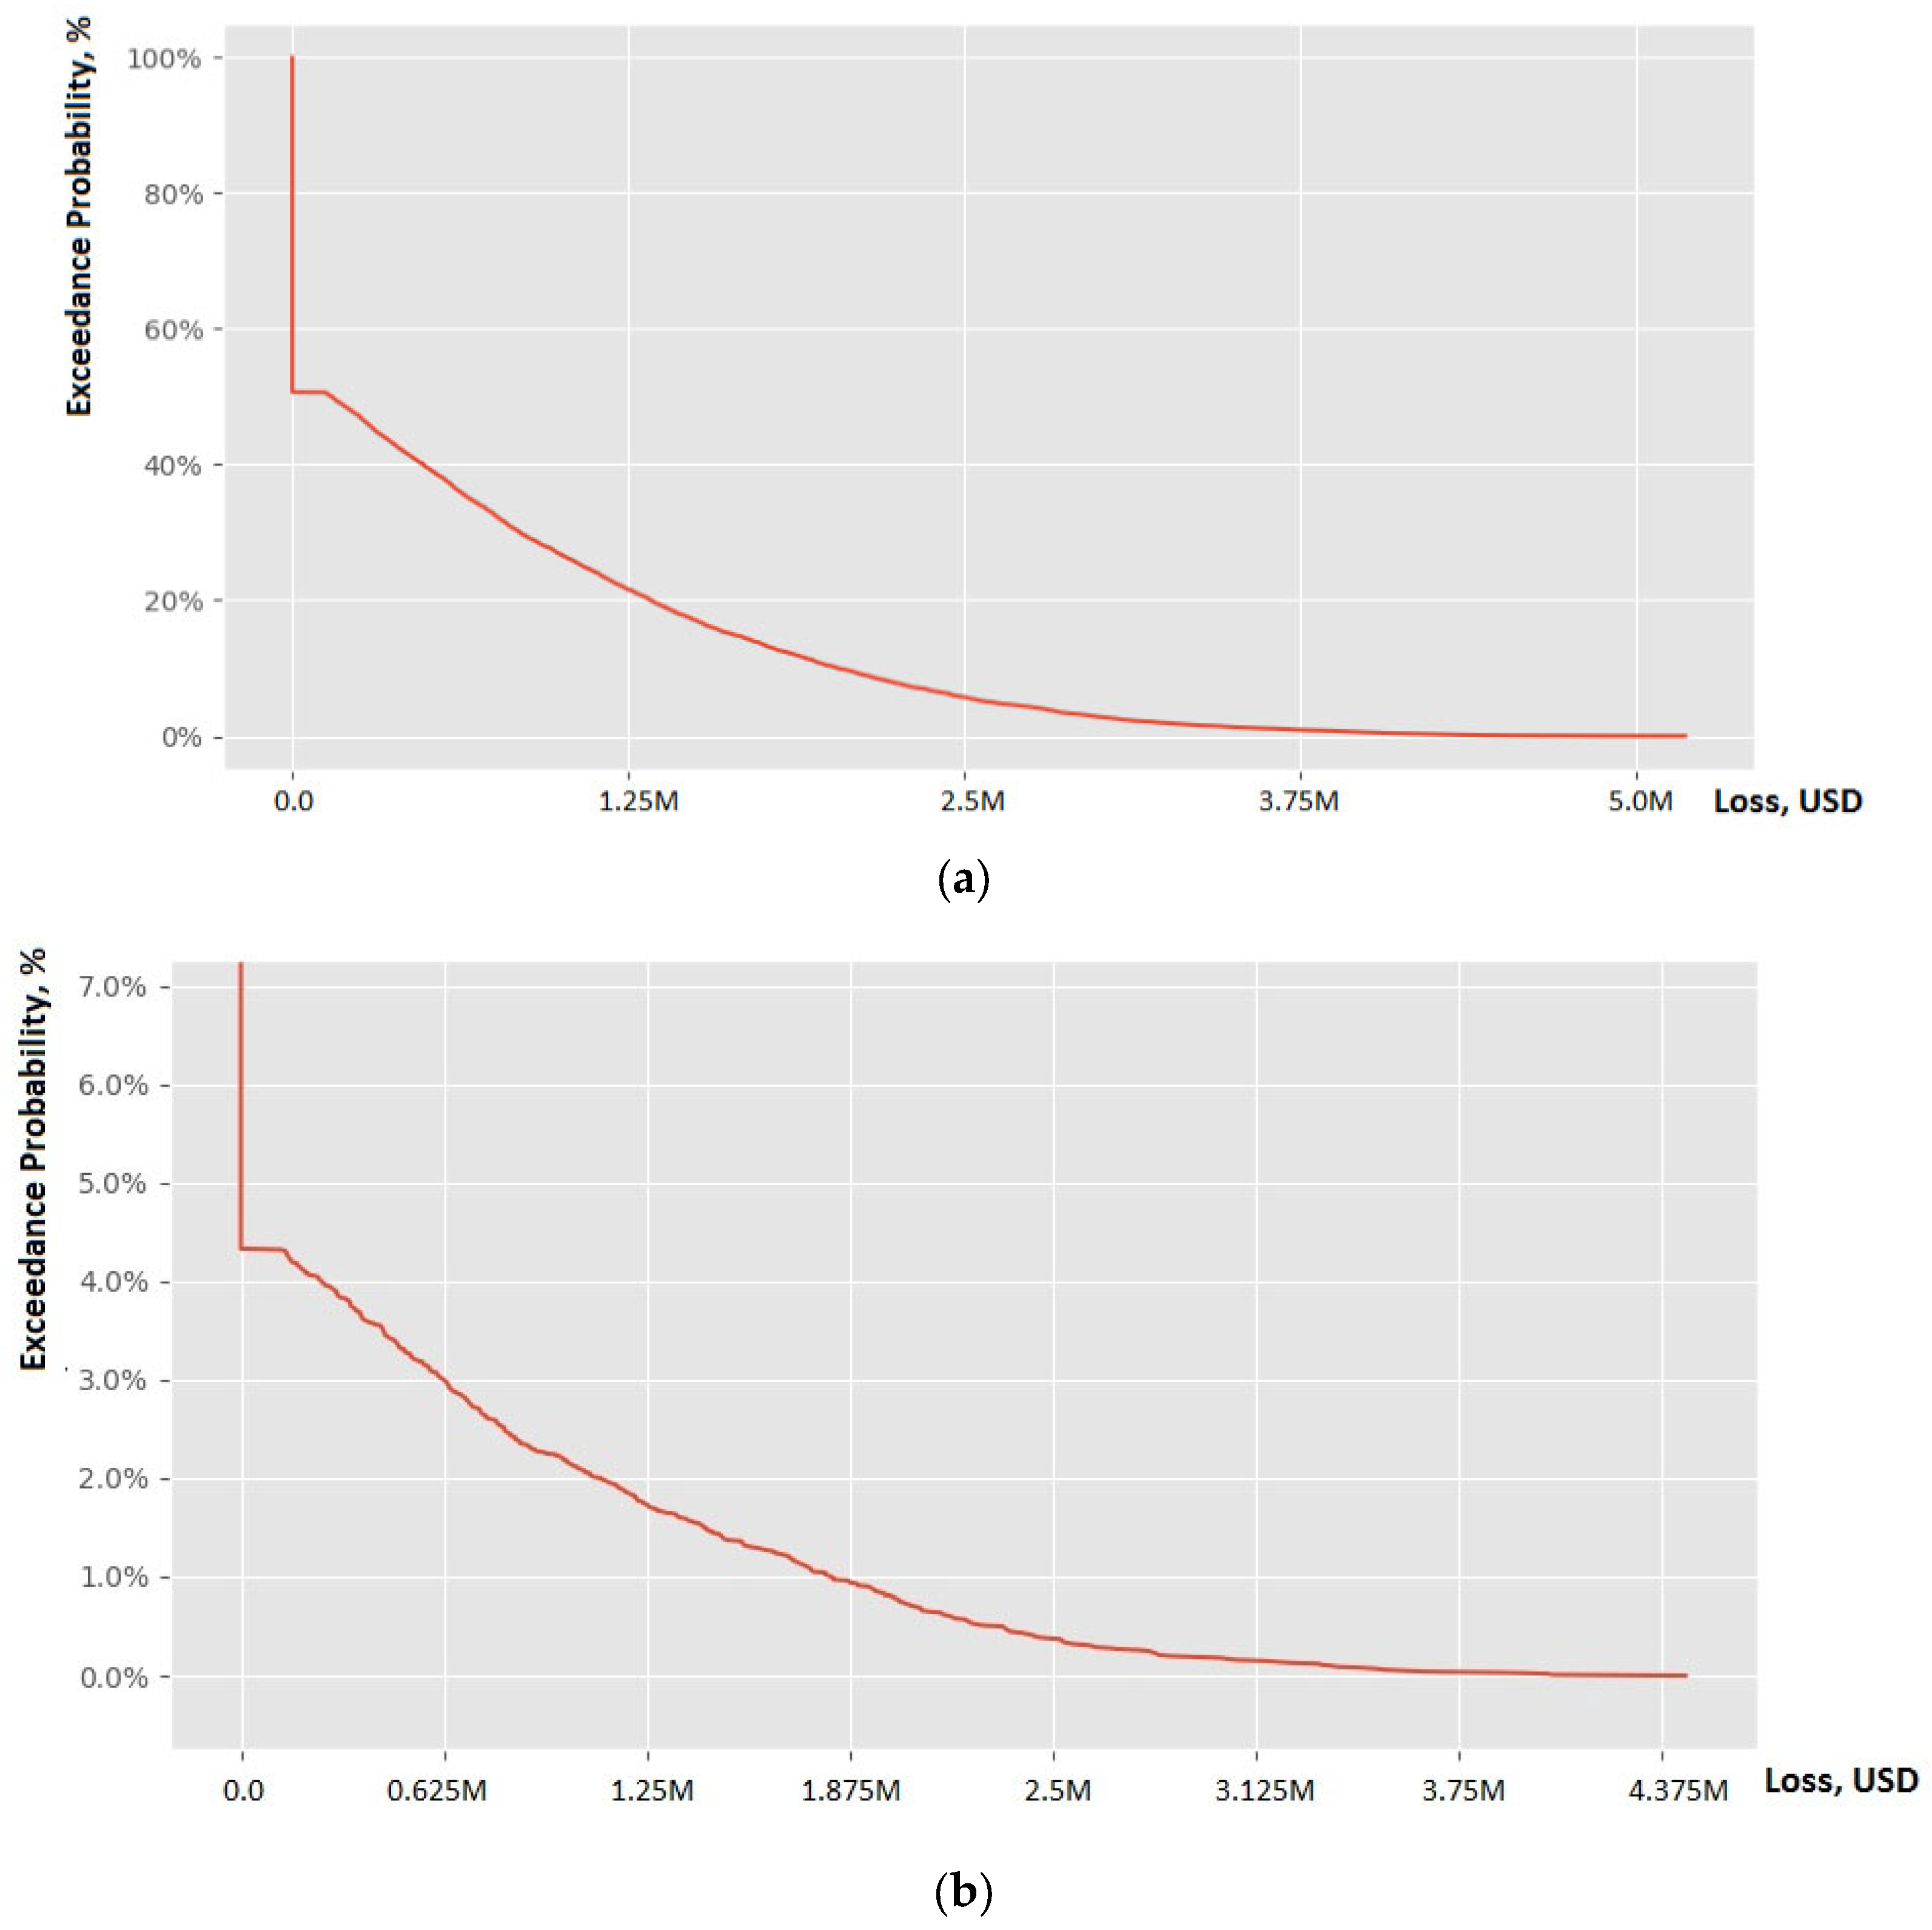
4.4. Scenario 4
4.5. Scenario 5
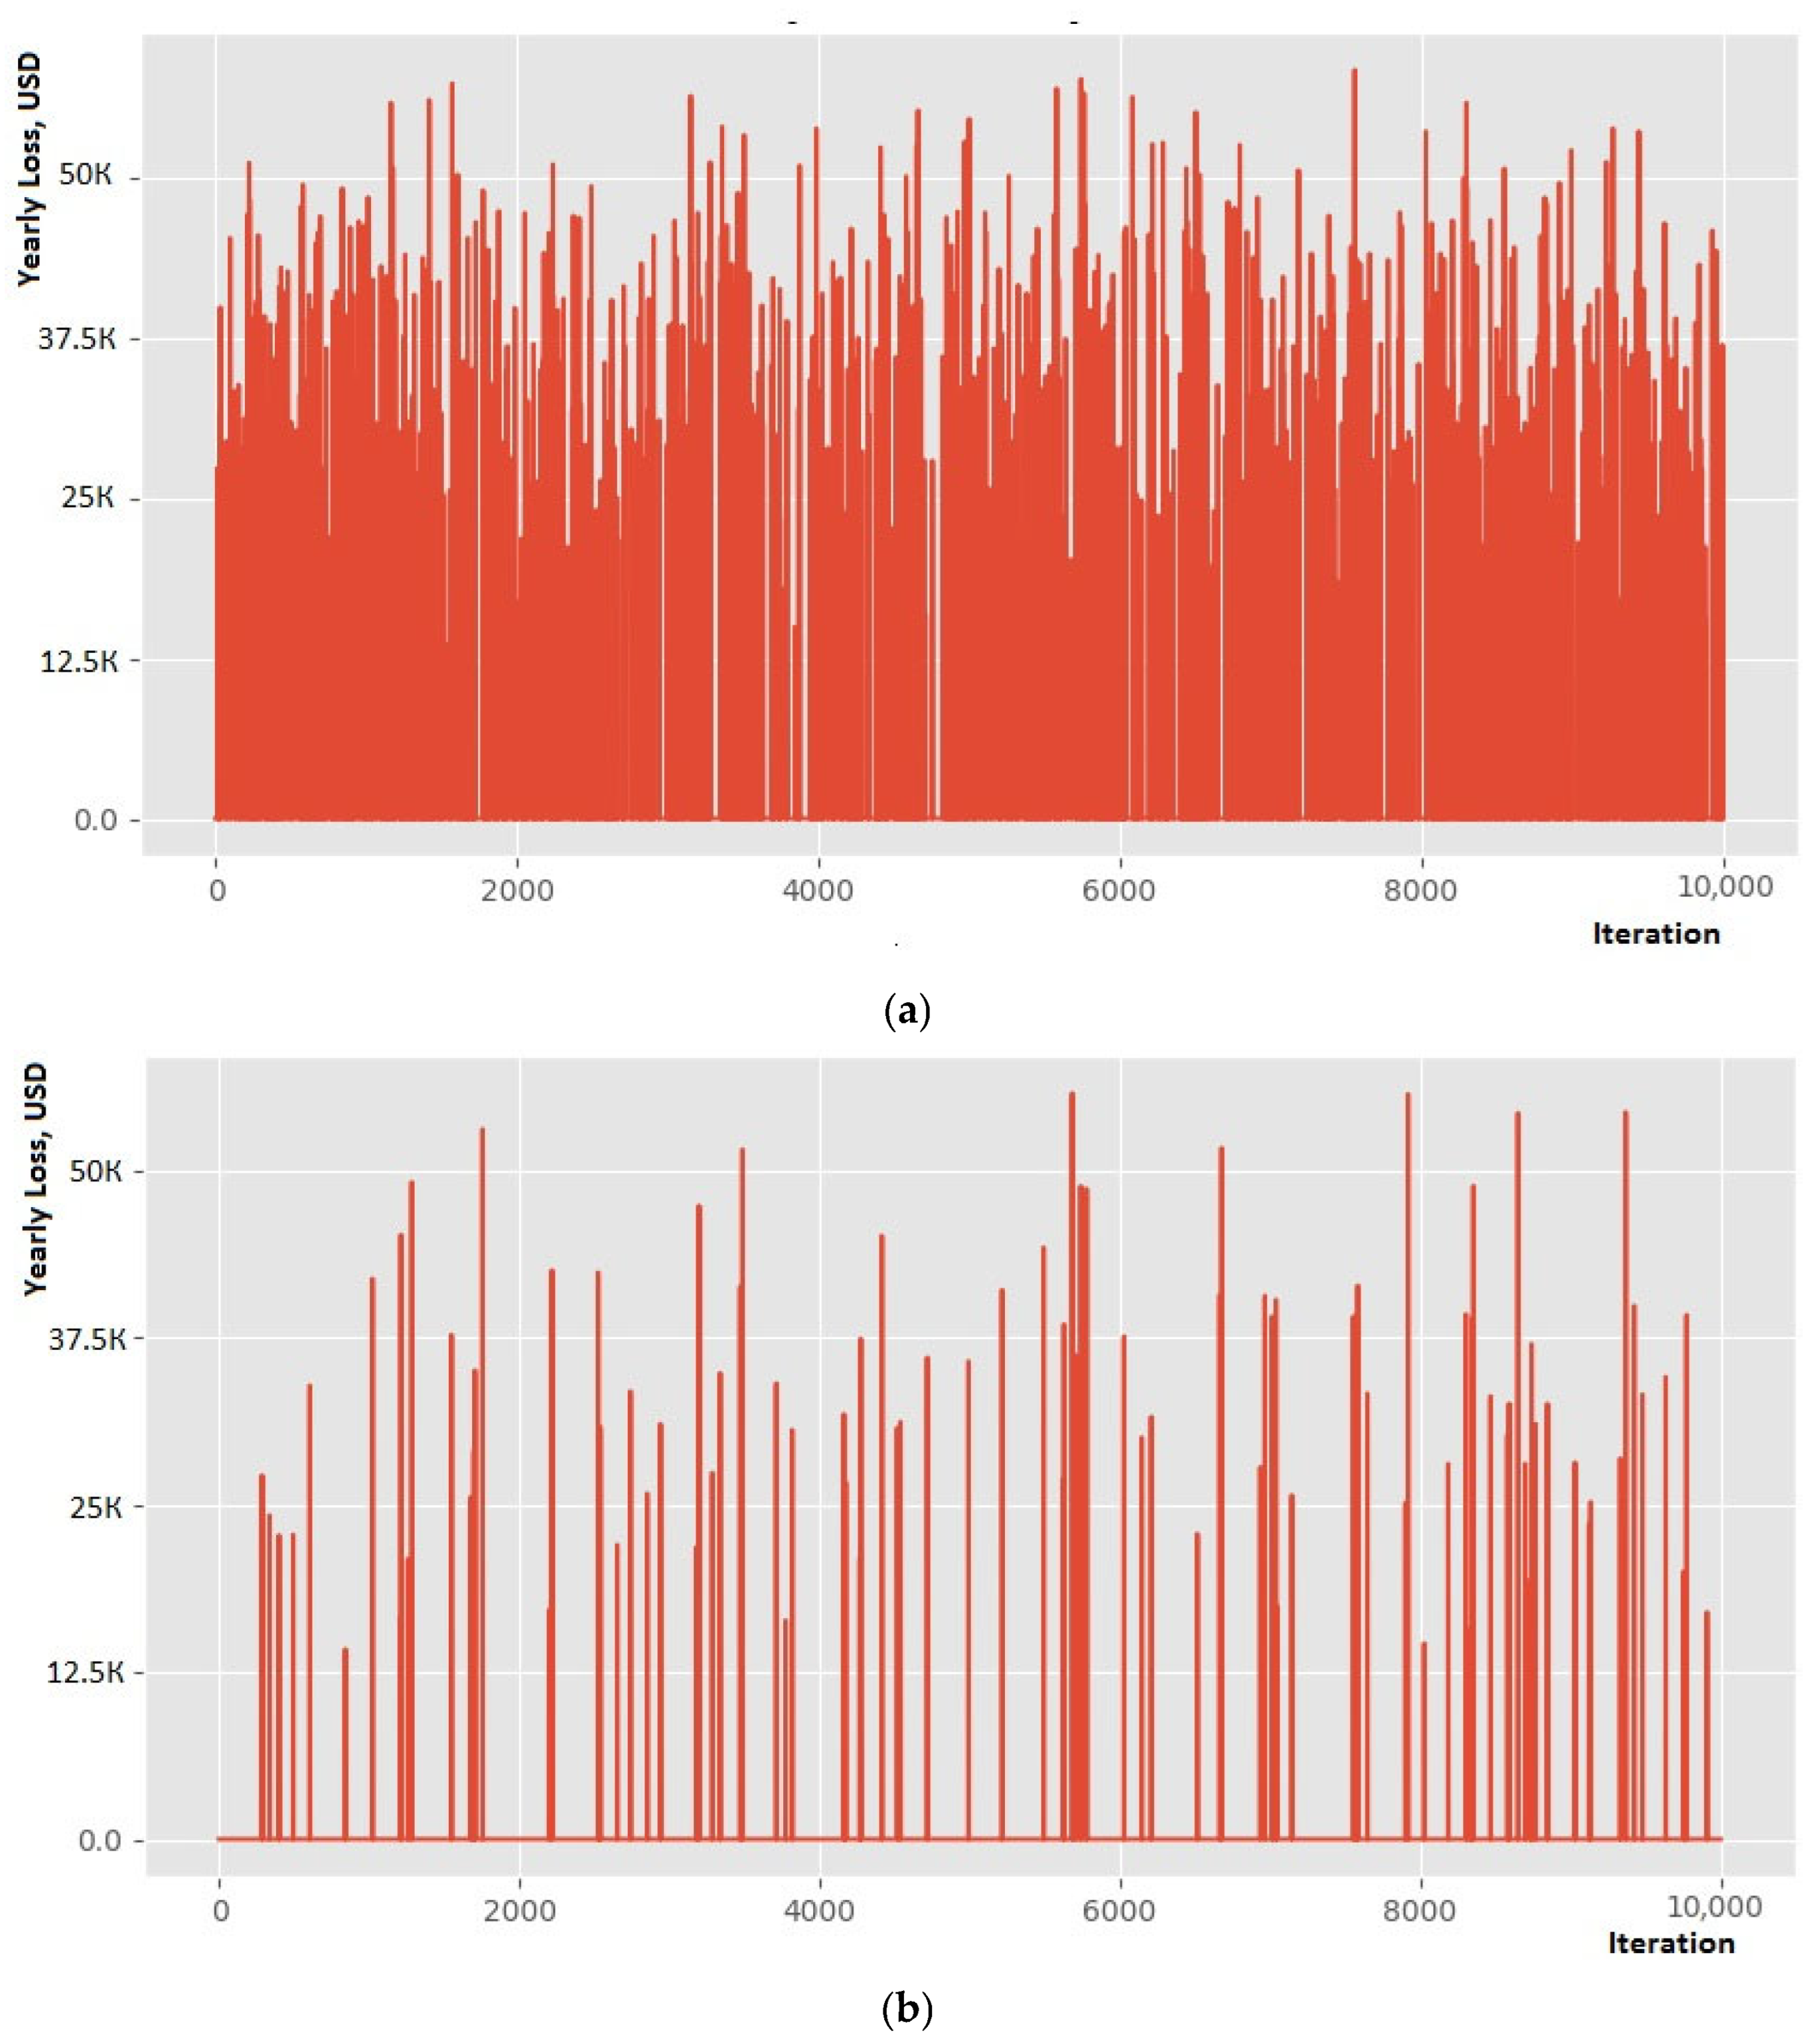
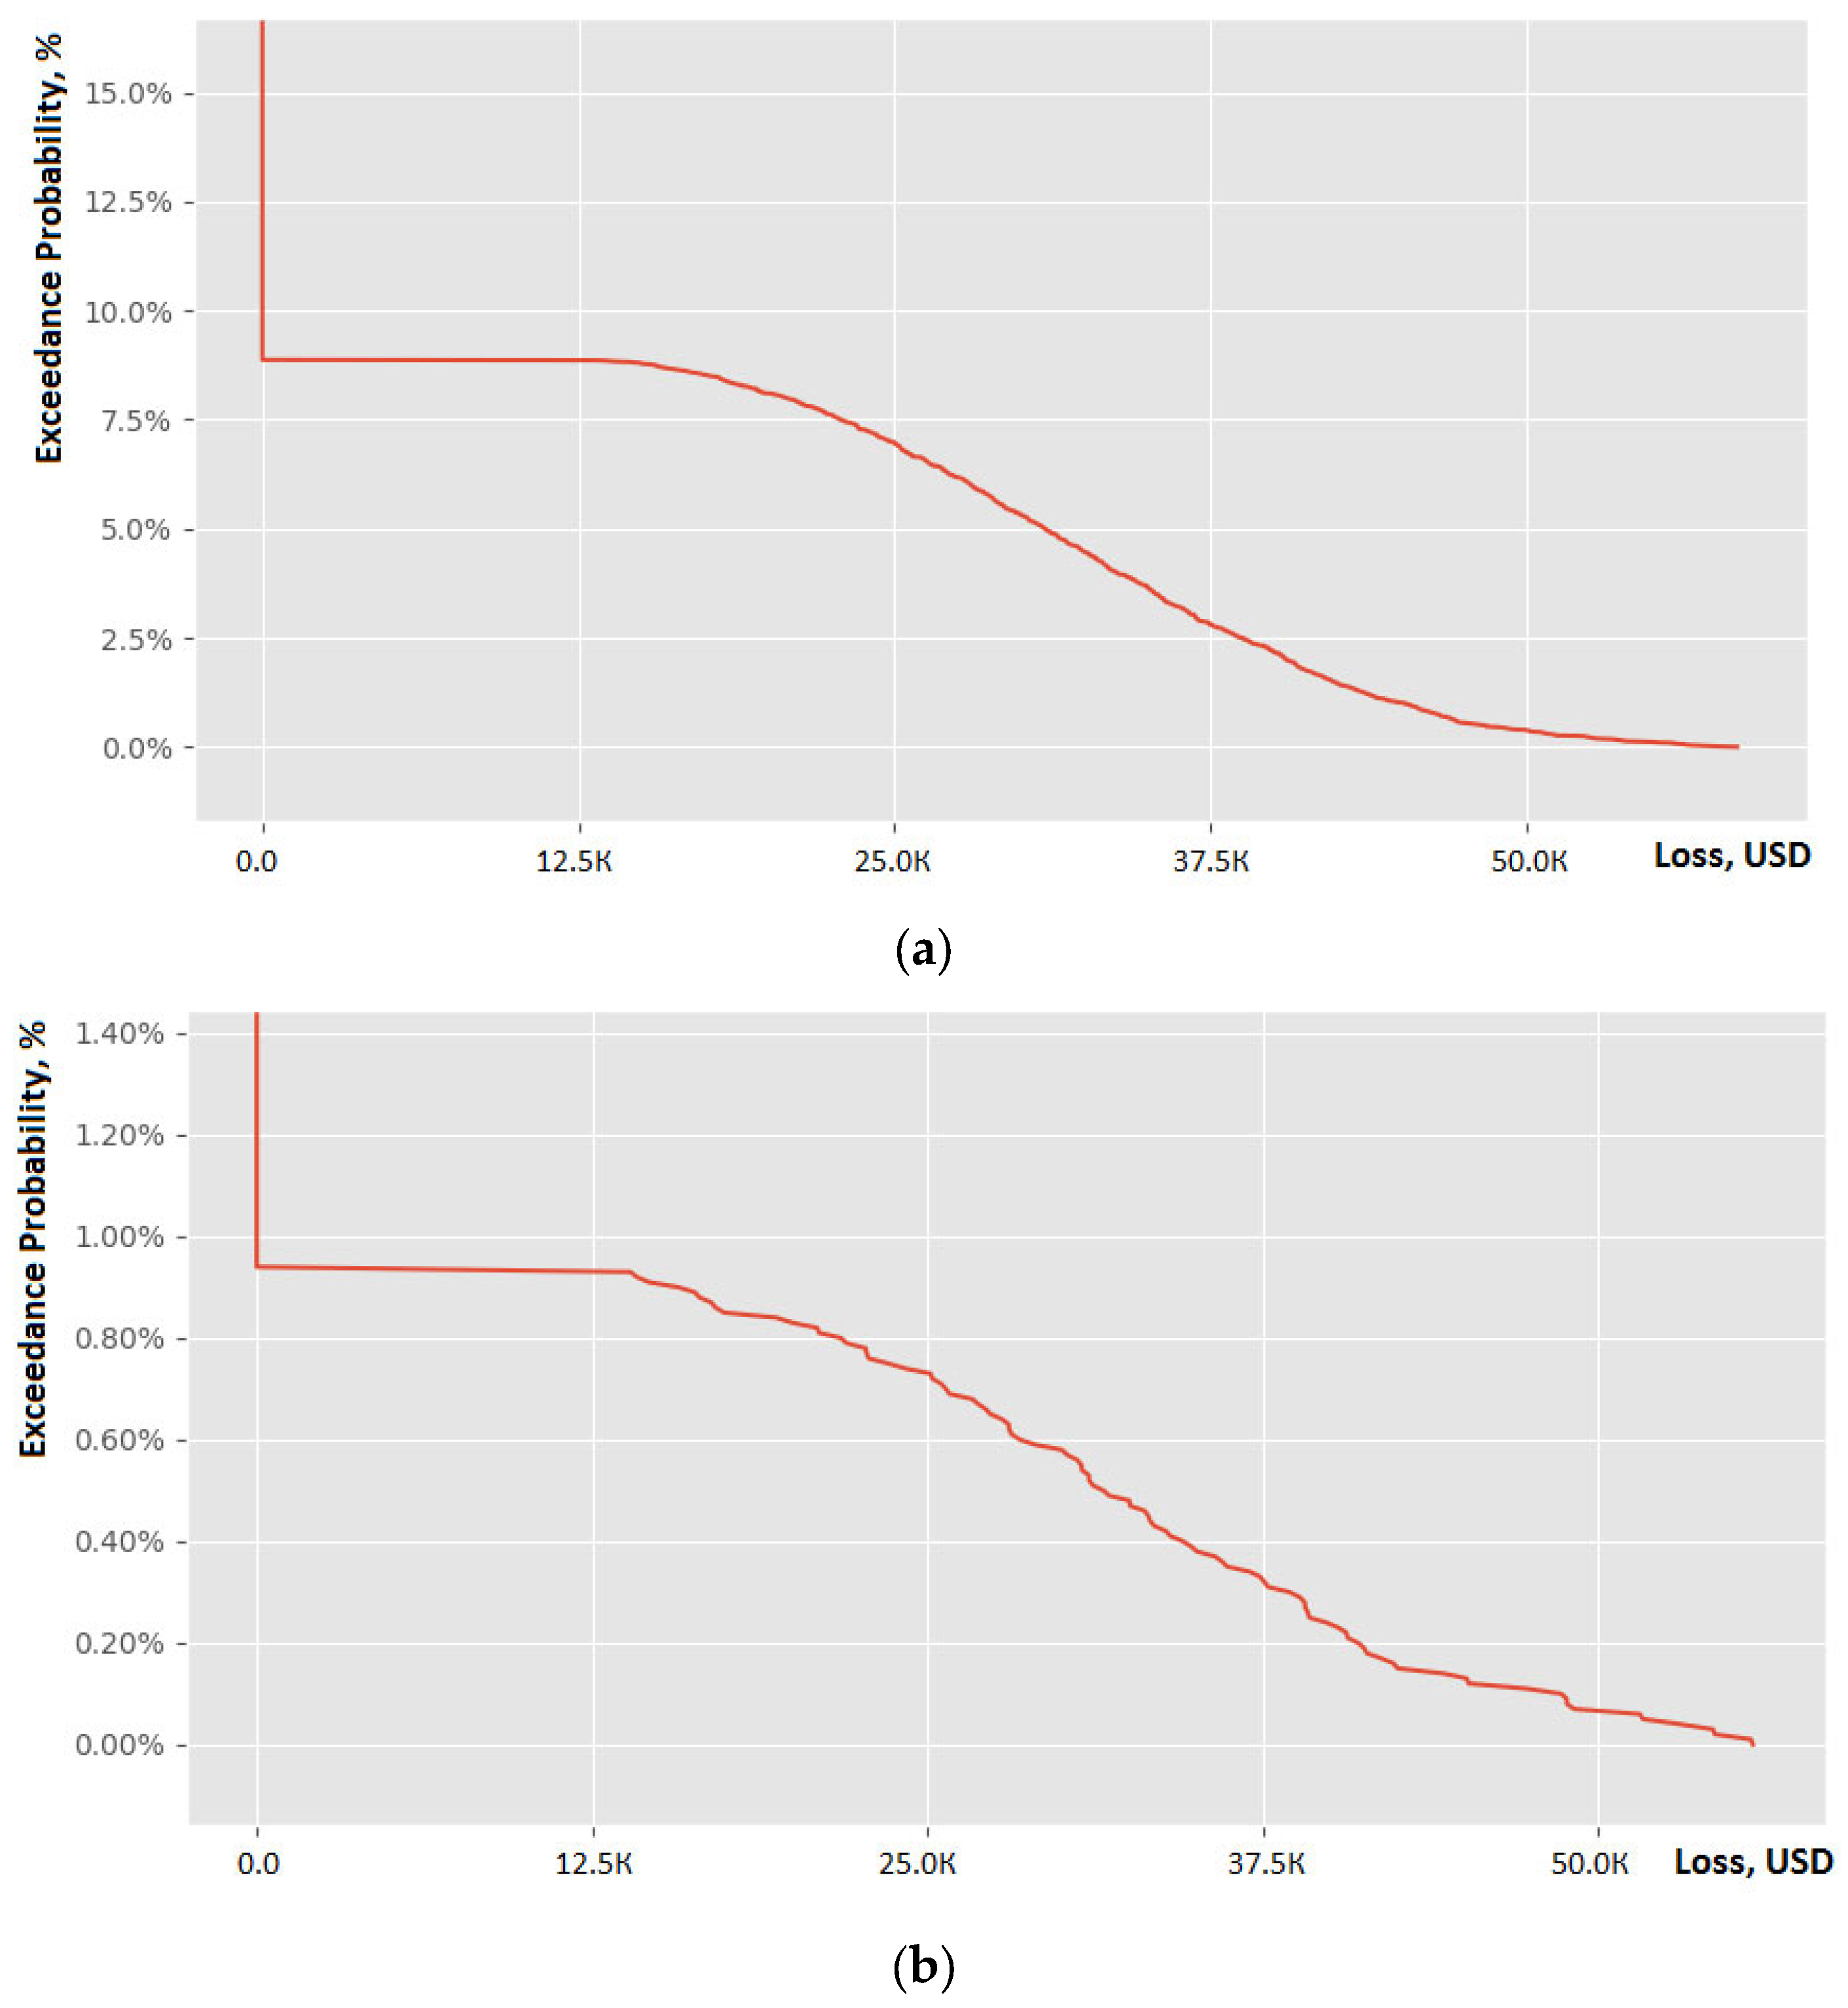
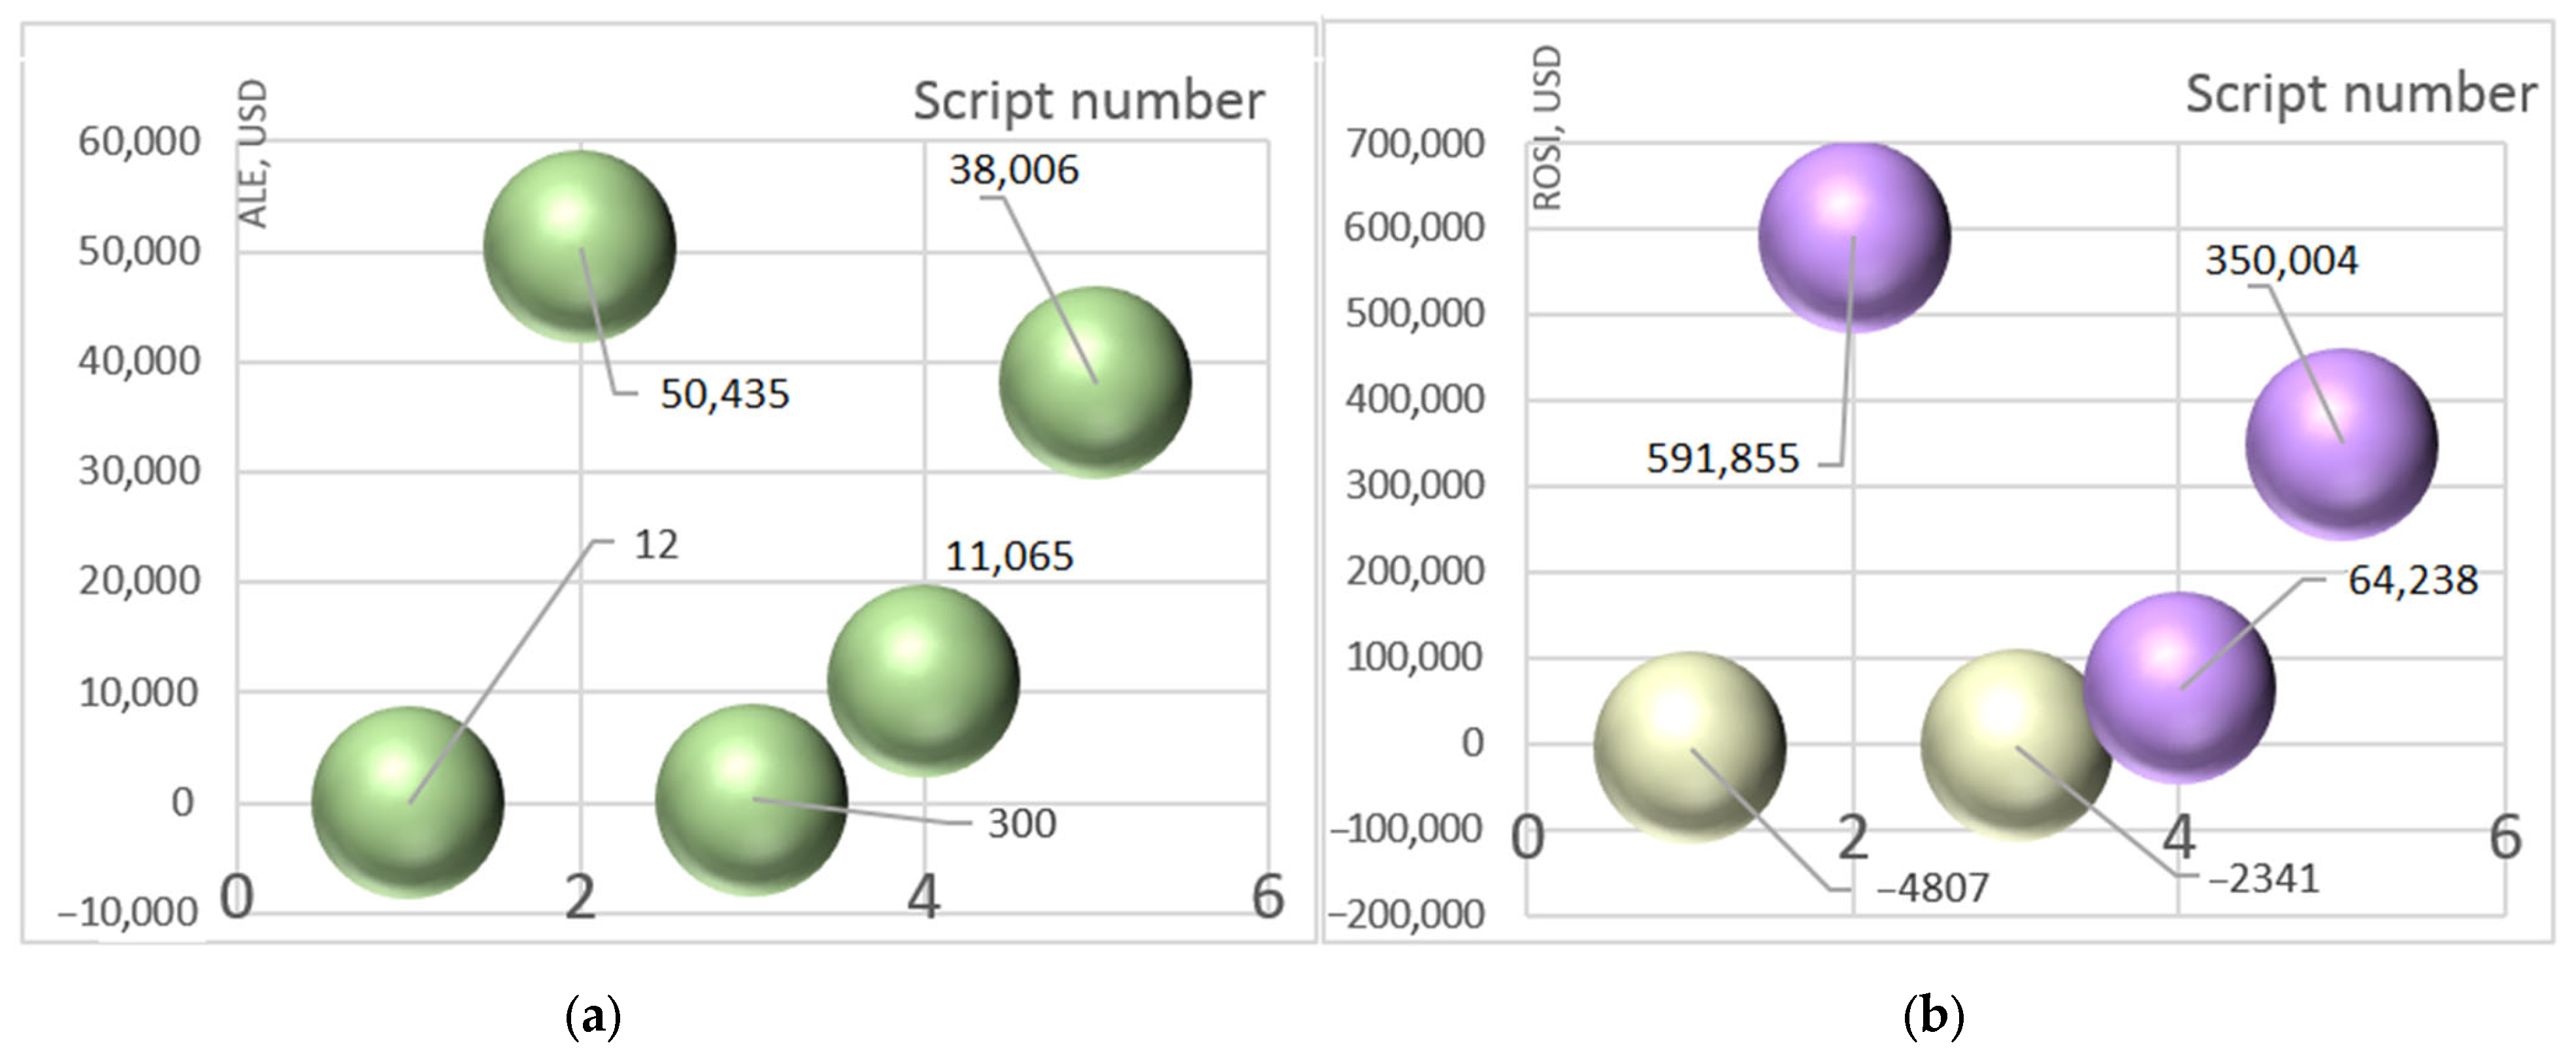
4.6. Analysis of the Results
5. Discussion and Prospects
5.1. Comparison of Risk Assessment Scenarios with Previously Known Ones
5.2. Practical Recommendations for Stakeholders
5.3. Future Research Directions
- Multi-criteria decision analysis (MCDA);
- Utility-based analysis;
- Stakeholder-based scenario analysis;
- Customizable risk reports.
6. Conclusions
- -
- Increased electricity costs (in the agricultural sector, where there are already high electricity costs for irrigation, greenhouse lighting and other processes, the additional burden of cryptojacking can lead to even higher costs). This is especially true for farms that use automated systems and sensors that require constant power.
- -
- Reduced equipment performance (cryptojacking can slow down computers and other devices used in the agricultural sector for farm management, data analysis, and other tasks). This can lead to delays in decision-making, equipment errors and reduced overall productivity.
- -
- Cybersecurity risks (cryptojacking is often part of a wider cyberattack that can include data theft, equipment damage and other malicious actions).
Author Contributions
Funding
Institutional Review Board Statement
Informed Consent Statement
Data Availability Statement
Acknowledgments
Conflicts of Interest
References
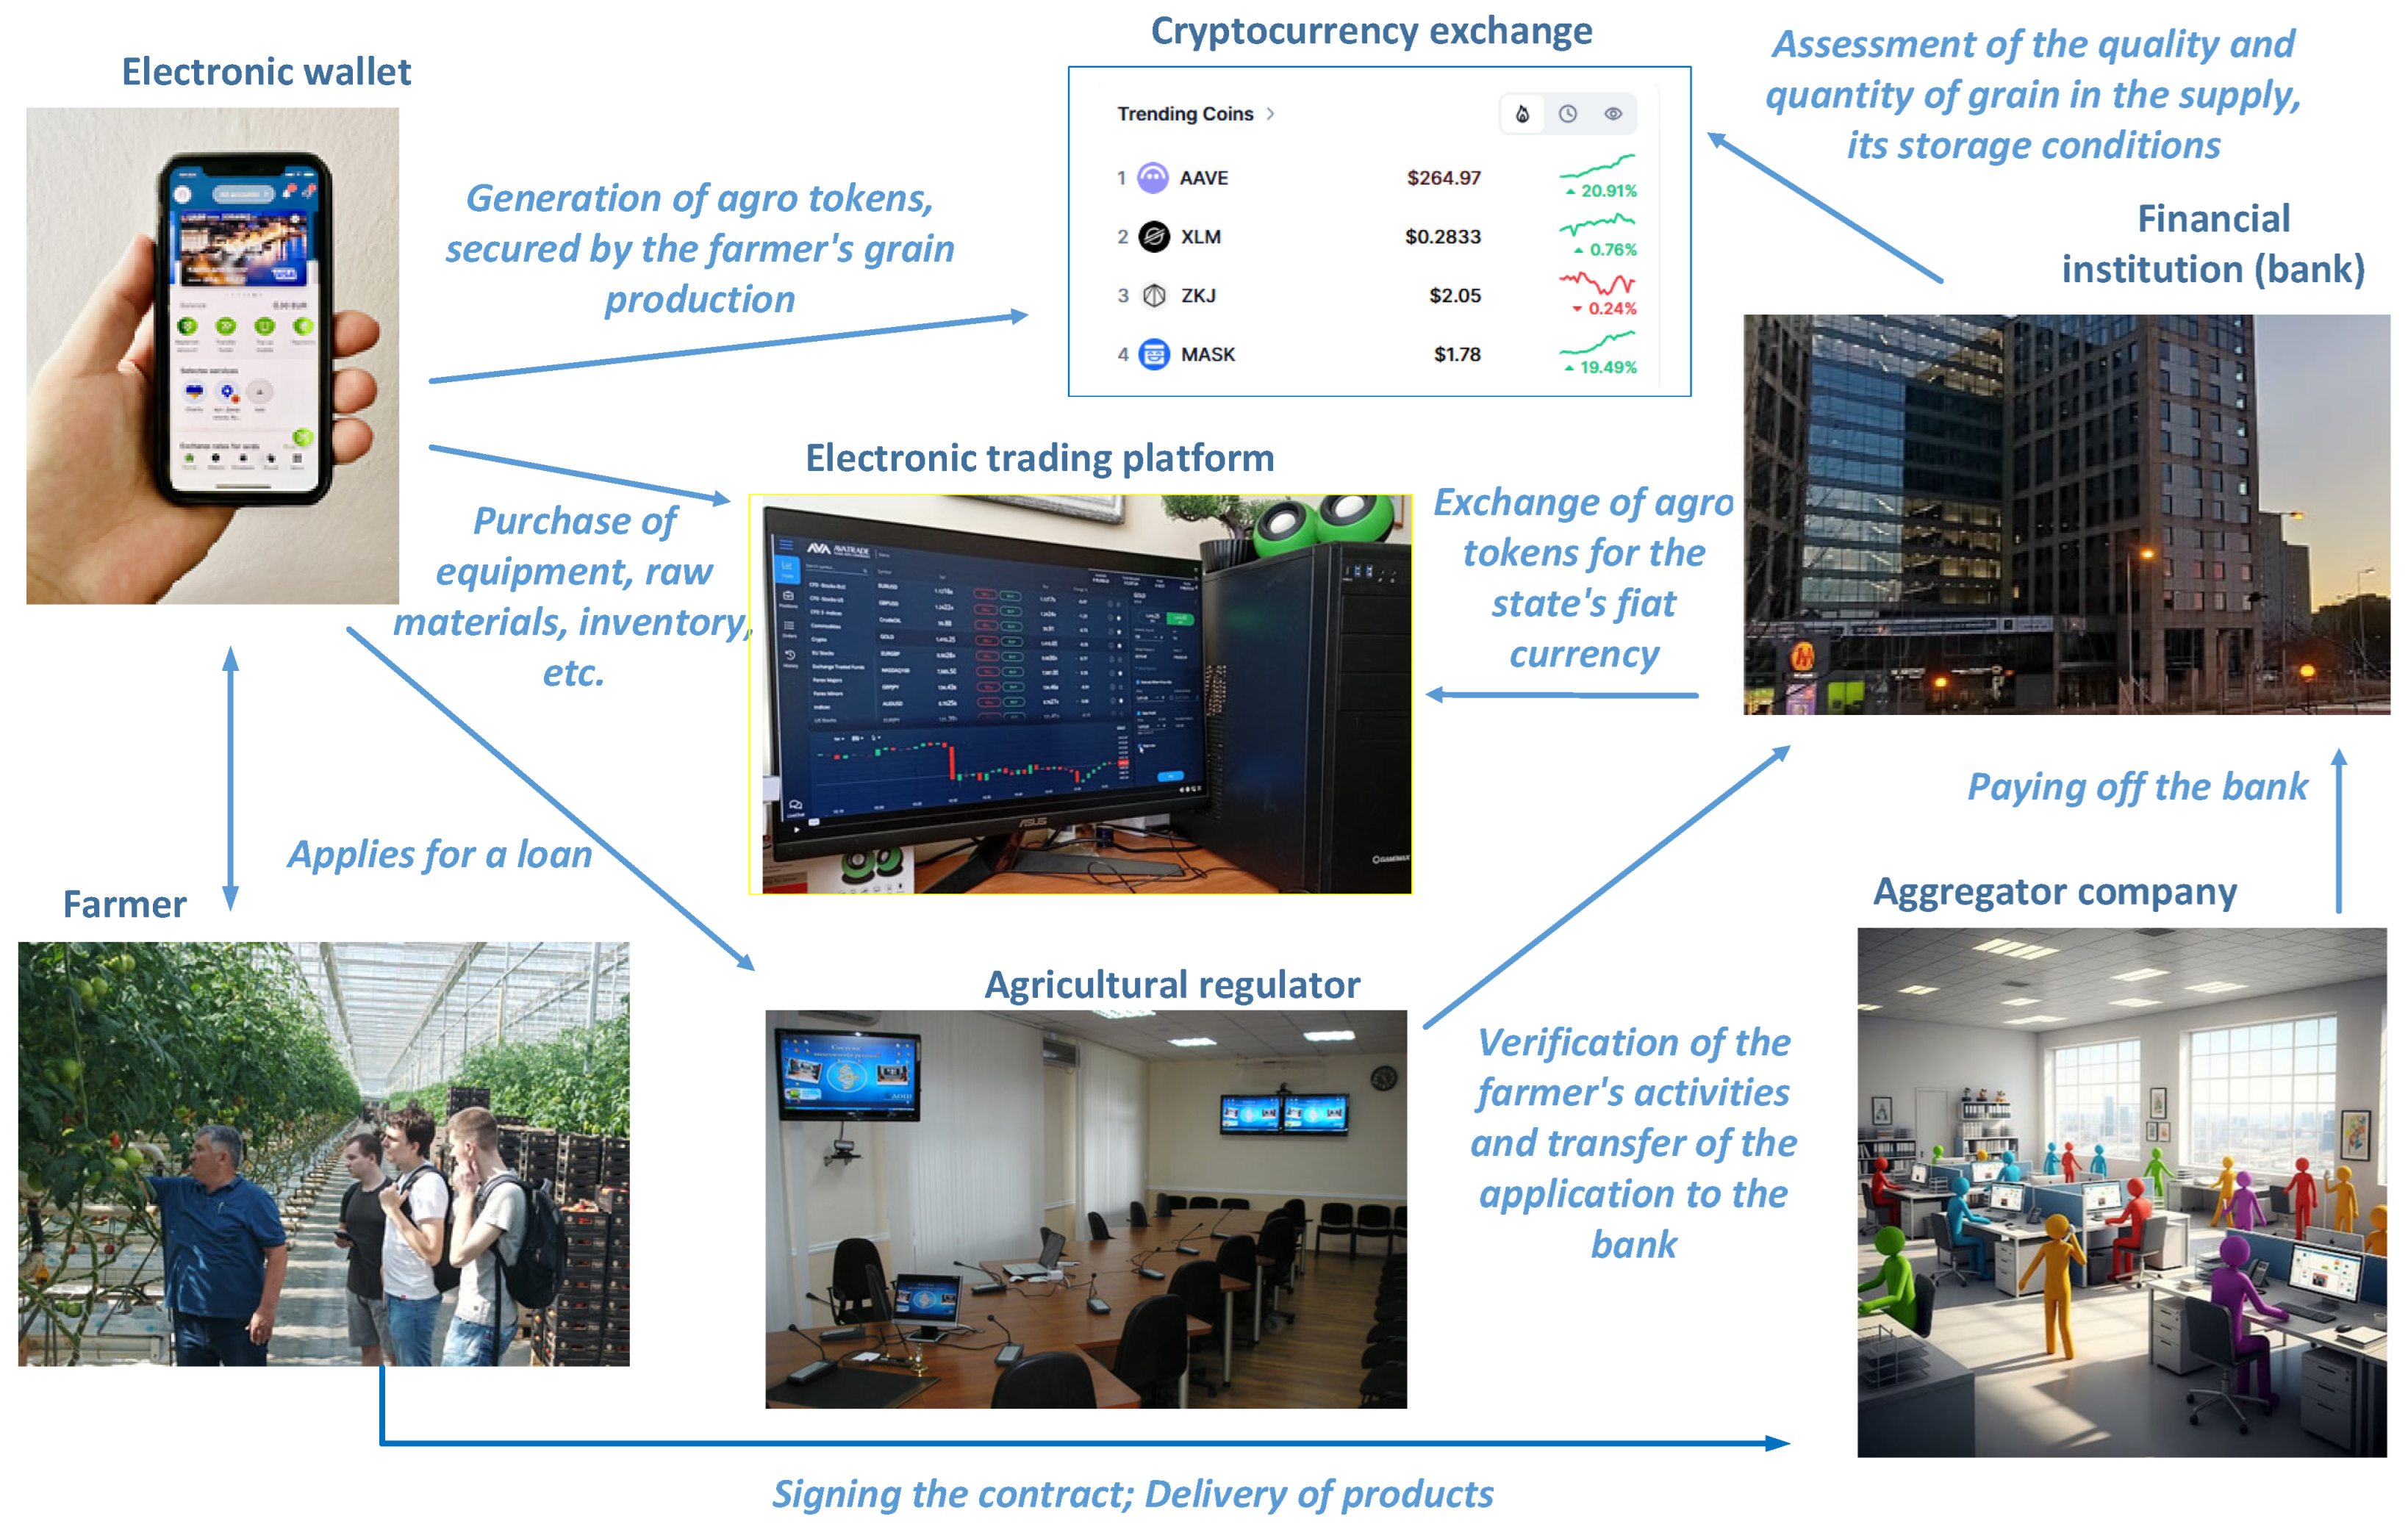
- Volodina, V.N.; Lukashenko, I.V.; Rudakova, O.S. Digital ecosystem of the agricultural sector: Architecture, grain tokens, startups (Context of functional priority and sustainable development). Int. Agric. J. 2023, 66, 479–483. (In Russian). Available online: https://cyberleninka.ru/article/n/tsifrovaya-ekosistema-agrosektora-arhitektura-zernovye-tokeny-startapy-kontekst-funktsionalnogo-prioriteta-i-ustoychivogo-razvitiya/viewer (accessed on 26 March 2025).
- Philippine Statistics Authority. Available online: https://psa.gov.ph/ (accessed on 26 March 2025).
- IBM X-Force. Global Threat Intelligence Report. 2022. Available online: https://www.ibm.com/security/xforce (accessed on 26 March 2025).
- McAfee Labs. Threats Report. 2021. Available online: https://www.mcafee.com (accessed on 26 March 2025).
- Symantec. Internet Security Threat Report. 2021. Available online: https://www.symantec.com (accessed on 26 March 2025).
- Kaspersky. Kaspersky Security Bulletin. 2022. Available online: https://www.kaspersky.com (accessed on 26 March 2025).
- Verizon. Data Breach Investigations Report. 2022. Available online: https://www.verizon.com/business/resources/reports/dbir/ (accessed on 26 March 2025).
- ENISA. Threat Landscape. 2021. Available online: https://www.enisa.europa.eu (accessed on 26 March 2025).
- Gartner. Endpoint Security Hype Cycle. 2021. Available online: https://www.gartner.com (accessed on 26 March 2025).
- SP 800-30; Guide for Conducting Risk Assessments. National Institute of Standards and Technology (NIST): Gaithersburg, MD, USA, 2012.
- FAIR Institute. Factor Analysis of Information Risk (FAIR) Framework. 2020. Available online: https://www.fairinstitute.org (accessed on 26 March 2025).
- Ponemon Institute. Cost of a Data Breach Report. 2021. Available online: https://www.ibm.com/security/data-breach (accessed on 26 March 2025).
- Palko, D.; Myrutenko, L.; Babenko, T.; Bigdan, A. Model of Information Security Critical Incident Risk Assessment. In Proceedings of the 2020 IEEE International Conference on Problems of Infocommunications Science and Technology (PIC S&T), Kharkiv, Ukraine, 6–9 October 2020; pp. 157–161. [Google Scholar] [CrossRef]
- IBM X-Force. Cryptojacking Rises 450 Percent as Cybercriminals Pivot from Ransomware to Stealthier Attacks. IBM Security, 26 February 2019. Available online: https://www.ibm.com/think/x-force/cryptojacking-rises-450-percent-as-cybercriminals-pivot-from-ransomware-to-stealthier-attacks (accessed on 26 March 2025).
- Adjibi, B.V.; Mbodji, F.N.; Bissyandé, T.F.; Allix, K.; Klein, J. The Devil is in the Details: Unwrapping the Cryptojacking Malware Ecosystem on Android. In Proceedings of the 2022 IEEE 22nd International Working Conference on Source Code Analysis and Manipulation (SCAM 2022), Limassol, Cyprus, 3–4 October 2022; pp. 153–163. [Google Scholar] [CrossRef]
- Bijmans, H.L.J.; Booij, T.M.; Doerr, C. Inadvertently Making Cyber Criminals Rich: A Comprehensive Study of Cryptojacking Campaigns at Internet Scale. In Proceedings of the 28th USENIX Security Symposium (USENIX Security 2019), Santa Clara, CA, USA, 14–16 August 2019; pp. 1627–1644. Available online: https://www.usenix.org/conference/usenixsecurity19/presentation/bijmans (accessed on 26 March 2025).
- Tekiner, E.; Acar, A.; Uluagac, A.S.; Kirda, E.; Selcuk, A.A. SoK: Cryptojacking Malware. In Proceedings of the 2021 IEEE European Symposium on Security and Privacy (EuroS&P), Vienna, Austria, 6–10 September 2021; pp. 120–139. [Google Scholar] [CrossRef]
- Carlin, D.; Burgess, J.; O’Kane, P.; Sezer, S. You Could Be Mine(d): The Rise of Cryptojacking. IEEE Secur. Priv. 2020, 18, 16–22. [Google Scholar] [CrossRef]
- Sudhakar; Kumar, S. An emerging threat Fileless malware: A survey and research challenges. Cybersecur 2020, 3, 1. [Google Scholar] [CrossRef]
- Rani, U.; Kumar, S.; Dahiya, N.; Solanki, K.; Kuttan, S.R.; Shah, S.; Shaheen, M.; Ahmad, F. An optimized neural network with AdaHessian for cryptojacking attack prediction for Securing Crypto Exchange Operations of MEC applications. J. Cloud Comp. 2024, 13, 63. [Google Scholar] [CrossRef]
- Varlioglu, S.; Elsayed, N.; ElSayed, Z.; Ozer, M. The Pulse of Fileless Cryptojacking Attacks: Malicious PowerShell Scripts. In SoutheastCon 2022; IEEE: Piscataway, NJ, USA, 2022. [Google Scholar] [CrossRef]
- Caprolu, M.; Raponi, S.; Oligeri, G.; Di Pietro, R. Cryptomining makes noise: Detecting cryptojacking via Machine Learning. Comput. Commun. 2021, 171, 126–139. [Google Scholar] [CrossRef]
- Laimon, M.; Almadadha, R.; Goh, S. Energy Consumption of Crypto Mining: Consequences and Sustainable Solutions Using Systems Thinking and System Dynamics Analysis. Sustainability 2025, 17, 3522. [Google Scholar] [CrossRef]
- Senova, A.; Tobisova, A.; Rozenberg, R. New Approaches to Project Risk Assessment Utilizing the Monte Carlo Method. Sustainability 2023, 15, 1006. [Google Scholar] [CrossRef]
- Le, A.; Chen, Y.; Chai, K.K.; Vasenev, A.; Montoya, L. Assessing Loss Event Frequencies of Smart Grid Cyber Threats: Encoding Flexibility into FAIR Using Bayesian Network Approach. In Smart Grid Inspired Future Technologies; Hu, J., Leung, V., Yang, K., Zhang, Y., Gao, J., Yang, S., Eds.; Lecture Notes of the Institute for Computer Sciences, Social Informatics and Telecommunications Engineering; Springer: Cham, Switzerland, 2017; Volume 175. [Google Scholar] [CrossRef]
- Kure, H.I.; Islam, S.; Ghazanfar, M.; Raza, A.; Pasha, M. Asset criticality and risk prediction for an effective cybersecurity risk management of cyber-physical system. Neural Comput. Appl. 2022, 34, 493–514. [Google Scholar] [CrossRef]
- Pendleton, R.; Garcia-Lebron, R.; Xu, S. A Survey on Security Metrics. CoRR 2016, arXiv:1601.05792v1. [Google Scholar]
- Poh, G.S.; Divakaran, D.M.; Lim, H.W.; Ning, J.; Desai, A. A Survey of Privacy-Preserving Techniques for Encrypted Traffic Inspection over Network Middleboxes. CoRR 2021, arXiv:2101.04338. [Google Scholar] [CrossRef]
- Ferdous, J.; Islam, R.; Mahboubi, A.; Islam, M.Z. A Survey on ML Techniques for Multi-Platform Malware Detection: Securing PC, Mobile Devices, IoT, and Cloud Environments. Sensors 2025, 25, 1153. [Google Scholar] [CrossRef] [PubMed]
- Rose, S.; Borchert, O.; Mitchell, S.; Connelly, S. Zero Trust Architecture; NIST Special Publication 800-207; National Institute of Standards and Technology: Gaithersburg, MD, USA, 2020. [Google Scholar] [CrossRef]
- Böhme, R.; Nowey, T. Economic Security Metrics. In Dependability Metrics; Eusgeld, I., Freiling, F.C., Reussner, R., Eds.; Lecture Notes in Computer Science; Springer: Berlin/Heidelberg, Germany, 2008; Volume 4909. [Google Scholar] [CrossRef]
- EIOPA. Methodological Principles of Insurance Stress Testing—Cyber Component. European Insurance and Occupational Pensions Authority, July 2023. Available online: https://www.eiopa.europa.eu/publications/methodological-principles-insurance-stress-testing-cyber-component_en (accessed on 26 March 2025).
- Wang, J.; Neil, M.; Fenton, N. A Bayesian network approach for cybersecurity risk assessment implementing and extending the FAIR model. Comput. Secur. 2020, 89, 101659. [Google Scholar] [CrossRef]
- Wang, J.; Neil, M. A Bayesian-network-based cybersecurity adversarial risk analysis framework with numerical examples. arXiv 2021, arXiv:2106.00471. [Google Scholar] [CrossRef]
- Le, T.D.; Ge, M.; Anwar, A.; Loke, S.W.; Beuran, R.; Doss, R.; Tan, Y. GridAttackAnalyzer: A Cyber Attack Analysis Framework for Smart Grids. Sensors 2022, 22, 4795. [Google Scholar] [CrossRef]
- Budde, C.E.; Stoelinga, M. Efficient Algorithms for Quantitative Attack Tree Analysis. In Proceedings of the 2021 IEEE 34th Computer Security Foundations Symposium (CSF), Dubrovnik, Croatia, 21–25 June 2021; pp. 1–15. [Google Scholar] [CrossRef]
- Kumar, R.; Schivo, S.; Ruijters, E.; Yildiz, B.M.; Huistra, D.; Brandt, J.; Rensink, A.; Stoelinga, M. Effective Analysis of Attack Trees: A Model-Driven Approach. In Fundamental Approaches to Software Engineering; Russo, A., Schürr, A., Eds.; FASE 2018. Lecture Notes in Computer Science; Springer: Cham, Switzerland, 2018; Volume 10802. [Google Scholar] [CrossRef]
- «Ecosystem 2.0: Climbing to the Next Level». McKinsey Report 2020. Available online: https://www.mckinsey.com/capabilities/mckinsey-digital/our-insights/ecosystem-2-point-0-climbing-to-the-next-level (accessed on 26 March 2025).
- SP 800-90; Cyber Risk Quantification Guidelines. National Institute of Standards and Technology (NIST): Gaithersburg, MD, USA, 2023.
- Kwedza, P.; Chindipha, S.D. Cryptojacking Detection in Cloud Infrastructure Using Network Traffic. In Proceedings of the 2023 International Conference on Electrical, Computer and Energy Technologies (ICECET), Cape Town, South Africa, 16–17 November 2023; pp. 1–6. [Google Scholar] [CrossRef]
- Ferreira, A.; Mukherjee, A.; Sequeira, F. Artificial Intelligence Techniques for Proactive Cyber Defense: A Review. Future Gener. Comput. Syst. 2022, 132, 173–187. [Google Scholar] [CrossRef]
- Eggers, S.; Le Blanc, K. Survey of cyber risk analysis techniques for use in the nuclear industry. Prog. Nucl. Energy 2021, 140, 103908. [Google Scholar] [CrossRef]
- MITRE ATT&CK. Tactics, Techniques, and Procedures of Cryptojacking Threat Actors. 2023. Available online: https://attack.mitre.org (accessed on 26 March 2025).
- Krisper, M.; Dobaj, J.; Macher, G.; Schmittner, C. RISKEE: A Risk-Tree Based Method for Assessing Risk in Cyber Security. In Systems, Software and Services Process Improvement; Walker, A., O’Connor, R., Messnarz, R., Eds.; EuroSPI 2019. Communications in Computer and Information Science: Springer, Cham, Switzerland, 2019; Volume 1060. [Google Scholar] [CrossRef]
- Gartner, B. Blockchain Will Deliver $3.1 Trillion Dollars in Value by 2030//ConsenSys.2019. Available online: https://medium.com/consensys-media/gartner-blockchain-will-deliver-3-1-trillion-dollars-in-value-by-2030-d32b79c4c560 (accessed on 26 March 2025).
- Walpole, R.E.; Myers, R.H.; Myers, S.L.; Ye, K. Probability and Statistics for Engineers and Scientists, 9th ed.; Pearson Education: London, UK, 2011; 812p, ISBN 978-0-321-83144-6. Available online: https://spada.uns.ac.id/pluginfile.php/221008/mod_resource/content/1/ProbabilityStatistics_for_EngineersScientists%289th_Edition%29_Walpole.pdf (accessed on 26 March 2025).
- Kerzner, H. Project Management: A Systems Approach to Planning, Scheduling, and Controlling, 10th ed.; John Wiley & Sons: Hoboken, NJ, USA, 2009; 1122p, ISBN 978-0-470-50383-6. Available online: https://ftp.idu.ac.id/wp-content/uploads/ebook/ip/BUKU%20MANAJEMEN%20PROYEK/project-management-harold-kerzner1.pdf (accessed on 26 March 2025).
- Ransomware, Cryptojacking and Beyond: Emerging Security Trends. Available online: https://www.bankinfosecurity.com/surveys/ransomware-cryptojacking-beyond-emerging-security-trends-s-95 (accessed on 26 March 2025).
- Mining for Virtual Gold: Understanding the Threat of Cryptojacking. Available online: https://www.marsh.com/content/dam/marsh/Documents/PDF/en_nz/understanding-the-threat-of-cryptojacking.pdf (accessed on 26 March 2025).
- Babenko, T.; Kolesnikova, K.; Lisnevskyi, R.; Makilenov, S.; Landovsky, Y. Definition of Cryptojacking Indicators. In Proceedings of the 8th International Conference on Digital Technologies in Education, Science and Industry, DTESI 2023, Almaty, Kazakhstan, 6–7 December 2023; CEUR Workshop Proceedings, Volume 3680: Aachen, Germany, 2024. Available online: https://ceur-ws.org/Vol-3680/S4Paper6.pdf (accessed on 26 March 2025).
- Poleto, T.; Silva, M.M.; Clemente, T.R.N.; de Gusmão, A.P.H.; Araújo, A.P.d.B.; Costa, A.P.C.S. A Risk Assessment Framework Proposal Based on Bow-Tie Analysis for Medical Image Diagnosis Sharing within Telemedicine. Sensors 2021, 21, 2426. [Google Scholar] [CrossRef] [PubMed]
- Nykyforova, L.; Kiktev, N.; Lendiel, T.; Pavlov, S.; Mazurchuk, P. Computer-integrated control system for electrophysical methods of increasing plant productivity. Mach. Energetics 2023, 14, 34–45. [Google Scholar] [CrossRef]
- Lysenko, V.; Lendiel, T.; Bolbot, I.; Pavlov, S. Mobile system for monitoring plant environment parameters for biogas production. Mach. Energetics 2023, 14, 111–120. [Google Scholar] [CrossRef]
- Khort, D.; Kutyrev, A.; Kiktev, N.; Hutsol, T.; Glowacki, S.; Kuboń, M.; Nurek, T.; Rud, A.; Gródek-Szostak, Z. Automated mobile hot mist generator: A quest for effectiveness in fruit horticulture. Sensors 2022, 22, 3164. [Google Scholar] [CrossRef]
- Khort, D.O.; Kutyrev, A.; Smirnov, I.; Andriyanov, N.; Filippov, R.; Chilikin, A.; Astashev, M.E.; Molkova, E.A.; Sarimov, R.M.; Matveeva, T.A.; et al. Enhancing Sustainable Automated Fruit Sorting: Hyperspectral Analysis and Machine Learning Algorithms. Sustainability 2024, 16, 10084. [Google Scholar] [CrossRef]
- Kalivoshko, O.; Myrvoda, A.; Kraevsky, V.; Paranytsia, N.; Skoryk, O.; Kiktev, N. Accounting and Analytical Aspect of Reflection of Foreign Economic Security of Ukraine. In Proceedings of the 2022 IEEE 9th International Conference on Problems of Infocommunications, Science and Technology (PIC S&T), Kharkiv, Ukraine, 10–12 October 2022; pp. 405–410. [Google Scholar] [CrossRef]
- Palko, D.; Babenko, T.; Bigdan, A.; Kiktev, N.; Hutsol, T.; Kuboń, M.; Hnatiienko, H.; Tabor, S.; Gorbovy, O.; Borusiewicz, A. Cyber Security Risk Modeling in Distributed Information Systems. Appl. Sci. 2023, 13, 2393. [Google Scholar] [CrossRef]
- Hnatiienko, H.; Kiktev, N.; Babenko, T.; Desiatko, A.; Myrutenko, L. Prioritizing Cybersecurity Measures with Decision Support Methods Using Incomplete Data. CEUR Workshop Proc. 2021, 3241, 169–180. [Google Scholar]
- Palko, D.; Hnatienko, H.; Babenko, T.; Bigdan, A. Determining key risks for modern distributed information systems. CEUR Workshop Proc. 2021, 3018, 81–100. [Google Scholar]
- Hubskyi, O.; Babenko, T.; Myrutenko, L.; Oksiiuk, O. Detection of SQL Injection Attack Using Neural Networks. In Mathematical Modeling and Simulation of Systems (MODS’2020). MODS 2020; Shkarlet, S., Morozov, A., Palagin, A., Eds.; Advances in Intelligent Systems and Computing; Springer: Cham, Switzerland, 2021; Volume 1265. [Google Scholar] [CrossRef]
- Kiktev, N.; Osypenko, V.; Shkurpela, N.; Balaniuk, A. Input Data Clustering for the Efficient Operation of Renewable Energy Sources in a Distributed Information System. In Proceedings of the 2020 IEEE 15th International Conference on Computer Sciences and Information Technologies (CSIT), Zbarazh, Ukraine, 23–26 September 2020; pp. 9–12. [Google Scholar] [CrossRef]
- Kiktev, N.; Rozorinov, H.; Masoud, M. Information model of traction ability analysis of underground conveyors drives. In Proceedings of the 2017 XIIIth International Conference on Perspective Technologies and Methods in MEMS Design (MEMSTECH), Lviv, Ukraine, 20–23 April 2017; pp. 143–145. [Google Scholar] [CrossRef]
- Hetmańczuk, T. Cryptojacking: Definition, Implementation, Effects and Protection Against That Form of Cyberattack. Is Malicious Cryptomining a Manifestation of the Crisis Behaviour of Individual Miners During Cryptocurrency Rush? In Reactions of Market Entities to Crisis Situations 2023; Styś, A., Ed.; Publishing House of Wroclaw University of Economics and Business: Wroclaw, Poland, 2023; pp. 73–96. [Google Scholar]
- Eskandari, S.; Leoutsarakos, A.; Mursch, T.; Clark, J. A First Look at Browser-Based Cryptojacking. In Proceedings of the 2018 IEEE European Symposium on Security and Privacy Workshops (EuroS&PW), London, UK, 24–26 April 2018; pp. 58–66. [Google Scholar] [CrossRef]


| Unresolved Problem | Description | Potential Solutions |
|---|---|---|
| Dynamic Resource Throttling | Cryptominers adjust CPU/GPU consumption in real time, staying below typical detection baselines. | Implement adaptive ML models that compare current to historical usage; deploy high-frequency performance counters to detect subtle resource spikes [21]. |
| Cross-Platform Heterogeneity | Attacks span Windows, macOS, Linux, mobile, and IoT environments, each demanding specialized risk assessment. | Create modular frameworks for OS-specific telemetry; consolidate unified risk scoring across various platforms [28]. |
| Inconsistent Data Collection | Many organizations lack standardized logs or real-time endpoint telemetry, undermining probabilistic modeling of cryptomining losses. | Adopt uniform logging protocols; incentivize anonymized data sharing (e.g., via industry consortia) to improve model accuracy [22]. |
| Privacy and Compliance Barriers | Deep packet inspection or SSL interception can violate data protection laws, limiting detection of encrypted cryptojacking traffic. | Pursue selective decryption under strict governance; refine legal frameworks to permit cryptojacking detection within privacy constraints [28]. |
| Limited Incident Disclosure | Organizations often do not report cryptojacking attacks, restricting the availability of large-scale empirical datasets. | Encourage transparency through regulatory or insurance incentives; develop safe-harbor policies shielding proactive disclosures from punitive repercussions [23]. |
| Parameter | Example Value/Range | Description |
|---|---|---|
| Historical Attack Frequency | 8–12 incidents/year | Number of cryptojacking attempts or detections logged over the past 12 months, providing insight into overall exposure and serving as a baseline for forecasting |
| Threat Intelligence Factor | Elevated during crypto bull runs | Adjustment to likelihood estimates based on market data, as attackers show more interest in cryptojacking when cryptocurrency prices surge |
| Unpatched Vulnerabilities | Four critical CVEs/server | Known software or OS flaws that cryptojackers can exploit, often correlated with higher compromise success rates |
| Defensive Evasion Rate | 20–35% | Approximate percentage of attacks bypassing existing security controls, used to refine the probability component of risk equations |
| Avg. CPU Usage (Malicious) | 25–80% additional load | Typical rise in CPU utilization caused by cryptojacking scripts, forming the basis for electricity cost calculations |
| Electricity Rate | $0.12 per kWh | Average local cost of power, essential for evaluating the extra expenses imposed by unauthorized cryptomining |
| Hardware Depreciation Factor | 1.15–1.25 multiplier | Quantification of accelerated component wear due to sustained 24/7 cryptomining, often resulting in earlier-than-planned hardware replacements |
| Productivity Impact | 10–30% performance slowdown | Estimated reduction in user or system productivity, translating into calculable wage or revenue losses |
| ARO Sensitivity | ±10% based on crypto price | Variation in annual rate of occurrence driven by fluctuations in cryptocurrency market values, introduced into Monte Carlo simulations or Bayesian updates |
| Incident Response Costs | $5000–$20,000/incident | Staff labor, external consulting, or forensic tools required to investigate and remediate cryptojacking incidents |
Disclaimer/Publisher’s Note: The statements, opinions and data contained in all publications are solely those of the individual author(s) and contributor(s) and not of MDPI and/or the editor(s). MDPI and/or the editor(s) disclaim responsibility for any injury to people or property resulting from any ideas, methods, instructions or products referred to in the content. |
© 2025 by the authors. Licensee MDPI, Basel, Switzerland. This article is an open access article distributed under the terms and conditions of the Creative Commons Attribution (CC BY) license (https://creativecommons.org/licenses/by/4.0/).
Share and Cite
Babenko, T.; Kolesnikova, K.; Panchenko, M.; Abramkina, O.; Kiktev, N.; Meish, Y.; Mazurchuk, P. Risk Assessment of Cryptojacking Attacks on Endpoint Systems: Threats to Sustainable Digital Agriculture. Sustainability 2025, 17, 5426. https://doi.org/10.3390/su17125426
Babenko T, Kolesnikova K, Panchenko M, Abramkina O, Kiktev N, Meish Y, Mazurchuk P. Risk Assessment of Cryptojacking Attacks on Endpoint Systems: Threats to Sustainable Digital Agriculture. Sustainability. 2025; 17(12):5426. https://doi.org/10.3390/su17125426
Chicago/Turabian StyleBabenko, Tetiana, Kateryna Kolesnikova, Maksym Panchenko, Olga Abramkina, Nikolay Kiktev, Yuliia Meish, and Pavel Mazurchuk. 2025. "Risk Assessment of Cryptojacking Attacks on Endpoint Systems: Threats to Sustainable Digital Agriculture" Sustainability 17, no. 12: 5426. https://doi.org/10.3390/su17125426
APA StyleBabenko, T., Kolesnikova, K., Panchenko, M., Abramkina, O., Kiktev, N., Meish, Y., & Mazurchuk, P. (2025). Risk Assessment of Cryptojacking Attacks on Endpoint Systems: Threats to Sustainable Digital Agriculture. Sustainability, 17(12), 5426. https://doi.org/10.3390/su17125426