1. Introduction
Mobility is a key component of quality of life in urban environments, in the context of which intersections are particularly important elements of the street network that are often associated with significant congestion and delays. Therefore, the optimal design of intersections, both in terms of their geometry and signal control, has a substantial impact on ensuring smooth and efficient traffic flow. Beyond their operational role, intersections significantly influence the environmental and energy performance of the transportation system. Thus, the optimal design of intersections (considering both geometry and signal control) not only improves traffic flow efficiency but also contributes to sustainable urban mobility by minimizing vehicle delays, reducing fuel consumption and emissions, and supporting the more effective use of the existing infrastructure.
Traffic analysis and the evaluation of signalized intersection performance are based on the determination of the capacity and level of service (LOS) of individual approaches, as well as the intersection as a whole. Capacity is defined as the maximum number of vehicles that can pass through a lane or road section during a given time period under prevailing traffic and roadway conditions. LOS is a qualitative measure of traffic flow, describing operational conditions in terms of factors such as freedom of movement, travel speed and time, traffic interruptions, and driver comfort [
1].
As a result, whether designing a new intersection or reconstructing an existing one, it is essential to conduct a capacity analysis to assess its operational efficiency. Intersection performance is typically described through a set of performance measures that reflect the level of service provided to users. For motorized vehicles, key performance indicators include the volume-to-capacity (v/c) ratio, which reflects the degree of saturation, and control delay per vehicle, which is used to determine the LOS. As control delay is directly influenced by capacity, accurate capacity estimation is critical for reliable LOS assessment.
Analytical models for estimating capacity and LOS at signalized intersections are typically based on queuing theory and calibrated using field data. Among them, the most widely adopted is the Highway Capacity Manual (HCM) [
2]. According to Croatian regulations [
3], the use of the HCM methodology is also recommended for national practice. In the HCM framework, the capacity of a lane group is defined as the product of the adjusted saturation flow rate and the green-to-cycle-length ratio (g/C). The adjusted saturation flow is calculated by multiplying the base saturation flow rate by a set of adjustment factors that account for prevailing roadway, traffic, and control conditions. The base saturation flow refers to ideal conditions (e.g., no grade, no heavy vehicles, no turning movements, no pedestrians, etc.)
One of the known limitations of the HCM methodology for motorized vehicles is that it does not consider the effect of left-turn bay overflow on intersection operations [
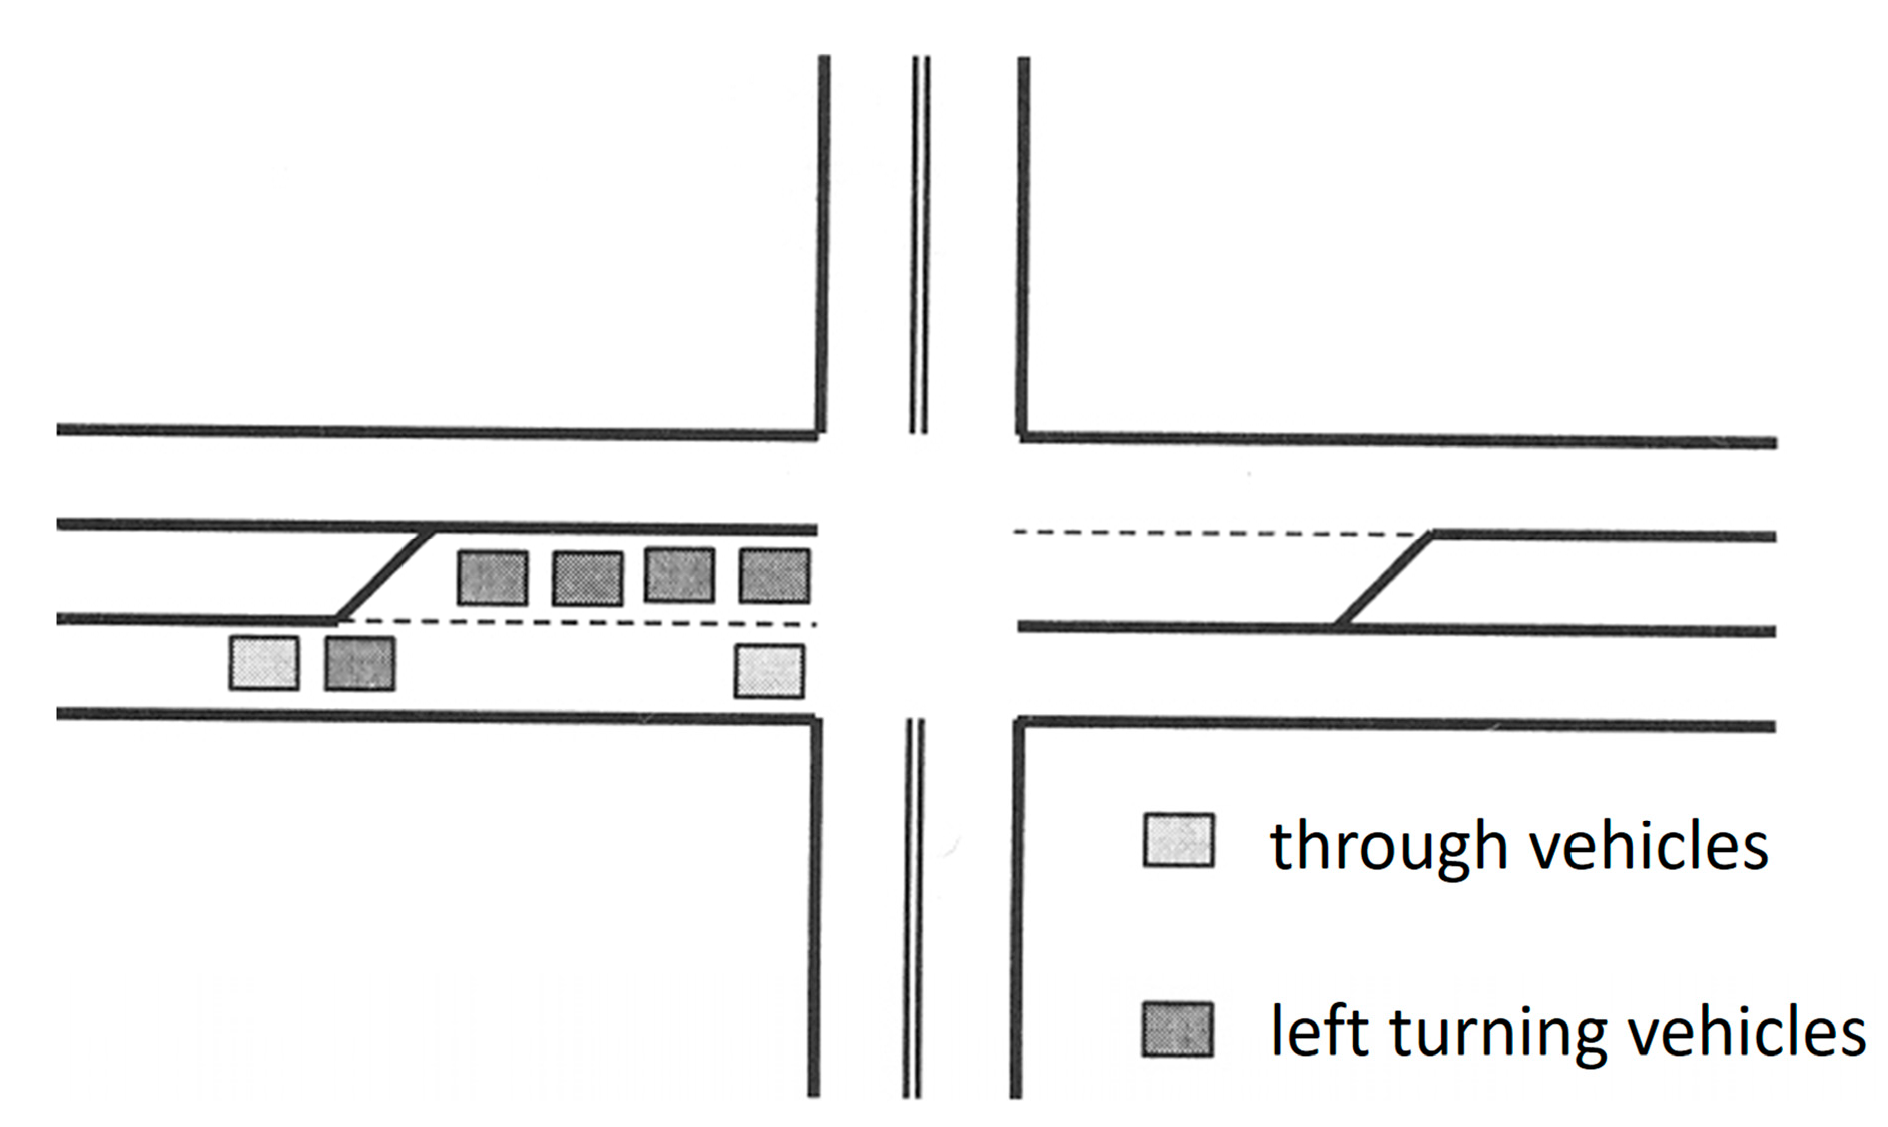
2]. An insufficient left-turn bay length can result in spillover, leading to blockage of the adjacent through lane. However, the HCM treats left-turn bays as if they are infinitely long, meaning that its analysis procedure does not explicitly account for the capacity loss and increased delay caused by overflow conditions. In practice, short left-turn bays can substantially reduce through lane capacity, resulting in greater delays and lower LOS.
Therefore, the main objective of this study was to use the validated and calibrated CORSIM microsimulation model to investigate the impact of left-turn bay length on the capacity of through movements at signalized intersections under various prevailing conditions, and to develop a new adjustment factor based on the results obtained.
As a first step, field data were collected to validate the CORSIM model, confirming its suitability for simulating real-world traffic conditions. Following validation, the model was calibrated to ensure consistency with the HCM methodology, thereby enabling the development of an adjustment factor for saturation flow rate calculation. Numerous simulation scenarios were created, varying left-turn bay lengths, traffic volumes, and signal timings across four intersection geometries typical for pretimed signal control. Simulations were conducted for each scenario, resulting in a comprehensive database that enabled comparisons between scenarios with infinite and finite left-turn bay lengths under identical conditions. This comparison served as the basis for determining the new adjustment factor.
Using regression analysis, the most influential variables contributing to flow blockage and capacity reduction were identified. These include the percentage of left-turning vehicles, left-turn bay length, opposing traffic volume, and green-to-cycle-length ratio. For each intersection geometry, a separate adjustment factor model was developed based on these parameters. The accuracy of the proposed adjustment factors was validated using a new set of simulation scenarios not included in the regression model development. The Mean Absolute Percentage Error (MAPE) was used as the primary performance metric. The validation results confirmed that the proposed models provide satisfactory predictive accuracy in terms of reducing through capacity due to lane blockage.
The remainder of this paper is organized as follows:
Section 2 presents a literature review on the impact of turn bay length on intersection capacity.
Section 3 describes the research methodology, including CORSIM validation and the generation of simulation scenarios, while
Section 4 presents the results and a discussion. In
Section 5, the main conclusions and future study recommendations are presented.
2. Literature Review
A considerable number of studies have focused on the performance analysis of signalized intersections, but few have addressed the impact of inadequate left-turn bay length on approach capacity and delay estimation. Left-turn spillover occurs when a queue exceeds the available storage length of the dedicated bay, forcing through-moving vehicles to stop or change lanes [
4]. This creates bottlenecks, reduces the effective capacity of through lanes, and increases delays for all movements [
5].
Lin and Kou [
6] examined the effect of auxiliary lane length on average delay at seven signalized intersections in Sarasota, Florida. After identifying that the existing analytical delay estimation models treat left-turn bays as having an infinite length, they used the microscopic simulation model SimTraffic to estimate delays for both infinite and actual left-turn bay lengths. Among their conclusions, Lin and Kou emphasized the importance of recognizing the issue of inadequate bay length to improve safety and traffic flow efficiency.
Tian and Wu [
7] proposed a probabilistic model for estimating the capacity of an approach at a signalized intersection with a short right-turn bay, accounting for the stochastic nature of traffic flow and the potential for blockage due to insufficient bay length. Their capacity analysis focused on comparing the approach capacity with a dedicated right-turn bay to that of a shared through-right lane. Validation of their proposed model was conducted using CORSIM based on a real-world intersection.
In a related study, Wu [
8] developed a theoretical–empirical model for estimating the capacity of approaches with auxiliary lanes. The proposed model incorporates the effect of bay length by considering the stochastic likelihood of flow blockage. Wu concluded that the capacity of an approach with a short auxiliary lane is influenced by the bay length, the proportion of left-turning vehicles, and the duration of green time allocated to specific movements. He also noted that cycle length is not an explicit parameter affecting total capacity. In a follow-up study, Wu [
9] introduced a mathematical model for quantifying the impact of permitted left-turning vehicles on the capacity of signalized intersections with shared lanes. This model estimates the probability of blockage in a shared lane caused by permitted left turns, providing a tool for analyzing intersection performance under mixed movement conditions.
Farivar et al. [
10] created a model to predict blockage likelihood and approach capacity for channelized right-turn lanes at signalized intersections in order to analyze the influence of limited storage lengths on right-turning traffic. The models were evaluated using the VISSIM microsimulation software, and suggestions for the storage length of channelized right-turn lanes were made.
Kikuchi et al. [
11,
12] developed an analytical framework and probability-based model for determining the lengths of left-turn lanes at a signalized intersection. The authors analyzed vehicle arrival rates, signal timing plans, phase sequence, and intersection capacity to determine optimal length.
Zhang and Tong [
13] modeled the capacity of the left turn and through movements as a function of the left-turn bay length by using a probabilistic approach, taking into account potential blockage due to a short left-turn bay length. Several studies have also suggested a probabilistic capacity estimation model for a through lane with a storage bay, taking into account signal timing factors including cycle length, green duration, and phase sequence [
14,
15,
16].
The literature clearly indicates that left-turn bay overflow is a significant factor influencing the capacity and performance of signalized intersections. In this study, the objective was to develop an adjustment factor to enhance the accuracy of the HCM analytical model using the simulation model scenarios.
A methodological approach in which simulation results are used to develop or extend existing analytical models has also been applied in many other studies and research efforts [
17,
18,
19,
20,
21]. Simulation enables the artificial creation of traffic conditions that may occur in real-world scenarios but are difficult to capture through field observations.
3. Materials and Methods
The primary objective of this research was to estimate the reduction in through movement capacity caused by left-turn bay overflow. The main focus was on developing a functional relationship between the capacity of a short left-turn lane and that of an infinitely long left-turn lane, as well as identifying the key influencing parameters that can cause a blockage of traffic flow in the adjacent through lane. These parameters include the approach volume, left-turn volume, intersection geometry, turn bay length, signal cycle length, green-to-cycle-length ratio, and opposing traffic volume.
In general, to establish an analytical or empirical relationship, it is necessary to build a comprehensive database with varying values of influencing parameters in order to determine whether and to what extent they affect capacity. However, identifying real-world intersections with a broad range of prevailing conditions and collecting the required field data are both challenging and costly. Therefore, the CORSIM simulation model (TSIS-CORSIM 6.3) was used for this research. Simulation enables the creation of various scenarios covering a wide range of parameter values and facilitates the generation of an extensive database. This database was then used to define an adjustment factor for calculating the saturation flow rate, accounting for the effect of left-turn bay length on the intersection approach capacity.
As a first step, CORSIM was tested and validated against actual measured data. After it was validated that CORSIM could be used to simulate actual traffic flow, calibration was performed for consistency with the HCM methodology, and numerous scenarios were generated. The results from the simulations served as the basis for the application of regression analysis to model the new adjustment factor for capacity estimation. The sequence of the main activities carried out in this research is presented in the workflow diagram shown in
Figure 1.
3.1. Problem Statement
The Highway Capacity Manual (HCM) [
2] is the primary reference for traffic operational analysis, methodologies, and level of service (LOS) concepts in the United States, as well as in many other countries. One of the notable limitations of the HCM methodology for analyzing signalized intersections is the turn bay overflow as a potential influencing factor on the capacity of the analyzed approach. The inability to store the full volume of turning vehicles within the designated auxiliary lane can lead to adjacent lane blockage, which reduces the effective capacity of adjacent through movements and increases delay (
Figure 2).
The capacity of an intersection lane or lane group may be computed as [
1]
where
ci = capacity of lane or lane group i (veh/h);
si = saturation flow rate for lane or lane group i (veh/hg);
gi = effective green time for lane or lane group i (s);
C = signal cycle length (s).
Since the signal design defines the cycle length and effective green duration, the saturation flow rates must be determined in order to calculate the capacity. The current signalized intersection methodology of the HCM uses different adjustment factors to compute the saturation flow rates and capacities of approaches at signalized intersections [
17]. According to HCM 2016 [
2], there are 13 adjustment factors for saturation flow rate that represent the prevailing traffic conditions. Each of these factors adjusts the base saturation flow rate to the prevailing saturation flow rate, taking into account real-world conditions that deviate from the ideal. The general equation is as follows:
where
s = adjusted saturation flow rate (prevailing conditions);
s0 = base saturation flow rate (ideal conditions);
N = number of lanes;
fi = adjustment factors that reflect prevailing conditions.
The symbol fi represents the adjustment factors for lane width; heavy vehicles and grade; existence of a parking lane and parking activity adjacent to lane group; blocking effect of local buses that stop within an intersection area; area type; lane utilization; left-turn vehicle presence in a lane group; right-turn vehicle presence in a lane group; pedestrian for left-turn groups; pedestrian-bicycle adjustment factor for right-turn groups; work zone presence at the intersection; downstream lane blockage; and sustained spillback.
The HCM methodology does not provide a specific equation for the adjustment factor that reflects blockage due to turn bay overflow. It recommends the use of field observations or simulation models to estimate the impact of blockage on intersection capacity. Therefore, this study presents the modeling of new adjustment factors for left-turn bay overflow based on the results of different scenarios simulated by the CORSIM microsimulation model.
3.2. Validation of CORSIM
It should be emphasized that CORSIM and other simulation models do not give the capacity value explicitly as output data, but it can be estimated indirectly. To determine the approach capacity in the simulation model, it is necessary to define a sufficiently large traffic volume on the observed approach to attain a continuous and saturated traffic flow. The number of vehicles that discharged the intersection in one hour represents the approach capacity for the defined prevailing conditions. Before using CORSIM as a data generator for simulating different prevailing conditions, such as various traffic demand, signal timing, and intersection geometries, it was necessary to validate the model by comparing the simulated results with actual measurements [
22,
23]. This ensures the credibility of the estimates and increases the reliability of the conclusions drawn from the simulation.
Zhang et al. [
24] performed sensitivity analysis over the twenty CORSIM parameters, and the results of their analysis showed that the values of saturation headway and free flow speed have the greatest impact on capacity and delay estimations. Therefore, these parameters were measured at selected signalized intersections and used for the calibration and validation of CORSIM.
The saturation flow rate depends on the saturation headway h (s = 3600/h), which means that field measuring of saturation headway can result in the saturation flow rate under prevailing conditions, and thus the actual capacity [
1]. Field measurement of saturation headway requires a minimum of fifteen observed cycles with eight or more vehicles at the beginning of the green light, and the best time to collect data is during the morning or afternoon peak hour [
25]. Five signalized intersections with different geometries were selected for testing and evaluating CORSIM. The video recordings were used to collect empirical data including traffic volumes, percentage of heavy vehicles, saturation headways, free flow speed, and number of pedestrians. Data on traffic light operations were also collected. The saturation headway was extracted manually from the video recordings [
26].
Due to the start-up lost time, resulting from drivers’ reaction time and the acceleration of the queue, the first four vehicles were excluded from the determination of saturation headway. Therefore, it was necessary to record the time at which the rear axle of the fourth vehicle crossed the stop line, as well as the time at which the rear axle of the last vehicle in the stabilized queue crossed the stop line. The saturation headway (h) was then obtained by dividing this saturated time period by the number of vehicles included in that period:
where h is the saturation headway; T
4 is the time of the fourth vehicle crossing the stop line; T
n is the time of the n-th vehicle (the last one in the queue) crossing the stop line; and n is the number of queued vehicles.
Based on the measured saturation headways, the actual value of the saturation flow s (s = 3600/h) was obtained. Knowing the green-to-cycle-length ratio (g/C), according to the signal timing plan, the values of actual capacity for each observed approach were calculated according to Equation (1). These data served as a benchmark for evaluating the accuracy of the simulations modeled in CORSIM. Every simulation was run 10 times to account for stochastic variability and obtain representative average values. Field measured capacities and the simulation values as well as the percentage of model error are shown in
Table 1.
To evaluate the accuracy of the model in estimating capacity, the Mean Absolute Percentage Error (MAPE) was employed as a primary performance metric. MAPE measures the average magnitude of the error between the measured and simulated values, expressed as a percentage of the measured values. MAPE is commonly used in model validation studies as a qualitative assessment of the comparison between modeled and actual values [
14,
26]. It is defined as follows:
where
n = number of observations;
cs = capacity from the simulation;
cf = capacity measured in the field.
The calculated MAPE between measured and simulated capacities was 1.69%, which suggests that the simulation model provides highly accurate estimates of the approach capacity. The validation was primarily focused on evaluating the capacity of through lanes, which may be obstructed by the spillover from a left-turn bay of insufficient length when left-turning vehicles block the movement of through traffic. CORSIM simulates driver gap acceptance and interactions with opposing traffic flow. This approach allowed the impact of yielding behavior to be inherently reflected in the capacity estimates. Validation of the simulation model against field data confirmed that CORSIM realistically represents permissive left-turn operations and is suitable for the scenario-based analysis of the impact of left-turn bay length on the through capacity of the signalized intersection approach. This ensures that the adjustment factor accounts for both bay overflow and vehicle interaction effects.
3.3. Method for Calibrating the Adjustment Factor
The calibration of an individual adjustment factor involves determining the saturation flow rate under conditions where all the conditions are ideal except the one for which the calibration is performed [
1,
27]. To capture the effect of turn bay overflow, left-turn bay length was treated as the parameter of interest, while all the other conditions were maintained at ideal HCM levels (all the other adjustment factors are equal to 1). When considering a single traffic lane, the saturation flow rate for the lane is defined as
where s presents the adjusted saturation flow rate, s
0 is the base saturation flow rate (1900 veh/h according to HCM), and f
i presents the adjustment factor to be calibrated. According to Equation (5), the adjustment factor can be obtained as follows:
Furthermore, if the saturated flow is expressed according to Equation (1), the following equation is obtained:
In general, the adjustment factor can be calibrated as the ratio of the capacity in the prevailing flow conditions to the capacity in the ideal flow conditions with the same traffic light operation. CORSIM was used to model hypothetic intersections to collect data from various scenarios and create a database to calculate the appropriate adjustment factor. Scenarios with numerous combinations of left-turn bay lengths, traffic volumes, and different signal phase durations were modeled. To isolate the impact of left-turn bay length on through capacity, the following assumptions were adopted and modeled in CORSIM: the width of all the lanes is 12 ft, no heavy vehicles in traffic flow, no grade, no parking maneuvers or bus stops, no right turns, no pedestrian and bicycle flow, and no work zones. By adopting these assumptions, all the HCM adjustment factors take on a value equal to 1, which implies that they do not affect the value of the saturation flow rate.
This study focused on intersections with two-phase signal control, which are used in practice in our local conditions, especially at intersections with simple geometric configurations, and offer a simplified framework for isolating the effect of left-turn bay overflow on throughput capacity. The use of a two-phase scheme enabled the controlled simulation of a large number of geometric and traffic scenarios, enabling the creation of a large database for the development of an adjustment factor. While this represents a foundational step, the methodological framework can be extended in future research to include more complex phasing schemes.
As the research does not include cases with a left-turn protected green phase, the selected intersection geometries have one or two through lanes in the observed approach because with three or more lanes, the use of a protected green phase is recommended.
Figure 3 shows four selected geometries, typical of the two-phase operation of traffic signals, for conducting the analysis.
The notations in
Figure 3 (1 + 2, 2 + 2, 1 + 1, and 2 + 1) represent the number of lanes. The first number refers to through lanes in the observed (eastbound) approach, and the second one refers to the number of through lanes in the opposite flow. Both approaches have one exclusive left-turn lane. The capacity of through eastbound movement was observed for each intersection geometry with various prevailing conditions that were modeled in simulation scenarios, as described in
Section 4. In the case of approaches with two through lanes, the CORSIM model dynamically simulates vehicle lane changes when one lane is blocked by a left-turning vehicle. As a result, the estimated capacity reduction reflects the combined effect on both through lanes rather than only the directly adjacent one.
To ensure consistency between the simulation results and the HCM, the next step involved calibrating the CORSIM model in accordance with the HCM methodology. For this purpose, the capacity of the through lanes was calculated according to the HCM for each of the four intersection geometries illustrated in
Figure 3. Since the lane capacity depends on the green-to-cycle-length ratio (g/C), the calculation was performed for various values of this parameter, i.e., from 0.2 to 0.8. This range was selected because it encompasses the typical values used in signal timing allocations at signalized intersections with pretimed signal control [
28]. The cycle lengths were 60, 80, and 100 s. The values of the opposing flow were selected so as to correspond to a volume-to-capacity ratio (v/c) ranging from 0.25 up to a level that results in a left-turn capacity of approximately 126–127 vehicles per hour (for cycle length C = 60 s). This capacity reflects the discharge of so-called “sneakers”, i.e., vehicles that complete the left-turn maneuver by clearing the conflict zone after the opposing flow has already stopped. The upper limit of the opposing volume for the 80 and 100 s cycles is also determined by the number of discharged sneakers. It is essential to ensure consistency between CORSIM and the HCM in terms of base capacity and flow modeling for through lanes, as these values will be utilized to evaluate reductions due to flow blockage caused by insufficient left-turn bay length.
Although the capacity of left-turn lanes is not the primary focus of this study, it is necessary to align these values in both CORSIM and the HCM as they represent the operational behavior and discharge characteristics of left-turning vehicles, which directly affect the occurrence of blockages in adjacent through lanes. An overview of the parameters that have been calibrated is given in
Table 2.
With calibrated parameters, the CORSIM capacity values matched the HCM values; some examples are shown in
Figure 4.
After the calibration, various scenarios were generated to simulate different conditions of intersection geometry, traffic flow, and signal timing.
4. Results and Discussion
Using the tested and calibrated CORSIM simulation model, the impact of left-turn bay length on the capacity of adjacent through lanes was analyzed under various prevailing traffic flow conditions. One of the key advantages of using a simulation model is the ability to compare the capacities obtained from a scenario with an infinitely long left-turn bay to those from a scenario with a finite-length bay, while keeping all the other prevailing conditions (traffic demand, signal timing, geometric characteristics, etc.) identical in both cases.
The parameters selected for analysis, which were considered to potentially influence the occurrence of through lane blockage and were varied in the simulation of different traffic flow scenarios, include the following: left-turn bay length (expressed as the number of vehicles), left-turn volume, approach volume, opposing traffic volume, number of lanes, cycle length, and green-to-cycle-length ratio. There are a significant number of studies in which the length of the left- or right-turn bay is expressed in terms of the number of vehicles [
7,
8,
10,
11,
12,
13,
14,
15,
16]. By expressing the left-turn bay length in terms of the number of vehicles, the model allows the application of different average vehicle lengths when converting storage requirements into metric or imperial (feet) units. CORSIM recommends passenger vehicle lengths of 14 ft (4.3 m) and 17 ft (5.2 m). In this study, a length of 17 ft was applied for all the vehicles in the traffic flow which, together with the 3 ft that CORSIM adds between vehicles in a stationary queue, results in a total length of 20 ft (6.1 m).
In addition to bay length, the parameter with the greatest influence on the potential occurrence of flow blockage is the volume of left-turning vehicles. In the simulation scenarios, the number of left-turning vehicles was defined as a proportion of the total approach volume. The left-turn share ranged from 5 to 30% of the total traffic volume on the observed approach, which itself was varied to cover a wide range of traffic flow combinations. The upper limit of 30% was selected based on data from field studies conducted at signalized intersections in several previous works [
6,
29,
30], where the proportion of left turns in the total approach volume did not exceed this value. The total volume on the observed approach was selected such that the number of through vehicles was either near or above the estimated capacity according to the HCM Equation (1). Due to the different values of the green-to-cycle length ratio, the applied approach volume range for the intersection geometry with one through lane was 500–2000 veh/h, while for two through lanes, the range was 1000–3800 veh/h. The values for individual scenarios were selected considering the allocated green time and calculated capacity using Equation (1).
The opposing traffic volume was selected based on the geometry of the intersection and the green time allocation, as both factors directly influence the ability of vehicles to complete left turns. In all the simulation scenarios, the range of opposing volumes was set to include conditions up to the point at which only so-called “sneakers” (vehicles that complete a left turn during the yellow or all-red interval) are able to turn. This level of opposing volume represents a critical threshold at which additional operational or design measures are typically needed to maintain capacity and safety. For this reason, in an intersection geometry with one lane in the opposite direction, the upper limit of the opposing volume is 1200 veh/h, while in a geometry with two opposite lanes, the upper limit of the opposing volume is 2000 veh/h. The values for individual scenarios were selected considering the allocated green time (g/C).
The cycle lengths were set to 60, 80, and 100 s, and the green-to-cycle-length ratio (g/C) ranged from 0.2 to 0.8.
Since the objective of this study was to develop a blockage adjustment factor by comparing the capacity of a through lane under conditions with a finite left-turn bay to those with an infinitely long bay, identical initial conditions were maintained across all the simulation scenarios to ensure consistency. Each scenario was initiated at the same signal phase and used the same distribution of driver behavior types, thereby satisfying the requirements for a valid comparative analysis.
The following sections present the input parameter values used in the simulations for each of the intersection geometries illustrated in
Figure 3. In addition, several examples of graphical outputs are provided to demonstrate the relationships observed between left-turn bay length and through lane capacity under various traffic flow conditions.
4.1. Intersection Geometry 1 + 2
Intersection geometry 1 + 2 refers to a four-leg intersection in which the analyzed approach has one through lane, while the opposing approach has two through lanes (as in
Figure 3). Also, both approaches have an auxiliary lane for left turns. The values and ranges of input traffic parameters applied for this intersection configuration are presented in
Table 3.
The traffic volumes for both the observed and opposing approaches were selected based on the effective green-to-cycle-length ratio (g/C) and the corresponding through lane capacity for the configuration with an infinitely long auxiliary lane.
The first set of scenarios was designed by selecting three representative values for each of the following parameters: green time ratio, approach volume, and opposing volume. Combined with three values for cycle length, four values for percentages of left-turning vehicles, and five values for left-turn bay length, this resulted in a total of 1620 simulation scenarios (3 × 3 × 3 × 3 × 4 × 5). For each scenario, 20 simulation runs were performed to obtain the average capacity values.
The results of the multiple regression analysis indicated that the cycle length parameter had the smallest impact among all the model variables. Specifically, when cycle length was included in the model, the adjusted coefficient of determination (adjusted R
2) was 0.874, and when it was excluded, adjusted R
2 slightly decreased to 0.872. This difference of only 0.2% confirms the limited contribution of cycle length to the model’s explanatory power, a finding consistent with previous research [
31]. As a result, the cycle length variable was excluded from the model to reduce complexity and the number of required simulation runs, without compromising model accuracy. A fixed cycle length of 60 s was used in all the subsequent simulations. Model validation, presented in
Section 4.6, confirmed that using different cycle lengths did not significantly affect the results; the Mean Absolute Percentage Error (MAPE) remained within acceptable limits across all the tested variations.
Based on the simulation results, a comprehensive database was created, covering all the selected combinations of input parameters.
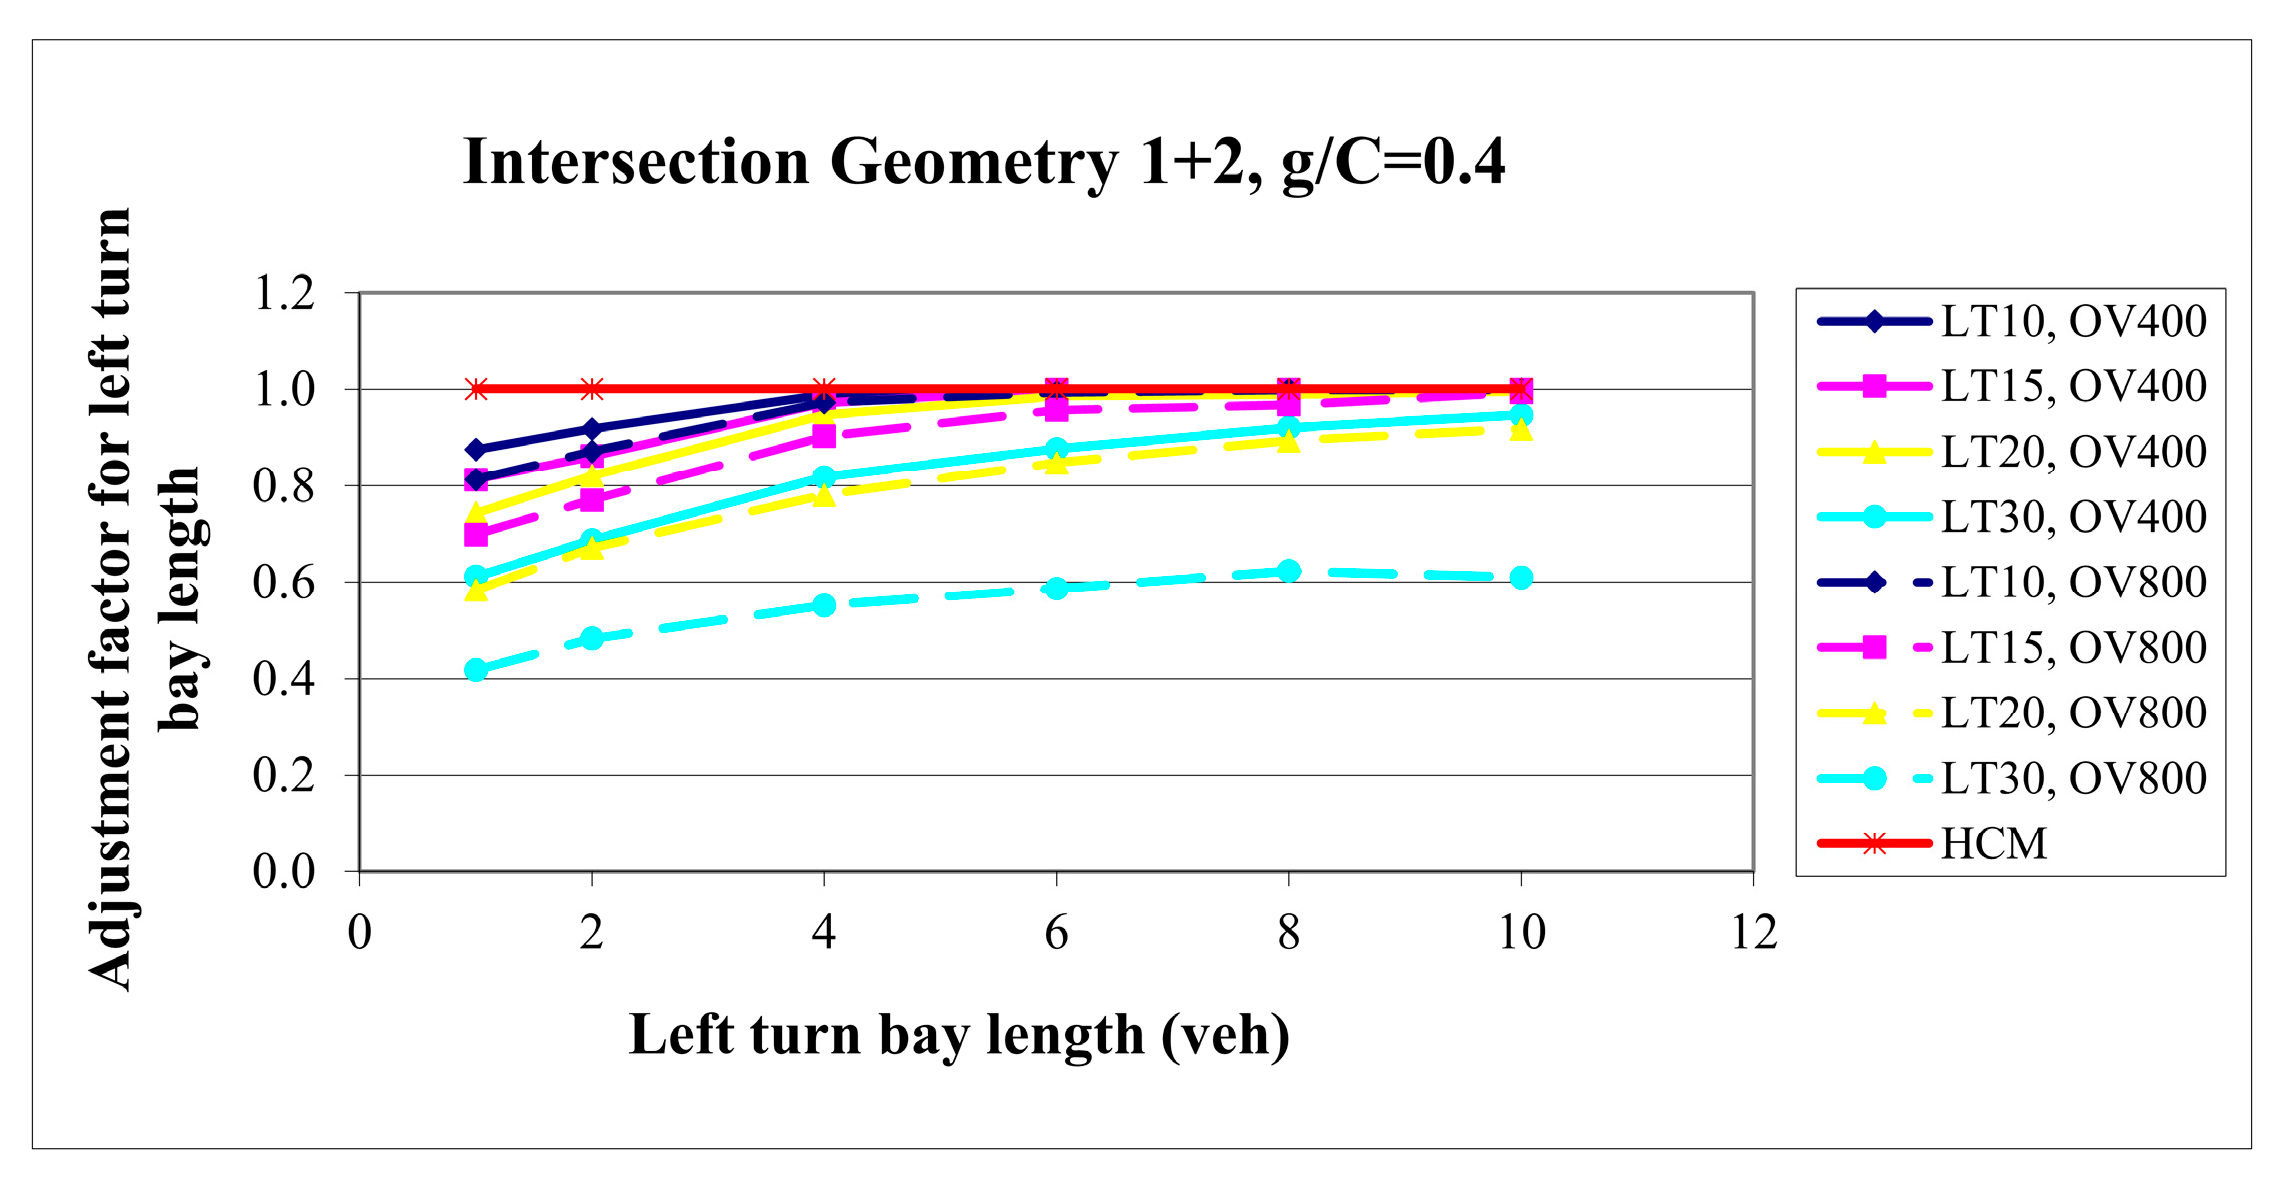
Figure 5 presents examples of graphs derived from this database. To facilitate a clearer understanding of the influence of individual parameters on through lane capacity, some examples of the output are shown here. These examples illustrate how capacity changes in relation to variations in influencing parameters. For this intersection geometry (1 + 2), examples of graphs are provided for different durations of the green phase, i.e., for various green-to-cycle-length ratios (g/C). In the graph legends, labels such as LT10 and OV400 indicate a scenario with 10% left-turning vehicles on the analyzed approach and an opposing volume of 400 vehicles per hour. Other labels follow the same format. The HCM through lane capacity is also presented in the graphs, where it is evident that the capacity remains constant for a given green ratio. This assumption does not reflect real-world conditions and may lead to inaccurate conclusions or inadequate design decisions.
The results clearly show that insufficient left-turn bay length can significantly reduce the capacity of the adjacent through lane, particularly under conditions of higher left turn demand and intense opposing flow. Moreover, the findings indicate that across all the values of the green-to-cycle-length ratio (g/C), the relationship between left-turn bay length and through lane capacity exhibits a similar pattern: the function increases monotonically with bay length up to a certain point, after which it levels off and remains constant.
To maintain compatibility with the HCM methodology, the capacities obtained from scenarios with limited left-turn bay lengths were compared to those with an infinitely long turn bay under identical traffic conditions. Based on this comparison, the adjustment factor was determined according to Equation (7) and was calculated for all the simulated scenarios. An example of the calculated adjustment factor for different prevailing conditions is presented in
Figure 6.
The following sections present the input data values that were combined to simulate various prevailing traffic conditions for the other intersection geometries. In addition to the input data, one example graph is provided for each geometry, illustrating the relationship between through lane capacity and left-turn bay length (an example for g/C = 0.4 was selected), in order to provide insight into the functional form of the relationship between the analyzed traffic parameters.
By varying the proportion of left-turning vehicles and the intensity of opposing traffic, the influence of these parameters on intersection performance can be observed. Only one graph is shown per analyzed intersection geometry because the examples for this geometry show that the overall shape of the curves remains generally consistent across different g/C and opposing volume values. The same applies to all the other intersection configurations analyzed.
4.2. Intersection Geometry 2 + 2
The intersection geometry 2 + 2 refers to a four-leg intersection where the analyzed approach has two through lanes and one auxiliary lane for left-turning vehicles, while the opposing conflicting approach has two through lanes and also one auxiliary lane for left turns. Since there are two through lanes, it is possible to bypass left-turning vehicles that block the through traffic flow in the adjacent lane.
Due to the higher capacity of the observed approach with an infinitely long auxiliary lane compared to the 1 + 2 geometry, a higher intensity of total incoming traffic volume needs to be used to estimate capacity using the simulation model. Therefore, in some scenarios, a 5% share of left-turning vehicles was used. The applied values of input traffic parameters for this intersection configuration are provided in
Table 4.
Combinations of the input data from
Table 4 resulted in 1200 simulation scenarios (5 × 3 × 4 × 5 × 4). One example of the simulation results is given in
Figure 7, where a similar trend of capacity reduction can be observed as for the previous intersection geometry.
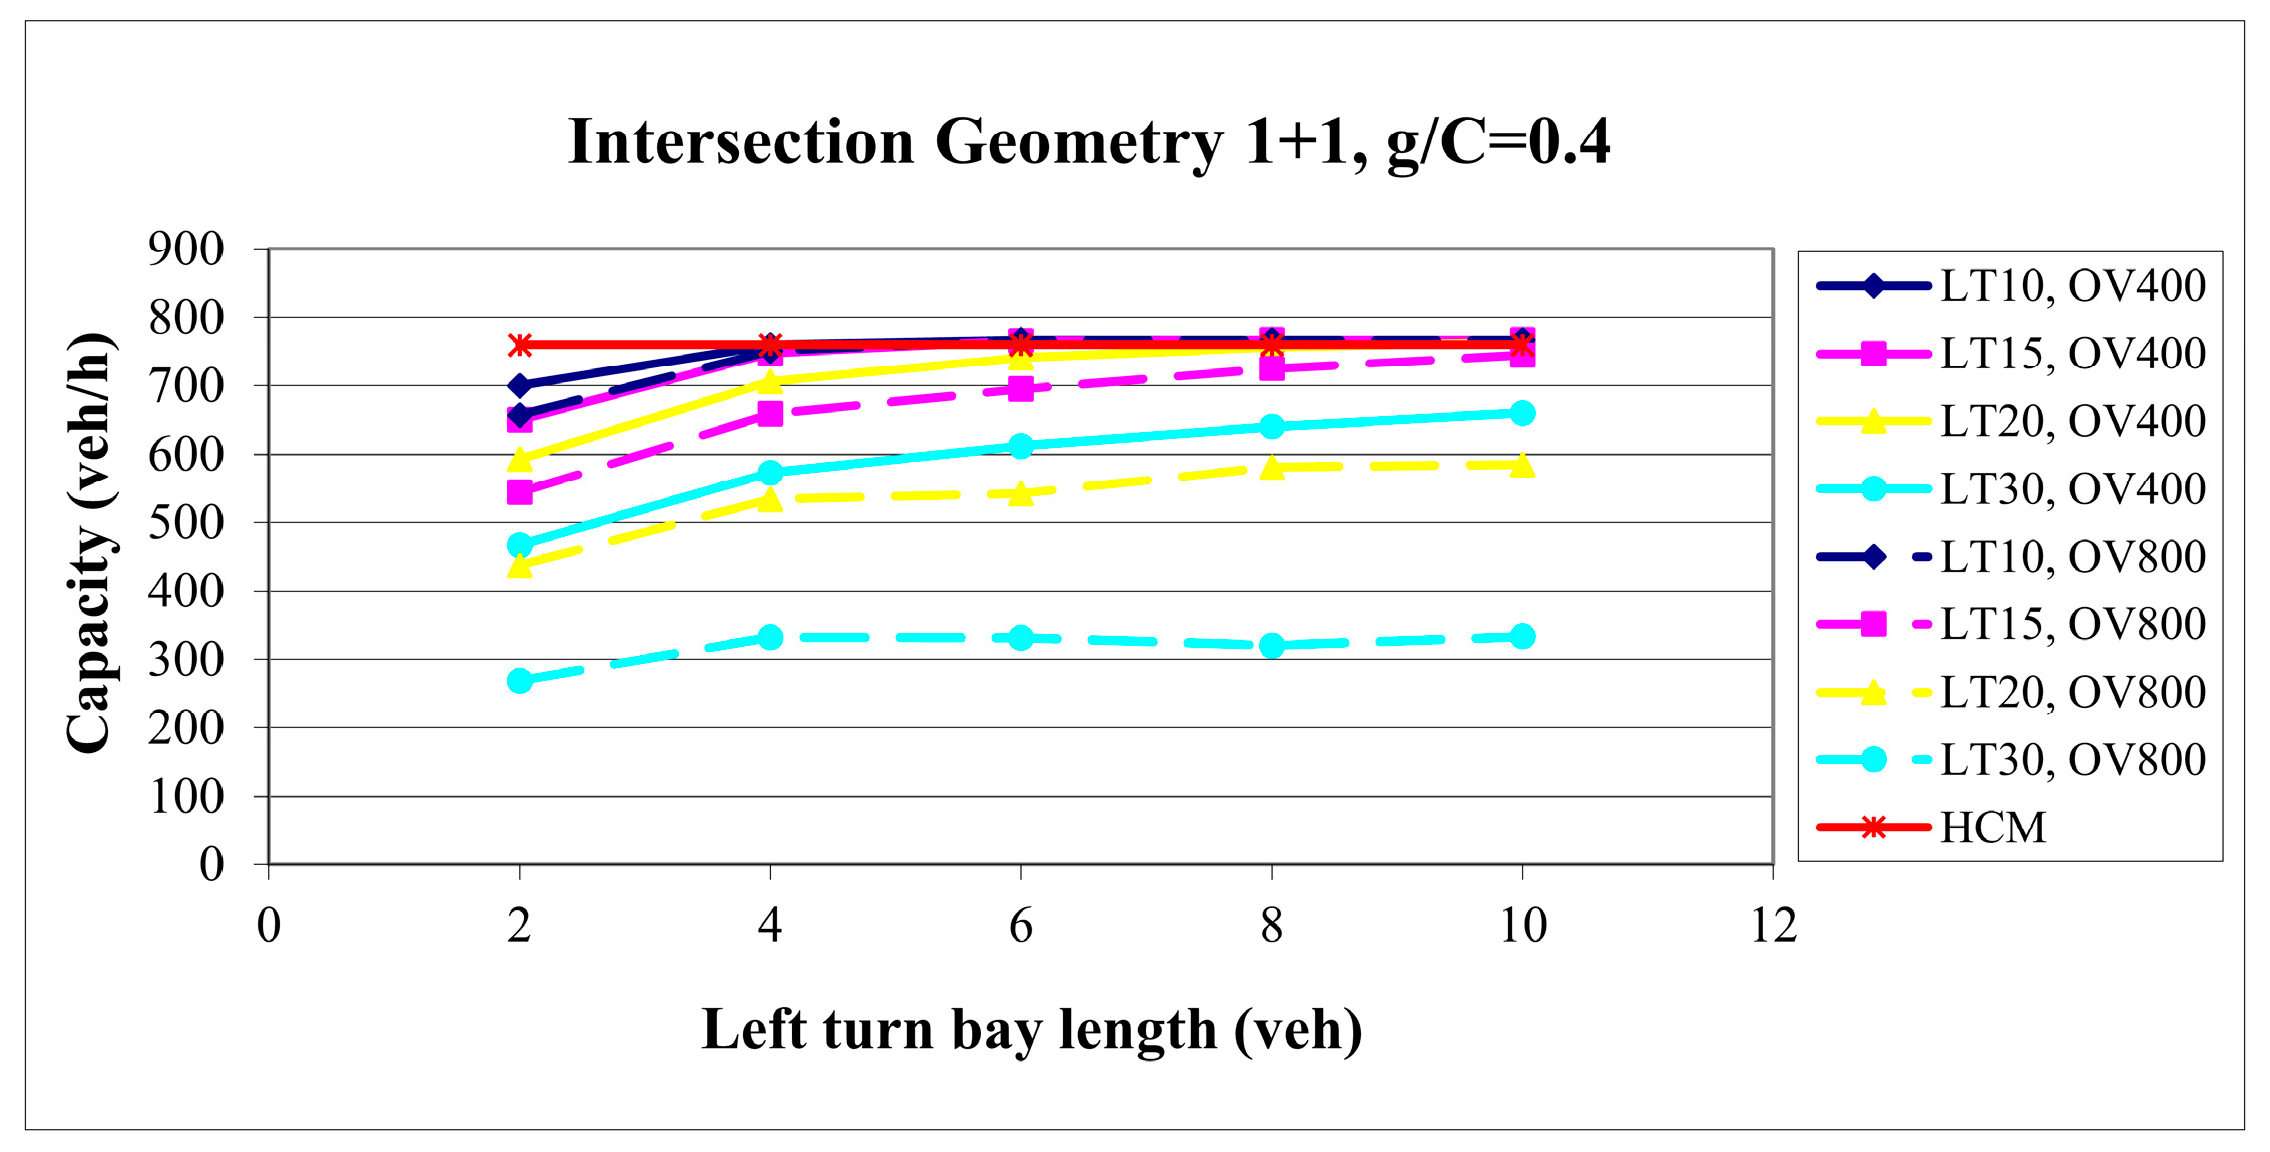
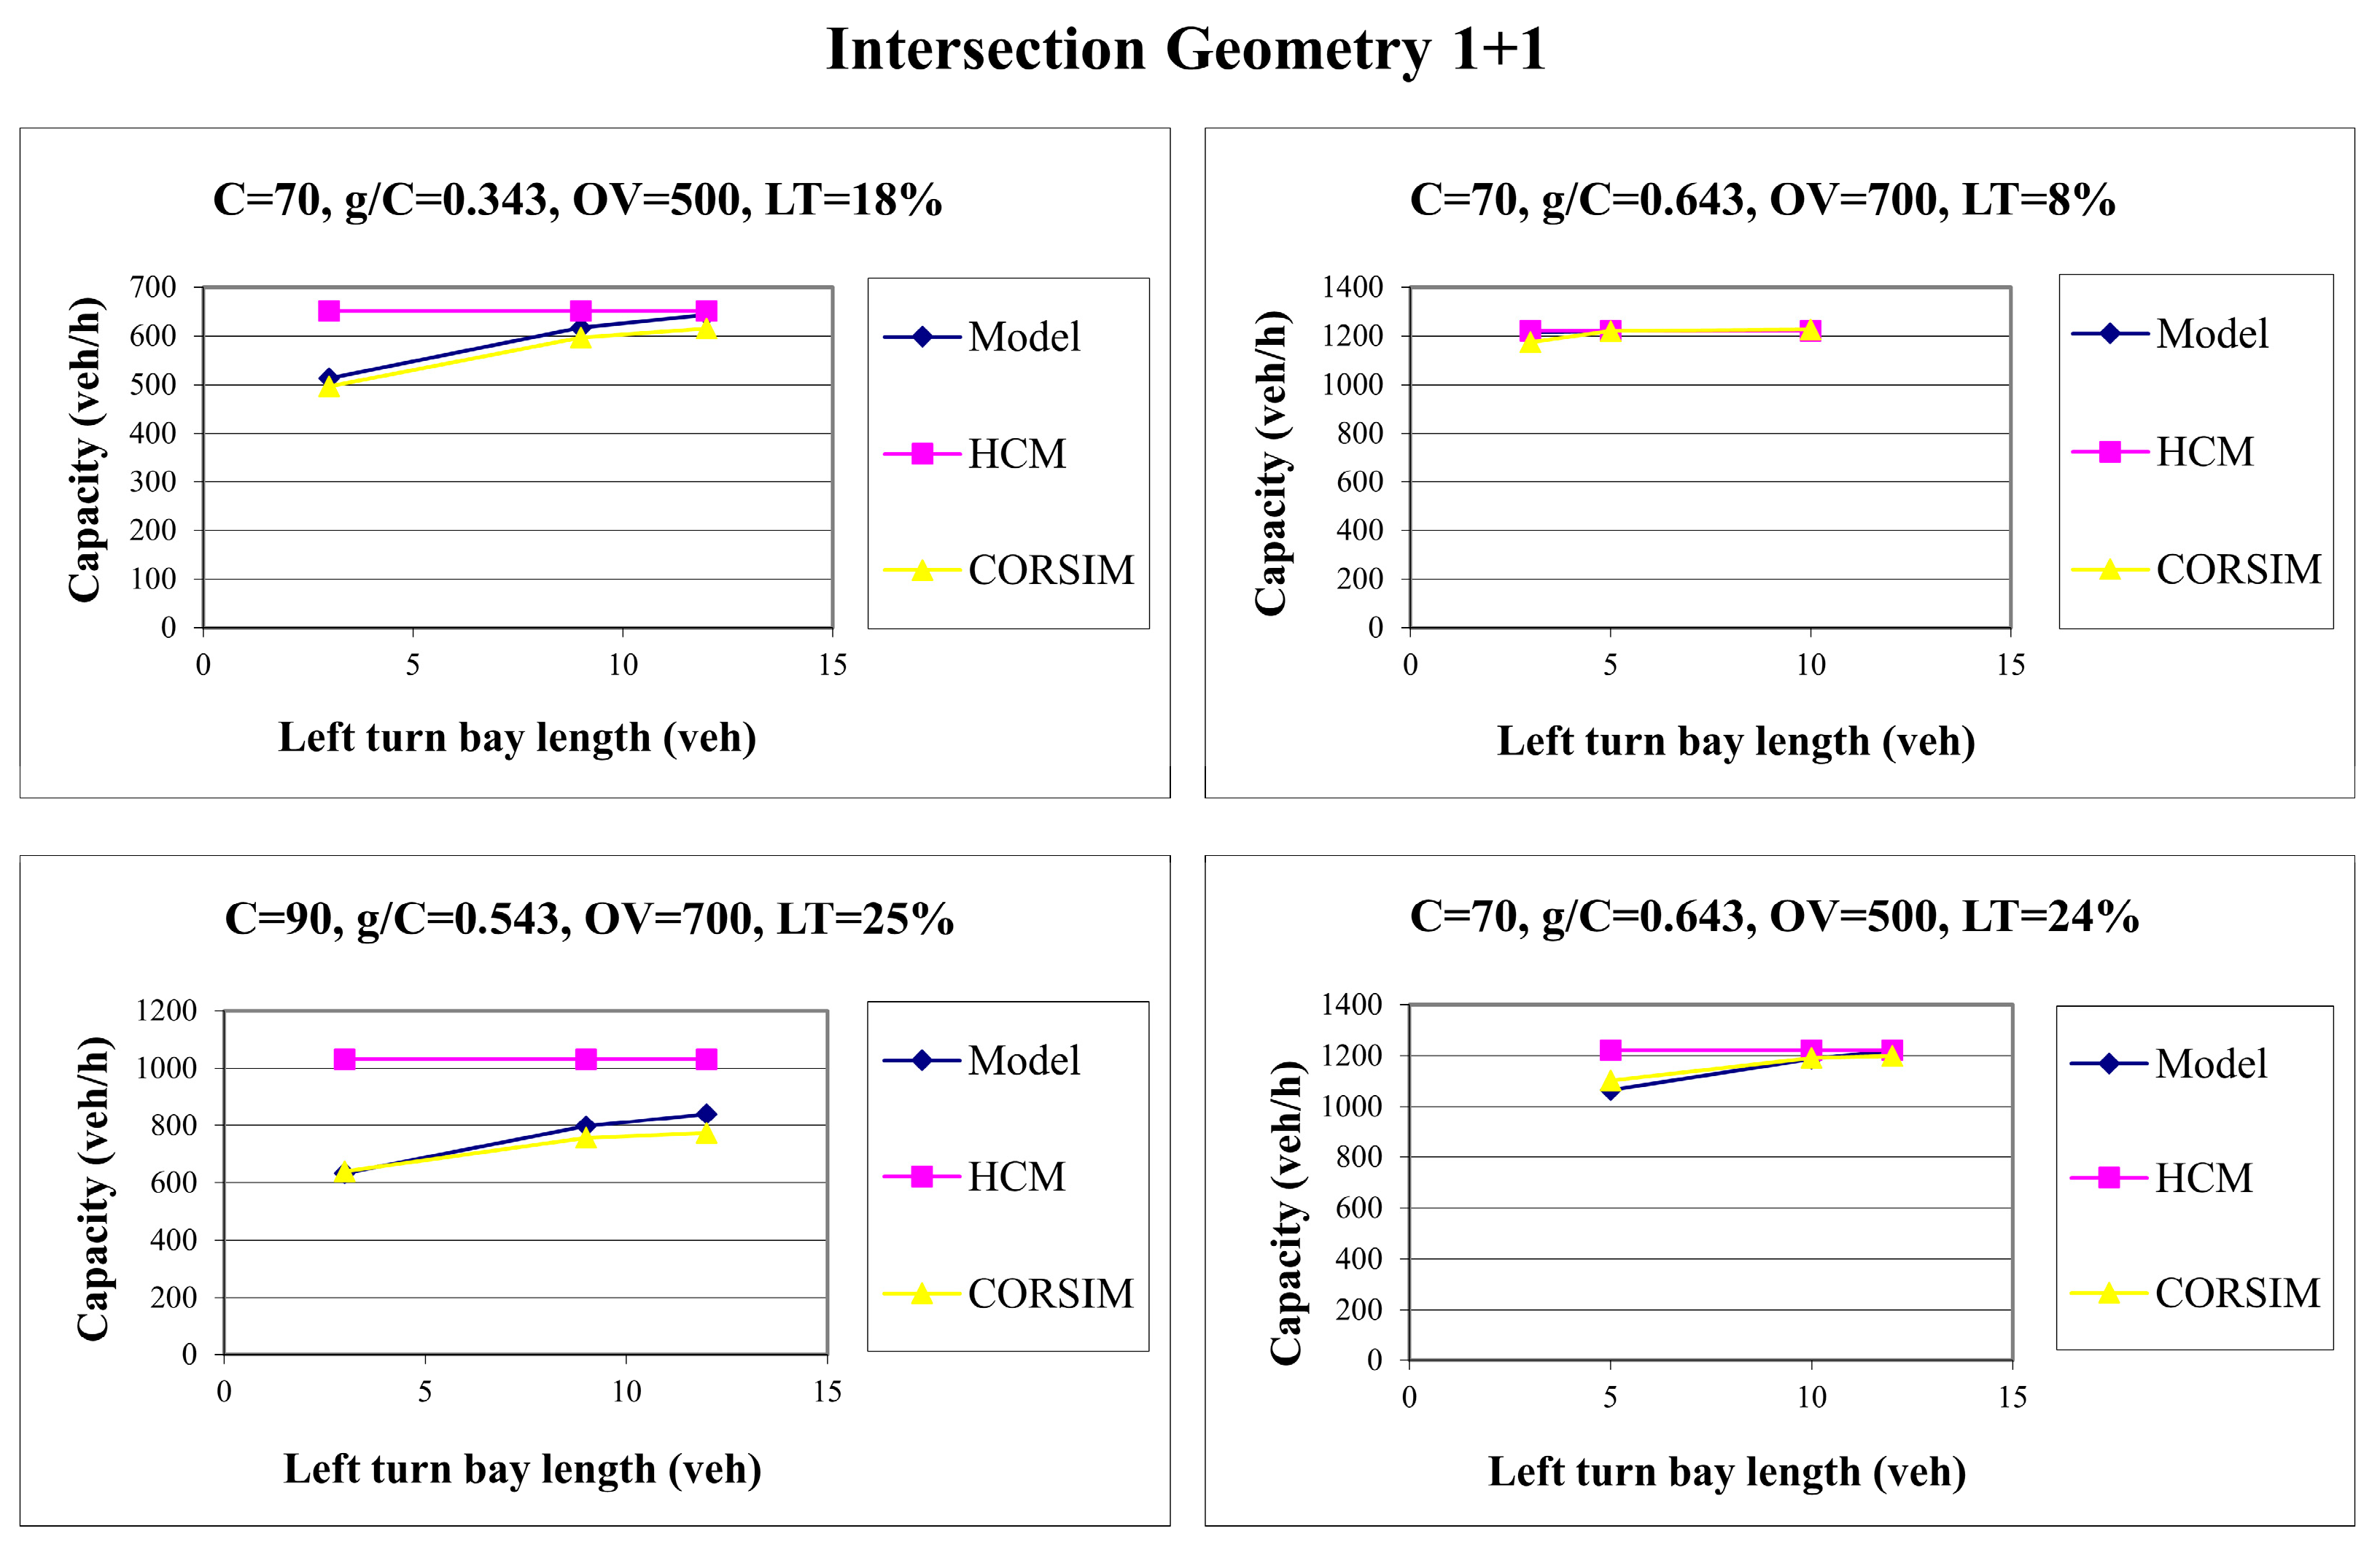
4.3. Intersection Geometry 1 + 1
For this intersection geometry, 1080 scenarios were generated by combining the input parameter values given in
Table 5. Combinations of the input data and capacities obtained through the simulations formed a database. One example of the graph based on this database is given in
Figure 8.
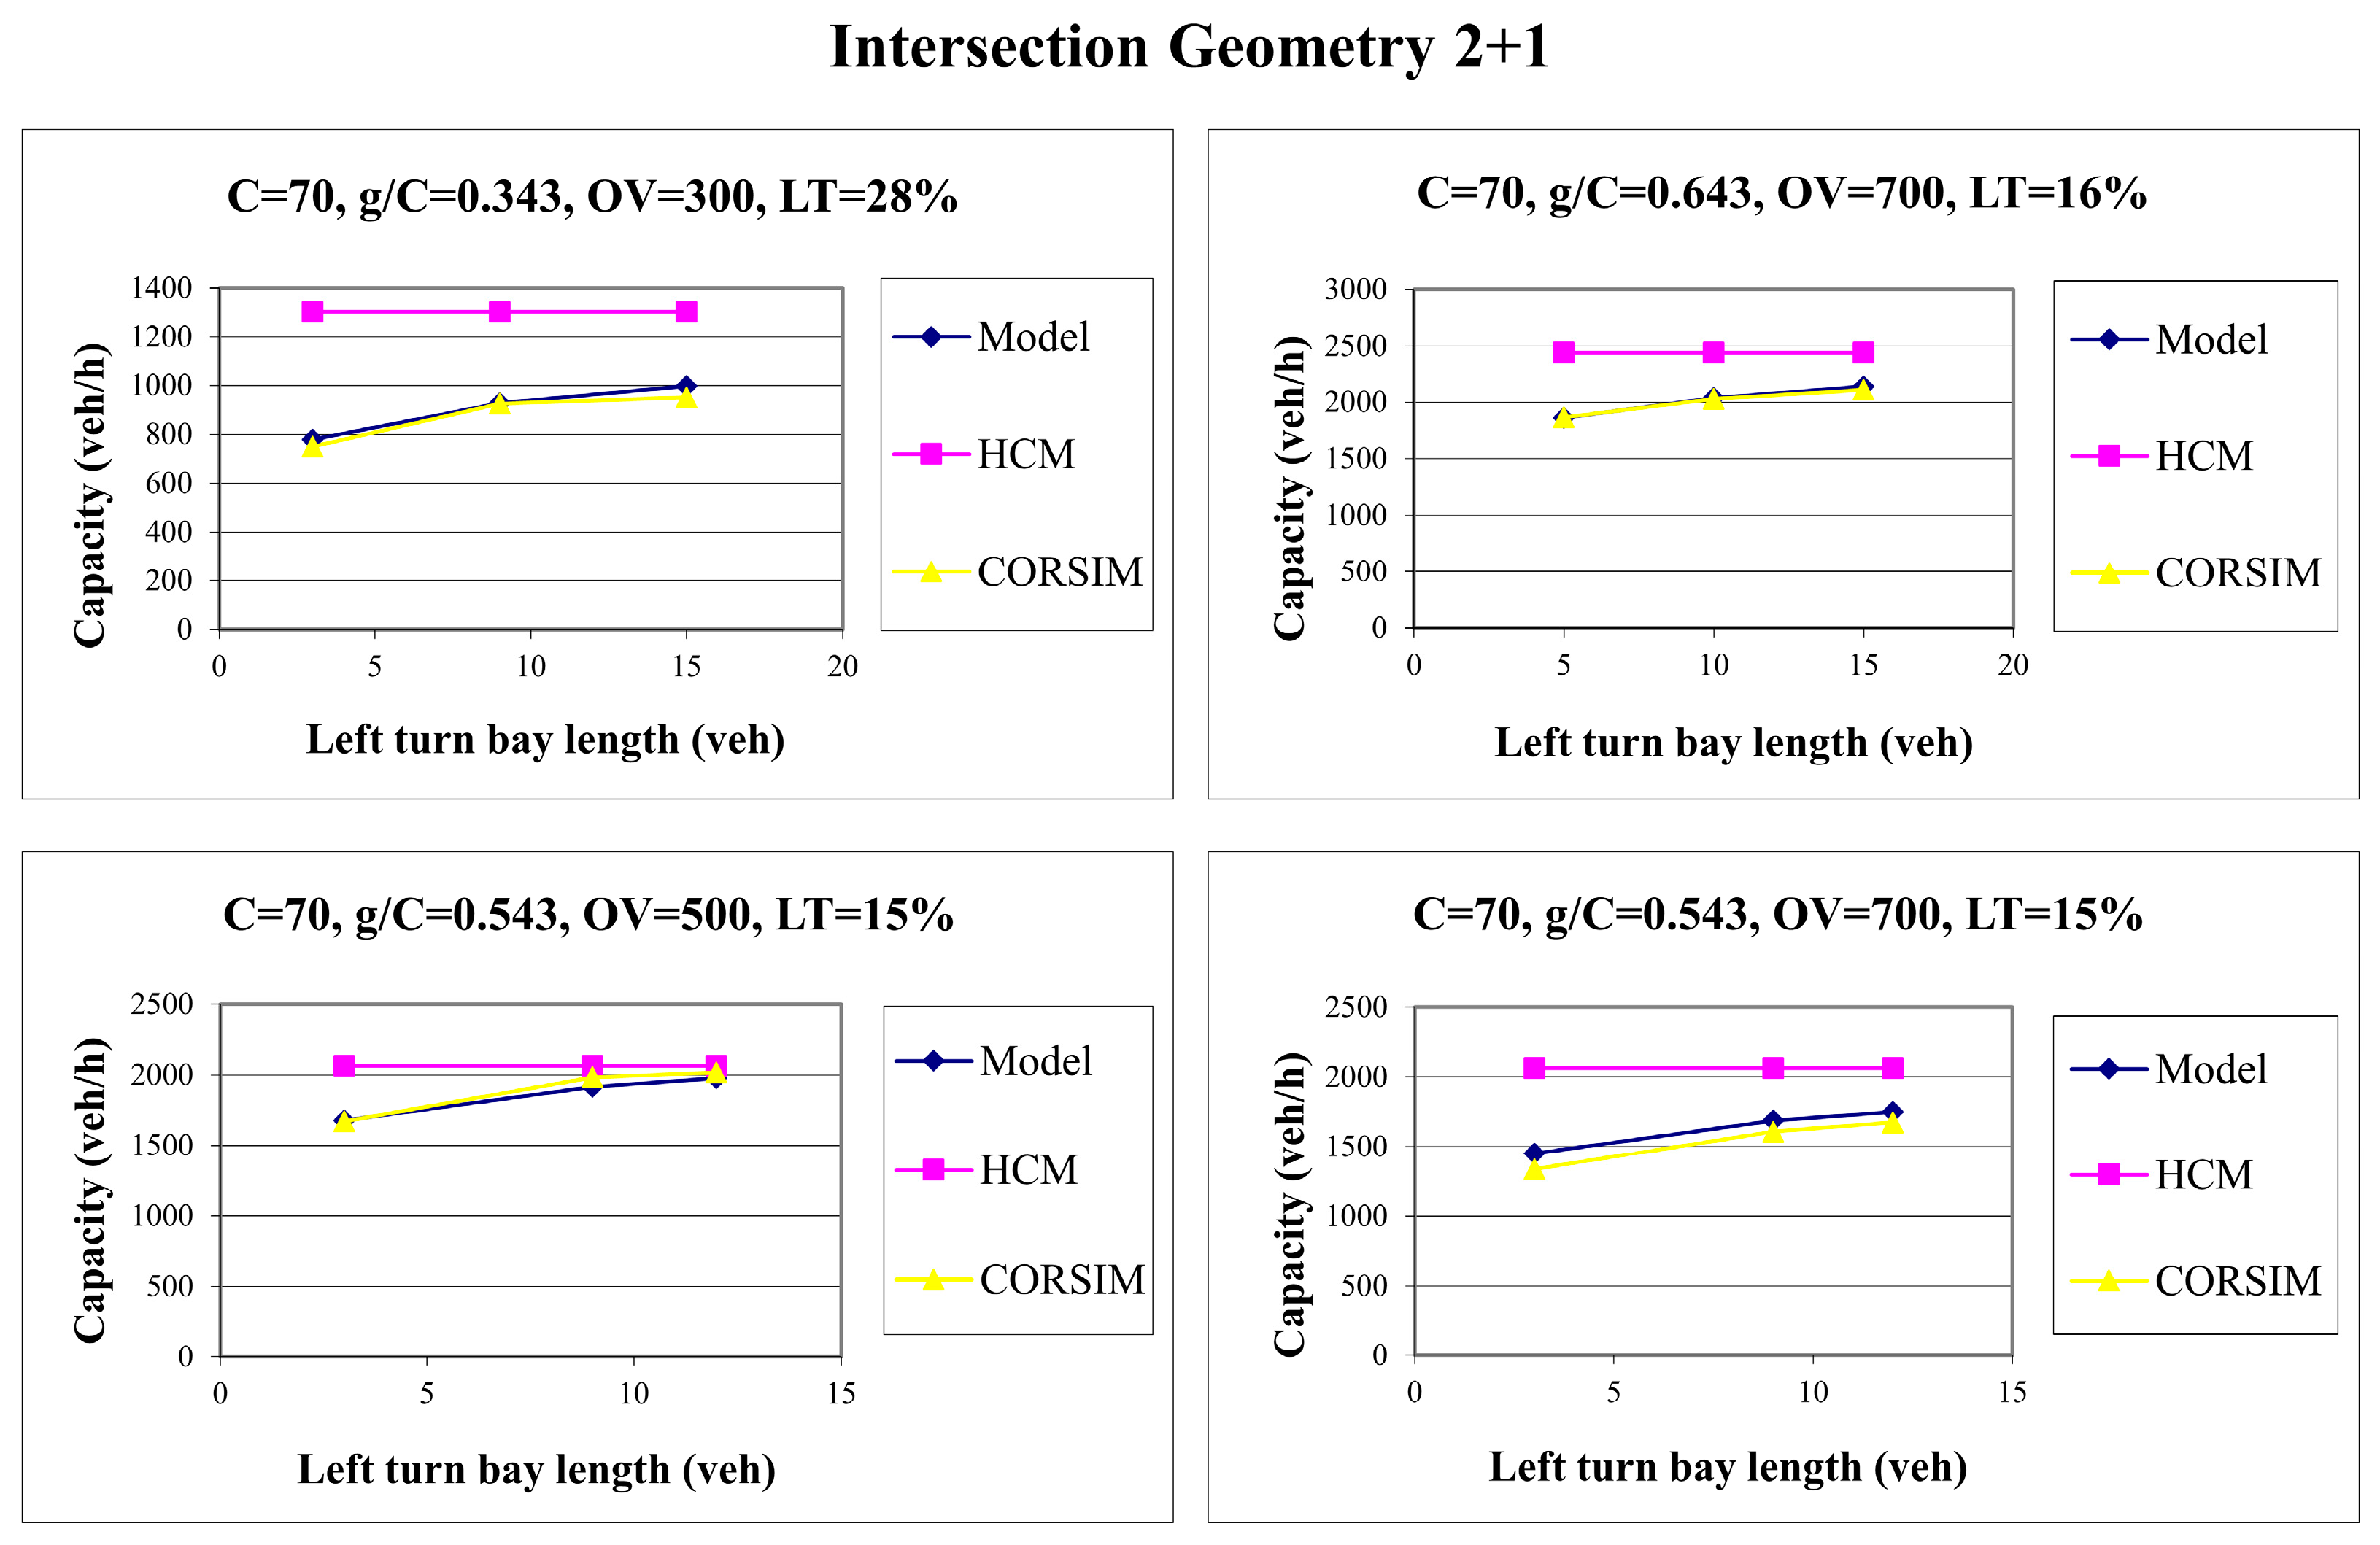
4.4. Intersection Geometry 2 + 1
Table 6 provides the values of the input parameters for this intersection geometry.
From these ranges of data, 1040 scenarios were modeled. As with the previous geometries, the graphs were made based on the input data and resulting capacities. An example is given in
Figure 9.
Based on the performed analyses, it can be concluded that the length of the left-turn bay can significantly affect the capacity of the adjacent through lanes. The results indicate that besides the left-turn bay lane length, the capacity reduction is significantly impacted by a combination of other parameters, primarily the left-turn volumes and the opposing flow. The graphs further highlight that the HCM methodology, in its estimation of through lane capacity, does not account for the potential occurrence of flow blockage due to the insufficient length of the left-turn bay. For any combination of left-turn bay length, left-turn traffic volume, and opposing flow intensity, the HCM yields a constant result.
Accurate capacity estimation and, consequently, reliable assessment of the existing or planned volume-to-capacity ratio and average delay are essential for evaluating intersection performance. The obtained simulation results served as a basis for the proposal of a new adjustment factor for the saturation flow calculation that is compatible with the HCM methodology.
4.5. Modeling of Adjustment Factor for Left-Turn Bay Length
The input parameters presented in
Section 4 and the results of the performed simulations formed the basic databases for multiple regression analysis separately for each of the four types of intersection geometries. The adjustment factor for left-turn bay length f
LTB was calculated as the ratio of the capacity with limited auxiliary left lane length and the base capacity with an infinite auxiliary lane (Equation (7)) when all the other simulation parameters were the same for both scenarios. When the turn bay has a satisfactory length to function as an infinite lane, there is no flow blockage in the adjacent lane and the adjustment factor has a value of 1.
The calculated adjustment factor, used as the dependent variable in a multiple regression model, required the identification of suitable predictors to ensure the development of a statistically valid and reliable model. For each combination of left-turn volume, opposing volume, and signal timing, there is a threshold value of the turn bay length for which it begins to function as an infinite lane. A regression function that will give the same result (value 1) for different input values of model predictors could not be established. Therefore, to explore the relationship between capacity reduction and its influencing parameters, only the scenarios with an adjustment factor below 1 were extracted and analyzed. Separate reduced datasets were prepared for each intersection geometry and used as the input for regression analysis.
During the development of the regression model, different combinations of independent variables were tested to achieve the best fit to the input data, i.e., the highest coefficient of determination and the lowest standard error, while meeting the assumptions of regression analysis. A useful tool for defining the structure of the regression function was the scatterplot diagram, which illustrates the relationship between the dependent variable and each independent variable. These diagrams also help identify whether the transformation of a specific variable is needed.
Based on the analysis of all the relevant regression indicators, the most suitable model was found to be a multiple linear regression in which the independent variables (predictors) included the percentage of left-turning vehicles, the length of the turn bay, the opposing volume, and the green-to-cycle-length ratio.
Partial regression plots indicated that the left-turn bay length does not exhibit a strictly linear relationship with the dependent variable (the adjustment factor), but aligns more closely with a natural logarithmic function. Therefore, to establish a linear relationship, the natural logarithm of the turn bay length (lnL) was used as the independent variable. The resulting models of the adjustment factor for left-turn bay length are presented in
Table 7 for each observed intersection geometry.
The signs of the coefficients associated with the independent variables are logically consistent: a higher proportion of left-turning vehicles and greater intensity of opposing traffic reduce the adjustment factor and, consequently, the capacity of the adjacent through lane. In contrast, greater turn bay length and more available green time increase the value of the adjustment factor. The coefficients of the independent variables are relatively small, not because their contribution to the model is insignificant, but because the resulting adjustment factor takes values close to 1.
The results of the performed regression analysis are given in
Table 8. For each model, the correlation value R, coefficient of determination R
2, adjusted R
2, and standard error of the estimate are shown.
Adjusted R2 indicates that the model fits the data well and that the included independent variables explain a meaningful portion of the variability in the dependent variable. In the context of this study, the obtained adjusted R2 values confirm that the proposed models are reliable and that the selected variables, such as left-turn bay length, percentage of left turns, opposing volume, and green-to-cycle-length ratio, effectively capture the key factors influencing the adjustment factor.
The results of the F-test for all the models, presented in the Analysis of Variance (ANOVA) table (
Table 9), indicate that the regression models are statistically significant. At a 95% confidence level, the null hypothesis, which is that all the predictors are redundant in the model, is rejected. Furthermore, the high value of the F-statistic and the very low
p-value (<0.0001) suggest that the selected independent variables explain a substantial portion of the variability in the dependent variable.
According to the presented models, it is possible to predict whether the capacity of the through lanes would be reduced as a result of the lane blockage, as well as the percentage of this reduction. The proposed adjustment factor, defined as the ratio of short lane capacity to infinite lane capacity, by definition, cannot be greater than 1; that is, for all the cases where the auxiliary lane is long enough to prevent blocking the adjacent flow, the factor should be set to 1, as it has no effect on through capacity. In order to meet this limit condition, the final forms of the proposed models have been slightly modified in terms of using the minimal function. Therefore, the proposed models are as follows:
Intersection geometry 1 + 2:
Intersection geometry 2 + 2:
Intersection geometry 1 + 1:
Intersection geometry 2 + 1:
To check the reliability of all the proposed models, validation was performed on an independent database that was not used for their development.
4.6. Model Validation
In general, validation is best performed on the basis of field data at actual locations. However, in the absence of field data, researchers today often use simulation results as references to test new analytical models. As it is very difficult to obtain field data on the capacity due to flow blockage, a simulation was used to validate the proposed models.
For each of the four intersection geometries, approximately 50 new scenarios were generated, with 20 simulation runs conducted per scenario. Based on the resulting capacity values and Equation (7), a new set of adjustment factors was calculated. The validation process involved a comparison between the adjustment factors predicted by the proposed model and those derived from the simulation results. To assess the model’s accuracy, the Mean Absolute Percentage Error (MAPE), defined by the following equation, was used as a measure of performance:
where
n = number of simulated scenarios;
fLTBs = simulation-derived adjustment factor;
fLTBm = model-derived adjustment factor.
The calculated Mean Absolute Percentage Error (MAPE) values were 4.5%, 7.8%, 3.4%, and 4.3% for the intersection geometries 1 + 2, 2 + 2, 1 + 1, and 2 + 1, respectively, which are considered highly acceptable from a statistical standpoint. These results suggest that the selection of independent variables in the regression analysis was appropriate and resulted in reliable and well-performing models.
To illustrate the implications of the proposed adjustment factor model within the HCM capacity methodology, the capacity of through lanes was evaluated for all the newly created scenarios. In the first variant, the capacity was estimated using the current equations defined in the HCM. In the second variant, the equations were modified by including the proposed adjustment factor f
LTB for the influence of left-turn bay length. Both sets of calculated capacities were compared with the capacity values obtained through the CORSIM simulation.
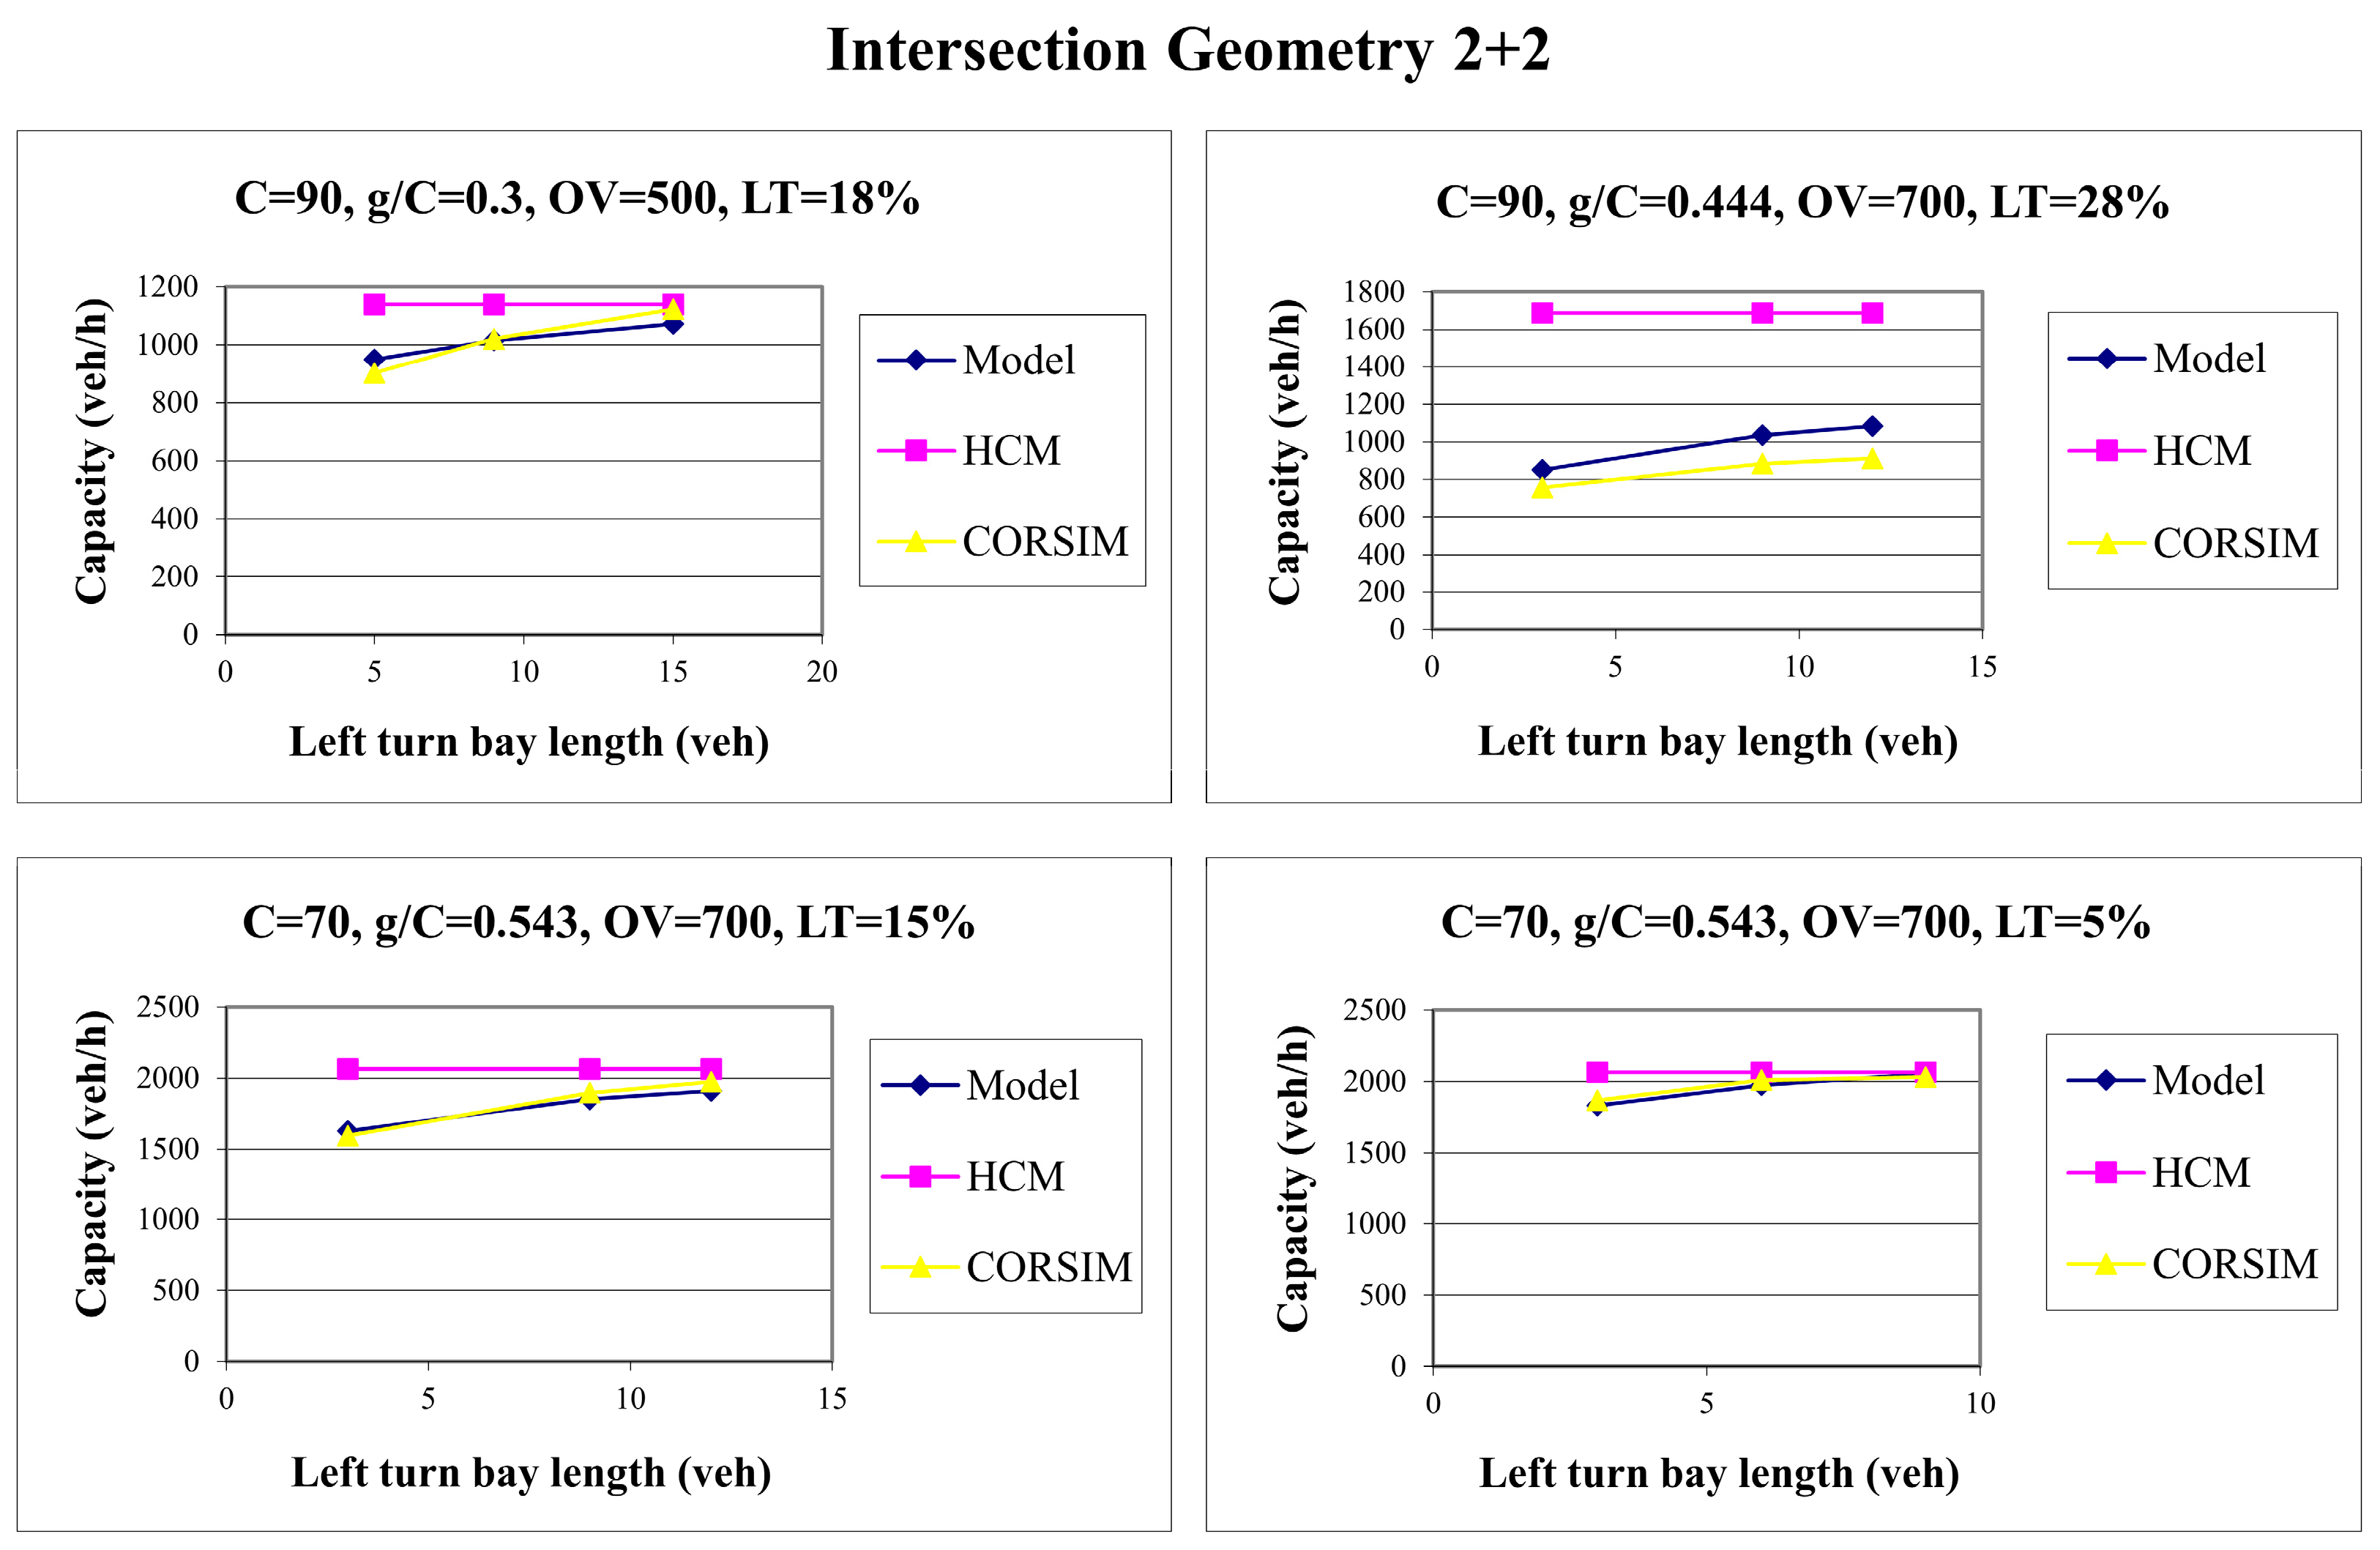
Figure 10,
Figure 11,
Figure 12 and
Figure 13 show a few examples of the results obtained in the model validation process. The label “Model” in
Figure 10,
Figure 11,
Figure 12 and
Figure 13 refers to the capacity estimation using the HCM methodology enhanced with the new adjustment factor.
Through movement capacity estimations using the HCM methodology (Equations (1) and (2)), which included a new adjustment factor fLTB, showed very good agreement with the simulation results, especially in comparison to the current HCM model, which does not account for the impact of turn bay overflow. Applying the new factor enables a better estimation of capacity, leading to more accurate estimates of delays and levels of service.
In contrast to the probabilistic modeling approaches employed in previous studies [
13,
14,
15,
16,
17], which characterize left-turn bay spillback using stochastic frameworks and lane blockage probabilities, this study adopts a deterministic, simulation-based methodology to quantify the impact of left-turn bay length on through lane capacity. While probabilistic models are valuable for capturing the inherent variability of traffic behavior, they often require detailed calibration, and the resulting capacity estimation equations can be less intuitive for direct integration into operational tools such as the HCM. The approach proposed in this study presents applicability by generating a calibrated simulation dataset consistent with the HCM methodology and translating its results into a new adjustment factor (f
LTB), suitable for direct use within the HCM saturation flow rate equation. This makes the proposed method useful for practitioners seeking to refine HCM-based capacity estimates while maintaining methodological consistency.
Table 10 presents some examples of through capacity estimates obtained using the HCM method, our proposed model, and the CORSIM simulation for several different scenarios. It also includes the Absolute Percentage Error (APE) of the model estimates relative to the CORSIM results. This comparison highlights the contribution of our model: while the HCM method consistently overestimates capacity in cases where left-turn overflow impacts through traffic, our model’s estimates align more closely with the CORSIM simulation, which captures dynamic queue interactions.
The proposed regression models resulted in high coefficients of determination, indicating a strong fit between the simulation outputs and predicted values. Furthermore, the accuracy and stability of the adjustment factor models were confirmed through validation scenarios, which resulted in low MAPE values.
Although the proposed adjustment factor (fLTB) provides HCM-consistent improvements to saturation flow rate estimation, the study is limited to intersections with two-phase pretimed signal control. As such, it does not account for more complex phasing schemes, such as protected/permitted signals. Nevertheless, the results highlight the potential of using simulation-based methods to develop an adjustment factor that is both empirically valid and methodologically aligned with the HCM, providing a foundation for future extensions to more diverse intersection control types.
5. Conclusions
Traffic analysis and the evaluation of signalized intersection performance rely heavily on accurate capacity estimation and level of service (LOS) assessments for each approach and the intersection as a whole. One of the key limitations of the Highway Capacity Manual (HCM) methodology is that it treats left-turn bays as having infinite length, thus neglecting the potential for the overflow and blockage of adjacent through lanes when the actual bay length is insufficient. This assumption may lead to an overestimation of capacity and inaccurate conclusions about intersection performance.
To address this issue, this study investigated the impact of left-turn bay length on through lane capacity and proposed a new adjustment factor to improve the accuracy of HCM-based capacity estimation. The CORSIM simulation model was selected for its ability to simulate a wide range of prevailing traffic conditions and provide detailed capacity measurements. The model was validated against field data to verify its applicability as a data generator and was then calibrated to ensure that it is consistent with the HCM methodology.
A comprehensive database of simulation results was generated for various combinations of traffic volumes, left-turn bay lengths, and signal timing parameters across four typical intersection geometries operating under two-phase signal control. The effect of bay length on capacity was quantified by comparing the capacity with the finite bay length to the capacity with the assumption of infinite bay length in the same other prevailing conditions. This comparison formed the basis for defining a new adjustment factor fLTB for left-turn bay length, consistent with the structure of the HCM’s saturation flow rate formula.
The regression analysis revealed that the most influential factors contributing to through lane capacity reduction are the proportion of left-turning vehicles, the opposing traffic volume, the length of the auxiliary lane, and the green-to-cycle-length ratio. This study shows that the dependence of the value of the new adjustment factor and the aforementioned traffic variables can be reliably determined by applying multiple regression analysis. The obtained adjustment factor models, considering the geometries typical for two-phase signal control, satisfied all the assumptions of the regression analysis and obtained significant coefficients of determination, indicating the correct choice of independent variables. Model validation using a separate set of simulation scenarios confirmed the reliability of the proposed adjustment factor. The Mean Absolute Percentage Error (MAPE) ranged from 3.4% to 7.8%, which is considered highly acceptable in the context of traffic flow analysis.
Incorporating the newly developed left-turn bay length adjustment factor (fLTB) into the HCM methodology for saturation flow estimation provides a more realistic assessment of intersection capacity. This improvement was illustrated through several examples for each analyzed intersection geometry.
Identifying the problem of insufficient turn bay length—whether for the existing or planned intersections—and implementing appropriate measures (optimal signal timing or increasing the length of the turn bay) can improve the performance of an intersection, thus increasing safety and sustainable transportation.
It is important to note that this study focused exclusively on intersections with two-phase pretimed signal control and the geometries typical of such signal timing. This limitation was necessary due to the large number of simulations required to generate data suitable for regression modeling. Therefore, future research could extend this analysis to intersections with multi-phase signal control, including configurations with protected left-turn phases or protected permitted phases, in order to further improve the generalizability and applicability of the proposed methodology.


