Article

Shaping the Coupled and Coordinated Development of Forestry Industry Agglomeration and Eco-Efficiency in China’s Provinces

College of Economics and Management Nefu, Northeast Forestry University, Harbin 150040, China
*
Author to whom correspondence should be addressed.
Sustainability 2025, 17(12), 5390; https://doi.org/10.3390/su17125390
Submission received: 10 February 2025 / Revised: 27 May 2025 / Accepted: 9 June 2025 / Published: 11 June 2025
(This article belongs to the Section Sustainable Forestry)

Abstract

:
This study constructs an index system based on provincial data from 2012 to 2023 for forestry industry agglomeration and eco-efficiency. Using methods such as the Coupling Coordination Degree and Relative Development Degree, the study explores the relationship between the coupled and coordinated development of forestry industry agglomeration and eco-efficiency at the provincial level, and introduces a balanced interval to regulate the coupling and coordination process between forestry industry agglomeration and eco-efficiency. The results indicate that: (1) During the study period, the overall coupled and coordinated development of China’s forestry industry agglomeration and eco-efficiency was in an antagonistic stage, with the development of forestry industry agglomeration lagging behind the level of eco-efficiency. (2) The Relative Development Degree of forestry industry agglomeration and eco-efficiency shifted from a “ladder” pattern to an “hourglass” pattern. (3) The process of coupling and coordinating the development of forestry industry agglomeration and eco-efficiency exhibited fluctuations, indicating that future efforts should focus on improving the quality of both forestry industry agglomeration and eco-efficiency to promote coordinated development. (4) During the period from 2012 to 2023, China’s forestry industry agglomeration and eco-efficiency generally failed to simultaneously reach a reasonably balanced state, with notable regional differences. Factors such as the number of non-forestry employees, geographic location, and environmental conditions significantly impacted the balance between forestry industry agglomeration and eco-efficiency.

1. Introduction

The Third Plenary Session of the 20th Central Committee of the Communist Party of China emphasized that the harmonious coexistence of humanity and nature characterizes Chinese modernization. The forestry industry, through the protection, cultivation, management, and utilization of forest resources, not only meets the material demands for forest products and services, but more importantly, it meets the needs of social ecology [1]. A mutually restrictive and interrelated coupling relationship exists between forestry industry agglomeration and eco-efficiency. Specifically, through collaboration and synergy along the industrial chain, forestry industry agglomeration achieves resource sharing, complementary advantages, and economies of scale, thereby enhancing the efficiency of forest resource utilization and influencing forestry eco-efficiency [2]. Conversely, forest resources provide the foundation for the development of the forestry industry, and forestry eco-efficiency impacts the quality of economic growth within the industry, thus altering the process of forestry industry agglomeration. Clarifying the degree of coupling and coordination between forestry industry agglomeration and forestry eco-efficiency is of profound significance for enhancing national ecological security, promoting the high-quality development of the forestry industry, and advancing the construction of a beautiful China, the relationship is shown in Figure 1.
In recent years, the regional distribution of the forestry industry has shown varying degrees of agglomeration, attracting widespread attention from the academic community [3,4]. Current theoretical research on forestry industry agglomeration primarily focuses on its formation mechanisms [5,6,7], measurement methods [8,9,10,11,12,13,14,15,16], and economic effects [17,18,19,20]. With the gradual advancement of ecological civilization, the environmental impact of forestry industry agglomeration has increasingly become a research hotspot. Existing studies on forestry eco-efficiency mainly concentrate on efficiency measurement [21,22,23,24] and influencing factors [25,26]. In the existing literature, scholars generally agree that factors such as the spillover of knowledge and skills, economies of scale, improvement in production facilities, and resource sharing resulting from industrial agglomeration will enhance forestry industry eco-efficiency [27]. Although existing studies have preliminarily explored the relationship between forestry industry agglomeration and eco-efficiency [28,29], most prior analyses have examined forestry agglomeration and eco-efficiency as isolated phenomena rather than interconnected systems, and the dynamic temporal evolution and spatial heterogeneity of this relationship remain understudied. Most importantly, there is a striking lack of quantitative assessments examining the province-level coupling coordination between these two dimensions in China. Building on existing research, this paper uses provincial panel data from 2012 to 2023 as the sample. It employs a Coupling Coordination Degree model to analyze the coupling and coordination relationship between forestry industry agglomeration and eco-efficiency from both temporal and spatial perspectives. This study provides a foundation for promoting the coordinated development of the forestry industry and eco-efficiency.

2. Indicator System Construction and Research Methods

2.1. Indicator System Construction

Forestry industry agglomeration refers to the spatial concentration of forestry-related activities, promoting collaboration and efficiency across the supply chain. This clustering enhances resource sharing, economies of scale, and sustainable development.
The agglomeration level reflects the industry’s spatial concentration and is measured through employment and output indicators. Employment concentration assesses the proportion of forestry workers in the regional labor force, indicating labor specialization. Industry concentration evaluates forestry’s contribution to regional GDP, reflecting its economic scale and competitiveness.
The agglomeration structure compares forestry with other sectors in employment and output, revealing its role in the regional economy. These metrics help assess clustering effectiveness and inform policy decisions to optimize industrial development.
The agglomeration structure examines the internal linkages, spatial distribution, and inter-industry relationships of the forestry sector. This study employs two key metrics: the forestry/non-forestry employment ratio and output value ratio [30]. These indicators assess the sector’s relative position in the regional economy, with the employment ratio reflecting workforce absorption capacity and the output ratio measuring economic contribution and industrial complementarity.
This study constructs a comprehensive and systematic evaluation index system for forestry industry agglomeration by selecting the concentration of forestry employment and the concentration of forestry industry as indicators for the agglomeration level, and the ratio of forestry to non-forestry employment and the ratio of forestry to non-forestry output value as indicators for the agglomeration structure. The details of this index system are presented in Table 1.
The study employs the PSR (Pressure–State–Response) model framework to assess forestry eco-efficiency [31]. This analytical model systematically examines the interaction between human activities and ecosystems through three core indicators: pressure indicators (e.g., investment in forestry fixed assets and forest coverage rate) quantify economic impacts on the environment. Investment in forestry fixed assets serves as a critical proxy for technological intensity in forestry operations. Capital investments directly determine the adoption of advanced processing equipment and automation technologies, which subsequently influence both resource utilization rates and pollution abatement capacities. Modern machinery typically exhibits higher energy efficiency and lower material waste coefficients, thereby enhancing production eco-efficiency. Eco-efficiency state indicators (including the afforestation area, forest management scale, and pollution emissions) reflect current ecological conditions. Wastewater discharge volume serves as a key indicator for assessing water pollution pressure; exhaust gas emissions are used to measure atmospheric pollution levels and the impact of human activities on air quality. Response indicators (such as total forestry output, ecotourism revenue, and employment) evaluate sustainable development performance. Characterized by rigorous logic, operational feasibility, and broad applicability, this model provides quantitative support for formulating science-based forestry management policies. It is an essential indicator for assessing ecological, environmental protection, and economic and social development coordination. Per capita water resources contextualizes the regional ecological carrying capacity that constrains forestry operations. The change in per capita water resources can indirectly reflect the effectiveness of water resource management and water-saving measures, which is of great significance for evaluating the overall condition of the ecological environment. The details of this index system are presented in Table 2.
This study selects various provinces as the research subjects based on data availability. The data primarily come from the 2012–2023 China Statistical Yearbook, China Forestry and Grassland Statistical Yearbook, China Environmental Statistical Yearbook, and the National Bureau of Statistics, among others (some indicators are missing, so indicators from adjacent years are used as substitutes).

2.2. Research Methods

2.2.1. Comprehensive Evaluation Model

This study selects data for various provinces from 2012 to 2023 (some data are missing, so values from adjacent years and neighboring provinces are used as substitutes). It employs the entropy method to determine the dynamic weights of the primary, secondary, and tertiary indicators for forestry industry agglomeration and eco-efficiency. The dynamic weights of the indicators are determined based on the entropy method and then weighted to compute the weights of the tertiary indicators [32].
Step 1: Standardize the original indicators. Using the range method, each indicator is processed to be dimensionless and oriented in the same direction so that the values fall within the range [0, 1]. This study uses the linear dimensionless method, with the specific method as follows:
Positive   indicators :   x i j = a i j m i n a i j m a x a i j m i n a i j
Negative   indicators :   x i j = m a x a i j a i j m a x a i j m i n a i j
In Equations (1) and (2), aij represents the raw value of the j-th indicator in the i-th region, and xij represents the standardized value of the j-th indicator in the i-th region.
Step 2: To avoid negative values or zeros during the range standardization process, add 0.0001 to the entire expression.
p i j = y i j / i = 1 m y i j
Finally, the entropy value ej and the divergence coefficient dj for the indicator xj are calculated.
e j = 1 l n m i = 1 m p i j l n p i j
d j = 1 e j
It can be observed that the smaller the entropy value ej, the larger the divergence coefficient dj between indicators, indicating that the indicator is more important. Next, calculate the weight wj of the indicator.
w j = d i j / j = 1 n d i j
Based on this, the comprehensive score for evaluating forestry eco-efficiency can be obtained:
S i = j = 1 n w i × y i j

2.2.2. Coupling Coordination Degree Model

(1)
Coupling Coordination Degree
The Coupling Coordination Degree measures the degree of mutual coordination between different projects. This study establishes a Coupling Coordination Degree model to analyze the coordination between forestry industry agglomeration and eco-efficiency. Referring to existing research [33], the calculation formula is as follows:
C = 2 × U 1 × U 2 U 1 + U 2
T = α U 1 + β U 2
D = C × T
In the above formula, C represents the coupling degree, and U1 and U2 are the comprehensive indicators of forestry industry agglomeration and eco-efficiency, respectively. The parameters α + β = 1, T denote the development level index of the Coupling Coordination Degree, and D is the Coupling Coordination Degree. This study aims to promote the coordinated development of forestry industry agglomeration and eco-efficiency, so it is assumed that both factors interact equally; setting α = β = 0.5. D ∈ (0, 1), the larger the value of D, the higher the Coupling Coordination Degree, and vice versa.
(2)
Relative Development Degree
While the Coupling Coordination Degree can reflect the coordinated development status between forestry industry agglomeration and eco-efficiency, it cannot indicate the relative development level of the two. Therefore, based on existing research [34], a Relative Development Degree indicator of forestry industry agglomeration relative to eco-efficiency is constructed. The formula is as follows:
γ = U 1 / U 2

2.2.3. Equilibrium Intervals Model

The balanced interval regulates the coupling and coordination between forestry industry agglomeration and eco-efficiency. This study establishes a balanced interval to achieve a synchronized and highly coordinated state between forestry industry agglomeration and eco-efficiency. The formula is as follows:
0.7 4 U 1 × U 2 < 1
0.8 < U 1 / U 2 1.2

2.3. Evaluation Criteria for Coupling and Coordinated Development

Considering the characteristics of forestry industry agglomeration and eco-efficiency, this study classifies the development stages and types of their Coupling Coordination Degree [35,36]. The standards are outlined in Table 3.

3. Results

Using Equation (7), we calculated the comprehensive indices of forestry industry agglomeration and eco-efficiency for various provinces in China for 2012, 2015, 2018, 2021, and 2023. Using the available data, the Coupling Coordination Degree and Relative Development Degree of forestry industry agglomeration and eco-efficiency were calculated according to Equations (8)–(11). The results are shown in Table 4.

3.1. Analysis of Coupling Coordination Development Stages

From a temporal perspective, in 2012, the Coupling Coordination Degree between forestry industry agglomeration and eco-efficiency ranged from 0.07 to 0.71, with the coupling coordination development in the stages of antagonism, running-in, and coordination. In 2015, the Coupling Coordination Degree ranged from 0.07 to 0.73, showing an overall improvement compared to 2012, with the stages still being antagonism, running-in, and coordination. At this time, Heilongjiang Province was in the coordination stage, Inner Mongolia, Jilin, Jiangxi, Guangxi, and Yunnan were in the running-in stage, and other regions were in the antagonism stage.
In 2018, the Coupling Coordination Degree ranged from 0.08 to 0.75, reflecting the three stages of antagonism, running-in, and coordination. Heilongjiang remained in the coordination stage, while Hunan’s Coupling Coordination Degree improved from 0.48 to 0.51. The coordinated development stage entered the running-in stage from the antagonistic stage, and Guizhou’s Coupling Coordination Degree increased from 0.43 to 0.53, moving from the antagonism stage to the running-in stage.
In 2021, the Coupling Coordination Degree ranged from 0.09 to 0.74, with the development stages still representing the three phases. Hunan’s Coupling Coordination Degree decreased from 0.51 to 0.48, returning to the antagonism stage. Inner Mongolia’s Coupling Coordination Degree decreased from 0.54 to 0.49, returning to the antagonism stage. At this time, Heilongjiang was still in the coordination stage, Jilin, Jiangxi, Guangxi, Guizhou, and Yunnan were in the running-in stage, and the remaining regions were still in the antagonism stage.
The coupling coordination degree between forestry industrial agglomeration and ecological efficiency in 2023 ranged from 0.12 to 0.62. The coupling coordination development was classified into six stages, with Stage I being the most predominant. Guangxi, Heilongjiang, and Jiangxi reached the running-in stage, while the remaining regions remained in the antagonistic stage.
Based on Figure 2, from 2012 to 2023, the regional disparities in the coupling coordination development level between forestry industry agglomeration and eco-efficiency in China have gradually narrowed. The Coupling Coordination Degree for the 23 provinces has fluctuated and increased, with an average growth rate of 23.9%. Eight regions—Inner Mongolia, Liaoning, Jilin, Shanghai, Jiangsu, Henan, Hainan, and Tibet—experienced a year-on-year decrease in their Coupling Coordination Degree, with an average decline of 8%, and the largest decrease being in Tibet at 19%.
The data reveal that the coupling coordination development stages between forestry industry agglomeration and eco-efficiency are predominantly in the antagonism stage, with most regions exhibiting a low Coupling Coordination Degree and being imbalanced. Some regions are in the running-in stage, and only Heilongjiang is in the coordination stage. This indicates that China is currently in the antagonism and running-in periods regarding forestry industry agglomeration and eco-efficiency.
From a spatial perspective, the process of coupling coordination development between forestry industry agglomeration and eco-efficiency exhibits volatile characteristics, with some provinces experiencing a “regression” phenomenon. For instance, Hunan has undergone an “antagonism–antagonism–running-in–antagonism” process, and Inner Mongolia has experienced “running-in–running-in–antagonism”. Data show that these provinces had a higher Coupling Coordination Degree in 2018, allowing for low-level running-in. Still, by 2021, the Coupling Coordination Degree fell below 0.5, leading these regions to the antagonism stage. This suggests that simultaneous ecological construction may involve many unstable factors during the current rapid development phase of forestry industry agglomeration. Identifying and addressing these instability factors, adapting measures to local conditions, and addressing deficiencies are essential for promoting the coordinated development of forestry industry agglomeration and eco-efficiency.

3.2. Analysis of the Relative State of Development

According to the results in Table 4, the relative development status of forestry industry agglomeration compared to eco-efficiency for 2012, 2015, 2018, 2021, and 2023 across various provinces was analyzed. The relative development status of forestry industry agglomeration and eco-efficiency can be categorized into three forms: being advanced, synchronized, or lagging behind eco-efficiency. In 2012, four provinces were in the synchronized state: Guangxi, Gansu, Qinghai, and Ningxia; four provinces were in the advanced state: Inner Mongolia, Jilin, Heilongjiang, and Hainan; and the remaining regions were lagging. In 2015, the relative development status showed that five provinces experienced synchronized growth: Shanxi, Guangxi, Yunnan, Gansu, and Qinghai. Five provinces were in the advanced state: Inner Mongolia, Jilin, Heilongjiang, Hainan, and Ningxia; the rest of the regions remained lagging. By 2018, the degree of coupling coordination development had changed significantly, leading to a shift in relative development status. The provinces in the synchronized state were Shanxi, Liaoning, Guangxi, Yunnan, and Gansu. The advanced states included Inner Mongolia, Jilin, Heilongjiang, Hainan, Qinghai, and Ningxia. In 2021, some provinces saw a decline in coupling coordination. The synchronized state was limited to Guizhou, Yunnan, Gansu, and Qinghai. The advanced state comprised Inner Mongolia, Jilin, Heilongjiang, Jiangxi, and Hainan, while the remaining 22 provinces lagged. In 2023, only Ningxia, Xinjiang, Qinghai, Fujian, Yunnan, and Guangxi exhibited a synchronized state, while all other regions displayed a state where forestry industrial agglomeration outpaced ecological efficiency.
Based on Figure 3, the variation in forestry industry agglomeration and eco-efficiency across provinces is attributed to significant differences in forestry industry agglomeration and forestry resources. Overall, between 2012 and 2023, the relative development status of forestry industry agglomeration compared to eco-efficiency can be divided into two stages, with a turning point in 2018. From 2012 to 2018, the relative development status exhibited a “staircase” pattern, where provinces with forestry industry agglomeration lagging behind eco-efficiency had the highest values, while the values for synchronized and advanced provinces were nearly identical. By contrast, from 2018 to 2023, the relative development status displayed an “hourglass” shape, with the fewest provinces synchronizing forestry industry agglomeration with eco-efficiency.
The transition from the “staircase” to the “hourglass” pattern from 2012 to 2023 indicates a decrease in provinces where forestry industry agglomeration is synchronized with eco-efficiency and an increase in provinces where forestry industry agglomeration lags behind eco-efficiency. The reasons for this change include:
(1) At present, China has elevated ecological security to a strategic level. The 18th National Congress of the Communist Party proposed the “Five-in-One” overall layout, setting the construction of ecological civilization as a new task for forestry development in the new era. The Chinese government has increased financial investment in forestry ecological construction, supported key ecological restoration projects and technological innovation in forestry, improved subsidy policies for forestry, directed that appropriate subsidies and rewards should be given to forest farmers and enterprises involved in forestry ecological construction, and encouraged financial institutions to provide more credit support for forestry ecological construction, promoting the application and development of green finance in the forestry sector. These measures have significantly advanced forestry eco-efficiency. (2) Complexity of the forestry industry: the forestry industry is a highly complex group with a long industrial chain and extensive coverage. Although the scale of China’s forestry industry is large, limitations in forest resources and an unreasonable industrial structure constrain the development of forestry industry agglomeration. China’s forestry industry economy is still in an extensive development mode, with a dispersed industrial layout and no significant industry cluster formation or scale benefits.

3.3. Analysis of Coupling Coordination Development Types

Based on the results of the comprehensive Coupling Coordination Degree and Relative Development Degree of forestry industry agglomeration and eco-efficiency, and referring to Table 3 for the classification of coupling coordination development types, different regions are categorized into various coupling coordination development types for forestry industry agglomeration and eco-efficiency, as shown in Figure 4.
In 2012, the coupling coordination development types between forestry industry agglomeration and eco-efficiency included Types I, II, III, VI, and IX, totaling five types. Type I was the most common, encompassing 23 provinces, including Beijing and Tianjin. Types II, III, and VI included four, one, and two provinces, respectively, while type IX included only Heilongjiang. In 2015, type V was added, including Jiangxi, Guangxi, and Yunnan. By 2018, the coupling coordination development types included I, II, III, IV, V, VI, and IX, with 17, 3, 3, 4, 2, 2, and 1 provinces, respectively. In 2021, the coupling coordination development types remained I, II, III, IV, V, VI, and IX. In 2023, the coupling development types between forestry industrial agglomeration and ecological efficiency were exclusively categorized as types I, II, III, IV, V, and VI. Among these, types IV, V, and VI each comprised only a single case, while type I remained the most prevalent. Type IX still included only Heilongjiang, and type VI included only Jilin, with the number of provinces in type I remaining the highest.
Figure 4 shows that between 2012 and 2018, the coupling coordination development between forestry industry agglomeration and eco-efficiency progressively moved into the running-in stage but saw a decline in 2021. During 2012–2018, significant progress was made in China’s forestry industry, such as notable land greening effects, a steady advancement in forestry and grassland construction, and continuous growth in the total output value of the forestry industry. These positive factors promoted improved coupling levels between forestry industry agglomeration and eco-efficiency. However, after 2018, macroeconomic fluctuations and downward pressure, including policy orientation changes, from supporting forestry industry agglomeration to paying attention to ecological protection, have affected the investment, production, and market demand of the forestry industry. Weaker forestry enterprises may have struggled to compete in the market, leading to decreased forestry industry agglomeration. China’s limited effective resource supply capability and scarce forestry resources, fragile ecological conditions, and generally low forest quality have highlighted timber safety issues. Additionally, high labor costs in the forestry and a significant trend of rural labor moving to urban non-forestry sectors have led to a loss of young labor in rural areas, contributing to the prevalence of ‘hollow villages’ with mainly the elderly, women, and children left behind. This demographic imbalance has further weakened the vitality and potential of forestry production in forested and mountainous areas, impacting the coupling coordination development between forestry industry agglomeration and eco-efficiency. Furthermore, disruptions such as the global pandemic have impacted forestry industry production and operations, affecting the coupling coordination level.
Between 2012 and 2023, types VII and VIII did not appear in the coupling coordination development, with type I being the most prevalent, averaging 65%, and type IX averaging 3%, while other types had relatively even proportions. This indicates that the coupling coordination between forestry industry agglomeration and eco-efficiency in China is in the antagonism phase, with significant gaps between the two.

3.4. Analysis of Equilibrium Intervals

Given that the current Coupling Coordination Degree between forestry industry agglomeration and eco-efficiency has not reached an ideal level, this study establishes equilibrium intervals for these two. These intervals guide regions to conduct scientific planning and dynamic running-ins based on local conditions, optimize forestry industry agglomeration models, enhance eco-efficiency, and promote coordinated development between the two.
Equilibrium intervals are constructed based on two core evaluation indicators: Coupling Coordination Degree and Relative Development Degree. The Coupling Coordination Degree measures the extent of interaction and mutual influence between forestry industry agglomeration and eco-efficiency, reflecting their synergy at specific development stages. By contrast, the Relative Development Degree focuses on assessing the development status of either forestry industry agglomeration or eco-efficiency individually, as well as their relative position compared to the other. A more refined regulation of the coupling coordination process between forestry industry agglomeration and eco-efficiency can be achieved by setting equilibrium intervals. On the one hand, equilibrium intervals can limit the tendency to pursue industry agglomeration at the expense of eco-efficiency excessively, ensuring that the development of the forestry industry does not come at the cost of environmental degradation. On the other hand, they can also prevent excessive emphasis on ecological protection from stifling reasonable industry agglomeration and economic development, thereby maintaining a dynamic balance between the two.
To achieve the synchronized development of forestry industry agglomeration and eco-efficiency with coordinated relative development, approximate equilibrium intervals are derived based on Figure 4: an eco-efficiency greater than 0.43 and forestry industry agglomeration greater than 0.44, as shown in Figure 5 and Figure 6. When eco-efficiency exceeds 0.80 and forestry industry agglomeration exceeds 0.83, local agglomeration and eco-efficiency achieve absolute equilibrium.
By calculating the comprehensive indicators for forestry industry agglomeration and eco-efficiency from 2012 to 2023, it was found that during the study period, China’s forestry industry agglomeration and eco-efficiency did not simultaneously reach a reasonable equilibrium interval. Comparing the eco-efficiency comprehensive index of different provinces, in 2020 and 2021, Guangxi’s eco-efficiency reached the equilibrium intervals of 0.44 and 0.47, respectively. However, the forestry industry agglomeration was around 0.33, slightly below the equilibrium interval. This is because Guangxi has relatively few non-forestry employment positions, resulting in a large gap between forestry and non-forestry employment numbers, affecting its overall forestry industry agglomeration indicator. Between 2014 and 2021, Tibet had a higher eco-efficiency comprehensive index that could meet the equilibrium interval values. However, due to Tibet’s high-altitude location and severe desertification, its forestry industry agglomeration was relatively poor, with a significant gap from the equilibrium interval values. During the study period, the northeastern regions of China had high forestry industry agglomeration. From 2012 to 2023, Heilongjiang’s comprehensive value for forestry industry agglomeration consistently exceeded the equilibrium interval, surpassing 0.9 between 2019 and 2021. However, this region’s comprehensive value of eco-efficiency was around 0.35, which is below 0.43, though the gap is relatively small. From 2014 to 2016, Jilin’s forestry industry agglomeration comprehensive value ranged between 0.44 and 0.49, and Inner Mongolia’s forestry industry agglomeration was above 0.5 from 2014 to 2017. Nevertheless, the eco-efficiency comprehensive values in these regions only reached between 0.2 and 0.33, showing a significant gap from the equilibrium interval. Jiangxi Province’s two major indicators were relatively close to the equilibrium interval.

4. Discussion

Each region should adhere to the principles of sustainable development when improving eco-efficiency and forestry industry agglomeration, focusing on ecological protection and rational resource utilization. Simultaneously, efforts should be made to enhance innovation, improve labor productivity, and increase resource utilization efficiency. Through regional cooperation and technological exchange, the coordinated development of the forestry industry and eco-efficiency across the country can be promoted. Based on the unique characteristics of regional development, the following specific recommendations are proposed:
East China: Optimize the industrial structure and strengthen regional industrial integration, such as developing forest tourism and promoting the combination of forestry and tertiary industries. This approach can enhance economic value-added and improve overall eco-efficiency. South China: As a forestry industry cluster region, despite geographical constraints, efforts should be made to promote the high-quality development of the forestry industry, focusing on ecological protection and sustainable resource utilization. Additionally, technological innovation and brand building should be emphasized to enhance forest products’ added value and market competitiveness. North China: Maintain the rationality of the industrial structure while reducing energy consumption and pollutant emissions. Leverage regional advantages to support neighboring regions in improving eco-efficiency through technology transfer and industrial collaboration. Central China: Address imbalances in eco-efficiency development by optimizing labor structures, improving infrastructure, and increasing economies of scale. Developing forestry industry clusters can further enhance agglomeration and stimulate economic growth. Southwest China: Strengthen forest resource management and moderately develop forest tourism while prioritizing ecological protection to maintain and improve eco-efficiency. Northwest China: Address significant disparities in eco-efficiency by enhancing inter-regional cooperation, optimizing resource allocation, and reducing internal development gaps. Drawing from successful forestry development models in other regions can help improve local eco-efficiency. Northeast China: Strengthen resource allocation and promote the coordinated development of the economy and the ecological environment. Through policy guidance and financial support, technological innovation and industrial upgrading in the forestry sector can be accelerated, improving resource utilization efficiency.
Using a coupling coordination model, this study analyzes the coupling coordination development level and relative development status of forestry industry agglomeration and eco-efficiency in China. It provides a basis for promoting their coordinated development. However, the models and methods used in this study may have limitations and shortcomings that warrant further research. Additionally, given the challenges in quantitatively assessing eco-efficiency, this study analyzes the drivers of coupling coordination development between forestry industry agglomeration and eco-efficiency. Future research should expand the eco-efficiency indicator system to enable quantitative studies and more precise evaluation.

5. Conclusions

This study analyzed the coupling characteristics of forestry industry agglomeration and eco-efficiency using the Coupling Coordination Degree model from both temporal and spatial dimensions for 2012, 2015, 2018, 2021, and 2023 across provinces in China (excluding Hong Kong, Macau, and Taiwan). The following conclusions were drawn:
(1)
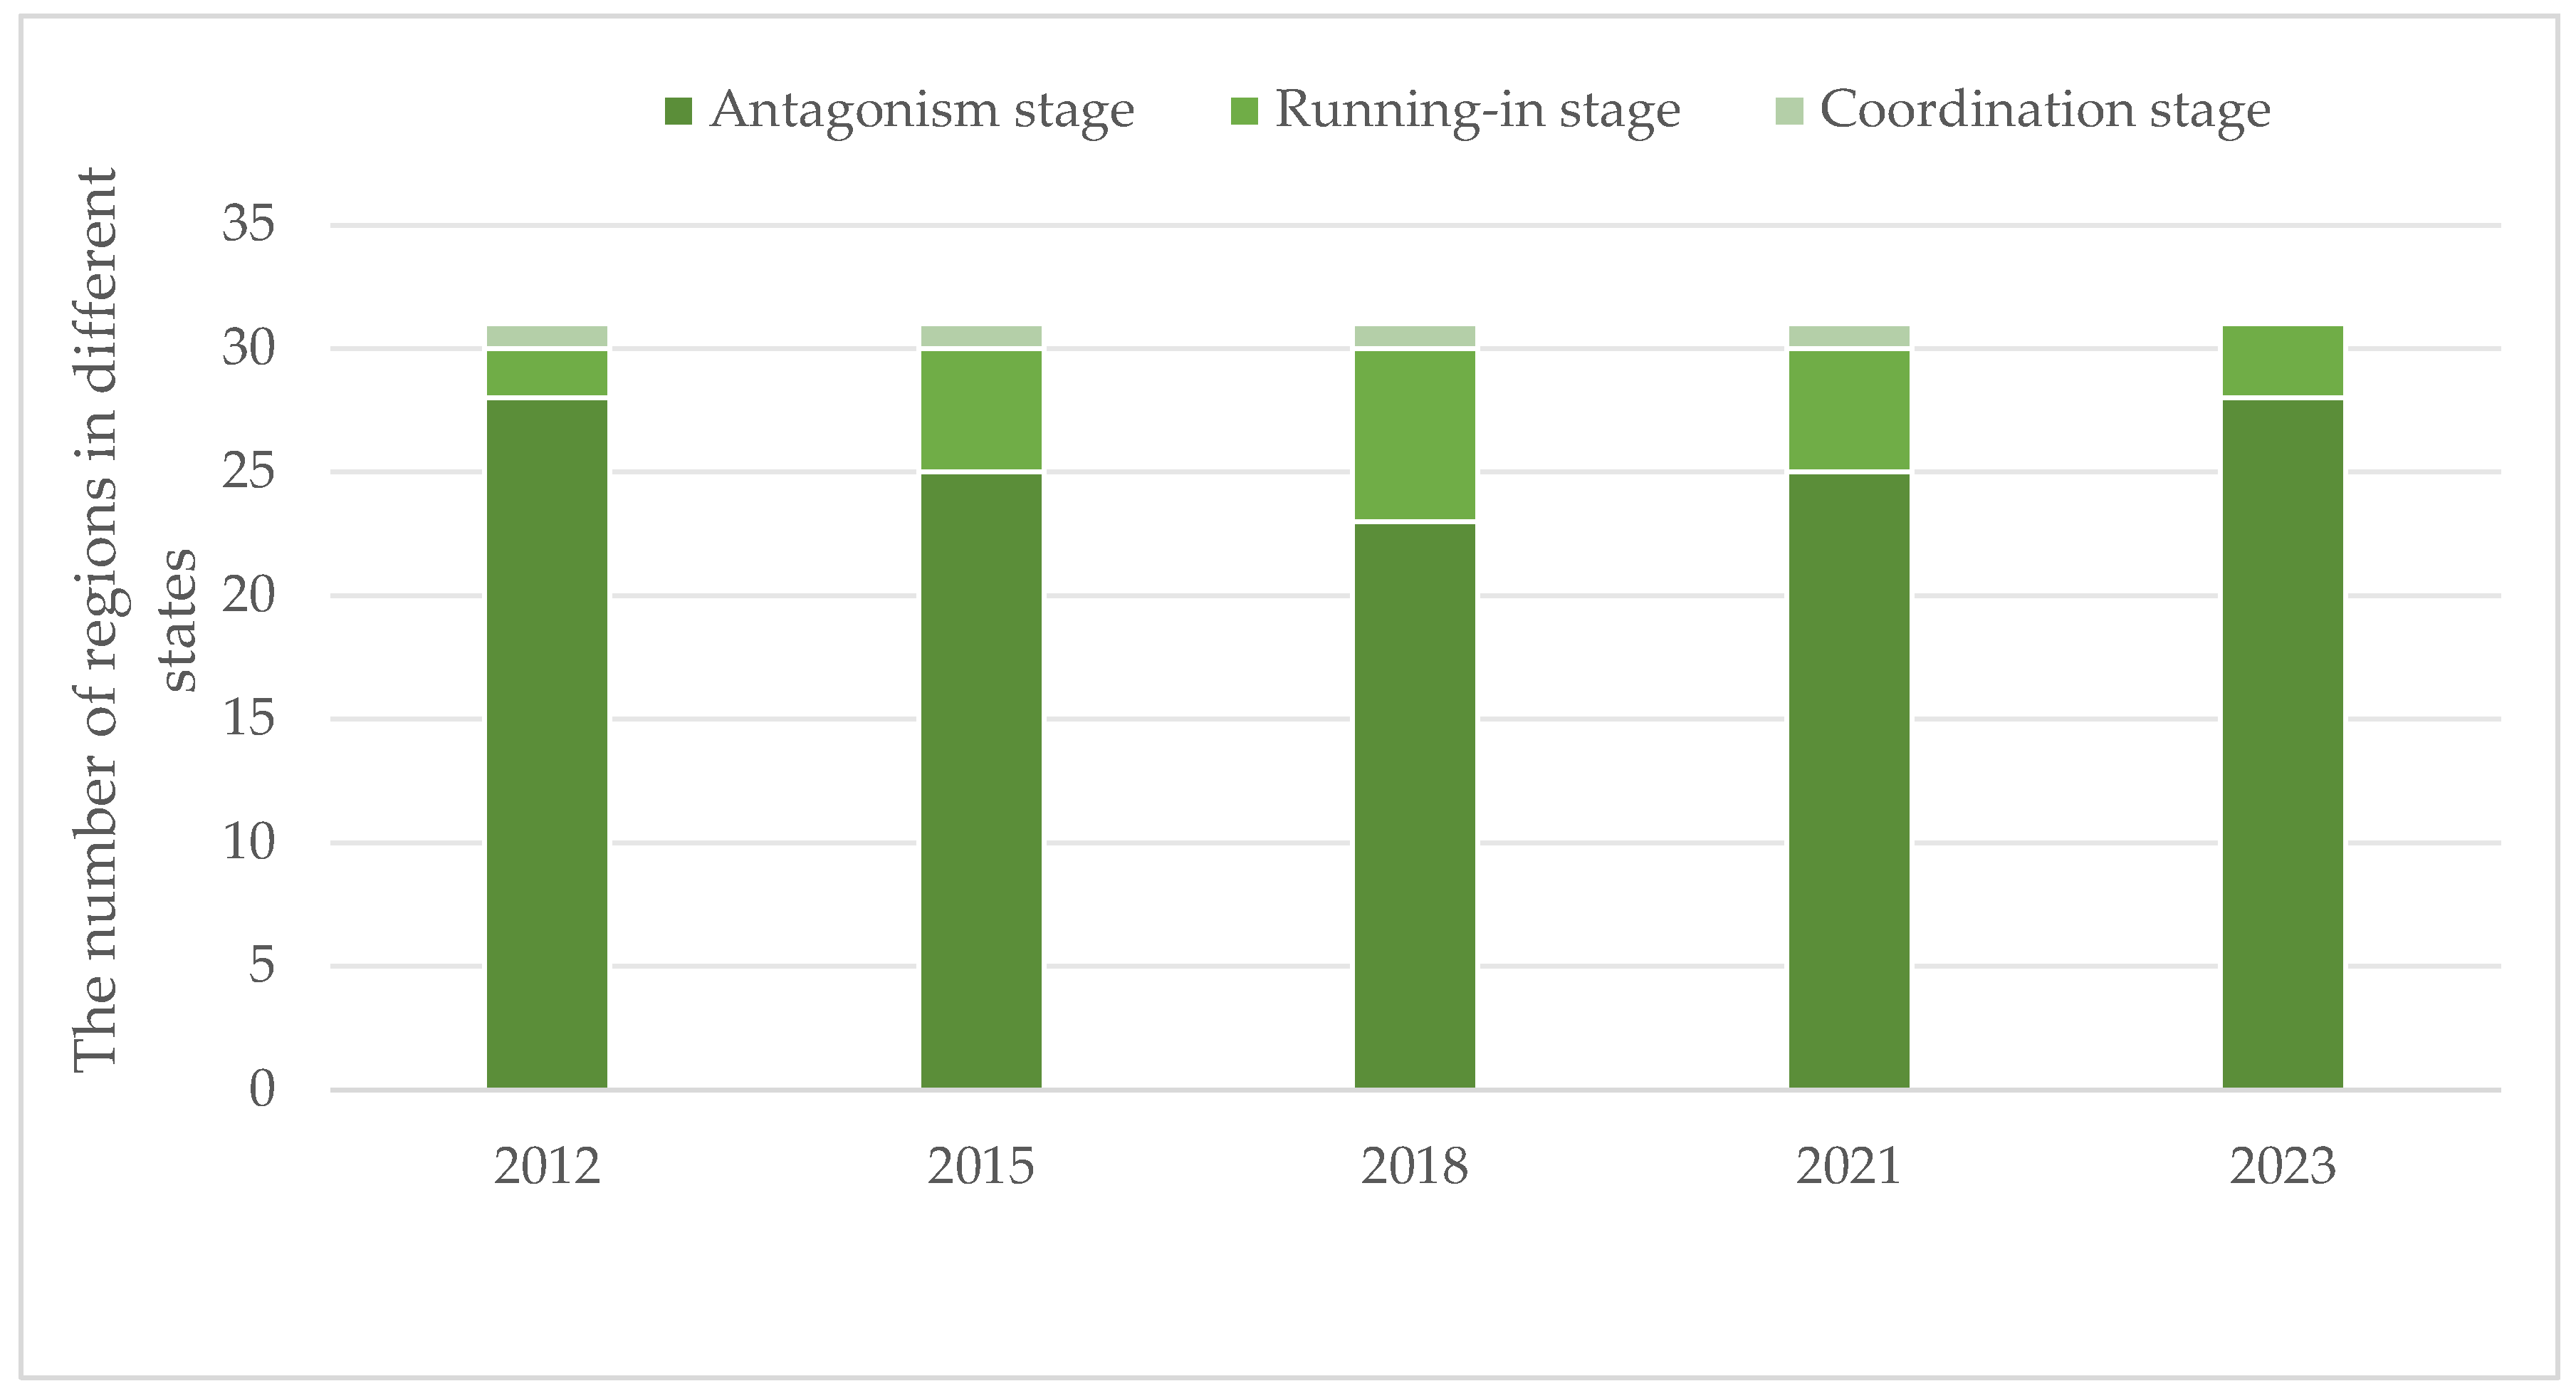
Coupling Interaction System: Forestry industry agglomeration and eco-efficiency form a coupled interactive system, where the Coupling Coordination Degree and Relative Development Degree are crucial for evaluating the coordinated development level of this system. The analysis of the Coupling Coordination Degree from 2012 to 2023 revealed significant regional differences, with provinces being in three distinct stages: antagonistic, transitional, and coordinated. On average, 82% of provinces were in the antagonistic stage, 15% in the transitional stage, and 3% in the coordinated stage during 2012, 2015, 2018, 2021, and 2023. Relative Development Degree results showed that from 2012 to 2023, forestry industry agglomeration, compared to eco-efficiency, exhibited advanced, synchronized, and lagging states. Provinces in the advanced state averaged 16%, synchronized 16%, and lagged 68%. The coupling coordination development types from 2012 to 2023 included types I, II, III, IV, V, VI, and IX, with type I being the most common. Types VII and VIII did not appear.
(2)
Current Development Stage: Overall, the coupling coordination development between forestry industry agglomeration and eco-efficiency in China is currently in the antagonistic stage, with a significant gap between them. From 2012 to 2023, most regions experienced an antagonistic stage, with forestry industry agglomeration lagging behind eco-efficiency or being in a transitional stage with synchronized development. The future focus should be on the high-quality development of forestry industry agglomeration and simultaneous improvement in the quality and speed of eco-efficiency to promote coordinated development.
(3)
Trends and Fluctuations: The coupling coordination process between forestry industry agglomeration and eco-efficiency shows an upward trend, though the magnitude is insignificant. Many provinces are on the edge of transitioning between different levels of coupling coordination and relative development. Some provinces show “retreat” phenomena. The coupling coordination development process exhibits certain volatility. When promoting coordinated development, attention should be paid to these fluctuations, improving the coupling coordination quality, avoiding focusing on speed, and fostering healthy and orderly development.
(4)
Equilibrium Interval Achievement: Forestry industry agglomeration and eco-efficiency have not reached the equilibrium interval. Generally, the development of forestry industry agglomeration is relatively better, with Inner Mongolia, Jilin, and Heilongjiang achieving the equilibrium interval in some years. In some years, Guangxi and Tibet achieved the equilibrium interval for eco-efficiency. Some regions are close to reaching the equilibrium interval. For provinces where one indicator has already reached the equilibrium interval, increased attention should be given to the other. Also, attention should be focused on provinces nearing the equilibrium interval to promote coordinated development between forestry industry agglomeration and eco-efficiency.

Author Contributions

Conceptualization, writing and editing—original draft: M.L.; Data analysis and writing: Y.T.; Review and editing: Y.Z. All authors have read and agreed to the published version of the manuscript.

Funding

This research was funded by Heilongjiang Province Philosophy and Social Science Planning Project, grant number 24GLB008; and the Fundamental Research Funds for the Central Universities, grant number 2572024DZ34.

Institutional Review Board Statement

Not applicable.

Informed Consent Statement

Not applicable.

Data Availability Statement

The data will be made available upon request.

Conflicts of Interest

The authors declare no conflicts of interest.

References

  1. Yan, Y.Z.; Zhou, Z.W.; Chen, L.P.; Wei, Y.Z. Impact and Spatial Effect of Government Environmental Policy on Forestry Eco-Efficiency-Examining China’s National Ecological Civilization Pilot Zone Policy. Forests 2024, 15, 1312. [Google Scholar] [CrossRef]
  2. Ma, L.B.; Fan, J.X.; Wang, Q.; Zhao, R. Can Ecological Protection Affect High-Quality Forestry Development?—A Case Study of China. Forests 2024, 15, 1354. [Google Scholar] [CrossRef]
  3. Zhang, Z.Z.; Wang, Y.J. Empirical analysis of forestry industrial concentration level in northeast state-owned forest area. Sci. Silvae Sin. 2011, 47, 112–116. [Google Scholar]
  4. Wei, X.; Zhang, M. Empirical study on mechanism of factors influencing Chinese forestry industrial agglomeration—Based on spatial Durbin model (SDM). Resour. Dev. Mark. 2018, 34, 1731–1737. [Google Scholar]
  5. Li, H.M.; Zhang, Y.C.; Tian, G. Evaluation of the mechanism and effect of new quality productive forces in enabling high-quality forestry development. J. Agro-For. Econ. Manag. 2025, 1–13. Available online: https://oversea.cnki.net/KCMS/detail/detail.aspx?dbcode=CAPJ&dbname=CAPJLAST&filename=JNDS20250429003&uniplatform=OVERSEA&v=uECLuU7pzujK36mmwyz6zlsz8_7d8FL9DgHnkZ_4BsJQy-Z-Z97_ofnGefl3GPRX (accessed on 8 June 2025).
  6. Hou, F.M.; Wang, H.F.; Shuai, B.Y. Mechanism of Industrial Agglomeration on Chinese Wood Enterprises’ GVC(Global Value Chain) Position and Its Realization Path. Sci. Silvae Sin. 2024, 59, 137–151. [Google Scholar]
  7. Chen, J.C.; Wang, H.W.; Hou, J. The Influence Mechanism of Industrial Agglomeration on Forestry Green Total Factor Productivity from the Perspective of Financial Support. J. Beijing For. Univ. (Soc. Sci.) 2024, 23, 11–20. [Google Scholar]
  8. Hong, Y.Z.; Dai, Y.W. An Empirical Study on Forestry Industrial Cluster Identification in Fujian Province. For. Econ. 2014, 36, 84–89. [Google Scholar]
  9. Xu, R.Y.; Yang, J.Z.; Jiang, Y.T. Analysis on Agglomeration Level and Effect of the Second Industry of the Forestry in Southern Collective Forest Region. Issues For. Econ. 2012, 32, 523–527. [Google Scholar]
  10. Zhao, D. Forestry industrial agglomeration level in China. Guizhou Agric. Sci. 2015, 43, 257–261. [Google Scholar]
  11. Xia, Y.H.; Shen, W.X. Agglomeration Level Measurement, Evolution Trend and Industrial Economic Growth of China’s Forest Products Industry: An Empirical Study Based on 2003–2016 Data. World For. Res. 2018, 31, 42–46. [Google Scholar]
  12. Zeng, J.J.; Nie, Y. A Analysis of Furniture Industry Cluster Present Situation And Countermeasure Research. For. Econ. 2010, 10, 96–100. [Google Scholar]
  13. Li, X.P.; Nie, H. China’s Wood-based Panel Industrial Cluster Sptial Pattern Change. For. Econ. 2013, 8, 57–59. [Google Scholar]
  14. Chen, Z.H.; Zhu, H.G.; Zhao, W.C.; Zhao, M.H.; Zhang, Y.T. Spatial Agglomeration of China’s Forest Products Manufacturing Industry: Measurement, Characteristics and Determinants. Forests 2021, 12, 1006. [Google Scholar] [CrossRef]
  15. Wen, W.X.; Cheng, M. Study on the Agglomeration Degree of Forestry Industry during the “Thirteenth Five-year Plan” Period in Six Provinces of Central China. Trop. For. 2024, 52, 4–7+28. [Google Scholar]
  16. Liu, Y.R.; Pan, D.; Zeng, R.; Wei, L.Q. Measurement and Analysis of Guangxi Forestry Industry Agglomeration Level. Guangxi For. Sci. 2023, 52, 594–599. [Google Scholar]
  17. Tao, C.L.; Gao, Z.X.; Cheng, B.D.; Chen, F.W.; Yu, C. Enhancing wood resource efficiency through spatial agglomeration: Insights from China’s wood-processing industry. Resour. Conserv. Recycl. 2024, 203, 107453. [Google Scholar] [CrossRef]
  18. Chen, Z.G.; Cui, W.W.; Long, F. The Impact of Forestry Industry Agglomeration on Forestry Economic Growth: An Empirical Analysis Based on 11 Provinces and Autonomous Region in Southern Collective Forest Areas. J. Yunnan Agric. Univ. (Soc. Sci.) 2022, 16, 62–71. [Google Scholar]
  19. Wang, Y.H.; Wang, Y.R.; Yang, J.L.; Zhao, T.Y.; Zhang, D.H. Impact of Specialized and Diversified Agglomeration of Forestry Industry on Forestry Total Factor Productivity. Issues For. Econ. 2022, 42, 142–150. [Google Scholar]
  20. Li, L.C.; Li, F.F.; Tao, C.L.; Cheng, B.D. The impact of spatial agglomeration on export of forest products manufacturing in China: Evidence from enterprises’ data. J. Sustain. For. 2019, 38, 743–754. [Google Scholar] [CrossRef]
  21. Tao, C.L.; Cheng, B.D.; Li, L.C.; Wei, Z.R.; Zhang, Q.; Chen, F.W.; Wang, S.Y.; Yang, C. Can Spatial Agglomeration Promote Exports? The Evidence from China’s Wood-Processing Industry. Forests 2024, 15, 237. [Google Scholar] [CrossRef]
  22. Kao, C.; Yang, Y.C. Maintaining the Balance Between Production Activities and Environmental Conservation in Ecological Efficiency Assessment: Evidence from OECD Countries. Singap. Econ. Rev. 2024; early access. [Google Scholar]
  23. Zhang, J.; Li, X.Y.; Jiang, Q.L.; Li, C.S.; Li, P.; Dong, D.F.; Lin, L.S.; Lu, W.T. A study on the measurement for forest ecological benefit. J. For. Res. 2000, 11, 37–40. [Google Scholar]
  24. Luna-Vargas, S.; Pensado-Leglise, M.; Rosano-Peña, C.; Marques-Serrano, A. Socio-Eco-Efficiency in Agroforestry Production Systems: A Systematic Review. Sustainability 2024, 16, 8589. [Google Scholar] [CrossRef]
  25. Peng, J.T.; Liu, Y.H.; Xu, C.; Chen, D.B. Unveiling the Patterns and Drivers of Ecological Efficiency in Chinese Cities: A Comprehensive Study Using Super-Efficiency Slacks-Based Measure and Geographically Weighted Regression Approaches. Sustainability 2025, 16, 3112. [Google Scholar] [CrossRef]
  26. Chen, S.; Yao, S. Evaluation of forestry eco-efficiency: A spatiotemporal empirical study based on China’s Provinces. Forests 2021, 12, 142. [Google Scholar] [CrossRef]
  27. Ren, Y.; Arif, M.; Cao, Y.K.; Zhang, S.P. Pathways to enhance the efficiency of forestry ecological conservation and restoration: Empirical evidence from Heilongjiang Province, China. Front. For. Glob. Change 2024, 7, 1382198. [Google Scholar] [CrossRef]
  28. Gan, M.Q.; Li, J.Q. Study on forest ecosphere allocation and sustainable development of ecological economy in Changsha-Zhuzhou-Xiangtan urban agglomeration. J. Cent. South Univ. For. Technol. 2010, 30, 140–144. [Google Scholar]
  29. Wei, S.R.; Yu, T.; Ji, P.; Xiao, W.D.; Li, X.Y.; Zhang, N.J.; Liu, Z.W. Analysis on Ecological Network Pattern Changes in the Pearl River Delta Forest Urban Agglomeration from 2000 to 2020. Remote Sens. 2024, 16, 3800. [Google Scholar] [CrossRef]
  30. Jia, X.M. The synergistic effect of new urbanization and agricultural agglomeration. J. South China Agric. Univ. (Soc. Sci. Ed.) 2018, 17, 1–10. [Google Scholar]
  31. Fan, H.M.; Mu, H.Z. The Coupling Between Population Structure and Industrial Structure of China. Econ. Geogr. 2015, 35, 11–17. [Google Scholar]
  32. Wang, H.Y.; Liu, J.X.; Xu, Y.L. A System Coupling Analysis on the Integration of Scientific and Technological Innovation with Industrial Innovation for Sustainable Regional Development in China. Sustainability 2025, 17, 1627. [Google Scholar] [CrossRef]
  33. Wei, Z.L. Research on the coupling degree of green finance and ecological environment in Qinghai province. China For. Econ. 2022, 6, 114–118. [Google Scholar]
  34. Meng, F.Y.; Ding, S.Y. Research on the coupling and coordination relationship between rural revitalization and high-quality agricultural development. Stat. Decis. 2024, 40, 79–83. [Google Scholar]
  35. Lu, J.H.; Cai, X.T. Spatial-temporal coupling measurement of forest ecological security and forestry industrial structure at provincial level. World For. Res. 2019, 32, 34–39. [Google Scholar]
  36. Bi, G.H.; Yang, Q.Y.; Liu, S. Coupling Coordination Development between Ecological Civilization Construction and Urbanization in China. Econ. Geogr. 2017, 37, 50–58. [Google Scholar]
Figure 1. Mechanism diagram of the coupling between forestry industry agglomeration and eco-efficiency.
Sustainability 17 05390 g001
Figure 2. Frequency distribution of coupling coordination degree between forestry industry agglomeration and eco-efficiency.
Sustainability 17 05390 g002
Figure 3. Frequency distribution of relative development status between forestry industry agglomeration and eco-efficiency.
Sustainability 17 05390 g003
Figure 4. Frequency distribution of coupling and coordinated development between forestry industry agglomeration and eco-efficiency.
Sustainability 17 05390 g004
Figure 5. Integrated contour map of coupling coordination and relative development degrees. (a) Contour map of coupling coordination degree; (b) contour map of relative development degree.
Sustainability 17 05390 g005
Figure 6. Schematic diagram of equilibrium intervals.
Sustainability 17 05390 g006
Table 1. Comprehensive evaluation index system for forestry industry agglomeration.
Level 1 IndicatorsLevel 2 IndicatorsUnitAttributeWeight
Aggregation levelForestry employment-population agglomeration degree%+0.3570
Forestry industry agglomeration degree%+0.1399
Aggregation structureRatio of forestry to non-forestry employment population%+0.3607
Ratio of forestry to non-forestry output value%+0.1423
Table 2. Comprehensive evaluation index system for eco-efficiency.
Level 1 IndicatorsLevel 2 IndicatorsUnitAttributeWeight
Eco-efficiency pressure indicatorsInvestment in forestry fixed assetsCNY0.0122
Forest coverage rate%+0.0519
Eco-efficiency state indicatorsAfforestation areahectare+0.0796
Forest tending areahectare+0.0874
Wastewater discharge amountten thousand tons0.0185
Exhaust gas emissions amountten thousand tons0.0242
Eco-efficiency response indicatorsTotal forestry output valueCNY+0.1523
Forestry tourism revenueten thousand yuan+0.1600
Number of employees persons+0.3467
Per capita water resources cubic meters per person+0.0672
Table 3. Standards for the classification of coupling coordination development stages and types between forestry industry agglomeration and eco-efficiency.
Coupling Coordination DegreeRelative Development DegreeTypeCharacteristics of Coupling Coordination DevelopmentDevelopment Stage
0 D < 0.5 0 < γ 0.8 IForestry industry agglomeration lags behind eco-efficiency, with high antagonism between the two.Antagonism
0.8 < γ 1.2 IIForestry industry agglomeration synchronizes with eco-efficiency and has a low antagonism between the two.
γ > 1.2 IIIForestry industry agglomeration precedes eco-efficiency, with high antagonism between the two.
0.5 D < 0.7 0 < γ 0.8 IVForestry industry agglomeration lags behind eco-efficiency, with low running-in between the two.Running-in
0.8 < γ 1.2 VForestry industry agglomeration synchronizes with eco-efficiency, with high running-in between the two.
γ > 1.2 VIForestry industry agglomeration precedes eco-efficiency, with low running-in between the two.
0.7 D < 1 0 < γ 0.8 VIIForestry industry agglomeration lags behind eco-efficiency, with low coordination between the two.Coordination
0.8 < γ 1.2 VIIIForestry industry agglomeration synchronizes with eco-efficiency, with high coordination between the two.
γ > 1.2 IXForestry industry agglomeration precedes eco-efficiency, with low coordination between the two.
Table 4. Results of the coupling coordination development measurement between forestry industry agglomeration and eco-efficiency.
Province20122015201820212023
DγTypeDγTypeDγTypeDγTypeDγType
Beijing0.260.41I0.260.37I0.290.42I0.330.47I0.280.40I
Tianjin0.070.01I0.120.04I0.150.08I0.150.05I0.120.03I
Hebei0.270.30I0.310.45I0.360.41I0.350.62I0.290.39I
Shanxi0.300.68I0.340.94II0.350.92II0.400.68I0.310.53I
Neimenggu0.591.39VI0.651.70VI0.541.26VI0.491.23III0.471.35III
Liaoning0.330.40I0.370.54I0.350.81II0.300.71I0.270.59I
Jilin0.541.47VI0.572.12VI0.541.87VI0.521.87VI0.473.63III
Heilongjiang0.712.07IX0.732.62IX0.752.56IX0.742.73IX0.595.78VI
Shanghai0.110.34I0.070.01I0.080.01I0.090.01I0.140.05I
Jiangsu0.220.16I0.220.20I0.230.23I0.220.19I0.280.35I
Zhejiang0.280.17I0.300.16I0.310.17I0.290.13I0.360.43I
Anhui0.370.47I0.420.61I0.430.54I0.430.53I0.410.76I
Fujian0.410.50I0.430.61I0.470.49I0.450.47I0.460.83II
Jiangxi0.490.78I0.520.84V0.530.77IV0.530.65IV0.620.55IV
Shandong0.250.15I0.250.25I0.270.27I0.270.38I0.330.59I
Henan0.260.27I0.280.36I0.290.26I0.280.28I0.290.46I
Hubei0.310.29I0.370.36I0.390.34I0.390.44I0.410.60I
Hunan0.450.43I0.480.48I0.510.49IV0.480.55I0.430.73I
Guangdong0.330.11I0.360.13I0.370.15I0.360.21I0.380.31I
Guangxi0.470.82II0.520.98V0.560.91V0.630.70IV0.561.11V
Hainan0.472.37III0.462.11III0.482.15III0.461.74III0.400.65I
Chongqing0.260.25I0.280.29I0.330.33I0.360.39I0.320.44I
Sichuan0.350.29I0.390.34I0.460.44I0.430.43I0.380.63I
Guizhou0.340.55I0.430.74I0.530.73IV0.520.97V0.471.35III
Yunan0.460.73I0.510.91V0.531.12V0.511.13V0.471.12II
Xizang0.480.30I0.380.10I0.430.17I0.380.11I0.390.16I
Shanxi0.330.45I0.360.52I0.370.54I0.370.38I0.360.56I
Gansu0.330.96II0.371.02II0.380.99II0.370.94II0.351.25III
Qinghai0.330.90II0.371.04II0.462.00III0.421.05II0.361.12II
Ningxia0.310.95II0.321.33III0.321.45III0.320.74I0.311.12II
Xinjiang0.350.45I0.340.73I0.360.57I0.380.71I0.340.84II
Disclaimer/Publisher’s Note: The statements, opinions and data contained in all publications are solely those of the individual author(s) and contributor(s) and not of MDPI and/or the editor(s). MDPI and/or the editor(s) disclaim responsibility for any injury to people or property resulting from any ideas, methods, instructions or products referred to in the content.

