Article

A Place-Based County-Level Study of Air Quality and Health in Urban Communities

1
Biomedical Engineering, University of Houston, Houston, TX 77204-5060, USA
2
Civil and Environmental Engineering, University of Houston, Houston, TX 77204-4003, USA
*
Author to whom correspondence should be addressed.
Sustainability 2025, 17(12), 5368; https://doi.org/10.3390/su17125368
Submission received: 11 May 2025 / Revised: 30 May 2025 / Accepted: 6 June 2025 / Published: 11 June 2025
(This article belongs to the Section Health, Well-Being and Sustainability)

Abstract

This study investigates the relationships between air quality, social vulnerability, and health outcomes at the census tract-level in Harris County, Texas. Spatial and regression analyses were conducted using sociodemographic data, air quality indicators, including PM2.5, diesel particulate matter (DPM), nitrogen dioxide (NO2), and ozone, and health metrics, such as coronary heart disease, chronic obstructive pulmonary disease (COPD), asthma, and stroke prevalence. The results indicated variability in sociodemographic challenges, air pollution, and health outcomes. Social vulnerability strongly correlated with increased prevalence of respiratory and cardiovascular diseases, notably COPD, asthma, and stroke. The air quality metrics showed significant geospatial variability: PM2.5 and NO2 were concentrated centrally near transportation corridors, DPM was elevated near eastern industrial regions, and ozone peaked in western parts of the county, potentially due to atmospheric transport and photochemical processes. PM2.5 exposure significantly correlated with increased cardiovascular and respiratory health outcomes, particularly at elevated concentrations. In contrast, ozone demonstrated a plateauing effect, increasing the health risks but with a diminishing impact at higher concentrations. The correlations between social vulnerability and air quality were modest, suggesting homogenous distributions of PM2.5, NO2, and DPM across socioeconomically diverse areas, whereas ozone exposure slightly increased with higher social vulnerability. The findings pointed to the complexity of spatial relationships between socioeconomic status, air pollution, and health, highlighting the need for additional monitoring and targeted interventions to improve health outcomes in socio-demographically and economically challenged communities.

1. Introduction

Air pollution is a significant public health and environmental concern in the United States, where industrial emissions, vehicular traffic, and energy production remain the dominant sources of air quality degradation [1,2]. Key pollutants include particulate matter (PM2.5 and PM10) [3], nitrogen oxides (NOx) [4], sulfur dioxide (SO2) [5], carbon monoxide (CO) [6], and ozone (O3) [7], all of which are known to contribute to adverse health effects and environmental harm. Particulate matter, especially PM2.5, is a complex mixture of extremely small particles and liquid droplets composed of acids, organic chemicals, metals, and soil or dust particles, which can penetrate deep into the lungs and even enter the bloodstream [3]. NOx and SO2 are primarily emitted from motor vehicles, industrial activities, and fossil fuel combustion [4]. Ozone forms when NOx and volatile organic compounds (VOCs) react in the atmosphere, contributing to smog and harming lung function at ground level [7]. In industrial regions like many parts of Texas, where petrochemical industries and vehicular traffic are prevalent, these pollutants frequently exceed federal air quality standards, contributing to the region’s air quality challenges [8,9].
The health impacts of poor air quality have been extensively researched, with strong evidence linking the long-term exposure to pollutants such as PM2.5 and ozone to cardiovascular and respiratory diseases. Several studies have shown that chronic exposure to air pollution increases the incidence of ischemic heart disease [9,10], myocardial infarction [11,12], and stroke [13,14]. A systematic review by Chen and Hoek [15] concluded that exposure to fine particulate matter contributes significantly to cardiovascular morbidity and mortality, while recent studies link air pollution with arrhythmias and heart failure [16]. Respiratory diseases, including asthma and chronic obstructive pulmonary disease (COPD), are also exacerbated by poor air quality, with particulate matter and ozone playing a key role in triggering exacerbations and increasing hospitalizations [17,18,19,20]. Beyond cardiopulmonary effects, emerging research has demonstrated links between air pollution and neurological disorders, such as cognitive decline [21,22], depression [23,24], and neuroinflammation [25,26]. Furthermore, air pollution has been implicated in the progression of chronic kidney disease (CKD) [27,28,29], highlighting its widespread impact on human health.
While significant improvements in air quality have been achieved over the past three decades through environmental regulations [30], research indicates that these benefits have not been realized across all communities in the United States [31,32]. Low-income communities and communities of color are disproportionately exposed to air pollution due to their proximity to industrial sites, highways, and other sources of emissions. Studies have consistently shown that communities near petrochemical refineries and chemical plants face higher risks for diseases such as asthma, cardiovascular disease, and cancer [33,34]. For example, during the 2019 Intercontinental Terminals Company (ITC) fire in Houston, the benzene levels in nearby communities exceeded safe exposure thresholds, intensifying the already-elevated health risks associated with chronic exposure to air pollution in these areas [35].
Similarly, neighborhoods near metal recycling facilities in Houston have experienced inequitable exposure to harmful pollutants, with community complaints leading to studies showing elevated cancer risks from metal emissions [36,37]. In a related biomonitoring study, higher urinary concentrations of metals such as arsenic and manganese were detected among children living in impacted communities in Houston [38]. In addition, the Maternal and Infant Environmental Health Riskscape study found that Black and Hispanic communities in Houston, located closer to industrial pollution sources, face higher exposure to environmental toxins like polycyclic aromatic hydrocarbons (PAHs), which are associated with adverse birth outcomes and respiratory diseases [39]. The cumulative impact of air pollution and social challenges in these communities is exacerbated by limited access to healthcare, compounding the adverse health outcomes associated with chronic exposure to pollutants.
While substantial research exists on air quality and health outcomes, the integration of these two domains remains limited. The relationships between air quality and the associated health influencing factors are not fully understood, particularly how air quality contributes to adverse health outcomes in urban communities, especially those with relatively high industrial activity such as in Houston, Texas. This gap in knowledge becomes increasingly significant in the context of climate variability, extreme events, and natural disasters, where worsening air quality, combined with extreme heat, for example, is projected to exacerbate public health challenges. These factors are especially relevant to Harris County, which is vulnerable to numerous extreme events annually and experiencing an increase in the frequency and severity of such events. The relationship and/or impact of these events on population health is the subject of several ongoing studies from the research team in this work and others. It is noted that data on the exacerbation of air quality due to extreme events continue to emerge around the globe. So for example, a 21-year-long observation study in Seoul found that ozone levels increased by 17.2% during heat waves, heightening the risk of respiratory challenges in affected populations [40].
The current study aims to bridge the gap in the lack of integration of air quality and health outcomes. This study, more specifically, aims to explore the relationship between air quality and health outcomes at the county level to better understand how air pollution contributes to adverse health outcomes at the community level. Harris County in Texas is used as a pilot study metroplex, one that could serve as a model for similar studies locally here in the US or globally elsewhere. The region regularly experiences elevated levels of ozone and fine particulate matter, driven by industrial activities (e.g., petrochemical refining) and high traffic volumes [41,42]. Recent studies, including an empirical evaluation of ozone interpolation procedures in Houston, have demonstrated that ozone levels can vary significantly even within the same urban area, depending on air quality monitor proximity [43,44]. This variation highlights the need for including spatial analyses when assessing pollution exposure and monitoring concentrations using monitoring network data that provide more statistical power [45]. If spatial analyses are not considered, the lack of accounting for differences in exposure may mask the true extent of health risks in affected communities. By examining spatial variability in pollution exposure and the associated health impacts, this research seeks to fill a critical gap in understanding how differences in exposure affect the health of populations and communities in urban areas such as the City of Houston that have had a long history of industrial activities and economic growth and development over the past three decades. It is noted that while the manuscript does not address corrective measures for air quality improvements, numerous studies have been undertaken that demonstrate novel technologies that can be used for this purpose [46,47,48].

2. Materials and Methods

This study investigates the intricate relationships between air quality and health within the urban environment of Harris County, Texas, which includes the City of Houston. The analysis includes the time frame from 2014 to 2022 for health data, utilizes 2019 sociodemographic data, and employs the time frame from 2014 to 2022 for air quality data. The use of 2019 sociodemographic data was necessary for consistency with the geospatial discretization of the health and air quality data.

2.1. Study Area

As the most populous county in Texas, covering 1778 square miles (4605 km2) and home to over 4.7 million residents, Harris County features a diverse mix of urban, suburban, and industrial zones [49]. The county faces significant environmental challenges, including frequent flooding, poor air quality, extreme heat, and winter storms [50]. These issues disproportionately affect Houston’s communities, leading to health disparities and pollution concerns [51]. Figures S1–S3 in the Supplementary Information (SI) illustrate the population and income distribution in Harris County. The data in the Figures illustrate a range of population estimates from 0 to 29,000 persons per census tract with a median income ranging from USD 2500 to USD 250,000 per year. Low-income families in Harris County reside in the inner core of the county with some census tracts having near 75% of their population below the poverty level.
The City of Houston occupies the majority of the county and has defined Super Neighborhoods [52] in an effort to encourage residents of communities to work together on common challenges. The city additionally developed the Complete Communities [53] program to ensure that communities have access to quality services and amenities. Each of the communities has developed relevant datasets that describe their community (e.g., transportation, undeveloped land, and education levels) in addition to action plans that identify community vulnerabilities and actions needed to reduce them. Each community has implemented a collaborative community-driven planning method for adopting the developed action plans that guides policy development and city-level interventions. Thus, while both programs are important from a municipal context standpoint, geographically, they are somewhat mismatched with national contexts that operate from a census tract geospatial unit. Therefore, in this project, communities are defined using geographic boundaries based on their census tracts in order to better align with the granularity of the data sources used in the study.

2.2. Sociodemographic Data

Sociodemographic data were sourced from the American Community Survey (ACS) and other local government databases [54]. Additional sociodemographic data were derived from the Centers for Disease Control and Prevention (CDC) Social Vulnerability Index [55].

2.3. Air Quality Data

Air quality data for the study were sourced from the U.S. Environmental Protection Agency (EPA) [56]. The EPA operates 21 air quality monitors in and around Houston which report concentrations of CO, NO2, O3, SO2, PM10, and PM2.5 daily. These daily monitor data were compiled for the period 2014–2022, matching the years for which the CDC PLACES Program has reported health data. Because of the small number of air quality monitors in Houston, model data has been included in the analysis to supplement the monitor data. The Air Quality Index (AQI) model, developed by the EPA, gives a county-level assessment of air quality based on predicted CO, NO2, SO2, PM10, and PM2.5 concentrations. Daily AQI values for Harris County for the period 2015–2021 have been compiled for the study.

2.4. Health Data

Health data were derived from the CDC PLACES dataset [57], which provides model-based estimates at multiple geographic levels, including county and census tract resolutions (used in the current study). The dataset includes 36 health-related measures: 13 health outcomes, 9 preventive service utilizations, 4 chronic disease-related behaviors, 7 disability indicators, and 3 overall health status metrics. The construction of these model-based estimates leverages data from the Behavioral Risk Factor Surveillance System (BRFSS) for the years 2020 and 2021, supplemented by the Census Bureau’s 2010 population figures and the American Community Survey’s 2019–2024 estimates. Notably, the 2023 release of the dataset utilizes 2021 BRFSS data for 29 measures and 2020 data for an additional 7 measures, which include critical screenings and health behaviors assessed biennially by the BRFSS.

2.5. Correlation Analyses, Geospatial, and Geostatistical Modeling

Correlation analyses between health and sociodemographic data, health and air quality data, and sociodemographic and air quality data were performed in Microsoft Excel. These correlation analyses involved plotting each census tract in Harris County with variables from the datasets being compared on each axis. For the health and sociodemographic correlations, 10 of the health-related measures from CDC PLACES and 3 sociodemographic variables from ACS, as well as the Social Vulnerability Index (SVI) value, were used in the analysis. For the health and air quality correlations, the same health measures were correlated with air quality data from EPA’s EJSCREEN. Sociodemographic and air quality correlation analyses involved correlating the SVI value for each census tract with the EJSCREEN air quality data for each census tract.
The City of Houston has identified 10 neighborhoods, 9 of which are in Harris County, as Complete Communities. These neighborhoods have been historically underserved and are being given special attention by the city to increase their resilience and decrease their vulnerability. As part of this work, we have outlined the extents of the 9 Complete Communities on figures in this manuscript and illustrated how these neighborhoods compared to the county as a whole.

3. Results

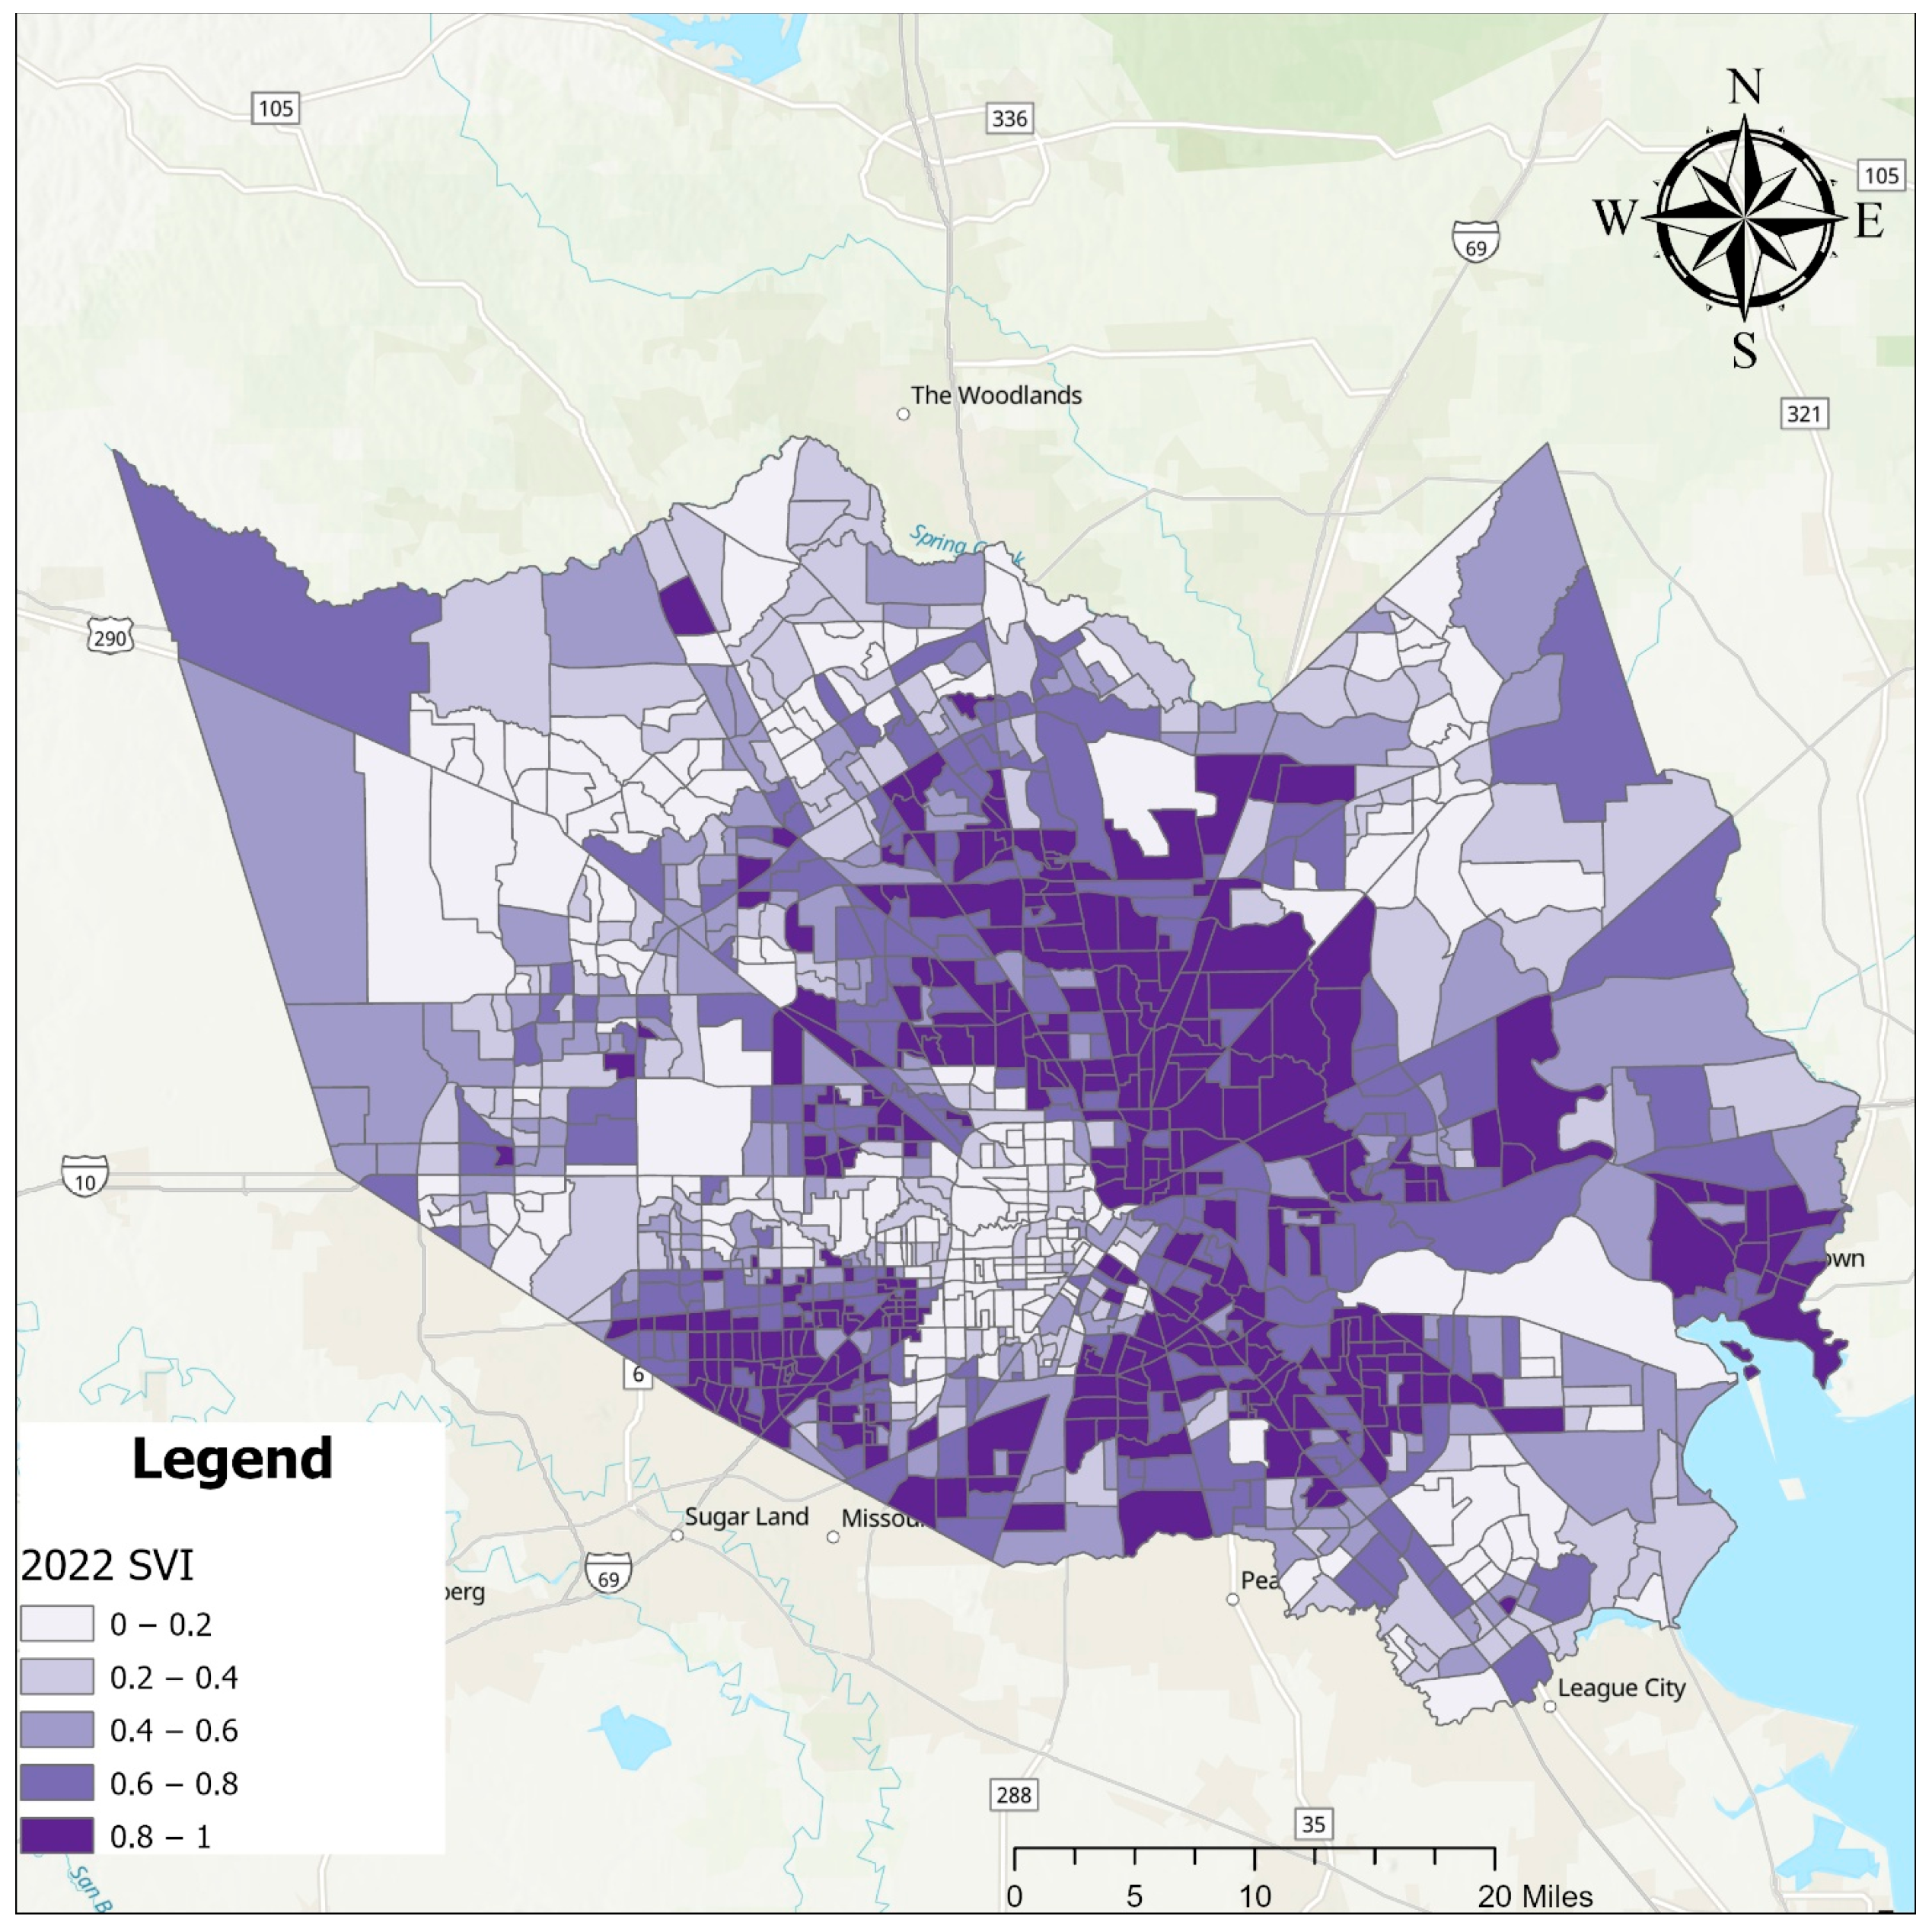
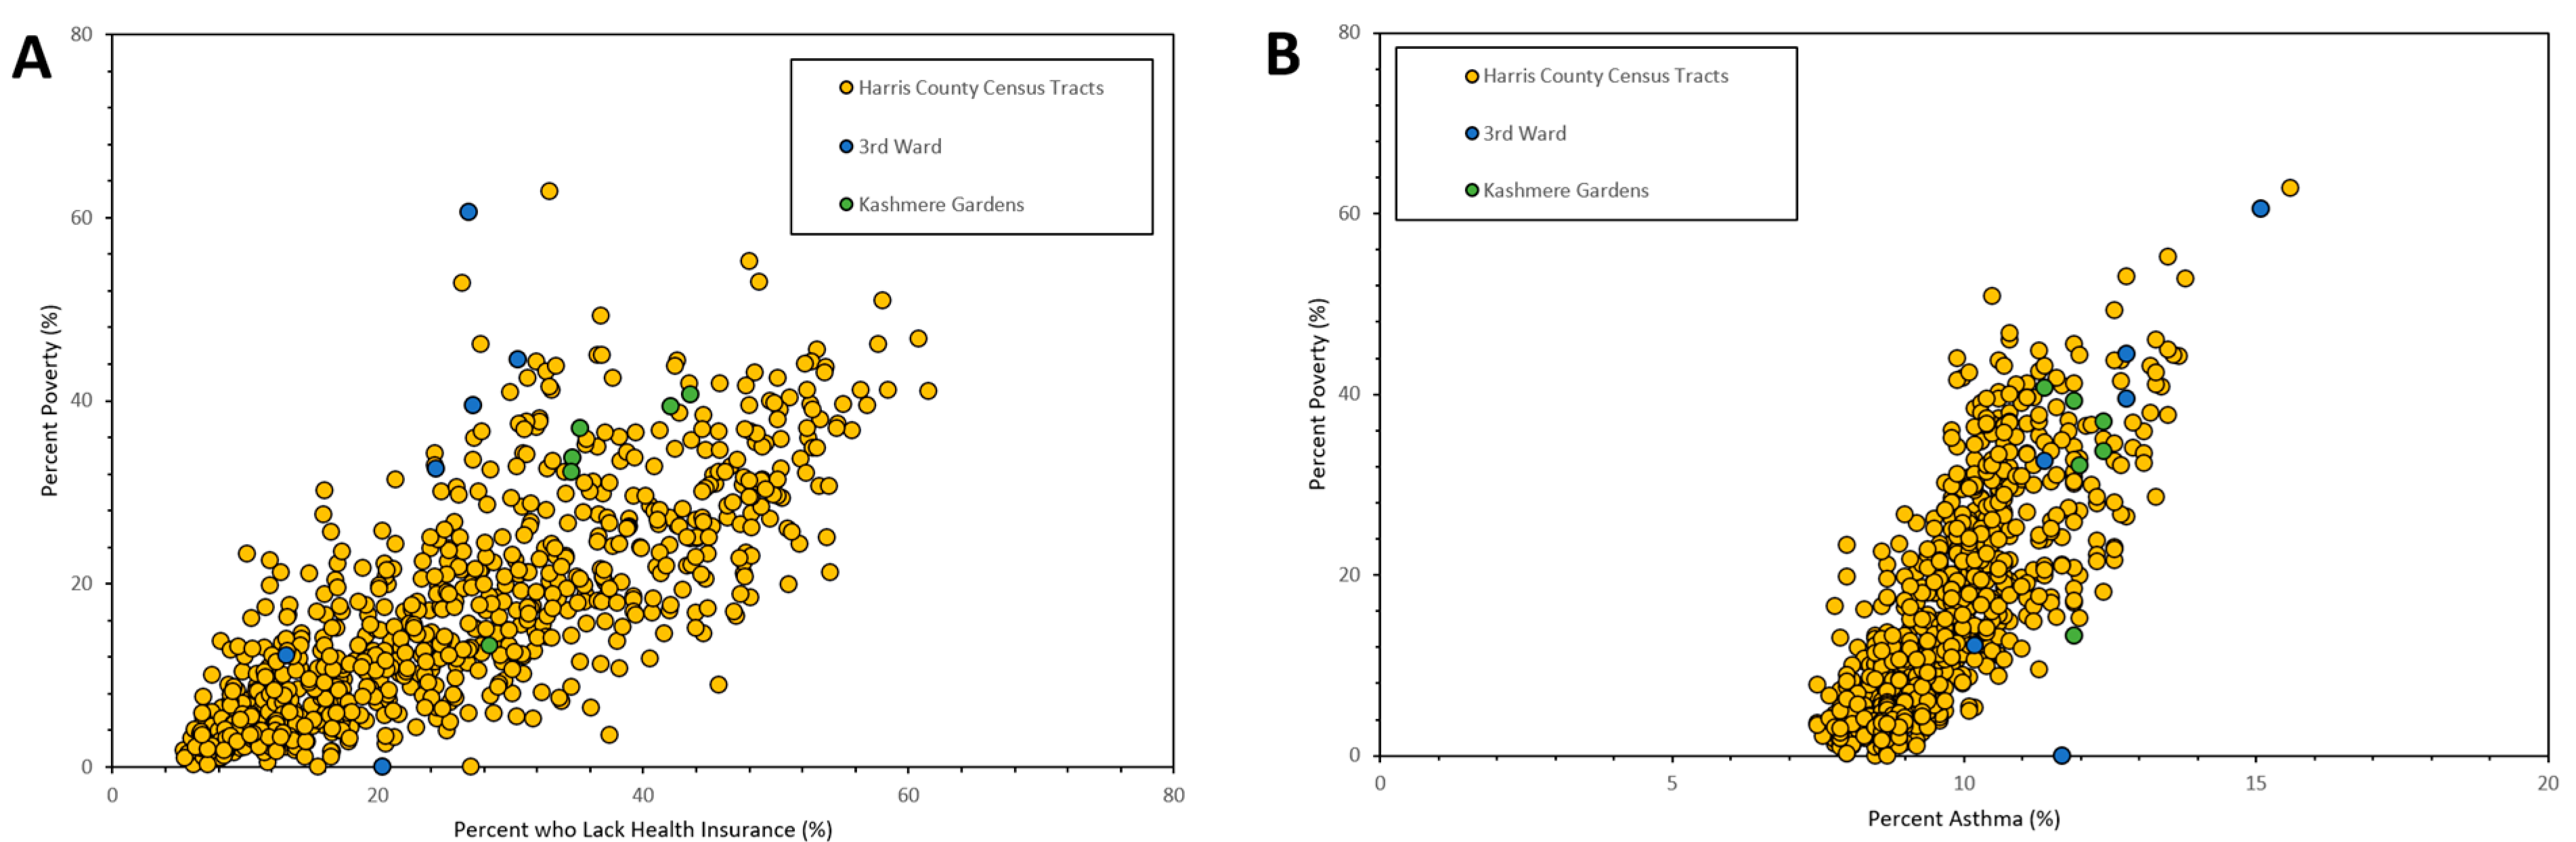
3.1. Geospatial Sociodemographic Analysis

Figure 1 illustrates the geospatial distribution of the SVI across Harris County. The map highlights a crescent-shaped cluster of areas with the highest SVI values (0.8–1.0), indicating regions with the greatest social vulnerability. However, these high-SVI areas are not uniformly distributed across the county. The eastern part of Harris County predominantly exhibits higher SVI values (>0.8), while other regions display stark contrasts, with some areas having very low SVI (<0.2), all within the same county. This spatial disparity highlights the uneven distribution of social and economic stressors, which may contribute to differences in environmental exposure and health risks across communities.

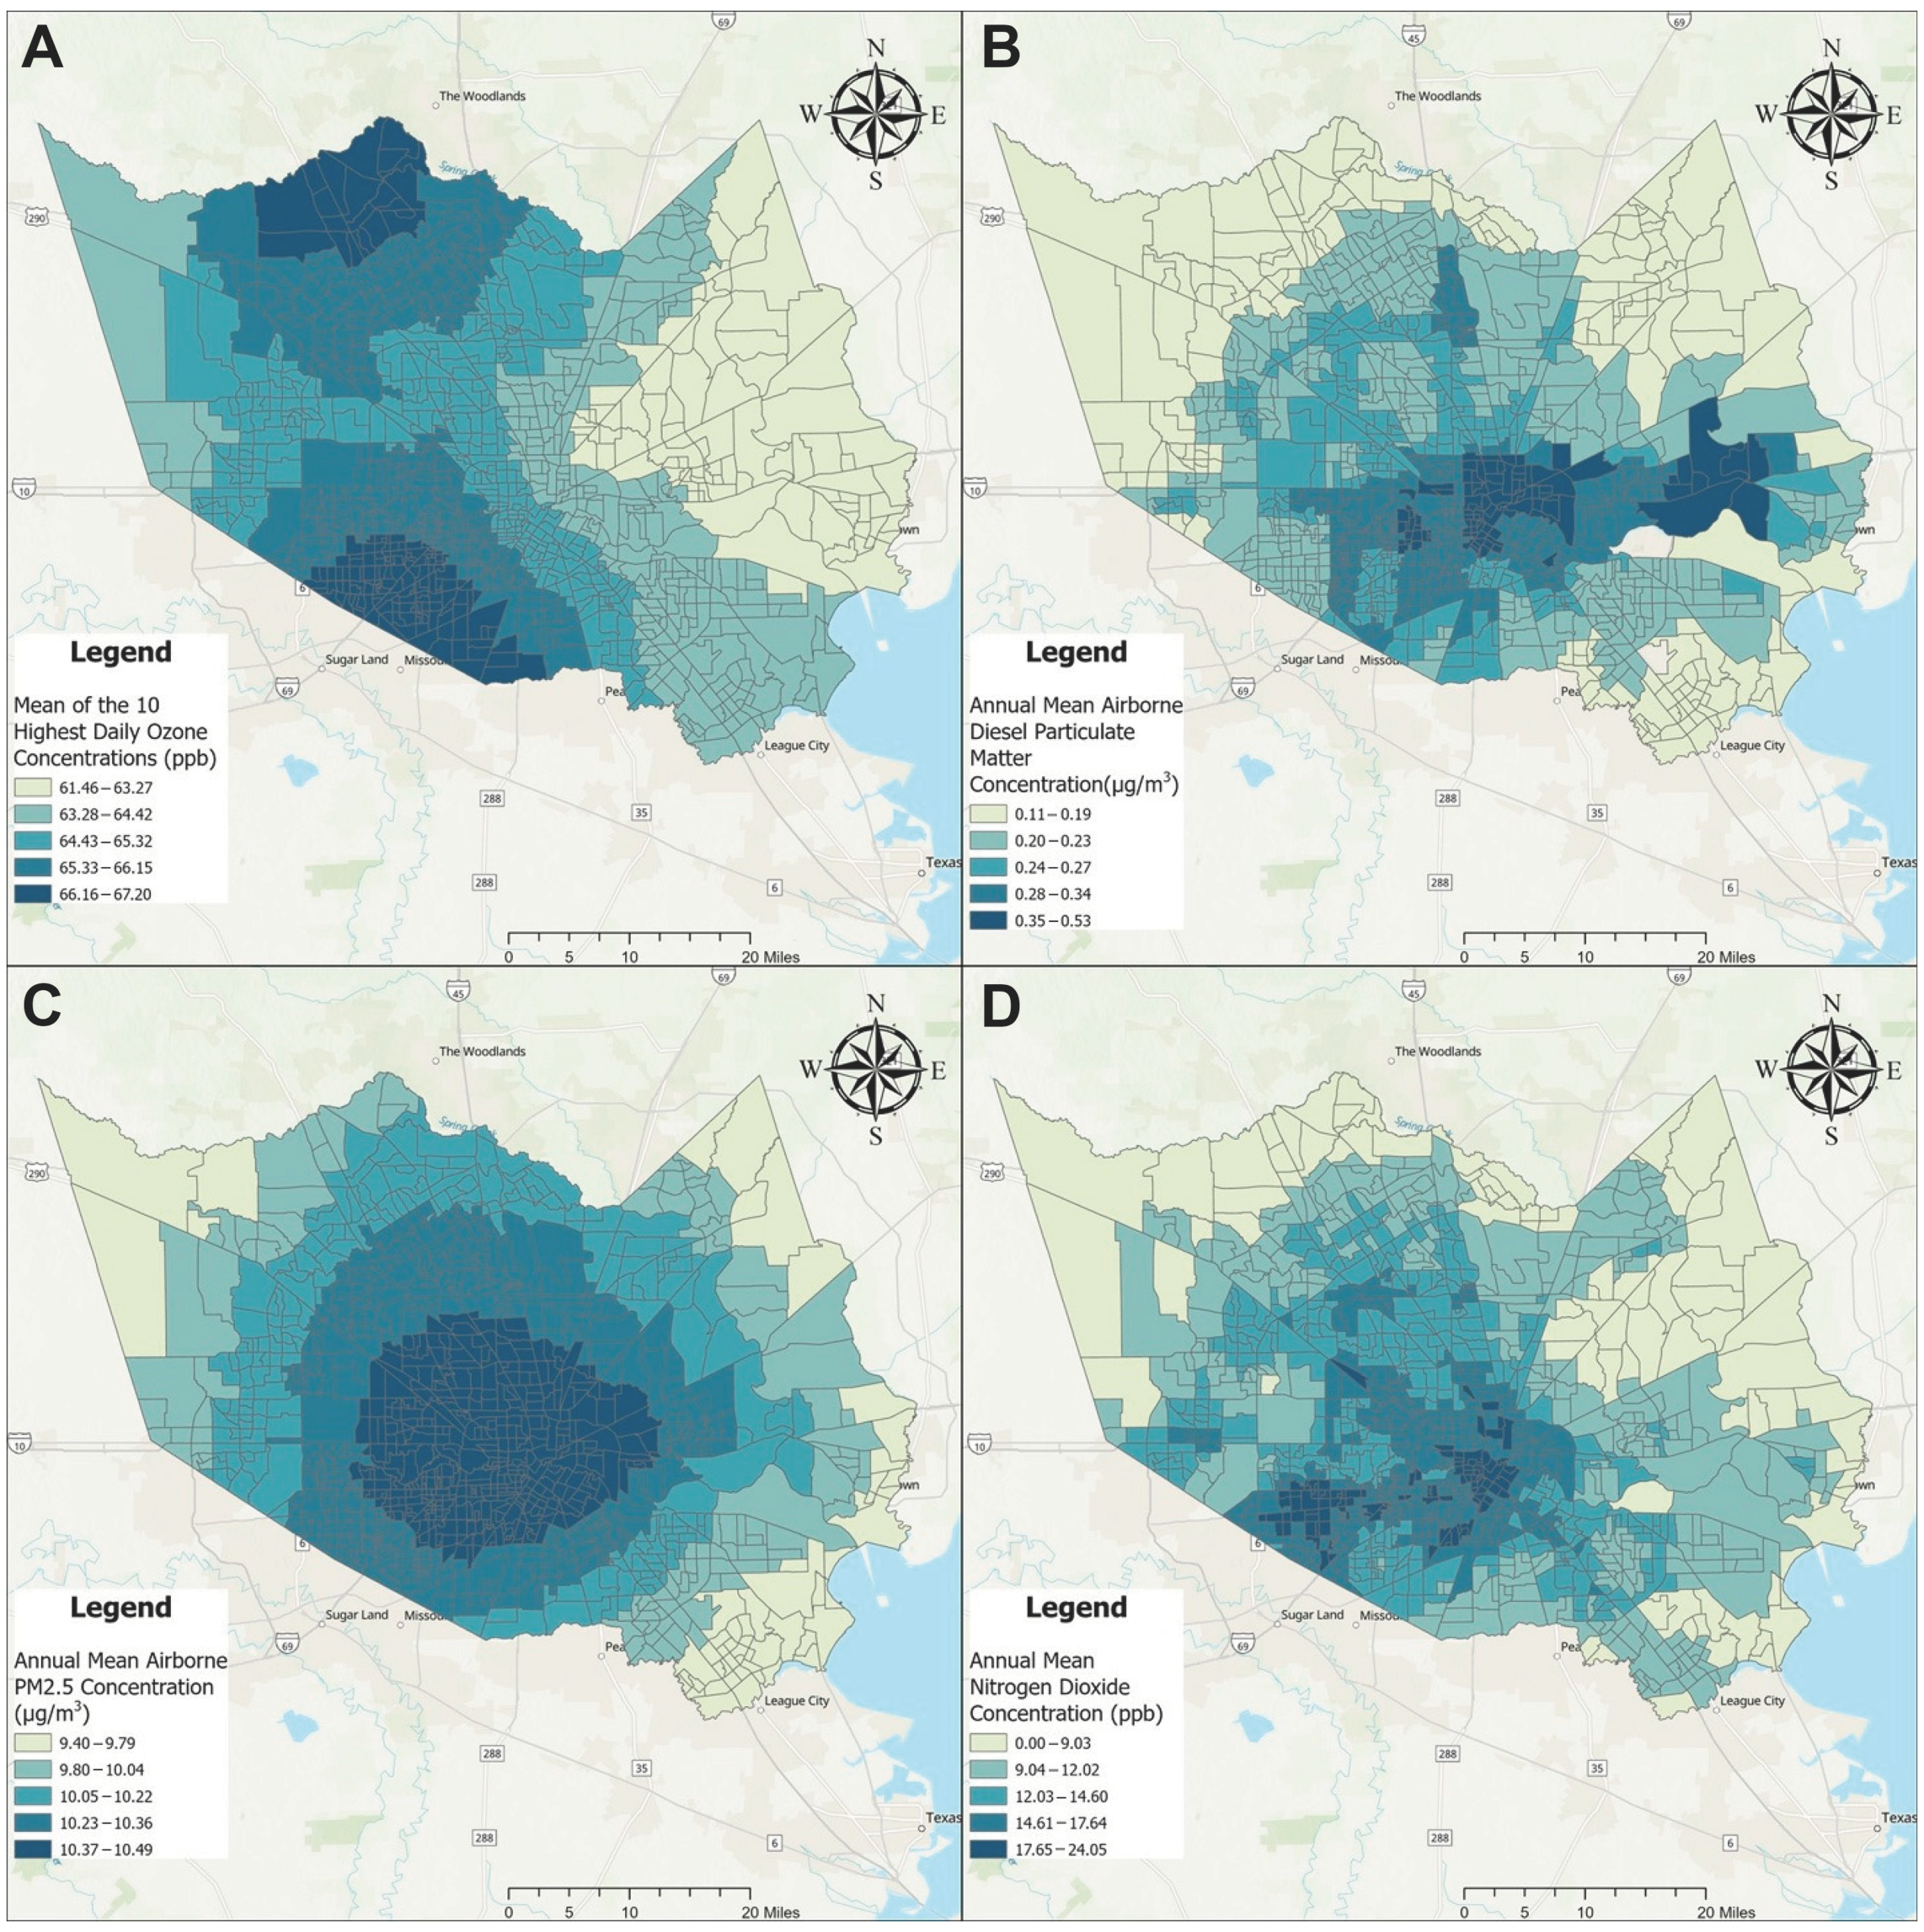
3.2. Geospatial Air Quality Measures

The analysis indicated that air quality varies significantly across different geographic areas in the county due to the influence of industrial activity, vehicular emissions, and meteorological conditions. Figure 2 illustrates the spatial patterns of air pollution levels in the county by depicting key air quality indicators, including particulate matter (PM2.5), diesel particulate matter (DPM), nitrogen dioxide (NO2), and ozone concentrations. PM2.5 levels demonstrated a strong spatial concentration in the central areas of Harris County, particularly in regions with dense traffic (Figure 2A). These regions frequently exceed the U.S. EPA’s regulatory standards, posing significant public health risks. High levels of DPM were mostly observed in the eastern part of Harris County, home to industrialized zones, with the emissions likely stemming from both petrochemical facilities and heavy-duty transportation corridors (Figure 2B).
The spatial patterns of NO2 showed predominantly high levels in the central region of Harris County, with localized hotspots of elevated concentrations in the southwestern parts, particularly near the Blaire area in Houston (Figure 2C). Overall, NO2 distribution follows a similar trend to PM2.5, with the highest concentrations observed in densely populated urban centers and along major transportation corridors. The localized high concentrations near the Bellaire area can be attributed to several contributing factors. This region is characterized by a high density of road networks, including major highways and intersections, which are significant sources of NO2 emissions due to vehicular exhaust. Additionally, the presence of industrial facilities and logistics hubs in the vicinity likely exacerbates NO2 levels through emissions from manufacturing processes and heavy-duty diesel truck traffic. Meteorological conditions, such as lower wind speeds and temperature inversions, may further contribute to the accumulation of pollutants in this area, preventing effective dispersion.
The spatial distribution of ozone in Harris County is highly disproportionate, with the western region experiencing notably higher concentrations compared with other areas (Figure 2D). Several factors likely contribute to this pattern. First, prevailing wind patterns in the region tend to transport ozone precursors—such as nitrogen oxides (NOx) and volatile organic compounds (VOCs)—from urban and industrial sources in central and eastern Harris County toward the western areas, where photochemical reactions lead to ozone formation. Additionally, suburban and rural areas in western Harris County experience lower nitrogen dioxide (NO2) levels, which can limit ozone scavenging and result in higher ambient ozone concentrations. Meteorological conditions, including higher temperatures and increased solar radiation, further enhance photochemical ozone production, particularly during warmer months. Some areas within western Harris County exceed 66 ppb, surpassing regulatory standards and posing potential health risks, particularly for vulnerable populations.

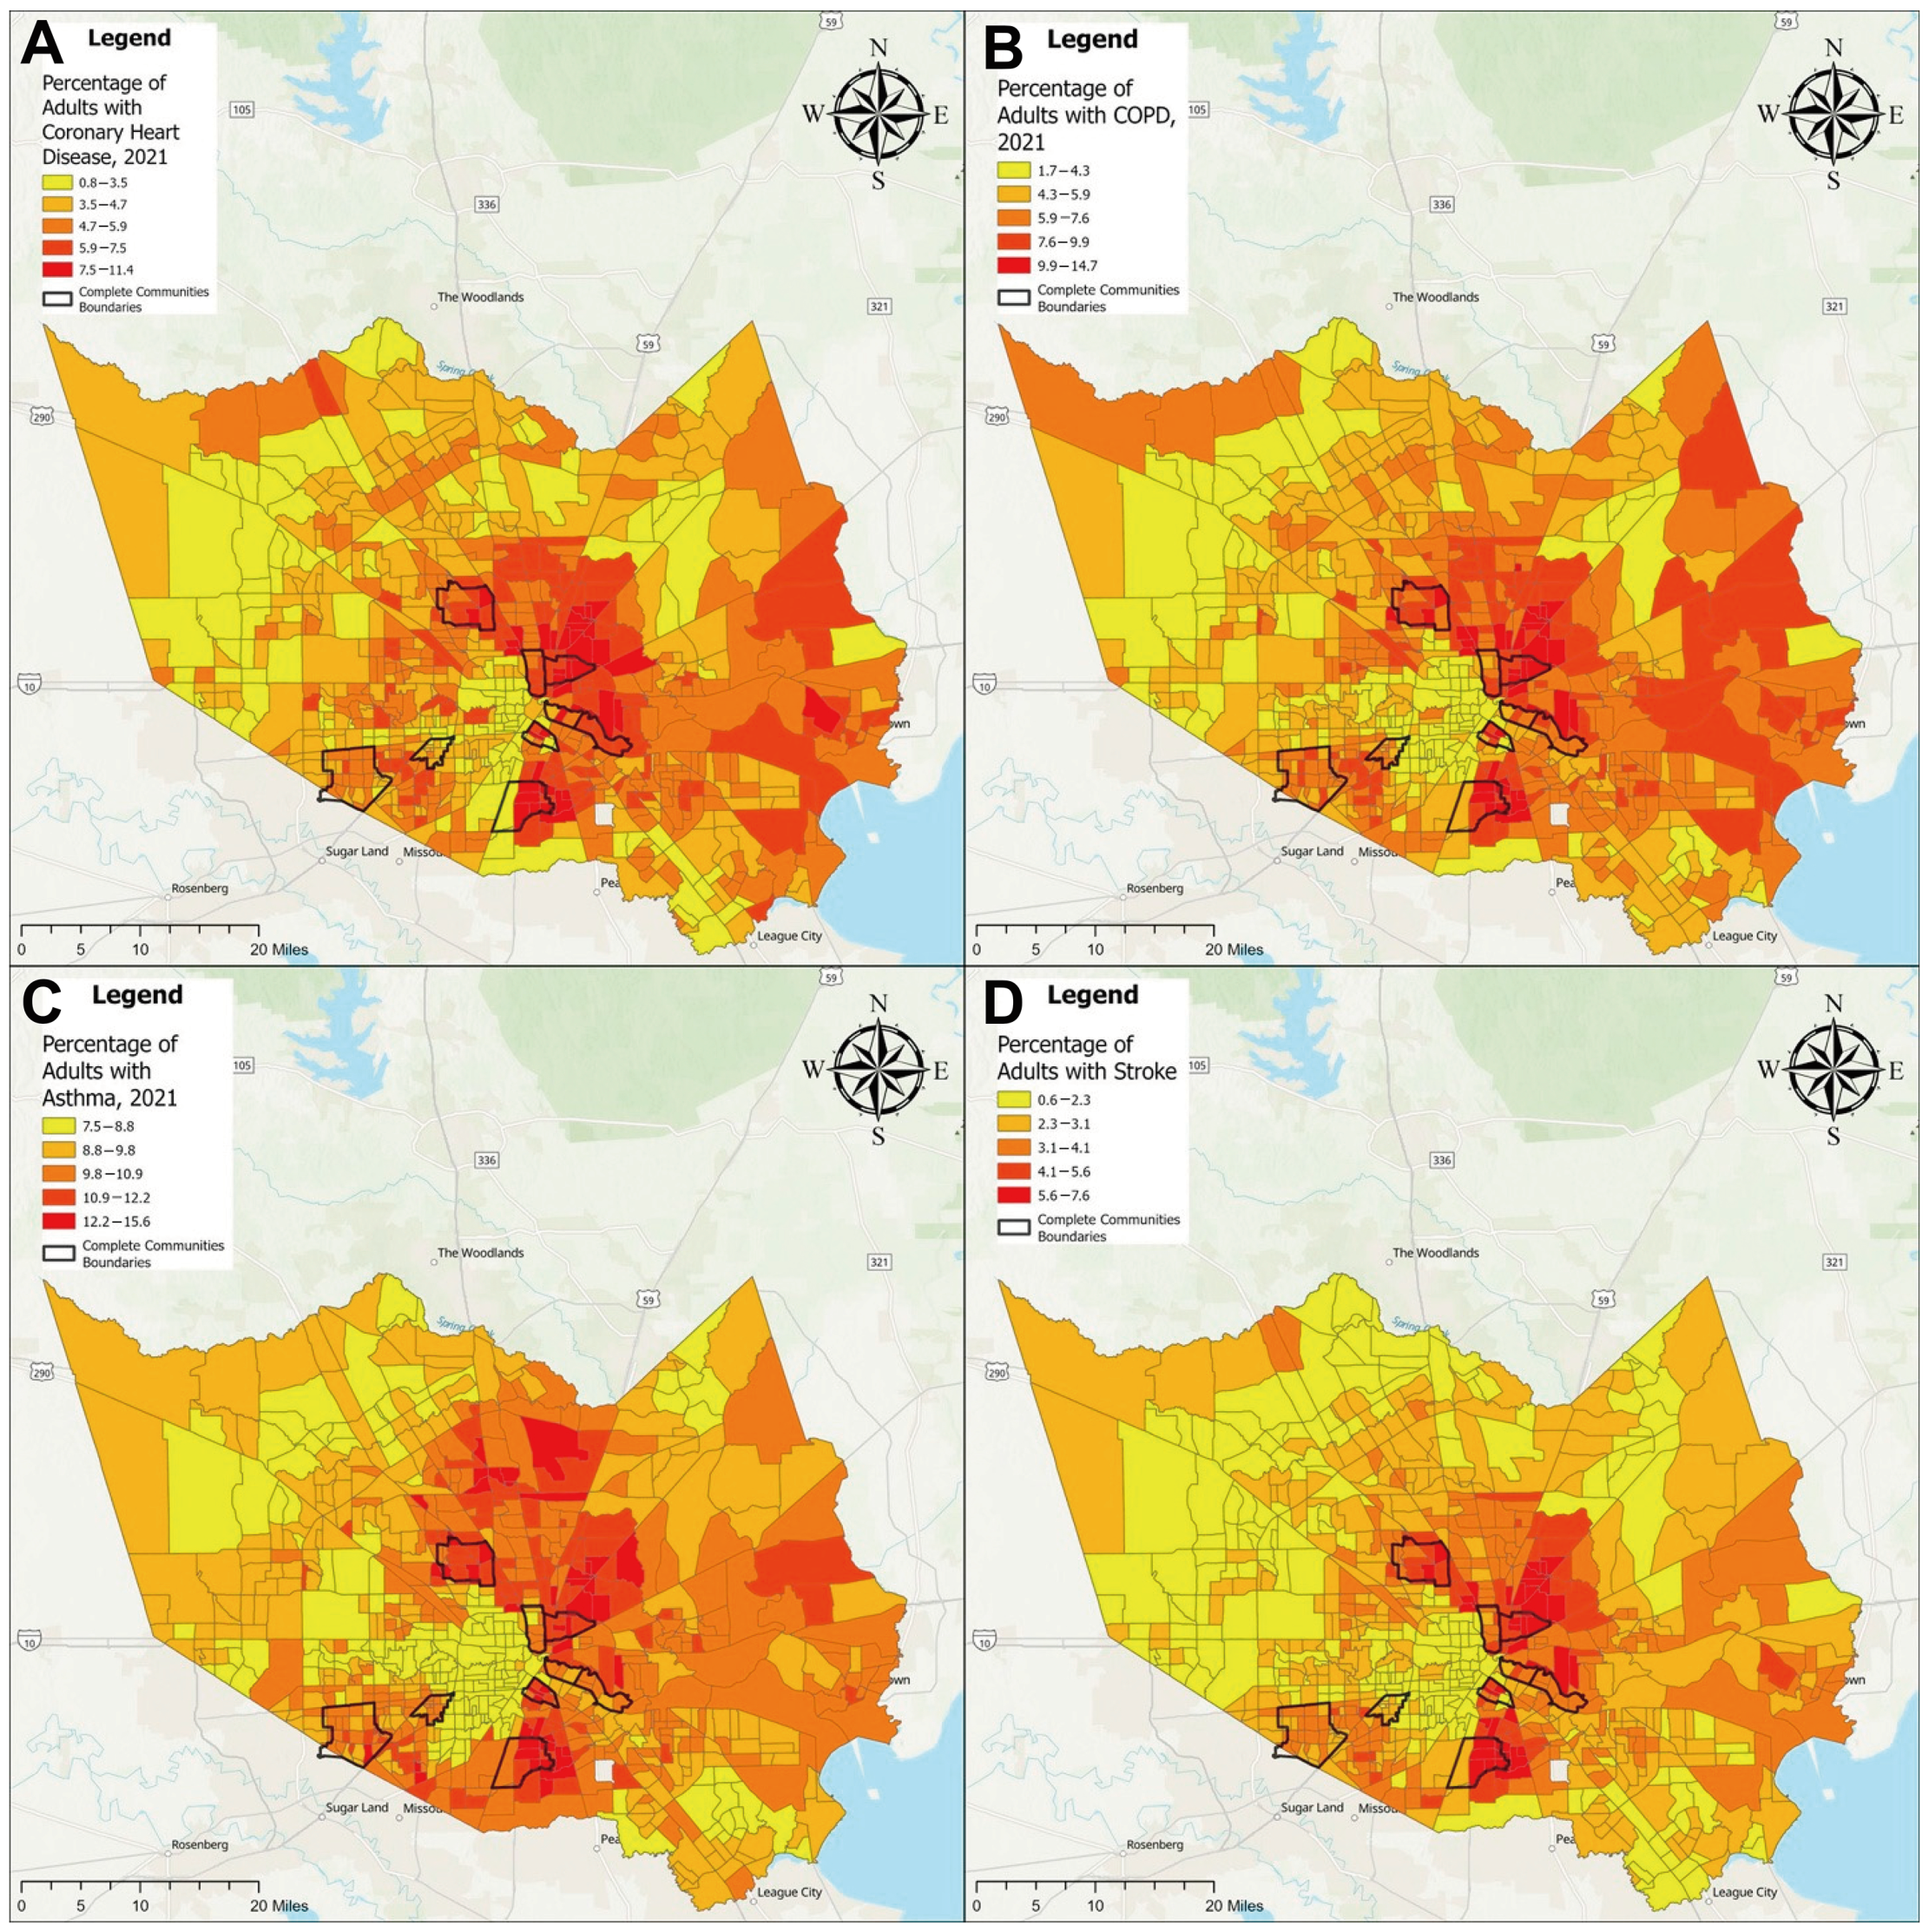
3.3. Geospatial Health Measures

Figure 3 presents the spatial distribution of various health conditions in Harris County, including coronary heart disease, chronic obstructive pulmonary disease (COPD), asthma, and stroke. The observed geographic patterns provide further evidence of the links between air pollution exposure and health effects.
The prevalence of coronary heart disease was notably high in central and eastern Harris County, aligning with the regions of elevated PM2.5 and DPM concentrations (Figure 3A). Similarly, COPD prevalence followed a comparable distribution (Figure 3B), reflecting the established relationship between long-term exposure to fine particulate matter and obstructive lung diseases. Asthma prevalence was also particularly elevated in areas with high PM2.5 and DMP levels (Figure 3C), further reinforcing the role of airborne pollution in exacerbating respiratory conditions. The spatial distribution of stroke prevalence also exhibited higher concentrations in the eastern part of Harris County (Figure 3D), aligning with the patterns observed for coronary heart disease, COPD, and asthma. Although all four studied diseases showed some degree of spatial overlap with PM2.5 and DPM concentrations, socioeconomic factors may also play a significant role in shaping these health outcomes. Areas with high disease prevalence often correspond to communities with lower socioeconomic status, where residents may experience limited access to healthcare, preventive services, and resources for managing chronic conditions. As can be seen in Figure 3 below, all nine Complete Communities in Houston exhibit some of the highest percentages for all diseases.
Additional health-related variables—including high cholesterol, cholesterol screening, self-care disability, routine checkup rates, smoking, and health insurance coverage—are visualized in the SI (Figures S4–S9), offering further insight into the broader landscape of public health indicators across the county. Interesting patterns and observations can be gleaned from the figures. For example, high cholesterol prevalence (Figure S4) is evident in the inner core census tracts of the city (with relatively high SVI), but as can be seen in Figure S5, less cholesterol screening is occurring in these tracts (including tracts within Complete Communities) relative to other tracts in the city. The data in Figure S6 also illustrate the challenges faced by Complete Communities in terms of the percentage of adults reporting difficulties with self-care while the data in Figure S7 illustrate the adults reporting routine checkups. Higher smoking rates (Figure S8), when combined with a lack of medical insurance (Figure S9), point to further challenges experienced in tracts within the inner core of the city (with a relatively high SVI); this challenge is not likely to be addressed with routine checkups as shown in Figure S7 and confirmed by the prevalence of specific diseases in the inner core and high-SVI census tracts as shown in Figure 1 and Figure 3.

3.4. Correlation Analyses

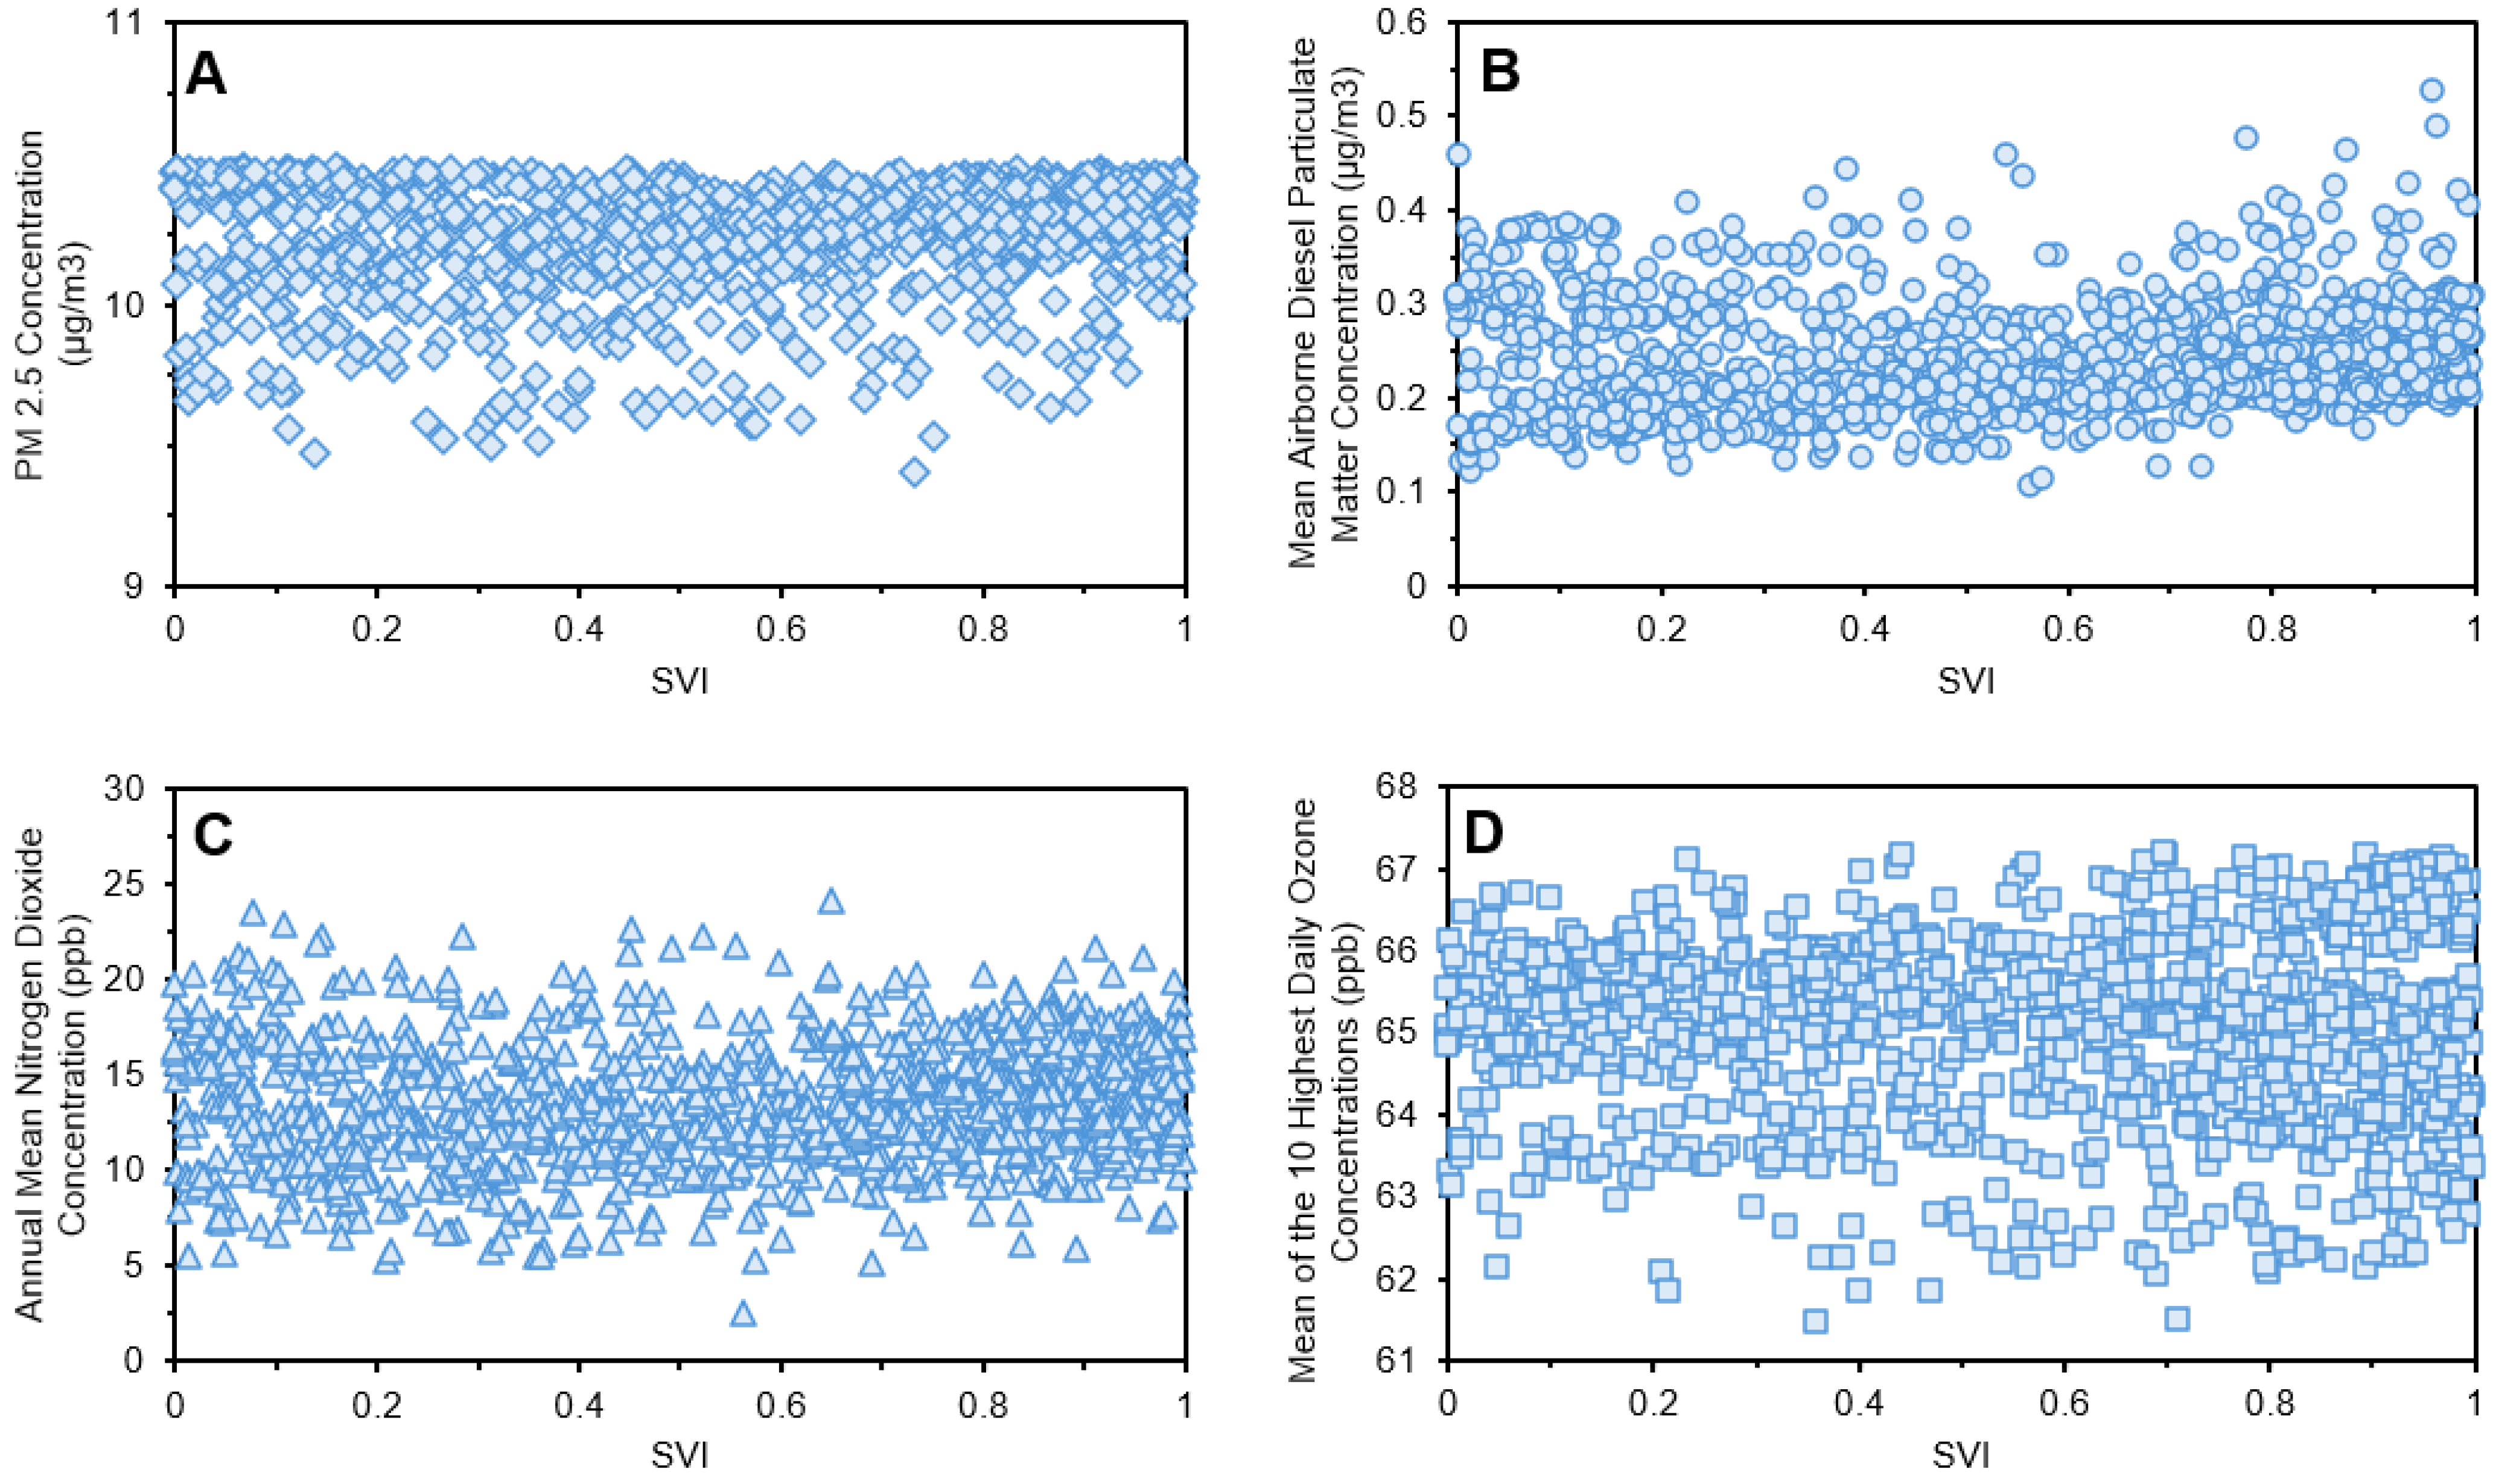
3.4.1. Air Quality and SVI

To examine the potential relationship between social vulnerability and air pollution exposure, regression analyses were conducted using the SVI as the independent variable and four air quality indicators—PM2.5, diesel particulate matter (DPM), nitrogen dioxide (NO2), and ozone—as dependent variables (Figure 4). Overall, no strong correlation was evident between the SVI and concentrations of PM2.5, DPM, or NO2 (Figure 4A–C). These pollutants exhibited relatively uniform distributions across Harris County; so, for example, as can be seen in Panel A of Figure 2, the PM2.5 concentrations exceed the annual PM2.5 standard of 9.0 micrograms per cubic meter (µg/m3) for most of Harris County. This uniformity supports the finding that homogeneous emission sources and regional dispersion patterns exist in Harris County that result in a generally consistent ambient exposure independent of community-level social vulnerability. Ozone concentrations, on the other hand, demonstrated a slightly increasing trend with higher SVI (Figure 4D). This association might be attributed to the secondary formation of ozone, influenced by the photochemical reactions of pollutants transported from other areas, potentially leading to increased exposure in vulnerable communities downwind of urban and industrial emission sources. It should be noted that while the correlations with SVI were not evident or weak, as will be seen subsequently in the manuscript, stronger correlations were found with specific socioeconomic variables that are part of the SVI. This supports the need for granular analyses that examine sociodemographics, air quality data, and health outcomes, as performed here.

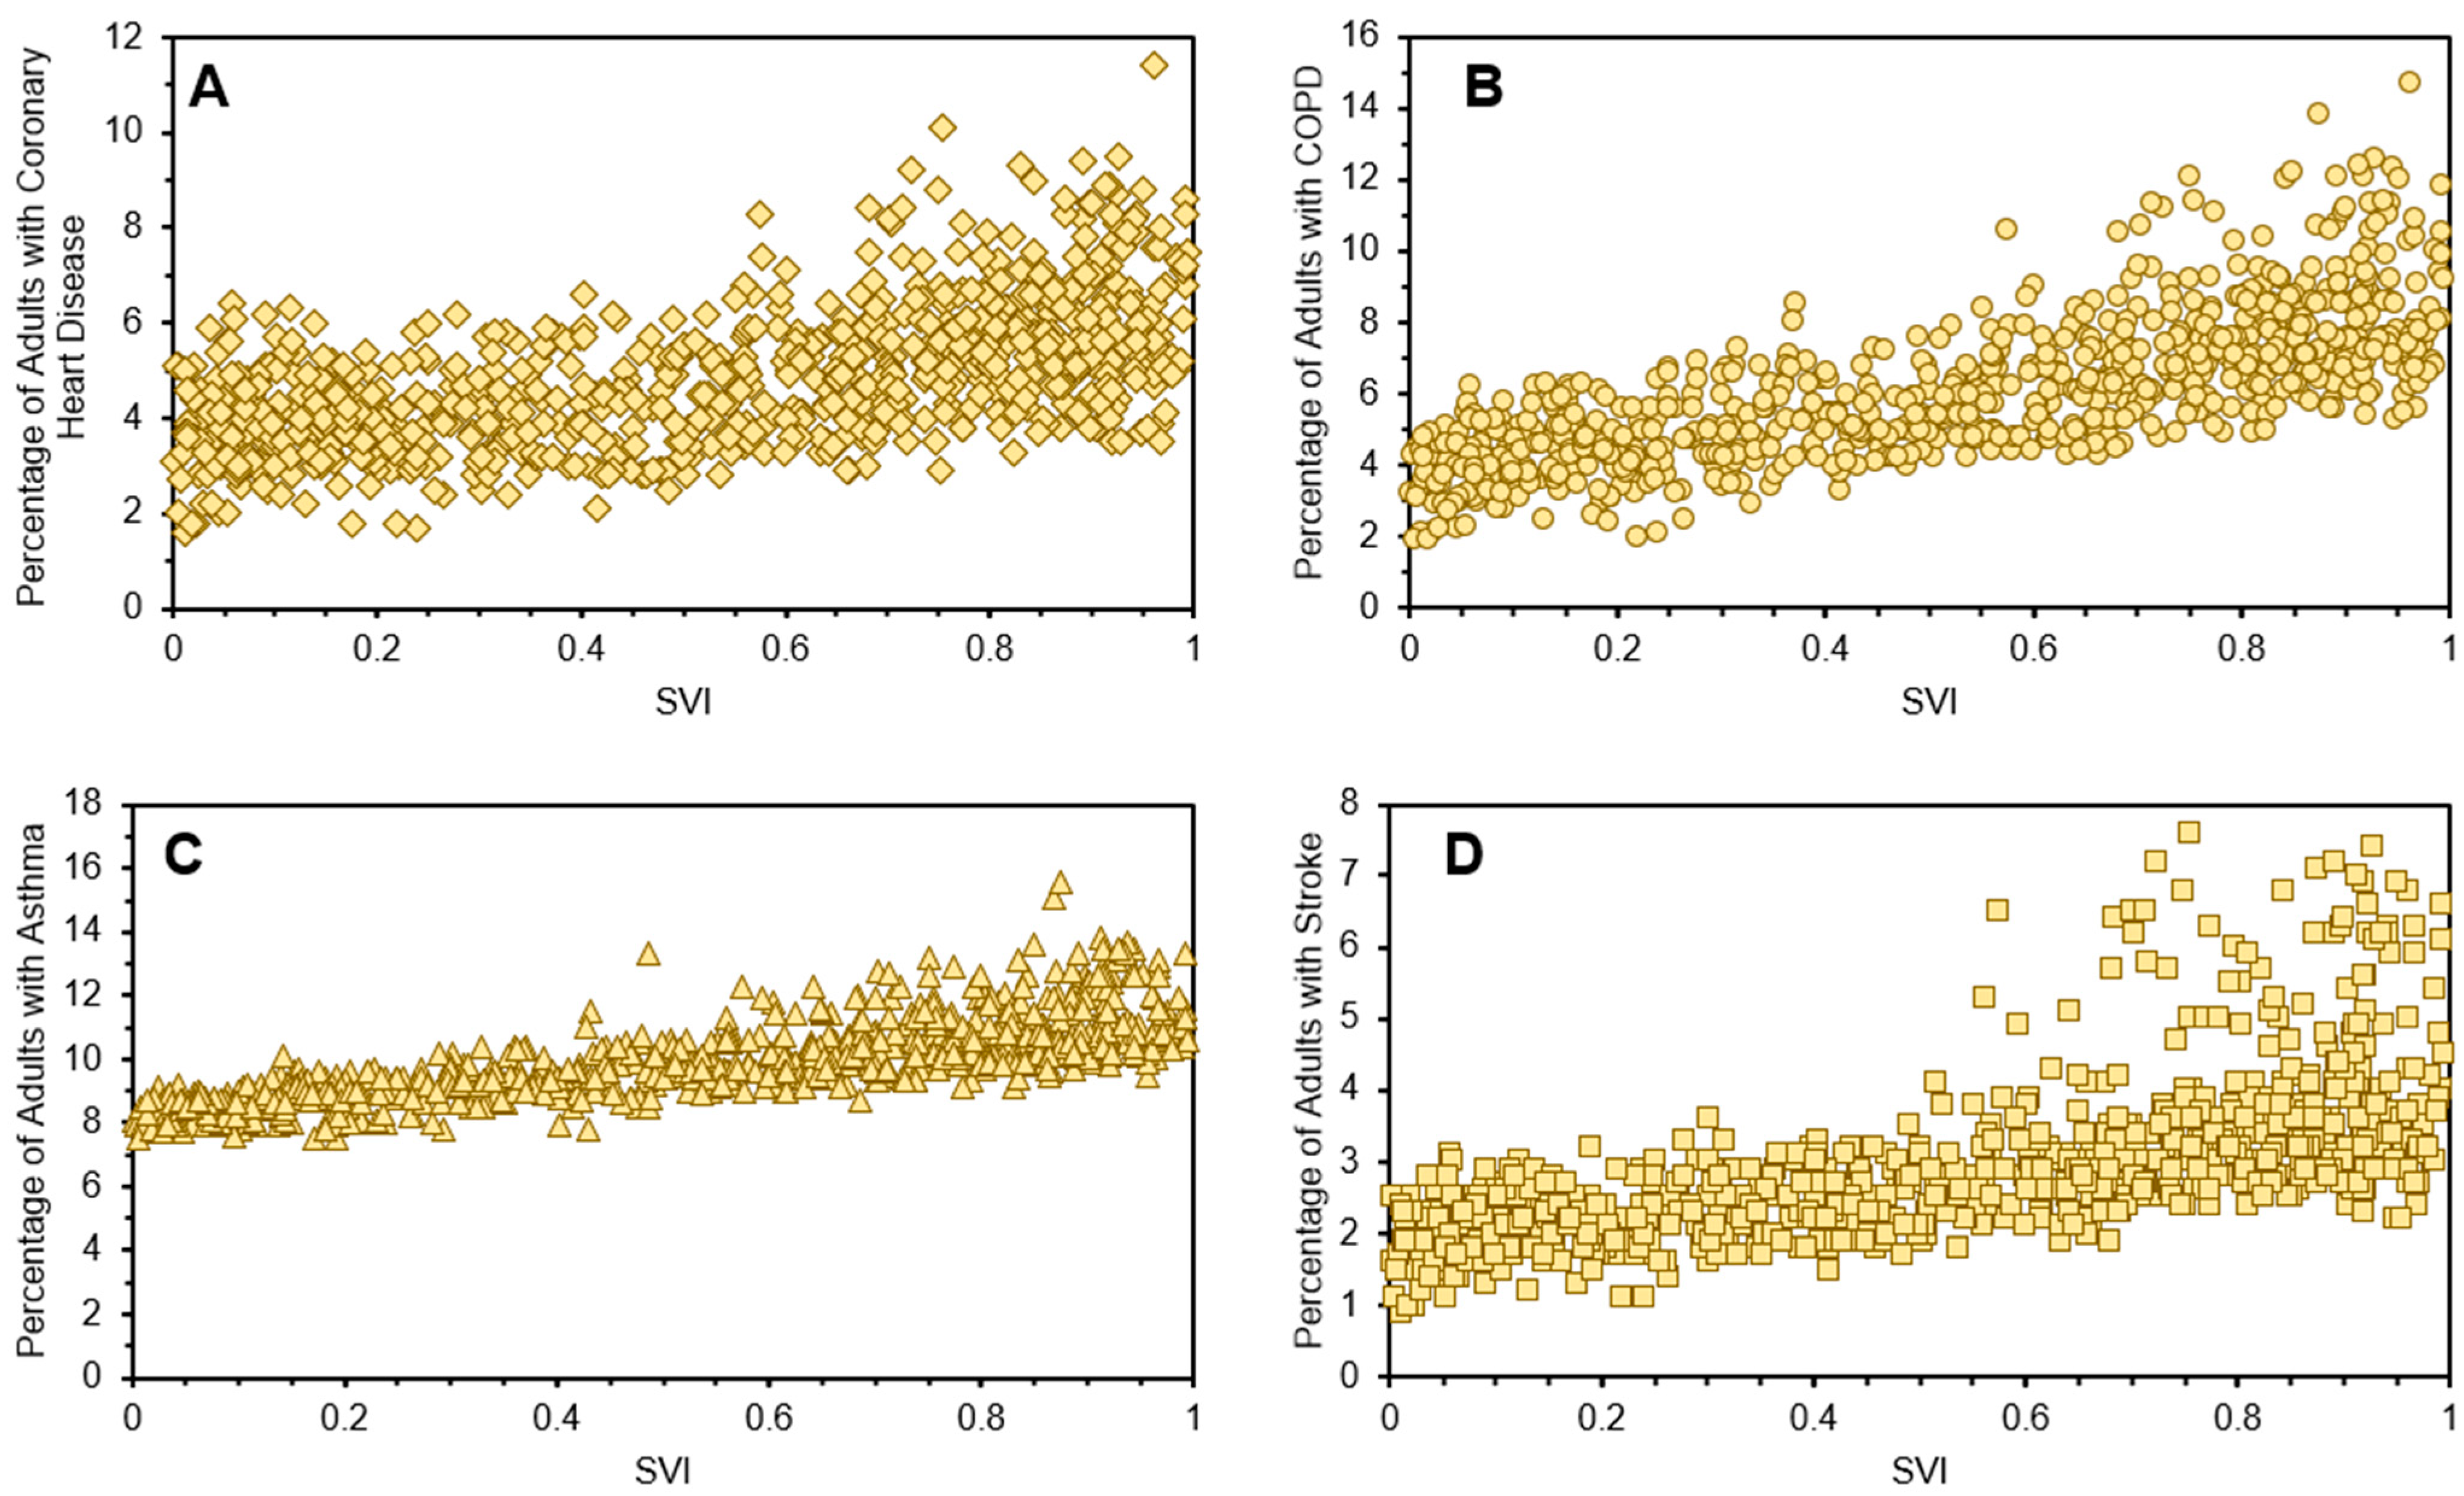
3.4.2. Health and SVI

To assess the relationship between social vulnerability and health outcomes, we performed regression analyses with the SVI as the independent variable and four major health conditions—coronary heart disease, COPD, asthma, and stroke—as the dependent variables. The results indicate varying degrees of association between SVI and these health conditions.
The percentage of adults with coronary heart disease exhibits a slight increasing trend with SVI, though the association is not particularly strong (Figure 5A). While areas with higher social vulnerability tend to have greater coronary heart disease prevalence, the trend fluctuates at higher SVI levels (SVI > 0.6), suggesting additional influencing factors beyond social vulnerability alone. A more pronounced correlation is observed between SVI and COPD prevalence, with a sharper increasing trend compared with coronary heart disease (Figure 5B). COPD prevalence generally rises with higher SVI, though fluctuations become more pronounced at higher SVI values (SVI > 0.6). This trend aligns with the established links between respiratory diseases and environmental stressors, which are often more severe in socially vulnerable communities. Asthma prevalence exhibits a clear linear relationship with SVI, with higher social vulnerability consistently associated with increased asthma rates (Figure 5C). This strong correlation suggests that populations in high-SVI areas experience sustained exposure to risk factors such as air pollution, housing conditions, and healthcare access limitations. The association between SVI and stroke prevalence follows a nonlinear pattern, where stroke rates generally increase with SVI but exhibit an exponential-like rise at higher SVI values (Figure 5D). This indicates that for communities with very high social vulnerability (SVI > 0.6), the likelihood of stroke increases disproportionately, reflecting a compounding effect of multiple social and environmental stressors. Similar to COPD, stroke prevalence fluctuates more at higher SVI levels, possibly due to the underlying disparities in healthcare access, preventive care, and cumulative exposure to risk factors. Overall, these findings suggest that social vulnerability is strongly linked to respiratory and cardiovascular health outcomes, with the most pronounced effects observed in high-SVI areas where systemic challenges in healthcare access, environmental exposure, and economic stressors contribute to worsening health conditions.

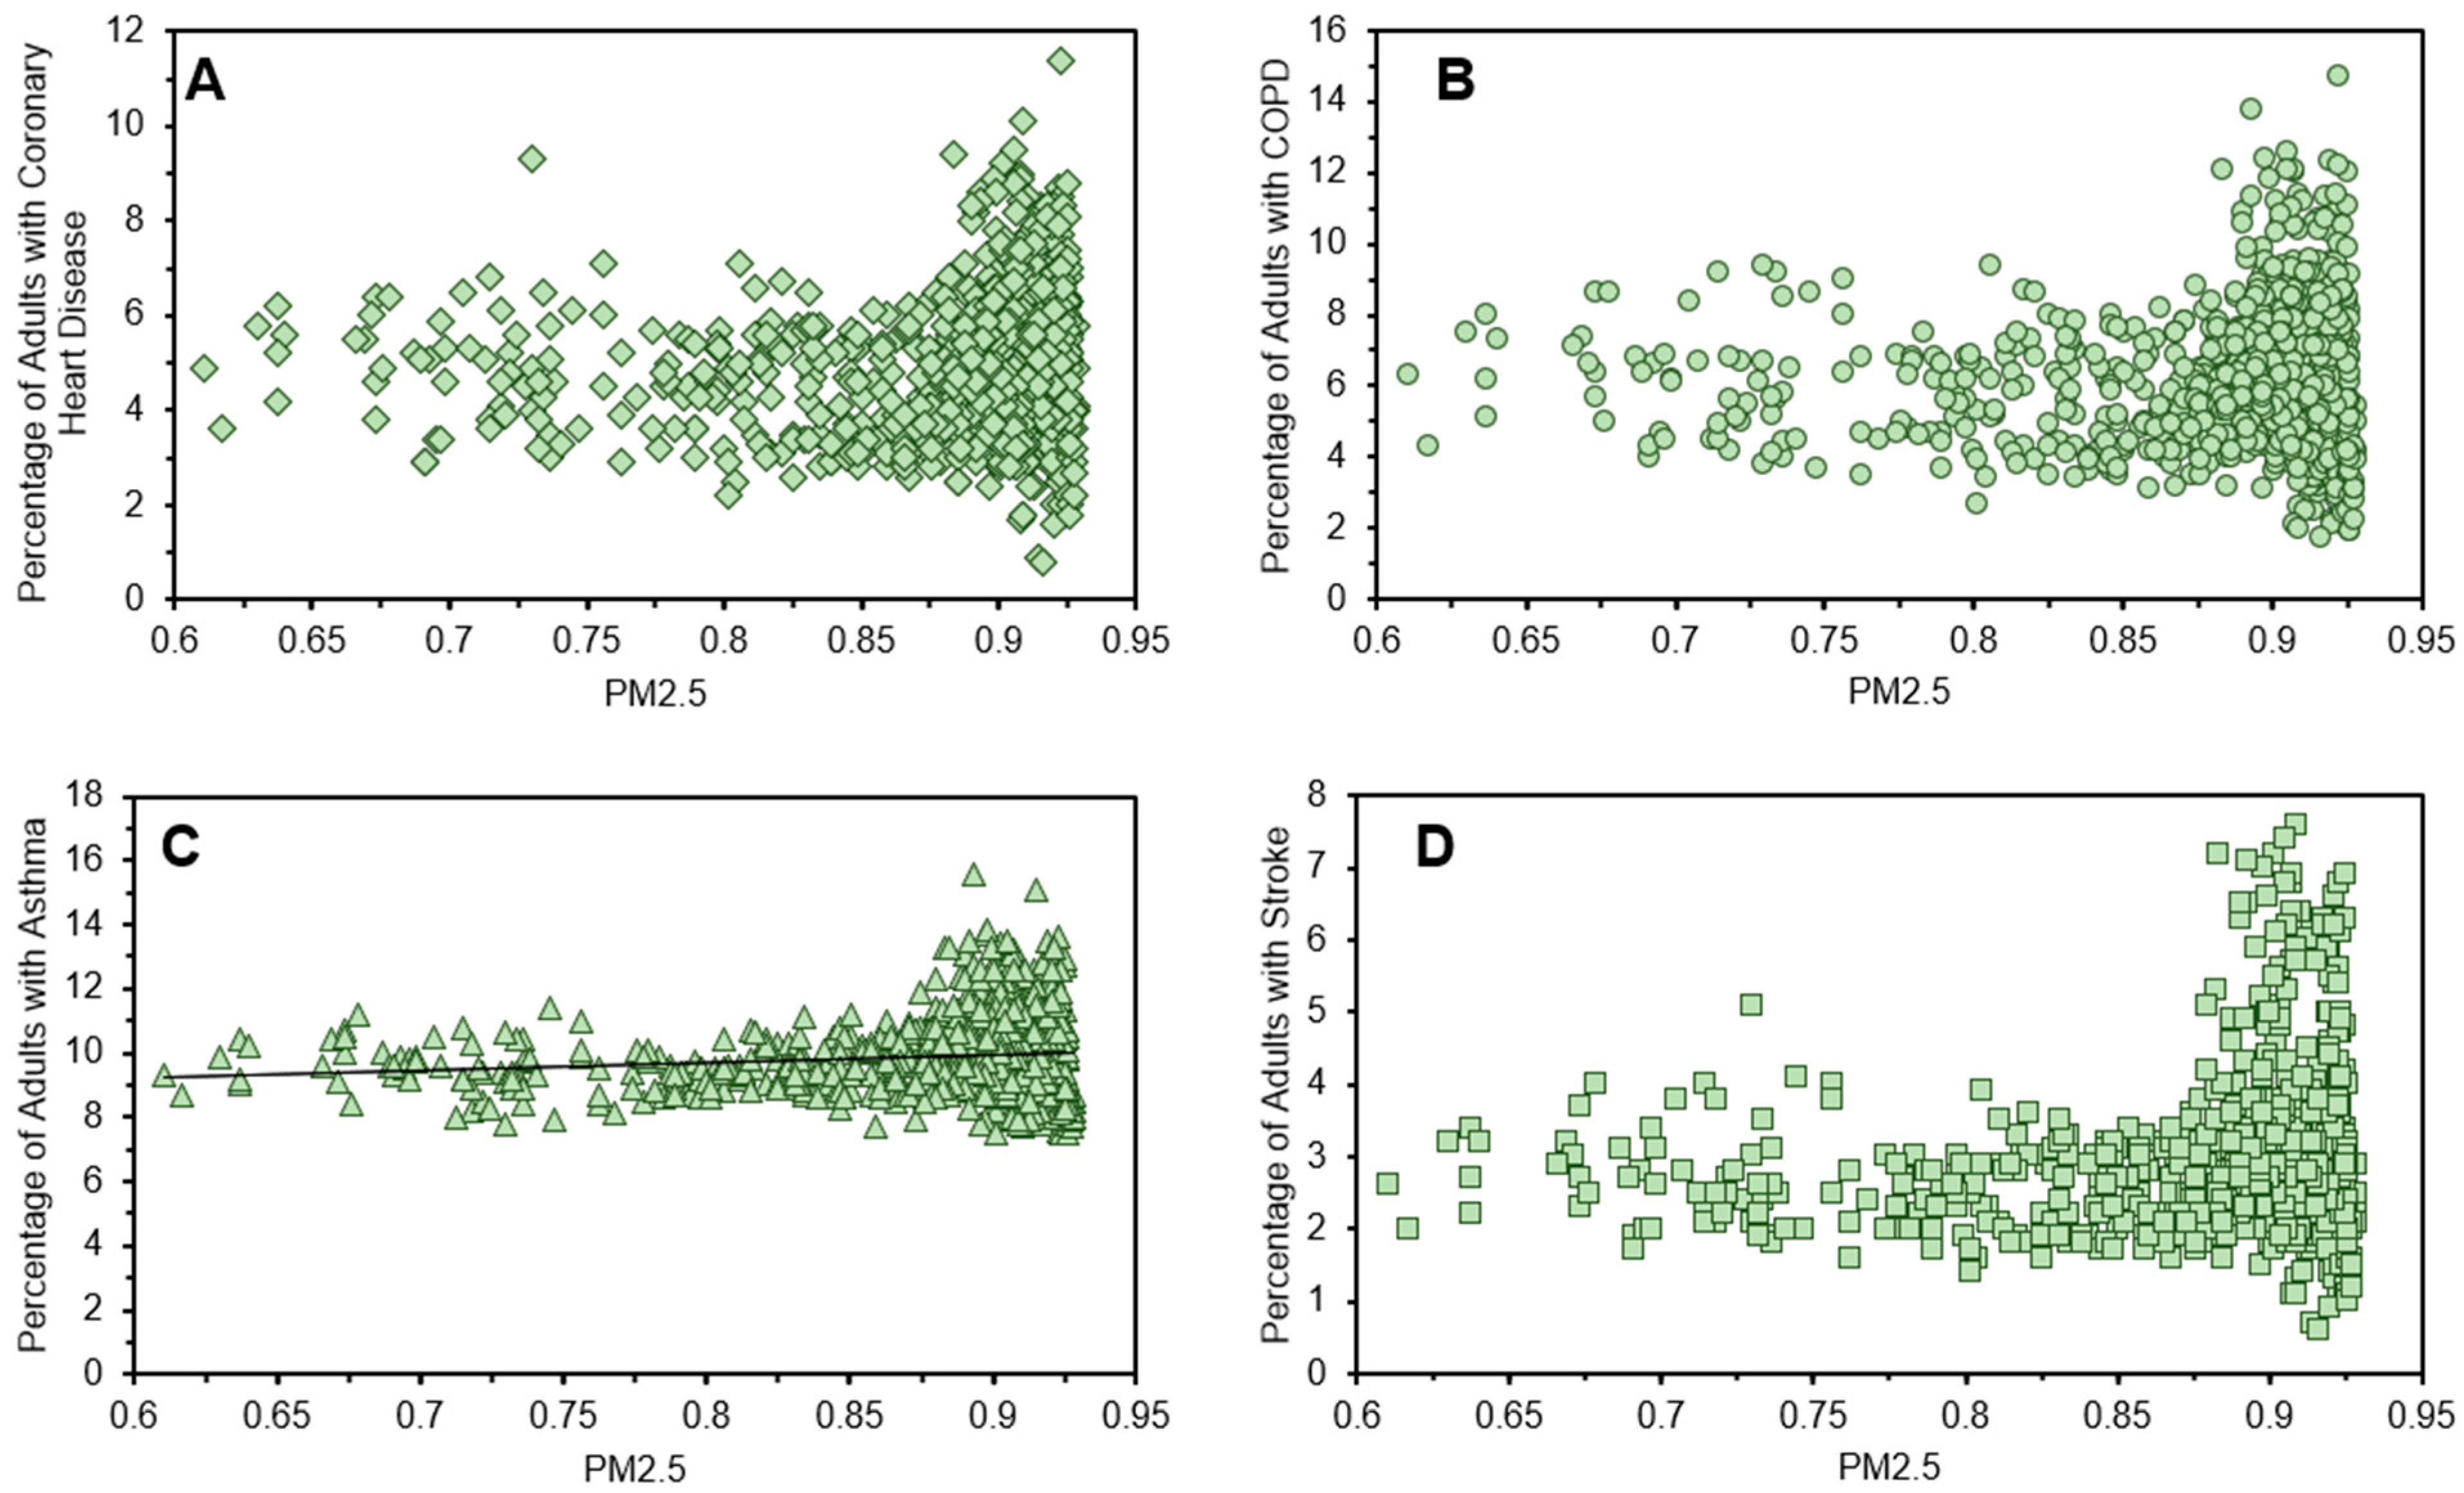
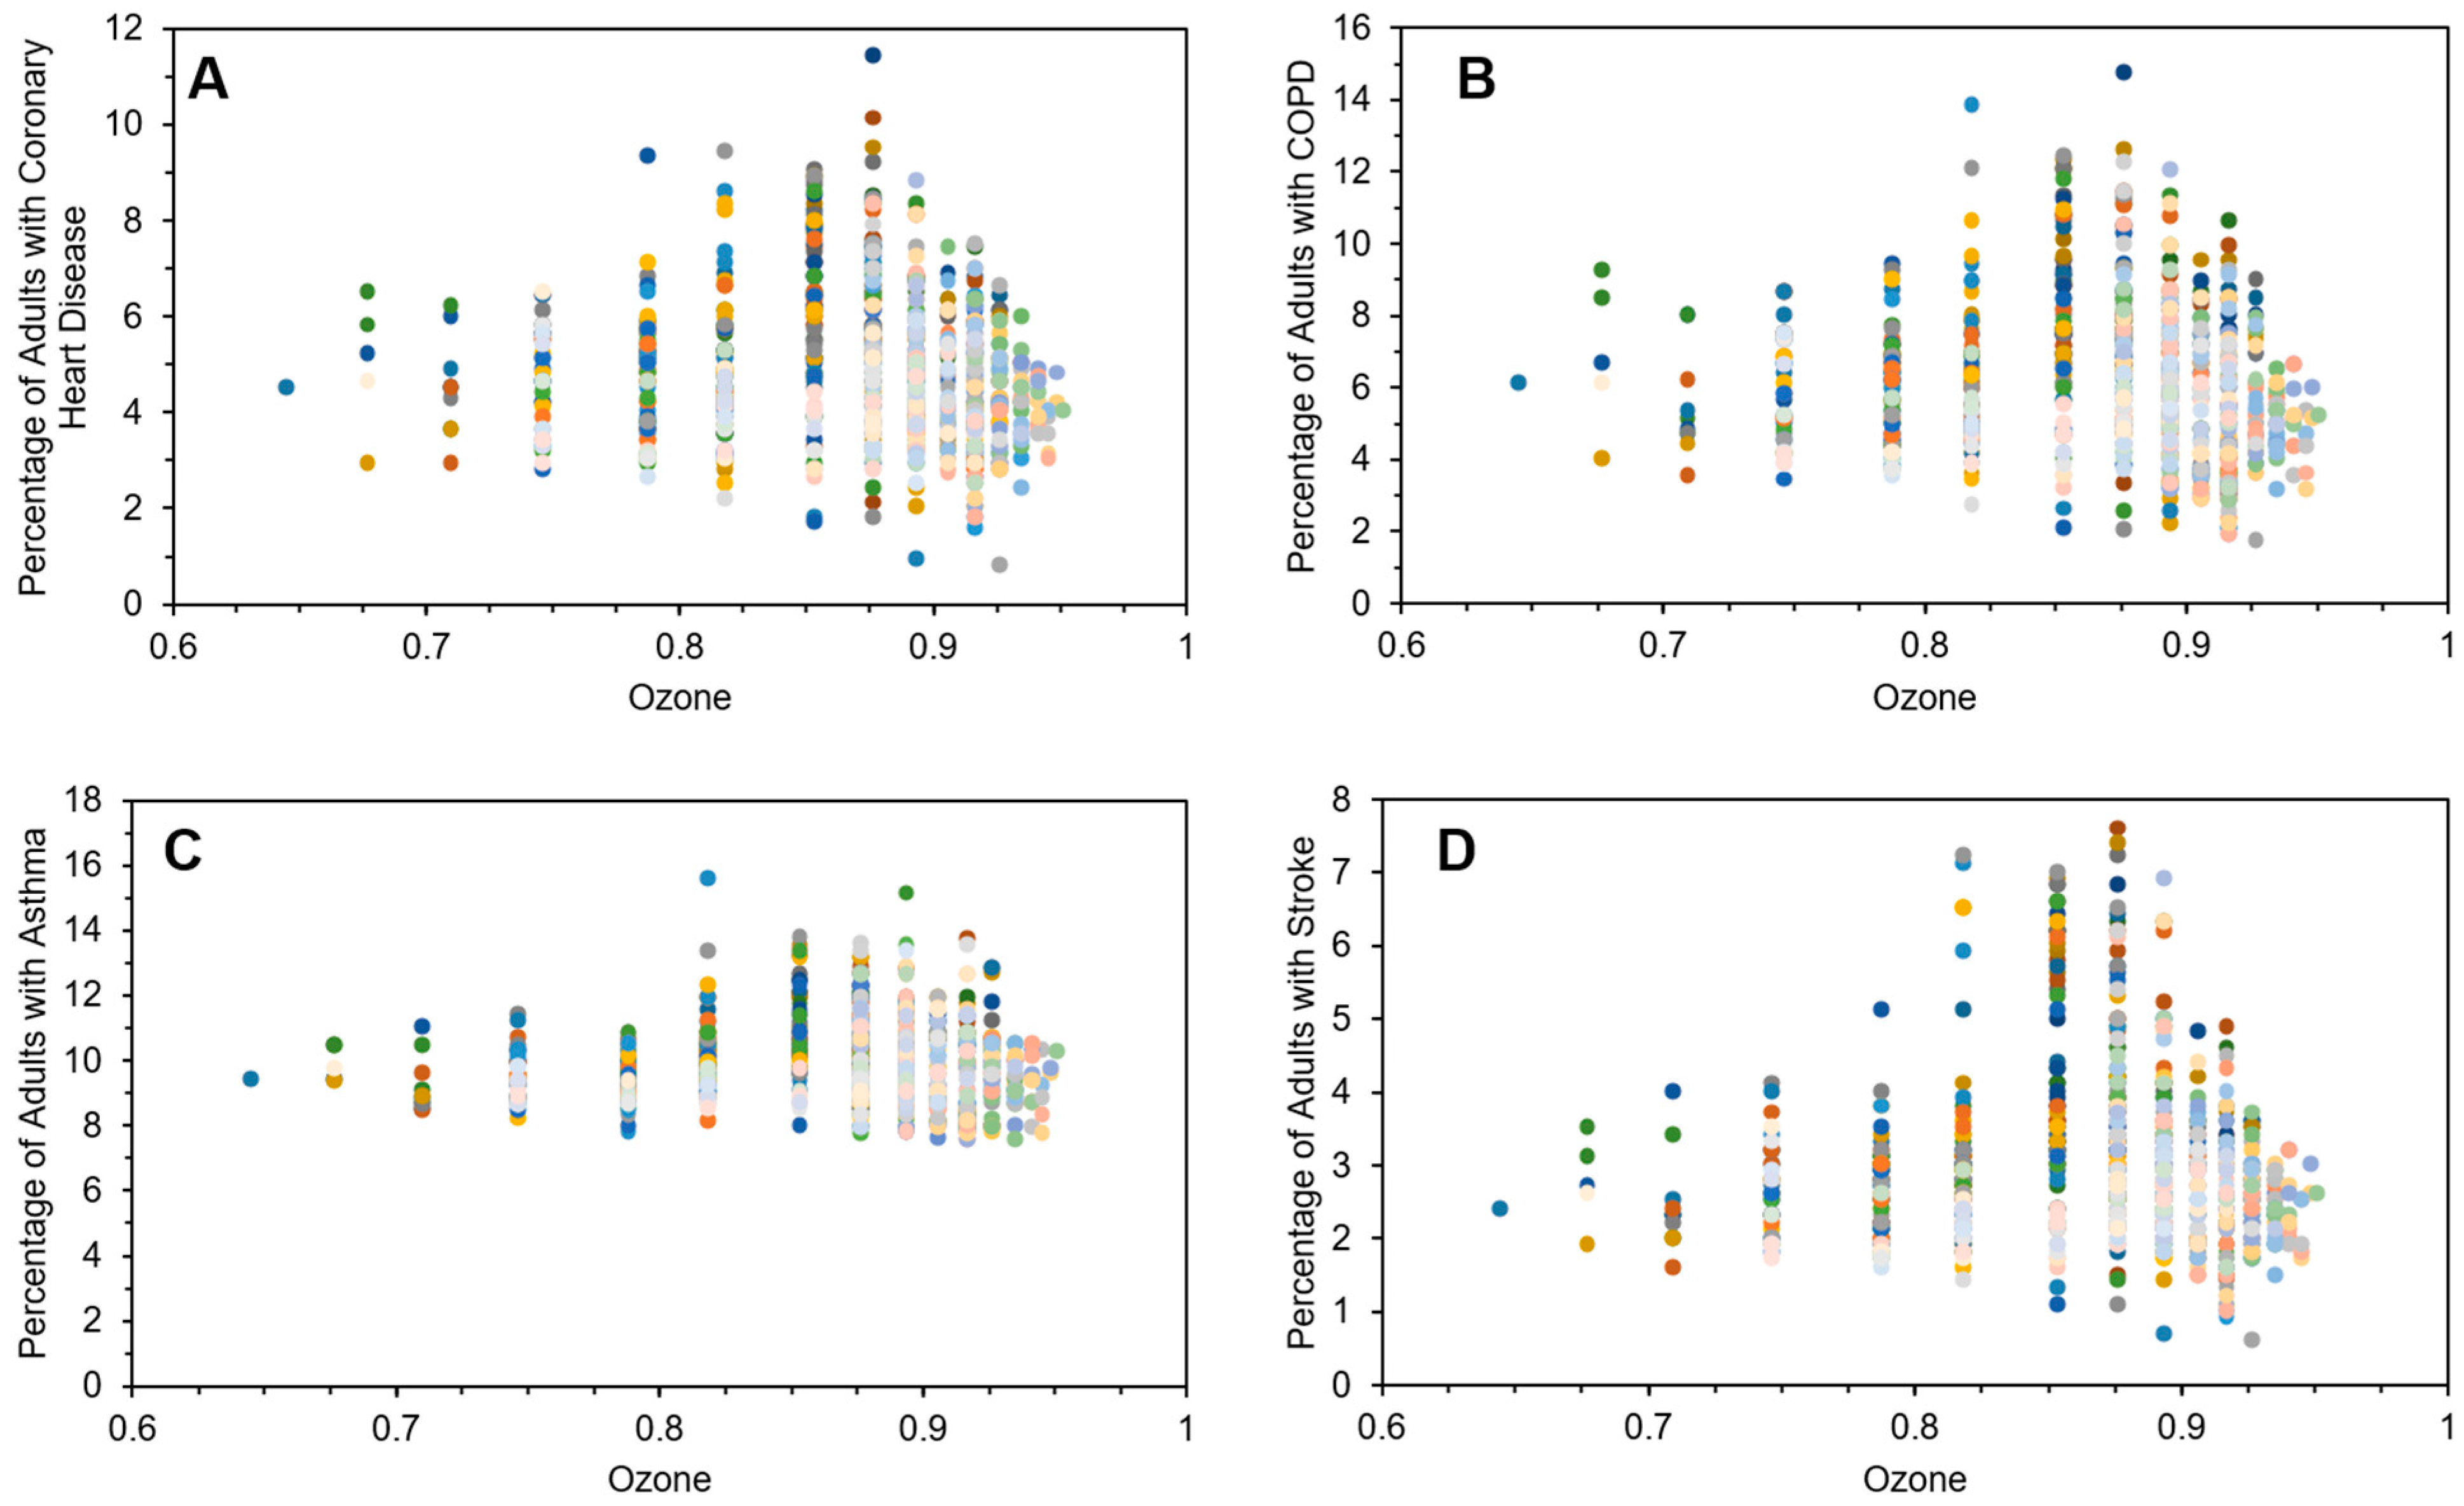
3.4.3. Health and Air Quality

To examine the impact of air pollution on health, we analyzed the relationships between PM2.5, ozone, and four major health conditions: coronary heart disease, COPD, asthma, and stroke. PM2.5 and ozone were selected due to their well-documented associations with cardiovascular and respiratory diseases, as well as their prevalence in urban and industrial areas. PM2.5, a fine particulate pollutant, can penetrate deep into the respiratory system and bloodstream, contributing to inflammation and long-term health risks. Ozone, a secondary pollutant formed through atmospheric reactions, is known to exacerbate respiratory conditions and trigger cardiovascular stress, particularly in vulnerable populations.
For PM2.5, the relationship with health outcomes varied in magnitude (Figure 6). Coronary heart disease prevalence exhibited a general increasing trend with PM2.5, with more fluctuations at higher concentrations (Figure 6A). A sharper trend was observed for COPD, where prevalence increased with PM2.5 levels (Figure 6B). Asthma prevalence showed a threshold effect, with PM2.5 concentrations above 0.6 associated with increased asthma rates, though further increases beyond 0.85 did not lead to a substantial additional rise in cases (Figure 6C). Stroke prevalence, however, remained relatively unaffected at PM2.5 concentrations below 0.8 but increased significantly at higher concentrations, suggesting a stronger impact only at elevated pollution levels (Figure 6D).
For ozone, a general increasing trend was observed for all four health conditions (Figure 7). However, unlike PM2.5, the rate of increase diminished at higher ozone concentrations. This suggests that elevated ozone concentrations are directly correlated to the four health conditions; however, once elevated above standards, the rate of increase in disease prevalence decreases. This could be due to several factors including varying susceptibility among individuals, differing levels of exposure, and the complex interplay of other environmental conditions and pre-existing health conditions. While coronary heart disease, COPD, asthma, and stroke prevalence were all elevated in areas with high ozone exposure, further increases in ozone levels did not substantially amplify health risks. This suggests that ozone exposure primarily influences baseline health risks, while other factors may drive variability at higher concentrations.

3.5. Community-Based Geospatial and Temporal Analyses

Figure 8 shows two correlation analysis plots, correlating the percentage of adults living in poverty with the percentage of adults who lack healthcare and the percentage of adults with asthma, respectively. These plots highlight the census tracts which are part of the 3rd Ward and Kashmere Gardens communities. It is interesting to note that there is high variance between the census tracts within these individual communities, particularly for the percentage of poverty variable. Despite this variance, the percentage of poverty and the percentage lacking health insurance in the two communities are among the highest in the county. Similarly, the percentage of the population with asthma correlated with poverty are also among the highest in the county.

4. Discussion

The findings in this study reinforce the established links between air pollution, social vulnerability, and health outcomes at the community scale. Our spatial analyses identified significant geographic variability in pollution exposure and social vulnerability across Harris County. Areas of high social vulnerability generally experienced higher disease prevalence, reflecting the compounded risks from socioeconomic stressors, limited healthcare access, and environmental burdens. COPD, asthma, and stroke demonstrated clear associations with social vulnerability, aligning with the previous literature indicating heightened susceptibility to chronic health conditions in disadvantaged populations.
Interestingly, the correlations between air quality indicators (PM2.5, NO2, and DPM) and SVI were relatively weak, implying that the spatial distribution of these pollutants was influenced more strongly by regional emission sources and meteorological conditions rather than localized socioeconomic characteristics. Conversely, ozone showed a slight positive correlation with SVI, likely due to secondary formation processes downwind from urban and industrial emissions and reduced pollutant removal by vegetation in vulnerable neighborhoods.
PM2.5 exhibited the strongest and most consistent relationship with cardiovascular and respiratory diseases. The nonlinear relationships observed suggest critical thresholds, beyond which health risks significantly intensify, supporting the need for stringent air quality management, particularly in densely populated urban centers. Ozone’s plateauing health impact at higher concentrations indicates that baseline exposure substantially elevates health risks, while incremental increases have diminishing marginal effects, highlighting the complexity in pollutant–health dynamics.
Community-level variability, such as that observed in 3rd Ward and Kashmere Gardens, highlights the importance of granular analyses. High within-community variability in poverty and health outcomes suggests that interventions must be locally tailored rather than broadly applied. Future studies should incorporate temporal dynamics, meteorological factors, and additional air toxics to further elucidate these complex relationships.

5. Conclusions

The novel research in this paper contributes to a better understanding of the interplay between air quality indicators, social vulnerabilities, and health outcomes. This research is the first systemic demonstration that PM2.5 health impacts are stronger than social vulnerability in Harris County, but that there are regional inequalities in ozone exposure. In comparison, nitrogen dioxide correlated well with social vulnerability as did airborne diesel particulate matter. Other novel findings point to social vulnerability as a robust predictor of respiratory and cardiovascular disease prevalence while PM2.5, for example, was a strong predictor of chronic respiratory and cardiovascular disease. This research demonstrated the need for local and regional geospatial analyses among the three domains of air quality, social vulnerability, and health outcomes in order to fully elucidate correlations at various scales. The findings from this research, for the first time, to the best knowledge of the authors, stress the need for targeted, community-specific interventions addressing both socioeconomic determinants and environmental conditions to improve health outcomes. A significant contribution of this work elucidates the difference in correlations when the data are analyzed regionally in contrast with locally at the community level.

Supplementary Materials

The following supporting information can be downloaded at: https://www.mdpi.com/article/10.3390/su17125368/s1, Figure S1. The population map of Harris County, Texas; Figure S2. Median household income distribution of Harris County; Figure S3. Percentage of population whose income is below the poverty level in Harris Country; Figure S4. Spatial distribution of high cholesterol prevalence among adults across census tracts in Harris County, Texas.; Figure S5. Spatial distribution of adults who have received cholesterol screening within the past five years across Harris County, Texas.; Figure S6. Spatial distribution of adults reporting self-care disability in Harris County, Texas.; Figure S7. Spatial distribution of adults reporting a routine checkup across census tracts in Harris County, Texas.; Figure S8. Spatial distribution of current smoking among adults in Harris County, Texas.; Figure S9. Spatial distribution of uninsured adults across census tracts in Harris County, Texas. Table S1. Regression Equations for Figure 4, Figure 5, Figure 6 and Figure 7.

Author Contributions

Conceptualization, H.S.R., A.K. and W.E.V.; methodology, A.K., W.E.V. and H.S.R.; formal analysis, A.K. and W.E.V.; resources, H.S.R.; writing—original draft preparation, A.K., W.E.V. and H.S.R.; writing—review and editing, A.K., W.E.V. and H.S.R.; visualization, W.E.V.; supervision, H.S.R.; project administration, H.S.R.; funding acquisition, H.S.R. All authors have read and agreed to the published version of the manuscript.

Funding

Support for the project provided by the Hurricane Resilience Research Institute (HuRRI) at the University of Houston and the Gulf Research Program.

Institutional Review Board Statement

Not applicable.

Informed Consent Statement

Not applicable.

Data Availability Statement

The raw data supporting the conclusions of this article will be made available by the authors on request. All raw data files were sourced from public data.

Acknowledgments

The Gulf Research Program and the Hurricane Resilience Research Institute (HuRRI) at the University of Houston are acknowledged for their funding support.

Conflicts of Interest

The authors declare no conflicts of interest.

References

  1. Brunekreef, B.; Holgate, S.T. Air pollution and health. Lancet 2002, 360, 1233–1242. [Google Scholar] [CrossRef] [PubMed]
  2. Kampa, M.; Castanas, E. Human health effects of air pollution. Environ. Pollut. 2008, 151, 362–367. [Google Scholar] [CrossRef] [PubMed]
  3. Hamanaka, R.B.; Mutlu, G.M. Particulate matter air pollution: Effects on the cardiovascular system. Front. Endocrinol. 2018, 9, 680. [Google Scholar] [CrossRef] [PubMed]
  4. Gómez-García, M.; Pitchon, V.; Kiennemann, A. Pollution by nitrogen oxides: An approach to NOx abatement by using sorbing catalytic materials. Environ. Int. 2005, 31, 445–467. [Google Scholar] [CrossRef]
  5. Amoatey, P.; Omidvarborna, H.; Baawain, M.S.; Al-Mamun, A. Emissions and exposure assessments of SOX, NOX, PM10/2.5 and trace metals from oil industries: A review study (2000–2018). Process Saf. Environ. Prot. 2019, 123, 215–228. [Google Scholar] [CrossRef]
  6. Chen, T.-M.; Kuschner, W.G.; Gokhale, J.; Shofer, S. Outdoor air pollution: Nitrogen dioxide, sulfur dioxide, and carbon monoxide health effects. Am. J. Med. Sci. 2007, 333, 249–256. [Google Scholar] [CrossRef]
  7. Chen, T.-M.; Kuschner, W.G.; Gokhale, J.; Shofer, S. Outdoor air pollution: Ozone health effects. Am. J. Med. Sci. 2007, 333, 244–248. [Google Scholar] [CrossRef]
  8. Geer, L.A.; Weedon, J.; Bell, M.L. Ambient air pollution and term birth weight in Texas from 1998 to 2004. J. Air Waste Manag. Assoc. 2012, 62, 1285–1295. [Google Scholar] [CrossRef]
  9. Zora, J.E.; Sarnat, S.E.; Raysoni, A.U.; Johnson, B.A.; Li, W.-W.; Greenwald, R.; Holguin, F.; Stock, T.H.; Sarnat, J.A. Associations between urban air pollution and pediatric asthma control in El Paso, Texas. Sci. Total Environ. 2013, 448, 56–65. [Google Scholar] [CrossRef]
  10. Montone, R.A.; Rinaldi, R.; Bonanni, A.; Severino, A.; Pedicino, D.; Crea, F.; Liuzzo, G. Impact of air pollution on ischemic heart disease: Evidence, mechanisms, clinical perspectives. Atherosclerosis 2023, 366, 22–31. [Google Scholar] [CrossRef]
  11. Bhaskaran, K.; Hajat, S.; Haines, A.; Herrett, E.; Wilkinson, P.; Smeeth, L. Effects of air pollution on the incidence of myocardial infarction. Heart 2009, 95, 1746–1759. [Google Scholar] [CrossRef] [PubMed]
  12. Raziani, Y.; Raziani, S. The effect of air pollution on myocardial infarction. J. Chem. Rev. 2021, 3, 83–96. [Google Scholar]
  13. Lee, K.K.; Miller, M.R.; Shah, A.S. Air pollution and stroke. J. Stroke 2018, 20, 2. [Google Scholar] [CrossRef] [PubMed]
  14. Ljungman, P.L.; Mittleman, M.A. Ambient air pollution and stroke. Stroke 2014, 45, 3734–3741. [Google Scholar] [CrossRef]
  15. Chen, J.; Hoek, G. Long-term exposure to PM and all-cause and cause-specific mortality: A systematic review and meta-analysis. Environ. Int. 2020, 143, 105974. [Google Scholar] [CrossRef]
  16. Brook, R.D.; Rajagopalan, S.; Pope, C.A., III; Brook, J.R.; Bhatnagar, A.; Diez-Roux, A.V.; Holguin, F.; Hong, Y.; Luepker, R.V.; Mittleman, M.A. Particulate matter air pollution and cardiovascular disease: An update to the scientific statement from the American Heart Association. Circulation 2010, 121, 2331–2378. [Google Scholar] [CrossRef]
  17. Guarnieri, M.; Balmes, J.R. Outdoor air pollution and asthma. Lancet 2014, 383, 1581–1592. [Google Scholar] [CrossRef]
  18. Tiotiu, A.I.; Novakova, P.; Nedeva, D.; Chong-Neto, H.J.; Novakova, S.; Steiropoulos, P.; Kowal, K. Impact of air pollution on asthma outcomes. Int. J. Environ. Res. Public Health 2020, 17, 6212. [Google Scholar] [CrossRef]
  19. Ko, F.W.; Hui, D.S. Air pollution and chronic obstructive pulmonary disease. Respirology 2012, 17, 395–401. [Google Scholar] [CrossRef]
  20. Duan, R.-R.; Hao, K.; Yang, T. Air pollution and chronic obstructive pulmonary disease. Chronic Dis. Transl. Med. 2020, 6, 260–269. [Google Scholar] [CrossRef]
  21. Peters, R.; Peters, J.; Booth, A.; Mudway, I. Is air pollution associated with increased risk of cognitive decline? A systematic review. Age Ageing 2015, 44, 755–760. [Google Scholar] [CrossRef]
  22. Schikowski, T.; Altuğ, H. The role of air pollution in cognitive impairment and decline. Neurochem. Int. 2020, 136, 104708. [Google Scholar] [CrossRef] [PubMed]
  23. Fan, S.-J.; Heinrich, J.; Bloom, M.S.; Zhao, T.-Y.; Shi, T.-X.; Feng, W.-R.; Sun, Y.; Shen, J.-C.; Yang, Z.-C.; Yang, B.-Y. Ambient air pollution and depression: A systematic review with meta-analysis up to 2019. Sci. Total Environ. 2020, 701, 134721. [Google Scholar] [CrossRef]
  24. Borroni, E.; Pesatori, A.C.; Bollati, V.; Buoli, M.; Carugno, M. Air pollution exposure and depression: A comprehensive updated systematic review and meta-analysis. Environ. Pollut. 2022, 292, 118245. [Google Scholar] [CrossRef] [PubMed]
  25. Jayaraj, R.L.; Rodriguez, E.A.; Wang, Y.; Block, M.L. Outdoor ambient air pollution and neurodegenerative diseases: The neuroinflammation hypothesis. Curr. Environ. Health Rep. 2017, 4, 166–179. [Google Scholar] [CrossRef] [PubMed]
  26. Armas, F.V.; D’Angiulli, A. Neuroinflammation and neurodegeneration of the central nervous system from air pollutants: A scoping review. Toxics 2022, 10, 666. [Google Scholar] [CrossRef]
  27. Wu, M.-Y.; Lo, W.-C.; Chao, C.-T.; Wu, M.-S.; Chiang, C.-K. Association between air pollutants and development of chronic kidney disease: A systematic review and meta-analysis. Sci. Total Environ. 2020, 706, 135522. [Google Scholar] [CrossRef]
  28. Tsai, H.-J.; Wu, P.-Y.; Huang, J.-C.; Chen, S.-C. Environmental pollution and chronic kidney disease. Int. J. Med. Sci. 2021, 18, 1121. [Google Scholar] [CrossRef]
  29. Chen, Y.; Cao, F.; Xiao, J.-P.; Fang, X.-Y.; Wang, X.-R.; Ding, L.-H.; Wang, D.-G.; Pan, H.-F. Emerging role of air pollution in chronic kidney disease. Environ. Sci. Pollut. Res. 2021, 28, 52610–52624. [Google Scholar] [CrossRef]
  30. Wu, X.; Gao, M. Effects of different environmental regulations and their heterogeneity on air pollution control in China. J. Regul. Econ. 2021, 60, 140–166. [Google Scholar] [CrossRef]
  31. Jbaily, A.; Zhou, X.; Liu, J.; Lee, T.-H.; Kamareddine, L.; Verguet, S.; Dominici, F. Air pollution exposure disparities across US population and income groups. Nature 2022, 601, 228–233. [Google Scholar] [CrossRef] [PubMed]
  32. Colmer, J.; Hardman, I.; Shimshack, J.; Voorheis, J. Disparities in PM2. 5 air pollution in the United States. Science 2020, 369, 575–578. [Google Scholar] [CrossRef]
  33. Marquès, M.; Domingo, J.L.; Nadal, M.; Schuhmacher, M. Health risks for the population living near petrochemical industrial complexes. 2. Adverse health outcomes other than cancer. Sci. Total Environ. 2020, 730, 139122. [Google Scholar] [CrossRef]
  34. Williams, S.B.; Shan, Y.; Jazzar, U.; Kerr, P.S.; Okereke, I.; Klimberg, V.S.; Tyler, D.S.; Putluri, N.; Lopez, D.S.; Prochaska, J.D. Proximity to oil refineries and risk of cancer: A population-based analysis. JNCI Cancer Spectr. 2020, 4, pkaa088. [Google Scholar] [CrossRef] [PubMed]
  35. Danforth, C.G.; Portier, C.; Ensor, K.B.; Hopkins, L.; Evans, B.; Quist, A.J.; McGraw, K.E.; Craft, E. Development and demonstration of a data visualization platform of short-term guidelines for ambient air levels of benzene during disaster response in Houston, Texas. Integr. Environ. Assess. Manag. 2024, 20, 533–546. [Google Scholar] [CrossRef]
  36. Peckham-Gregory, E.C.; Ton, M.; Rabin, K.R.; Danysh, H.E.; Scheurer, M.E.; Lupo, P.J. Maternal residential proximity to major roadways and the risk of childhood acute leukemia: A population-based case-control study in Texas, 1995–2011. Int. J. Environ. Res. Public Health 2019, 16, 2029. [Google Scholar] [CrossRef]
  37. Siddiqua, A.; Hahladakis, J.N.; Al-Attiya, W.A.K. An overview of the environmental pollution and health effects associated with waste landfilling and open dumping. Environ. Sci. Pollut. Res. 2022, 29, 58514–58536. [Google Scholar] [CrossRef]
  38. Symanski, E.; Whitworth, K.W.; Han, I.; Rammah, A.; Alvarez, J.; Moussa, I.; Han, H.A.; Flores, J. Assessing Metal Exposures Among Children Living in Environmental Justice Communities Near Metal Recycling Facilities in Houston, Texas. Environ. Justice 2024, 17, 128–142. [Google Scholar] [CrossRef]
  39. Symanski, E.; Whitworth, K.W.; Mendez-Figueroa, H.; Aagaard, K.M.; Moussa, I.; Alvarez, J.; Chardon Fabian, A.; Kannan, K.; Walker, C.L.; Coarfa, C. The Maternal and Infant Environmental Health Riskscape study of perinatal disparities in greater Houston: Rationale, study design and participant profiles. Front. Reprod. Health 2024, 6, 1304717. [Google Scholar] [CrossRef]
  40. Park, K.; Jin, H.-G.; Baik, J.-J. Do heat waves worsen air quality? A 21-year observational study in Seoul, South Korea. Sci. Total Environ. 2023, 884, 163798. [Google Scholar] [CrossRef]
  41. Nnoli, N.C.; Linder, S.H.; Smith, M.A.; Gemeinhardt, G.L.; Zhang, K. The combined effect of ambient ozone exposure and toxic air releases on hospitalization for asthma among children in Harris County, Texas. Int. J. Environ. Health Res. 2018, 28, 358–378. [Google Scholar] [CrossRef] [PubMed]
  42. Rammah, A.; Whitworth, K.W.; Symanski, E. Particle air pollution and gestational diabetes mellitus in Houston, Texas. Environ. Res. 2020, 190, 109988. [Google Scholar] [CrossRef] [PubMed]
  43. Botlaguduru, V.S.; Kommalapati, R.R.; Huque, Z. Long-term meteorologically independent trend analysis of ozone air quality at an urban site in the greater Houston area. J. Air Waste Manag. Assoc. 2018, 68, 1051–1064. [Google Scholar] [CrossRef]
  44. Michael, R.; O’Lenick, C.R.; Monaghan, A.; Wilhelmi, O.; Wiedinmyer, C.; Hayden, M.; Estes, M. Application of geostatistical approaches to predict the spatio-temporal distribution of summer ozone in Houston, Texas. J. Expo. Sci. Environ. Epidemiol. 2019, 29, 806–820. [Google Scholar] [CrossRef]
  45. Sofia, D.; Lotrecchiano, N.; Giuliano, A.; Barletta, D.; Poletto, M. Optimization of Number and Location of Sampling Points of an Air Quality Monitoring Network in an Urban Contest. Chem. Eng. Trans. 2019, 74, 277–282. [Google Scholar]
  46. Zhang, S.; Liu, H.; Tang, N.; Ali, N.; Yu, J.; Ding, B. Highly Efficient, Transparent, and Multifunctional Air Filters Using Self-Assembled 2D Nanoarchitectured Fibrous Networks. ACS Nano 2019, 13, 13501–13512. [Google Scholar] [CrossRef] [PubMed]
  47. Lyu, C.; Zhao, P.; Xie, J.; Dong, S.; Liu, J.; Rao, C.; Fu, J. Electrospinning of Nanofibrous Membrane and Its Applications in Air Filtration: A Review. Nanomaterials 2021, 11, 1501. [Google Scholar] [CrossRef] [PubMed]
  48. Lee, W.J.; Oh, S.; Park, J.-E.; Hwang, J.; Eom, H. Scalable, solvent-free transparent film-based air filter with high particulate matter 2.5 filtration efficiency. Sci. Total Environ. 2023, 895, 165197. [Google Scholar] [CrossRef]
  49. Mukherjee, F.; Singh, D. Detecting flood prone areas in Harris County: A GIS based analysis. GeoJournal 2020, 85, 647–663. [Google Scholar] [CrossRef]
  50. Dey, H.; Shao, W.; Haque, M.M.; VanDyke, M. Enhancing flood risk analysis in Harris County: Integrating flood susceptibility and social vulnerability mapping. J. Geovis. Spat. Anal. 2024, 8, 19. [Google Scholar] [CrossRef]
  51. Adepoju, O.E.; Han, D.; Chae, M.; Smith, K.L.; Gilbert, L.; Choudhury, S.; Woodard, L. Health disparities and climate change: The intersection of three disaster events on vulnerable communities in Houston, Texas. Int. J. Environ. Res. Public Health 2021, 19, 35. [Google Scholar] [CrossRef] [PubMed]
  52. City of Houston, Department of Neighborhoods, Super Neighborhoods. Available online: https://www.houstontx.gov/superneighborhoods/ (accessed on 12 May 2025).
  53. Houston Complete Communities. Available online: https://www.houstoncc.org/ (accessed on 12 May 2025).
  54. U.S. Census Bureau. (n.d.). American Community Survey 5-Year Estimates U.S. Department of Commerce 2025. Available online: https://catalog.data.gov/dataset/american-community-survey-5-year-estimates-detailed-tables-5-year-155db (accessed on 12 May 2025).
  55. Centers for Disease Control and Prevention (CDC). Available online: https://www.atsdr.cdc.gov/place-health/php/svi/index.html (accessed on 12 May 2025).
  56. EPA AirData Air Quality Monitors. Available online: https://epa.maps.arcgis.com/apps/webappviewer/index.html?id=5f239fd3e72f424f98ef3d5def547eb5&extent=-146.2334,13.1913,-46.3896,56.5319 (accessed on 12 May 2025).
  57. Centers for Disease Control and Prevention. PLACES: Local Data for Better Health. U.S. Department of Health and Human Services. 2024. Available online: https://www.cdc.gov/places (accessed on 12 May 2025).
Figure 1. Geospatial distribution of the Social Vulnerability Index (SVI) across Harris County, Texas. The map illustrates areas of varying social vulnerability, highlighting a crescent-shaped cluster of regions with the highest SVI values (0.8–1.0), predominantly located in central and eastern Harris County.
Sustainability 17 05368 g001
Figure 2. Spatial distribution of air pollutants across Harris County: (A) PM2.5 concentration, (B) diesel particulate matter (DPM) concentrations, (C) nitrogen dioxide (NO2) concentrations, (D) ozone concentrations.
Sustainability 17 05368 g002
Figure 3. Spatial distribution of health outcomes across Harris County: (A) percentage of adults with coronary heart disease; (B) percentage of adults with chronic obstructive pulmonary disease (COPD); (C) percentage of adults with asthma; (D) percentage of adults with stroke. [Black outlined areas outline the 9 City of Houston Complete Communities within Harris County].
Sustainability 17 05368 g003
Figure 4. Relationship between Social Vulnerability Index (SVI) and air quality indicators in Harris County. (A) Particulate matter (PM2.5) concentration as a function of SVI. (B) Diesel particulate matter (DPM) concentration as a function of SVI. (C) Nitrogen dioxide (NO2) concentration as a function of SVI. (D) Ozone concentration as a function of SVI (regression equations for all panels can be viewed in Table S1 in Supplementary Information).
Sustainability 17 05368 g004
Figure 5. Relationship between Social Vulnerability Index (SVI) and health outcomes in Harris County. (A) Percentage of adults with coronary heart disease as a function of SVI. (B) Percentage of adults with chronic obstructive pulmonary disease (COPD) as a function of SVI. (C) Percentage of adults with asthma as a function of SVI. (D) Percentage of adults with stroke as a function of SVI (regression equations for all panels can be viewed in Table S1 in the Supplementary Information).
Sustainability 17 05368 g005
Figure 6. Relationship between PM2.5 and health outcomes in Harris County. (A) Percentage of adults with coronary heart disease as a function of PM2.5. (B) Percentage of adults with chronic obstructive pulmonary disease (COPD) as a function of PM2.5. (C) Percentage of adults with asthma as a function of PM2.5. (D) Percentage of adults with stroke as a function of PM2.5. The values plotted on the x-axis represent the percentile rank of annual mean days above the PM2.5 regulatory standards for a given census tract as compared to all census tracts in the United States. An illustrative regression line is shown on Panel C (regression equations for all panels can be viewed in Table S1 in the Supplementary Information).
Sustainability 17 05368 g006
Figure 7. Relationship between ozone and health outcomes in Harris County. (A) Percentage of adults with coronary heart disease as a function of ozone. (B) Percentage of adults with chronic obstructive pulmonary disease (COPD) as a function of ozone. (C) Percentage of adults with asthma as a function of ozone. (D) Percentage of adults with stroke as a function of ozone. The values plotted on the x-axis represent the percentile rank of annual mean days above the ozone regulatory standards for a given census tract as compared to all census tracts in the United States. Each dot represents a census tract (different colors for each census tract are used for illustration purposes).
Sustainability 17 05368 g007
Figure 8. Correlation analyses illustrating relationships between socioeconomic and health factors in Harris County: (A) percentage of adults living in poverty vs. percentage of adults lacking healthcare; (B) percentage of adults living in poverty vs. percentage of adults with asthma.
Sustainability 17 05368 g008
Disclaimer/Publisher’s Note: The statements, opinions and data contained in all publications are solely those of the individual author(s) and contributor(s) and not of MDPI and/or the editor(s). MDPI and/or the editor(s) disclaim responsibility for any injury to people or property resulting from any ideas, methods, instructions or products referred to in the content.

