Article

Climate Change Risk Perception, Adaptive Capacity and Psychological Distance in Urban Vulnerability: A District-Level Case Study in Istanbul, Türkiye

Department of Civil Engineering, Bogazici University, Istanbul 34342, Türkiye
*
Author to whom correspondence should be addressed.
Sustainability 2025, 17(12), 5358; https://doi.org/10.3390/su17125358
Submission received: 22 April 2025 / Revised: 1 June 2025 / Accepted: 6 June 2025 / Published: 10 June 2025

Abstract

:
Urban climate resilience is shaped by both direct exposure to environmental risks and cognitive, socioeconomic and institutional factors. This study investigates climate change risk perception (CCRP), psychological distance (PD) and adaptive capacity (AC) across five districts of Istanbul: Beşiktaş, Kadıköy, Kağıthane, Şişli and Üsküdar, using a structured survey (sample size = 500) and advanced multivariate statistical modeling to explore the factors influencing adaptive behavior. To evaluate perceptual and behavioral responses to climate threats, the study constructs both equal-weighted indices and indices derived through principal component analysis (PCA). ANOVA and chi-square tests reveal significant district-level differences in risk perception and adaptation engagement. PCA results validate the internal structure of the indices by identifying latent dimensions such as institutional confidence, emotional proximity and self-efficacy. Correlation and regression analyses confirm that CCRP and PD significantly predict AC in theoretically meaningful patterns. Structural equation modeling (SEM) demonstrates both direct and indirect pathways linking climate risk perception to adaptive capacity, highlighting the complex interplay of these variables. Mediation analysis shows that PD partially mediates the CCRP–AC relationship, accounting for 39.7% of the total effect. Cluster analysis identifies distinct cognitive profiles where proactive adaptation behaviors are more common in affluent districts while disengagement is more prevalent in low-income areas. These findings underscore the importance of localized communication efforts, institutional credibility and financial equity in shaping effective climate adaptation. By integrating perceptual and structural dimensions, the study advances a multidimensional understanding of urban climate readiness and offers empirical guidance for socially equitable resilience policy design.

1. Introduction

Climate change is a defining challenge of the 21st century, presenting complex and layered risks to urban environments. As global temperatures rise, cities are increasingly vulnerable to extreme weather events, flooding, sea-level rise and heat stress, exacerbated by rapid urbanization and infrastructure deficits [1,2,3,4]. These risks are exacerbated by fragmented governance and limited community-level adaptation [5,6,7,8,9,10]. However, vulnerability to these risks is not evenly distributed and urban climate resilience extends beyond physical exposure. Differences in socioeconomic status, institutional trust and individual perceptions of climate change affect how they see and respond to climate change [11,12]. Addressing this complexity is essential for developing equitable, evidence-based adaptation policies that enhance urban resilience in rapidly growing metropolitan regions such as Istanbul [8,10,13,14].
Enhancing urban climate resilience requires more than investment in physical infrastructure. It also involves understanding how people interpret risks and what motivates them to respond [11,12]. A growing body of research highlights climate change risk perception (CCRP) as a key determinant of adaptation behavior, yet perception alone does not consistently lead to action [15,16,17,18]. While individuals who perceive climate threats as severe and immediate are more likely to engage in protective behaviors, psychological distance (PD) often inhibits action by framing climate risks as temporally, spatially or socially distant [19,20,21]. In cities, economic priorities often overshadow environmental risks, reducing engagement [3,12,22]. Psychological distance reduces the perceived urgency of climate threats and is associated with lower motivation to engage in adaptive behaviors [23,24]. Studies suggest that individuals with high psychological distance exhibit weaker climate adaptation behaviors, reinforcing the need for tailored risk communication strategies that reduce perceived distance and enhance engagement with climate adaptation measures [2,3,4,23,25,26,27,28,29].
Institutional trust is another key factor influencing adaptation outcomes. Public confidence in municipal authorities, scientific organizations and civil society increases support for climate strategies, while distrust, particularly toward national agencies, may undermine public participation [30,31,32,33,34]. In cities with decentralized governance and uneven adaptation capacity, trust serves as a proxy for institutional accessibility and policy legitimacy [10,11,12,14,23,27]. Recent studies also show that clear, credible and emotionally resonant communication from trusted institutions can improve adaptation engagement [3,18,26,35,36,37].
Adaptive capacity (AC) is the ability of individuals and communities to prepare for and respond to climate hazards. It depends on several interconnected factors, including socioeconomic resources, institutional trust and personal agency [1]. Individuals with higher incomes usually have greater adaptive capacity because they have better access to financial resources, climate knowledge and institutional support. This enables them to take proactive steps like improving their homes, upgrading infrastructure and joining community resilience programs [2,3,18]. In contrast, low-income communities often lack financial resources and access to information which limits their ability to adapt and increases their vulnerability, even when they are aware of climate risks [38]. Empirical studies show that financial constraints are among the most significant barriers to climate adaptation, particularly in low-income districts where basic needs are the priority [11,12]. These disparities often intersect with perceived institutional inefficacy and psychological distance, compounding vulnerability [8,10,29,39,40,41]. Given these disparities, understanding how climate risk perception, psychological distance and institutional trust influence adaptive capacity is crucial for designing policies that facilitate equitable adaptation across urban populations [23,24,27].
Istanbul, Türkiye’s largest metropolis, presents a compelling case study for examining the intersection of CCRP, PD and AC within an urban climate resilience framework. As a rapidly urbanizing megacity, Istanbul faces multiple climate risks, including rising temperatures, intensified urban heat island effects and recurrent flooding, exacerbated by uncontrolled urban expansion and aging infrastructure [8,42]. Adaptation behaviors differ across districts due to socioeconomic variation and trust levels [2,3,18]. Among Istanbul’s 39 districts, Beşiktaş, Kadıköy, Kağıthane, Şişli and Üsküdar were selected for this study due to their distinct socioeconomic compositions and differing levels of climate risk exposure. Beşiktaş and Kadıköy, affluent and well-educated districts, exhibit higher climate awareness and stronger engagement with adaptation strategies [43,44,45]. In contrast, Kağıthane and Üsküdar with lower socioeconomic indicators, face compounded vulnerabilities due to weaker adaptation measures, lower institutional trust and financial constraints limiting individual adaptation efforts [11,12,42,45]. Şişli, a high-density commercial and residential hub, presents a unique combination of economic resilience and climate vulnerability [42,44,45].
This study examines how CCRP, PD, institutional trust and financial constraints influence adaptation behaviors across five socioeconomically diverse districts in Istanbul. It addresses three primary research objectives: (1) to assess how climate risk perception varies across socioeconomic groups; (2) to examine the influence of psychological distance on adaptation behavior and (3) to evaluate how socioeconomic vulnerability and institutional trust affect adaptive capacity. Guided by these objectives, four hypotheses are tested: H1: Individuals with higher climate risk perception exhibit greater adaptive capacity; H2: Lower psychological distance to climate risks is associated with stronger adaptation behavior; H3: Institutional trust positively influences both climate risk perception and adaptive capacity; H4: Financial and informational constraints reduce adaptive capacity in socioeconomically vulnerable districts.
To address these questions, the study employs a structured household survey (n = 500) and a suite of multivariate statistical techniques, including ANOVA, chi-square tests, correlation analysis and multiple regression modeling. Composite indices of CCRP, PD and AC are calculated using equal-weighted item averages to ensure interpretability and enable district-level comparison. In parallel, principal component analysis (PCA) is applied to validate underlying factor structures and capture latent cognitive dimensions. Both equal-weighted and PCA-derived indices are included in regression and mediation models to assess consistency and robustness. Structural equation modeling (SEM) is used to test direct and indirect relationships among the variables and cluster analysis is applied to identify shared adaptation profiles across districts.
The findings contribute to climate adaptation research by demonstrating how risk perception, psychological distance and institutional trust interact to shape urban resilience. Results underscore the importance of localized adaptation policies that account for socioeconomic disparities, enhance institutional credibility and reduce psychological barriers to engagement. Districts with higher climate risk perception, lower psychological distance and greater institutional trust exhibit stronger adaptive capacity while low-income districts with financial constraints and governance skepticism demonstrate reduced engagement in climate adaptation. The study aligns with global climate adaptation frameworks, including the IPCC’s urban resilience agenda [46], UNFCCC adaptation strategies [47] and the EU Green Deal [48], reinforcing the need for equitable and participatory climate policies in rapidly urbanizing cities [49,50,51]. By integrating behavioral insights with institutional trust and cognitive dimensions, this research advances the discourse on urban climate adaptation, providing policymakers with actionable recommendations to strengthen resilience in socially and economically diverse communities.

2. Theoretical Framework

Climate change adaptation in urban environments is influenced by a complex interplay of psychological, socioeconomic and institutional factors. While climate science provides empirical evidence on environmental threats, public responses are shaped by how individuals perceive, internalize and respond to these threats within their cognitive and social environments [1,2,28]. Understanding how these dimensions interact is critical for developing targeted adaptation strategies that address not only objective risk exposure but also the cognitive and structural barriers shaping adaptation behavior [6,7,8,40]. This section refines the theoretical foundation of this study by integrating insights from risk perception, psychological distance, social vulnerability and governance to offer a comprehensive analytical framework for climate adaptation in Istanbul’s urban landscape [9,10].

2.1. Climate Risk Perception and Adaptation Behavior

Risk perception is a central determinant of climate adaptation, as individuals who perceive climate risks as immediate and severe are more likely to engage in protective behaviors [15,16,28]. However, climate risk perception is shaped not only by information but also by personal experience, social norms, media exposure and trust in information sources [7,32,52]. Despite scientific consensus on climate change, individual interpretations often diverge from expert assessments, influenced by cognitive biases, political ideology and misinformation [8,20,23]. Recent studies confirm that higher risk perception significantly increases climate-related actions [14,53], suggesting that individual engagement rises as climate threats become more personally relevant [9,10,54]. Affective components such as anxiety and concern also mediate this link, making engagement a key variable [24,37].
Within urban contexts, climate risk perception is further shaped by socioeconomic status and place-based experiences [41,55]. Residents of flood-prone districts may perceive climate risks as more tangible and urgent compared to those in economically stable areas with robust infrastructure [42]. However, risk perception alone does not necessarily translate into action. Many individuals acknowledge climate risks but fail to take adaptive measures due to psychological, financial and institutional barriers [8,56]. Therefore, understanding how risk perception interacts with psychological distance, vulnerability and trust in institutions is essential for explaining adaptation behavior in urban populations. Recent studies highlight that perceived institutional credibility and procedural fairness enhance the translation of perception into action [7,13].

2.2. Psychological Distance and Inaction in Urban Adaptation

Psychological distance occurs when individuals perceive climate risks as temporally delayed, geographically remote or socially detached [16,19,28]. This reduces adaptation engagement, particularly when climate communication emphasizes long-term threats rather than immediate risks [57,58]. Moreover, this distance is further shaped by digital infrastructures and urban modernization which can distort citizens’ temporal and spatial proximity to climate impacts [7,39]. Effective adaptation strategies must therefore emphasize local, immediate and personally relevant climate impacts while engaging trusted messengers [8,59,60]. PD is closely associated with perceived self-efficacy and agency; individuals who feel detached are also less likely to believe their actions matter [9,10,23,29,39].
The perceived remoteness of climate risks often stems from political narratives and institutional ambiguity, not from ignorance [61]. A recent study suggests that it is useful to examine how psychological distance affects climate impact perception, policy understanding and individual behavior to better explain how people think and act on climate issues [14,50].
In Istanbul, economic inequalities further exacerbate psychological distance. Wealthier districts may view adaptation as a long-term concern, while lower-income communities prioritize immediate economic survival over future climate risks [2,5,41]. Bounded rationality theory [62] explains this behavior, as financial constraints and cognitive overload lead individuals to prioritize short-term necessities over adaptation [11]. Institutional trust further shapes adaptation behavior where lower-income communities often perceive government-led policies as inaccessible or ineffective [5,8,63]. This dynamic has been shown to deepen perceptions of exclusion, further widening the psychological gap between individuals and institutions [7,25].

2.3. Adaptive Capacity and Climate Readiness

Adaptive capacity is the ability to prepare for, respond to and recover from climate threats [1,9,10]. It depends on a range of factors including income, education, access to information and institutional support [7,11]. Multiple forms of capital including social, financial and informational are critical determinants of adaptive capacity [41,61]. In recent assessments, perceptions of adaptive readiness are shaped by everyday environmental concerns, not long-term climate projections [8,25]. Studies also emphasize that adaptive capacity is highly contextual, varying with perceived control, emotional engagement and past exposure [14,64,65]. Key factors include:
  • Financial resources: Wealthier communities can invest in climate adaptation, while lower-income groups struggle with basic necessities [41,58];
  • Self-efficacy: People who feel capable of making a difference are more likely to act [15,28];
  • Community networks: Stronger social ties promote collective adaptation efforts [7,66].
Wealthier districts show higher AC due to better infrastructure, financial security and responsive governance. Research confirms that financial and institutional resources allow affluent communities to implement proactive adaptation strategies [8,67]. In contrast, lower-income districts have lower AC, weaker disaster preparedness and less engagement in adaptation efforts [2,41]. Research indicates that climate adaptation policies that neglect these inequalities risk reinforcing existing patterns of vulnerability [2,9,10,51].

2.4. Vulnerability and Structural Constraints on Adaptation

Climate vulnerability extends beyond physical exposure. It is deeply shaped by socioeconomic inequality, governance capacity and access to resources [1,38,68]. Socially vulnerable groups, including low-income households, marginalized communities and informal sector workers, are disproportionately affected by climate risks due to their limited financial resources, precarious housing conditions and lower access to climate information [11,69,70]. Even in cities with strong climate policies, vulnerable groups are often left out because adaptation plans do not fully consider social and economic inequality [71,72]. These disparities are further deepened when institutional quality is low, limiting public trust and adaptive investment [35,73]. Recent urban studies show that climate policy often reinforces existing patterns of exclusion, particularly in fast-developing cities [36,67,68].
In rapidly urbanizing cities like Istanbul, informal settlements and inadequate infrastructure further exacerbate climate vulnerability [42,70]. Residents in these areas face compounded risks due to weak social safety nets, economic instability and exclusion from formal governance structures [66,72]. Moreover, studies indicate that individuals with lower socioeconomic status are less likely to invest in private adaptation measures, such as improving home insulation or adopting flood-resistant construction, due to financial constraints and rental insecurity [73,74]. Empirical data suggest that households with fewer assets and less access to financial instruments face disproportionately higher barriers to adaptation, even when risk awareness is high [68,75]. These disparities underscore the need for equitable, community-based adaptation policies that account for both financial and structural constraints. Place-based interventions, particularly those involving co-produced adaptation, have shown potential to close these gaps [49,50,70].
Targeted financial incentives, such as climate adaptation subsidies and investment in resilient infrastructure, have been identified as critical solutions [5,73]. Strengthening municipal adaptation efforts and integrating climate resilience into urban planning can mitigate social vulnerability [49,72]. Inclusive governance and equitable access to resources are essential for building long-term urban resilience [68,70].

2.5. Institutional Trust and Climate Adaptation Governance

Institutional trust shapes how individuals interpret climate risks, comply with adaptation initiatives and participate in resilience-building efforts [30,31,70]. High-quality institutions are consistently associated with lower climate vulnerability as they facilitate transparent decision-making and credible communication [35,68]. High trust increases policy legitimacy and public cooperation. When residents believe that institutions implement policies transparently and fairly, trust increases and so does willingness to cooperate [72,76]. In contrast, low trust leads to skepticism, particularly when governance is perceived as ineffective or exclusionary [2,23,73]. Recent evidence confirms that institutional quality can directly reduce climate vulnerability by enhancing adaptive capacity through better governance mechanisms [35,36,70].
Urban governance systems that coordinate adaptation across multiple spatial and institutional scales tend to be more effective in addressing social vulnerability [6,68]. Historical governance patterns and past adaptation failures contribute to distrust, particularly in marginalized communities that have experienced limited inclusion in climate planning [70]. Cultural cognition theory [63] explains variations in trust. People interpret policies through social and political identities. In lower-income communities, skepticism is often linked to exclusionary policy histories or perceptions that adaptation efforts primarily benefit elites [5,32,72]. This aligns with findings that perceived exclusion from governance processes lowers willingness to engage in adaptation measures [54,73]. Contradictory climate messaging and fragmented adaptation strategies further weaken public trust [15,70]. Evidence from comparative city studies confirms that procedural justice and institutional responsiveness improve citizen engagement in adaptation [25,68].
In Istanbul, trust varies by district, reflecting differences in municipal governance structures. Recent research suggests that trust in local authorities is particularly vital in cities where adaptation planning must respond to district-level differences in vulnerability [51,70]. Some communities engage with local governments due to proactive adaptation efforts, while others rely on alternative trust mechanisms, such as NGOs and grassroots networks, when formal governance is perceived as inadequate [5,72]. These trust dynamics show how institutional credibility influences climate adaptation across different urban contexts.

2.6. Integrating Perception, Psychological Distance, Adaptive Capacity and Vulnerability

Effective climate adaptation requires a multidimensional framework that integrates CCRP, PD, AC and vulnerability. Adaptation behavior is influenced not just by awareness of climate hazards, but also by individuals’ perceived ability to act, the institutional environment and cognitive biases [20,57,68]. Gaps between perceived and actual climate risks often lead to inaction, especially when adaptation seems irrelevant or out of reach. This integration reflects an emerging consensus in adaptation science that behavioral and structural factors must be addressed jointly [5,40,70].
A localized, participatory approach is essential to addressing the uneven distribution of climate risks and adaptive capacity. Policies must reflect the specific needs and vulnerabilities of different districts [11,72]. Targeted risk communication strategies are needed to reduce the psychological distance by emphasizing the immediacy and localized impact of climate threats [73,77]. Strengthening institutional trust through transparent and inclusive governance can increase public engagement and collective adaptation [2,30,70].
This study applies these concepts to Istanbul, examining how the interaction of key factors influences adaptation across five districts. The findings provide evidence for policy solutions that promote resilience in socioeconomically diverse areas. This work contributes to the broader climate governance literature by supporting strategies that build trust, address inequality and strengthen community capacity for proactive adaptation [70,72].

3. Methods and Data

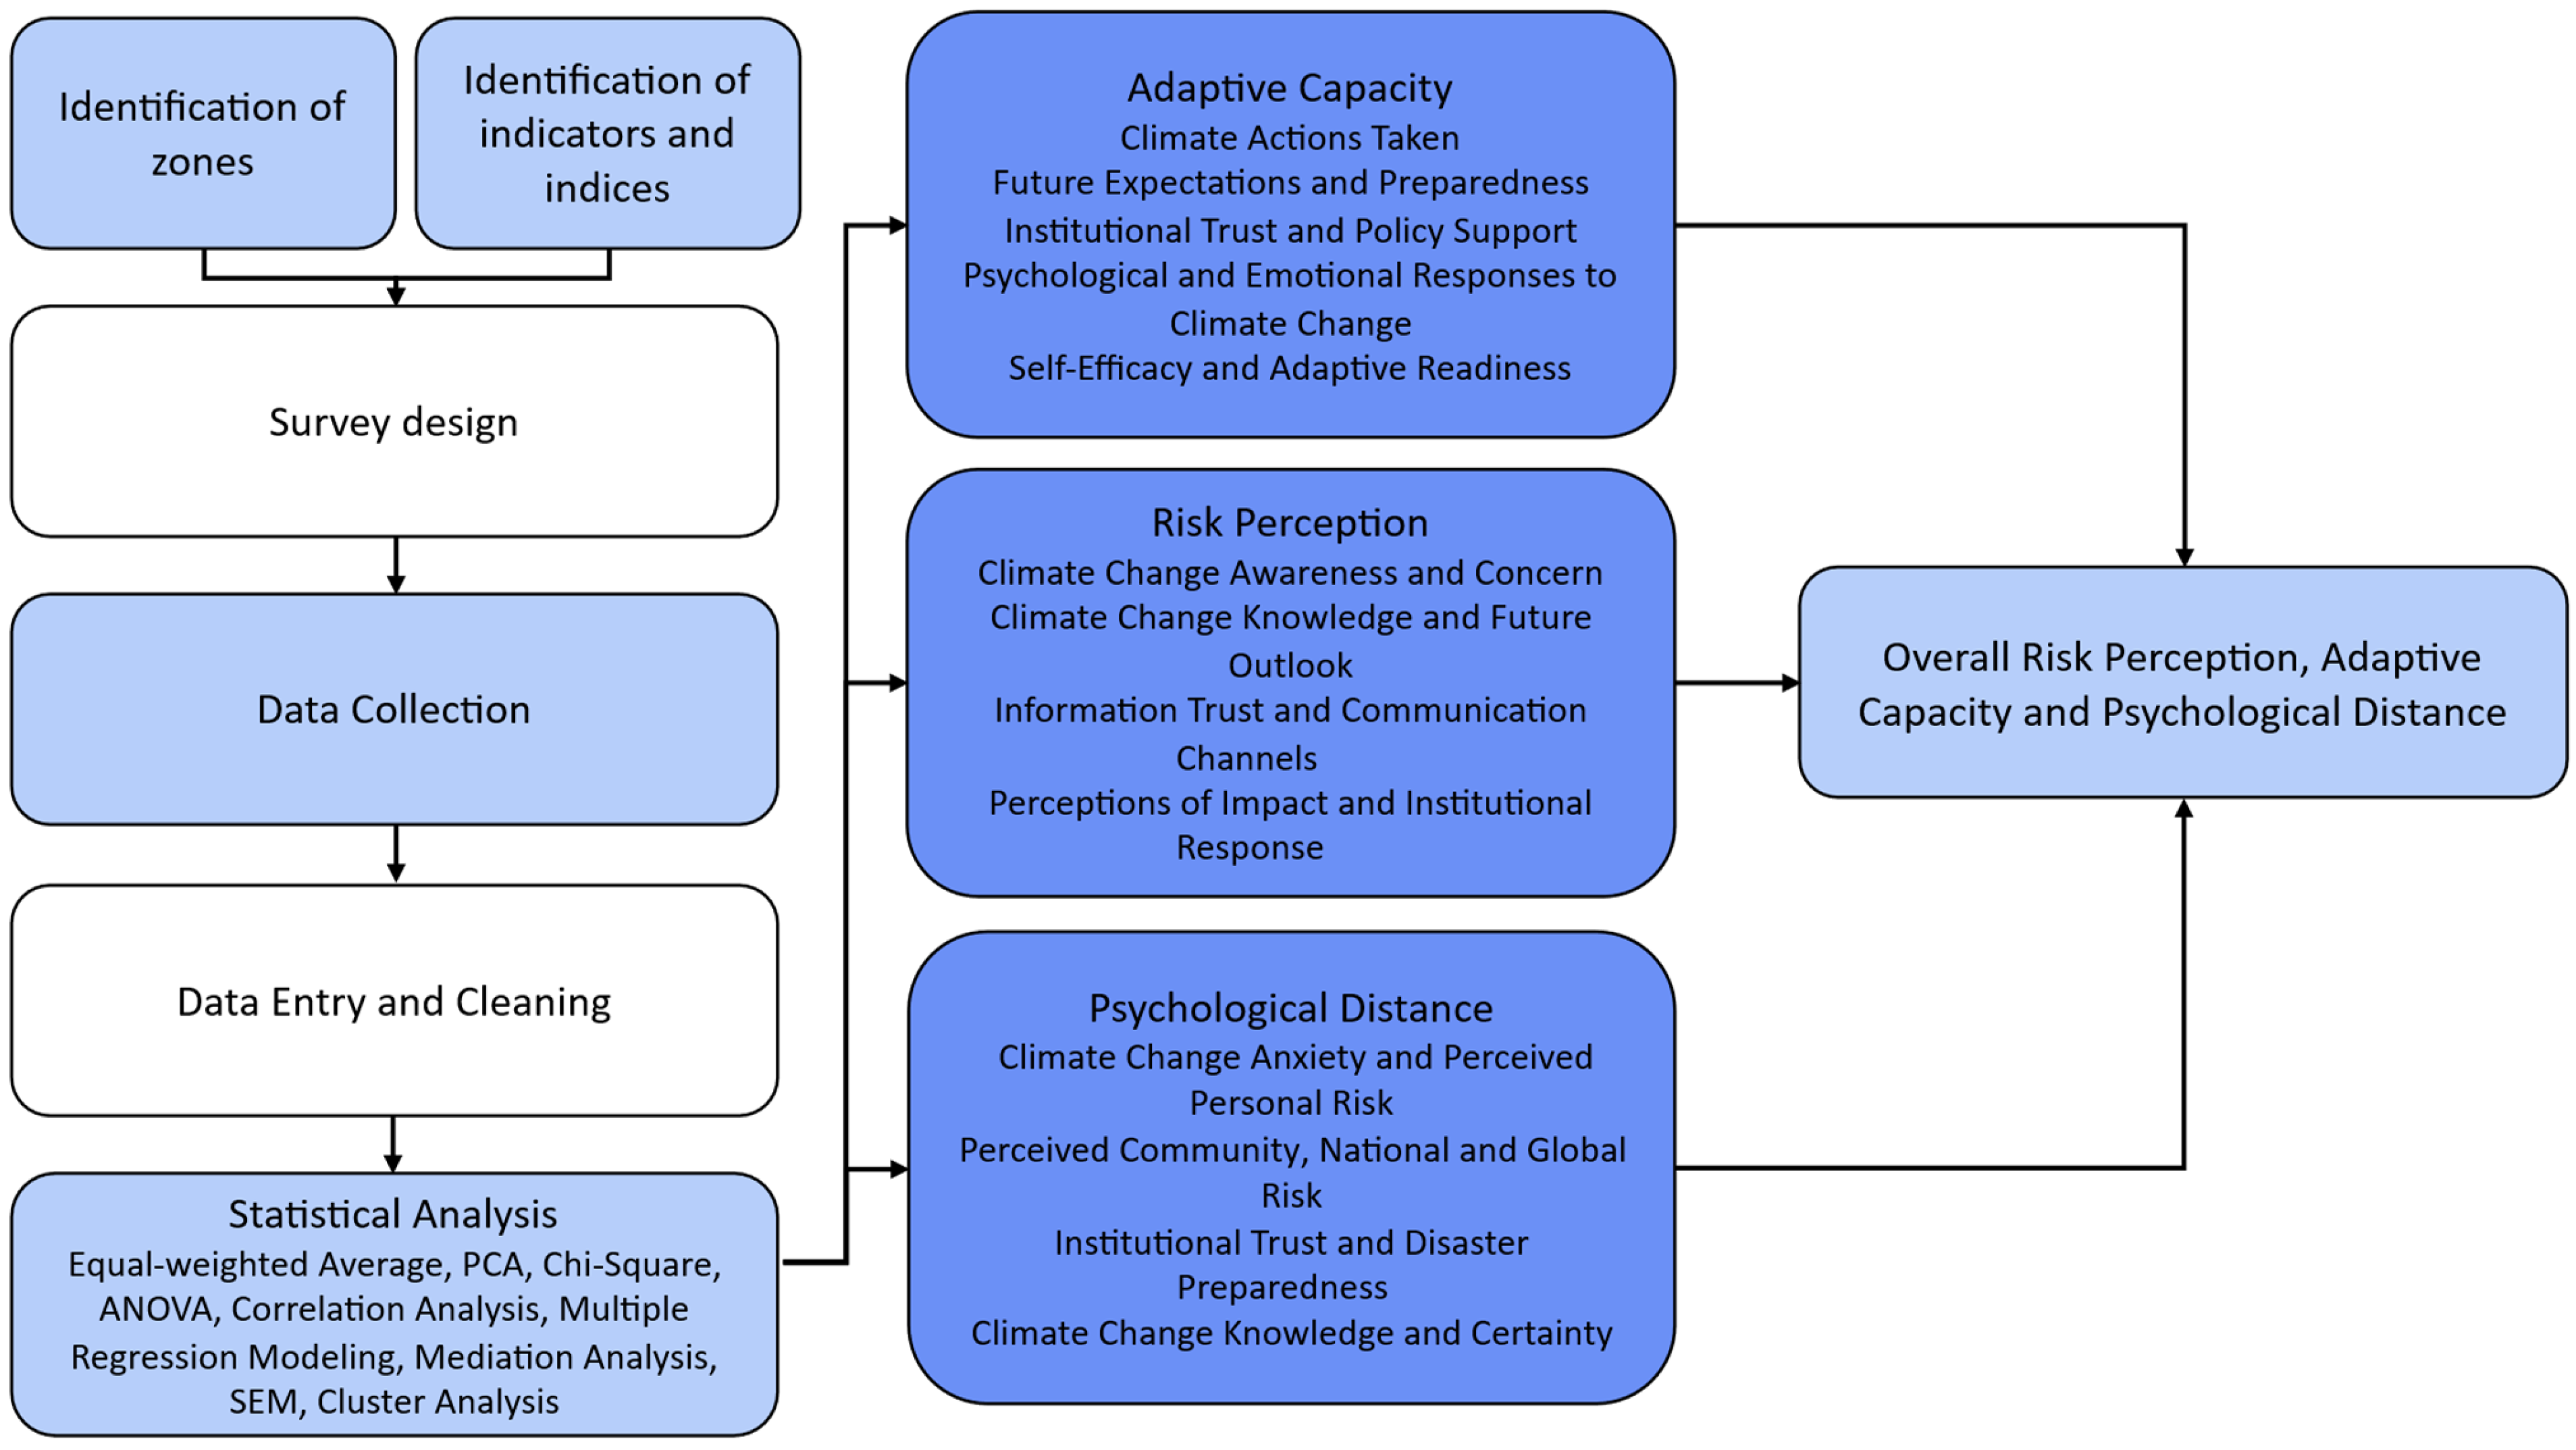
This study applies a quantitative design to examine the relationship between CCRP, PD and AC across five socioeconomically diverse districts in Istanbul. The methodological framework integrates structured survey data with advanced statistical modeling to examine variations in climate risk perception and adaptation behaviors across different socioeconomic and geographic contexts. This approach ensures a robust empirical foundation for assessing urban climate resilience and informing localized adaptation strategies. A general overview of the methodology is described in Figure 1.

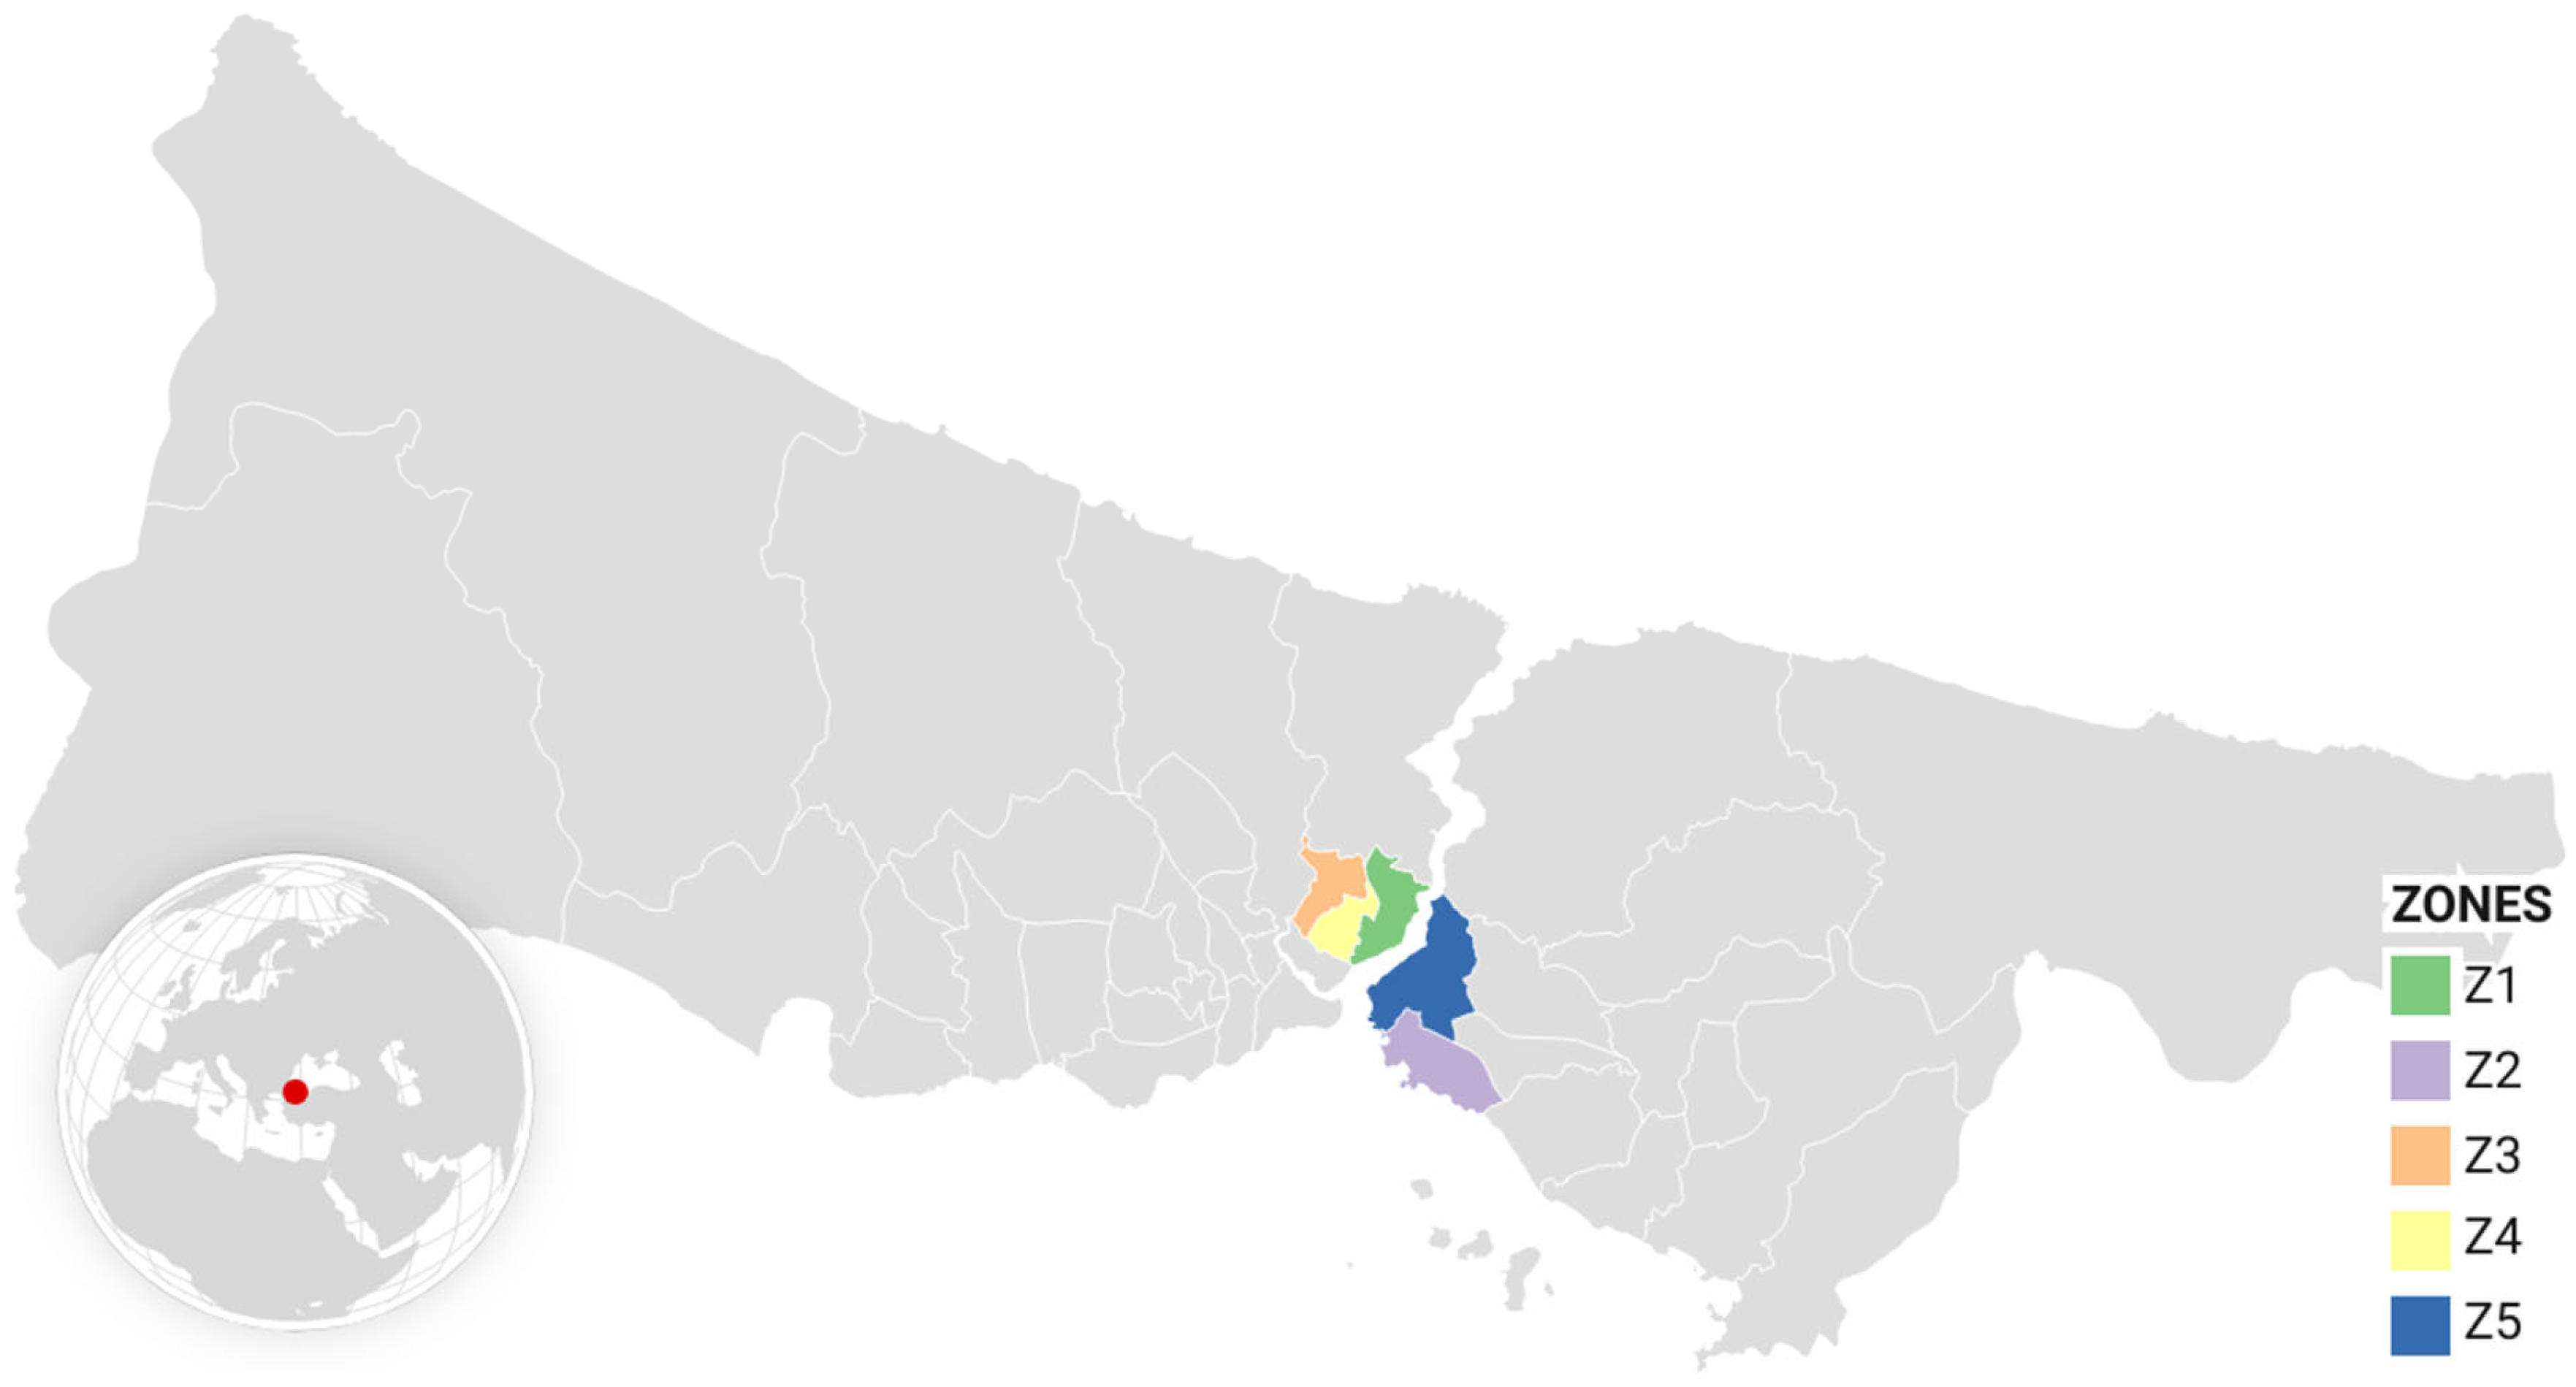
3.1. Case Study Area Selection: Istanbul, Türkiye

Istanbul represents an ideal case study for urban climate vulnerability and adaptation research due to its unique geographic exposure, rapid urbanization wide socioeconomic disparities. As Türkiye’s largest city, hosting 18.34% of the national population [78], it faces a complex interplay of risks including urban flooding, coastal inundation, heatwaves and extreme precipitation events. However, the distribution of climate risk perception, adaptation behaviors and institutional trust varies widely across the city, influenced by differences in income, governance structures and access to adaptation resources [42,70].
Five districts were selected:
  • Beşiktaş and Kadıköy are relatively affluent, well-educated and politically engaged districts with stronger municipal climate policies [43,44];
  • Kağıthane is a rapidly urbanizing district with lower income levels and high flood risks due to inadequate drainage infrastructure [42];
  • Şişli is a high-density commercial and residential hub, experiences urban heat island effects due to limited green spaces [44];
  • Üsküdar is situated along the Bosphorus coastline and is prone to sea-level rise, storm surges and recurrent flooding [2].
These districts provide a representative sample of Istanbul’s broader urban dynamics, enabling a comparative analysis of how socioeconomic conditions, institutional trust and psychological distance influence climate adaptation behaviors (Figure 2).

3.2. Survey Design, Index Construction and Data Collection

A structured online survey was conducted in February 2025 to assess climate change risk perception, psychological distance, adaptation behaviors and institutional trust across the selected districts. The survey used a five-point Likert scale (1 = Strongly Disagree to 5 = Strongly Agree) and included four components:
  • Demographics: District of residence, age, gender, education level, employment type, income bracket and housing type;
  • Climate Change Risk Perception Index (CCRP): Media engagement, climate concern, perceived climate impact, trust in climate communication sources and hazard severity perception (Table 1, Equation (1));
  • Psychological Distance Index (PD): Climate anxiety, immediacy of threat, perceived local versus global climate impact and personal relevance (Table 2, Equation (2));
  • Adaptive Capacity Index (AC): Proactive adaptation behaviors, institutional trust, financial commitment to adaptation and perceived barriers to climate action (Table 3, Equation (3)).
To construct the CCRP, PD and AC indices, two complementary strategies were used. First, equal-weighted scores were calculated by taking the arithmetic average of all relevant indicators within each index. This ensured clarity and comparability across districts. Second, principal component analysis (PCA) was applied to examine the internal structure of each index and to generate weighted scores that reflect the most meaningful underlying patterns. PCA helped reduce dimensionality and account for correlations among items providing a more refined view of each construct. For each index, the first principal component was selected since it explained the most variance and matched the theoretical concept. PCA-based scores were used together with unweighted scores in regression, mediation and structural equation models to improve the strength and reliability of the analysis [79,80,81,82,83]. The survey was pilot-tested with 50 participants to confirm clarity and reliability.
Table 1. Indicators used to assess climate change risk perception.
CategoriesQuestions and IndicatorsEmpirical References
Climate Change Awareness and Concern
Media & Information Engagement10. I often follow climate change-related news.[55]
Concern Level11. How concerned are you about climate change?[52,84,85]
Perceived Direct Impact13. Do you think climate change has directly affected Istanbul in recent years?[55]
Climate Change Knowledge and Future Outlook
Scientific Literacy14. How well do you understand the causes and impacts of climate change?[86]
Future Generational Outlook15. Do you believe climate change will affect future generations more than the current one?[55]
Hazard Severity Perception16. How would you describe the severity of climate change risks in Istanbul?[69]
Information Trust and Communication Channels
Trust in Climate Communication27. How much do you trust the information you receive linked to climate change from different sources? ((a). Government agencies, (b). Local municipalities, (c). Environmental NGOs & activists, (d). Scientific community & universities, (e). Traditional media, (f). Social media & online platforms)[31]
Perceptions of Impact and Institutional Response
Urban Risk Sensitivity33. How concerned are you about the effects of climate change on Istanbul?[55]
Personal Climate Relevance34. How personally significant is the issue of climate change to you?[52]
Institutional Confidence35. How much confidence do you have in Turkish government policies to mitigate and adapt to climate change?[32,87]
The overall CCRP score is calculated as the average of all individual indicators used to assess climate change perception and risk awareness, climate knowledge and future outlook, preparedness and perceptions of climate change impacts. The formula for the overall CCRP score is:
C C R P = X i N ,
where:
  • Xi represents each indicator score (from Q10, Q11, Q13–Q16, Q27, Q33–Q35);
  • N is the total number of indicators used in the table (10 in this case).
Each indicator is measured using a Likert scale and the final score represents the respondent’s overall climate change risk perception based on their engagement with climate information, concern levels, perceived risks, scientific literacy, institutional confidence and future expectations.
Alongside the unweighted average method, we also applied principal component analysis (PCA) to construct a composite CCRP index. This helped capture deeper patterns such as concern about climate change, institutional trust and expectations about future impacts. The PCA-based version was used in complementary analyses to check the internal consistency of the construct and the robustness of results [79,80,81,82,83]. The formula used to calculate the PCA-based CCRP score is:
C C R P P C A = i = 1 n w i . z i ,
where:
  • wi denotes the factor loading of item i on the first principal component;
  • zi represents the standardized (z-score) response to item i;
  • n is the total number of indicators used in the PCA model (10 in this case).
Table 2. Indicators used to assess psychological distance to climate change.
CategoriesQuestions and IndicatorsEmpirical References
Climate Change Anxiety and Perceived Personal Risk
Climate Anxiety28. How much do you feel anxious or fearful about the impacts of climate change?[52]
Personal Impact Expectation37. To what extent do you believe climate change will negatively impact you and your family?[55]
Future Impact Certainty43. How much do you believe climate change will affect future generations compared to today?[66]
Perceived Community, National and Global Risk
Community-Level Impact Perception38. To what extent do you think climate change will affect your broader community and society in Istanbul?[69]
Global Disparities in Impact39. How much do you think climate change will negatively impact people living in vulnerable regions of the world?[86]
Localized Threat Perception40. To what extent do you think climate change will impact people in your local district?[55]
National Impact Projection41. To what extent do you think climate change will affect people across Türkiye?[55]
Global Impact Projection42. To what extent do you think climate change will have a global impact?[52]
Institutional Trust and Disaster Preparedness
Disaster Readiness Perception36. How much trust do you place in disaster management agencies to effectively respond to climate-related hazards in Istanbul?[30]
Timeline Expectation44. In your opinion, when will Türkiye start experiencing the significant effects of climate change?[69]
Climate Change Knowledge and Certainty
Climate Reality Confidence45. How certain are you that climate change is happening?[55]
Perceived Alarmism46. Do you believe the severity of climate change is often exaggerated?[55]
Scientific Consensus Awareness47. Do you agree that most scientists support the idea that human activity is the primary driver of climate change?[52]
The overall PD Score is calculated as the average of all individual indicators assessing future expectations and preparedness, perceptions of climate change impacts, future outlook, perceptions of climate science and government action and uncertainty. The formula for the overall psychological distance score is:
P D = X i N ,
where:
  • Xi represents each indicator score (from Q28, Q36–Q47);
  • N is the total number of indicators used in the table (13 in this case).
Each indicator is measured using a Likert scale and the final score represents the extent to which respondents perceive climate change as an immediate or distant threat. Higher scores indicate lower psychological distance and stronger perceived proximity to climate risks (i.e., greater concern and perceived proximity of climate risks), whereas lower scores suggest greater psychological distance and detachment from climate change impacts.
To complement the unweighted average, we also created a PCA-based PD index. This approach revealed underlying patterns such as perceived urgency of climate threats, emotional connection and confidence in preparedness. We compared both versions in the analyses to test whether results remained consistent across different scoring methods [73,74,75,76,77]. The formula used to calculate the PCA-based PD score is:
P D P C A = i = 1 n w i . z i ,
where:
  • wi denotes the factor loading of item i on the first principal component;
  • zi represents the standardized (z-score) response to item i;
  • n is the total number of indicators used in the PCA model (13 in this case).
Table 3. Indicators used to assess adaptive capacity.
CategoriesQuestions and IndicatorsEmpirical References
Climate Actions Taken
Individual Proactiveness17. Have you taken any personal actions to reduce climate risks (e.g., energy conservation, flood-proofing your home)?[88]
Future Expectations and Preparedness
Crisis Preparedness20. If a climate-related disaster occurred in your district, how prepared do you feel?[30]
Institutional Trust and Policy Support
Community Engagement21. Have you participated in any climate awareness programs, community initiatives, or government-led climate adaptation projects?[11]
Policy Perception22. Do you believe the Turkish government is taking adequate action on climate change?[88]
Institutional Resilience23. How much do you trust the following entities to address climate change in Istanbul? ((a). Turkish government, (b). Local municipalities, (c). Environmental NGOs & activists, (d). Scientific community & universities, (e). Private sector & businesses, (f). International organizations)[32,87]
Regulatory Endorsement24. Would you support stricter environmental regulations in Istanbul?[55]
Financial Commitment25. Would you be willing to pay higher taxes or fees for improved climate resilience measures?[69]
Policy Prioritization26. I think policies should be prioritized to mitigate climate risks in Istanbul.[55]
Psychological and Emotional Responses to Climate Change
Quality of Life Impact29. To what extent do you believe climate change will affect your overall quality of life?[16]
Risk Awareness & Forecasting30. How likely do you think it is that the frequency and intensity of climate-related hazards will increase in the future?[55]
Self-Efficacy and Adaptive Readiness
Self-Efficacy in Adaptation31. How confident are you in your ability to manage and cope with the consequences of climate change?[66]
Practical Adaptation Implementation32. How well do you think you can implement known adaptation measures to address climate-related challenges?[69]
The overall AC Score is calculated as the average of all individual indicators assessing climate change knowledge and future outlook, climate actions taken, barriers to climate action, institutional trust and policy support and psychological responses to climate change. The formula for the overall adaptive capacity score is:
A C = X i N ,
where:
  • Xi represents each indicator score (from Q17, Q20–Q26, Q29–Q32);
  • N is the total number of indicators used in the table (12 in this case).
Each indicator is measured using a Likert scale and the final score reflects individuals’ ability to anticipate, manage and respond to climate-related hazards. Higher scores indicate stronger adaptive capacity, characterized by proactive engagement in climate action, trust in institutions and preparedness for climate risks, whereas lower scores suggest limited adaptation readiness due to financial, institutional or psychological constraints.
In addition to the average-based approach, we applied PCA to the AC indicators to highlight the most prominent themes such as institutional trust, belief in one’s ability to adapt and readiness to act. The PCA-based index was used in regression, SEM and clustering to explore whether findings remained stable across different measurement strategies [79,80,81,82,83]. The formula used to calculate the PCA-based AC score is:
P D P C A = i = 1 n w i . z i ,
where:
  • wi denotes the factor loading of item i on the first principal component;
  • zi represents the standardized (z-score) response to item i;
  • n is the total number of indicators used in the PCA model (12 in this case).

3.3. Sampling Strategy and Participant Recruitment

Participants were recruited using online municipal platforms, social media and targeted digital outreach. Eligibility was limited to adults (aged 18 or older) engaged in household-level climate decisions. Using Yamane’s formula with a 95% confidence level and 5% margin of error:
n = N ( 1 + N e 2 )
where:
  • N = 15,907,951 (Istanbul’s total population, [78]) and e = 0.05 (5% margin of error, ensuring a 95% confidence level) yielding a minimum sample of 400. To strengthen analysis and district comparison, 500 valid responses were collected: 100 per district.
The digital survey method ensured accessibility for urban working populations. However, it may have underrepresented digitally excluded or lower income groups, a limitation noted for future research.

3.4. Statistical Analysis and Modeling Approach

Statistical analysis was conducted using IBM SPSS Statistics Version 29.0.2.0 (20) and RStudio Version 2024.12.1 + 563. The dataset underwent multi-level statistical analysis, integrating descriptive, inferential and correlational techniques to examine district-level variations in climate perception and adaptation behavior. The following procedures were applied:
  • Descriptive Statistics: Frequency distributions and means for CCRP, PD and AC;
  • Chi-Square Tests: Assessed associations between categorical variables, including district-level differences;
  • ANOVA (F-Test): Examined mean differences in index scores across districts;
  • Correlation Analysis (Pearson’s r): Explored relationships among CCRP, PD and AC;
  • Multiple Regression Modeling: Identified predictors of adaptation behavior, including trust, perception, psychological distance and socioeconomic variables;
  • Principal Component Analysis (PCA): Validated the internal structure of each index and produced PCA-based indices;
  • Mediation Analysis: Assessed whether PD mediates the relationship between CCRP and AC;
  • Structural Equation Modeling (SEM): Confirmed hypothesized pathways and evaluated model fit;
  • Cluster Analysis: Identified distinct cognitive profiles among participants.
The indices were constructed using both unweighted averages and principal component analysis. The average method ensured clarity and comparability across districts [85]. PCA was used to identify latent patterns and reduce complexity. Using both approaches provided a stronger foundation for analysis. PCA-based scores were applied in regression, mediation, SEM and cluster analyses to assess whether the findings held across different modeling strategies. To construct the CCRP, PD and AC indices two complementary strategies were used. First, equal-weighted scores were calculated by taking the arithmetic average of all relevant indicators within each index. This ensured clarity and comparability across districts. Second, PCA was applied to examine the internal structure of each index and to generate weighted scores that reflect the most meaningful underlying patterns. PCA helped reduce dimensionality and account for correlations among items, providing a more refined view of each construct. For each index, the first principal component was selected since it explained the most variance and matched the theoretical concept. PCA-based scores were used together with unweighted scores in regression, mediation and structural equation models to improve the strength and reliability of the analysis [79,80,81,82,83].

4. Results and Discussion

This section examines how climate perception, adaptive capacity and psychological distance vary across Beşiktaş, Kadıköy, Kağıthane, Şişli and Üsküdar. It presents results from ANOVA, chi-square and correlation analyses, as well as from advanced methods including principal component analysis, multiple regression, mediation modeling, structural equation modeling and cluster analysis. Together, these methods show how differences in socioeconomic context, psychological distance and institutional trust shape urban residents’ awareness of climate risks and their ability to adapt. The findings provide both theoretical insight and practical guidance for designing targeted and equitable resilience strategies.

4.1. Socioeconomic Profile of Respondents

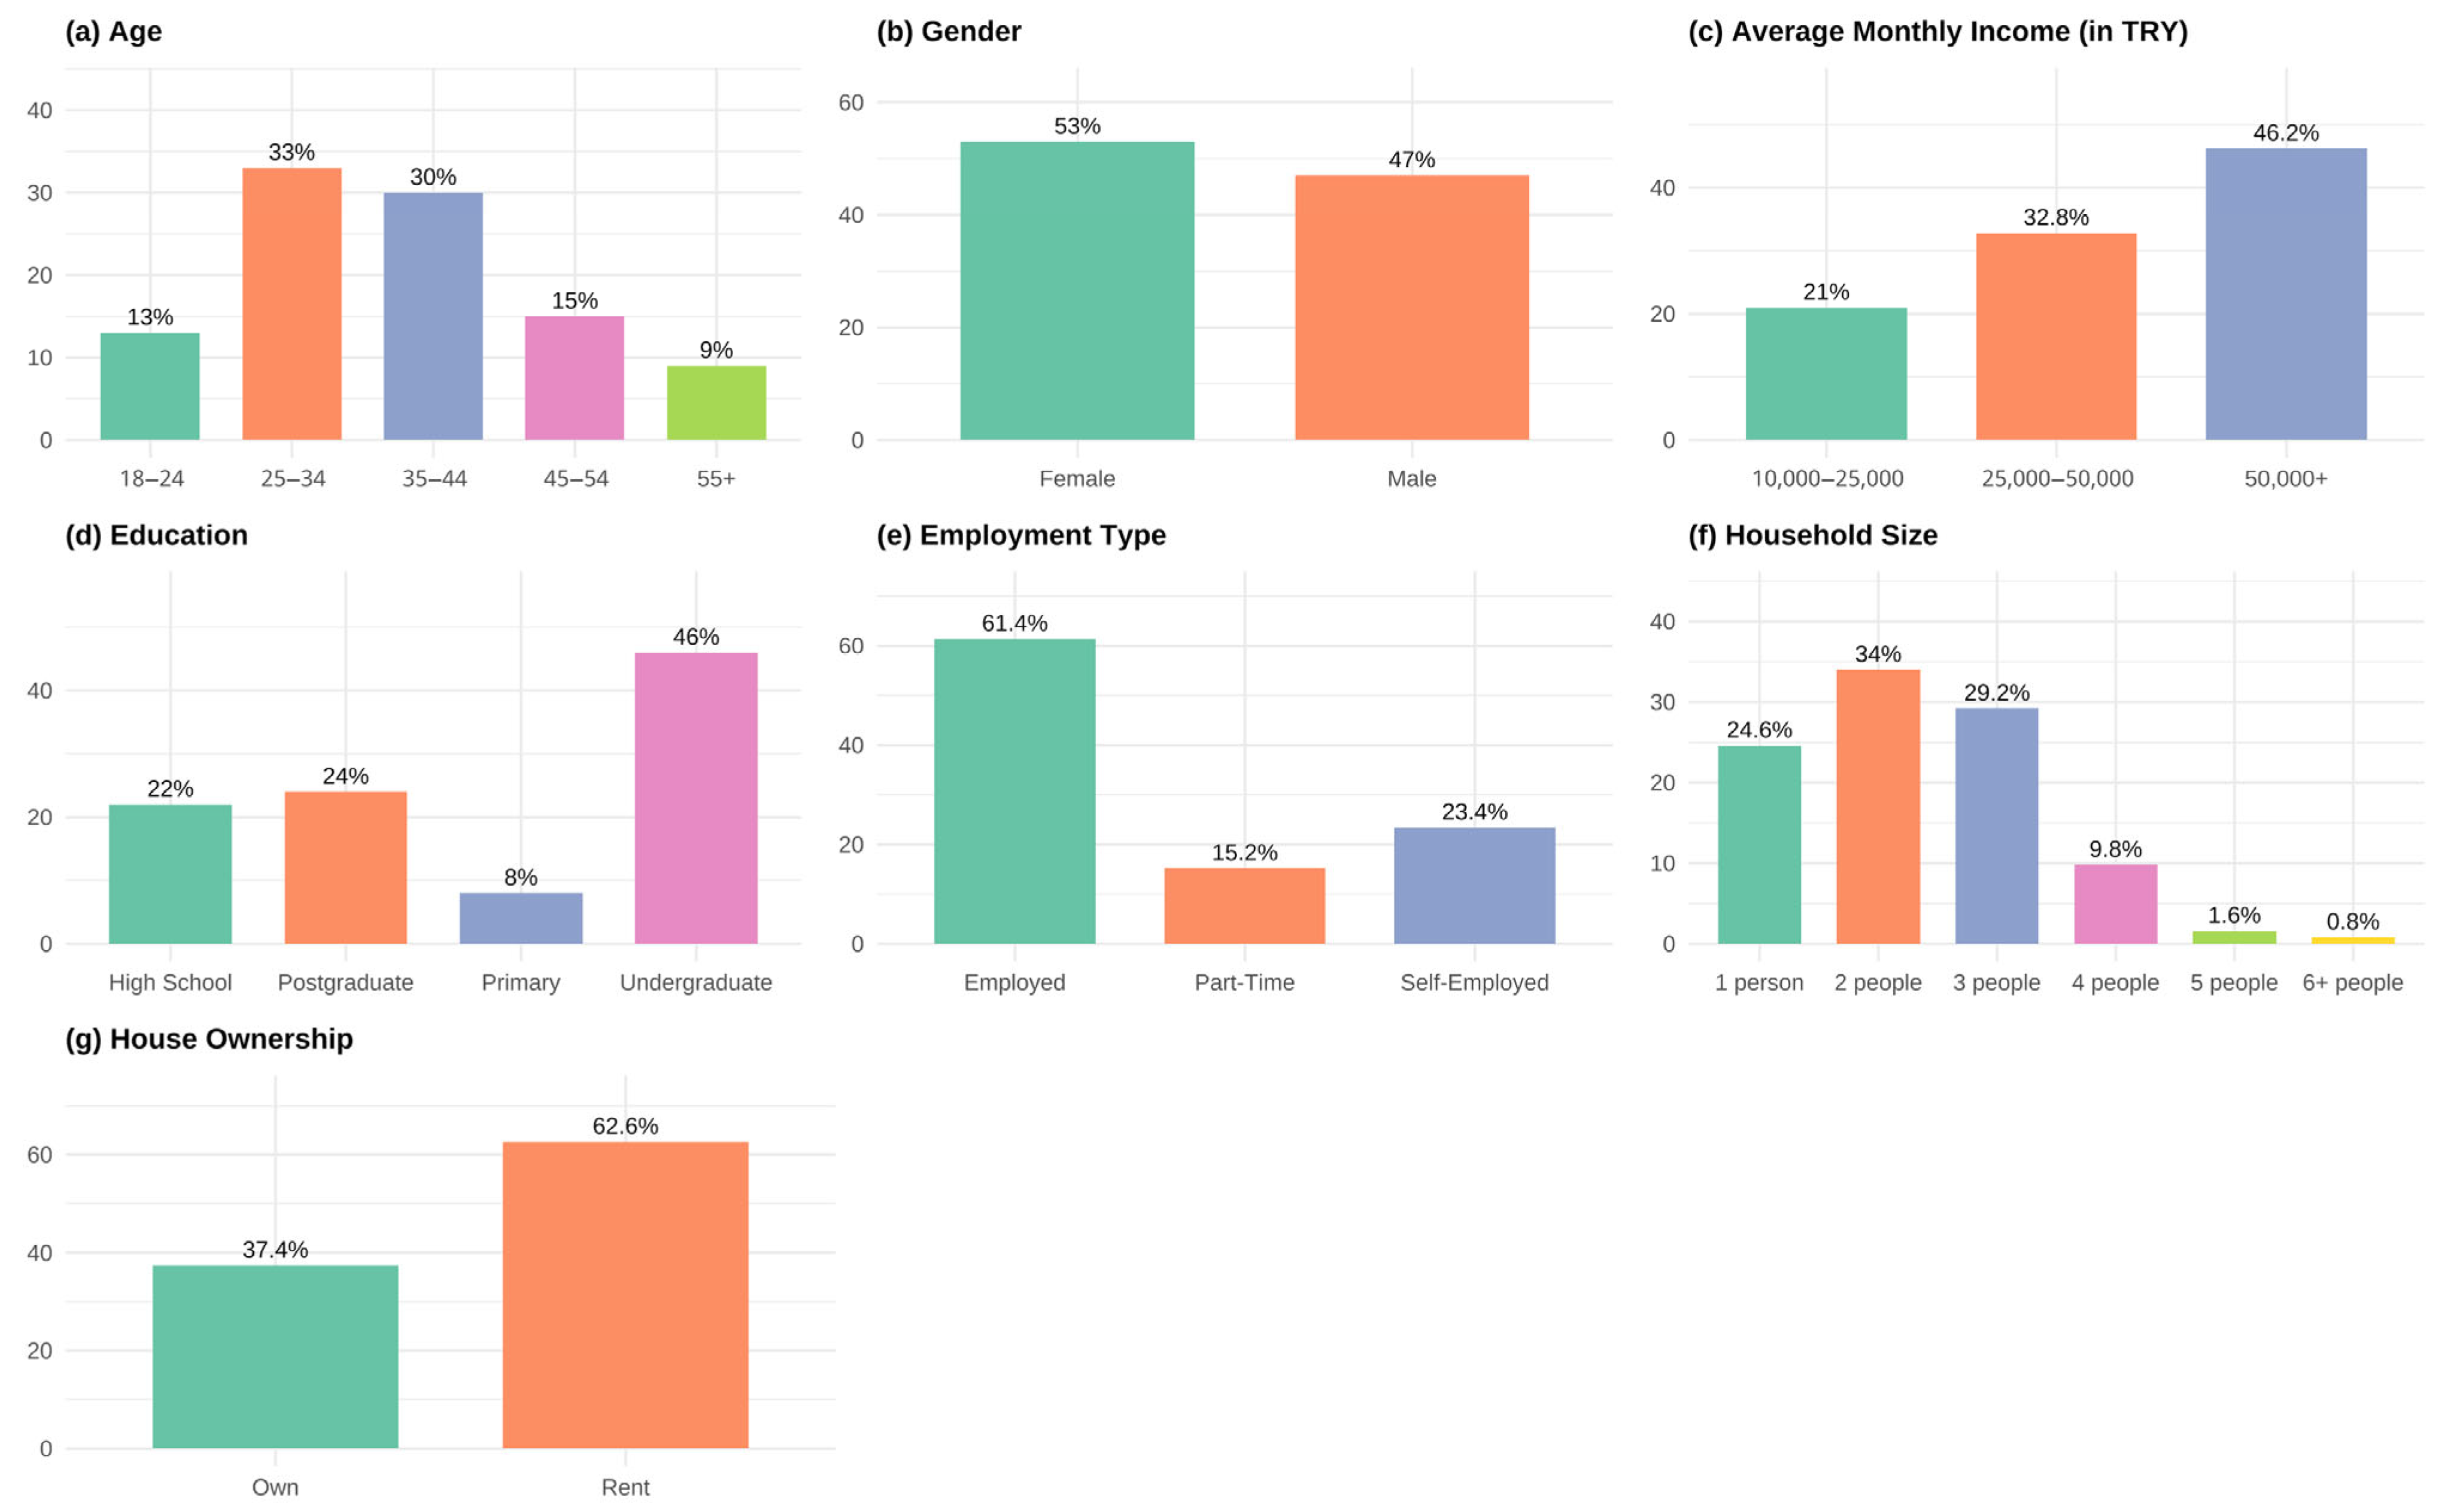
The study surveyed 500 individuals evenly distributed across five districts, focusing on working-age adults to capture perceptions of economically active urban residents. Demographic diversity was evident in age, income, education and employment (Table 4, Figure 3 and Figure 4).

4.1.1. Demographic and Socioeconomic Characteristics

Respondents were mostly aged 25–44 (63%) with a slight female majority (53%) aligning with previous studies indicating higher climate concern among women [89]. Education levels were high: 46% held undergraduate and 24% postgraduate degrees. Kadıköy and Beşiktaş had more postgraduate respondents, while Kağıthane had more with lower education. Income varied considerably: 46.2% earned above 50,000 TRY while 21% earned below 25,000 TRY which includes or falls below Türkiye’s official minimum wage of 22,104.67, 1 USD = 36.44 TRY as of January 2025. Lower-income respondents were more concentrated in Kağıthane and Üsküdar, influencing adaptive capacity. These districts also showed lower adaptive capacity scores in both equal-weight and PCA-based models.

4.1.2. Housing, Employment and Climate Exposure

Housing and employment influence individuals’ ability to adapt. Most respondents (62.6%) were renters, concentrated in Kağıthane and Üsküdar where limited resources and dense urban conditions reduce investment in resilient housing. Beşiktaş and Kadıköy had higher homeownership, increasing the potential for long-term adaptation measures.
Employment status also shaped adaptive capacity. Most respondents (61.4%) worked full-time, while 23.4% were self-employed and 15.2% worked part-time. Beşiktaş and Kadıköy showed stronger financial stability, supporting adaptation initiatives. In contrast, Kağıthane and Üsküdar faced compounded financial and institutional barriers, consistent with findings on urban adaptation inequality [90].

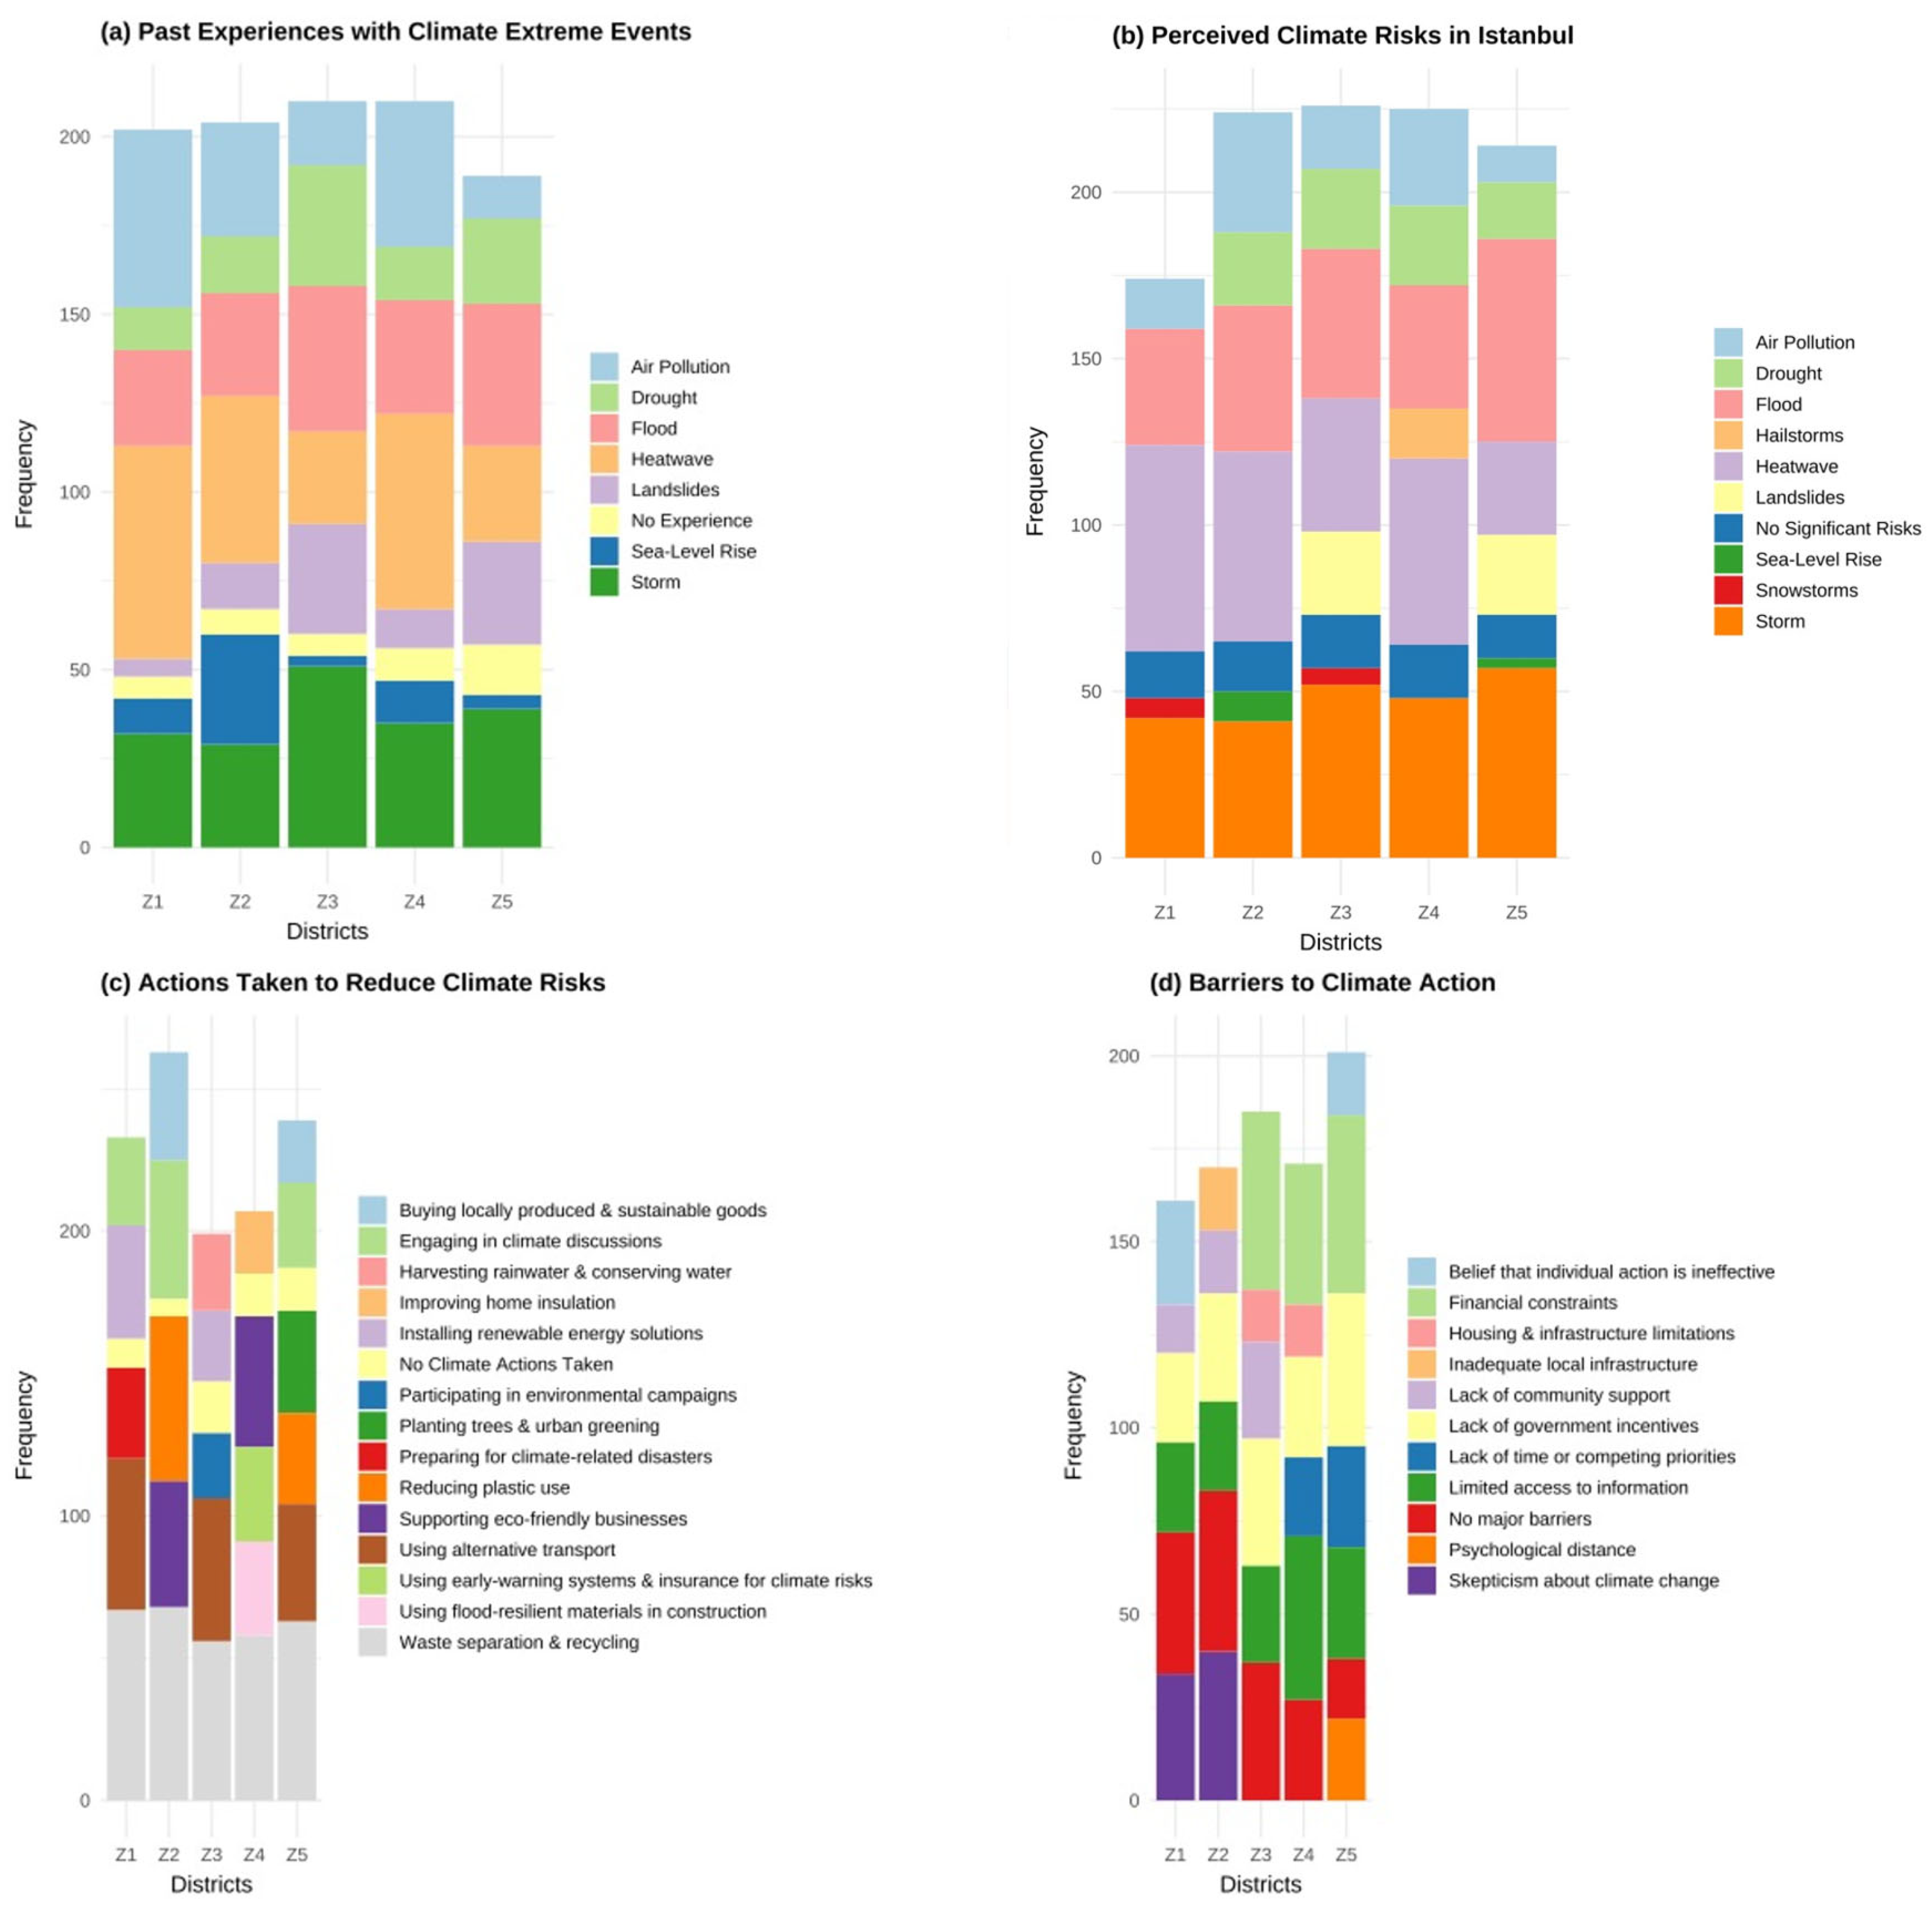
4.1.3. Past Experiences with Climate Extreme Events

Direct experience with extreme weather increases awareness of climate risk. Respondents most frequently reported experiencing heatwaves (43%), storms (37.2%) and flooding (33.8%). Flooding was especially common in Üsküdar and Kağıthane, reflecting both coastal geography and insufficient drainage systems [42]. Air pollution was reported by 30.6% of participants, particularly in Şişli. Awareness of sea-level rise was more common in coastal districts like Kadıköy and Üsküdar, though it was perceived as a lower threat (12%). Firsthand exposure to hazards influenced CCRP scores and reduced psychological distance, consistent with studies showing that lived experience increases perceived risk and urgency [37,91].

4.1.4. Implications for Climate Risk Perception and Adaptive Capacity

Income differences strongly influenced adaptive behavior. Higher-income respondents in Beşiktaş and Kadıköy were more engaged in adaptive behaviors, likely due to financial flexibility. In contrast, lower-income groups in Kağıthane and Üsküdar, though more exposed to climate hazards, showed less adaptation, highlighting economic constraints as key barriers. This finding was supported by regression and cluster analyses which identified these two districts as having the lowest scores in both CCRP and AC.
These patterns confirm that vulnerability in Istanbul is shaped not only by hazard exposure but also by structural inequality. While education and financial stability promote resilience, communities with fewer resources remain more vulnerable. Local governments should address income gaps, housing quality and institutional support to promote equitable adaptation. These findings align with broader literature showing that economic capacity, governance trust and environmental infrastructure jointly influence adaptation outcomes [61,90,92].

4.2. Climate Change Risk Perception

Climate risk perception is a key adaptation driver. District-level comparisons revealed significant differences in how residents engage with climate-related information and perceive risks. Statistical results showed that both risk awareness and institutional trust vary by district, shaping adaptation behavior. Engagement with climate-related information differed significantly across districts (χ2 = 61.457; F = 12.768, p < 0.001). Beşiktaş residents showed the highest engagement (mean = 3.61) while Kağıthane reported the lowest (mean = 2.64). Lower engagement aligns with weaker perception and readiness [15,70,93]. Summary statistics and test results supporting these findings are presented in Table 5.
Principal component analysis revealed that CCRP was primarily shaped by scientific literacy (0.43), personal climate relevance (0.43), media and information engagement (0.42), direct impact perception (0.38) and trust in scientific institutions (0.35). Institutional confidence had a strong negative loading (−0.56) indicating that skepticism toward governance diminishes perceived climate risk. The first principal component explained 11% of the total variance, confirming the index’s conceptual coherence [31,94]. A full breakdown of PCA loadings is provided in Table 5–7.
Regression results confirmed that CCRP significantly predicted adaptive capacity (β = 0.267, p < 0.001) even after controlling for demographic variables. This underscores the importance of risk awareness in promoting behavioral readiness [93]. The interaction term between CCRP and PD was not statistically significant (p = 0.140), indicating that the effect of risk perception on adaptation operates independently from psychological proximity.
Structural equation modeling provided further support for these relationships. CCRP had a direct effect on AC (β = 0.260) as well as an indirect effect through PD (β = 0.176, p < 0.001). The SEM model demonstrated excellent fit (CFI = 1.000, RMSEA = 0.000) [11,50].

4.2.1. District-Level Climate Risk Perception

Patterns of perceived climate threats aligned closely with district-level vulnerabilities. Heatwaves (48.6%), storms (48%) and floods (44.4%) were the most frequently cited threats. Üsküdar residents emphasized flooding (61%) due to coastal exposure [2], while Kağıthane cited floods and landslides, reflecting concerns tied to rapid urban development. In contrast, Beşiktaş and Kadıköy residents expressed greater concern about heatwaves, consistent with dense urban form and urban heat island effects. These perceptions varied significantly (χ2 = 45.750; F = 9.812, p < 0.001). Beşiktaş (mean = 3.88) and Kadıköy (mean = 3.80) reported the highest perceived impacts, while Kağıthane scored the lowest (mean = 3.07), suggesting elevated psychological distance [20,31].
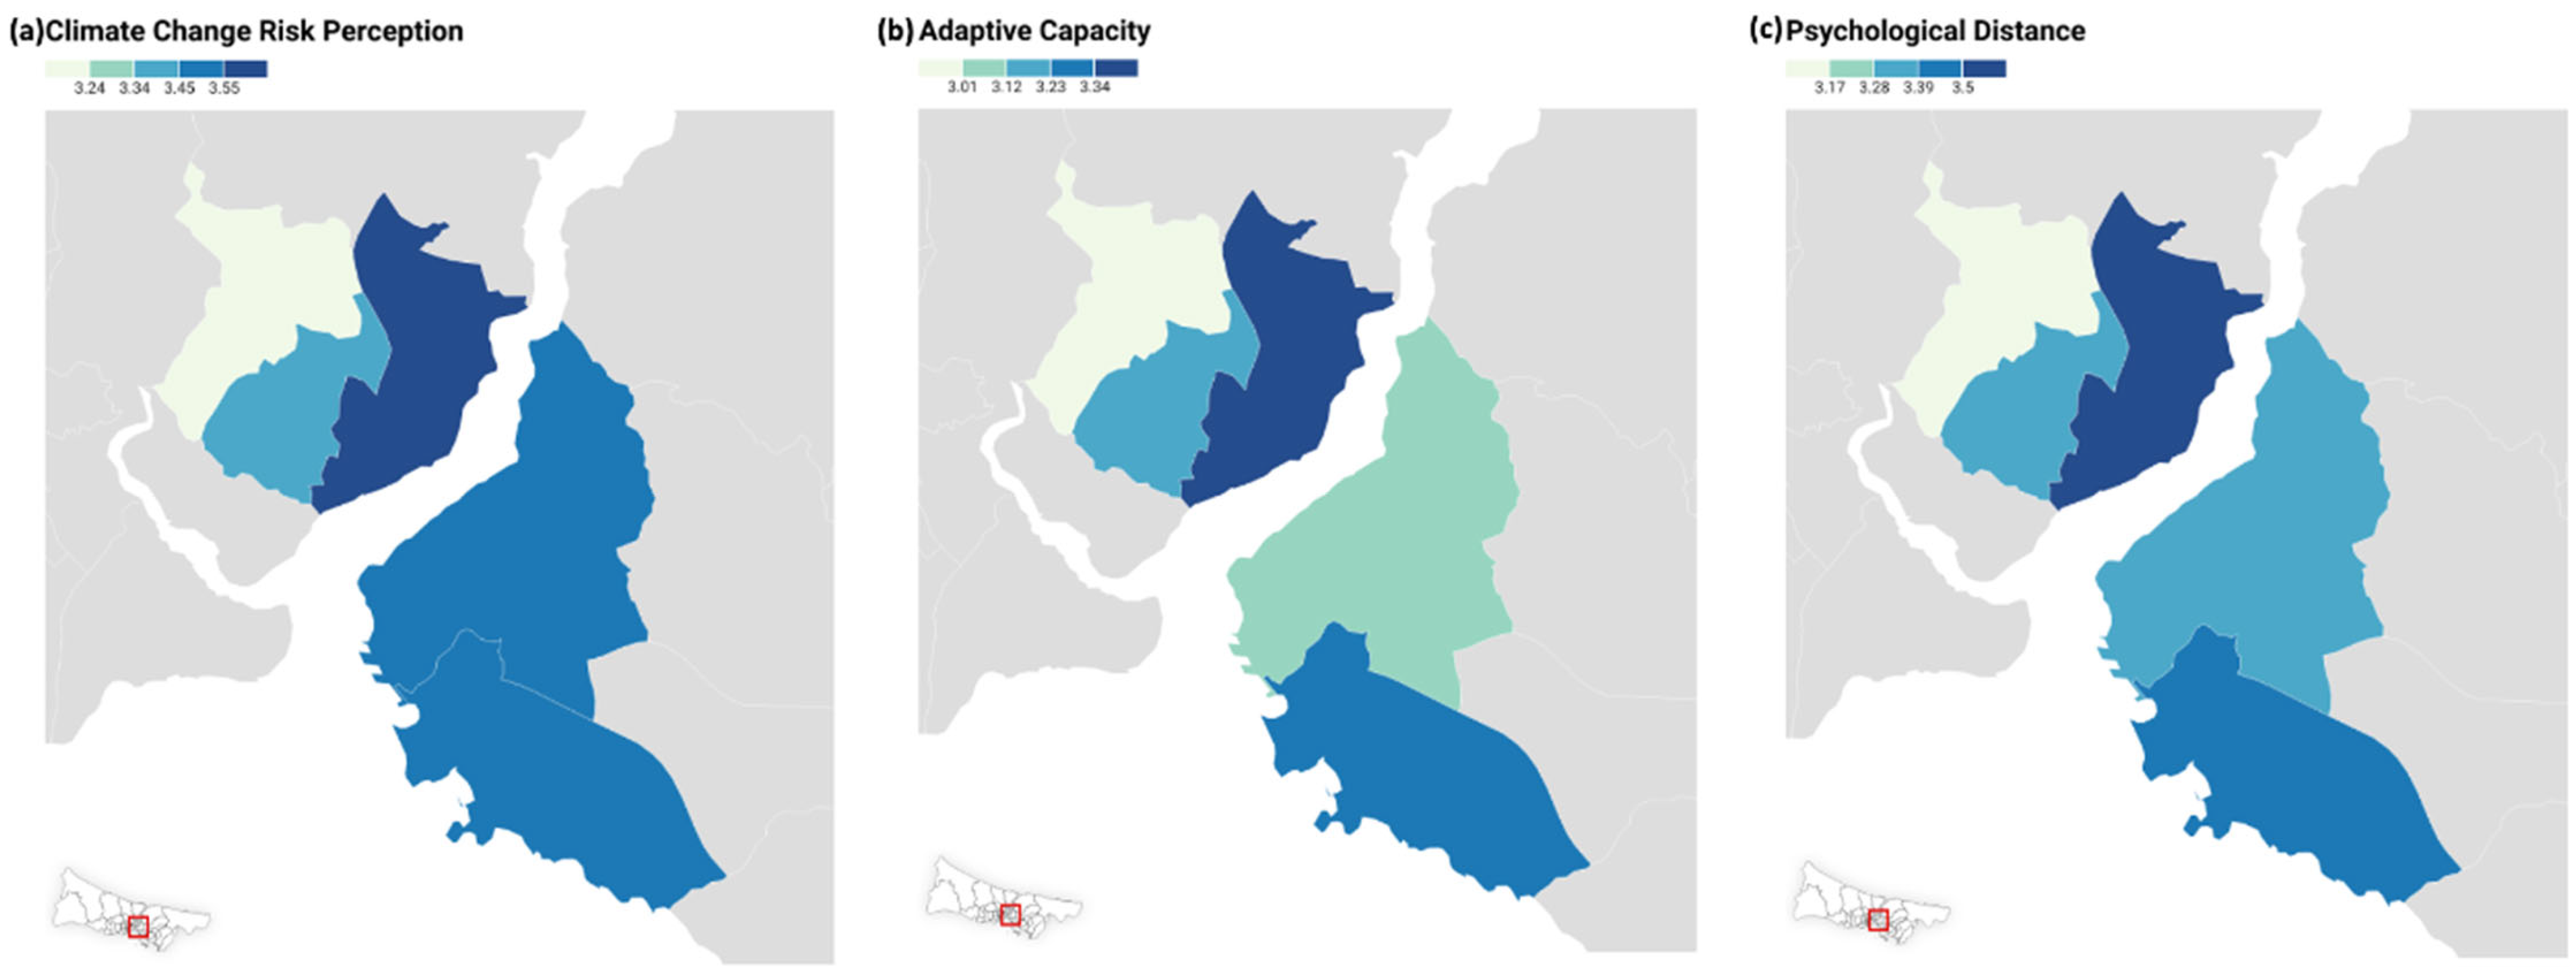
Spatial differences in CCRP are illustrated in 
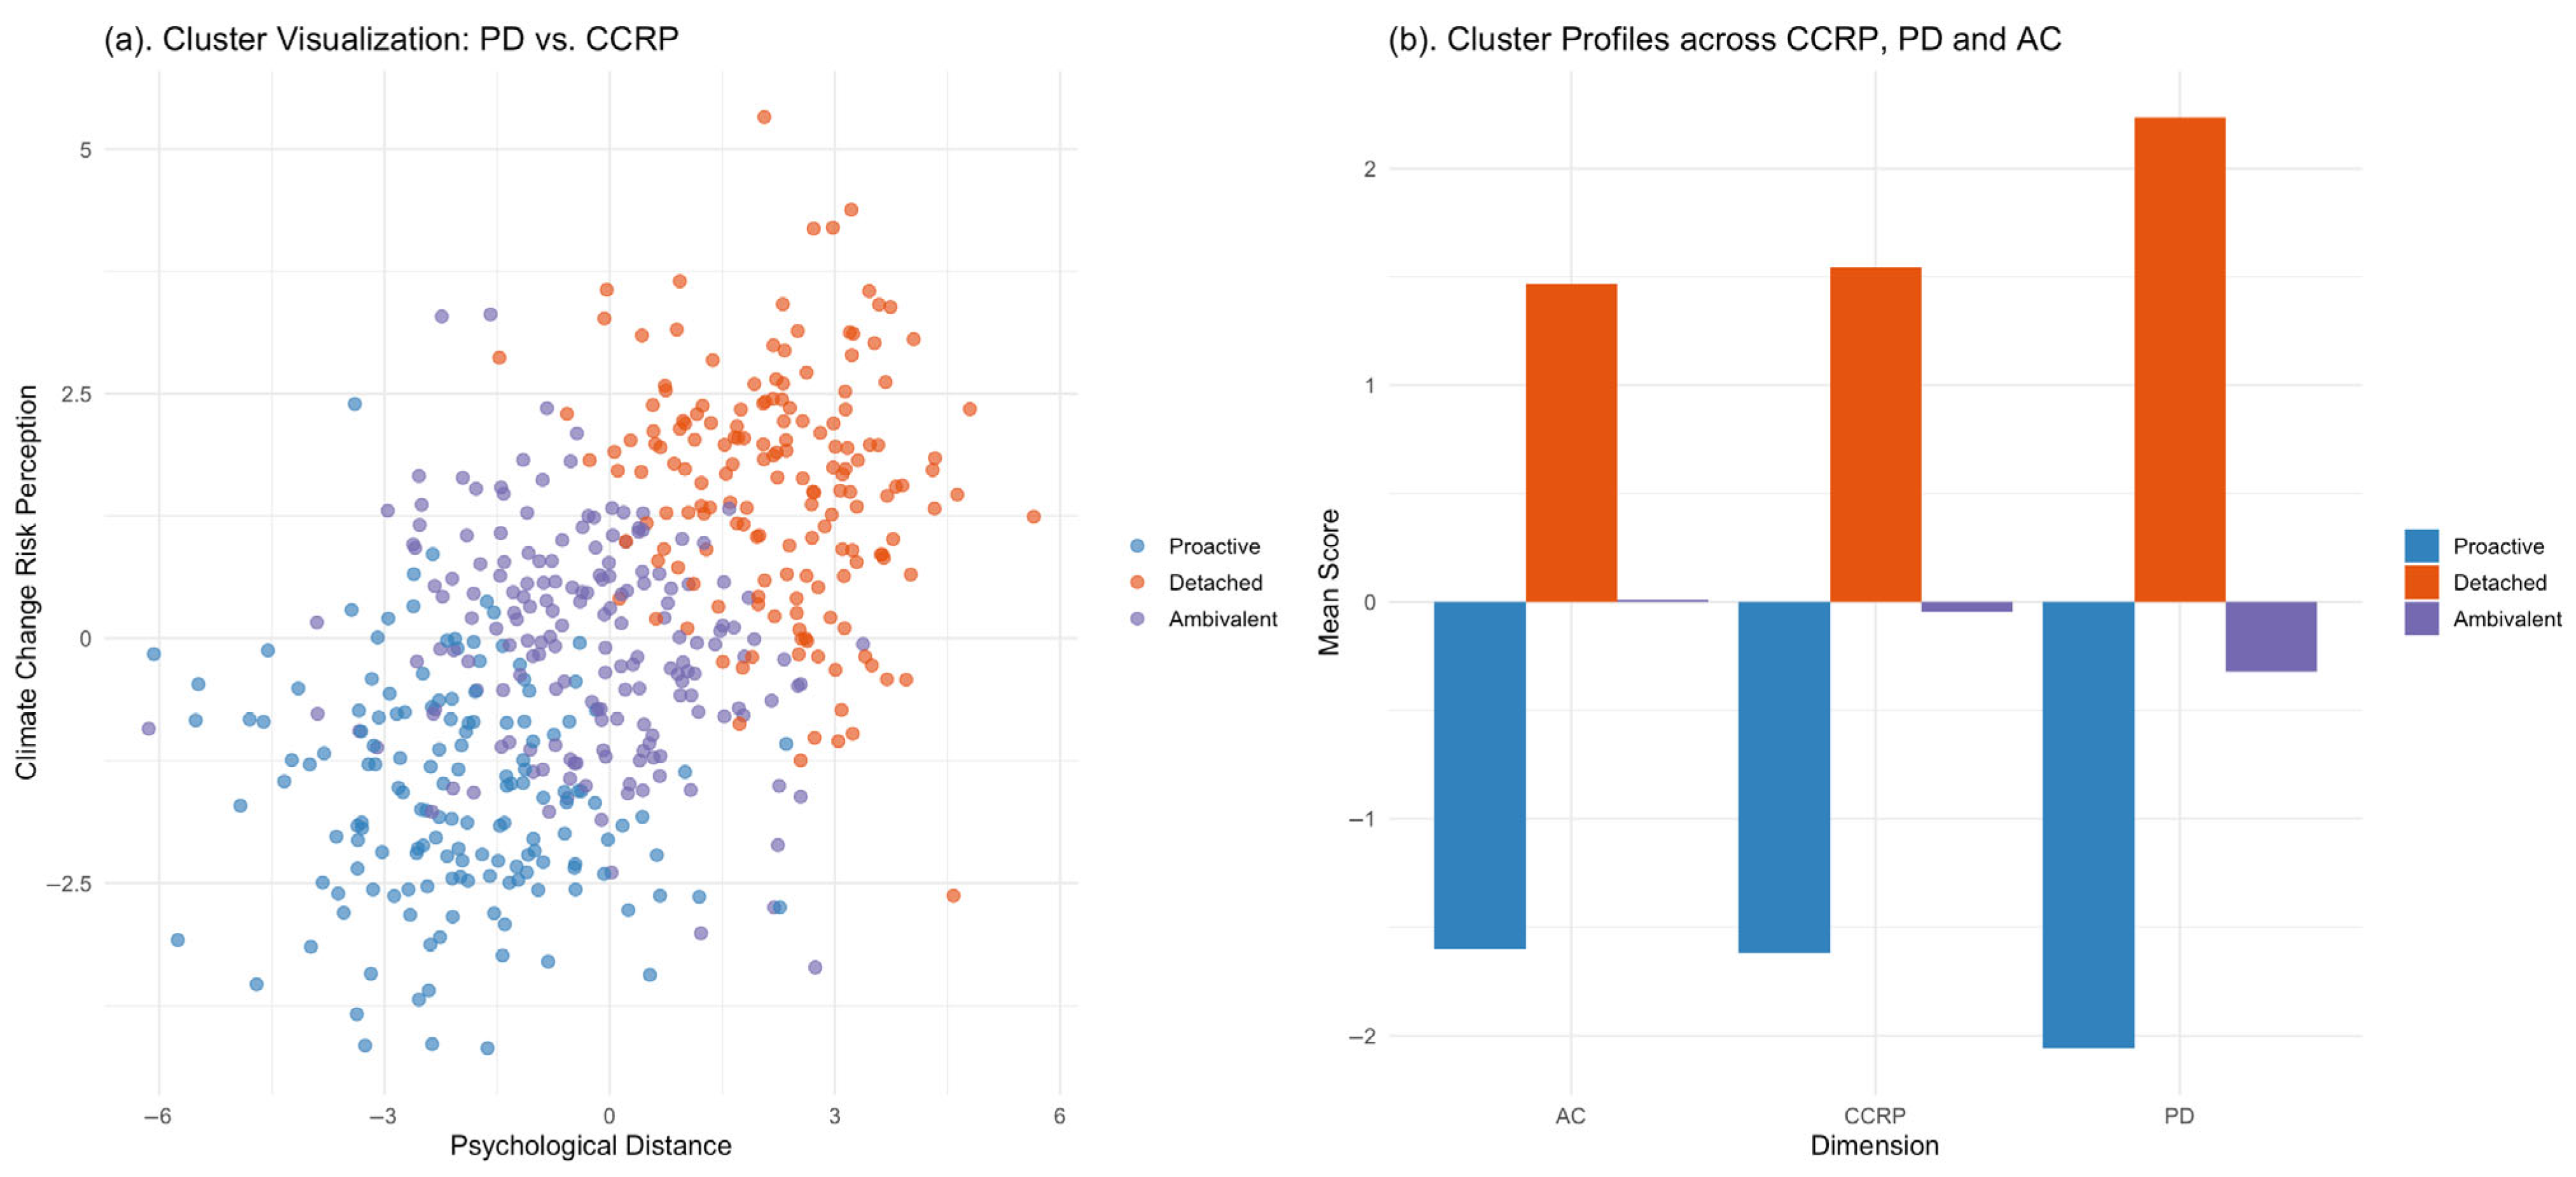
Figure 5a. Beşiktaş and Kadıköy scored highest on the CCRP index, while Kağıthane and Üsküdar scored lowest. These patterns align with the results of the PCA and cluster analysis which grouped Beşiktaş and Kadıköy into the “proactive” cluster and Kağıthane and Üsküdar into the “detached” cluster (see Figure 6).

4.2.2. Trust in Institutions and Climate Governance

Institutional trust emerged as a critical factor in climate engagement and varied considerably across districts. Trust in scientific institutions (mean = 3.59) was higher than trust in municipalities (mean = 2.90) and national government agencies (mean = 2.64). Beşiktaş and Kadıköy residents expressed the highest trust in science (means = 4.16 and 3.66) while Kağıthane and Şişli showed lower trust in local governance (means = 2.67 and 2.47).
Correlation analysis revealed that institutional trust was positively associated with both CCRP and AC (r = 0.23 and r = 0.70, respectively, p < 0.01) [23,95]. In lower-income districts such as Kağıthane and Üsküdar, reduced institutional trust further limits engagement with climate initiatives and contributes to higher psychological distance. These relationships were also confirmed in mediation analysis where trust-related variables decreased psychological distance, indirectly strengthening adaptive capacity.
These results are consistent with existing literature demonstrating that institutional credibility enhances the legitimacy and reach of climate governance [35]. Transparent, responsive and inclusive institutions are essential for fostering public trust and enabling meaningful engagement in local adaptation strategies [40].

4.3. Psychological Distance and Perceived Risk

Psychological distance reduces the perceived urgency of climate risks and limits individual motivation to act [16,19]. The survey findings revealed substantial district-level differences in psychological distance, emotional engagement and perceptions of immediacy. ANOVA results confirmed that PD and climate anxiety significantly vary across districts (PD: χ2 = 200.290; F = 37.754, p < 0.001; Climate anxiety: χ2 = 71.127; F = 16.770, p < 0.001). Beşiktaş residents reported the highest levels of climate anxiety (mean = 3.96) while Kağıthane showed the lowest (mean = 2.90), reinforcing patterns of disengagement [20].
Principal component analysis revealed that psychological distance was shaped primarily by perceived alarmism (−0.68), emotional closeness (0.45) and future impact certainty (0.40). The first component explained 17% of the total variance. These findings confirm that temporal immediacy and emotional proximity are central dimensions of climate engagement [50,96]. Lower PD scores indicate a heightened cognitive and emotional connection to climate change which in turn enhances adaptive behavior [97].
Despite high concern levels, Beşiktaş residents reported a lower sense of preparedness (mean = 2.63) while Üsküdar (mean = 3.27) and Şişli (mean = 3.23) showed relatively higher perceived readiness. This suggests that emotional importance does not always translate into practical preparedness. The observed gap reflects the limits of bounded rationality where anxiety or perceived helplessness may inhibit decision-making under stress [11,94].
Regression models confirmed that PD significantly predicts adaptive capacity (β = 0.266, p < 0.001) with the PCA-based model producing a higher adjusted R2 compared to the equal-weight model. This highlights that psychological proximity is a stronger predictor of adaptation than demographic or structural variables [64,97]. Self-efficacy scores followed a similar pattern (χ2 = 54.326; F = 10.150, p < 0.001) with the highest levels observed in Beşiktaş (mean = 3.97) and the lowest in Kağıthane (mean = 3.06), confirming that self-confidence is tied to perceived climate relevance and immediacy.
Mediation analysis showed that PD serves as a partial mediator between CCRP and AC, accounting for 39.7% of the total effect (indirect effect: β = 0.176, p < 0.001). The direct effect remained significant (β = 0.267, p < 0.001), indicating that both perception and proximity contribute to adaptive capacity. These findings align with prior research suggesting that emotional and cognitive closeness enhances behavioral response [13,16,97].
These relationships were further validated through SEM which confirmed significant paths from CCRP to PD (β = 0.508) from PD to AC (β = 0.338) and from CCRP to AC (β = 0.260) with excellent model fit (CFI = 1.000, RMSEA = 0.000). These findings empirically support the proposed theoretical framework where emotional and temporal proximity serve as key channels through which climate risk perception translates into adaptive readiness [97].
PD scores are mapped in Figure 5b and descriptive statistics, chi-square and F test results can be found in Table 6. Beşiktaş and Kadıköy showed the lowest psychological distance and strongest climate concern, while Kağıthane and Üsküdar scored highest in PD, aligning with cluster results and regression models. These patterns highlight the need for tailored strategies that bridge psychological distance in socially and economically vulnerable communities [8,24].

4.4. Adaptive Capacity and Climate Engagement

Adaptive capacity differed across districts (χ2 = 239.872; F = 45.691, p < 0.001) due to financial constraints, institutional trust and access to climate information. Beşiktaş (mean = 3.65) and Kadıköy (mean = 3.51) showed the highest engagement, while Kağıthane (mean = 3.05) and Üsküdar (mean = 3.19) faced economic and institutional constraints that limited their ability to implement adaptive measures.
PCA results showed that the first principal component of AC explained 10% of total variance and was driven by self-efficacy (0.40), institutional trust (0.45) and confidence in practical adaptation measures (0.42). These results were supported by regression models which showed that both CCRP and PD significantly predicted AC. The PCA-based model produced a higher adjusted R2 compared to the equal-weight model, indicating that latent cognitive traits are more predictive of adaptation than observable demographic factors [96].
Lack of climate information was the most cited barrier (29.6%), especially in Şişli where public engagement was lower. Financial limitations (26.8%) restricted private adaptation, particularly in Kağıthane and Üsküdar. Institutional skepticism (22%) further impeded action with Kağıthane showing the lowest trust in governance (mean = 2.67).
The SEM results confirmed the direct effects of CCRP (β = 0.260) and PD (β = 0.338) on AC with model fit indices indicating strong validity (CFI = 1.000, RMSEA = 0.000). Mediation analysis revealed that psychological distance partially explained the effect of CCRP on AC, accounting for 39.7% of the total effect. This confirms that structural adaptation is reinforced when individuals feel emotionally and cognitively close to the threat [58,96].
Cluster analysis revealed clear cognitive groupings across districts. Residents in Beşiktaş and Kadıköy largely fell into a proactive group with high CCRP, low PD and high AC. In contrast, Kağıthane and Üsküdar were overrepresented in a detached group with low levels across all indices. These typologies are visually illustrated in Figure 6 which highlights how perceptual configurations align with cluster-based adaptation readiness. These patterns suggest that adaptation cannot be explained solely by infrastructure or awareness. Instead, perceived control, emotional engagement and institutional credibility are critical components of individual and collective readiness [94,98].
Figure 5c illustrates the spatial distribution of AC and descriptive statistics, chi-square and F test results can be found in Table 7. Districts with higher education, stronger trust and more stable incomes demonstrated stronger adaptive behavior. Conversely, districts with weaker institutional ties and greater economic vulnerability demonstrated lower capacity to implement adaptive responses.
These findings reaffirm that adaptive capacity is shaped by both material access and cognitive-affective conditions [92,94,98]. Public trust, climate knowledge and emotional importance are essential in converting concern into action. As highlighted by previous studies, adaptation policies must simultaneously address informational gaps, institutional deficiencies and financial barriers [5,60,99]. Strengthening these components through inclusive communication, targeted incentives and transparent governance can enhance engagement, particularly in disadvantaged urban contexts.

4.5. Interrelationships Between Adaptive Capacity, Climate Change Risk Perception and Psychological Distance

The interaction between AC, CCRP and PD is central to understanding climate adaptation behavior. Statistical analyses confirmed significant correlations and causal mechanisms linking these constructs, validating the proposed theoretical model and providing robust empirical support for integrated climate engagement strategies [58,94].
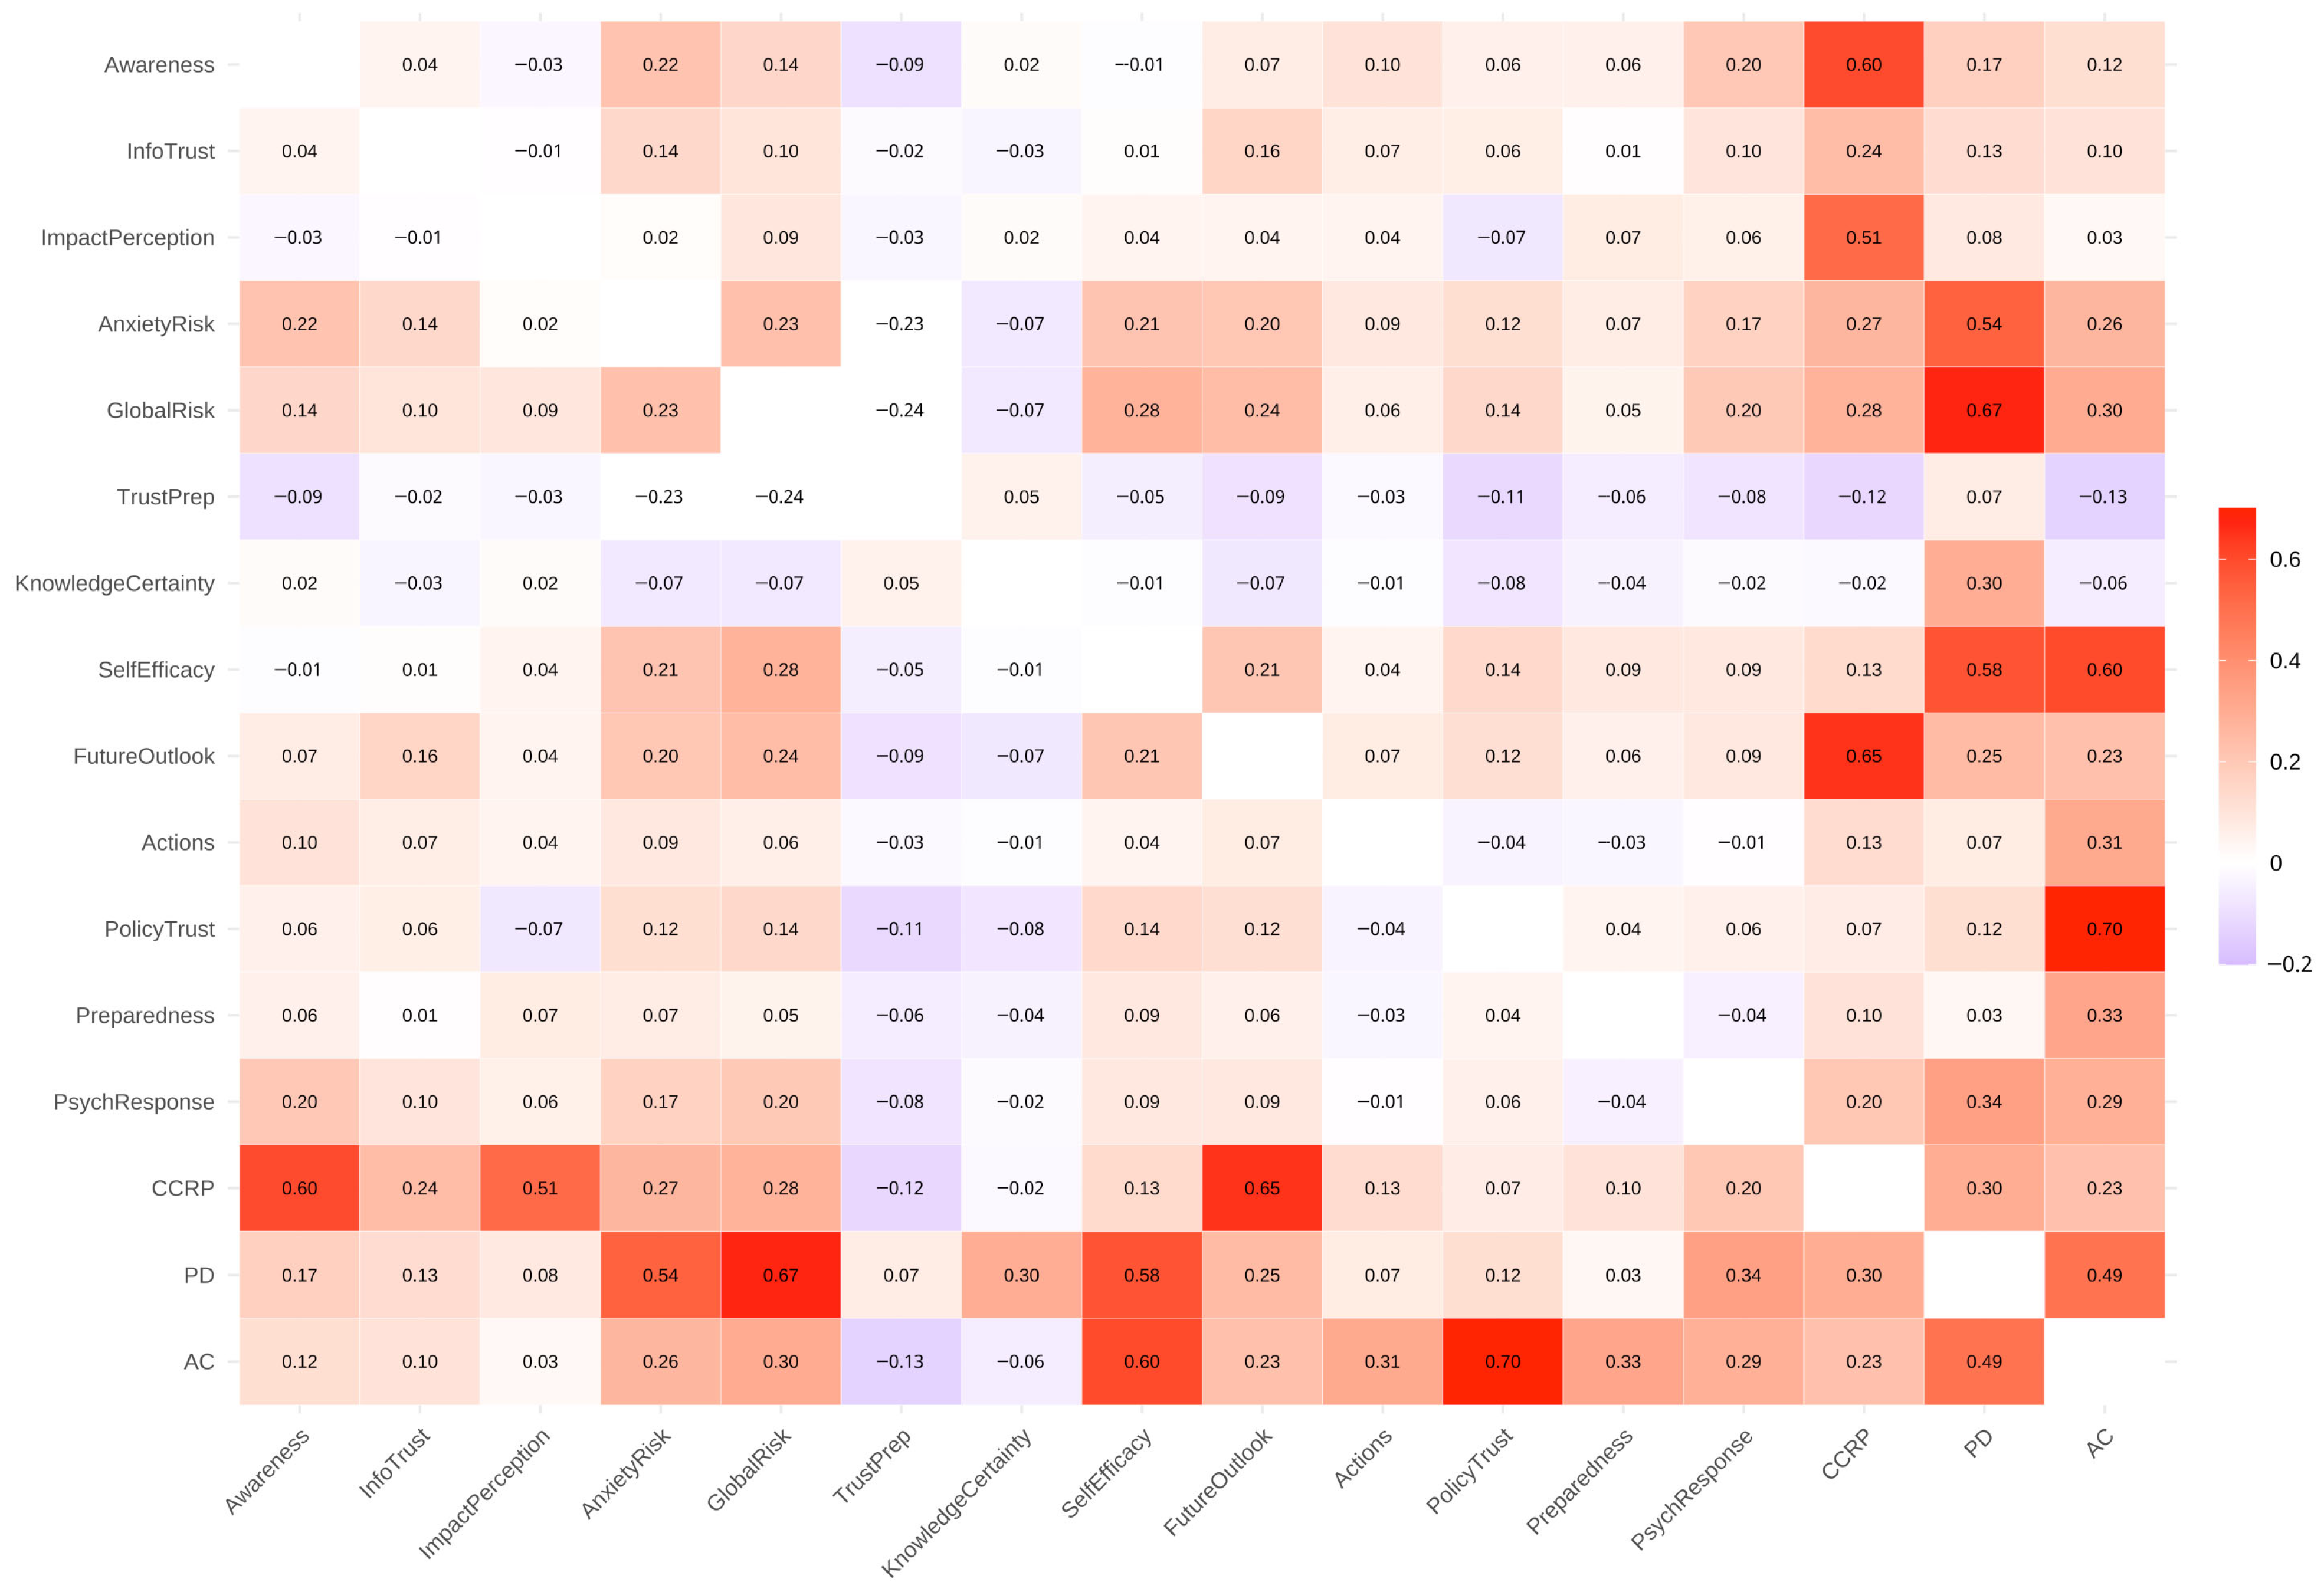
Correlation analysis reveals key relationships. CCRP is positively correlated with AC (r = 0.23, p < 0.01) indicating that individuals who perceive climate risks as immediate are more likely to adopt adaptive measures [2,94]. PD is also positively correlated with AC (r = 0.49, p < 0.01) suggesting that those who view climate change as distant or abstract are less engaged [20,58]. These findings are consistent with previous research that underscores the importance of psychological proximity in motivating climate action [13,64,96]. CCRP and PD are also moderately correlated (r = 0.40, p < 0.01) indicating that higher perception of risk tends to accompany greater emotional and temporal closeness. Institutional trust is strongly associated with AC (r = 0.70, p < 0.01) and CCRP (r = 0.23, p < 0.01) supporting the view that public belief in credible institutions enhances both perception and engagement [23,95]. These relationships are visualized in Figure 7.
PCA further substantiated these patterns by validating the conceptual integrity of the indices. The first component explained 11% of the variance for CCRP, 17% for PD and 10% for AC. Key loadings reflected institutional trust, emotional proximity and self-efficacy respectively. Regression models using PCA-based indices yielded stronger predictive power than equal-weighted indices. The adjusted R2 improved highlighting the analytical value of incorporating latent psychological dimensions [94,96].
Mediation analysis showed that PD partially mediated the relationship between CCRP and AC. The indirect effect (β = 0.176, p < 0.001) accounted for 39.7% of the total effect while the direct effect remained significant (β = 0.267, p < 0.001). These findings provide empirical support for psychological distance theory by confirming that perceived proximity to climate risks enhances adaptation through cognitive engagement [24,50,58,96].
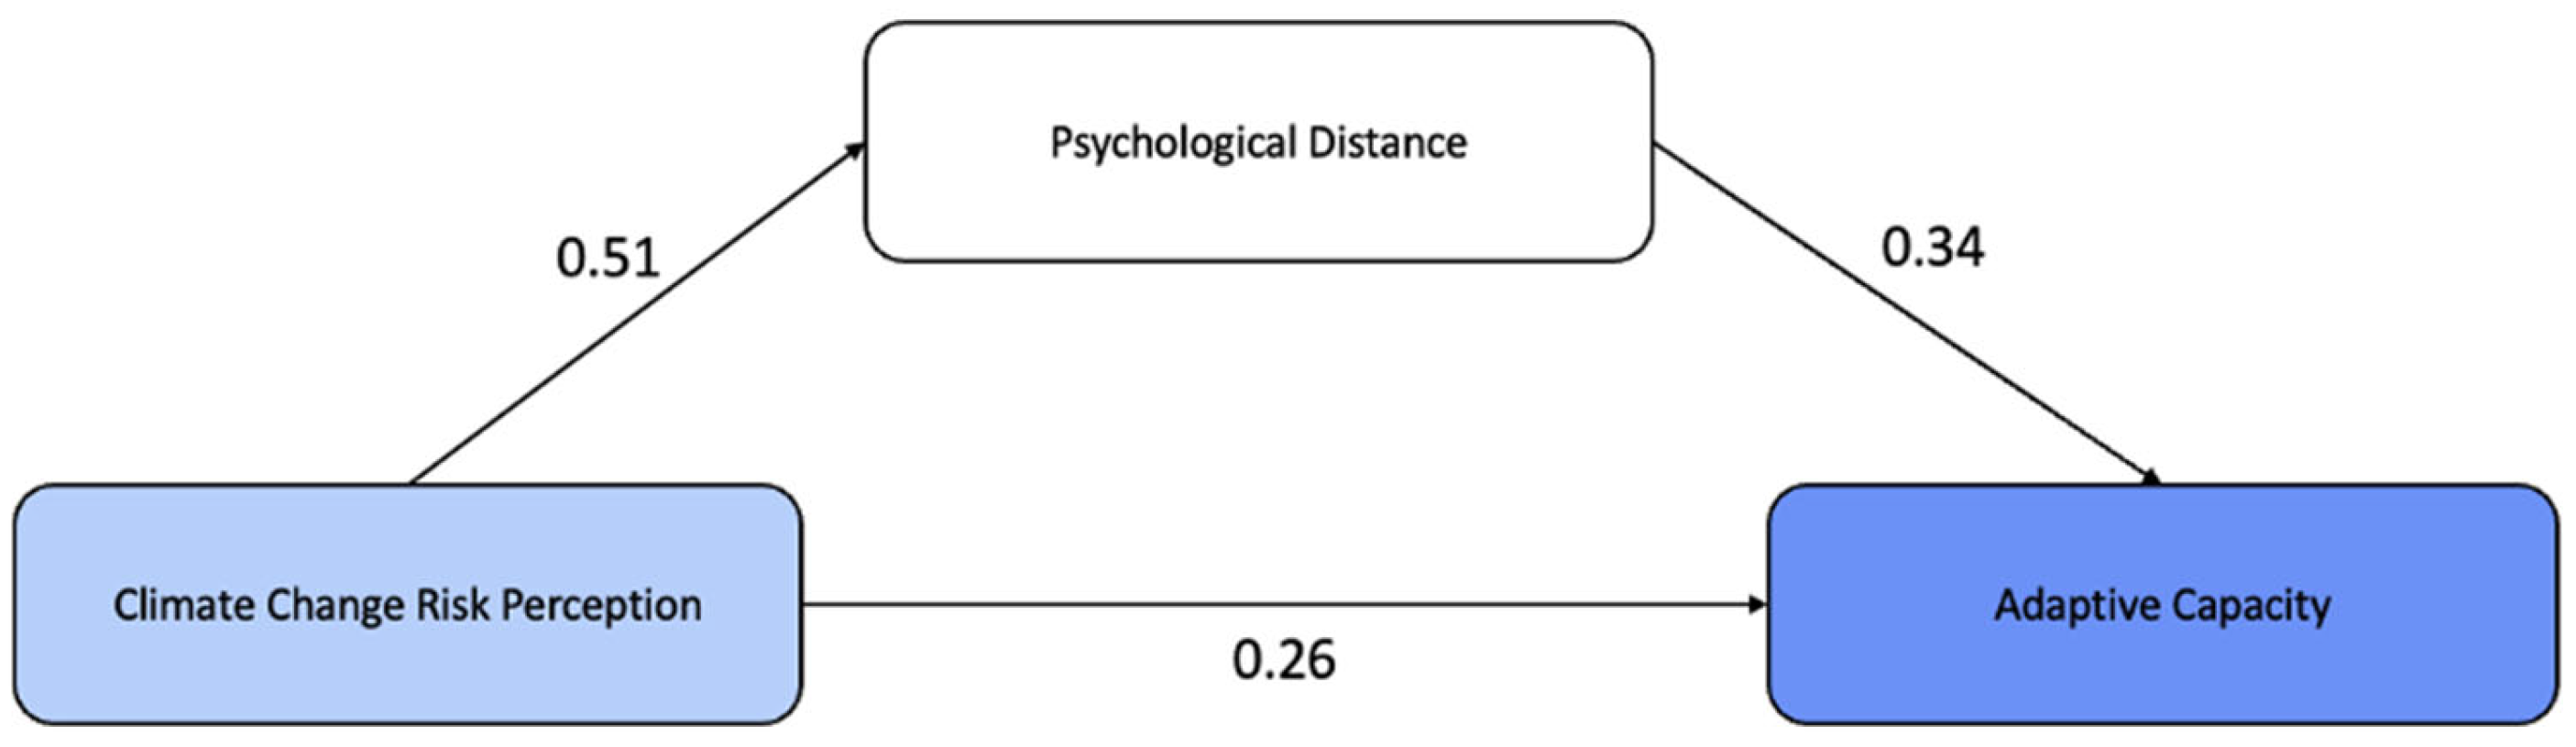
Structural equation modeling reinforced these results (Figure 8). The model demonstrated excellent fit (CFI = 1.000, RMSEA = 0.000) with significant paths from CCRP to PD (β = 0.508), from PD to AC (β = 0.338) and from CCRP to AC (β = 0.260) [11,96]. These pathways reflect a robust structural framework linking perception and adaptation through psychological processing.
Cluster analysis revealed three cognitive profiles across the sample. Individuals with high CCRP, low PD and high AC were primarily found in Beşiktaş and Kadıköy while those with low CCRP, high PD and low AC were concentrated in Kağıthane and Üsküdar. These results confirm that adaptation is influenced by both structural inequalities and cognitive-perceptual dynamics [5,19].
Districts with high perception, low psychological distance and greater institutional trust showed stronger adaptation. In contrast, areas with economic and trust deficits displayed reduced engagement. These patterns point to the need for tailored district-specific policies that improve awareness, strengthen trust and increase access to financial support [40,60,94,98].
To enhance urban climate resilience policymakers must prioritize localized risk communication transparent governance and inclusive decision-making. Expanding subsidies, adaptation grants and affordable resilience loans can help bridge access gaps [98,100]. Strengthening institutional capacity and producing solutions with vulnerable communities can further ensure the equity and legitimacy of adaptation efforts. By adopting these strategies Istanbul can enhance urban resilience and offer a scalable model for other climate-vulnerable cities [98,99,101,102,103].

5. Conclusions

This study highlights the complex interplay between CCRP, PD, AC and institutional trust in shaping climate adaptation behaviors across five districts of Istanbul. By integrating structured survey data with principal component analysis, regression modeling and structural equation modeling, the findings offer empirical insight into how cognitive and institutional factors jointly shape climate adaptation at the urban scale.
District-level comparisons revealed significant variation in risk perception, institutional trust and adaptation readiness. Beşiktaş and Kadıköy exhibited stronger engagement, higher CCRP and lower PD, aligning with greater institutional trust and self-efficacy. In contrast, Kağıthane and Üsküdar showed weaker scores across all indices, reflecting the impact of economic and informational constraints. These patterns were consistently confirmed through PCA and cluster analysis which identified clear cognitive and behavioral profiles aligning with proactive and detached adaptation orientations.
Regression models demonstrated that both CCRP and PD significantly predict adaptive capacity. Mediation analysis further revealed that PD partially explains the pathway from CCRP to AC, affirming the theoretical proposition that perceived proximity and relevance are key to translating awareness into behavior. Structural equation modeling further validated these relationships, establishing a robust empirical framework linking cognitive risk appraisal, psychological orientation and adaptive readiness.
Institutional trust emerged as a central enabler of climate engagement. Trust in scientific institutions was positively associated with both CCRP and AC, while skepticism toward public agencies weakened both perception and preparedness. These findings reinforce the importance of transparent, credible and participatory governance structures in building robust urban resilience.
This study makes several key contributions to the growing literature on urban climate adaptation. First, it empirically demonstrates that psychological and institutional dimensions are not peripheral considerations but are foundational to shaping adaptation outcomes. Second, it provides a nuanced, district-level understanding of how these factors manifest within a rapidly urbanizing megacity like Istanbul, offering a compelling case study. Finally, it underscores that effective interventions must address not only material vulnerabilities but also cognitive gaps and emotional disconnection from climate threats.
While this study provides valuable insights into urban adaptation, some limitations remain. The cross-sectional design limits understanding of change over time and online data may exclude those without internet. Self-reported responses may involve bias. Still, the quantitative design offers generalizable district-level findings and supports practical policy guidance by capturing key cognitive and structural barriers to climate readiness.

Author Contributions

Conceptualization, P.O. and E.N.O.; methodology, P.O.; software, P.O.; validation, P.O.; data curation, P.O.; writing—original draft preparation, P.O.; writing—review and editing, E.N.O.; visualization, P.O.; supervision, E.N.O. All authors have read and agreed to the published version of the manuscript.

Funding

This research received no external funding.

Institutional Review Board Statement

Ethical review and approval were waived for this study as all data collection procedures adhered strictly to the principles of voluntary participation and anonymity. In accordance with both European Union and national research ethics frameworks, research based on fully anonymized survey data does not fall under the scope of ethics committee evaluation. Specifically, the General Data Protection Regulation (GDPR—Regulation (EU) 2016/679), Recital 26, explicitly states that data protection principles do not apply to information that does not relate to an identified or identifiable individual.

Informed Consent Statement

Informed consent was obtained from all subjects involved in this study.

Data Availability Statement

The raw data supporting the conclusions of this article will be made available by the authors upon request.

Conflicts of Interest

The authors declare no conflicts of interest.

Abbreviations

The following abbreviations are used in this manuscript:
ACAdaptive capacity
ANOVAAnalysis of variance
CCRPClimate change risk perception
CFIComparative fit index
IPCCIntergovernmental Panel on Climate Change
NGONon-Governmental organization
PCAPrincipal component analysis
PDPsychological distance
RMSEARoot mean square error of approximation
SEMStructural equation modeling
TURKSTATTurkish Statistical Institute

References

  1. Engle, N.L. Adaptive capacity and its assessment. Glob. Environ. Change 2011, 21, 647–656. [Google Scholar] [CrossRef]
  2. Lorencová, E.; Loučková, B.; Vačkářů, D. Perception of climate change risk and adaptation in the Czech Republic. Climate 2019, 7, 61. [Google Scholar] [CrossRef]
  3. Wieszczeczynska, K.A.; Tollin, N.; Spaliviero, M. Capacity building within urban climate resilience in the Global South–a literature review. Front. Sustain. Cities 2024, 6, 1380936. [Google Scholar] [CrossRef]
  4. Pitidis, V.; Coaffee, J.; Lima-Silva, F. Advancing equitable ‘resilience imaginaries’ in the Global South through dialogical participatory mapping: Experiences from informal communities in Brazil. Cities 2024, 150, 105015. [Google Scholar] [CrossRef]
  5. Berrang-Ford, L.; Biesbroek, R.; Ford, J.D.; Lesnikowski, A.; Tanabe, A.; Wang, F.M.; Chen, C.; Hsu, A.; Hellmann, J.J.; Pringle, P.; et al. Tracking global climate change adaptation among governments. Nat. Clim. Change 2019, 9, 440–449. [Google Scholar] [CrossRef]
  6. Werners, S.E.; Wise, R.M.; Butler, J.R.; Totin, E.; Vincent, K. Adaptation pathways: A review of approaches and a learning framework. Environ. Sci. Policy 2021, 116, 266–275. [Google Scholar] [CrossRef]
  7. Bizzotto, M. Building Climate Resilience with Local Communities: Insights from Izmir. CityTalk. 2024. Available online: https://talkofthecities.iclei.org/building-climate-resilience-with-local-communities-insights-from-izmir/ (accessed on 30 May 2025).
  8. IMM Istanbul Climate Change Action Plan. 2022. Available online: https://cevre.ibb.istanbul/wp-content/uploads/2022/05/Ozet_Rapor_Ingilizce.pdf (accessed on 30 March 2025).
  9. Republic of Türkiye, Ministry of Environment, Urbanization and Climate Change. Türkiye’s First Biennial Transparency Report Under the Paris Agreement. United Nations Framework Convention on Climate Change (UNFCCC). 2023. Available online: https://unfccc.int/sites/default/files/resource/T%C3%BCrkiye_1BTR.pdf (accessed on 29 May 2025).
  10. Republic of Türkiye, Ministry of Environment, Urbanization and Climate Change. Türkiye Long-Term Climate Strategy (2053 Vision). United Nations Framework Convention on Climate Change (UNFCCC). 2023. Available online: https://unfccc.int/sites/default/files/resource/Turkiye_Long_Term_Climate_Strategy.pdf (accessed on 29 May 2025).
  11. Fatorić, S.; Morén-Alegret, R. Integrating local knowledge and perception for assessing vulnerability to climate change in economically dynamic coastal areas: The case of natural protected area Aiguamolls de l’Empordà, Spain. Ocean Coast. Manag. 2013, 85, 90–102. [Google Scholar] [CrossRef]
  12. Ergun, S.J.; Karadeniz, Z.D.; Rivas, M.F. Climate change risk perception in Europe: Country-level factors and gender differences. Humanit. Soc. Sci. Commun. 2024, 11, 1573. [Google Scholar] [CrossRef]
  13. Moore, J.W.; Schindler, D.E. Getting ahead of climate change for ecological adaptation and resilience. Science 2022, 376, 1421–1426. [Google Scholar] [CrossRef]
  14. United Nations Development Programme (UNDP). Cities in Turkey Cooperate on Climate Change Adaptation. 2023. Available online: https://www.undp.org/turkiye/news/cities-turkey-cooperate-climate-change-adaptation (accessed on 29 May 2025).
  15. Weber, E.U.; Stern, P.C. Public understanding of climate change in the United States. Am. Psychol. 2011, 66, 315. [Google Scholar] [CrossRef]
  16. Spence, A.; Poortinga, W.; Pidgeon, N. The psychological distance of climate change. Risk Anal. Int. J. 2012, 32, 957–972. [Google Scholar] [CrossRef] [PubMed]
  17. Maiella, R.; La Malva, P.; Marchetti, D.; Pomarico, E.; Di Crosta, A.; Palumbo, R.; Cetara, L.; Di Domenico, A.; Verrocchio, M.C. The psychological distance and climate change: A systematic review on the mitigation and adaptation behaviors. Front. Psychol. 2020, 11, 568899. [Google Scholar] [CrossRef] [PubMed]
  18. Ewart, T.; Coffee, J.; Miller, S.; Mobilizing Private Capital for Climate Adaptation Infrastructure. Canadian Climate Infrastructure. Available online: https://climateinstitute.ca/wp-content/uploads/2023/05/mobilizing-private-capital-climate-adaptation-infrastructure.pdf (accessed on 29 May 2025).
  19. Trope, Y.; Liberman, N. Construal-level theory of psychological distance. Psychol. Rev. 2010, 117, 440. [Google Scholar] [CrossRef]
  20. Gifford, R. The dragons of inaction: Psychological barriers that limit climate change mitigation and adaptation. Am. Psychol. 2011, 66, 290. [Google Scholar] [CrossRef]
  21. González, J.E.; Ramamurthy, P.; Bornstein, R.D.; Chen, F.; Bou-Zeid, E.R.; Ghandehari, M.; Luvall, J.; Mitra, C.; Niyogi, D. Urban climate and resiliency: A synthesis report of state of the art and future research directions. Urban Clim. 2021, 38, 100858. [Google Scholar] [CrossRef]
  22. Barr, S. Personal mobility and climate change. Wiley Interdiscip. Rev. Clim. Change 2018, 9, e542. [Google Scholar] [CrossRef]
  23. Cologna, V.; Siegrist, M. The role of trust for climate change mitigation and adaptation behaviour: A meta-analysis. J. Environ. Psychol. 2020, 69, 101428. [Google Scholar] [CrossRef]
  24. Brosch, T. Affect and emotions as drivers of climate change perception and action: A review. Curr. Opin. Behav. Sci. 2021, 42, 15–21. [Google Scholar] [CrossRef]
  25. Chisale, H.L.; Chirwa, P.W.; Kamoto, J.F.M.; Babalola, F.D. Determinants of adaptive capacities and coping strategies to climate change related extreme events by forest dependent communities in Malawi. Wellbeing Space Soc. 2024, 6, 100183. [Google Scholar] [CrossRef]
  26. Shi, L.; Chu, E.; Anguelovski, I.; Aylett, A.; Debats, J.; Goh, K.; Schenk, T.; Seto, K.C.; Dodman, D.; Roberts, D.; et al. Roadmap towards justice in urban climate adaptation research. Nat. Clim. Change 2016, 6, 131–137. [Google Scholar] [CrossRef]
  27. O’Hare, P. Not ‘just’climate adaptation—Towards progressive urban resilience. Humanit. Soc. Sci. Commun. 2025, 12, 260. [Google Scholar] [CrossRef]
  28. Şahin, G. Psychological Distance in Climate Change: The Role of Climate Change Denial, Contact with Nature and Political Opinion. Afet ve Risk Dergisi 2023, 6, 1202–1217. [Google Scholar] [CrossRef]
  29. Carmi, N.; Kimhi, S. Further than the eye can see: Psychological distance and perception of environmental threats. Hum. Ecol. Risk Assess. 2015, 21, 2209–2230. [Google Scholar] [CrossRef]
  30. Gray, S.R.; Gagnon, A.S.; Gray, S.A.; O’Dwyer, B.; O’Mahony, C.; Muir, D.; Devoy, R.J.; Falaleeva, M.; Gault, J. Are coastal managers detecting the problem? Assessing stakeholder perception of climate vulnerability using Fuzzy Cognitive Mapping. Ocean Coast. Manag. 2014, 94, 74–89. [Google Scholar] [CrossRef]
  31. Siegrist, M.; Cvetkovich, G. Perception of hazards: The role of social trust and knowledge. Risk Anal. 2000, 20, 713–720. [Google Scholar] [CrossRef]
  32. Maibach, E.W.; Kreslake, J.M.; Roser-Renouf, C.; Rosenthal, S.; Feinberg, G.; Leiserowitz, A.A. Do Americans understand that global warming is harmful to human health? Evidence from a national survey. Ann. Glob. Health 2015, 81, 396–409. [Google Scholar] [CrossRef]
  33. Frantzeskaki, N.; McPhearson, T. Mainstream nature-based solutions for urban climate resilience. BioScience 2022, 72, 113–115. [Google Scholar] [CrossRef]
  34. Zhu, S.; Feng, H. Strengthening Climate Resilience Through Urban Policy: A Mixed-Method Framework with Case Study Insights. Land 2025, 14, 890. [Google Scholar] [CrossRef]
  35. Albahouth, A.A.; Tahir, M. Institutional Quality and Climate Vulnerability: Empirical Evidence from GCC Economies. Sustainability 2025, 17, 2047. [Google Scholar] [CrossRef]
  36. Lee, J.J. Party polarization and trust in science: What about democrats? Socius 2021, 7, 23780231211010101. [Google Scholar] [CrossRef]
  37. Sisco, M.R. The effects of weather experiences on climate change attitudes and behaviors. Curr. Opin. Environ. Sustain. 2021, 52, 111–117. [Google Scholar] [CrossRef]
  38. Wu, S.Y.; Yarnal, B.; Fisher, A. Vulnerability of coastal communities to sea-level rise: A case study of Cape May County, New Jersey, USA. Clim. Res. 2002, 22, 255–270. [Google Scholar] [CrossRef]
  39. Vercammen, A.; Wray, B.; Crider, Y.S.; Belkin, G.; Lawrance, E.L. Psychological impacts of climate change on US youth. Proc. Natl. Acad. Sci. USA 2025, 122, e2311400122. [Google Scholar] [CrossRef]
  40. Nalau, J.; Verrall, B. Mapping the evolution and current trends in climate change adaptation science. Clim. Risk Manag. 2021, 32, 100290. [Google Scholar] [CrossRef]
  41. World Bank. Global Lessons Learned for Urban Resilience and Regeneration Projects: Informing Türkiye’s Urban Transformation Process (Report No. 160251). 2021. Available online: https://documents1.worldbank.org/curated/en/347121625066734390/pdf/Global-Lessons-Learned-for-Urban-Resilience-and-Regeneration-Projects-Informing-Turkey-s-Urban-Transformation-Process.pdf (accessed on 29 May 2025).
  42. Ekmekcioğlu, Ö.; Koc, K.; Özger, M. Stakeholder perceptions in flood risk assessment: A hybrid fuzzy AHP-TOPSIS approach for Istanbul, Turkey. Int. J. Disaster Risk Reduct. 2021, 60, 102327. [Google Scholar] [CrossRef]
  43. Nelson, L.K.; Cullen, A.C.; Koehn, L.E.; Harper, S.; Runebaum, J.; Bogeberg, M.; Strawn, A.; Levin, P.S. Understanding perceptions of climate vulnerability to inform more effective adaptation in coastal communities. PLoS Clim. 2023, 2, e0000103. [Google Scholar] [CrossRef]
  44. Atmaca, T.; Aydın, A. Reproduction of social inequality in education by transferring cultural capital. Manas Sos. Araştırmalar Derg. 2020, 9, 778–797. [Google Scholar] [CrossRef]
  45. Seker, M.; Baypinar, M.B.; Celikbicak, G.; Ozbay, B.K. Quality of life index: Istanbul 2020. İstanbul İktisat Derg.–Istanb. J. Econ. 2022, 72, 543–568. [Google Scholar] [CrossRef]
  46. Calvin, K.; Dasgupta, D.; Krinner, G.; Mukherji, A.; Thorne, P.W.; Trisos, C.; Romero, J.; Aldunce, P.; Barrett, K.; Blanco, G.; et al. IPCC, 2023: Climate Change 2023: Synthesis Report, Summary for Policymakers. Contribution of Working Groups I, II and III to the Sixth Assessment Report of the Intergovernmental Panel on Climate Change; Core Writing Team, Lee, H., Romero, J., Eds.; IPCC: Geneva, Switzerland, 2023; pp. 1–34. [Google Scholar]
  47. UNFCCC (United Nations Framework Convention on Climate Change). Introduction to Adaptation. 2022. Available online: https://unfccc.int/topics/adaptation-and-resilience/the-big-picture/introduction-to-adaptation (accessed on 22 February 2025).
  48. European Commission. The European Green Deal. 2020. Available online: https://ec.europa.eu/info/sites/default/files/european-green-deal-communication_en.pdf (accessed on 22 February 2025).
  49. Çal, İ.; Ciravoğlu, A. Determining Vulnerability Indicators of Buildings for Sea-Level Rise and Floods in Urban Coastal Areas. Sustainability 2024, 17, 27. [Google Scholar] [CrossRef]
  50. Keller, E.; Marsh, J.E.; Richardson, B.H.; Ball, L.J. A systematic review of the psychological distance of climate change: Towards the development of an evidence-based construct. J. Environ. Psychol. 2022, 81, 101822. [Google Scholar] [CrossRef]
  51. Goldberg, M.H.; Gustafson, A.; Rosenthal, S.A.; Leiserowitz, A. Shifting Republican views on climate change through targeted advertising. Nat. Clim. Change 2021, 11, 573–577. [Google Scholar] [CrossRef]
  52. Leiserowitz, A.; Maibach, E.; Roser-Renouf, C.; Smith, N. Climate Change in the American Mind: Americans’ Global Warming Beliefs and Attitudes in January 2010; Yale Project on Climate Change; Yale University: New Haven, CT, USA; George Mason University: Fairfax, VA, USA, 2010. [Google Scholar]
  53. Wang, C.; Geng, L.; Rodríguez-Casallas, J.D. How and when higher climate change risk perception promotes less climate change inaction. J. Clean. Prod. 2021, 321, 128952. [Google Scholar] [CrossRef]
  54. Wu, M.; Long, R.; Chen, H.; Wang, J. The influence of risk perception on climate change communication behavior: A dual perspective of psychological distance and environmental values. Nat. Hazards 2023, 118, 785–806. [Google Scholar] [CrossRef]
  55. McDonald, R.I.; Chai, H.Y.; Newell, B.R. Personal experience and the ‘psychological distance’of climate change: An integrative review. J. Environ. Psychol. 2015, 44, 109–118. [Google Scholar] [CrossRef]
  56. Lorenzoni, I.; Nicholson-Cole, S.; Whitmarsh, L. Barriers perceived to engaging with climate change among the UK public and their policy implications. Glob. Environ. Change 2007, 17, 445–459. [Google Scholar] [CrossRef]
  57. Weber, E.U. What shapes perceptions of climate change? Wiley Interdiscip. Rev. Clim. Change 2010, 1, 332–342. [Google Scholar]
  58. Spence, A.; Pidgeon, N. Framing and communicating climate change: The effects of distance and outcome frame manipulations. Glob. Environ. Change 2010, 20, 656–667. [Google Scholar] [CrossRef]
  59. Lai, C.H.; Liao, P.C.; Chen, S.H.; Wang, Y.C.; Cheng, C.; Wu, C.F. Risk perception and adaptation of climate change: An assessment of community resilience in rural Taiwan. Sustainability 2021, 13, 3651. [Google Scholar] [CrossRef]
  60. Pelling, M.; Dill, K. Disaster politics: Tipping points for change in the adaptation of sociopolitical regimes. Prog. Hum. Geogr. 2010, 34, 21–37. [Google Scholar] [CrossRef]
  61. Hügel, S.; Davies, A.R. Expanding adaptive capacity: Innovations in education for place-based climate change adaptation planning. Geoforum 2024, 150, 103978. [Google Scholar] [CrossRef]
  62. Simon, H.A. Bounded rationality in social science: Today and tomorrow. Mind Soc. 2000, 1, 25–39. [Google Scholar] [CrossRef]
  63. Kahan, D.M.; Peters, E.; Wittlin, M.; Slovic, P.; Ouellette, L.L.; Braman, D.; Mandel, G. The polarizing impact of science literacy and numeracy on perceived climate change risks. Nat. Clim. Change 2012, 2, 732–735. [Google Scholar] [CrossRef]
  64. Carmen, E.; Fazey, I.; Ross, H.; Bedinger, M.; Smith, F.M.; Prager, K.; McClymont, K.; Morrison, D. Building community resilience in a context of climate change: The role of social capital. Ambio 2022, 51, 1371–1387. [Google Scholar] [CrossRef] [PubMed]
  65. Ji, T.; Chen, J.H.; Wei, H.H.; Su, Y.C. Towards people-centric smart city development: Investigating the citizens’ preferences and perceptions about smart-city services in Taiwan. Sustain. Cities Soc. 2021, 67, 102691. [Google Scholar] [CrossRef]
  66. Hahn, M.B.; Riederer, A.M.; Foster, S.O. The Livelihood Vulnerability Index: A pragmatic approach to assessing risks from climate variability and change—A case study in Mozambique. Glob. Environ. Change 2009, 19, 74–88. [Google Scholar] [CrossRef]
  67. Serdeczny, O.; Andrijevic, M.; Fyson, C.; Lissner, T.; Menke, I.; Schleussner, C.F.; Theokritoff, E.; Thomas, A. Climatic risks to adaptive capacity. Mitig. Adapt. Strateg. Glob. Change 2024, 29, 10. [Google Scholar] [CrossRef]
  68. Ustaoglu, E.; Bovkır, R.; Sisman, S. Assessment of the Climate Change Vulnerability of the Cities in Turkey. Environ. Sci. Sustain. Dev. 2024, 9, 17–31. [Google Scholar] [CrossRef]
  69. Ma, A.T.; Wong, G.K.; Cheung, L.T.; Lo, A.Y.; Jim, C.Y. Climate change perception and adaptation of residents in Hong Kong. J. Clean. Prod. 2021, 288, 125123. [Google Scholar] [CrossRef]
  70. Williams, D.S.; Balaban, O.; Ilhan, A.; Paker, H.; Şahin, Ü.; Yıldırım, B.S.; Turhan, E.; Uncu, B.A.; Olazabal, M. A policy content analysis for evaluating urban adaptation justice in İstanbul. Environ. Sci. Policy 2022, 136, 476–485. [Google Scholar] [CrossRef]
  71. Berner, H.; Hurtado, S.D.G.; Gualini, E. Strategies for urban climate adaptation: Pathways towards equitable resilience in Barcelona and Berlin. Cities 2025, 161, 105836. [Google Scholar] [CrossRef]
  72. Türe, C.; Ar, M. Urban Vulnerability Assessments to Climate Change for Members of the European Healthy Cities Network in Turkey: A Case Study. Resilience 2024, 8, 249–264. [Google Scholar] [CrossRef]
  73. İklim Değişikliği Başkanlığı. İklim Değişikliği Uyum Bülteni (Vol. 34). 2023. Available online: https://iklimeuyum.org/wp-content/uploads/2023/08/Vol-34.pdf (accessed on 29 May 2025).
  74. Korkmaz, M. Public awareness and perceptions of climate change: Differences in concern about climate change in the West Mediterranean region of Turkey. Appl. Ecol. Environ. Res. 2018, 16, 4039–4050. [Google Scholar] [CrossRef]
  75. Liu, X.; Huang, Y.; Xu, X.; Li, X.; Li, X.; Ciais, P.; Lin, P.; Gong, K.; Ziegler, A.D.; Chen, A.; et al. High-spatiotemporal-resolution mapping of global urban change from 1985 to 2015. Nat. Sustain. 2020, 3, 564–570. [Google Scholar] [CrossRef]
  76. Włodarczyk-Marciniak, R.; Sikorska, D.; Krauze, K. Residents’ awareness of the role of informal green spaces in a post-industrial city, with a focus on regulating services and urban adaptation potential. Sustain. Cities Soc. 2020, 59, 102236. [Google Scholar] [CrossRef]
  77. Hong, J.; Jeon, C.Y. Linking Perceptions, Emotions, and Actions: How Psychological Distance, Media Framing, and Guilt About Climate Crisis Promote Communication and Pro-Environmental Behavior. Sustainability 2025, 17, 2409. [Google Scholar] [CrossRef]
  78. Turkish Statistical Institute (TURKSTAT). The Results of Address-Based Population Registration System 2024. 2024. Available online: https://data.tuik.gov.tr/Bulten/Index?p=The-Results-of-Address-Based-Population-Registration-System-2024-53783&dil=2#:~:text=TURKSTAT%20Corporate&text=The%20population%20residing%20in%20T%C3%BCrkiye,million%20811%20thousand%20834%20people (accessed on 10 February 2025).
  79. Tanim, A.H.; Goharian, E.; Moradkhani, H. Integrated socio-environmental vulnerability assessment of coastal hazards using data-driven and multi-criteria analysis approaches. Sci. Rep. 2022, 12, 11625. [Google Scholar] [CrossRef]
  80. Engström, J.; Jafarzadegan, K.; Moradkhani, H. Drought vulnerability in the United States: An integrated assessment. Water 2020, 12, 2033. [Google Scholar] [CrossRef]
  81. Nandi, A.; Mandal, A.; Wilson, M.; Smith, D. Flood hazard mapping in Jamaica using principal component analysis and logistic regression. Environ. Earth Sci. 2016, 75, 465. [Google Scholar] [CrossRef]
  82. Tipping, M.E.; Bishop, C.M. Probabilistic principal component analysis. J. R. Stat. Soc. Ser. B Stat. Methodol. 1999, 61, 611–622. [Google Scholar] [CrossRef]
  83. Uddin, M.N.; Islam, A.S.; Bala, S.K.; Islam, G.T.; Adhikary, S.; Saha, D.; Haque, S.; Fahad, M.G.; Akter, R. Mapping of climate vulnerability of the coastal region of Bangladesh using principal component analysis. Appl. Geogr. 2019, 102, 47–57. [Google Scholar] [CrossRef]
  84. Slovic, P.; Fischhoff, B.; Lichtenstein, S. Facts and fears: Understanding perceived risk. In The Perception of Risk; Routledge: Oxfordshire, UK, 2016; pp. 137–153. [Google Scholar]
  85. Sjöberg, M.; Edberg, A.K.; Rasmussen, B.H.; Beck, I. Documentation of older people’s end-of-life care in the context of specialised palliative care: A retrospective review of patient records. BMC Palliat. Care 2021, 20, 91. [Google Scholar] [CrossRef] [PubMed]
  86. Ho, M.C.; Shaw, D.; Lin, S.; Chiu, Y.C. How do disaster characteristics influence risk perception? Risk Anal. Int. J. 2008, 28, 635–643. [Google Scholar]
  87. Slovic, P. Trust, emotion, sex, politics, and science: Surveying the risk-assessment battlefield. Risk Anal. 1999, 19, 689–701. [Google Scholar] [CrossRef]
  88. Antronico, L.; Coscarelli, R.; De Pascale, F.; Di Matteo, D. Climate change and social perception: A case study in southern Italy. Sustainability 2020, 12, 6985. [Google Scholar] [CrossRef]
  89. Amos, E.; Akpan, U.; Ogunjobi, K. Households’ perception and livelihood vulnerability to climate change in a coastal area of Akwa Ibom State, Nigeria. Environ. Dev. Sustain. 2015, 17, 887–908. [Google Scholar] [CrossRef]
  90. Schipper, E.L.; Revi, A.; Preston, B.L.; Carr, E.R.; Eriksen, S.H.; Fernandez-Carril, L.R.; Glavovic, B.; Hilmi, N.J.; Ley, D.; Mukerji, R.; et al. Climate Resilient Development Pathways; Cambridge University Press: Cambridge, UK, 2022. [Google Scholar]
  91. Sambrook, K.; Konstantinidis, E.; Russell, S.; Okan, Y. The role of personal experience and prior beliefs in shaping climate change perceptions: A narrative review. Front. Psychol. 2021, 12, 669911. [Google Scholar] [CrossRef]
  92. Yu, J.; Castellani, K.; Forysinski, K.; Gustafson, P.; Lu, J.; Peterson, E.; Tran, M.; Yao, A.; Zhao, J.; Brauer, M. Geospatial indicators of exposure, sensitivity, and adaptive capacity to assess neighbourhood variation in vulnerability to climate change-related health hazards. Environ. Health 2021, 20, 31. [Google Scholar] [CrossRef]
  93. Leiserowitz, A. Climate change risk perception and policy preferences: The role of affect, imagery, and values. Clim. Change 2006, 77, 45–72. [Google Scholar] [CrossRef]
  94. Van der Linden, S. The social-psychological determinants of climate change risk perceptions: Towards a comprehensive model. J. Environ. Psychol. 2015, 41, 112–124. [Google Scholar] [CrossRef]
  95. Gallopín, G.C. Linkages between vulnerability, resilience, and adaptive capacity. Glob. Environ. Change 2006, 16, 293–303. [Google Scholar] [CrossRef]
  96. Jones, C.R.; Hine, D.W.; Marks, A.D.G. The future is now: Reducing psychological distance to increase public engagement with climate change. Risk Anal. 2017, 37, 331–341. [Google Scholar] [CrossRef] [PubMed]
  97. Burke, S.M.; Stephens, J.C. Political power and renewable energy futures: A critical review. Energy Res. Soc. Sci. 2018, 35, 78–93. [Google Scholar] [CrossRef]
  98. Adger, W.N.; Barnett, J.; Brown, K.; Marshall, N.; O’brien, K. Cultural dimensions of climate change impacts and adaptation. Nat. Clim. Change 2013, 3, 112–117. [Google Scholar] [CrossRef]
  99. Climate Change and Social Vulnerability in the United States: A Focus on Six Impacts; U.S. Environmental Protection Agency: Washington, DC, USA, 2021.
  100. Schaffer, L.M.; Oehl, B.; Bernauer, T. Are policymakers responsive to public demand in climate politics? J. Public Policy 2022, 42, 136–164. [Google Scholar] [CrossRef]
  101. Ostrom, E. Beyond markets and states: Polycentric governance of complex economic systems. Am. Econ. Rev. 2010, 100, 641–672. [Google Scholar] [CrossRef]
  102. Henstra, D. The tools of climate adaptation policy: Analysing instruments and instrument selection. Clim. Policy 2016, 16, 496–521. [Google Scholar] [CrossRef]
  103. Rafael, S.; Martins, H.; Borrego, C.; Lopes, M. Urban vulnerability and resilience to climate change. WIT Trans. Ecol. Environ. 2015, 198, 379–390. [Google Scholar]
Figure 1. Methodological framework.
Sustainability 17 05358 g001
Figure 2. The study area, showing selected districts of Istanbul: (a) Z1—Beşiktaş; (b) Z2—Kadıköy; (c) Z3—Kağıthane; (d) Z4—Şişli; (e) Z5—Üsküdar.
Sustainability 17 05358 g002
Figure 3. Socioeconomic characteristics of respondents: (a) Age; (b) Gender; (c) Average Monthly Income; (d) Education; (e) Employment Type; (f) Household Size; (g) House Ownership.
Sustainability 17 05358 g003
Figure 4. District-wise frequencies of: (a) Past experiences with climate extremes; (b) Perceived climate risks in Istanbul; (c) Actions taken to reduce climate risks; (d) Barriers to climate action.
Sustainability 17 05358 g004
Figure 5. District-based generated maps of Istanbul illustrating the spatial distribution of key perception indices: (a) Climate Change Risk Perception; (b) Psychological Distance; (c) Adaptive Capacity.
Sustainability 17 05358 g005
Figure 6. (a) Clustered distribution of respondents based on Psychological Distance and Climate Change Risk Perception; (b) Mean scores of each cluster across CCRP, PD and Adaptive Capacity (AC), indicating distinct cognitive-perceptual profiles labeled as “Proactive”, “Detached” and “Ambivalent”.
Sustainability 17 05358 g006
Figure 7. Heatmap of the correlation matrix illustrating the relationships among Climate Change Awareness and Concern, Information Trust and Communication Channels, Perceptions of Impact and Institutional Response, Climate Change Anxiety and Perceived Personal Risk, Perceived Community, National and Global Risk, Institutional Trust and Disaster Preparedness, Climate Change Knowledge and Certainty, Self-Efficacy and Adaptive Readiness, Climate Change Knowledge and Future Outlook, Climate Actions Taken, Institutional Trust and Policy Support, Future Expectations and Preparedness, Psychological and Emotional Responses to Climate Change, Climate Change Risk Perception, Psychological Distance, Adaptive Capacity (in order of appearance).
Sustainability 17 05358 g007
Figure 8. Structural equation model depicting the relationship between climate change risk perception, psychological distance and adaptive capacity. Standardized path coefficients are presented.
Sustainability 17 05358 g008
Table 4. Socioeconomic characteristics of the respondents (n = 500).
Socioeconomic CharacteristicsClassesFrequency%
Age18–246513
25–3416533
35–4415030
45–547515
55+459
GenderFemale26553
Male23547
Average Monthly Income (in TRY) *10,000–25,00010521
25,000–50,00016432.8
50,000+23146.2
EducationHigh School11022
Postgraduate12024
Primary408
Undergraduate23046
Employment TypeEmployed30761.4
Part-Time7615.2
Self-Employed11723.4
1 person12324.6
2 people17034
Household size3 people14629.2
4 people499.8
5 people81.6
6 or more people40.8
House ownershipOwn18737.4
Rent31362.6
Past experiences with climate extreme eventsFlood16933.8
Storm18637.2
Heatwave21543
Landslides8917.8
Drought10120.2
Air Pollution15330.6
Sea-Level Rise6012
No Experience428.4
Perceived Climate-Related Risks in IstanbulFlood22244.4
Storm24048
Heatwave24348.6
Landslides499.8
Drought8717.4
Air Pollution11022
Sea-Level Rise122.4
Hailstorms153
Snowstorms112.2
No Significant Risks7414.8
Actions Taken to Reduce Climate Risks in IstanbulWaste separation & recycling31262.4
Planting trees & urban greening367.2
Reducing plastic use9018
Improving home insulation224.4
Using alternative transport14428.8
Engaging in climate discussions11022
Installing renewable energy solutions6513
Harvesting rainwater & conserving water275.4
Buying locally produced & sustainable goods6012
Participating in environmental campaigns234.6
Supporting eco-friendly businesses9018
Preparing for climate-related disasters326.4
Using flood-resilient materials in construction336.6
Using early-warning systems & insurance for climate risks336.6
No Climate Actions Taken6412.8
Belief that individual action is ineffective459
Financial constraints13426.8
Housing & infrastructure limitations285.6
Inadequate local infrastructure173.4
Lack of community support5611.2
Barriers to Climate ActionLack of government incentives15531
Lack of time or competing priorities489.6
Limited access to information14829.6
Psychological distance224.4
Skepticism about climate change7414.8
No major barriers16132.2
* 1 USD = 36.44 TRY and Minimum Wage is TRY22,104.67 (per month) (January, 2025).
Table 5. Descriptive statistics and loading factors of climate change risk perception indicators.
CodesDescriptive StatisticsZ1Z2Z3Z4Z5Chi-Square (χ2) TestANOVA Test (F Test)PC1
Media & Information EngagementMean3.613.362.643.353.34χ2 = 61.457F = 12.7680.42
Std. Dev1.0141.151.010.9680.945p-value < 0.001p-value < 0.001
Concern LevelMean3.623.483.093.513.24χ2 = 31.639F = 4.7070.36
Std. Dev0.8741.0961.0450.990.976p-value = 0.011p-value < 0.001
Perceived Direct ImpactMean3.883.83.073.793.58χ2 = 45.750F = 9.8120.38
Std. Dev1.0180.9641.1570.9981.103p-value < 0.001p-value < 0.001
Scientific LiteracyMean3.863.593.083.223.28χ2 = 51.497F = 8.3080.43
Std. Dev0.9850.9541.1071.161.232p-value < 0.001p-value < 0.001
Future Generational OutlookMean4.33.843.523.933.88χ2 = 37.194F = 7.5530.27
Std. Dev0.8591.0421.1411.0080.988p-value = 0.002p-value < 0.001
Hazard Severity PerceptionMean3.993.953.473.673.75χ2 = 26.241F = 4.1850.22
Std. Dev1.010.9141.1321.0351.095p-value = 0.051p-value = 0.002
Trust in Climate Communication—Government AgenciesMean2.422.692.672.472.96χ2 = 24.208F = 4.013−0.16
Std. Dev1.1211.0321.0920.9891.1p-value = 0.085p-value = 0.003
Trust in Climate Communication—Local MunicipalitiesMean2.892.633.042.723.22χ2 = 31.768F = 4.900−0.11
Std. Dev1.0721.0121.0441.1291.124p-value = 0.011p-value < 0.001
Trust in Climate Communication—Environmental NGOs & ActivistsMean3.773.463.193.182.66χ2 = 60.291F = 14.2410.27
Std. Dev0.931.1141.1611.1231.085p-value < 0.001p-value < 0.001
Trust in Climate Communication—Scientific Community & UniversitiesMean4.163.663.393.553.23χ2 = 52.265F = 10.7920.35
Std. Dev0.8251.1391.1711.141.072p-value < 0.001p-value < 0.001
Trust in Climate Communication—Traditional MediaMean2.342.522.512.822.57χ2 = 29.780F = 2.458−0.05
Std. Dev0.9451.0961.0781.141.241p-value = 0.019p-value = 0.045
Trust in Climate Communication—Social Media & Online PlatformsMean3.773.452.873.332.95χ2 = 46.827F = 10.4610.37
Std. Dev1.0531.0771.1861.1981.201p-value < 0.001p-value < 0.001
Urban Risk SensitivityMean3.853.493.033.353.52χ2 = 41.248F = 8.3280.27
Std. Dev0.9680.981.1231.0381.03p-value < 0.001p-value < 0.001
Personal Climate RelevanceMean3.953.83.093.333.49χ2 = 50.015F = 11.2690.43
Std. Dev0.9680.9531.0451.1461.059p-value < 0.001p-value < 0.001
Institutional ConfidenceMean2.342.843.373.273.45χ2 = 84.663F = 20.376−0.56
Std. Dev1.0271.170.9910.930.999p-value < 0.001p-value < 0.001
Climate Change Risk PerceptionMean3.663.523.133.443.45χ2 = 239.660F = 35.344
Std. Dev0.2830.3140.3000.3240.301p-value < 0.001p-value < 0.001
Table 6. Descriptive statistics and loading factors of psychological distance to climate change indicators.
CodesDescriptive StatisticsZ1Z2Z3Z4Z5Chi-Square (χ2) TestANOVA Test (F Test)PC1
Climate AnxietyMean3.963.762.93.663.27χ2 = 71.127F = 16.7700.45
Std. Dev0.9531.0061.041.0171.145p-value < 0.001p-value < 0.001
Disaster Readiness PerceptionMean2.632.983.063.233.27χ2 = 39.353F = 5.205−0.28
Std. Dev1.2281.0731.0331.1881.062p-value < 0.001p-value < 0.001
Personal Impact ExpectationMean3.853.462.843.373.15χ2 = 46.641F = 11.7920.32
Std. Dev0.9571.1411.1351.0891.123p-value < 0.001p-value < 0.001
Community-Level Impact PerceptionMean3.983.663.123.533.22χ2 = 54.057F = 12.7650.35
Std. Dev0.8990.8441.0570.9891.04p-value < 0.001p-value < 0.001
Global Disparities in ImpactMean3.983.593.013.433.59χ2 = 59.976F = 11.5220.38
Std. Dev0.8531.0551.1411.0940.986p-value < 0.001p-value < 0.001
Localized Threat PerceptionMean3.83.712.883.223.11χ2 = 63.899F = 14.2680.39
Std. Dev1.0050.9241.1571.061.081p-value < 0.001p-value < 0.001
National Impact ProjectionMean3.863.573.163.483.41χ2 = 40.452F = 6.7900.31
Std. Dev0.7921.0271.0321.0680.933p-value < 0.001p-value < 0.001
Global Impact ProjectionMean4.043.763.193.163.57χ2 = 62.804F = 14.6740.35
Std. Dev0.7240.9221.1341.170.891p-value < 0.001p-value < 0.001
Future Impact CertaintyMean3.983.742.963.283.56χ2 = 70.830F = 17.1440.40
Std. Dev0.8870.9061.0440.9960.957p-value < 0.001p-value < 0.001
Timeline ExpectationMean1.51.542.431.991.83χ2 = 83.580F = 21.586−0.54
Std. Dev0.6280.7020.9670.8470.888p-value < 0.001p-value < 0.001
Climate Reality ConfidenceMean4.34.13.433.733.59χ2 = 70.650F = 14.0750.43
Std. Dev0.8930.9590.9871.0140.954p-value < 0.001p-value < 0.001
Perceived AlarmismMean1.531.613.482.843.59χ2 = 287.728F = 119.609−0.68
Std. Dev0.6580.7511.020.9721.065p-value < 0.001p-value < 0.001
Scientific Consensus AwarenessMean4.213.923.353.573.69χ2 = 56.955F = 11.7270.31
Std. Dev0.8440.8951.0671.0270.971p-value < 0.001p-value < 0.001
Psychological DistanceMean3.513.343.063.293.30χ2 = 200.290F = 37.754
Std. Dev0.2230.2440.3000.2000.272p-value < 0.001p-value < 0.001
Table 7. Descriptive statistics and loading factors of adaptive capacity indicators.
CodesDescriptive StatisticsZ1Z2Z3Z4Z5Chi-Square (χ2) TestANOVA Test (F Test)PC1
Individual ProactivenessMean3.653.513.053.413.15χ2 = 27.413F = 4.6330.16
Std. Dev1.0381.1151.251.1811.201p-value = 0.037p-value = 0.001
Crisis PreparednessMean2.892.632.322.692.61χ2 = 28.408F = 3.5900.17
Std. Dev1.1631.071.0431.071.053p-value = 0.028p-value = 0.007
Community EngagementMean2.582.462.132.52.11χ2 = 39.681F = 4.3550.25
Std. Dev0.9871.0491.0021.151.072p-value < 0.001p-value = 0.002
Policy PerceptionMean2.222.552.82.372.88χ2 = 36.129F = 6.842−0.38
Std. Dev1.0691.1141.1011.060.988p-value = 0.003p-value < 0.001
Institutional Resilience—Turkish GovernmentMean2.332.472.712.283.01χ2 = 44.458F = 7.685−0.37
Std. Dev1.0161.0391.1041.1111.168p-value < 0.001p-value < 0.001
Institutional Resilience—Local MunicipalitiesMean3.12.642.872.63.2χ2 = 31.144F = 5.9630.02
Std. Dev1.1421.011.061.111.155p-value = 0.013p-value < 0.001
Institutional Resilience—Environmental NGOs & ActivistsMean3.643.543.223.262.63χ2 = 56.213F = 12.0210.30
Std. Dev1.1060.9681.2761.1511.16p-value < 0.001p-value < 0.001
Institutional Resilience—Scientific Community & UniversitiesMean3.943.743.463.572.91χ2 = 69.725F = 15.5950.45
Std. Dev0.8621.0411.0680.8681.055p-value < 0.001p-value < 0.001
Institutional Resilience—Private Sector & BusinessesMean2.392.442.763.162.66χ2 = 36.746F = 7.141−0.30
Std. Dev1.0721.1751.1821.1351.191p-value = 0.002p-value < 0.001
Institutional Resilience—International OrganizationsMean3.723.422.923.252.93χ2 = 41.869F = 9.6200.37
Std. Dev0.9961.1481.1431.0671.112p-value < 0.001p-value < 0.001
Regulatory EndorsementMean4.023.73.293.473.22χ2 = 48.087F = 10.2190.37
Std. Dev0.7650.981.1311.151.031p-value < 0.001p-value < 0.001
Financial CommitmentMean3.523.412.973.483.19χ2 = 34.145F = 4.5090.19
Std. Dev1.020.9751.2751.0491.089p-value = 0.005p-value = 0.001
Policy PrioritizationMean43.763.33.643.58χ2 = 39.571F = 7.3230.28
Std. Dev0.8410.9861.010.8711.007p-value < 0.001p-value < 0.001
Quality of Life ImpactMean3.883.713.163.513.39χ2 = 51.758F = 7.4010.41
Std. Dev1.0180.821.0121.151.1p-value < 0.001p-value < 0.001
Risk Awareness & ForecastingMean3.933.633.173.513.38χ2 = 39.136F = 7.2200.28
Std. Dev1.0081.0121.121.0871.052p-value = 0.001p-value < 0.001
Self-Efficacy in AdaptationMean3.973.693.063.533.46χ2 = 54.326F = 10.1500.40
Std. Dev0.9041.071.1791.021.039p-value < 0.001p-value < 0.001
Practical Adaptation ImplementationMean4.013.532.873.113.35χ2 = 68.855F = 15.6970.42
Std. Dev0.8931.0681.1691.1971.123p-value < 0.001p-value < 0.001
Adaptive CapacityMean3.403.232.943.143.04χ2 = 239.872F = 45.691
Std. Dev0.2350.2650.3150.2960.282p-value < 0.001p-value < 0.001
Disclaimer/Publisher’s Note: The statements, opinions and data contained in all publications are solely those of the individual author(s) and contributor(s) and not of MDPI and/or the editor(s). MDPI and/or the editor(s) disclaim responsibility for any injury to people or property resulting from any ideas, methods, instructions or products referred to in the content.

