Article

Flowering Patterns of Cornus mas L. in the Landscape Phenology of Roadside Green Infrastructure Under Climate Change Conditions in Serbia

1
Faculty of Forestry, University of Belgrade, Kneza Viseslava 1, 11030 Belgrade, Serbia
2
Faculty of Agriculture, University of Novi Sad, Trg Dositeja Obradovića 8, 21000 Novi Sad, Serbia
*
Author to whom correspondence should be addressed.
Sustainability 2025, 17(12), 5334; https://doi.org/10.3390/su17125334 (registering DOI)
Submission received: 5 May 2025 / Revised: 27 May 2025 / Accepted: 4 June 2025 / Published: 9 June 2025
(This article belongs to the Section Sustainability, Biodiversity and Conservation)

Abstract

:
One of the emerging services provided by roadside green infrastructure is its contribution to the quality of landscape phenology, which is measured through the succession of colours and forms throughout the seasons. In the seasonal dynamics of space, flowering phenological patterns play a key role, particularly in early blooming species such as Cornus mas L. Therefore, this paper aims to highlight the significance of the Cornelian cherry as a component of roadside green infrastructure in the southwestern suburban zone of Belgrade. Through an integrative approach to phenological and climatic elements, and by means of a specific case study covering the period from 2007 to 2025, under climate change conditions, the influence of air temperature and precipitation on local flowering patterns of the Cornelian cherry has been assessed. Based on 1140 phenological observations conducted over 19 consecutive years, from January to April, key flowering elements were identified—those that influence pollination, fruiting, and the species’ practical potential. The Mann–Kendall, Sen’s slope, Rayleigh, and Watson–Williams tests were used to examine spatio-temporal changes in flowering patterns, while the Spearman Rank test and circular statistics were applied to quantify correlations among the analysed parameters. The results confirm that Cornelian cherry is an adaptive and sustainable species that continuously provides visual identity during its flowering period, while simultaneously reflecting climate change through phenological responses. These phenological responses are closely linked to local climatic conditions. In addition to enriching landscape phenology with vibrant visual features during the colder months, Cornelian cherry also enhances biodiversity by providing ecosystem services as a nectar-producing species, with its pollen serving as an early and valuable food source for bees. The study also confirms that the seasonal dynamics of landscape phenology can be used as a scientifically valid criterion for assessing the ecological quality of roadside green infrastructure.

1. Introduction

Phenology is the study of recurring phenomena influenced by biological processes and climatic variables. Phenological shifts, expressed through phenotypic plasticity, serve as a valuable primary tool for monitoring early signs of ecosystem transition under climate change conditions [1]. Plant phenology responds to weather and climate and is fundamentally shaped by the evolutionary development of species along climatic gradients, which reflect differing resource-use strategies [2]. Geographic variation is also inherent in the ecological concept of ecotypes—populations adapted to specific local environmental and climatic conditions [3]—a concept recognised in the early stages of modern bioclimatic research [4]. In this context, landscape phenology stands out as a field that perceives seasonal variations in colours and forms across landscapes [5]. Landscape phenology is also used as an indicator by the OECD, as the uniqueness of specific locations and landscape diversity are of great significance for regional identity, and indirectly exert substantial societal influence [6]. In contemporary research, phenology is becoming increasingly important for understanding the influence of varying conditions on species interactions [7] and for shedding light on the relationship between climate and ecosystem processes [8]. There is a growing emphasis on creating attractive year-round landscapes, with seasonal changes being used as scientifically relevant criteria for assessing landscape quality. Studies in landscape phenology primarily focus on describing and characterising seasonal transformations, while relatively few address the winter aspect under conditions of altered temperate continental climates. Given that phenology can be heterogeneous across different communities and landscapes, and may vary across a broad range of spatial and temporal scales [9], and considering that phenological shifts in individual species can affect ecosystem functions [10], this study explores the impact of Cornus mas L. flowering patterns in late winter and early spring on the landscape phenology of roadside green infrastructure.
Cornus mas L. is a medium-sized tree or shrub that is increasingly used in public green spaces across Europe, particularly due to its seasonal characteristics—such as profuse late-winter flowering and autumn foliage—and its multifunctional fruit [11]. The Cornelian cherry is a food, medicinal, and ornamental plant, rarely affected by pests or diseases [12]. It is resistant to low temperatures and drought, and requires minimal maintenance, which is why it is considered a species of the future [11]. However, published studies on Cornelian cherry in the context of landscape phenology are limited, which has prompted extensive field research aimed at identifying the species’ practical potential. Existing research has focused on two main aspects of roadside vegetation: (1) the analysis of its functions, including providing habitats for rare plants and animals, serving as a seed source for surrounding landscapes, offering protection from traffic-related noise and light, and enhancing the aesthetic experience for road users [13,14,15]; and (2) its negative effects, such as attracting wildlife and increasing the rate of wildlife-vehicle collisions, creating corridors for the spread of weeds and invasive species, obstructing traffic signs, and causing damage to road surfaces [16,17,18]. To the authors’ knowledge, this is the first study to apply an integrative approach—over a period of 19 consecutive years—linking climatic variables with the flowering phenology of Cornus mas L., with the aim of assessing the species’ adaptability and enabling predictive insights into phenological shifts and landscape-level phenology of roadside green infrastructure under climate change conditions.
The objectives of the research were: (a) to understand the vulnerability of the Cornelian cherry’s flowering phenological pattern to climate change over a period of 19 consecutive years; (b) to assess the impact of air temperature and precipitation on local flowering patterns; and (c) to propose a sustainable model of winter-spring landscape phenology of Cornelian cherry within the roadside green infrastructure of the suburban zone of Belgrade, Serbia.

2. Materials and Methods

2.1. Study Site

This study investigates a population of Cornelian cherry within roadside green infrastructure, located on the slope of a road cut along the M19 main road in Serbia, in the southwestern territory of the Belgrade municipality of Čukarica, in the settlement of Ostružnica (Figure 1). The total area of the roadside green infrastructure encompassing the study population is 5397 m2, with Rhus typhina L. being the dominant species. Other recorded species include Prunus cerasifera Ehrh., Malus sylvestris (L.) Mill., Prunus spinosa L., Rosa canina L., and Amorpha fruticosa L. The Cornelian cherry population occupies an area of 564.6 m2 (central coordinates: φ 44°43′38.59″ N, λ 20°18′55.05″ E), situated on gently sloping terrain (3.3°) with an ENE (east-northeast) orientation, on dry gleyic soil [19], at an elevation ranging from 97 to 99 m above sea level.

2.2. Data Analysis

Phenology, Seasonality and Climatic Variables

Phenological Data. Through monitoring every other day over a period of 19 consecutive years (2007–2025), key elements of the flowering phenological pattern were recorded at the population level, according to Meier [20], using the extended BBCH scale: 60BBCH (the day when more than 10% of flowers were open), 65BBCH (the day when more than 50% of flowers were open), and 69BBCH (the day when more than 80% of flowers had wilted). The dates were converted into day of year (DOY) values following Koch et al. [21]. For the elements of the flowering phenological pattern, the accumulated heat sums (GDD) were calculated for each individual year of the study, according to Lalić et al. [22]. Flowering abundance was assessed by quantifying phenological observations using the five-point Kaperov scale [23]: no open flowers (0% of individuals with open flowers), low number of open flowers (≤20%), small number of open flowers (>20−≤40%), moderate number of open flowers (>40−≤60%), abundant flowering (>60−≤80%), and maximum number of open flowers (>80%).
In relation to the landscape, the phenology of flowering is defined as the connection between colour and form in roadside green infrastructure and the seasons, given that, according to Coeterier [5], the expression of the seasons in the perception of roadside green infrastructure is one of the fundamental characteristics in the observation and evaluation of seasonality. Daily percentages (DOY) of open flowers at the population level were analysed for each of the 19 years. Additionally, a circular statistical analysis method was used to determine seasonality, following Morellato et al. [24]. In this analysis, months were converted into angles (each month covering a 30° interval). The mean angle was calculated to indicate the central tendency of the data for each flowering phase (60BBCH, 65BBCH, and 69BBCH), based on the corresponding DOY values.
Length of the Mean Vector (r). The length of the mean vector r (ranging from 0 to 1) indicates the degree of concentration of frequency around the mean value, thereby defining the level of seasonality (an r value of 1 indicates that the data are tightly clustered around a specific angle, thus reflecting maximum seasonality). Measures of dispersion included angular variance (values ranging from 0 to 2) and angular deviation (values from 0 to 81.03), with higher values indicating greater dispersion or a more uniform circular distribution (BioEstat).
To test the significance of seasonality, the Rayleigh test was applied, where the null hypothesis assumes no seasonality and that all variables follow a uniform circular distribution. The alternative hypothesis assumes a non-uniform distribution, with data concentrated in a particular directional segment.
Day of year (DOY) values were used as phenological variables for all key elements of the flowering phenological pattern over the 19-year study period, at the population level. To confirm seasonality, a comparison of flowering phenophase elements was conducted for the period 2007–2025 between the native C. mas and the naturalised P. cerasifera, using circular statistical analysis and the non-parametric Watson–Williams F-test. This test assumes that the mean vectors of the two species are not significantly different; rejecting this hypothesis would indicate asynchrony between species.
Climatic Data. To analyse the influence of climatic variables, a generalised logistic model was applied using data from the Republic Hydrometeorological Service of Serbia (RHMZ) (https://www.hidmet.gov.rs and https://www.ogimet.com; accessed on 28 February 2025), based on records from the main meteorological station in Surčin (φ44°47′54.44″ N; λ20°27′53.35″ E), due to environmental similarity. The analysis covered the period 1991–2025. Statistical climatological methods based on percentiles and associated terciles (RHMZ) were applied after establishing climate normals for the reference period 1991–2020.
Quantitative data were statistically processed using descriptive statistics, the Mann–Kendall trend test, Sen’s slope estimator, and the Spearman rank correlation test, implemented through the XLSTAT 2022 software package. Circular statistics were conducted using the BioEstat 5.3 software. Additionally, ArcGIS/ArcMap 10.8, Google Earth Pro, and the author’s photographs were used in the study.

3. Results

3.1. The Influence of Air Temperature and Precipitation on the Flowering Phenological Patterns of Cornelian Cherry

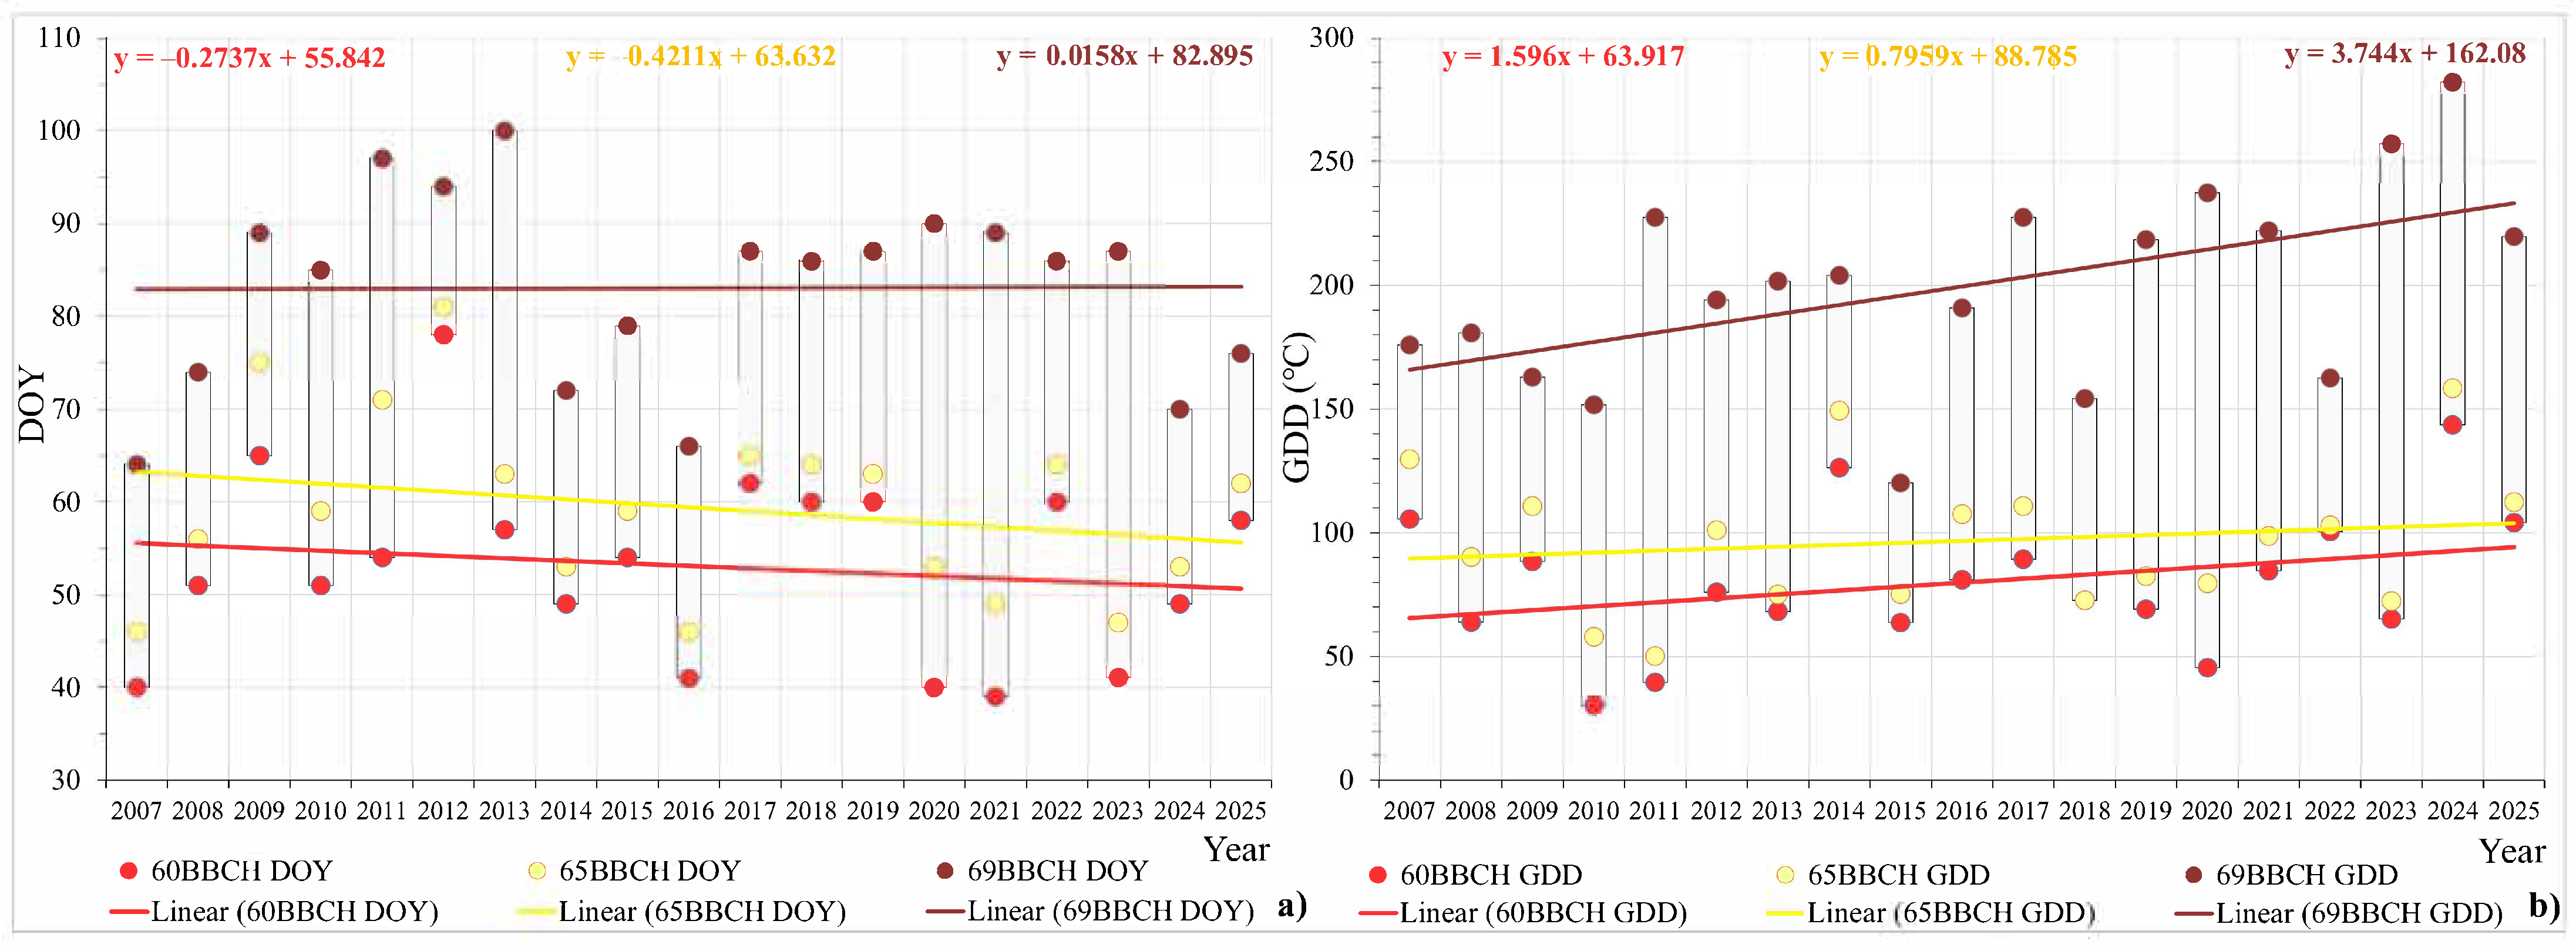
For the flowering phenophases 60BBCH and 65BBCH, decreasing trends in DOY (day of year) were observed, confirming that both the onset and full flowering phases have shown a tendency to occur earlier over time. In contrast, the 69BBCH phase exhibited only a slight downward trend, indicating pronounced fluctuations in the end of flowering over the 19-year study period (Figure 2a). The absolute difference between the earliest and latest occurrence of 60BBCH was 39 days, supporting the conclusion that the flowering of Cornelian cherry varied in accordance with changes in climatic parameters. The absolute difference for 65BBCH was 35 days, and for 69BBCH, 36 days. The earliest 60BBCH DOY was recorded in 2021 (DOY 39), while the earliest 65BBCH (DOY 49) and 69BBCH (DOY 64) were both observed in 2007. The year 2012 stood out with the latest 60BBCH (DOY 78) and 65BBCH (DOY 81), while 2013 recorded the latest 69BBCH (DOY 100).
The 60BBCH phase occurred after the accumulation of growing degree days (GDD) ranging from 30.1 °C (in 2010, DOY 51) to 142.6 °C (in 2024, DOY 49). The mean accumulated heat sum for 60BBCH during the 2007–2025 period was 79.9 °C. The 65BBCH phase was observed following accumulated heat sums between 50.2 °C (in 2011, DOY 71) and 158.4 °C (in 2024, DOY 53).
The mean accumulated heat sum for 65BBCH during the 2007–2025 period was 96.7 °C. The 69BBCH phase was recorded following GDD accumulation ranging from 120.1 °C (in 2015, DOY 79) to 282.1 °C (in 2024, DOY 70). The mean accumulated heat sum for 69BBCH over the same period was 199.5 °C. In 2024, which was recorded as the globally warmest year (RHMZ), flowering began, reached full bloom, and ended (Figure 2b) after the highest accumulated heat sums in the 19-year period.
The calculated GDDs during the study period showed variability, with increasing linear trends for all key flowering phenophases (Figure 2b). These findings confirm that the shifts in DOY for the observed phenophases do not affect heat accumulation; rather, the phenophases occur within specific thermal thresholds and are influenced by extreme climatic events.
However, the Mann–Kendall trend test indicated that the DOY trends, as well as the increasing GDD trends for 60BBCH and 65BBCH phases, were not statistically significant (Table 1). Only the trend in accumulated heat for the end of flowering (69BBCH GDD) was statistically significant, which was also confirmed by the slope magnitude in Sen’s slope test (Table 1, Figure 3), where a previously observed increasing trend was evident.
The values of the Spearman correlation coefficient for GDD and DOY of Cornelian cherry flowering were statistically significant, positive, and strong between 60BBCH DOY and 65BBCH DOY (0.92002), as well as between 60BBCH GDD and 65BBCH GDD (0.91579). A moderate positive correlation was observed between 65BBCH DOY and 69BBCH DOY (0.58252). Thus, as one variable increases, so does the other, in accordance with the strength of the correlation. A moderate negative correlation was also found between 65BBCH GDD and 69BBCH DOY (−0.5365), indicating that as GDD for full flowering increases, the DOY for the end of flowering decreases. Other correlations were not statistically significant.
Descriptive statistics were also used to assess the impact of climatic variables on the adaptability of Cornelian cherry (Table 2). Standard deviation and other deviation parameters indicated a shift in the onset and other phenophases of Cornelian cherry flowering.
Based on the previous analyses, it was confirmed that the flowering phenophase of Cornelian cherry was influenced by the interactions between years and climatic variables during the 19 consecutive years of the study. Therefore, the average seasonal air temperatures and precipitation amounts for the study period from 2007 to 2025, for February, March, and April (the months in which the key flowering phases were observed over the 19 years), are shown in relation to the reference period 1991–2020 in Figure 4.
The year in which flowering began the earliest (2021) was characterised by temperatures above the upper tercile and precipitation amounts at the normal level for February, while the latest onset, full bloom, and shortest duration of the flowering phenophase occurred in 2012, when February temperatures were significantly below the lower tercile, and precipitation was above the upper tercile (Figure 4a). The winter of 2012, according to the percentile method, was categorised as cold and very cold, with February 2012 being the coldest since measurements began, accompanied by a snow cover of 64 cm in mid-month (RHMZ), which implied the latest onset of flowering. The earliest full bloom and end of flowering were observed in 2007, when temperatures and precipitation in February and March (Figure 4a,b) were significantly above the upper terciles, particularly in March. The latest end of flowering occurred in 2013, when temperatures in February were near normal, and precipitation was above the upper tercile. In March, temperatures were significantly below the lower tercile, with precipitation above the upper tercile, while in April, temperatures were above the upper tercile, and precipitation was near the lower tercile (Figure 4a–c). The highest accumulated heat sums for all key events in the flowering phenological pattern were recorded in 2024 (marked in red on Figure 4a–c), when temperatures in February and March were furthest from the upper tercile, and precipitation was significantly below the lower tercile (February) and between the lower tercile and normal (March). In April, temperatures were significantly above the upper tercile, and precipitation was slightly below the lower tercile. According to data from RHMS, 2024 is the warmest year on record in Belgrade since 1887, with the mean air temperature deviation reaching +2.3 °C compared to the normal reference period of 1991–2020. The warmest winter, spring, summer, as well as the months of February, March, June, July, and August were recorded, with absolute maximum values of mean, mean maximum, and mean minimum air temperatures. This significantly affected the accumulated heat sums relevant to the phenological flowering patterns of Cornelian cherry. In the current year (2025), the DOY and GDD values for all flowering phenophase elements were close to the mean value for the 19-year study period. It is characterised by temperatures significantly below the lower tercile and precipitation at the lower tercile (February), temperatures and precipitation significantly above the upper tercile (March), and both climatic variables at the upper terciles in April (Figure 4a–c).
During the period 2007–2025, the shortest flowering phenophase occurred in 2012 (17 days), while the longest occurred in 2020 and 2021 (51 days). The years with the longest flowering phenophases were characterised by (Figure 4a–c): February temperatures and precipitation above the upper tercile (2020) or temperatures above the upper tercile and precipitation at normal levels (2021); March temperatures at the upper tercile and precipitation at normal levels (2020) or temperatures at the lower tercile and precipitation near the upper tercile (2021); and April temperatures significantly above the upper tercile with precipitation significantly below the lower tercile (2020) or temperatures significantly below the lower tercile with precipitation at normal levels (2021). The average flowering duration was 29.9 days, with the flowering phase in 2024 being 8.9 days longer and in 2025 being 11.9 days shorter than the average.
Table 3 shows the descriptive statistics for the flowering pattern elements of Cornelian cherry at the population level for each of the 19 consecutive years of the study. The average number of days from 60BBCH to 65BBCH was 6.3 days, from 65BBCH to 69BBCH was 23.6 days, and from 60BBCH to 69BBCH was 29.9 days. Given the pronounced variability of the flowering pattern elements over the study period, the average daily air temperatures during the relevant periods, as well as the descriptive statistics for these temperatures, were determined (Table 3). This data was used to assess the impact of air temperature on the flowering of Cornelian cherry. The statistical parameters indicate variation in the number of days for the flowering pattern elements of Cornelian cherry and the average air temperatures during the corresponding flowering periods. Therefore, the statistical significance of increasing or decreasing trends for the analysed parameters was tested using the Mann–Kendall and Sen’s slope tests (Table 4). No significant trends were confirmed for any of the parameters.
Considering the previous findings, Spearman Rank correlations were performed. The values of the Spearman Rank correlation coefficient indicate a significant, very strong positive correlation between the length of the flowering phase and the number of days from 65BBCH to 69BBCH (0.9655), meaning that the longer the period from full bloom to the end of blooming, the longer the overall flowering phase. A strong positive correlation was also found between the average air temperature during the flowering phase and the average temperature during the period from 65BBCH to 69BBCH (0.84578), meaning that higher temperatures from full bloom to the end of blooming significantly increase the air temperature during the flowering phase. On the other hand, a moderate negative correlation was observed between the length of flowering and Tmean 60BBCH-65BBCH (−0.60793) and the number of days from full bloom to the end of blooming and Tmean 60BBCH-65BBCH (−0.52975), confirming the impact of air temperature on the phenological flowering patterns. Other correlations were not statistically significant.
Although not the subject of this study, it is important to note that the yield during the 18 consecutive years of observation correlated with the abundance of flowering, and that in the current year, 2025, fruits in the 72BBCH phase (Fruit size up to 20 mm; [14]) were observed in April.

3.2. Phenology of Flowering, Seasonality, and Climatic Variables

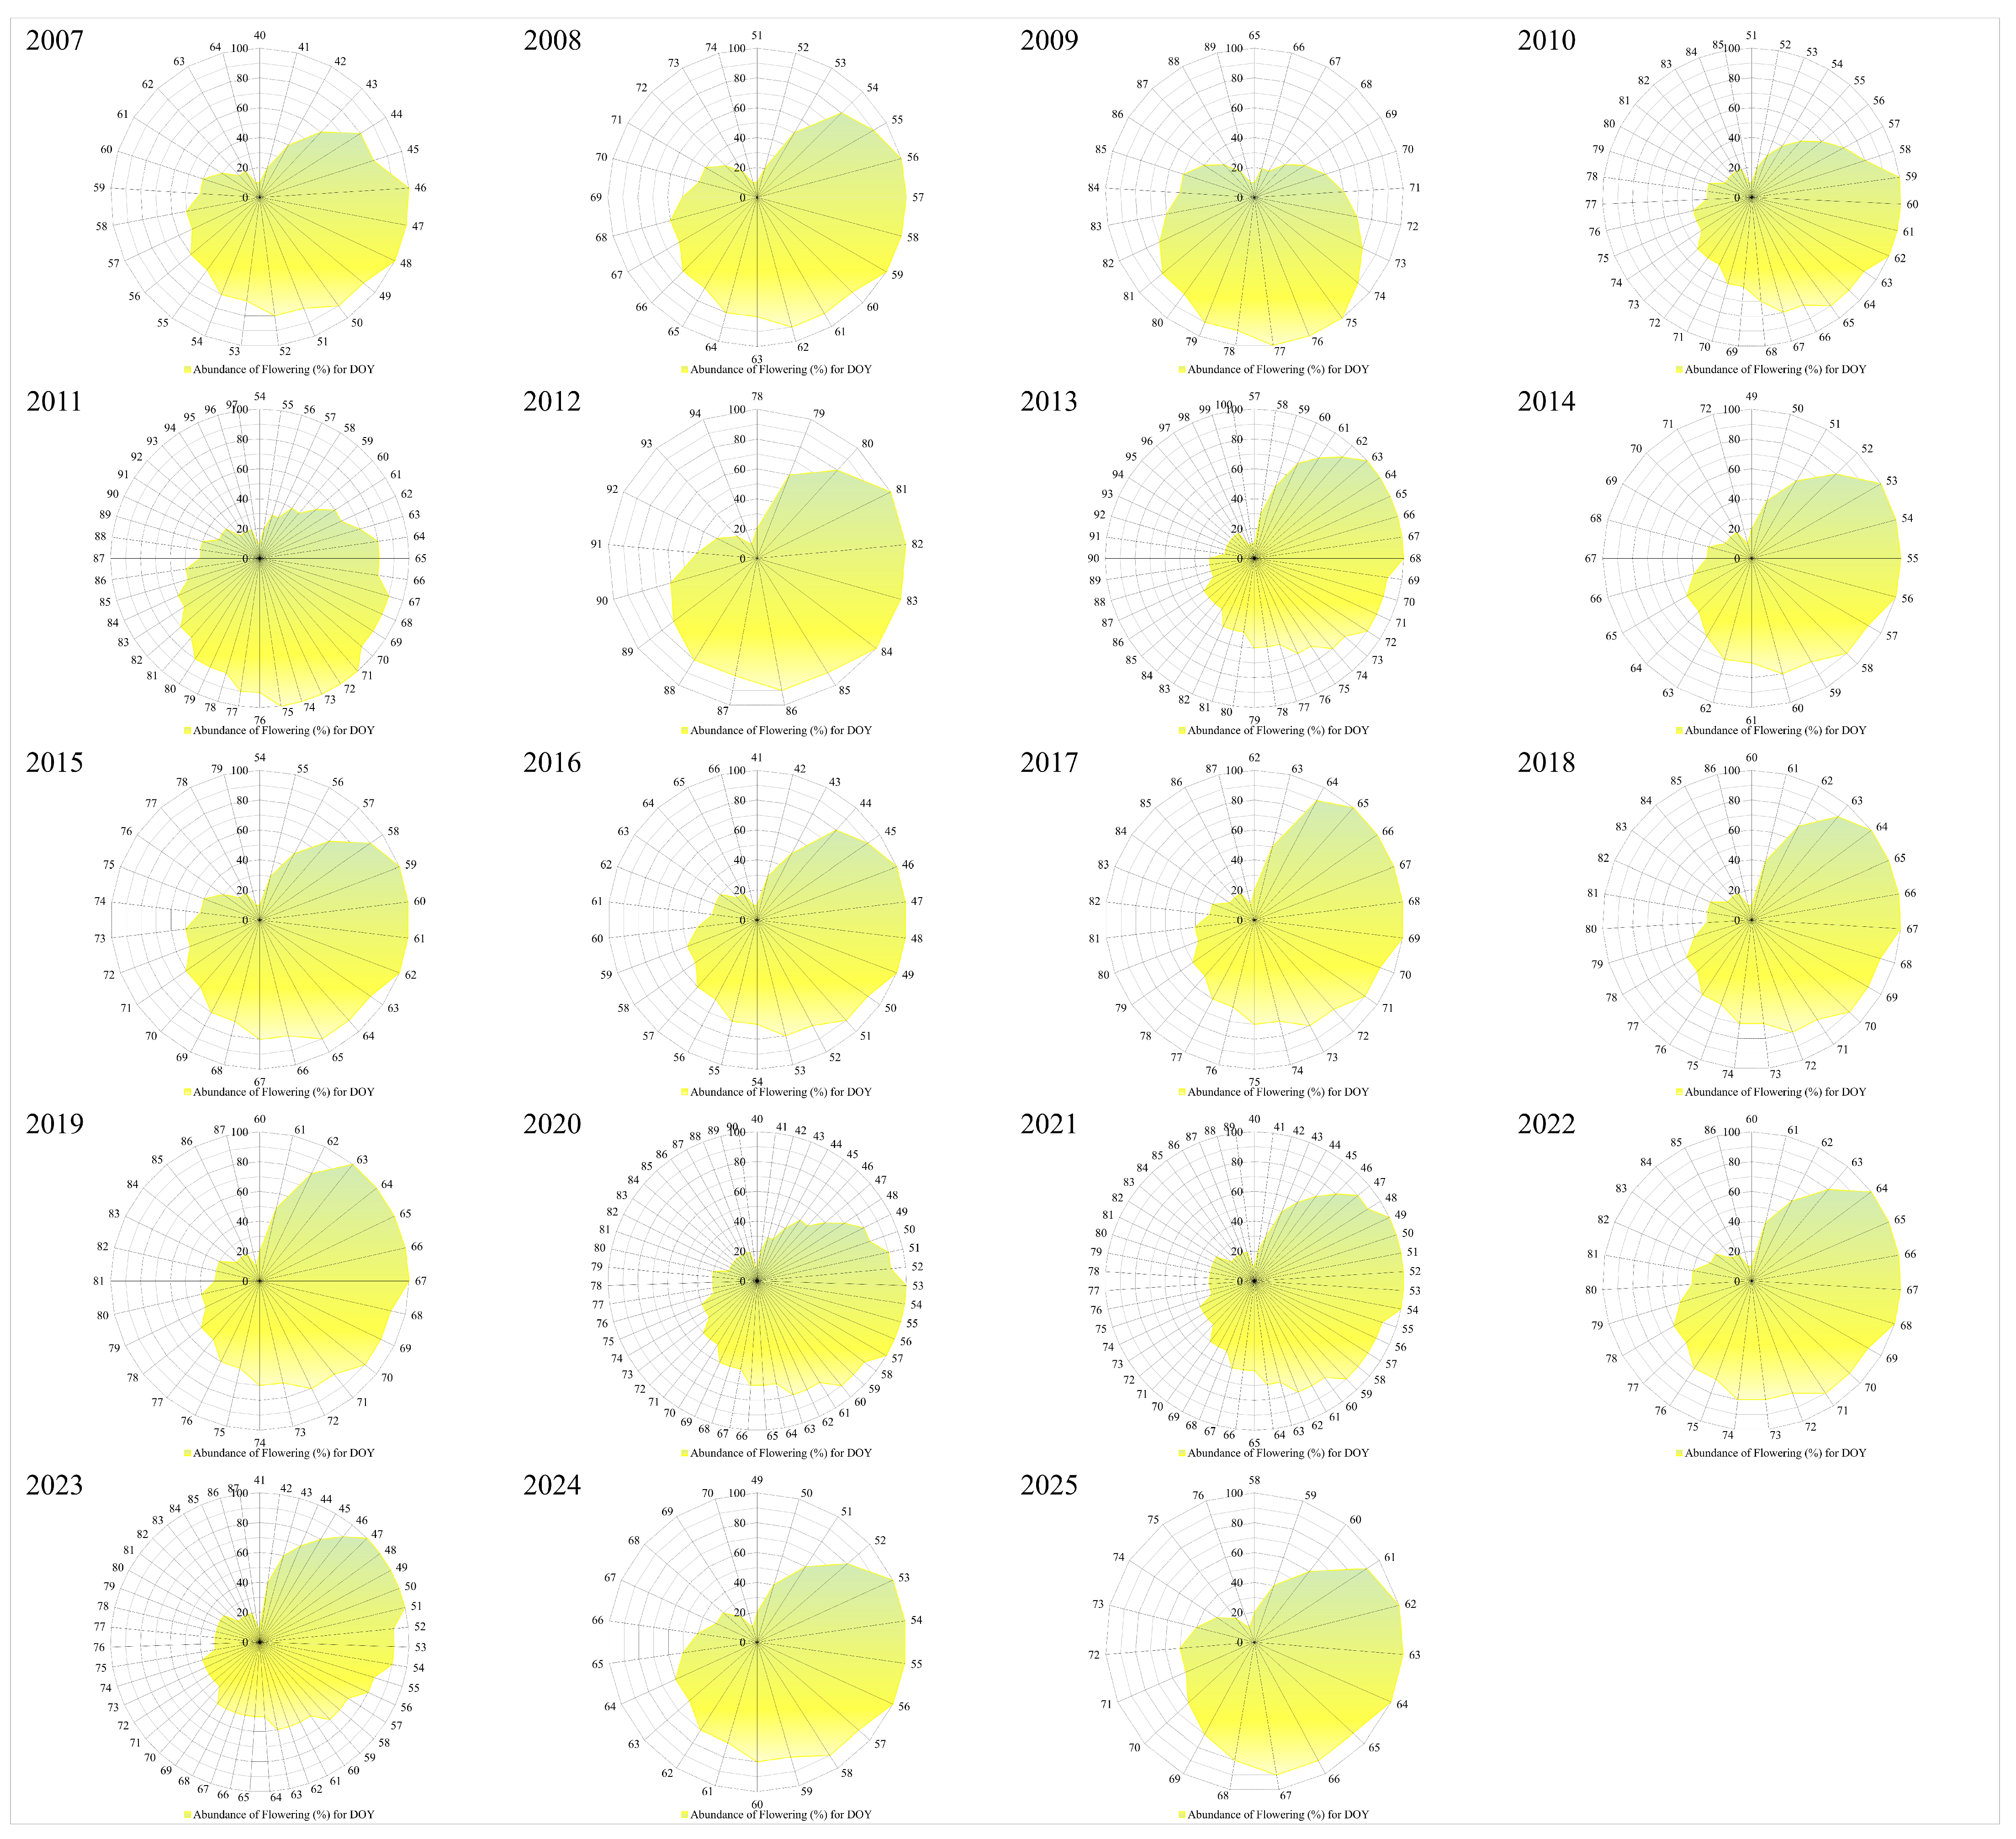
During the nineteen years of research, the phenological patterns of Cornelian cherry flowering were recorded at the end of winter and the beginning of spring (Figure 5). The 60BBCH phase began in February in 52% of the years, and in March in 48%. Full bloom (65BBCH) occurred in February in 36% of the cases and in March in 64%. Neither the beginning nor full bloom were recorded in April. The end of flowering (69BBCH) was observed only in 12% of the years in April, and in 88% in March, with no end of flowering recorded in February.
Since the previous analyses confirmed the impact of climatic variables on the phenological patterns of Cornelian cherry flowering, Table 5 presents the climatic variables for the reference period (1991–2020) and the research period (2007–2025), during which the flowering of C. mas occurred consecutively for 19 years. Table 6 and Table 7 show the results of the average monthly air temperatures (°C) and precipitation sums (mm), categorised using percentiles and terciles for the period from February to April 2025 (19th year of the study).
In the current year, 2025, February had air temperature within the normal category according to both percentiles and terciles, with precipitation categorised as very dry according to percentiles and dry according to terciles. In March, the air temperature was categorised as very warm according to percentiles and warm according to terciles, with precipitation categorised as rainy in both percentiles and terciles. In April, the air temperature was warm, and precipitation was in the normal category for both statistical parameters (Table 6 and Table 7).
Although changes in climatic variables, particularly air temperature and precipitation, are evident, the Cornelian cherry has confirmed strong seasonality for all three phases of the flowering pattern according to the results of the Rayleigh test (Table 8). The close (high) values of the vector (r) approaching 1 indicate the concentration of flowering beginnings around the angle of 53°, full flowering at 59°, and the end of flowering around the angle of 83°. All p-values were below the significance level (0.05), leading to the rejection of the null hypothesis and the conclusion that there is a peripheral direction that directs the flowering pattern to the late winter-early spring period.
The year of observation had an impact on the flowering patterns (Figure 5), with air temperatures and precipitation affecting all elements of the flowering phenophase, as confirmed by high values of r ranging from 0.9849 to 0.9864 (Table 8). The elements of the phenological flowering pattern of Cornelian cherry and their impact on the seasonal dynamics of roadside green infrastructure are shown in Figure 6.
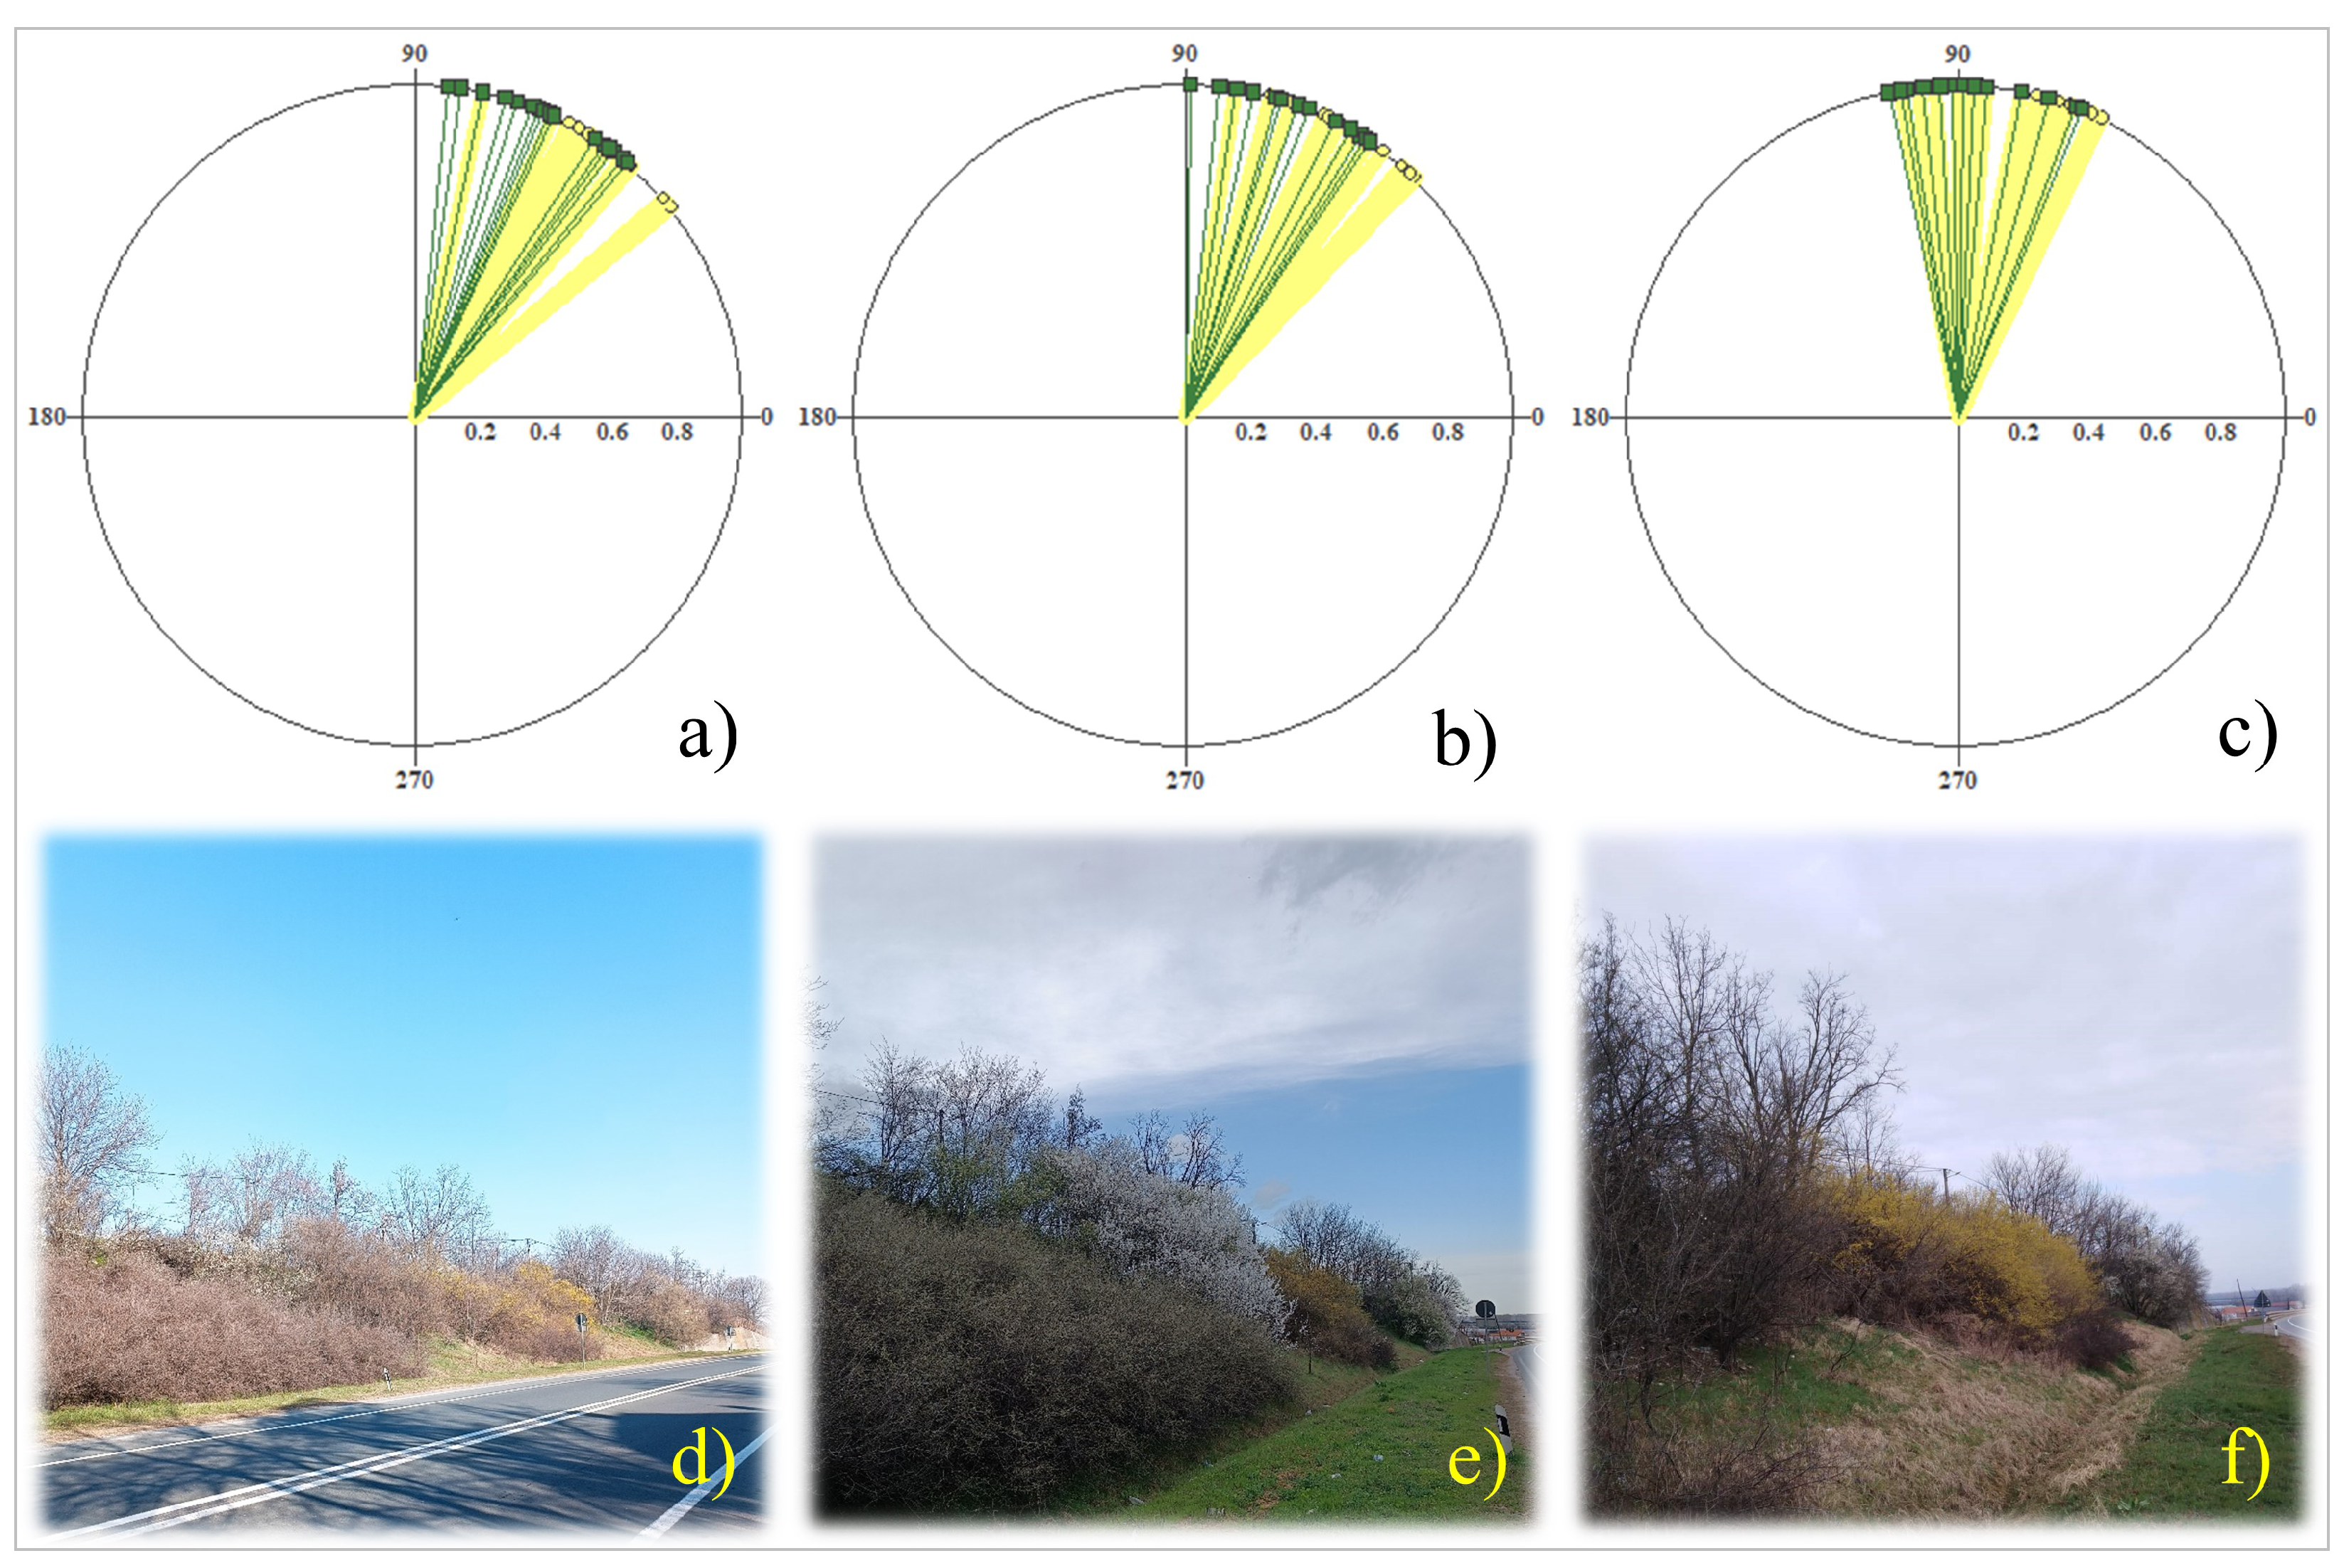
It can be observed that Cornelian cherry has a dominant influence in landscape phenology during late February, considering that the roadside green infrastructure is deciduous in nature. At the beginning of March, the dynamics are influenced by the full flowering phenophase of P. cerasifera, but it is the colour stability of the landscape phenology of roadside green infrastructure in mid-March that is provided by C. mas, as P. cerasifera is already in the phase of post-flowering and leafing, and P. spinosa had not yet entered the flowering initiation phase.
Considering all of the above and based on the comparative circular statistical analysis (Table 9), where the values of r are close to 1, p-values for both species and all flowering pattern elements were below the significance level (0.05), and the variance of the mean angle was significantly low, it is concluded that the species have a seasonal character. For P. cerasifera, over the 19 years of research, phenophases are observed to concentrate around the angles of 69° (flowering initiation), 83° (full flowering), and 89° (flowering end), which is 16°, 24°, and 30° more, respectively, compared to Cornelian cherry, directing the flowering pattern of P. cerasifera to early spring (Figure 6 and Figure 7). However, the standard error of the mean angle is higher, and it can be concluded that the flowering patterns of C. mas and P. cerasifera in the landscape phenology of roadside green infrastructure follow periodic events in their life cycles, primarily influenced by changes in climatic variables.
Furthermore, the end of flowering was the only phenophase in which there were no statistically significant differences between species over the years of the study (Table 10), as for the 69BBCH phase, the p-value was higher than 0.05, confirming that there is synchronisation in the end of flowering of C. mas and P. cerasifera
Circular correlations were used to assess the relationship between two independent variables, which in this study are the elements of the flowering patterns of C. mas and P. cerasifera, based on Raa notation for identifying the correlation coefficient that measures the degree of their association (Table 10). High positive values of Raa and p-values indicate the correlation of the elements of the phenological flowering pattern and their seasonality, as confirmed by the Watson–Williams test (Figure 7).

3.3. Guidelines for Modelling the Landscape Phenology of Roadside Green Infrastructure

Prediction models of phenological transitions are needed for various purposes, including: (1) identifying the mechanisms or environmental thresholds that drive and control phenology [25]; (2) predicting (and retrospectively assessing) the impact of climate change on phenology [26]; and (3) representing the seasonal trajectory of vegetation development and ageing in models of roadside green infrastructure [27]. Considering climate change in comparison with intensive urbanisation, rapid population growth, and increasing traffic volumes, roadside green infrastructure emerges as an innovative and holistic solution [28]. In the context of sustainable transport, roadside green infrastructure represents an approach that integrates natural elements and environmental engineering with the planning and management of transport systems in order to increase efficiency, reduce negative environmental impacts, and improve quality of life [29]. The integration is two-way, involving the development of green infrastructure alongside roads to support recreation, lower air temperatures, enhance biodiversity, and manage stormwater [28,30]. Elements such as permeable pavements and roadside rain gardens assist in stormwater runoff, increase water absorption, and reduce the risk of flooding. They also help lower maintenance costs by protecting transport infrastructure from damage and extending its lifespan [31]. In addition, this strategy supports the maintenance of groundwater quality and contributes to healthy ecosystems [32]. By reducing the environmental impact of transport systems, improving air and water quality, and creating more liveable spaces, roadside green infrastructure contributes to the development of healthier, more resilient, and more sustainable urban and suburban areas. Taking all of the above into account, along with the findings from nineteen years of research, the use of native trees and shrubs adapted to local conditions—such as Cornus mas L.—is recommended for roadside green infrastructure, as it can reduce maintenance costs and serve an educational purpose. Species with a tendency to become environmental weeds should be avoided due to the risk of invasiveness [33]. Like most regions worldwide, Serbia maintains a list of weed species that should be consulted to prevent the introduction of invasive plants [34]. This study highlights the presence of invasive, native, and non-native species (R. typhina, P. cerasifera, P. spinosa, R. canina, and A. fruticosa) in the study area, which, due to appropriate maintenance, have not spread into adjacent spaces. On the contrary, a continuous barrier was formed, which, according to Kalansuriya et al. [35], reduces high-frequency noise by up to 40%, thus improving both human quality of life and animal vocal communication. Due to the fragmentation of roadside green infrastructure and urbanisation in the study area, animal species are relatively scarce, though squirrels, hares, pheasants, buzzards, great tits, blackbirds, starlings, barn owls, long-eared owls, and other strictly protected species are present [36]. The steep topography and road verges have been stabilised with grasses and spontaneous shrub growth (e.g., dog rose, blackberry), which have not colonised the surrounding natural or agricultural ecosystems.
Nevertheless, a key guideline is that plant selection must be carried out with caution, minimising the risk of invasiveness. It is also important that the selection of plant taxa for predicting the dynamics of landscape phenology in roadside green infrastructure is based on local research. For instance, it may seem logical that following the flowering of C. mas, P. spinosa would become visually dominant during its full flowering phase. However, research by Ocokoljić et al. [37] documented an abrupt end to the flowering of P. spinosa in agroforestry ecotones, which function as elements of roadside green infrastructure, in April 2023. This was triggered by a drop in air temperature and heavy snowfall. Furthermore, the phenological response of blackthorn flowering to climate change—observed further north from the study area, along the continuation of the motorway towards central Belgrade—confirms that the greater the accumulation of heat, the less negative the effect of daily air temperatures on blackthorn flowering [37].
The obtained results provide a platform for studying non-systematic changes in landscape phenology as a response to climate change within elements of roadside green infrastructure. They are also relevant for research in the fields of landscape ecology and landscape architecture, for formulating guidelines in landscape design aimed at fostering a sense of place, as well as for highlighting the need to incorporate the values of physiognomic landscape composition into land-use policy.

4. Discussion

The observed differences in the phenological flowering patterns of Cornus mas L. in the roadside green infrastructure of the south-western suburban area of Belgrade, over all 19 consecutive years of the study, are correlated with climatic parameters. As in the study by Csontos et al. [38], the initiation of the flowering phenophase and subsequent phases of the phenological pattern are correlated with temperatures and precipitation from January to April. In comparison to the findings of Bijelić et al. [39] in Serbia (Vojvodina and Mačva) at five locations, where the start of flowering was recorded between 24 and 31 DOYa, in this study, it was 8 to 15 days earlier in relation to the mean DOY of flowering initiation over the 19 years. What was surprising is that the mentioned studies were conducted from 2011 to 2013, while our study also covered that three-year period, and our research recorded the latest start of flowering in 2012, which, compared to the findings of Bijelić et al. [39], was later by 47 to 54 days. Compared to the flowering of Cornelian cherry in Montenegro, from 72 to 117 DOYa, the results of this study indicate an earlier start of flowering by 33 days and a 17-day earlier end of flowering [40], highlighting the importance of local studies and the impact of climatic variables. The results of our study are consistent with the statements that Cornelian cherry flowers at the end of winter and the beginning of spring, before leafing [11,41], specifically in the late February—early March period [42], and earlier than in Ukraine, where flowering occurs from mid-March to mid-April [43]. The duration of flowering aligns with the claims of Vujanić-Varga [44] that the total flowering period of Cornelian cherry lasts from 15 to 70 days. The obtained results indicate the influence of climatic parameters on the elements of the flowering phenological pattern, particularly air temperatures that correlate with accumulated heat sums, but also precipitation [45,46]. Additionally, they confirm that a certain amount of heat is necessary for the elements of the flowering phenological pattern of Cornelian cherry and support its stability and sustainability as a species.
The importance of this research is also confirmed by previous studies [47,48,49], which were based on the global efforts to reduce the environmental impact of road transport, improve safety, and understand the views of the business sector as well as how new transport technologies and practices can be aligned with its expectations. In response to these challenges, the European Union (EU) has taken proactive steps to promote a more resilient and sustainable transport system [50]. Phenological changes are among the clearest biological responses to climate change, with consequences for plants and the ecosystem processes that support human life [27]. The phenological behaviour of individual species and plant communities has changed significantly in recent decades [45,51], and phenology is recognised as an important indicator of climate change, environmental change, and disturbance [52], including in the context of landscape phenology. Therefore, this pioneering study contributes to promoting a better balance between ecological, economic, and social aspects in planning and investment in order to make better use of the potential of new transport trends in the region and to support the development of more sustainable green road infrastructure, including the more effective use of Cornus mas L. as a climate-adaptive species for the future.
Seasonal plant responses, as well as the flowering of Cornelian cherry, are shaped by genetic foundations formed in the process of evolution, on one hand, and on the other hand, they largely depend on their adaptability to environmental factors, including photoperiod, air temperature, precipitation, etc. [53]. In conditions of pronounced dynamic climate change, the scope of phenological data is constantly expanding [54], increasing the importance of local studies. Our findings are consistent with studies on reproductive phenology that indicate the advancement of flowering initiation as a response to climate change [55], but it should also be noted that this effect can be taxon-dependent, which is why some taxa have significantly shifted their flowering start [45], while others have not [56]. Taxa whose life cycles are strongly synchronised with rising air temperatures begin their growing season earlier, which also makes it longer [56]. The results of this study confirm the statements of Cushman [57] that early-flowering plants will have a strong response to climate change, but are not in agreement with the conclusions of Burroughs [58] that earlier initiation of the growing season increases the risk of late spring frosts, which, in combination with milder winters, pose a threat even to frost-resistant plants. Evidence from ecosystems at high latitudes suggests that flowering and pollinator activity begin shortly after the snow melts, allowing for a greater number of days during which air temperatures can influence both the timing of flowering and the development of insect pollinators [59]. Additionally, according to Tarun and Bhanu [60], the use of calendar days is, especially for early flowering species, inaccurate because accumulated heat sums provide more precise physiological estimates and predictions of phenophases in relation to insect cycles. Throughout all 19 years of the study, the presence of bees was noted during the flowering period of Cornelian cherry, which is significant since its pollen is a valuable source, as according to Klimenko [43], bees can collect up to 20 kg of honey per hectare of Cornelian cherry plantation.
In all the studied flowering patterns of Cornelian cherry at the beginning of the growing season, generative buds precede the development of vegetative buds, meaning that landscape phenology begins with flowering, which varied over the 19 years in terms of the DOY of the start and duration of the main phases. The appearance of leaves, approximately 5 mm in length (phase 09BBCH), was most commonly observed during full flowering (65BBCH), as in the study by Feng et al. [61]. However, in this study, there were also years when the leaf development phase was recorded at the end of flowering (69BBCH). A clear seasonality of Cornelian cherry is evident, specifically the phenological patterns were influenced by both abiotic and biotic factors, as well as variations in climatic parameters in roadside green infrastructure, as noted by Silva et al. [62]. Additionally, according to CaraDonna and Inouye [63], the flowering of Cornelian cherry is associated with these variations, but the correlation with phylogeny—that is, the historical development strategy of the species—has a stronger effect.
It is a fact that the flowering of Cornelian cherry contributes to the quality of the landscape in roadside green infrastructure, as stable flowering patterns support the representativeness of the overall image and identity of landscape phenology at the end of winter and the beginning of spring.

5. Conclusions

The study identifies a model of a variable landscape mosaic with implications for understanding the resilience and sustainability of Cornelian cherry in the roadside green infrastructure of the suburban zone of Belgrade under climate change conditions. Namely, the initial hypothesis that the phenological flowering patterns of the Cornelian cherry are vulnerable to climate change was not confirmed. Flowering of the Cornelian cherry began in February in 52% of the years, and in March in 48%. Full flowering occurred in February in 36% of the years, and in March in 64%. The end of flowering was recorded in March in 88% of the years, and in April in 12%. The start and peak of flowering were not recorded in April, nor the end of flowering in February. The observed onset and full flowering phases showed non-significant upward trends, while the end of flowering showed a slightly declining trend, indicating fluctuations in the phenological flowering patterns and, consequently, the adaptability of the species within roadside green infrastructure over a period of 19 consecutive years. Nevertheless, the influence of air temperature and precipitation on local flowering patterns of the Cornelian cherry was confirmed. Although accumulated heat sums showed increasing trends across all key flowering phases, a statistically significant trend was observed only for the GDD (Growing Degree Days) at the end of flowering. The findings confirm that the flowering phases are not linked to calendar days (DOY), but rather that they occur within specific ranges of accumulated heat, which—along with the duration of flowering—correlates with air temperatures and precipitation levels. The longest flowering phenophase and the earliest onset of flowering were recorded in the year when February air temperatures were above the upper tercile and precipitation was normal, March temperatures were near the lower tercile with precipitation close to the upper tercile, while April temperatures were significantly below the lower tercile with normal precipitation. Conversely, the shortest flowering phenophase and the latest onset of flowering occurred in the year when February air temperatures were significantly below the lower tercile and precipitation exceeded the upper tercile. The study confirmed that Cornelian cherry exhibits strong seasonality, directing all three flowering phases to the late winter–early spring period. Furthermore, it confirmed a sustainable model of winter-spring landscape phenology of Cornelian cherry within the roadside green infrastructure of Belgrade’s suburban zone in Serbia. It was observed that Cornelian cherry plays a dominant role in landscape phenology during late February, considering that the roadside green infrastructure is primarily composed of deciduous species. Cornus mas also contributes to the phenological colour stability of the landscape in mid-March, as Prunus cerasifera enters the phases of post-flowering and leaf emergence, while other early-flowering species remain dormant. Thus, the flowering patterns of C. mas within the landscape phenology of roadside green infrastructure respond to changes in climatic variables. The resulting data on phenological flowering patterns describe the long-term dynamics of landscape phenology and can also be applied in ecological modelling, monitoring, assessment, and forecasting. Given that flowering phenological patterns are directly correlated with fruit production, and that in recent years the nutritional value and bioactive compounds of the fruits of Cornelian cherry have been the focus of research, further studies should focus on the breeding and conservation of the analysed population. The study also highlights the importance of studying local factors for a better understanding of biodiversity patterns. Additionally, there is a need for further research on phenological patterns in other geographical areas in order to improve the understanding of interactions between climatic and natural systems and assess ecological changes due to changes in climatic variables.
The obtained data are also significant for further studies on the adaptive capacities of Cornelian cherry in different climatic conditions, as well as for the practical use of the studied gene pool, its introduction and use in agricultural production, pharmacology, landscape design, and nature-based solutions important for landscape phenology.
Since the flowering patterns of Cornelian cherry in the landscape phenology of roadside green infrastructure serve as a scientifically useful criterion for assessing quality, providing information on contributions to landscape quality, further research has identified relationships between the diversity of colours and shapes, environmental quality, and diversity in flora and fauna, as well as the psychological significance of seasonal aspects for humans. It is well known that seasonal aspects are decisive characteristics in the perception and evaluation of landscapes, but what is lacking is an understanding of how seasonal aspects such as colours, shapes, scents, and sounds affect human perception, and to what extent they support spatial and temporal orientation.

Author Contributions

M.O.—Conceptualization, Methodology, Formal analysis, Investigation, Resources, Visualization, Data curation, Writing—original draft preparation, Writing—review and editing, Supervision, N.G.—Conceptualization, Methodology, Investigation, Resources, Visualization D.S.—Conceptualization, Methodology, Investigation, Resources, Visualization, J.Č.—Conceptualization, Methodology, Formal analysis, Investigation, Resources, Data curation. S.Đ.—Investigation, Resources, Visualization. R.K.—Formal analysis, Investigation, Resources. D.P.—Conceptualization, Methodology, Formal analysis, Investigation, Resources, Data curation, Writing—review and editing. All authors have read and agreed to the published version of the manuscript.

Funding

This research was supported by the Ministry of Science, Technological Development and Innovation of the Republic of Serbia, contract no. 451-03-137/2025-03/200117, 451-03-136/2025-03/200117, and 451-03-137/2025-03/200169. In addition, this manuscript covers one of the research topics conducted by researchers at the Centre of Excellence Agro-Ur-For, Faculty of Agriculture, Novi Sad, supported by the Ministry of Science, Technological Development and Innovations, contract no. 451-03-4551/2024-04/17.

Institutional Review Board Statement

Not applicable.

Informed Consent Statement

Not applicable.

Data Availability Statement

The original contributions presented in this study are included in the article. Further inquiries can be directed to the corresponding author.

Conflicts of Interest

The authors declare no conflicts of interest.

References

  1. Schwartz, M.D.; Betancourt, J.L.; Weltzin, J.F. From Caprio’s lilacs to the USA National Phenology Network. Front. Ecol. Environ. 2012, 10, 324–327. [Google Scholar] [CrossRef]
  2. Celton, J.M.; Martinez, S.; Jammes, M.J.; Bechtim, A.; Salvi, S.; Legave, J.M.; Costes, E. Deciphering the genetic determinism of bud phenology in apple progenies: A new insight into chilling and heat requirement effects on flowering dates and positional candidate genes. New Phytol. 2011, 192, 378–392. [Google Scholar] [CrossRef] [PubMed]
  3. Smith, T.M.; Smith, R.L. Elements of Ecology, 8th ed.; Benjamin Cummings: San Francisco, CA, USA, 2012. [Google Scholar]
  4. Hopkins, A.D. The bioclimatic law. Mon. Weather. Rev. 1920, 48, 355. [Google Scholar] [CrossRef]
  5. Coeterier, J.F. Hoe Beleven wij Onze Omgeving? Resultaten van 25 Jaar Omgevingspsychologisch Onderzoek in Stad en Landschap; Alterra, Research Instituut voor de Groene Ruimte: Wageningen, The Netherlands, 2000. [Google Scholar]
  6. Stolze, M.; Piorr, A.; Haring, A.; Dabbert, S. The Environmental Impacts of Organic Farming in Europe. Organic Farming in Europe: Economics and Policy; University of Hohenheim: Stuttgart, Germany, 2000; Volume 6. [Google Scholar]
  7. Olliff-Yang, R.L.; Ackerly, D.D. Topographic heterogeneity lengthens the duration of pollinator resources. Ecol. Evol. 2020, 10, 9301–9312. [Google Scholar] [CrossRef]
  8. Koebsch, F.; Sonnentag, O.; Järveoja, J.; Peltoniemi, M.; Alekseychik, P.; Aurela, M.; Arslan, A.; Dinsmore, K.; Gianelle, D.; Helfter, C.; et al. Refining the role of phenology in regulating gross ecosystem productivity across European peatlands. Glob. Change Biol. 2020, 26, 876–887. [Google Scholar] [CrossRef]
  9. Ruml, M.; Vulić, T. Spatial-temporal distribution of the general flowering of plum požegača in Serbia. Prostorno-vremenska distribucija opšteg cvetanja šljive požegače u Srbiji; Arhiv za poljoprivredne nauke. J. Sci. Agric. Res. 2004, 65, 61–69. (In Serbian) [Google Scholar]
  10. Piao, S.; Friedlingstein, P.; Ciais, P.; Viovy, N.; Demarty, J. Growing Season Extension and its Impact on Terrestrial Carbon Cycle in the Northern Hemisphere over the Past 2 Decades. Glob. Biogeochem. Cycles 2007, 21, GB3018. [Google Scholar] [CrossRef]
  11. Ocokoljić, M.; Petrov, D. Decorative Dendrology; Univerzitet u Beogradu-Šumarski Fakultet: Belgrade, Serbia, 2022; p. 409. (In Serbian) [Google Scholar]
  12. Foster, S. Forest Pharmacy: Medicinal Plants in American Forests; Forest History Society: Durham, NC, USA, 1955; p. 57. [Google Scholar]
  13. Milberg, P.; Bergman, K.O.; Cronvall, E.; Eriksson, Ĺ.I.; Glimskär, A.; Islamovic, A. Flower abundance and vegetation height as predictors for nectarfeeding insect occurrence in Swedish semi-natural grasslands. Agric. Ecosyst. Environ. 2016, 230, 47–54. [Google Scholar] [CrossRef]
  14. Bernes, C.; Bullock, J.M.; Jakobsson, S.; Rundlöf, M.; Verheyen, K.; Lindborg, R. How are biodiversity and dispersal of species affected by the management of roadsides? A systematic map protocol. Environ. Evid. 2017, 5, 4. [Google Scholar] [CrossRef]
  15. Akyol, A.; Orucu, O. Investigation of Cornelian Cherry (Cornus mas L.) in the Scope of Non-Wood Forest Products According to Climate Change Scenarios and Species Distribution Mode. Eur. J. Sci. Technol. 2019, 17, 224–233. [Google Scholar] [CrossRef]
  16. Zhang, K.; Chui, T.F.M. Linking hydrological and bioecological benefits of green infrastructures across spatial scales—A literature review. Sci. Total Environ. 2019, 646, 1219–1231. [Google Scholar] [CrossRef] [PubMed]
  17. Boira, J.V.; Berzi, M. Liberalization, Trans-European Corridors and EU Funds: A New Scenario in the Relationship between Rail Networks and Mediterranean Cities. Land 2023, 12, 1986. [Google Scholar] [CrossRef]
  18. Hapriyanto, A.R.; Azmi, H. Implementation of Green Infrastructure in Sustainable Transportation in Supporting Urban Mobility: A Literature Review. Eng. Proc. 2025, 84, 25. [Google Scholar] [CrossRef]
  19. Anjos, L.; Gaistardo, C.; Deckers, J.; Dondeyne, S.; Eberhardt, E.; Gerasimova, M.; Harms, B.; Jones, A.; Krasilnikov, P.; Reinsch, T.; et al. World Reference Base for Soil Resources 2014 International Soil Classification System for Naming Soils and Creating Legends for Soil Maps; World Soil Resources Reports No. 106; Schad, P., Van Huyssteen, C., Micheli, E., Eds.; FAO: Rome, Italy, 2015; JRC91947. [Google Scholar]
  20. Meier, U. BBCH-Monograph. Growth Stages of Plants; Blackwell Wissenschafts-Verla: Berlin, Germany; Vienna, Austria, 1997; p. 622. [Google Scholar]
  21. Koch, E.; Bruns, E.; Chmielewski, F.M.; Defila, C.; Lipa, W.; Menzel, A. Guidelines for plant phenological observations. World Clim. Data Monit. Programme 2007, 1484, 1–41. [Google Scholar]
  22. Lalić, B.; Ejcinger, J.; Dalamarta, A.; Orlandini, S.; Firanj Sremac, A.; Paher, B. Meteorology and Climatology for Agronomists; Meteorologija i klimatologija za agronome; Univerzitet u Novom Sadu-Poljoprivredni Fakultet: Novi Sad, Serbia, 2021; p. 219. (In Serbian) [Google Scholar]
  23. Stilinović, S. Seed Production of Forest and Ornamental Trees and Shrubs; Semenarstvo Šumskog i Ukrasnog Drveća i Žbunja; University of Belgrade—Faculty of Forestry: Belgrade, Serbia, 1985; p. 399. (In Serbian) [Google Scholar]
  24. Morellato, L.P.C.; Alberti, L.F.; Hudson, I.L. Applications of Circular Statistics in Plant Phenology: A Case Studies Approach. In Phenological Research: Methods for Environmental and Climate Change Analysis; Hudson, I.L., Keatley, M.R., Eds.; Springer: Dordrecht, The Netherlands, 2010; pp. 339–359. [Google Scholar] [CrossRef]
  25. Migliavacca, M.; Sonnentag, O.; Keenan, T.F.; Cescatti, A.; O’Keefe, J.; Richardson, A.D. On the uncertainty of phenological responses to climate change, and implications for a terrestrial biosphere model. Biogeosciences 2012, 9, 2063–2083. [Google Scholar] [CrossRef]
  26. Ibanez-Rueda, N.; Guillen-Royo, M.; Guardiola, J. Pro-Environmental Behavior, Connectedness to Nature, and Wellbeing Dimensions among Granada Students. Sustainability 2020, 12, 9171. [Google Scholar] [CrossRef]
  27. Richardson, A.D.; Keenan, T.F.; Migliavacca, M.; Ryu, Y.; Sonnentag, O.; Toomey, M. Climate change, phenology, and phenological control of vegetation feedbacks to the climate system. Agric. For. Meteorol. 2013, 169, 156–173. [Google Scholar] [CrossRef]
  28. Vujičić, D.; Vasiljević, N.; Radić, B.; Tutundžić, A.; Galečić, N.; Skočajić, D.; Ocokoljić, M. Conceptualisation of the Regulatory Framework of Green Infrastructure for Urban Development: Identifying Barriers and Drivers. Land 2024, 13, 692. [Google Scholar] [CrossRef]
  29. Gebru, G.H. Creating Interconnected Outdoor Green Infrastructure in The Case of Aksum Historical Sites, Ethiopia. CSID J. Infrastruct. Dev. 2023, 6, 2. [Google Scholar]
  30. Di Turo, F.; Medeghini, L. How Green Possibilities Can Help in a Future Sustainable Conservation of Cultural Heritage in Europe. Sustainability 2021, 13, 3609. [Google Scholar] [CrossRef]
  31. Grabowski, Z.J.; McPhearson, T.; Matsler, A.M.; Groffman, P.; Pickett, S.T.A. What is green infrastructure? A study ofdefinitions in US city planning. Front. Ecol. Environ. 2022, 20, 152–160. [Google Scholar] [CrossRef]
  32. Chatzimentor, A.; Apostolopoulou, E.; Mazaris, A.D. A review of green infrastructure research in Europe: Challenges and opportunities. Landsc. Urban Plan. 2020, 198, 103775. [Google Scholar] [CrossRef]
  33. Milton, S.J.; Dean, W.R.J. Plant invasions in arid areas: Special problems and solutions—A South African perspective. Biol. Invasions 2010, 12, 3935–3948. [Google Scholar] [CrossRef]
  34. Stojanović, V.; Jovanović, I. Survey of invasive and potentially invasive plant species in the Republic of Serbia and the environment with the aim of determining their status at the national level. Nat. Conserv. 2018, 68, 41–59. (In Serbian) [Google Scholar]
  35. Kalansuriya, C.M.; Pannila, A.S.; Sonnadara, D.U.J. Effect of Roadside Vegetation on the Reduction of Traffic Noise Levels. In Proceedings of the Technical Sessions Conference, Colombo, Sri Lanka, 14 March 2009; Institute of Physics Sri Lanka (IPSL): Colombo, Sri Lanka, 2009; Volume 25, pp. 1–6. [Google Scholar]
  36. Batrićević, A.; Batanjski, V. Zaštita Životinja u Srbiji—Kaznenopravni i Ekološki Aspekti; Institut za Kriminološka i Sociološka Istraživanja: Beograd, Srbija, 2014; p. 231. [Google Scholar]
  37. Ocokoljić, M.; Petrov, D.; Vujičić, D.; Galečić, N. Effects of Climate Parameters on Blackthorn in Agroforestry Ecotones as Green road Infrastructure Elements. In Proceedings of the XIV International Scientific Agriculture Symposium AGROSYM, Jahorina, Bosnia and Hercegovina, 5–8 October 2023; Kovacevic, D., Ed.; Faculty of Agriculture: East Sarajevo, Bosnia and Hercegovina, 2023; pp. 853–858. [Google Scholar]
  38. Csontos, P.; Tamás, J.; Kalapos, T. Correlation between age basal diameter of Fraxinus ornus L. in three ecologically contrasting habitats. Acta Bot. Hung. 2001, 43, 127–136. [Google Scholar] [CrossRef]
  39. Bijelić, S.; Gološin, B.; Cerović, S.; Bogdanović, B. Pomological Characteristics of Cornelian Cherry (Cornus mas L.) Selections in Serbia and the Possibility of Growing in Intensive Organic Orchards. Acta Univ. Agric. Silvic. Mendel. Brun. 2015, 63, 1101–1104. [Google Scholar] [CrossRef]
  40. Jaćimović, V.; Božović, D.J.; Veličković, N.; Šebek, G. Biological-pomological characteristics of dogwood genotypes (Cornus mas L.) from the area of Gornji Polimlje. Jugosl. Voćarstvo 2000, 34, 99–105. (In Serbian) [Google Scholar]
  41. Dörken, V. Pflanzenporträt: Cornus mas—Kornelkirsche (Cornaceae). Jahrb. Boch. Bot. Vereins 2010, 1, 213–215. [Google Scholar]
  42. Cevriye, M. Studies on the Structure of Flowers and Inflorescences of Cornelian Cherry (Cornus mas L.). Not. Bot. Horti Agrobot. 2012, 40, 53–57. [Google Scholar]
  43. Klimenko, S. The Cornelian cherry (Cornus mas L.)—Collection, preservation and utilization of genetic resources. J. Fruit. Ornam. Plant Res. 2004, 12, 93–98. [Google Scholar]
  44. Vujanić-Varga, D. Pomology; Univerzitet u Novom Sadu—Poljoprivredni fakultet: Novi Sad, Serbia, 1987. (In Serbian) [Google Scholar]
  45. Ocokoljić, M.; Petrov, D.; Galečić, N.; Skočajić, D.; Košanin, O.; Simović, I. Phenological Flowering Patterns of Woody Plants in the Function of Landscape Design: Case Study Belgrade. Land 2023, 12, 706. [Google Scholar] [CrossRef]
  46. Čukanović, J.; Ljubojević, M.; Djordjević, S.; Narandžić, T.; Petrov, D.; Ocokoljić, M. The Impact of Climate Variability on the Blooming of Fraxinus ornus ‘Globosa’ as a Component of Novi Sad’s (Serbia) Green Infrastructure. Sustainability 2024, 16, 8404. [Google Scholar] [CrossRef]
  47. Blonsky, M.; Nagarajan, A.; Ghosh, S.; McKenna, K.; Veda, S.; Kroposki, B. Potential Impacts of Transportation and Building Electrification on the Grid: A Review of Electrification Projections and Their Effects on Grid Infrastructure, Operation, and Planning. Curr. Sustain. Energy Rep. 2019, 6, 169–176. [Google Scholar] [CrossRef]
  48. Chrzova, B.; Grabovac, A.; Hala, M.; Lalic, J.; Bashota, V.; Bjeloš, M.; Latal, S.; Naunov, M.; Semani’c, H.; Wilson, A.; et al. Western Balkans at the Crossroads: Assessing Influences of Non-Western External Actors; Prague Security Studies Institute: Prague, Czech Republic, 2019. [Google Scholar]
  49. Karaduman, H.A.; Karaman-Akgul, A.; Çağlar, M.; Akbaş, H.E. The relationship between logistics performance and carbon emissions: An empirical investigation on Balkan countries. Int. J. Clim. Change Strateg. Manag. 2020, 12, 449–461. [Google Scholar] [CrossRef]
  50. European Commission. Sustainable and Smart Mobility Strategy-Putting European Transport on Track for the Future; European Commission: Brussels, Belgium, 2020.
  51. Petrov, D.; Ocokoljić, M.; Galečić, N.; Skočajić, D.; Simović, I. Adaptability of Prunus cerasifera Ehrh. to Climate Changes in Multifunctional Landscape. Atmosphere 2024, 15, 335. [Google Scholar] [CrossRef]
  52. John, C.; Kerby, J.T.; Stephenson, T.R.; Post, E. Fine-scale landscape phenology revealed through time-lapse imagery: Implications for conservation and management of an endangered migratory herbivore. Remote. Sens. Ecol. Conserv. 2023, 9, 628–640. [Google Scholar] [CrossRef]
  53. Wilczek, A.M.; Burghardt, L.T.; Cobb, A.R.; Cooper, M.D.; Welch, S.M.; Schmitt, J. Genetic and physiological bases for phenological responses to current and predicted climates. Philos. Trans. R. Soc. Lond. B Biol. Sc. 2010, 365, 3129–3147. [Google Scholar] [CrossRef]
  54. Saxena, K.G.; Rao, K.S. Climate Change and Vegetation Phenology. In Reproductive Ecology of Flowering Plants: Patterns and Processes; Tandon, R., Shivanna, K., Koul, M., Eds.; Springer: Singapore, 2020; pp. 25–39. [Google Scholar] [CrossRef]
  55. Miller-Rushing, A.J.; Katsuki, T.; Primack, R.B.; Ishii, Y.; Lee, S.D.; Higuchi, H. Impact of global warming on a group of related species and their hybrids: Cherry tree (Rosaceae) flowering at Mt. Takao, Japan. Am. J. Bot. 2007, 94, 1470–1478. [Google Scholar] [CrossRef]
  56. Inouye, D.W. Effects of climate change on phenology, frost damage, and floral abundance of montane wild flowers. Ecology 2008, 89, 353–362. [Google Scholar] [CrossRef]
  57. Cushman, S.A. Generalizing Boltzmann configurational entropy to surfaces, point patterns and landscape mosaics. Entropy 2021, 23, 1616. [Google Scholar] [CrossRef]
  58. Burroughs, W.J. Gardening and climate change. Weather 2002, 5, 151–157. [Google Scholar] [CrossRef]
  59. Forrest, J.; Thomson, J.D. Pollinator experience, neophobia and the evolution of flowering time. Proc. R. Soc. B 2009, 276, 935–943. [Google Scholar] [CrossRef] [PubMed]
  60. Tarun, K.; Bhanu, V. GDD (Growing Degree Days): Phenology Forecasting for Crops. Just Agric. 2022, 2, 2582–8223. [Google Scholar]
  61. Feng, C.M.; Xiang, Q.Y.; Franks, R.G. Phylogeny-based developmental analyses illuminate evolution of inflorescence architectures in dogwoods (Cornus sl., Cornaceae). New Phytol. 2011, 191, 850–869. [Google Scholar] [CrossRef]
  62. Silva, I.A.; Da Silva, D.M.; De Carvalho, G.H.; Batalha, M.A. Reproductive phenology of Brazilian savannas and riparian forests: Environmental and phylogenetic issues. Ann. For. Sci. 2011, 68, 1207–1215. [Google Scholar] [CrossRef]
  63. CaraDonna, P.J.; Inouye, D.W. Phenological responses to climate change do not exhibit phylogenetic signal in a subalpine plant community. Ecology 2015, 96, 355–361. [Google Scholar] [CrossRef]
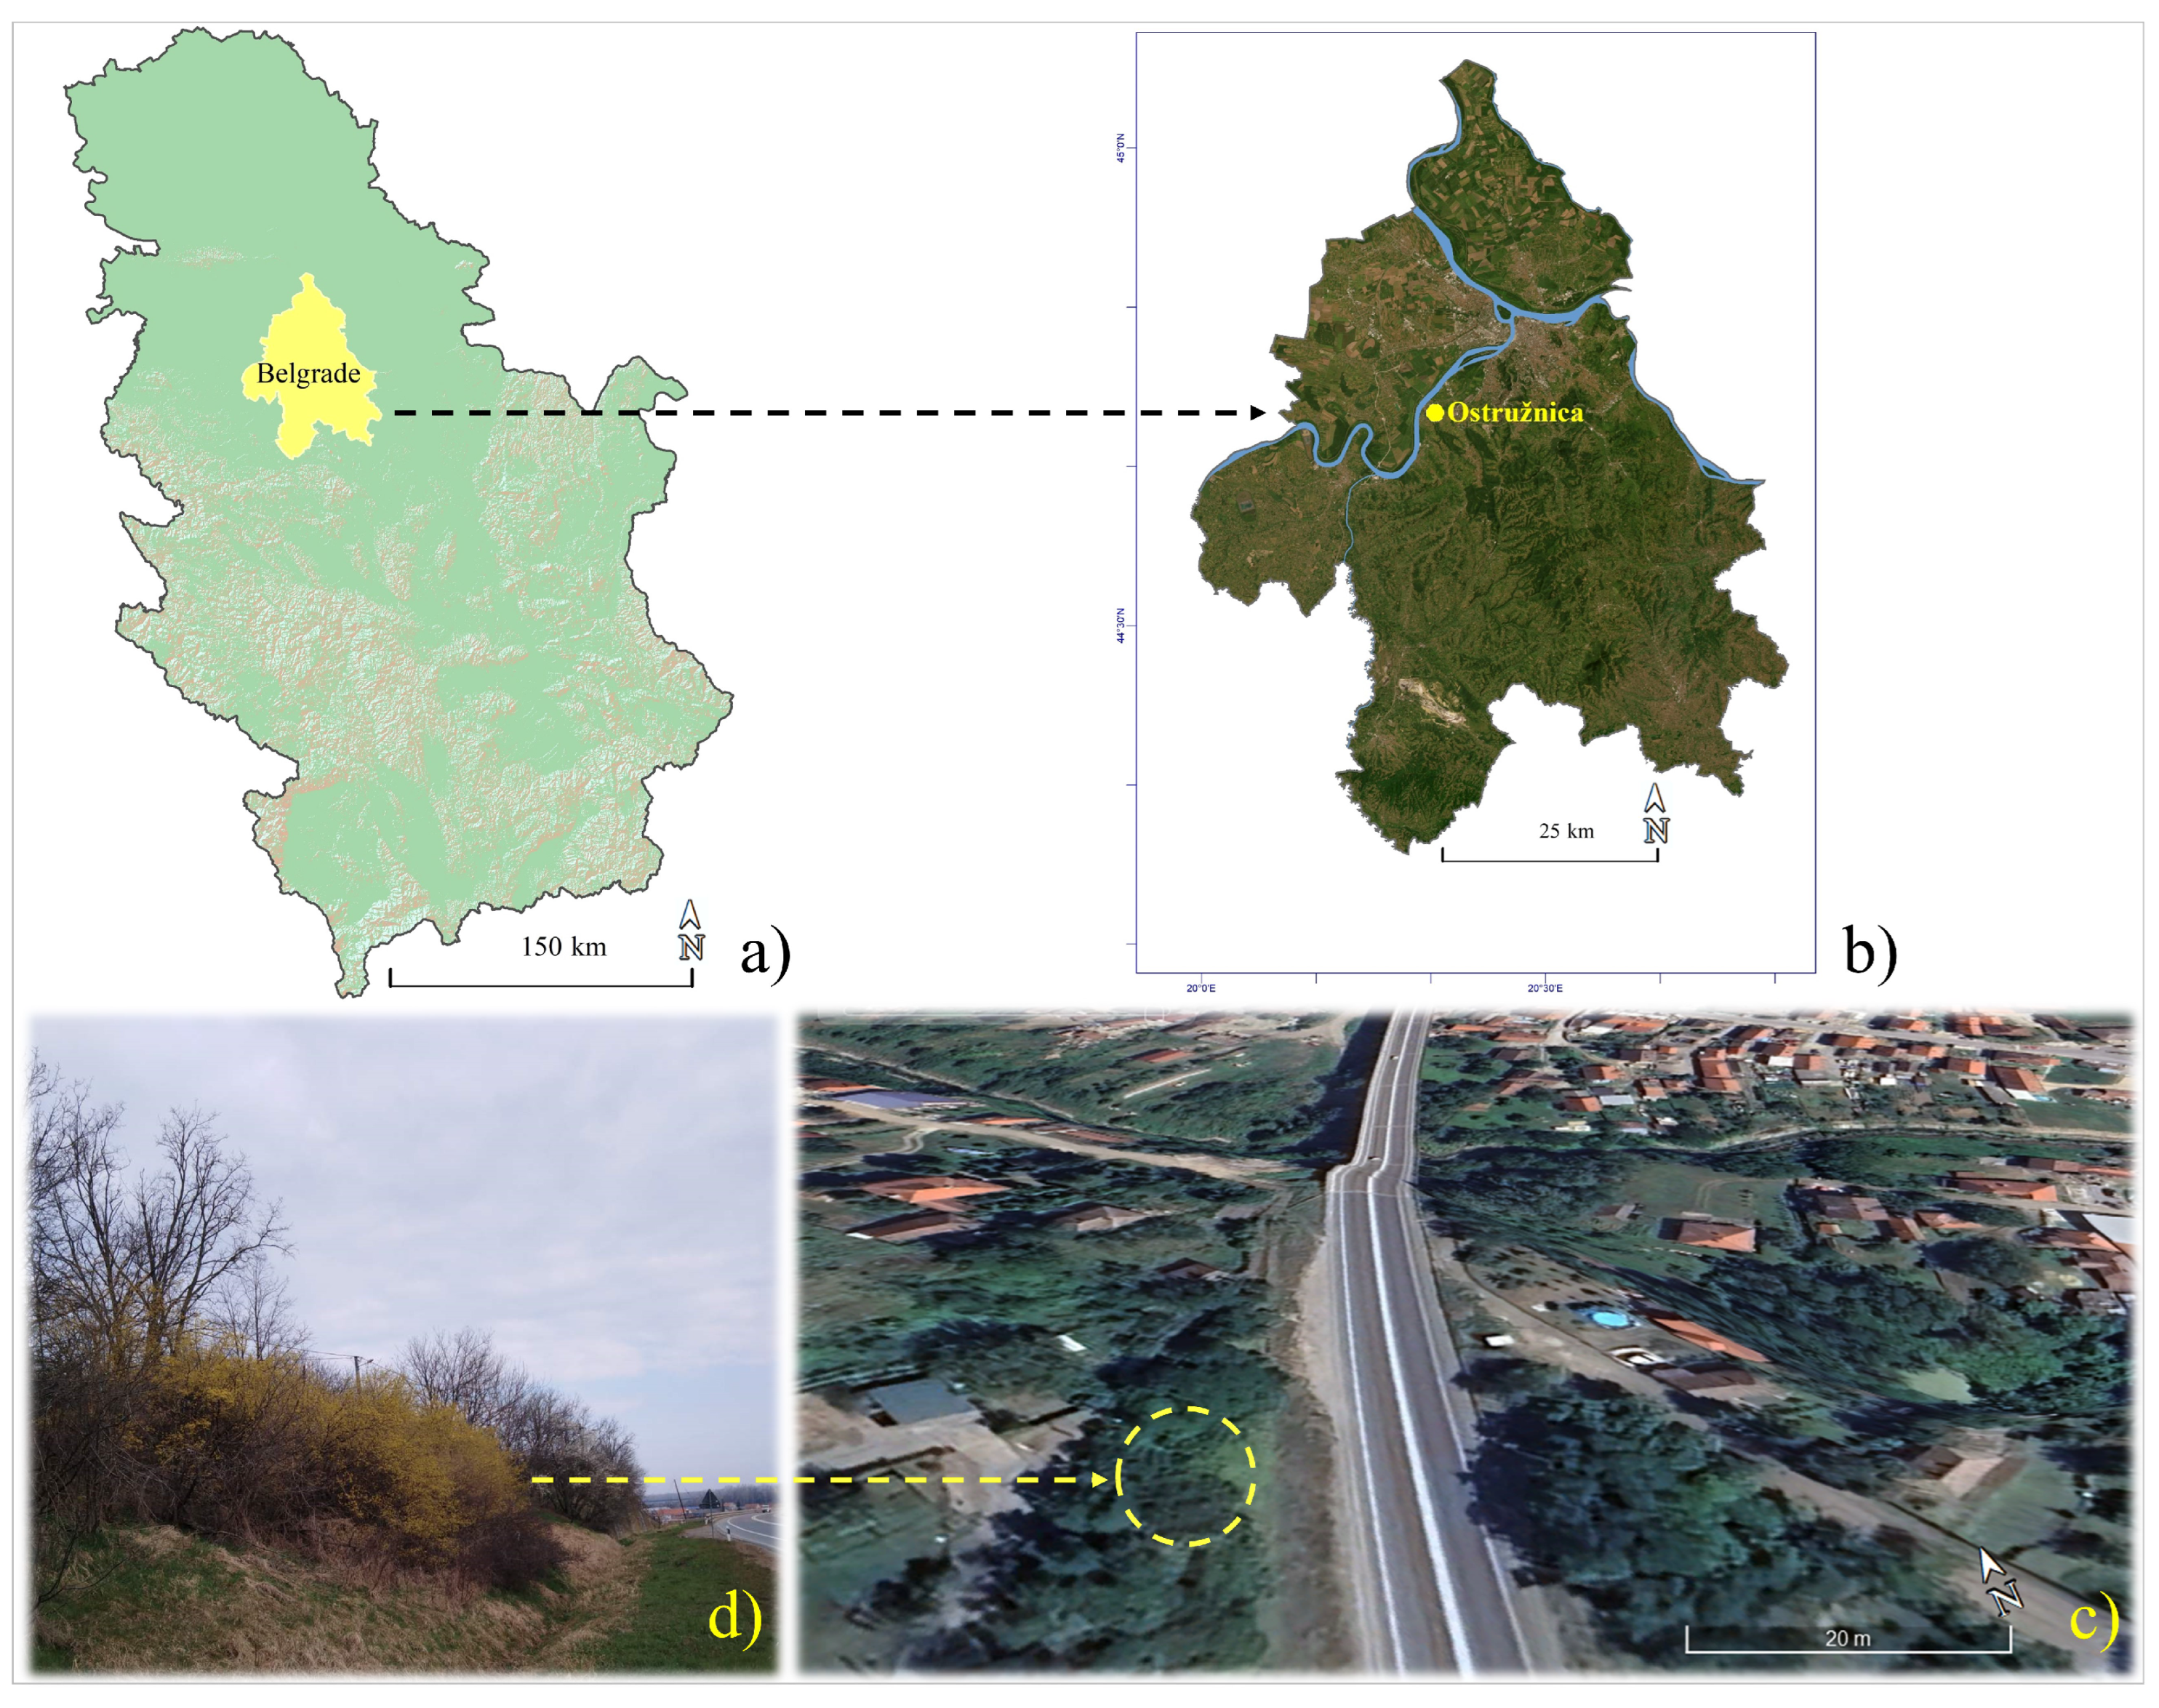
Figure 1. Study area: (a) Location map of the City of Belgrade districts within Serbia; (b) research area on a georeferenced topographic map of Belgrade; (c) position of the Cornelian cherry population within the roadside green infrastructure; and (d) Cornelian cherry at full flowering stage (65 BBCH).
Sustainability 17 05334 g001
Figure 2. (a) Day of year (DOY) and (b) accumulated growing degree days (GDD, in °C) for the onset of flowering (60BBCH), full flowering (65BBCH), and end of flowering (69BBCH) of Cornelian cherry during the study years.
Sustainability 17 05334 g002
Figure 3. Graphical representation of Sen’s slope and p-value (statistically significant trends p < 0.05) for the elements of the blooming physiological pattern of Cornelian cherry during the 2007–2025 period (a), and visual aspect of Cornus mas in the 69BBCH phase (b). Values in red are slopes for statistically significant trends (p < 0.05).
Sustainability 17 05334 g003
Figure 4. Mean monthly air temperatures and precipitation sums for February (a), March (b), and April (c), and the corresponding terciles for the reference period 1991–2020 (based on RHMZ data).
Sustainability 17 05334 g004
Figure 5. Phenological patterns of C. mas flowering, for 19 consecutive years of research (2007–2025), in the roadside green infrastructure of the southwestern suburban zone of Belgrade. The vertical values represent the percentage of open flowers at the population level.
Sustainability 17 05334 g005
Figure 6. Photographs provide a specific picture of the landscape at a given moment. The dashed circle represents the Cornelian cherry population.
Sustainability 17 05334 g006
Figure 7. Seasonality of the flowering phenophases of C. mas and P. cerasifera, in the period 2007–2025, according to the Watson–Williams test: (a) flowering initiation (60BBCH), (b) full flowering (65BBCH), (c) end of flowering (69BBCH), and seasonal landscape phenology of roadside green infrastructure: (d) at the end of February, (e) at the beginning of March, and (f) in mid-March. In Figures (ac), the flowering phenophases of C. mas are marked in yellow, and those of P. cerasifera in green.
Sustainability 17 05334 g007
Table 1. Results of the Mann–Kendall and Sen’s slope tests for DOY and GDD values related to the flowering phenological pattern of Cornelian cherry during the 2007–2025 period, for: onset of flowering (60BBCH), full flowering (65BBCH), and end of flowering (69BBCH).
ParameterKendall’s Taup-ValueSen’s Slope
60BBCH DOY−0.0660.725−0.125
65BBCH DOY−0.1430.419−0.500
69BBCH DOY0.0001.0000.000
60BBCH GDD0.2050.2341.600
65BBCH GDD0.0990.5760.862
69BBCH GDD0.3920.021 *4.029
* Bold values are slopes for statistically significant trends (p < 0.05).
Table 2. Descriptive statistics for the investigated phenological parameters of Cornelian cherry during the 2007–2025 period, based on own phenomonitoring data and RHMZ data.
Phenological Observations DOYGDD
Parameters60BBCH65BBCH69BBCH60BBCH65BBCH69BBCH
N191919191919
Min39466430.150.2120.1
Max7881100143.6158.4282.1
Sum1009112915781517.61838.13791
Mean53.1052659.4210583.0526379.8736896.74211199.5263
Std. error2.3581322.2338652.3464226.4904026.5706219.174924
Variance105.65594.81287104.6082800.3809820.28811599.405
Stand. dev10.278869.7371910.2278128.29128.6406739.99257
Median5459867698.7201.7
25 prcntil41537463.975.1162.9
75 prcntil606489100.5110.8227.4
Skewness0.45529880.480130−0.389770.42675440.56038380.0544626
Kurtosis0.3206357−0.10568−0.664380.36216260.0771781−0.096638
Geom. mean52.1777958.6826282.4310274.8492992.78957195.5902
Coeff. var19.3556316.3867712.3148635.4196829.6051820.04376
Table 3. Descriptive statistics: Number of days from the start to full bloom (No. of days 60-65), average air temperature during the period from start to full bloom (Average T in 60BBCH-65BBCH DOY), number of days from full bloom to end of bloom (No. of days 65BBCH-69BBCH), average air temperature during the period from full bloom to end of bloom (Average T in 65BBCH-69BBCH DOY), number of days from start to end of bloom (No. of days 60BBCH-69BBCH), and average air temperature during the period from start to end of bloom (Average T in 60BBCH-69BBCH DOY) for the flowering pattern elements of Cornelian cherry in the period 2007–2025, based on own research and RHMZ data.
VariableMinMaxMeanStd. Dev.
No. of days 60BBCH-65BBCH3.017.06.33.8
Average T in 60BBCH-65BBCH DOY−2.015.36.54.3
No. of days 65BBCH-69BBCH13.040.023.68.7
Average T in 65BBCH-69BBCH DOY5.311.98.42.2
No. of days 60BBCH-69BBCH16.050.029.910.8
Average T in 60BBCH-69BBCH DOY4.912.57.92.1
All the observations without missing.
Table 4. Results of the Mann–Kendall and Sen’s slope tests for No. of days 60-65, Average T in 60BBCH-65BBCH DOY, No. of days 65BBCH-69BBCH, Average T in 65BBCH-69BBCH DOY, No. of days 60BBCH-69BBCH, and Average T in 60BBCH-69BBCH for the flowering pattern elements of Cornelian cherry during the period 2007-2025.
ParameterKendall’s Taup-ValueSen’s Slope
No. of days 60BBCH-65BBCH−0.2180.226−0.111
Average T in 60BBCH-65BBCH DOY−0.2280.184−0.159
No. of days 65BBCH-69BBCH0.2280.1930.364
Average T in 65BBCH-69BBCH DOY0.0990.5760.083
No. of days 60BBCH-69BBCH0.1740.3250.167
Average T in 60BBCH-69BBCH DOY0.0290.8890.033
Table 5. Climatic variables for the reference period (1991–2020) and the research period (2007–2025), during which 19 consecutive years of Cornelian cherry flowering occurred, based on data from MMS Surčin.
Mean Air Temperatures (°C)
Months
Period
123456789101112 x ¯
Tmean 1991/20201.03.07.512.917.621.423.323.218.012.87.42.212.5
Tmean 2007/20242.04.58.313.417.822.324.324.218.913.38.13.413.4
Tmean 20254.02.410.413.8---------
Mean Maximum Air Temperatures (°C)
Tmax 1991/20204.57.412.918.423.226.929.029.324.118.511.95.517.6
Tmax 2007/20245.69.013.519.023.227.630.030.324.818.912.66.818.4
Tmax 20257.97.416.219.3---------
Mean Minimum Air Temperatures (°C)
Tmin 1991/2020−2.3−1.02.67.111.815.416.816.912.67.93.6−0.97.5
Tmin 2007/2024−1.40.43.37.412.216.317.817.613.38.44.30.38.3
Tmin 20250.1−1.55.18.2---------
Mean Monthly and Annual Relative Humidity (%)
Mean 1991/202085.078.068.864.966.266.463.162.568.874.679.985.372.0
Mean 2007/202482.674.465.961.365.464.358.458.264.972.078.483.069.1
Mean 202581.366.865.365.8---------
Total and Mean Precipitation Amounts (mm)
PeriodIIIIIIIVVVIVIIVIIIIXXXIXII
∑1991/202042.434.041.747.468.180.158.254.056.050.745.548.3626.4
∑2007/202446.037.246.240.583.176.451.644.053.947.950.849.7627.3
∑202516.48.664.351.5---------
Table 6. Average monthly air temperatures and corresponding percentiles and terciles and their deviations for the period February–April 2025, based on MMS Surčin data relative to the reference period 1991–2020.
Tmean (°C)Perc. Cat. *
1991–2020
Tmean (°C)
1991–2020
1991–2020
33.Perc.
1991–2020
50.Perc.
1991–2020
66.Perc.
Terciles **
Cat.
February
2.4N3.02.33.44.70
March
10.4VW7.56.77.48.41
April
13.8W12.912.212.813.51
* Extremely warm (EW), Very warm (VW), Warm (W), Normal (N), Very cold (VC), Extremely cold (EC). ** Warm (1), Normal (0), Cold (−1), kategorizacija RHMZ.
Table 7. Monthly precipitation sums and corresponding percentiles and terciles and their deviations for the period February–April 2025, in the study area, relative to the reference period 1991–2020.
Sum (mm)Perc. Cat. *Sum (mm) 1991–20201991–20201991–20201991–2020Terciles **
1991–202033.Perc.50.Perc.66.Perc.Cat.
February
8.6VD34.023.533.946.1−1
March
64.3W41.723.130.349.01
April
51.5N47.433.844.050.41
* Extremely wet (EW), Very wet (VW), Wet (W), Normal (N), Dry (D), Very dry (VD), Extremely dry (ED). ** Wet (1), Normal (0), Dry (−1), categorisation RHMZ.
Table 8. Results of circular statistical analysis and Rayleigh test for the phenological flowering pattern elements of C. mas, in the period 2007–2025, in the roadside green infrastructure of the suburban area of Belgrade.
Parameter60BBCH DOY65BBCH DOY69BBCH DOY
Sample size191919
Vector r0.98490.98640.985
Rayleigh R18.712518.741618.7148
Rayleigh Z18.429318.486718.4339
u4.4434.4434.443
p value<0.01<0.01<0.01
Mean dateLate FebruaryEarly MarchMid-March
Mean angle53.08459.401983.0708
Table 9. Circular statistical analysis of the flowering pattern elements of C. mas (1) and P. cerasifera (2), in the period 2007–2025, in the roadside green infrastructure of the suburban area of Belgrade.
Species(1)(2)(1)(2)(1)(2)
Parameter60BBCH DOY65BBCH DOY69BBCH DOY
Sample size191919191919
Mean angle53.08464.88159.401969.087983.070888.2384
Vector r0.98490.98240.98640.98280.9850.984
Variance of the mean angle0.03030.03520.02720.03450.030.0321
Standard error of mean angle9.967410.74719.449210.63549.927510.2578
Table 10. Results of the Watson–Williams test comparing the mean angles of different phenophases of C. mas and P. cerasifera and their circular correlations, in the period 2007–2025, in the roadside green infrastructure of the suburban area of Belgrade.
Parameter60BBCH DOY65BBCH DOY69BBCH DOY
Sample size191919
F11.5958.30192.3495
p value0.0020.00670.1304
Circular correlation
Raa (correlation coefficient)0.70870.84640.6677
p-value0.000700.0018
Disclaimer/Publisher’s Note: The statements, opinions and data contained in all publications are solely those of the individual author(s) and contributor(s) and not of MDPI and/or the editor(s). MDPI and/or the editor(s) disclaim responsibility for any injury to people or property resulting from any ideas, methods, instructions or products referred to in the content.