Abstract
While fintech offers new pathways for carbon emission reduction, its underlying mechanisms and regional disparities remain underexplored. Unlike prior studies, this study systematically examines the heterogeneous impact of fintech on carbon emissions by integrating geographic, regulatory, and developmental dimensions, while uncovering the counteracting “rebound effect” of technological innovation. Based on panel data from 286 prefecture-level cities in China (2010–2021), this study employs instrumental variable approaches and interaction effect models to examine the regional heterogeneity and underlying mechanisms of fintech’s carbon-emission-reduction effects. The results are as follows: (1) Fintech development demonstrates a statistically significant negative correlation with carbon emissions, confirming its emission-reduction potential; (2) The emission-reduction effects of fintech demonstrate substantial regional heterogeneity, with particularly pronounced impacts observed in eastern and western regions, smaller-sized cities, and areas with relatively lenient environmental regulations; (3) Fintech effectively curbs carbon emissions by optimizing industrial structure and improving energy efficiency. However, technological innovation exhibits a significant “rebound effect” that undermines fintech’s emission-reduction efficacy. This adverse impact is most evident during the nascent stage of fintech development and in non-resource-based cities. Policymakers should adopt region-specific strategies to align fintech with low-carbon industries while introducing carbon impact assessments for innovations to counteract rebound effects and maximize fintech’s emission-reduction potential.
1. Introduction
The global warming problem caused by greenhouse gas emissions has become a central focus of environmental governance [1]. According to the International Energy Agency’s 2022 report titled “CO2 Emissions in 2022”, while the growth rate of global CO2 emissions showed a significant decrease in 2022 compared to the exceptional surge of over 6% in 2021, overall emissions continue to rise. Urgent and decisive measures are imperative to accelerate the energy transition and steer the world toward achieving its energy and climate goals [2].
With rapid economic growth, China has been facing increasingly prominent environmental challenges, characterized by multiple issues related to pollution and resource consumption, posing significant obstacles to the sustainable and high-quality development of its economy and society [3]. The carbon peaking and carbon neutrality goals are urgently needed to address the outstanding problems of resource and environmental constraints and achieve sustainable development [4]. The proposal of the “carbon peaking and carbon neutrality” goals means that China will face even greater pressure to reduce emissions. The realization of the “dual-carbon” goal is a long-term process, which requires sustained and stable financial support [5]. During the process of decarbonization, the scale of funds required will keep rising as decarbonization progresses. The financial support provided by traditional financial models will be difficult to fully meet the growing financing needs once decarbonization reaches a certain stage. As an innovative manifestation of financial deepening, fintech is a technology-driven financial innovation relying on cutting-edge technologies such as big data, cloud computing, blockchain, and artificial intelligence, and it is a new financial model that integrates digital technologies. Compared with traditional finance, fintech relies on big data, cloud computing, and other digital technologies to provide services, overcoming the limitations of traditional finance, such as high transaction costs and credit discrimination, expanding the coverage of traditional finance, reducing the costs of risk identification, data processing, and operational processes, improving the availability and utilization of financial resources, promoting the rational allocation of resources, and supporting the financial needs of realizing the goals of “carbon peaking and carbon neutrality” to facilitate carbon emission reduction. In January 2022, the People’s Bank of China issued the “Financial Science and Technology Development Plan (2022–2025)”, emphasizing that financial science and technology should use digital technology to improve the scope and precision of financial services for the green industry and drive the green and low-carbon transformation of the economy.
In the field of academic research, scholars have long been committed to exploring the influencing factors of carbon emissions, mainly using decomposition techniques such as the Logarithmic Mean Divisia Index (LMDI), the STIRPAT model, and regression analysis. Early studies predominantly relied on the IPAT and Kaya models to establish relationships between carbon emissions and their determinants, attributing these factors to three main categories: population, economy, and technology [6,7]. With the progression of industrialization and urbanization, scholars have identified additional influencing factors, including population size [8], energy consumption [9,10], labor productivity, government intervention [11], technological change [12,13,14,15], digital economy [16], carbon tax policies [17,18], and environmental policies [19]. While carbon emissions are influenced by multiple factors, the magnitude and direction of these effects vary across regions. However, given significant regional disparities, the magnitude and direction of these factors’ impacts on carbon emissions vary considerably across different areas. Notably, existing studies have yet to reach a consensus regarding the key determinants and underlying mechanisms of carbon emissions, while empirical research at the city level remains relatively scarce.
In recent years, with the rapid advancement of technology and its profound integration into the financial sector, fintech has gained increasing recognition for its pivotal roles in supporting the real economy, facilitating the transformation and upgrading of financial institutions, promoting inclusive finance, and mitigating financial risks. At the same time, its impact on the environment has drawn extensive attention. To gain a comprehensive understanding of the mechanisms through which fintech influences carbon emissions, it is imperative to first clarify the theoretical mechanisms underlying the relationship between traditional financial development and carbon emissions. The relationship between financial development and carbon emissions has been a focal point in socio-economic research, where scholars have conducted extensive investigations that have crystallized into two predominant schools of thought. Some scholars maintain that financial development exacerbates carbon emissions by increasing energy-intensive consumption through expanded consumer credit [20] and scaling up production, leading to higher energy consumption [21]. In China, where credit-dominated financial systems prevail, financial development may hinder technological progress [22] and elevate total carbon emissions [23]. Others contend that financial development reduces carbon emissions through mechanisms such as technological advancement [24,25,26], industrial structure upgrading [27], financial agglomeration [28], improved financial resource allocation [29], and enhanced financial efficiency [30]. These controversial conclusions provide an important theoretical foundation for the study of the environmental effects of fintech.
It is worth noting that the rise of fintech has opened up a new field of environmental finance research. As a product of the deep integration of digital technology and financial services, fintech not only inherits the environmental impact mechanism of traditional finance but also demonstrates unique emission-reduction paths through technological innovation. Existing research suggests that fintech can drive the issuance of green credit [31], promote green development [32], and significantly mitigate pollution [33]. For instance, fintech has been shown to reduce haze pollution by driving consumption upgrading, industrial restructuring, and financial innovation [34]. However, its impact on carbon emission reduction exhibits regional heterogeneity [35,36]. While fintech can lower carbon emission intensity within specific regions, its effects on neighboring areas remain negligible [37].
In this context, we aim to address several critical and timely research questions: To what extent does fintech play a role in reducing carbon emissions? Does regional heterogeneity exist in the role of fintech in carbon emission reduction? What mechanisms underlie the impact of fintech on carbon emissions? To answer these questions, this paper employs panel data comprising 286 prefecture-level and above cities in China to empirically investigate the impact and mechanisms of fintech on carbon emissions.
Our paper makes three significant contributions to the literature on fintech and carbon emissions. First, it reveals the complexity of the rebound effect of technological innovation in the carbon-reduction efficacy of fintech. This effect primarily manifests in the early stages of fintech development and in non-resource-based cities. Specifically, it is driven by the combined effects of economic expansion, factor substitution, and consumer behavior, which collectively give rise to a significant rebound effect of technological innovation, thereby weakening the expected carbon-reduction efficacy of fintech. Second, the study finds that industrial structure optimization and energy efficiency improvement are the main mechanisms of fintech’s carbon-emission-reduction effect. Notably, there is significant industry heterogeneity in the path of industrial structure optimization. The primary industry demonstrates stronger structural dividends than the tertiary industry during the process of fintech—driven carbon emission reduction. This insight deepens our understanding of the diverse impacts of fintech across different industries and emphasizes the importance of formulating targeted policies. Third, we establish a tripartite heterogeneity framework, documenting how fintech’s carbon-reduction efficacy varies by region, regulatory environment, and development stage, providing a scientific basis for formulating differentiated environmental governance policies. These insights provide targeted recommendations for designing region-specific environmental governance policies.
The remainder of this paper is organized as follows. We put forward the theoretical analysis and research hypotheses in Section 2. In Section 3, we present the research design. Empirical results are provided in Section 4. Finally, in Section 5, we present the conclusions, discussion, and policy implications.
2. Theoretical Analysis and Research Hypotheses
In the pursuit of China’s “double carbon” (carbon peaking and carbon neutrality) objectives, fintech, through the profound integration of digital technologies and financial services, has emerged as a core driver of low-carbon economic development. It influences carbon emissions through the control of incremental emissions and the reduction in existing emission stocks.
From the perspective of incremental emission control, fintech exerts comprehensive source governance across three critical stages—investment, production, and consumption—through intelligent digital solutions to effectively mitigate new carbon emissions.
At the investment stage, the externality theory in environmental economics posits that the production activities of high-carbon enterprises generate negative externalities for society (such as environmental pollution), but the market itself cannot internalize these costs through price mechanisms, leading to market failures characterized by “overinvestment in high-carbon projects and underinvestment in low-carbon projects”. Fintech intervenes in investment decisions through green credit scoring models, incorporating enterprises’ environmental performance (such as carbon emissions and environmental compliance) into credit evaluation systems. This establishes “hard constraints” on high-carbon projects and “soft incentives” for low-carbon projects, thereby correcting market pricing deviations for environmental costs and achieving optimal allocation of resources to low-carbon sectors. Meanwhile, the increasing share of strategic emerging industries, such as new energy, the digital economy, and high-end manufacturing, in the national economy has propelled the transformation of the economic structure toward “low energy consumption and high added value”.
At the production stage, fintech reconstructs the industrial emission management system through digital technologies: real-time energy consumption monitoring systems based on the Internet of Things (IoT) optimize production processes by integrating AI algorithms, while supply chain carbon ledgers built with blockchain technology enable end-to-end emission traceability. These technological approaches effectively address the challenges of “regulatory lag and data silos” in traditional environmental governance, driving the manufacturing industry toward precise emission reduction transformation.
At the consumption stage, drawing on the nudge theory in behavioral economics, fintech triggers consumers’ “behavioral adaptation” to reshape their household carbon footprints. For instance, the implementation of personal carbon account systems has demonstrated significant global carbon-emission-reduction potential, thereby enhancing green economic efficiency [38]. Notably, Ant Group’s “Ant Forest” platform, with over 700 million users, can significantly enhance consumers’ low-carbon consumption behaviors [39].
From the perspective of reducing existing carbon emissions, based on Coase’s theories of property rights and transaction costs, fintech activates the market value of carbon assets through three interrelated mechanisms. First, in enhancing carbon market liquidity, blockchain-based trading platforms have successfully transformed carbon emission rights from regulatory compliance tools (i.e., “cost items”) into tradable financial assets (“asset items”), reducing transaction costs and optimizing market efficiency. Second, by bridging energy production and consumption, innovative financial instruments close the financing gap for renewable energy, aligning with the “energy ladder” hypothesis that financial intermediaries can alleviate capital constraints on clean energy investment [40]. A case in point is Industrial Bank’s "green certificate-linked, which focuses on the financing needs of renewable energy projects, such as photovoltaic power plants. It aims to address the funding gaps of clean energy enterprises through financial product innovation, while exploring deep integration paths between carbon assets and financial instruments. Third, through big data monitoring of high-carbon enterprises’ risks, backward production capacity is forced out of the market—for example, banks use satellite remote sensing and logistics data to track the production dynamics of high-carbon enterprises, initiate “green stress tests” for persistently non-compliant firms, and automatically trigger loan recovery mechanisms via AI models.
From a spatial dimension, the new economic geography theory suggests that differences in regional resource endowments and industrial structures lead to the differentiation of fintech’s emission-reduction mechanisms. At the institutional level, environmental regulation theory reveals significant variations in the synergistic effects between fintech and policy systems under different regulatory intensities. Meanwhile, the technology innovation theory explains the phased impact of fintech development levels on its emission-reduction functions. These theoretical perspectives collectively demonstrate that fintech’s carbon-reduction effects are not homogeneous or uniform but are deeply embedded in the specific socioeconomic and technological systems of different regions, presenting complex differentiated characteristics. Therefore, the impact of fintech on carbon emission reduction exhibits significant heterogeneous characteristics, with its effects demonstrating systematic variations across regional conditions and development stages.
Based on the above analysis, the following hypothesis is proposed:
Hypothesis 1:
Fintech can reduce carbon emissions and generate a carbon-emission-reduction effect. However, these effects exhibit notable regional heterogeneity across cities with varying geographical conditions, environmental governance intensity, and fintech development levels.
The traditional extensive development model, characterized by high energy consumption, pollution, and emissions, is facing significant challenges. Exploring a low-carbon and environmentally friendly path that neither compromises environmental integrity nor excessively exploits energy resources has become a critical factor for achieving high-quality economic development in China. Industrial structure upgrading is an indispensable part of the transformation of the economic development model, and the upgrading of China’s industrial structure requires long-term and stable financial support.
Commercial banks provide preferential credit to environmental protection enterprises, restrict loans to high-energy-consumption enterprises, and even impose punitive interest rates on high-energy-consumption and high-pollution enterprises. This creates a coercive mechanism for the secondary industry, which is characterized by high energy consumption, high emissions, and high pollution, and promotes its transformation toward low pollution, low energy consumption, and high efficiency. As a result, industrial structure upgrading is achieved, and environmental pollution pressure is reduced. At the same time, with the support of blockchain, big data, and other technologies, fintech not only enables the precise allocation of green credit funds but also tracks their flow in real time. This promotes the development of green finance and drives industrial structure. According to the “Structural Dividend Hypothesis”, industrial structure upgrading can spontaneously enhance resource utilization efficiency, thereby inhibiting carbon emissions and optimizing environmental quality.
Most carbon emissions originate from energy consumption, and the amount of energy consumed directly determines the quantity of carbon emissions released. With the emergence of fintech, its advanced information digitization technologies can reduce information barriers, addressing financing challenges for enterprises in technological upgrading and green industrial transformation. This not only facilitates innovation and improvement in production technologies but also further reduces high-carbon energy consumption, thereby achieving the goal of carbon emission reduction. Additionally, fintech can leverage its information technology advantages to rationally allocate financial resources, redirecting funds originally invested in high-pollution and high-energy-consuming projects into clean and low-carbon initiatives. This process improves energy efficiency, thereby lowering carbon emissions and driving the development of a low-carbon economy.
In view of this, the following hypothesis is proposed:
Hypothesis 2:
Fintech can strengthen the inhibitory effect on carbon emissions through the industrial structure optimization and energy efficiency improvement.
Technological innovation plays a pivotal role in achieving energy conservation and emission-reduction goals; however, innovation projects require substantial investments, lengthy cycles, and significant adjustment costs. Therefore, the seamless advancement of innovative endeavors relies on long-term and stable financial support. Fintech can alleviate corporate financing constraints by leveraging advanced technologies, such as big data analytics, blockchain, artificial intelligence, and other cutting-edge tools. Simultaneously, technological innovation introduces innovative products that can substitute traditional high-energy input factors, thereby reducing resource wastage and curtailing carbon emissions.
However, while technological advancements enhance energy efficiency and reduce energy intensity, they may also lead to a surge in energy consumption and carbon emissions by stimulating economic growth and altering business practices and individual behaviors, thereby diminishing the anticipated impact of energy conservation and emission reduction. Several factors contribute to this phenomenon. First, although technological advancements enhance energy efficiency, resulting in reduced energy consumption per unit of output, they may also stimulate economic growth and subsequently increase energy demand. Second, technological advancement can generate a factor substitution effect. While improving energy efficiency to promote economic growth, it simultaneously creates new energy demands. Finally, technological progress alters people’s lifestyles by providing more convenient transportation options and a greater abundance of electronic products, potentially increasing both energy consumption and carbon emissions.
In summary, the impact of technological innovation on carbon emissions is bidirectional. To sum up, the impact of technological innovation on carbon emissions is two-sided; therefore, this paper proposes two contrasting hypotheses:
Hypothesis 3a:
Fintech can exert an influence on carbon emissions through technological innovation.
Hypothesis 3b:
Technological innovation poses obstacles to the carbon-emission-reduction process of fintech.
3. Data and Methodology
3.1. Sample and Data
We obtain the panel data of 286 prefecture-level cities in China from 2010 to 2021. The data on energy consumption and regional GNP involved in carbon emission intensity are obtained from China Statistical Yearbook and China Urban Construction Statistical Yearbook; the data on fintech are obtained from web text crawlers; and all other variables are obtained from China Urban Statistical Yearbook, the work reports of various governments, and the Crdns database. Some missing data are supplemented by the average growth rate method.
3.2. Variable and Sample Description
3.2.1. Dependent Variable
The dependent variable in our research is carbon emission intensity (CO2GDP). Regional carbon emissions are quantified by the ratio of total carbon emissions from cities at all levels to regional GDP, referring to the method of measuring carbon emissions proposed by Wu [41]. The lower the carbon emission intensity is, the less carbon emissions are generated by creating a unit of GDP. The kernel density plot in Figure 1 illustrates the carbon emission intensity of China for the years 2010, 2016, and 2021.
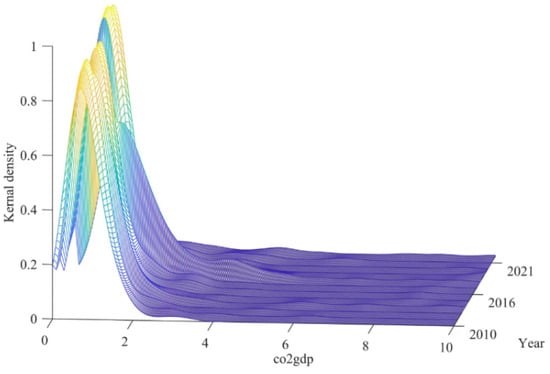
Figure 1.
Nuclear density map of carbon emission intensity.
The kernel density plot in Figure 1 illustrates a gradual rightward shift in the peak position of carbon emission intensity from 2010 to 2021, indicating that carbon emission levels have consistently increased over the past 12 years and that China’s environmental problems are becoming increasingly severe. From the perspective of the extension direction of the kernel density curve, the curve gradually extends to the right over time, suggesting the emergence of more regions with extremely high carbon emission intensity. Moreover, the presence of a secondary peak in the distribution indicates a pronounced polarization trend, highlighting substantial regional disparities in carbon emission intensity.
3.2.2. Independent Variable
The core explanatory variable in this paper is the development level of fintech (Fintech). The fintech development level is quantified following the methodological framework established by Li Chuntao [42]. Specifically, the collected data undergo a log transformation after applying a unit increment (log(x + 1)), which serves to normalize the distribution and mitigate potential scaling issues in the data.
By comparing Figure 1 and Figure 2, it is observed that from 2010 to 2021, the kernel density graphs of carbon emission intensity and the development level of fintech exhibit similar overall characteristics in terms of ductility and rightward shift of the peak, which preliminarily suggests a potential relationship between fintech and carbon emission levels.
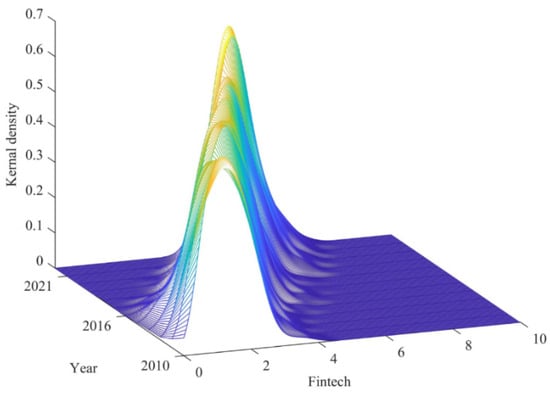
Figure 2.
Nuclear density map of fintech development level.
3.2.3. Control Variables
Many factors affect carbon emission intensity. The main control variables selected in our work are as follows: (1) Level of economic development (lnpgdp) using the logarithm of real GDP per capita. To test for an inverted U-shaped relationship between economic growth and carbon emissions, the quadratic term of this variable is also included; (2) Infrastructure construction level (const), measured by the ratio of urban road area to resident population; (3) Population density (pep) is represented by the ratio of the registered population to the administrative area of each city; (4) For government intervention (gov), we use the ratio of local general fiscal expenditure to GDP; (5) For urbanization (urban), we use the ratio of urban population to total population (both based on resident population).
3.2.4. Mechanism Variables
(1) Industrial structure upgrading (sec). The industrial structure change index is used to measure the degree of deviation between employment share and industrial share. Currently, labor mobility in China faces multiple constraints, such as excessive administrative interference and uneven market operation. The disparity between employment share and industrial share primarily results from changes in the industrial structure. Therefore, the industrial structure change index can, to some extent, reflect alterations in the industrial structure. In this study, the industrial structure change index is employed to quantify the upgrading of the industrial structure, following the methodology proposed by Gao [43]. Based on the research conducted by Nassar and Ando [44], the Euclidean distance between industry share and employment share can be mathematically formulated as follows:
where represents the distance between the employment share of industry and the industrial share, denotes the industrial added value of industry , indicates the number of employees in industry , and is the distance between the employment share of all industries and the industrial share, which serves as the index of change in industrial structure.
(2) Technological innovation (lnpatent), measured by the total number of inventions, utility models, and designs filed in each region during the current year.
(3) Energy consumption (pegy): Following the approach of Wu [41], total energy consumption is constructed based on the energy consumption from natural gas, liquefied petroleum gas, electricity, and urban heating. Furthermore, the energy consumption per unit of gross domestic product (GDP) is adopted to depict the level of energy consumption.
The descriptive statistical results of the variables used in this study are presented in Table 1.

Table 1.
Definitions and descriptive statistics of variables.
3.3. Model Specification
We construct the following model to further study the impact of fintech on regional carbon emissions in prefecture-level cities in China:
where refers to the regional carbon emission intensity; denotes the regional financial technology development level, control refers to other control variables; and indicate different cities and different years, respectively; captures the individual effect; captures the time effect; and is the random error term.
Building upon the theoretical framework and hypotheses established earlier and following the methodology of Jiang (2018) [45], this study incorporates interaction terms between the explanatory variable (fintech) and mechanism variables into Model 1 to empirically examine the underlying transmission channels. The extended econometric specification is formulated as follows:
where CO2 represents regional carbon emission intensity; denotes the development level of regional fintech; indicates the level of technological innovation; measures the optimization and upgrading of the industrial structure; and captures the level of energy consumption. Their respective interaction terms with are used to examine whether they play a mediating role in the carbon-reduction process of fintech. Control refers to other control variables, while and represent different cities and different years, respectively. captures individual effects, captures time effects, and is the random error term. The interaction coefficient between the explanatory variable and the mechanism variable reflects the correlation between the two.
4. Empirical Results
4.1. Main Results
4.1.1. Baseline Results
Table 2 reports the baseline regression results of the double fixed-effect model for fintech development and carbon emissions. In the first column, only the Fintech index is included to preliminarily examine the correlation between fintech and carbon emissions. According to the regression results, the coefficient of fintech is negative and statistically significant at the 1% level. In the second column, real GDP per capita and its square term are added to investigate the relationship between economic development and environmental quality. The regression results indicate that the primary coefficient of real GDP per capita is significantly negative, while the square term coefficient is significantly positive, both at the 1% significance level. This suggests a U-shaped relationship between economic development and carbon emissions, contrary to the inverted U-shaped relationship proposed by Lin and Jiang [46] and Abdouli and Hammami [47]. In other words, during the early stages of economic development, carbon emissions are suppressed; however, as the economy grows and reaches an inflection point, further economic development leads to an increase in carbon emissions. In the third column, additional control variables, such as infrastructure construction level, population density, government intervention, and urbanization, are included.
Table 2.
Baseline regression results.
The regression results indicate that both the level of infrastructure construction and population density have a significant impact on carbon emissions. Specifically, the level of infrastructure construction has a statistically significant positive effect at the 1% significance level, suggesting that it contributes to an increase in carbon emissions. This implies that higher levels of infrastructure are associated with higher carbon emissions. Population density also exhibits a positive effect at the 5% significance level, indicating that denser populations lead to increased urbanization and, consequently, higher carbon emissions. However, the influence of government intervention and urbanization on carbon emissions is not statistically significant.
4.1.2. Endogeneity Test
The regression results of this study may still suffer from potential endogeneity issues. While we have controlled for relevant variables to some extent, we omitted variable bias persists due to the complex factors influencing carbon emissions. In the current context of addressing climate change and pursuing high-quality development, high carbon emissions may compel enterprises to undergo transformation, thereby increasing their financial demands and subsequently influencing the development of fintech—suggesting possible reverse causality between fintech and carbon emissions. To address these endogeneity concerns, we employed an instrumental variable approach, using the average fintech development level of neighboring regions (Afintech) as a proxy measure. This instrumental variable must satisfy two key conditions: relevance and exogeneity. On one hand, geographically adjacent regions share similar economic development levels, making their fintech development mutually influential. On the other hand, due to administrative segmentation, financial resources from neighboring regions are unlikely to directly affect local economies. Furthermore, by controlling for time and year fixed effects along with other covariates, we ensure the exogeneity requirement is met. The instrumental variable estimation results using the mean fintech development of bordering regions are presented in Table 3.
Table 3.
Two-stage least-squares result.
The first column of Table 3 presents the results of the first-stage regression, indicating a significant positive correlation between the level of fintech development in neighboring regions and the level of local fintech development. The F-statistic for the first stage is 78.55, which exceeds the critical value of 10, suggesting no weak instrumental variable problem. The second column displays the results of the second-stage regression, showing that fintech remains significantly negatively correlated with carbon emissions. This implies that fintech continues to significantly inhibit carbon emissions even after controlling for the average level of fintech development in neighboring regions.
4.1.3. Heterogeneity Test
- (1)
- Geographical Location Heterogeneity
China is a vast country with significant regional diversity, and the level of fintech development varies across cities, particularly between provincial capitals and non-provincial capitals. Therefore, the 286 prefecture-level cities are divided into eastern, central, and western regions, as well as provincial capitals and non-provincial capitals, to examine whether regional differences exist in the carbon-emission-reduction effects of fintech.
The empirical results in Table 4 indicate that fintech significantly reduces carbon emissions in non-provincial capital cities, as well as in the eastern and western regions, while it has no significant impact on carbon emissions in provincial capital cities and the central region. The coefficient for the western region is −1.484, compared to −0.78 for the eastern region, suggesting that the carbon-emission-reduction effect of fintech is slightly stronger in the western region than in the eastern region. A potential reason for this is that while the eastern region is economically developed and possesses advanced technological capabilities, the resource and environmental challenges resulting from rapid development cannot be overlooked. With rapid economic growth, significant energy consumption occurs, leading to increased carbon emissions. This finding further supports the aforementioned U-shaped relationship between economic development and environmental quality, where carbon emissions are suppressed in the early stages of economic development but increase after reaching a turning point.
Table 4.
Heterogeneity analysis; Geographic region.
- (2)
- Heterogeneity in Fintech Development Levels
Theoretical analysis and empirical results suggest that fintech has an inhibitory effect on carbon emissions. However, does the level of fintech development influence the magnitude of this effect? Given the significant disparities in technological capabilities among Chinese cities, which result in varying levels of fintech development, the 286 cities are divided into high and low-fintech development groups based on the median of the annual average fintech index from 2010 to 2021. This study examines the heterogeneous impact of fintech development on carbon emission reduction across these groups. Table 5 presents the results of the heterogeneity regression analysis for high and low levels of fintech development.
Table 5.
Heterogeneity analysis; Fintech development level.
As shown in Table 5, the coefficient of the fintech index is statistically insignificant in high-fintech regions, while showing a significantly negative value in low-fintech regions that passes the significance test at the 1% level. This indicates that the carbon-emission-reduction effect of fintech is more pronounced in low-fintech regions. The underlying reason may be that compared to high-fintech cities, low-fintech regions generally lag behind in industrial structure upgrading, technological capabilities, and policy frameworks. Consequently, even marginal improvements brought by fintech adoption can lead to substantial environmental benefits in these areas. Therefore, greater emphasis should be placed on developing fintech in low-fintech cities to further promote carbon emission reduction and facilitate the achievement of “Dual Carbon” goals.
- (3)
- Heterogeneity of Cities by Size
China’s vast territory leads to significant variations in population density across cities. Does the impact of fintech on carbon emissions vary among cities of different population sizes? Following the Notice on Adjusting the Classification Standards of City Size issued by the State Council, the sample cities in this study are divided into four categories based on population size: small and medium-sized cities, large cities, megacities, and supercities.
The regression results in Table 6 indicate that fintech significantly reduces carbon emissions in small and medium-sized cities and large cities, but not in megacities and supercities. This suggests that the carbon-emission-reduction effect of fintech is influenced by population density. Specifically, the higher the population density, the weaker the carbon-emission-reduction effect of fintech; conversely, the lower the population density, the stronger the effect.
Table 6.
Heterogeneity analysis—cities of different sizes.
- (4)
- Heterogeneity of Environmental Regulation
Porter’s hypothesis posits that environmental regulations increase the environmental and economic costs for businesses, compelling them to adopt more sustainable production methods to reduce carbon emissions. To examine the carbon-reduction effect of fintech under varying levels of environmental regulation, this study employs a text capture method to define the level of environmental regulation, following the approaches of Shao [48]. Specifically, keywords related to environment, energy consumption, pollution, and environmental protection are expanded to measure the degree of environmental regulation across different regions. The empirical results are presented in Table 7.
Table 7.
Heterogeneity analysis—urban environmental regulation.
The results indicate that the coefficient of fintech is significantly negative at the 1% significance level in regions with relaxed environmental regulations, whereas it is not statistically significant in regions with stringent environmental regulations. These findings suggest that compared with regions where local governments implement strict environmental regulations, fintech plays a greater role in carbon emission reduction in regions with loose environmental regulations. A possible reason for this is that in regions with loose environmental regulations, the regulatory intensity is low, and there is not a strong binding force on reducing pollution emissions. The emergence of fintech can make up for the deficiency of environmental regulation intensity in some regions, thus helping with carbon emission reduction.
Overall, fintech’s inhibitory effect on carbon emissions is most pronounced in western regions, cities with underdeveloped fintech ecosystems, areas with lenient environmental regulations, and small-to-medium-sized urban centers, providing robust validation of the regional heterogeneity hypothesis (Hypothesis 1).
4.2. Channel Analysis
4.2.1. Mechanism of Action
To examine the transmission mechanisms of fintech’s carbon-emission-reduction effect, this section employs mechanism variables including industrial structure, energy efficiency, and technological innovation. Table 8 reports the results of the mechanism test. The coefficient of is significantly negative at the 1% level, which aligns with the hypothesized relationship between fintech and carbon emissions. This suggests that the optimization and upgrading of the industrial structure can enhance the carbon-emission-reduction effect of fintech, thereby confirming Hypothesis 2 of this study. Currently, China is addressing climate change and pursuing high-quality, sustainable development. The development of fintech can encourage enterprises to engage in technological innovation, phase out outdated production capacity, and optimize the industrial structure, thereby providing momentum for achieving high-quality and sustainable development.
Table 8.
Mechanism Inspection.
From the perspective of energy consumption, the coefficient of × is significantly negative at the 1% significance level. This result aligns with theoretical expectations and baseline regression results. This finding confirms that improved energy consumption efficiency serves as a crucial transmission channel for fintech to achieve carbon emission reduction. Most carbon emissions originate from energy consumption, and fintech can leverage its technological advantages to reduce the use of high-carbon emission energy sources like fossil fuels, improve energy consumption patterns, and ultimately cut the root causes of carbon emissions. Specifically, fintech streamlines financial services by reducing labor and intermediary costs through digital technologies [37], while simultaneously enhancing energy utilization efficiency via data-driven analytics and intelligent systems. Additionally, it fosters the development of clean energy through technological innovation—for example, by enabling distributed energy trading via blockchain or optimizing renewable energy scheduling with AI—thereby decreasing dependence on high-carbon energy and reducing overall energy consumption. This dual approach of “efficiency enhancement” and “energy substitution” demonstrates fintech’s multi-faceted potential to mitigate carbon emissions. The result validates Hypothesis 2.
From the perspective of technological innovation, technological progress serves as a crucial driver for promoting energy conservation and emission reduction. However, existing research demonstrates its dual impact on carbon emissions: it promotes energy conservation and emission reduction by improving energy use efficiency and optimizing energy structure on one hand, yet it may paradoxically increase carbon emissions by stimulating economic growth and altering consumption patterns, thereby creating a "rebound effect" that offsets anticipated environmental benefits. Specifically, the coefficient of the interaction term is significantly positive at the 1% level, which contrasts with the overall impact of fintech on carbon emissions. This indicates that technological advancements have partially hindered the carbon-reduction effect of fintech, thereby supporting Hypothesis 3b. This phenomenon can be explained through the following mechanisms. First, the economic expansion channel: Technological progress accelerates energy consumption and corresponding carbon emissions by expanding production scale and increasing factor inputs. Taking Zhejiang Province’s Digital Economy Demonstration Zone as an example, for every 1-unit increase in industrial robot density per 10,000 workers, GDP grows by 0.8%, but it simultaneously leads to a 0.5% increase in energy consumption. This “efficiency-scale” paradox is particularly prominent in the manufacturing sector. Second, the factor substitution channel: Traditional technological innovation promotes economic growth by improving energy efficiency while simultaneously creating new energy demands. These new energy demands may partially or completely offset the total energy savings, ultimately leading to increased overall energy consumption [49]. Third, the consumer behavior channel: Technological progress alters residents’ economic behavior patterns, such as enabling more convenient transportation methods and richer electronic products. The use, maintenance, and upgrading of these devices all require substantial energy consumption, potentially generating additional carbon emissions. According to the “China Shared Mobility Development Report (2023)”, when ride-hailing penetration exceeds 35% in sample cities, although per-vehicle emissions decrease, total transportation carbon emissions exhibit a “first decline then rebound” trend.
The rebound effect of technological innovation on carbon emissions manifests more complex mechanisms within intricate economic and environmental contexts, exhibiting significant variations due to regional resource endowments or developmental stages. Drawing on the classification framework of China’s National Sustainable Development Plan for Resource-Based Cities (2013–2020), this study categorizes cities into resource-based and non-resource-based types. Additionally, integrating the developmental trajectory of fintech, the sample is divided into three phases: (1) the embryonic stage (2010–2013), characterized by payment innovations like mobile payments; (2) the rapid expansion phase (2014–2017), marked by emerging technologies including blockchain, P2P lending, and big data risk control; and (3) the mature and regulated phase (2018–2021), featuring progressive regulatory framework development.
Results from Columns 1 and 2 of Table 9 indicate significant heterogeneity in the rebound effect across city types. The coefficient of the interaction term is statistically significant and positive in non-resource-based cities, while it is insignificant in resource-based cities. This divergence highlights that the “rebound effect” of technological innovation varies with resource endowments: In non-resource-based cities, industrial diversification, complex innovation trajectories, and efficiency-sensitive markets may inadvertently couple technological advancement with the expansion of high-carbon industries, thereby inhibiting fintech’s carbon-reduction efficacy. In resource-based cities, economic structure lock-in, singular innovation pathways, and delayed low-carbon transitions constrain the impact of technological innovation to traditional high-carbon sectors, leaving fintech’s emission-reduction role under activated and resulting in an insignificant inhibitory effect. These differences suggest that non-resource-based cities should strengthen low-carbon screening mechanisms for technological innovation (e.g., incorporating carbon intensity into innovation policy evaluations), while resource-based cities need to unlock fintech’s emission-reduction potential through industrial diversification and the introduction of low-carbon technologies.
Table 9.
The Rebound Effect of Technological Innovation.
Results from Columns 3 to 5 of Table 9 show that the coefficient of the interaction term is significantly positive only during the 2013–2020 germination phase and is insignificant in other stages. These reveals pronounced heterogeneity in the "rebound effect" of technological innovation across fintech’s developmental phases: the rebound effect significantly inhibited fintech’s carbon-reduction capacity from 2013 to 2020 but gradually diminished as fintech entered a deeper development stage. The underlying mechanism reflects the co-evolution of fintech and technological innovation: During fintech’s initial development period (2010–2013), the absence of a green orientation led technological innovation to primarily support high-carbon industries, amplifying rebound effects through economic expansion and factor substitution channels. Late, with the deep integration of fintech with green policy guidance and market mechanisms, technological innovation shifted toward low-carbon fields, promoting clean energy substitution and energy efficiency improvements. This established a positive cycle of “technological innovation—energy substitution—carbon emission reduction”, ultimately neutralizing the rebound effect. These findings highlight that maximizing fintech’s carbon-reduction efficacy requires deep coupling with green technologies and complementary policy interventions to guide innovation trajectories.
4.2.2. Further Analysis of the Mechanism
The above mechanism analysis demonstrates that the optimization and upgrading of the industrial structure can enhance the inhibitory effect of fintech on carbon emissions. However, does industrial upgrading across all sectors uniformly promote fintech’s carbon-reduction effects? Are there differential impacts of industrial upgrading on fintech’s emission-reduction potential among different sectors? To address these questions, this study further examines the mechanistic differences in the effect of industrial structure upgrading on fintech-driven carbon emissions across three major industries.
According to the results presented in Table 10, the interaction terms between the upgrading indicators of the three major industrial structures and fintech are all negative, indicating that the upgrading of the three major industrial structures can promote the carbon-emission-reduction effect of fintech. However, the significance levels of the interaction terms between the upgrading of the three major industrial structures and fintech are different. The cross-terms of the three major industries and fintech are significant at significance levels of 10%, 5%, and 10% respectively. That is, the promotion effect of the primary and tertiary industries on the carbon emission reduction in fintech is higher than that of the secondary industry. A possible reason for this is that the primary industry is mainly composed of agriculture, forestry, animal husbandry, and fishery, and the tertiary industry is dominated by finance and service sectors. Agriculture, forestry, animal husbandry, fishery, and the financial service industry usually have relatively low-carbon-emission intensities. In contrast, the secondary industry, which is mainly manufacturing-based, usually involves more high-carbon-emission processes, such as energy production and processing manufacturing. Therefore, it may be easier to achieve carbon emission reduction through the industrial upgrading of the primary and tertiary industries. Secondly, the primary and tertiary industries usually use clean energy sources, such as solar energy and wind energy, while the secondary industry, which is mainly manufacturing-based, usually relies on fossil energy. Therefore, it is easier to achieve low-carbonization in terms of energy through the industrial upgrading of the primary and tertiary industries.
Table 10.
Further analysis of the mechanism.
4.3. Robustness Check
4.3.1. Replacement of Relevant Indicators
To address potential biases from data measurement and sample selection, robustness tests are conducted using alternative indicators and subsamples. This study replaces carbon emission intensity with regional per capita carbon emissions in the regression analysis to further examine the robustness of the finding that fintech can curb carbon emissions. According to the regression results in Table 11, the coefficient of fintech remains significantly negative and passes the significance test at the 1% level, indicating that fintech significantly inhibits carbon emissions.
Table 11.
Robustness Test-Replacement indicators.
4.3.2. Selection of Subsamples
China’s cities are widely distributed, with significant differences in economic development, resource availability, technological capabilities, and other aspects. Municipalities directly under the central government and provincial capitals are generally more economically developed, enjoying greater advantages in policy support, technological infrastructure, and access to scientific and technical talent. Additionally, these cities may transfer part of their carbon emissions to surrounding regions. Therefore, this study excludes the four municipalities directly under the central government and the capital cities of each province to re-examine the regression. The regression results in Table 12 show that, after excluding these cities, the coefficient of fintech remains significantly negative, indicating a significant inhibitory effect on carbon emissions.
Table 12.
Robustness Test Subsample.
Different testing methods all support the core conclusion that fintech inhibits carbon emissions, indicating that the results have strong robustness.
5. Conclusions, Discussion and Policy Implications
5.1. Conclusions
In this study, we examine the impact of fintech on carbon emissions by utilizing a sample of 286 cities at the prefecture level and above in China. We discover that fintech exerts a significant inhibitory influence on carbon emissions. Furthermore, this conclusion persists as valid and robust even subsequent to replacing relevant indicators and excluding certain samples. Additionally, we find that the carbon-emission-reduction effect of fintech is more prominent in the eastern and western regions, in regions with a higher level of fintech development, in regions with more relaxed environmental regulations, and in smaller cities, thus confirming Hypothesis 1. Our results further demonstrate that fintech curbs carbon emissions through the optimization of the industrial structure and the enhancement of energy-consumption efficiency, validating Hypothesis 2. Technological progress has an inhibitory effect on the carbon-emission-reduction effect of fintech, resulting in a “rebound effect” that weakens the expected carbon-emission-reduction effect. This finding supports Hypothesis 3b. This inhibitory effect is more pronounced in the initial stage of fintech development and in non-resource-based cities. These findings withstand a series of tests that address endogeneity concerns, such as industry and year fixed-effects and instrumental variable estimations.
5.2. Discussion
This study empirically demonstrates that fintech significantly curbs urban carbon emissions by promoting industrial structure upgrading and enhancing energy efficiency, providing a scientific basis for formulating targeted digital finance policies. The observed industrial structure effects not only corroborate structural dividend hypothesis, but more critically demonstrate that the primary sector exhibits significantly stronger structural dividends than the tertiary sector. This finding substantially extends the service-dominant transition theory [50,51] by revealing the underappreciated decarbonization potential of primary industries in digital transformation contexts. Additionally, the interaction effect model shows that technological innovation significantly negatively moderates the emission-reduction effect of fintech, uncovering a “rebound effect” of technological innovation. This finding aligns with Shen’s research [52], indicating that although technology has the potential to improve the environment, its effects may unexpectedly drive carbon emission growth under specific circumstances.
This study has limitations in data coverage and granularity that need improvement. The current municipal-level panel data struggle to capture micro-level mechanisms at the enterprise level, particularly lacking differentiated analysis of fintech sub-sectors such as blockchain and green finance. Future research can break new ground in two directions: at the data level, by integrating enterprise-level carbon accounts with fintech transaction data and using natural language processing to mine unstructured text information to enhance the granularity of mechanism analysis; at the methodological level, by introducing agent-based modeling to simulate long-term equilibrium effects under different policy scenarios or leveraging algorithms like random forests to uncover complex nonlinear relationships in high-dimensional data.
5.3. Policy Implications
This study offers important policy implications for policymakers. First, there is an imperative to implement regionally tailored fintech development strategies. In eastern regions, efforts should center on fostering the profound integration of fintech with green industries and enhancing regulatory synergy, while in western regions, emphasis should be placed on fortifying infrastructure construction and leveraging market mechanisms for guidance. Second, policies should be strategically crafted to channel fintech resources towards low-carbon industries and energy-efficient technologies, thereby propelling the green transformation of industrial structures and bolstering energy efficiency. Third, it is crucial to institute a comprehensive carbon emission impact assessment mechanism for technological innovation projects and embed rebound effect mitigation designs within the policy incentive framework. This ensures that technological advancements are not accompanied by unintended increases in emissions. Finally, there should be a concerted push to enhance the integration of enterprise-level carbon accounts with fintech transaction data. By harnessing advanced technologies, such as big data analytics and machine learning, the policy-monitoring and evaluation system can be refined, enabling the dynamic optimization of policy tools. These measures collectively serve to achieve the precise and sustainable empowerment of green development by fintech.
Author Contributions
Conceptualization, D.T. and W.L.; methodology, D.T.; validation, H.S. and D.T.; data curation, D.T.; writing—original draft preparation, D.T.; writing—review and editing, W.L and H.S.; visualization, W.L and H.S., supervision, H.S.; project administration, D.T.; funding acquisition, W.L. All authors have read and agreed to the published version of the manuscript.
Funding
This research was supported by the Hubei Province Education Science Planning Key Topic (grant number 2023GA047); the Hubei Province Philosophy and Social Science Research Project (grant number 23Q165); and the Wuhan Social Science Fund Post-Funding Project (grant number 2024004).
Institutional Review Board Statement
Not applicable.
Informed Consent Statement
Not applicable.
Data Availability Statement
The data presented in this study can be accessed from the China Statistical Yearbook, China Urban Statistical Yearbook, and China Urban Construction Statistical Yearbook.
Conflicts of Interest
The authors declare no conflict of interest.
References
- IPCC. Climate Change 2023: Synthesis Report; Intergovernmental Panel on Climate Change: Geneva, Switzerland, 2023. [Google Scholar]
- Rogelj, J.; Forster, P.; Huppmann, D.; Kriegler, E.; Mundaca, L.; Smith, C.; Séférian, R. Mitigation pathways compatible with 1.5C. Nat. Clim. Chang. 2022, 12, 913–918. [Google Scholar]
- World Bank. China’s Transition to a Low-Carbon Economy; World Bank Group: Washington, DC, USA, 2022. [Google Scholar]
- Liu, Z.; Deng, Z.; He, G.; Wang, H.; Zhang, X.; Lin, J.; Qi, Y.; Liang, X. Challenges and opportunities for carbon neutrality in China. Nat. Rev. Earth Environ. 2022, 3, 141–155. [Google Scholar] [CrossRef]
- Chen, X.; Huang, Y. Long-term financial mechanisms for decarbonization. Energy Policy 2023, 175, 113478. [Google Scholar]
- York, R.; Rosa, E.A.; Dietz, T. STIRPAT, IPAT and ImPACT: Analytic tools for unpacking the driving forces of environmental impacts. Ecol. Econ. 2003, 46, 351–365. [Google Scholar] [CrossRef]
- Zhong, X.; Long, S. A re-understanding of the IPAT model for environmental impact. China Popul. Resour. Environ. 2016, 26, 1–8. [Google Scholar]
- Kumar, S.; Sen, R. Are larger or denser cities more emission efficient? Exploring the nexus between urban household carbon emission, population size and density. Appl. Energy 2025, 377, 124500. [Google Scholar] [CrossRef]
- Casler, S.D.; Rose, A. Carbon dioxide emissions in the US economy: A structural decomposition analysis. Environ. Resour. Econ. 1998, 11, 349–363. [Google Scholar] [CrossRef]
- Jiang, S.Z.; Du, H.F.; Xu, M.Z. Dual Structural Transformation of Energy and Industry under the “Double Carbon” Goals. J. Quant. Econ. Tech. Econ. 2024, 41, 109–130. [Google Scholar]
- Wang, S.; Zhao, Y.; Zhang, W.; Liu, Y. Analysis of factors affecting carbon emissions in Beijing-Tianjin-Hebei region and prediction of peak scenario: Based on the perspective of supply-side reform. J. Beijing Inst. Technol. (Soc. Sci. Ed.) 2022, 24, 54–66. [Google Scholar]
- Acemoglu, D.; Aghion, P.; Bursztyn, L.; Hemous, D. The environment and directed technical change. Am. Econ. Rev. 2012, 102, 131–166. [Google Scholar] [CrossRef]
- Li, J.G.; Gong, F.M.; Wang, Y.B. How does artificial intelligence technology innovation impact carbon reduction in the manufacturing industry? China Popul. Resour. Environ. 2025, 35, 14–24. [Google Scholar]
- Sun, Z.Q.; Yang, R. Impact of Artificial Intelligence Technological Innovation on Regional Carbon Emissions: Mechanism Identification and Rebound Effect. Sci. Technol. Manag. Res. 2024, 44, 168–177. [Google Scholar]
- Bonab, S.R.; Haseli, G.; Ghoushchi, S.J. Digital technology and information and communication technology on the carbon footprint. In Decision Support Systems for Sustainable Computing; Academic Press: Cambridge, MA, USA, 2024; pp. 101–122. [Google Scholar]
- Chen, H.L.; Yang, X.K.; Wang, Z.B. Impact and Spillover Effects of Digital Economy on Industrial Carbon Emission Intensity. Res. Environ. Sci. 2024, 37, 672–685. [Google Scholar]
- Barrage, L. Optimal dynamic carbon taxes in a climate-economy model with distortionary fiscal policy. Rev. Econ. Stud. 2020, 87, 1–39. [Google Scholar] [CrossRef]
- Tu, Z.G.; Shen, R.J. Can the emissions trading mechanism achieve the Porter effect in China? Econ. Res. J. 2015, 7, 160–173. [Google Scholar]
- Liu, J.; Zhang, Y. Fintech, strong environmental regulation, and regional industrial green development. J. Financ. Econ. 2022, 43, 123–131. [Google Scholar]
- Sadorsky, P. The impact of financial development on energy consumption in emerging economies. Energy Policy 2010, 38, 2528–2535. [Google Scholar] [CrossRef]
- Zhao, J.; Liu, C.Y.; Li, C. The Impact of Financial Development on Carbon Emissions: “Promotion Effect” or “Inhibitory Effect”?—Based on the Mediation Effect Model of Technological Progress Heterogeneity. J. Xinjiang Univ. (Philos. Human-it. Soc. Sci. Ed.) 2020, 4, 1–10. [Google Scholar]
- Chen, L.; Hu, W. Financial development, technological progress, and carbon emissions: A synergistic effect study based on VAR analysis of carbon emissions in 30 Chinese provinces from 2005 to 2017. Study Explor. 2020, 6, 117–124. [Google Scholar]
- Chen, X. Financial structure, technological innovation, and carbon emissions: Also on the development of green financial systems. Soc. Sci. Guangdong 2020, 4, 41–50. [Google Scholar]
- Boutabba, M.A. The impact of financial development, income, energy, and trade on carbon emissions: Evidence from the Indian economy. Econ. Model. 2014, 40, 33–41. [Google Scholar] [CrossRef]
- Shao, H.; Liu, Y. The nonlinear relationship between financial development and carbon emissions: An empirical test based on a panel smooth transition model. Soft Sci. 2017, 5, 80–84. [Google Scholar]
- Liang, L.; Lin, S. Financial structure and green low-carbon economic development. Inq. Econ. Issues 2018, 11, 179–190. [Google Scholar]
- He, Y.; Xu, T.; Zhong, L. The impact of financial development on carbon dioxide emissions and its pathways. Comp. Econ. Soc. Syst. 2020, 2, 1–10. [Google Scholar]
- Han, F.; Xie, R. Does the agglomeration of producer services reduce carbon emissions? A spatial econometric analysis of panel data from cities above the prefecture level in China. J. Quant. Tech. Econ. 2017, 34, 40–58. [Google Scholar]
- Zhou, Y.; Ji, P. Industrial upgrading, financial resource allocation efficiency, and carbon emissions: A study based on interprovincial spatial panel data analysis. East China Econ. Manag. 2019, 33, 59–66. [Google Scholar]
- Shahbaz, M.; Tiwari, A.K.; Nasir, M. The effects of financial development, economic growth, coal consumption, and trade openness on CO2 emissions in South Africa. Energy Policy 2013, 61, 1452–1459. [Google Scholar] [CrossRef]
- Kong, W.W.; Song, T.H.; Zhang, Y. Does Fintech Promote Green Credit Extension by Commercial Banks? - A Nonlinear Relationship Test Based on Threshold Effects. Commun. Financ. Account. 2024, 9, 53–59. [Google Scholar]
- Liu, J.; Zhang, C.; Tian, W. Fintech, resource misallocation, and urban green innovation. Financ. Econ. 2022, 6, 68–78. [Google Scholar]
- Li, J.; Liu, H.; Shi, C. An empirical study on the impact of fintech on non-CO2 greenhouse gas emissions of enterprises. J. Nanjing Univ. Inf. Sci. Technol. (Nat. Sci. Ed.) 2022, 14, 410–418. [Google Scholar]
- Lyu, Y.; Wang, Y. The value of fintech in environmental governance: Empirical analysis based on PM2.5 in 287 Chinese cities. Wuhan Financ. 2021, 9, 9–20. [Google Scholar]
- Hu, J.; Yu, L.; Liu, Y. The incentive effect of fintech on corporate green transformation: A dual empowerment perspective of digitalization and green governance. Mod. Financ. Econ. 2024, 6, 93–109. [Google Scholar]
- Xu, J.; Chen, F.; Zhang, W.; Liu, Y.; Li, T. Analysis of the carbon emission reduction effect of Fintech and the transmission channel of green finance. Financ. Res. Lett. 2023, 56, 104127. [Google Scholar] [CrossRef]
- Xue, Y.; Hu, J. Fintech promoting high-quality economic development: Theoretical logic, practical basis, and path selection. Reform 2020, 3, 53–62. [Google Scholar]
- Jiang, H.Q.; Zhang, Y.Y.; Yu, Z.; Chen, F.; Huang, W. Can the “Personal Carbon Account” Policy Reduce Carbon Emissions from Urban Residents’ Household Electricity Consumption? An Empirical Study Based on Quzhou, Zhejiang. Urban Dev. Stud. 2024, 1, 104–111. [Google Scholar]
- Xong, W.; Liu, D.; Li, Z.; Wang, Q.; Yao, S. How Does Ant Forest Influence Low Carbon Consumption Behavior: An Analysis Based on the SOR Model. Sustainability 2024, 16, 1736. [Google Scholar] [CrossRef]
- Van der Kroon, B.; Brouwer, R.; Van Beukering, P.J. The energy ladder: Theoretical myth or empirical truth? Results from a meta-analysis. Renew. Sustain. Energy Rev. 2013, 20, 504–513. [Google Scholar] [CrossRef]
- Wu, J.; Guo, Z. Convergence analysis of carbon emissions in China based on continuous dynamic distribution methods. Stat. Res. 2016, 33, 54–60. [Google Scholar]
- Li, C.; Yan, X.; Song, M. Fintech and corporate innovation: Evidence from listed companies on the New Third Board. China Ind. Econ. 2020, 1, 81–98. [Google Scholar]
- Gao, W.; Peng, Y.; Hu, X. The impact of the digital economy on urban energy conservation and emission reduction under the “dual carbon” goals. Urban Probl. 2023, 3, 25–37. [Google Scholar]
- Sakai, A.; Koffie, N.B. Indexing structural distortion: Sectoral productivity, structural change, and growth. IMF Work. Pap. 2017, 17, 48. [Google Scholar]
- Jiang, J.L.; Wang, Z.W.; Liao, L. Rural upbringing experience and stock market participation. Econ. Res. J. 2018, 53, 84–99. [Google Scholar]
- Lin, B.; Jiang, Z. Prediction of China’s carbon dioxide environmental Kuznets curve and analysis of influencing factors. Manag. World 2009, 4, 27–36. [Google Scholar]
- Abdouli, M.; Hammami, S. Exploring links between FDI inflows, energy consumption, and economic growth: Further evidence from MENA countries. J. Econ. Dev. 2017, 42, 95–117. [Google Scholar] [CrossRef]
- Shao, S.; Ge, L.M.; Zhu, J.L. How can man and nature coexist in harmony? Environmental regulation and environmental welfare performance from a geographical perspective. Manag. World 2024, 8, 119–143. [Google Scholar]
- Sorrell, S. Jevons’ Paradox Revisited: The Evidence for Backfire from Improved Energy Efficiency. Energy Policy 2009, 37, 1456–1469. [Google Scholar] [CrossRef]
- Zhou, G.; Li, X. Digital-enabled primary industry upgrading: The overlooked decarbonization pathway. Nat. Sustain. 2024, 7, 45–59. [Google Scholar]
- Gao, J. Service-oriented Structural Transformation and Environmental Performance: Evidence from China’s Tertiarization. Struct. Chang. Econ. Dyn. 2021, 56, 1–15. [Google Scholar]
- Shen, M.; Li, K.J.; Qu, R.X. Technological progress, economic growth and carbon dioxide emissions: Theoretical and empirical research. J. World Econ. 2012, 35, 83–100. [Google Scholar]
Disclaimer/Publisher’s Note: The statements, opinions and data contained in all publications are solely those of the individual author(s) and contributor(s) and not of MDPI and/or the editor(s). MDPI and/or the editor(s) disclaim responsibility for any injury to people or property resulting from any ideas, methods, instructions or products referred to in the content. |
© 2025 by the authors. Licensee MDPI, Basel, Switzerland. This article is an open access article distributed under the terms and conditions of the Creative Commons Attribution (CC BY) license (https://creativecommons.org/licenses/by/4.0/).