
A Study of the Impact of Industrial Land Development on PM2.5 Concentrations in China

Abstract
1. Introduction
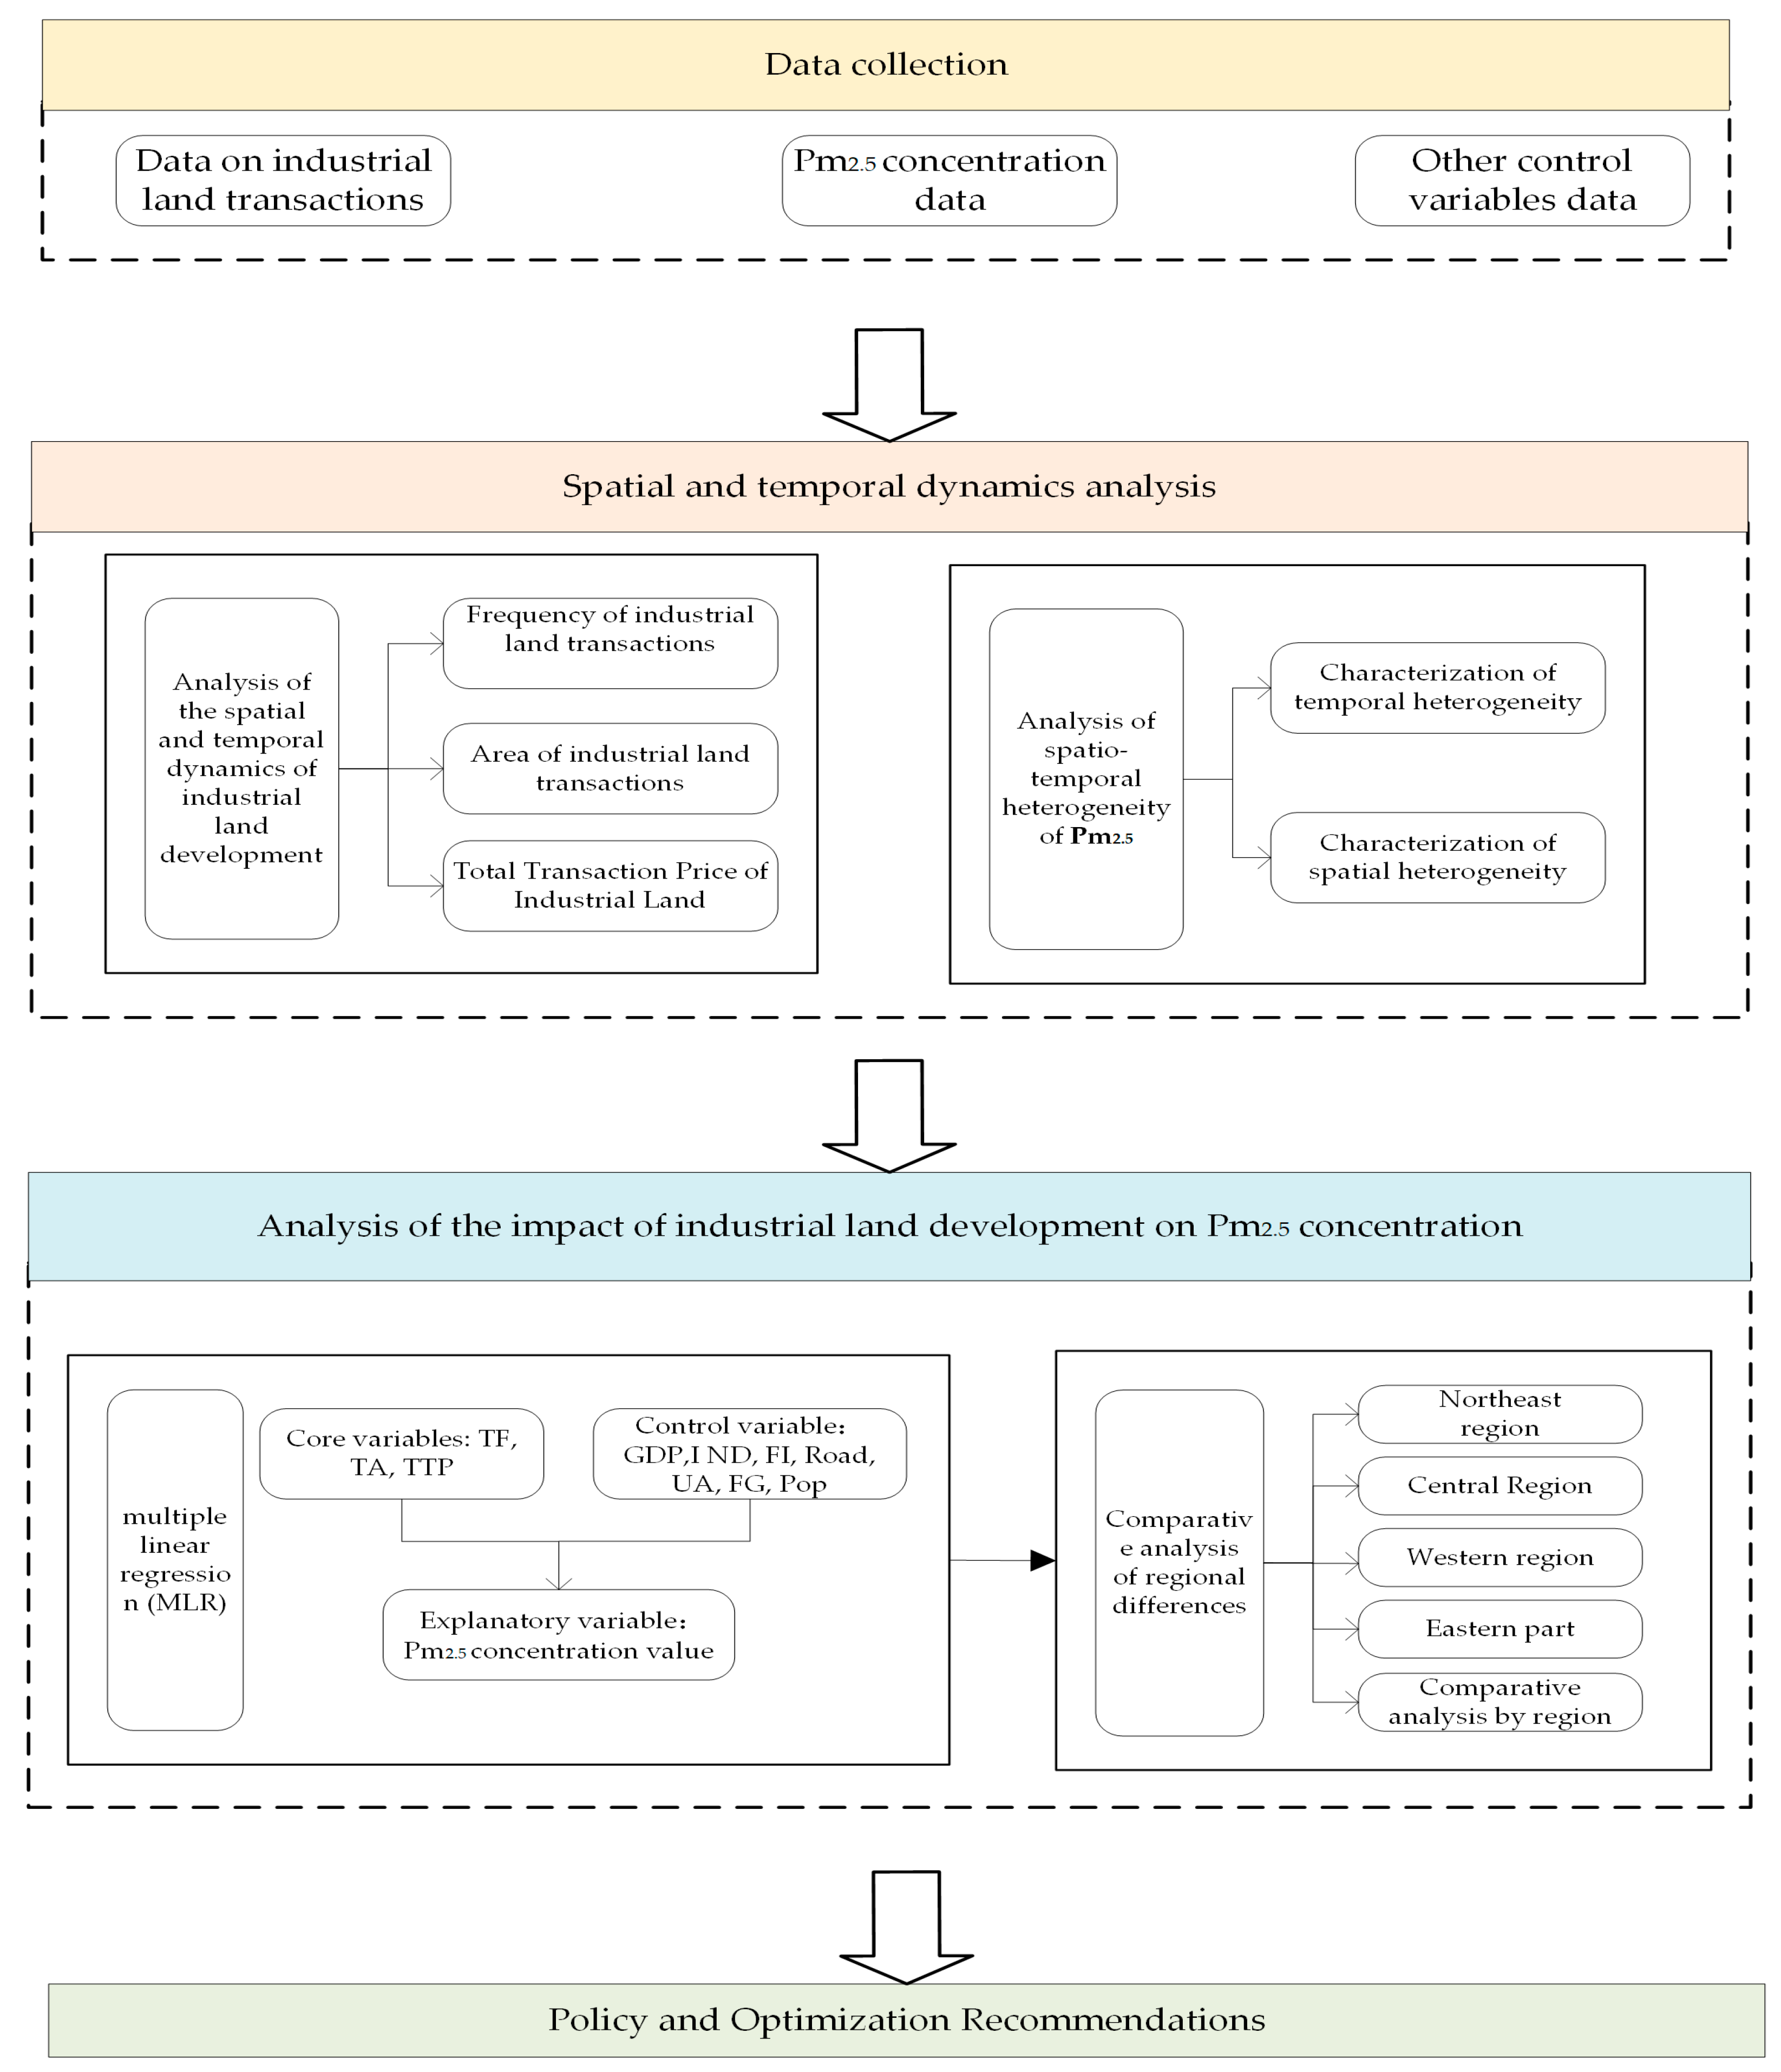
2. Materials and Methods
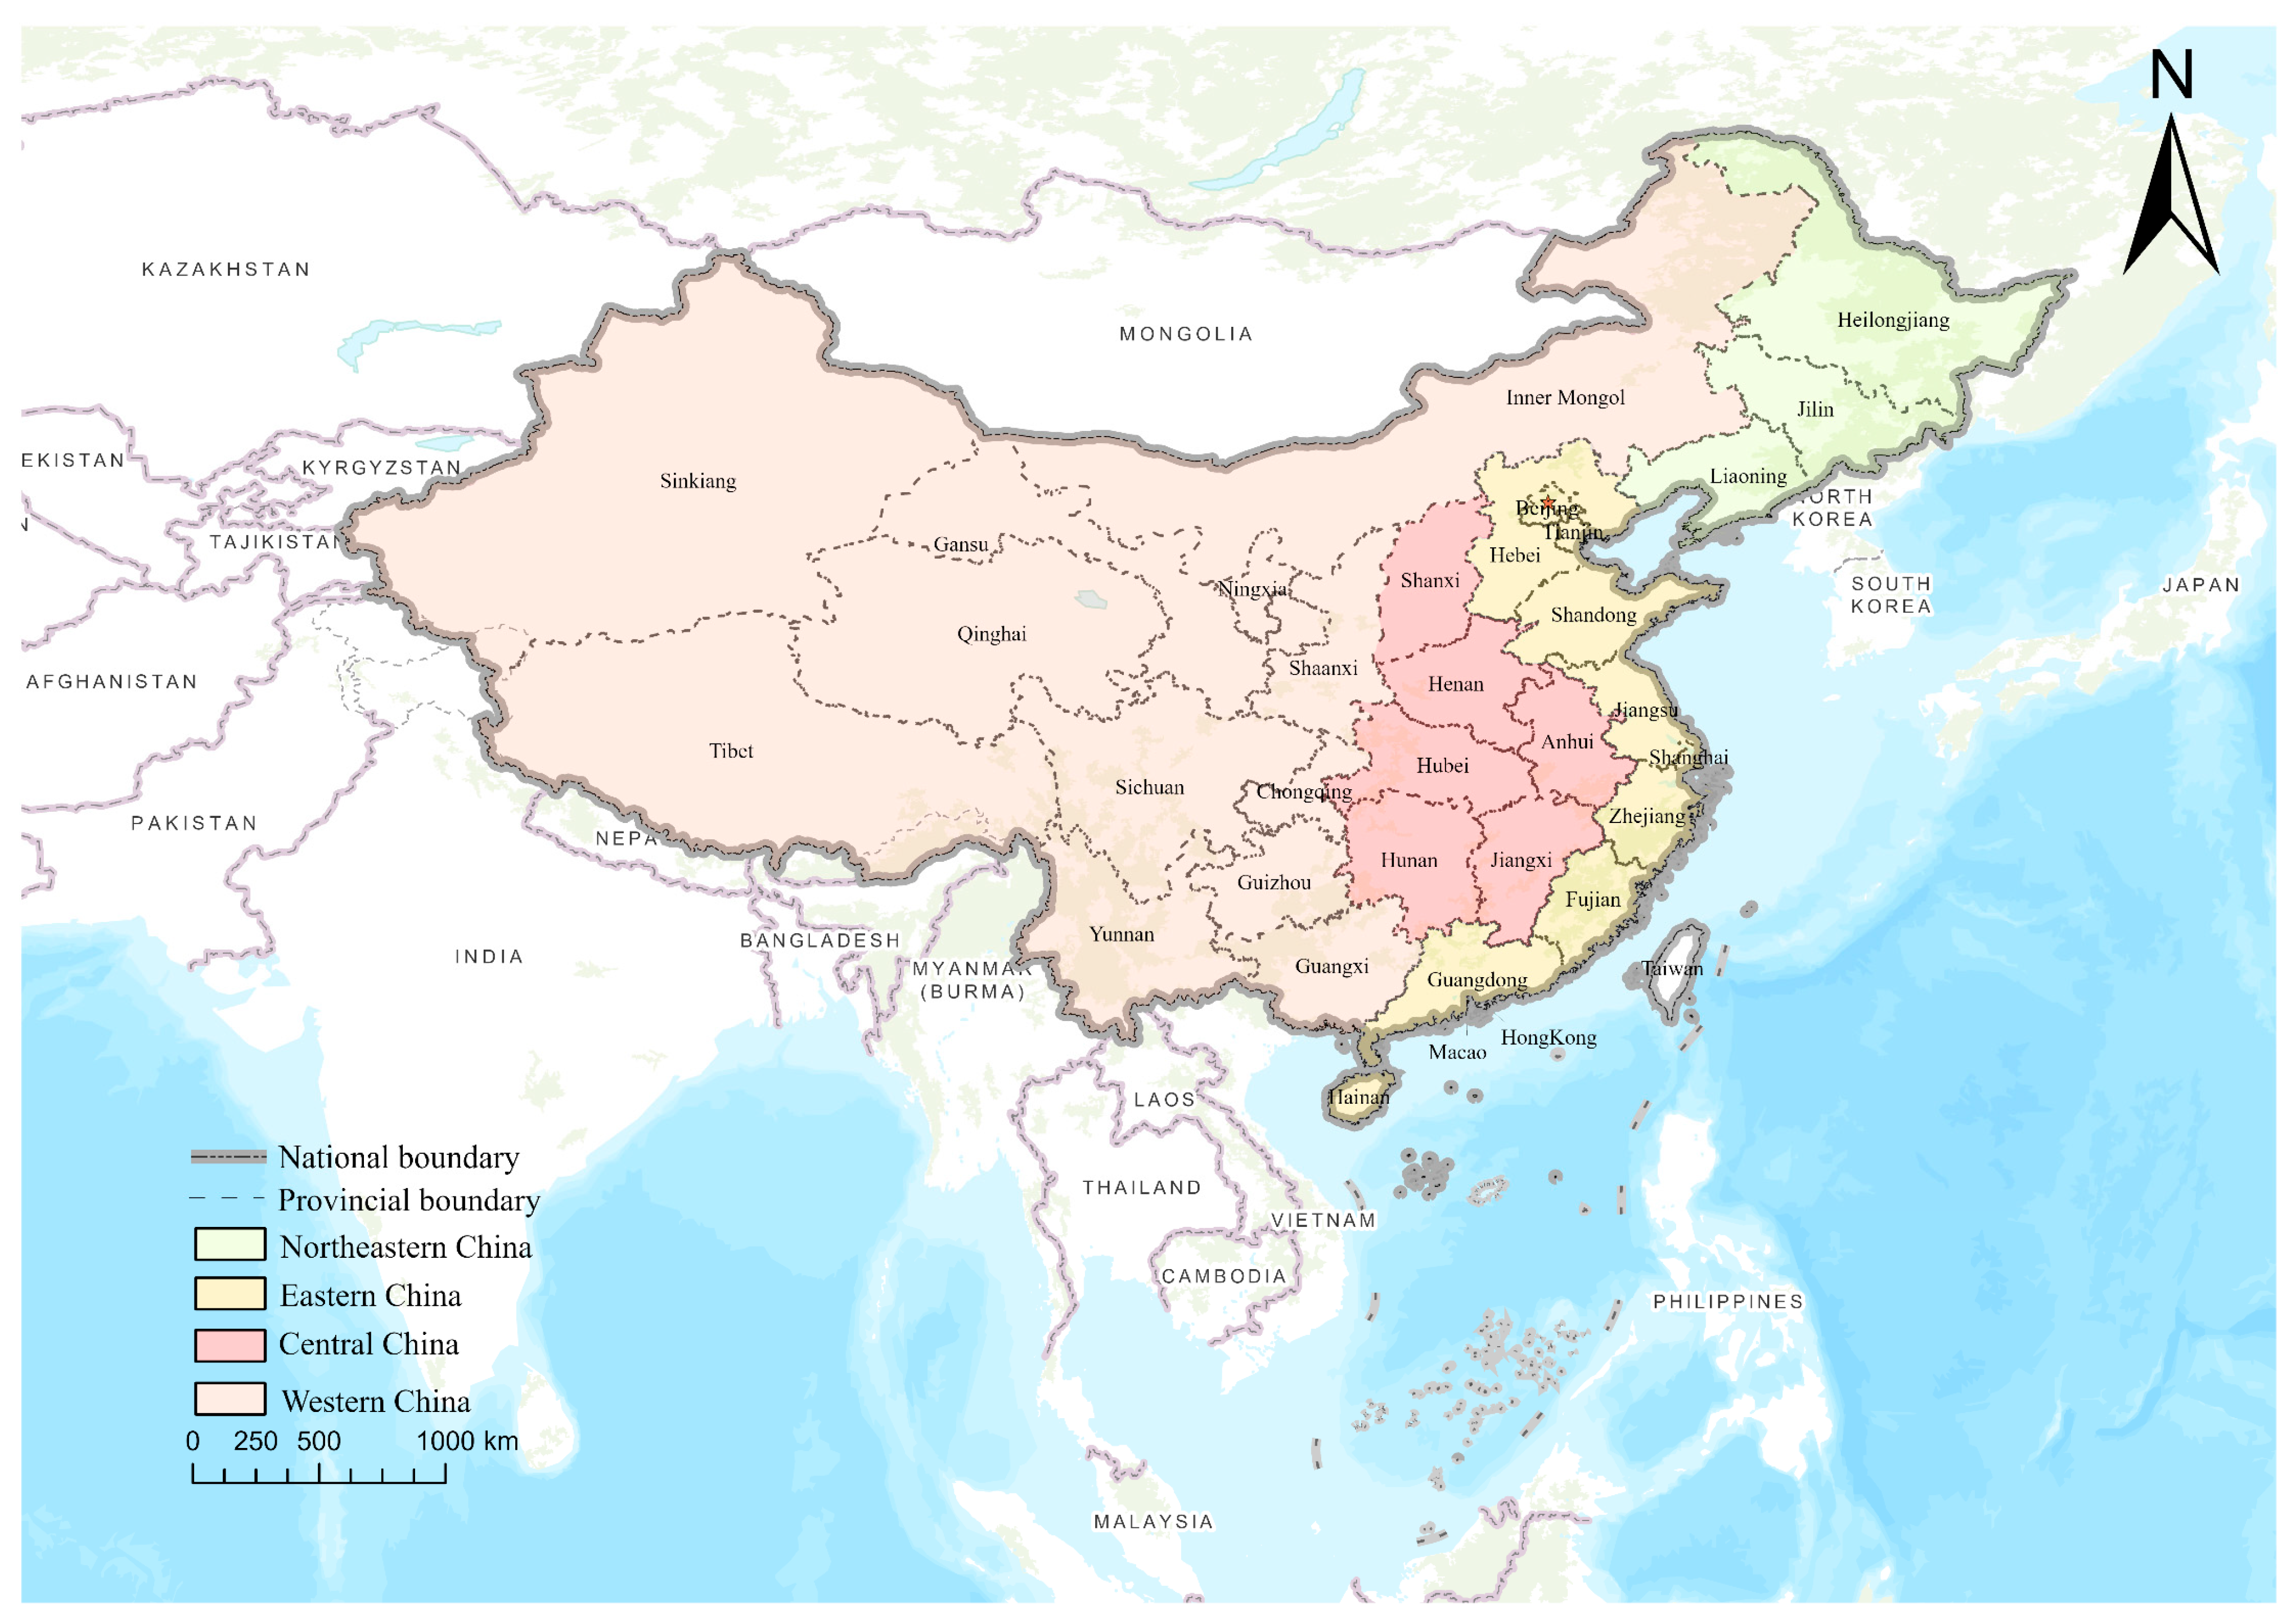
2.1. Study Area
2.2. Research Methodology
2.2.1. Spatial Autocorrelation
2.2.2. Cold and Hot Spot Analysis
2.2.3. Multiple Linear Regression Analysis
2.3. Data Sources
3. Results
3.1. Analysis of the Temporal and Spatial Dynamics of Industrial Land Development
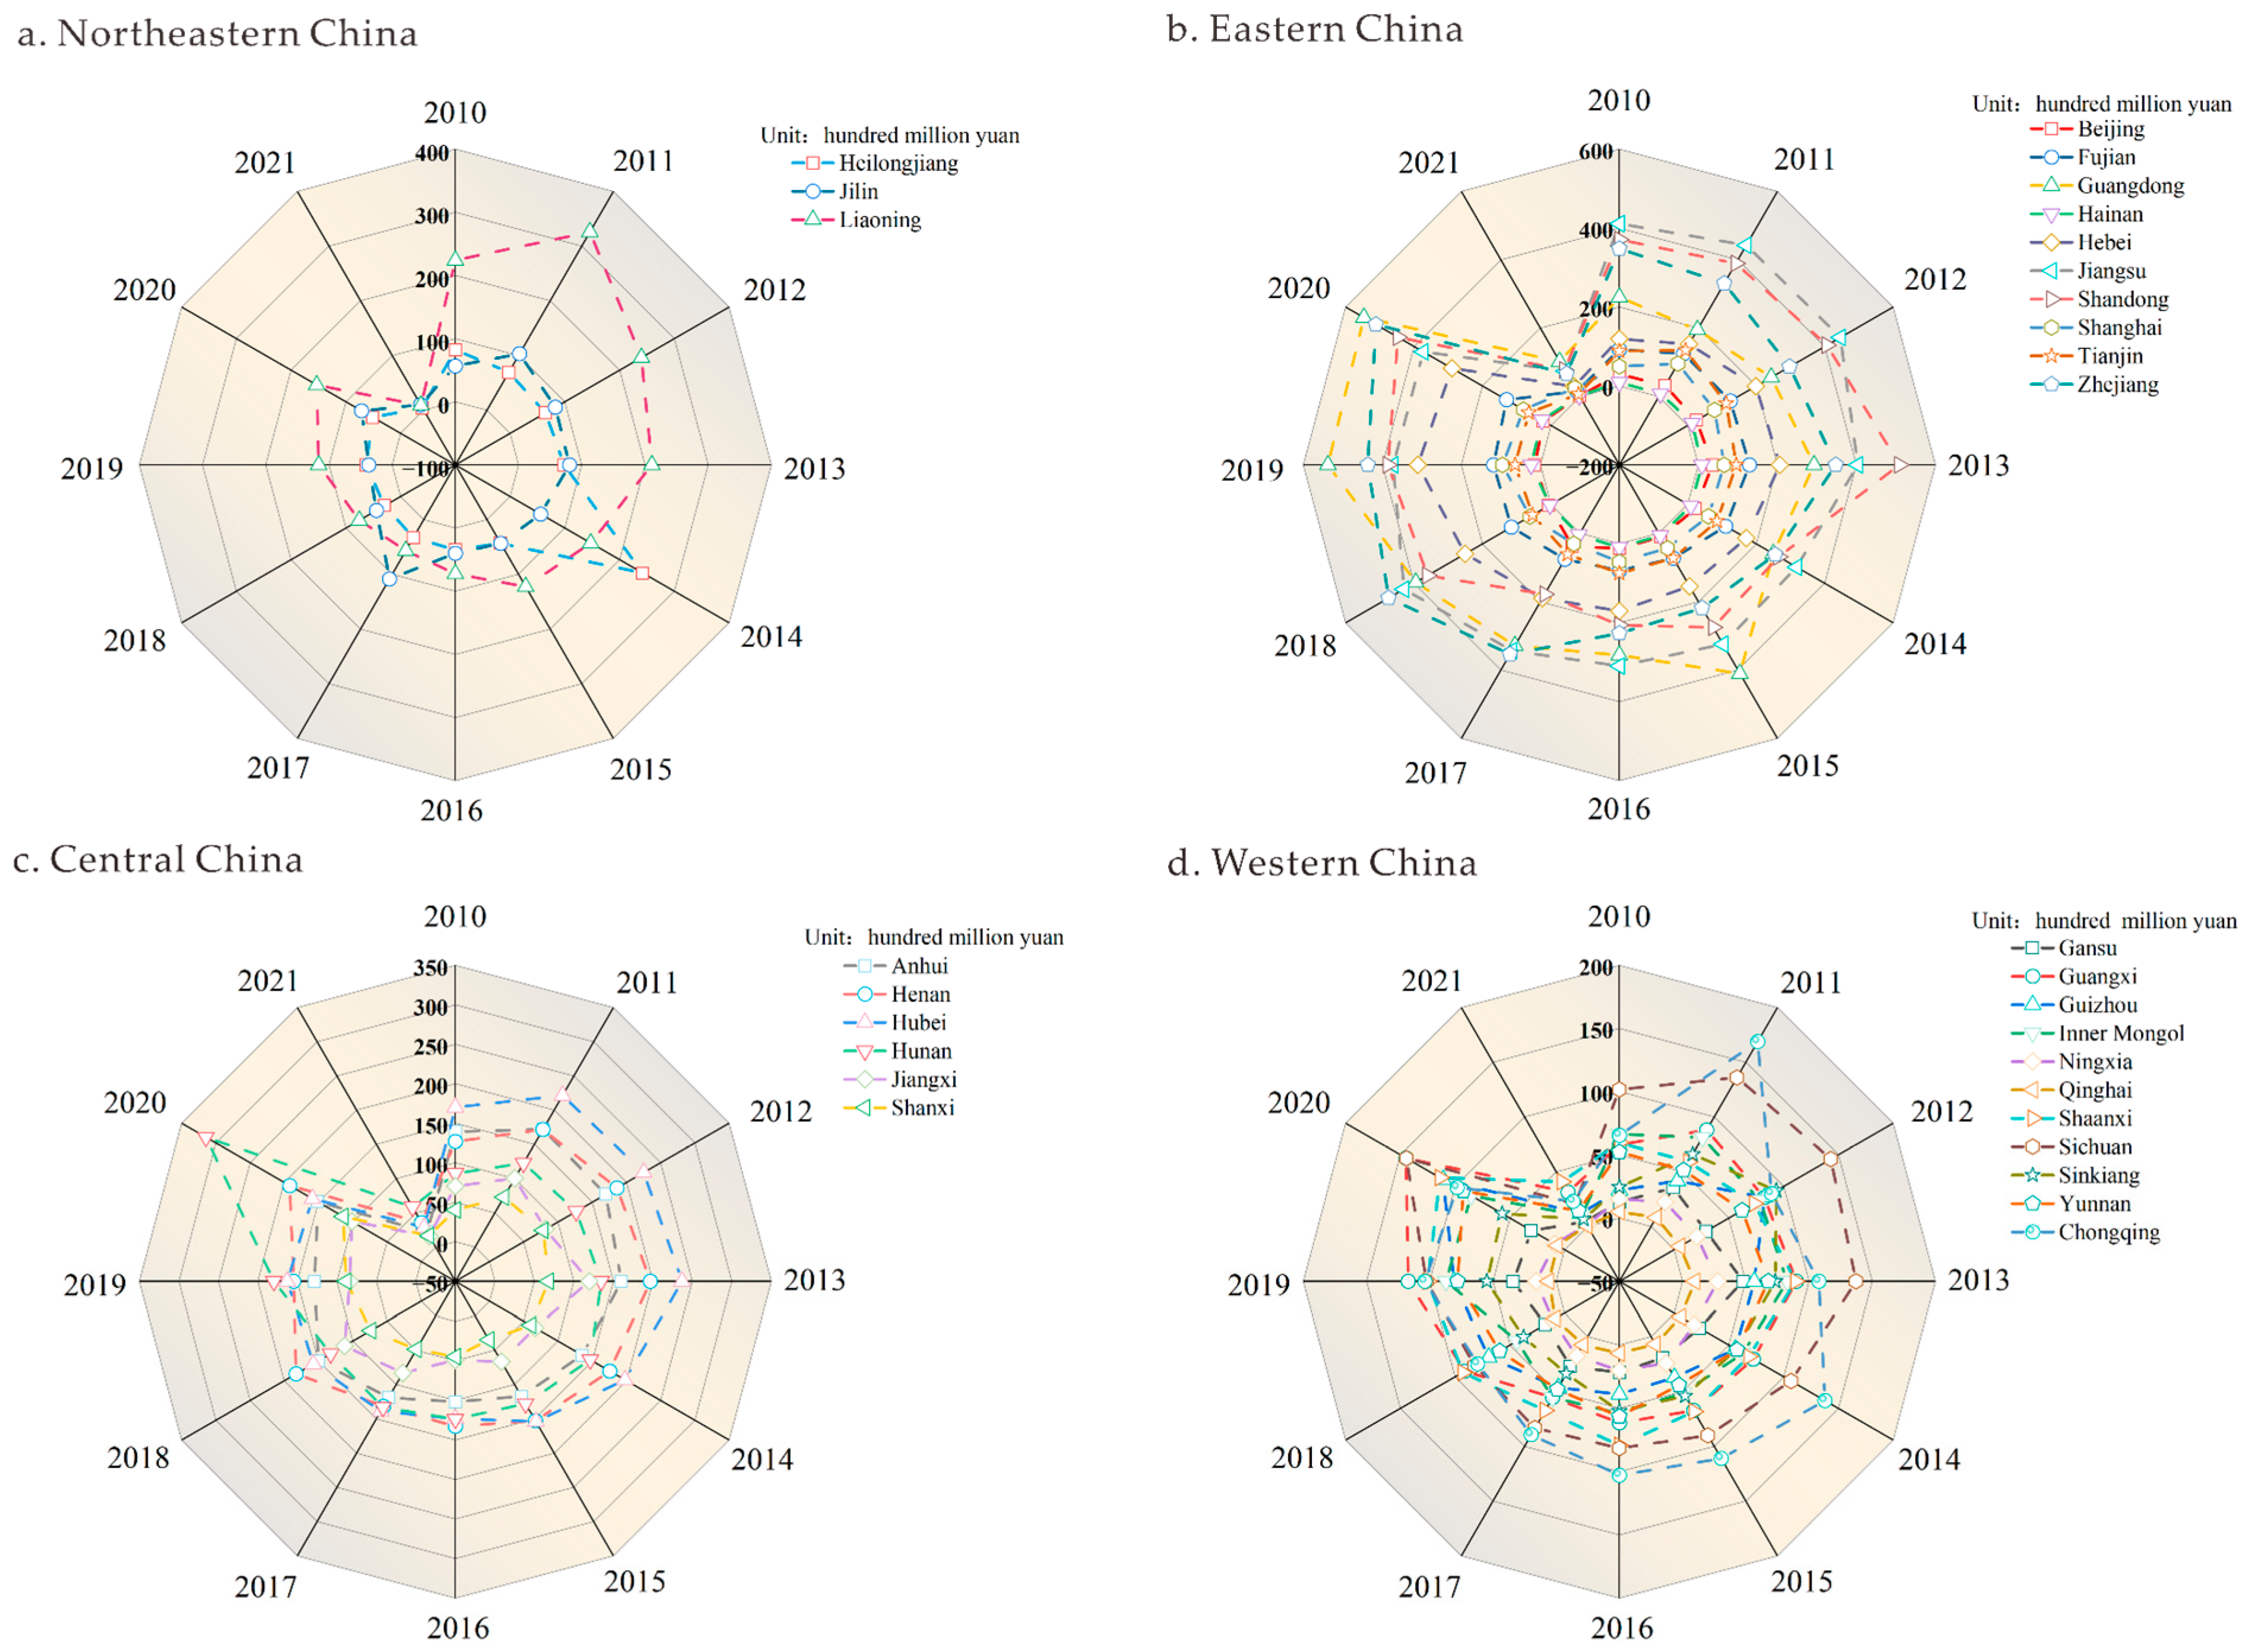
3.1.1. Analysis of the Spatial and Temporal Dynamics of the Frequency of Industrial Land Transactions
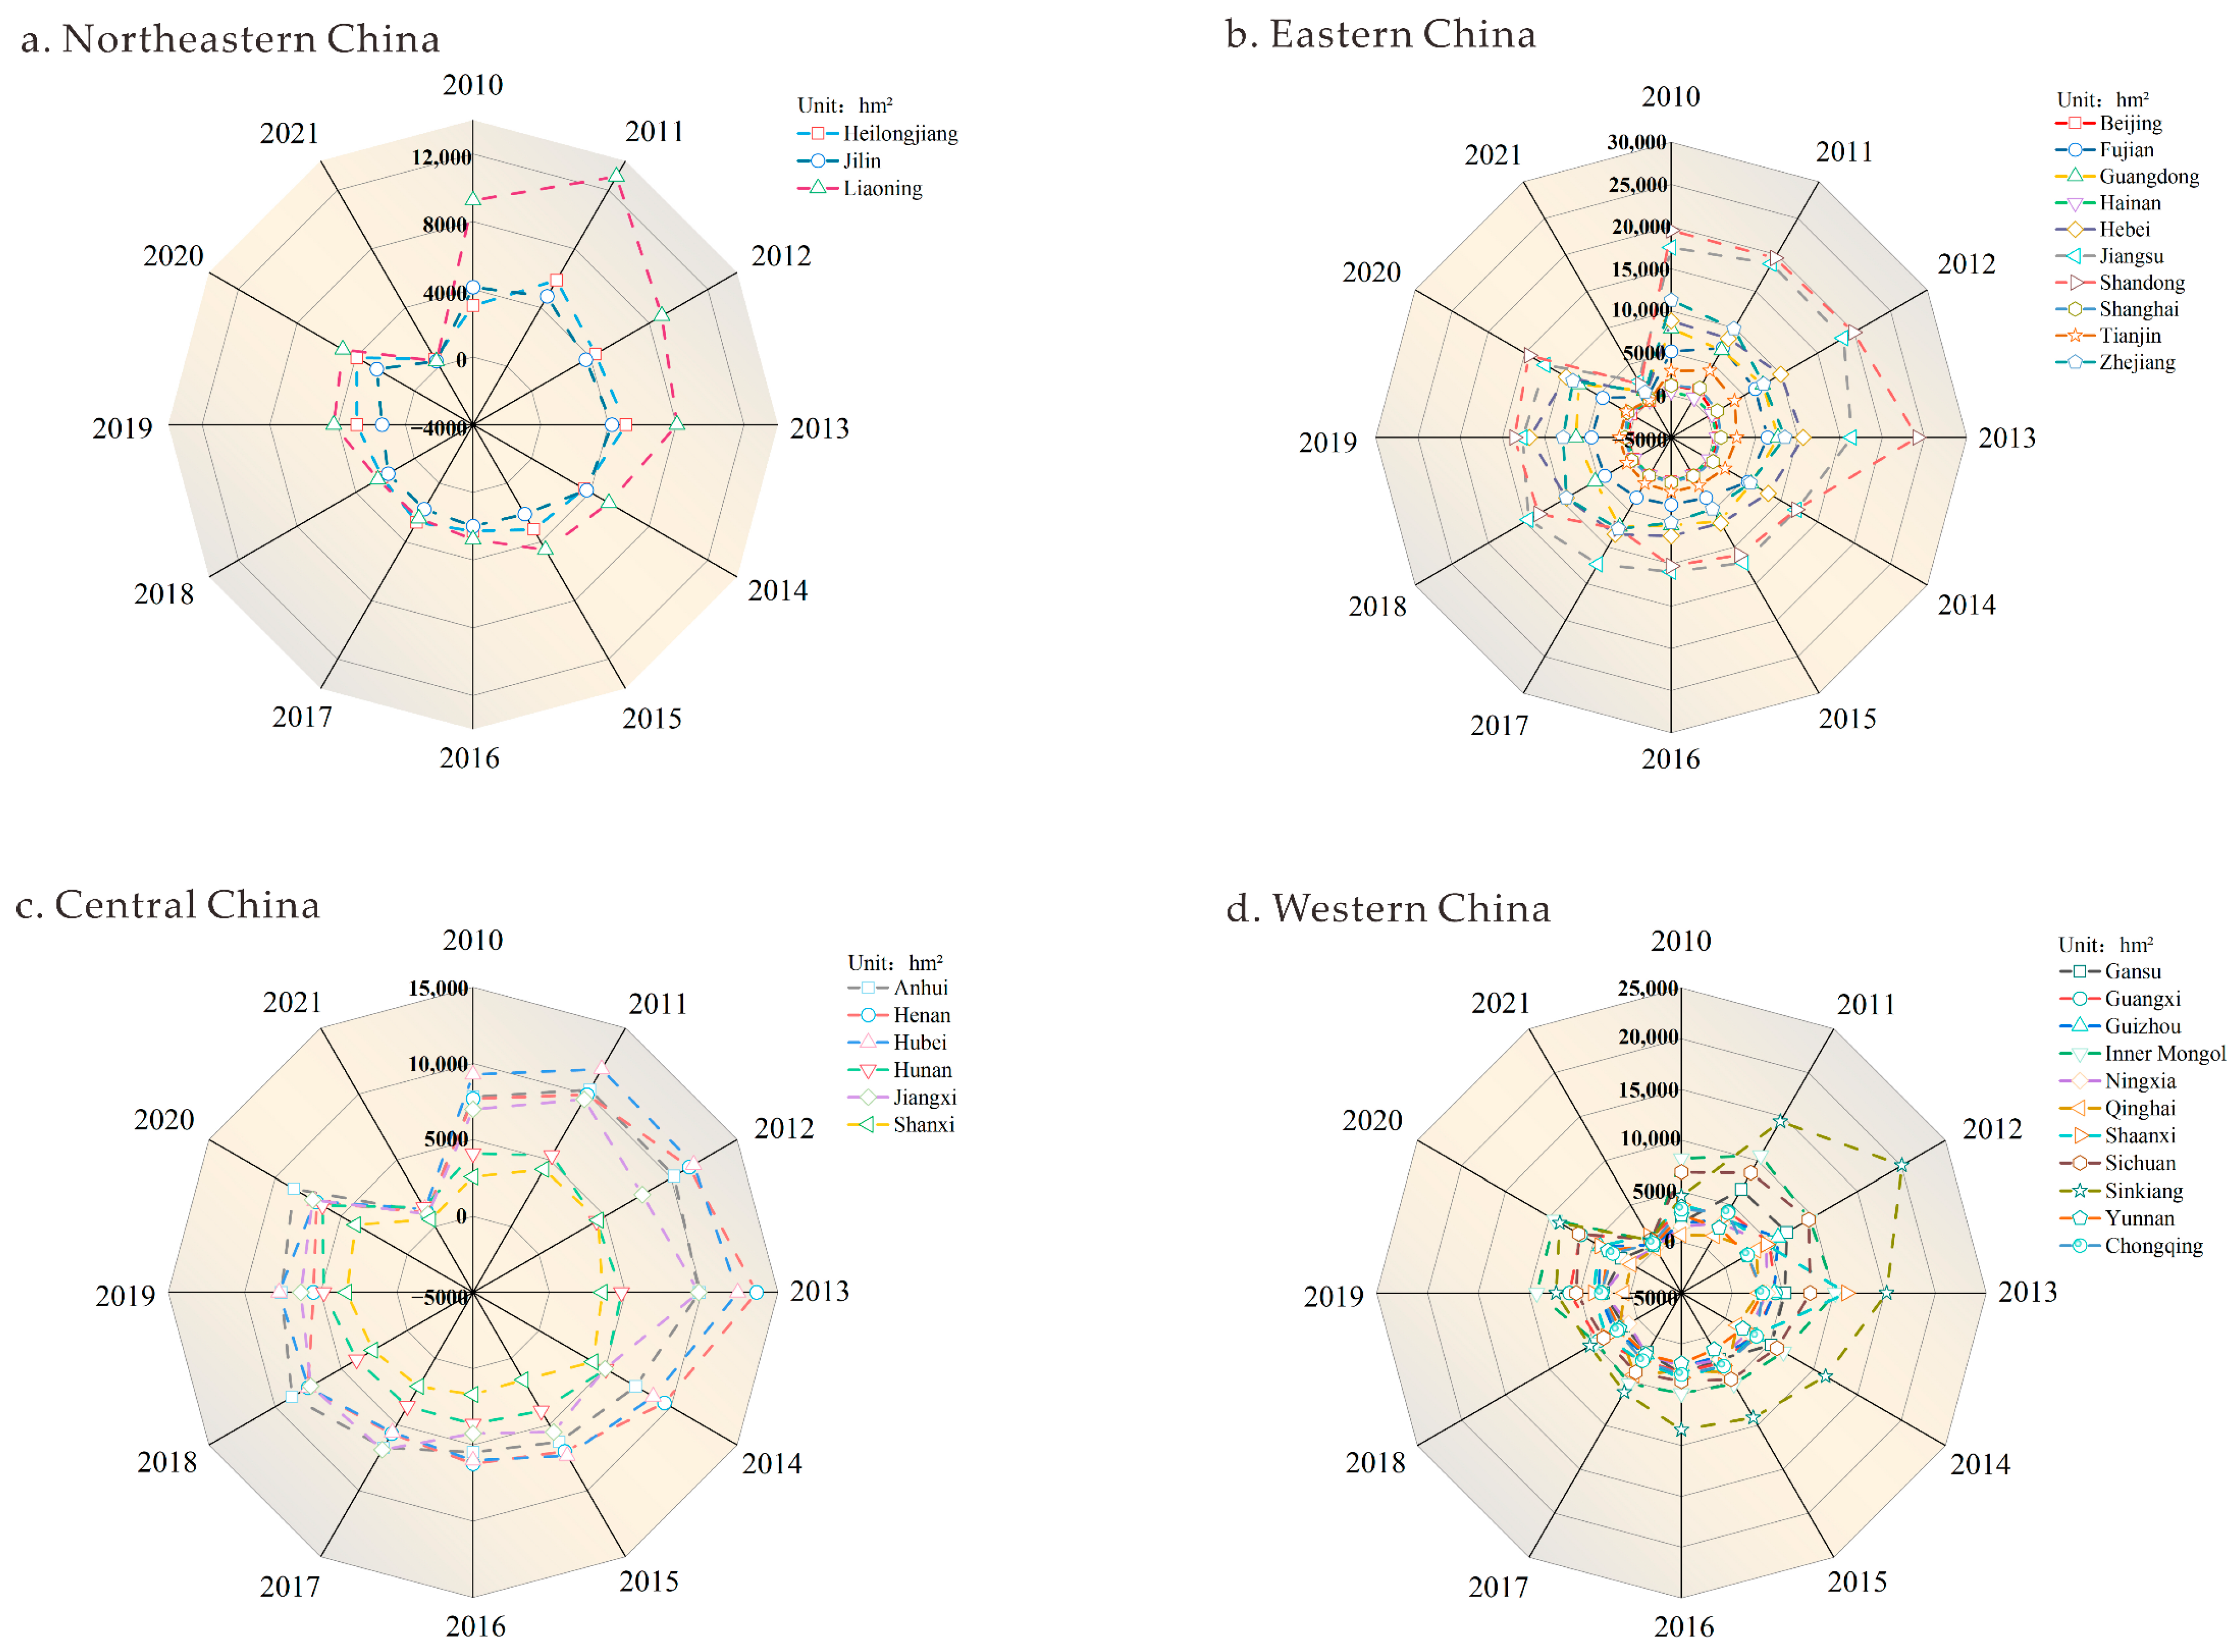
3.1.2. Analysis of the Temporal and Spatial Dynamics of the Area of Industrial Land Transactions
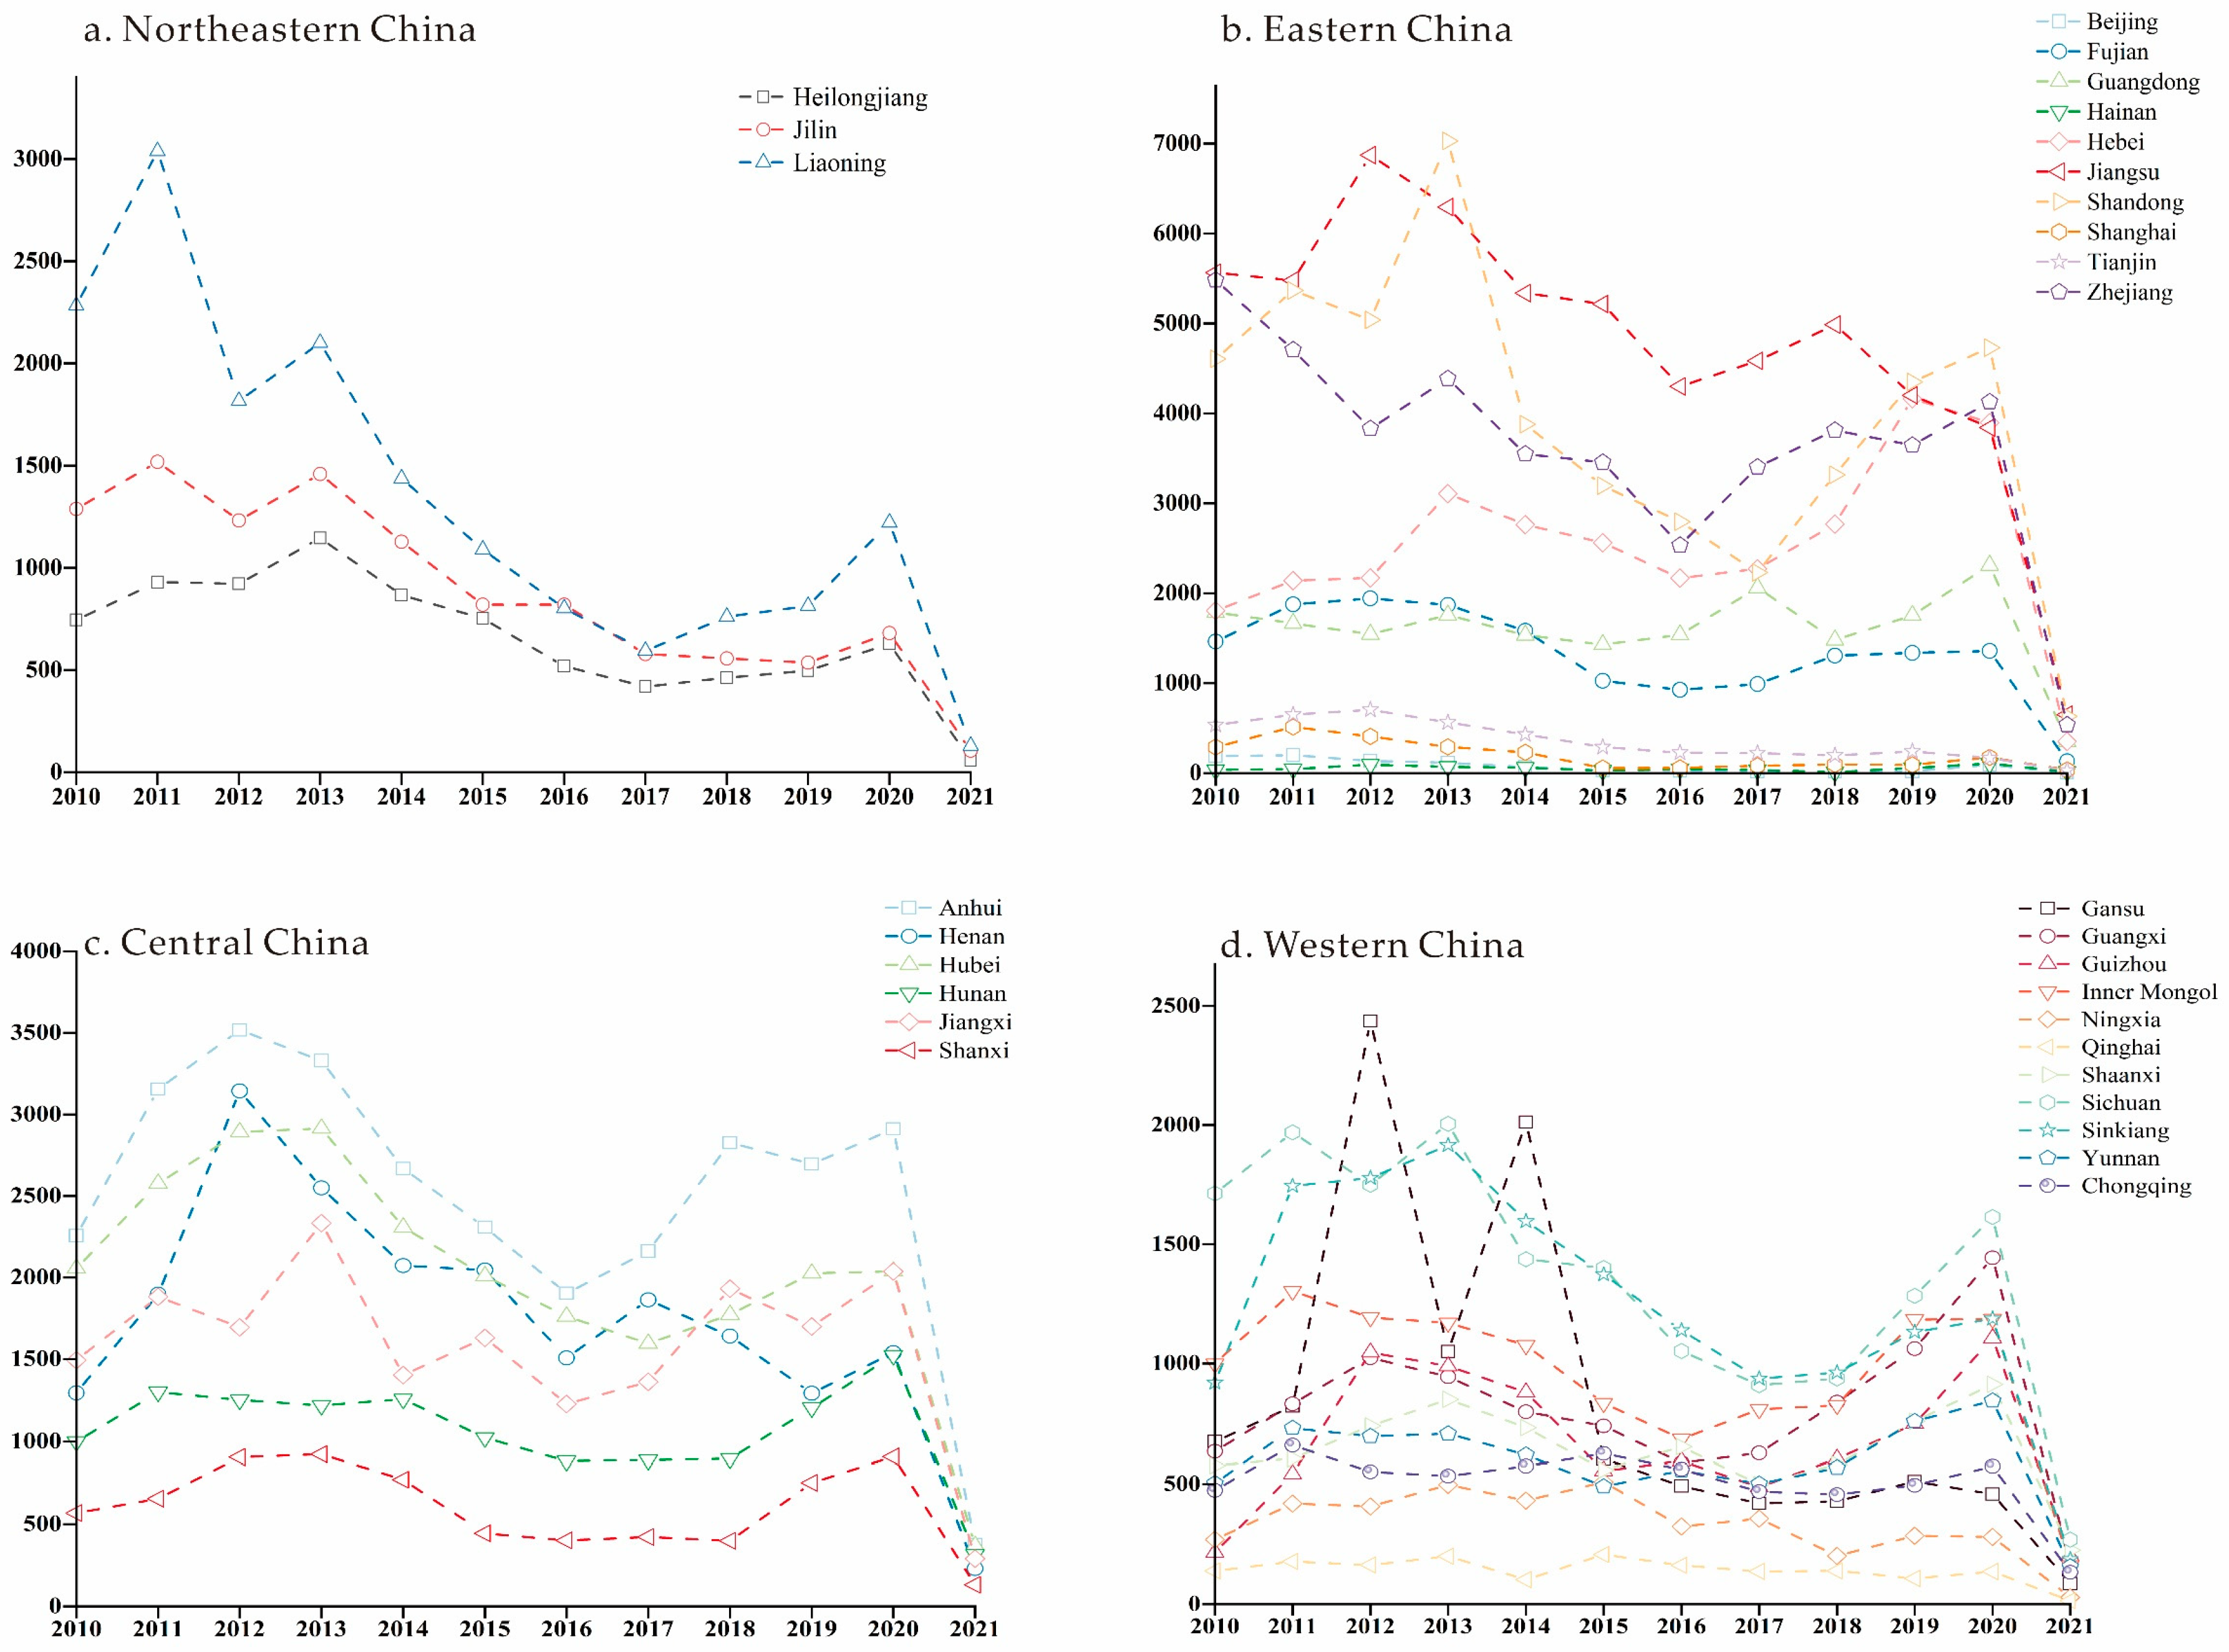
3.1.3. Analysis of the Temporal and Spatial Dynamics of the Total Price of Industrial Land Transactions
3.2. Characteristics of Spatial and Temporal Heterogeneity of PM2.5
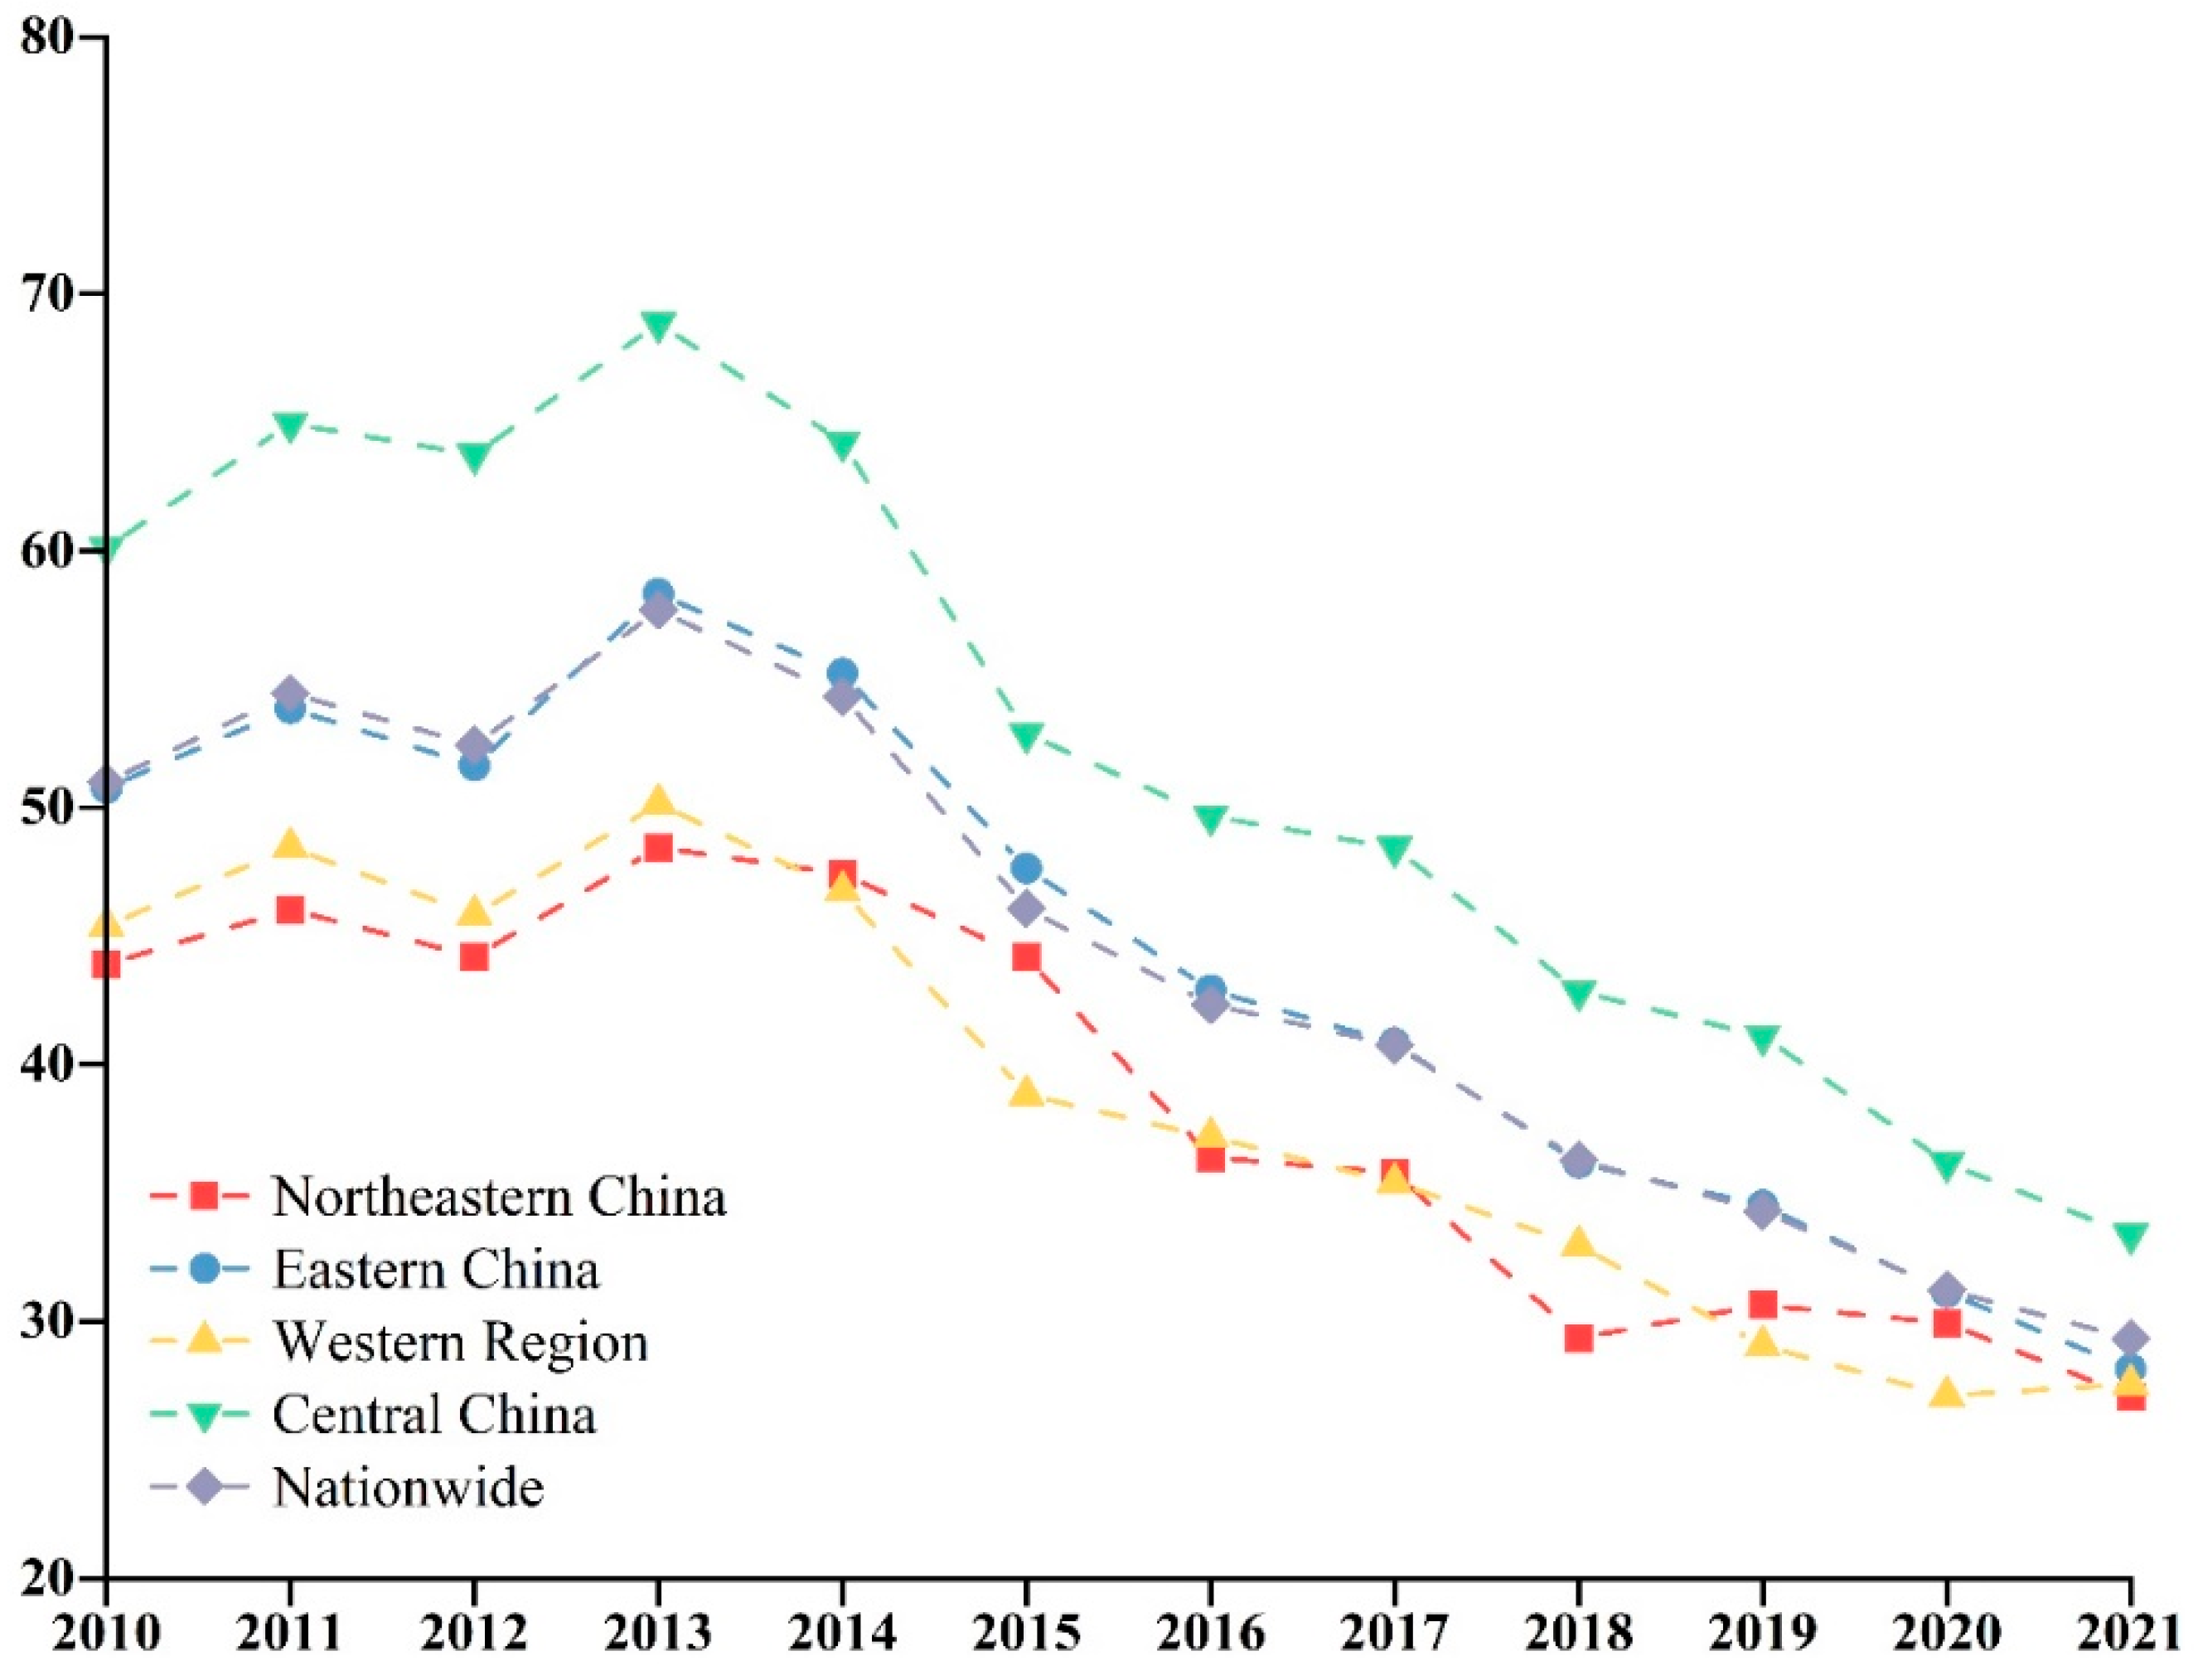
3.2.1. Characteristics of Temporal Heterogeneity
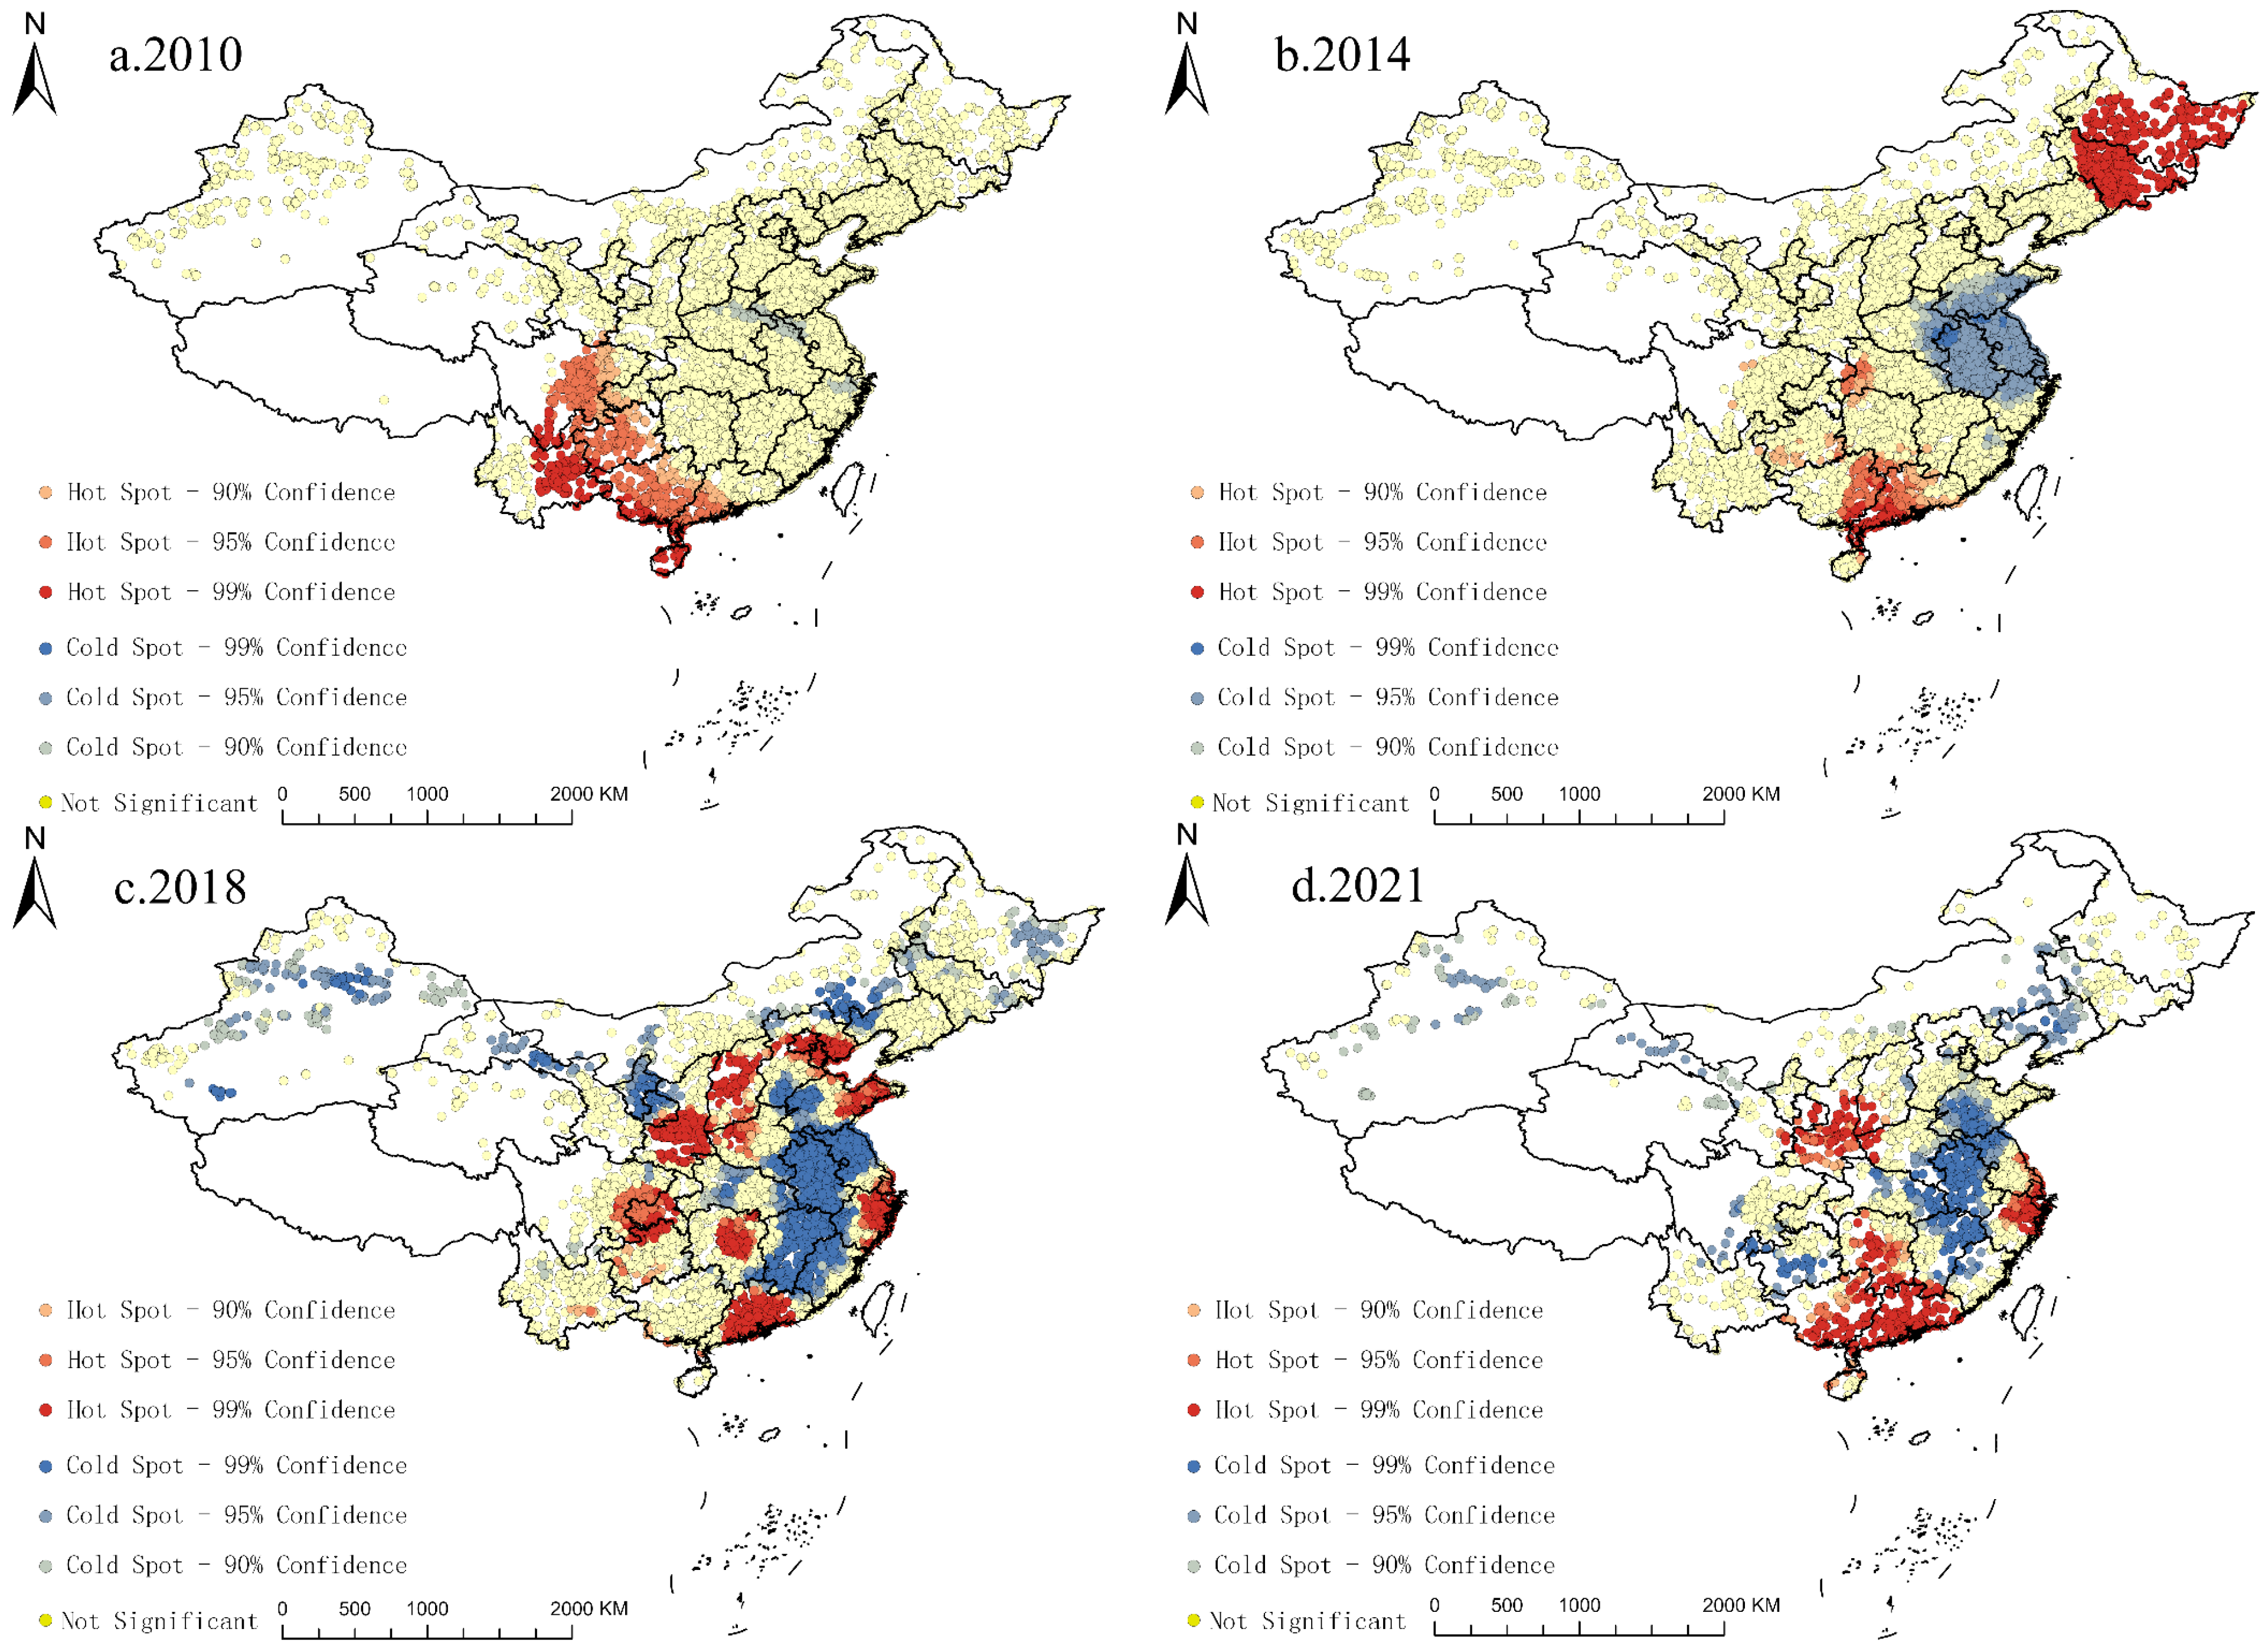
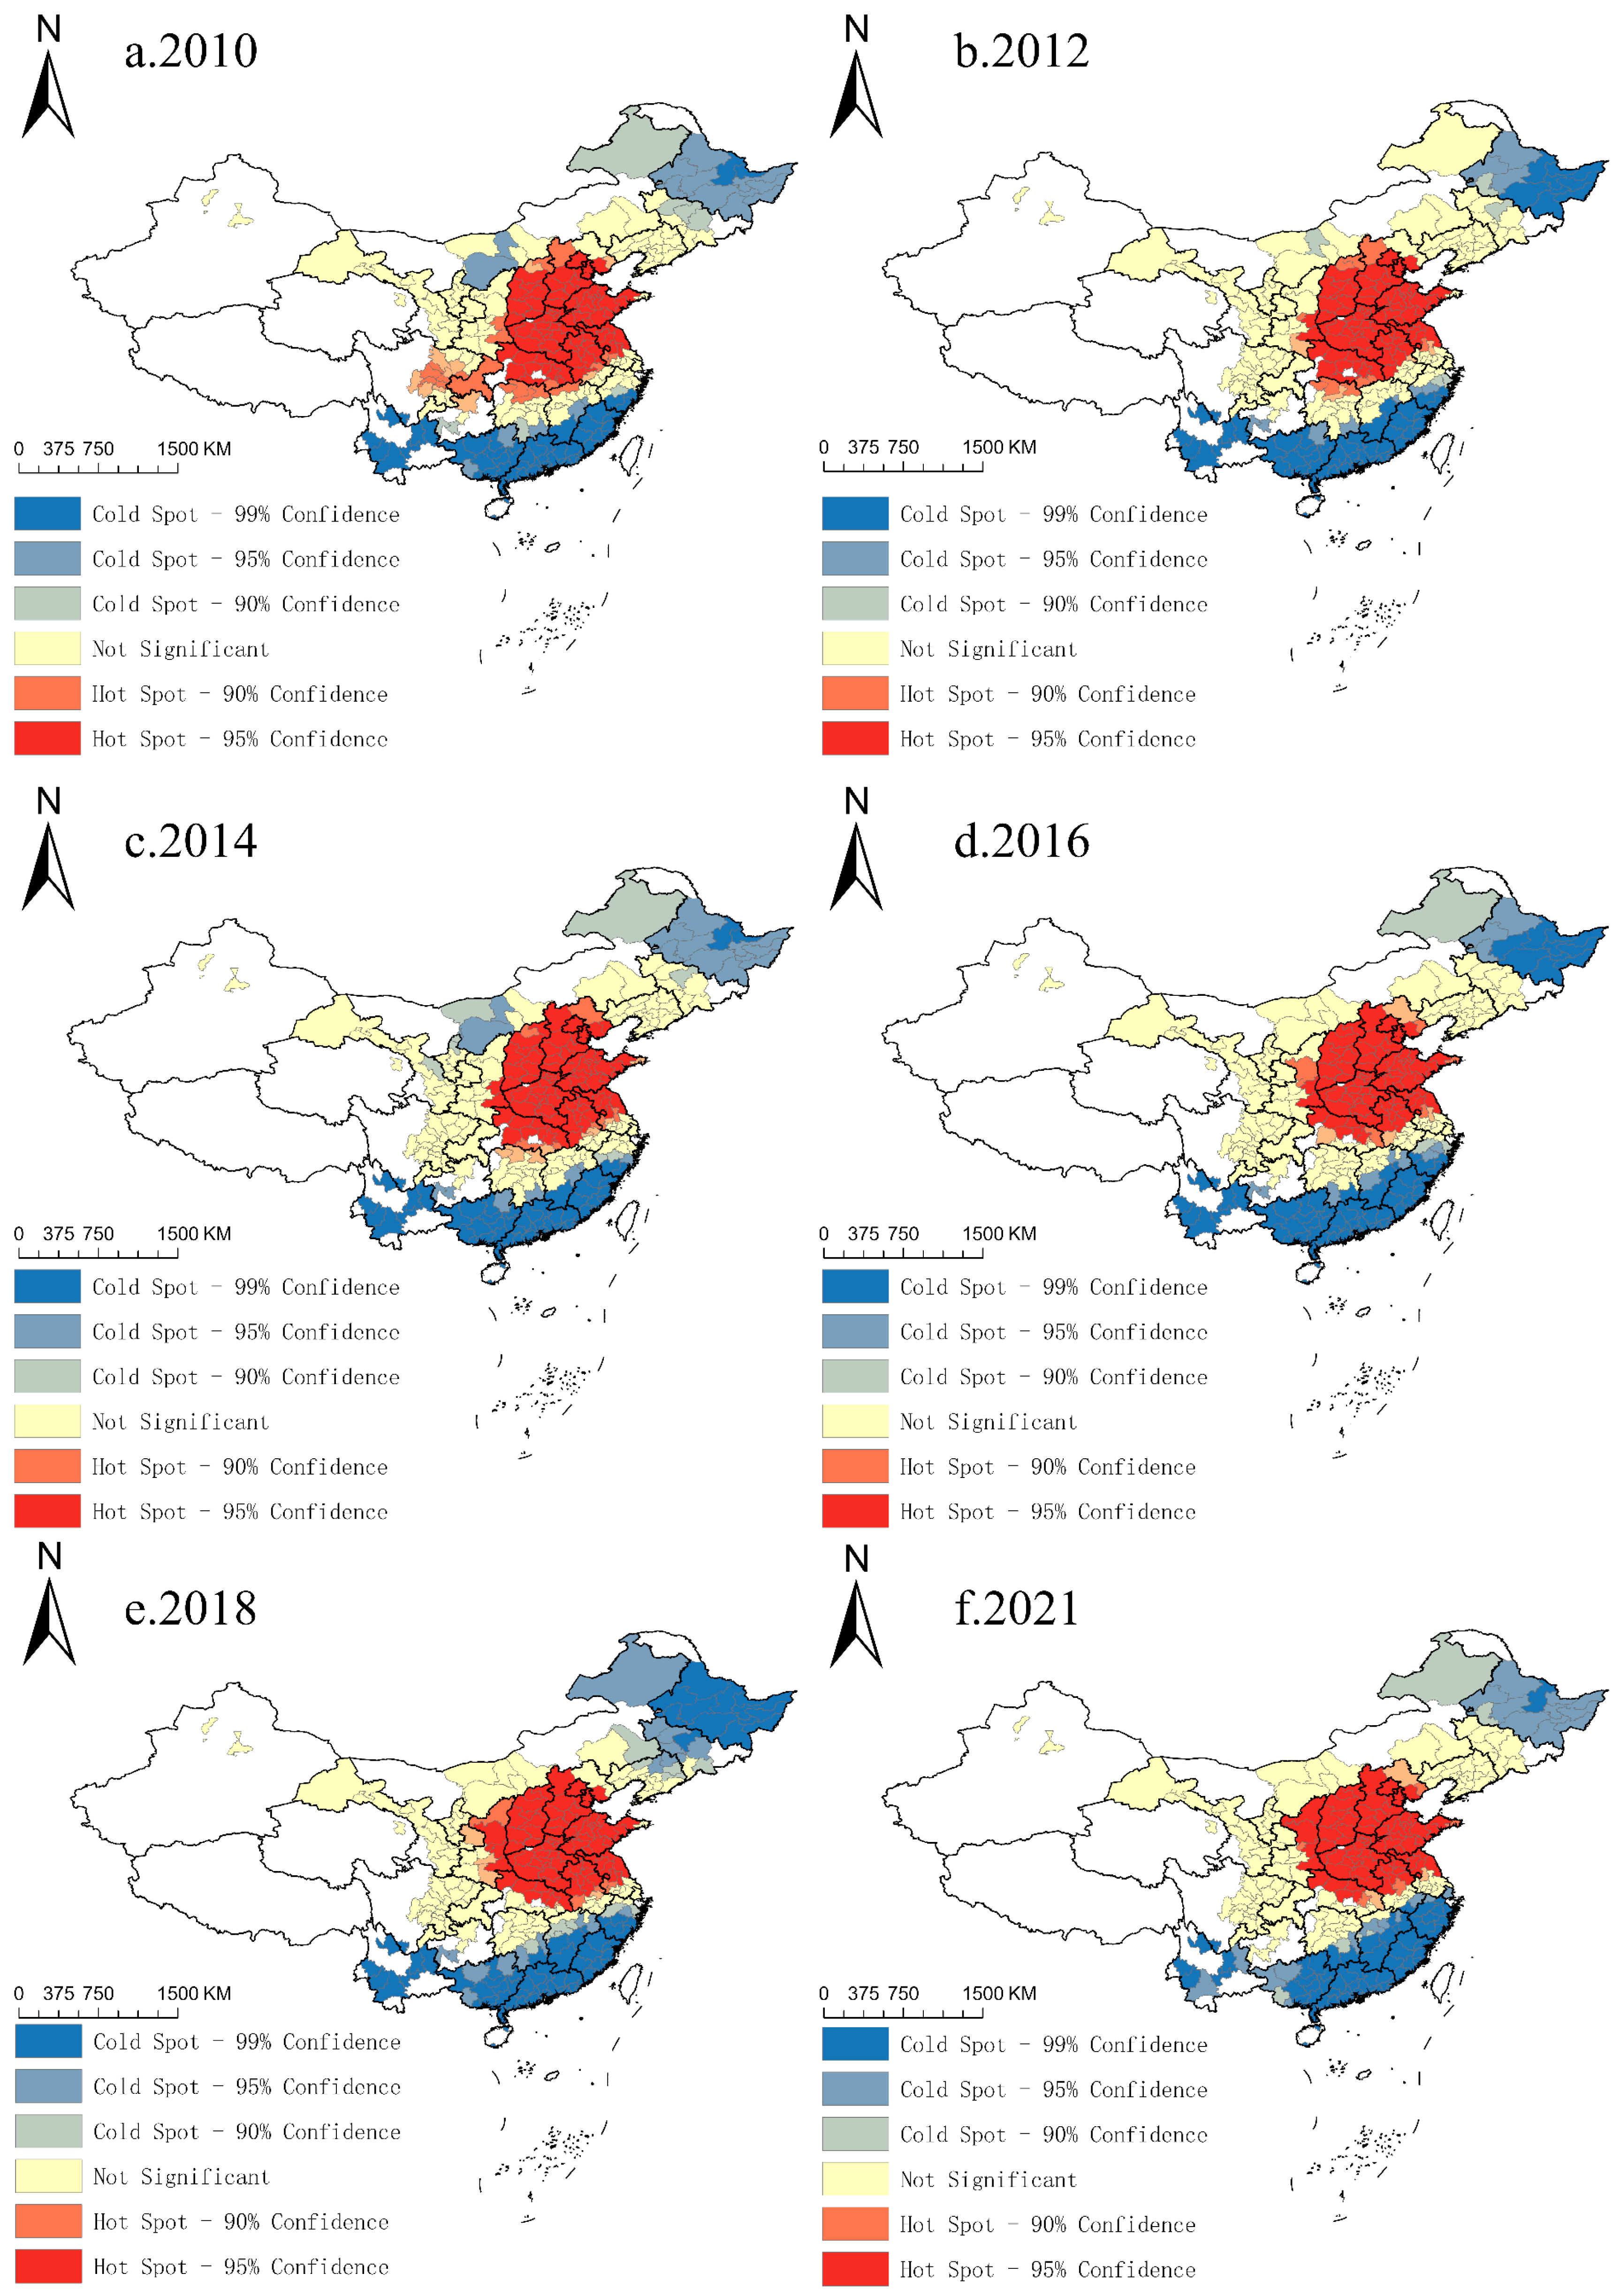
3.2.2. Characteristics of Spatial Heterogeneity
3.3. Analysis of the Impact of Industrial Land Development on PM2.5 Concentrations
3.3.1. Northeast Region
3.3.2. Central Region
3.3.3. Western Region
3.3.4. Eastern Region
3.3.5. Comparative Analysis
4. Discussion
4.1. Characterization of the Spatial and Temporal Distribution of Industrial Land Development and Analysis of the Impact of PM2.5
4.2. Limitations and Future Research Perspectives
4.3. Policy Implications
5. Conclusions
Author Contributions
Funding
Institutional Review Board Statement
Informed Consent Statement
Data Availability Statement
Conflicts of Interest
References
- Saini, P.; Sharma, M. Cause and Age-Specific Premature Mortality Attributable to PM2.5 Exposure: An Analysis for Million-Plus Indian Cities. Sci. Total Environ. 2020, 710, 135230. [Google Scholar] [CrossRef] [PubMed]
- Yang, M.; Liu, C.; Wang, X.H.; Liu, L.L.; Zhang, M.M.; Cao, S.S.; Yan, S.Z.; Sun, Z.Y.; Tian, C.G. Characteristics of Water-Soluble Ion Pollution in PM2.5 and the Causes of High Acidity of PM2.5 in Dalian. Huan Jing Ke Xue Huanjing Kexue 2024, 45, 5127–5139. [Google Scholar] [PubMed]
- Gupta, R. Temporal and Spatial Variations of Urban Heat Island Effect in Jaipur City Using Satellite Data. Environ. Urban. Asia 2012, 3, 359–374. [Google Scholar] [CrossRef]
- Liang, C.S.; Duan, F.K.; He, K.B.; Ma, Y.L. Review on Recent Progress in Observations, Source Identifications and Countermeasures of PM2.5. Environ. Int. 2016, 86, 150–170. [Google Scholar] [CrossRef]
- Wang, Y.; Gao, W.; Wang, S.; Song, T.; Gong, Z.; Ji, D.; Wang, L.; Liu, Z.; Tang, G.; Huo, Y.; et al. Contrasting Trends of PM2.5 and Surface-Ozone Concentrations in China from 2013 to 2017. Nat. Sci. Rev. 2020, 7, 1331–1339. [Google Scholar] [CrossRef]
- Yan, C.; Zheng, M.; Shen, G.; Cheng, Y.; Ma, S.; Sun, J.; Cui, M.; Zhang, F.; Han, Y.; Chen, Y. Characterization of Carbon Fractions in Carbonaceous Aerosols from Typical Fossil Fuel Combustion Sources. Fuel 2019, 254, 115620. [Google Scholar] [CrossRef]
- Zhao, Z.; Cao, J.; Zhang, T.; Shen, Z.; Ni, H.; Tian, J.; Wang, Q.; Liu, S.; Zhou, J.; Gu, J.; et al. Stable Carbon Isotopes and Levoglucosan for PM2.5 Elemental Carbon Source Apportionments in the Largest City of Northwest China. Atmos. Environ. 2018, 185, 253–261. [Google Scholar] [CrossRef]
- Xian, Y.; Zhang, Y.; Liu, Z.; Wang, H.; Xiong, T. Characterization of Winter PM2.5 Source Contributions and Impacts of Meteorological Conditions and Anthropogenic Emission Changes in the Sichuan Basin, 2002–2020. Sci. Total Environ. 2024, 947, 174557. [Google Scholar] [CrossRef]
- Lin, Z.; Fan, X.; Chen, G.; Hong, Y.; Li, M.; Xu, L.; Hu, B.; Yang, C.; Chen, Y.; Shao, Z.; et al. Sources Appointment and Health Risks of PM2.5-Bound Trace Elements in a Coastal City of Southeastern China. J. Environ. Sci. 2024, 138, 561–571. [Google Scholar] [CrossRef]
- Xie, W.; Gao, W.; Zhang, M. Has Land Resource Misallocation Increased Air Pollution in Chinese Cities? Environ. Sci. Pollut. Res. 2023, 30, 52702–52716. [Google Scholar] [CrossRef]
- Yuan, K.; Gan, C.; Yang, H.; Liu, Y.; Chen, Y.; Zhu, Q. Validation of the Ekc and Characteristics Decomposition between Construction Land Expansion and Carbon Emission: A Case Study of Wuhan City. China Land Sci. 2019, 33, 56–64. [Google Scholar]
- Wang, Q.; Wang, Y.; Chen, W.; Zhou, X.; Zhao, M.; Zhang, B. Do Land Price Variation and Environmental Regulation Improve Chemical Industrial Agglomeration? A Regional Analysis in China. Land Use Policy 2020, 94, 104568. [Google Scholar] [CrossRef]
- Lv, L.; Chen, Y.; Han, Y.; Cui, M.; Wei, P.; Zheng, M.; Hu, J. High-Time-Resolution PM2.5 Source Apportionment Based on Multi-Model with Organic Tracers in Beijing During Haze Episodes. Sci. Total Environ. 2021, 772, 144766. [Google Scholar] [CrossRef]
- Yan, R.H.; Peng, X.; Lin, W.; He, L.Y.; Wei, F.H.; Tang, M.X.; Huang, X.F. Trends and Challenges Regarding the Source-Specific Health Risk of PM2.5-Bound Metals in a Chinese Megacity from 2014 to 2020. Environ. Sci. Technol. 2022, 56, 6996–7005. [Google Scholar] [CrossRef]
- Liu, S.; Geng, G.; Xiao, Q.; Zheng, Y.; Liu, X.; Cheng, J.; Zhang, Q. Tracking Daily Concentrations of PM2.5 Chemical Composition in China since 2000. Environ. Sci. Technol. 2022, 56, 16517–16527. [Google Scholar] [CrossRef] [PubMed]
- Yang, H.; Yu, J.Z.; Ho, S.S.H.; Xu, J.; Wu, W.S.; Wan, C.H.; Wang, X.; Wang, X.; Wang, L. The Chemical Composition of Inorganic and Carbonaceous Materials in PM2.5 in Nanjing, China. Atmos. Environ. 2005, 39, 3735–3749. [Google Scholar] [CrossRef]
- Yan, J.W.; Tao, F.; Zhang, S.Q.; Lin, S.; Zhou, T. Spatiotemporal Distribution Characteristics and Driving Forces of PM2.5 in Three Urban Agglomerations of the Yangtze River Economic Belt. Int. J. Environ. Res. Public Health 2021, 18, 2222. [Google Scholar] [CrossRef] [PubMed]
- He, Q.; Zhang, M.; Song, Y.; Huang, B. Spatiotemporal Assessment of PM2.5 Concentrations and Exposure in China from 2013 to 2017 Using Satellite-Derived Data. J. Clean. Prod. 2021, 286, 124965. [Google Scholar] [CrossRef]
- Meng, X.; Liu, C.; Zhang, L.; Wang, W.; Stowell, J.; Kan, H.; Liu, Y. Estimating PM2.5 Concentrations in Northeastern China with Full Spatiotemporal Coverage, 2005–2016. Remote Sens. Environ. 2021, 253, 112203. [Google Scholar] [CrossRef]
- Xiao, Q.; Geng, G.; Cheng, J.; Liang, F.; Li, R.; Meng, X.; Xue, T.; Huang, X.; Kan, H.; Zhang, Q.; et al. Evaluation of Gap-Filling Approaches in Satellite-Based Daily PM2.5 Prediction Models. Atmos. Environ. 2021, 244, 117921. [Google Scholar] [CrossRef]
- Peng, J.; Han, H.; Yi, Y.; Huang, H.; Xie, L. Machine Learning and Deep Learning Modeling and Simulation for Predicting PM2.5 Concentrations. Chemosphere 2022, 308, 136353. [Google Scholar] [CrossRef] [PubMed]
- Cui, B.; Liu, M.; Li, S.; Jin, Z.; Zeng, Y.; Lin, X. Deep Learning Methods for Atmospheric PM2.5 Prediction: A Comparative Study of Transformer and Cnn-Lstm-Attention. Atmos. Pollut. Res. 2023, 14, 101833. [Google Scholar] [CrossRef]
- Tao, W.; Song, M.; Weng, S.; Chen, X.; Cui, L. Assessing the Impact of Environmental Regulation on Ecological Risk Induced by PM2.5 Pollution: Evidence from China. J. Clean. Prod. 2024, 451, 142029. [Google Scholar] [CrossRef]
- Liu, Z.; Fang, C.; Sun, B.; Liao, X. Governance Matters: Urban Expansion, Environmental Regulation, and PM2.5 Pollution. Sci. Total Environ. 2023, 876, 162788. [Google Scholar] [CrossRef]
- Yang, D.; Meng, F.; Liu, Y.; Dong, G.; Lu, D. Scale Effects and Regional Disparities of Land Use in Influencing PM2.5 Concentrations: A Case Study in the Zhengzhou Metropolitan Area, China. Land 2022, 11, 1538. [Google Scholar] [CrossRef]
- Li, Q.; Li, X.; Li, H. Factors Influencing PM2.5 Concentrations in the Beijing–Tianjin–Hebei Urban Agglomeration Using a Geographical and Temporal Weighted Regression Model. Atmosphere 2022, 13, 407. [Google Scholar] [CrossRef]
- Bi, S.; Dai, F.; Chen, M.; Xu, S. A New Framework for Analysis of the Morphological Spatial Patterns of Urban Green Space to Reduce PM2.5 Pollution: A Case Study in Wuhan, China. Sustain. Cities Soc. 2022, 82, 103900. [Google Scholar] [CrossRef]
- Liu, X. Impact of Urbanization on Energy Consumption and Haze in China-a Review. Energy Sources Part A Recovery Util. Environ. Eff. 2022, 44, 1959–1976. [Google Scholar] [CrossRef]
- Wang, L.; Sun, H.; Hu, X.; Leng, Z.; Zha, Z.; Zhang, Z.; Yang, J. Measurement of China’s Provincial Consumption-Based PM2.5 Emissions and Its Influencing Factors in the Perspective of Spatial Heterogeneity. J. Clean. Prod. 2021, 317, 128367. [Google Scholar] [CrossRef]
- Shi, T.; Zhang, W.; Zhou, Q.; Wang, K. Industrial Structure, Urban Governance and Haze Pollution: Spatiotemporal Evidence from China. Sci. Total Environ. 2020, 742, 139228. [Google Scholar] [CrossRef]
- Li, X.; Xu, Y.; Yao, X. Effects of Industrial Agglomeration on Haze Pollution: A Chinese City-Level Study. Energy Policy 2021, 148, 111928. [Google Scholar] [CrossRef]
- Lu, W.; Tam, V.W.; Du, L.; Chen, H. Impact of Industrial Agglomeration on Haze Pollution: New Evidence from Bohai Sea Economic Region in China. J. Clean. Prod. 2021, 280, 124414. [Google Scholar] [CrossRef]
- Sahoo, M.; Sethi, N. The Dynamic Impact of Urbanization, Structural Transformation, and Technological Innovation on Ecological Footprint and PM2.5: Evidence from Newly Industrialized Countries. Environ. Dev. Sustain. 2022, 24, 4244–4277. [Google Scholar] [CrossRef]
- Luo, X.; Sun, K.; Li, L.; Wu, S.; Yan, D.; Fu, X.; Luo, H. Impacts of Urbanization Process on PM2.5 Pollution in 2+ 26 Cities. J. Clean. Prod. 2021, 284, 124761. [Google Scholar] [CrossRef]
- Zhang, Z.; Zhou, T.G.; Zhou, Z.H.; Chang, Y. Multi-Scale Driving Mechanism of Urbanization on PM2.5 Concentration in Urban Agglomeration in the Middle Reaches of the Yangtze River. Huan Jing Ke Xue Huanjing Kexue 2024, 45, 1304–1314. [Google Scholar]
- Zhang, M.; Tan, S.; Pan, Z.; Hao, D.; Zhang, X.; Chen, Z. The Spatial Spillover Effect and Nonlinear Relationship Analysis between Land Resource Misallocation and Environmental Pollution: Evidence from China. J. Environ. Manag. 2022, 321, 115873. [Google Scholar] [CrossRef]
- Li, F.; Ma, R.; Du, M.; Ding, X.; Feng, J.; Jing, Y. The Impact of Land Resource Mismatch and Environmental Regulation on Carbon Emissions: Evidence from China. J. Environ. Plan. Manag. 2025, 68, 245–266. [Google Scholar] [CrossRef]
- Wang, Y.; Fan, J.; Liu, D.; Fu, J.; Ding, L.; Zhang, J. Air Pollution Outcomes, Land Misallocation, and the Transmission through Urban Sprawl. J. Environ. Manag. 2023, 345, 118730. [Google Scholar] [CrossRef]
- Pei, T.; Gao, L.; Yang, C.; Xu, C.; Tian, Y.; Song, W. The Impact of Fdi on Urban PM2.5 Pollution in China: The Mediating Effect of Industrial Structure Transformation. Int. J. Environ. Res. Public Health 2021, 18, 9107. [Google Scholar] [CrossRef]
- Yin, K.; Gu, H.; Huang, C. Fiscal Decentralization, Government Innovation Preference, and Haze Pollution. Environ. Sci. Pollut. Res. 2022, 29, 69818–69830. [Google Scholar] [CrossRef]
- Wang, F.; He, J.; Niu, Y. Role Foreign Direct Investment and Fiscal Decentralization on Urban Haze Pollution in China. J. Environ. Manag. 2022, 305, 114287. [Google Scholar] [CrossRef] [PubMed]
- Yang, X.; Wang, J.; Cao, J.; Ren, S.; Ran, Q.; Wu, H. The Spatial Spillover Effect of Urban Sprawl and Fiscal Decentralization on Air Pollution: Evidence from 269 Cities in China. Empir. Econ. 2021, 63, 847–875. [Google Scholar] [CrossRef]
- Li, J.; Jiao, L.; Li, R.; Zhu, J.; Zhang, P.; Guo, Y.; Lu, X. How Does Market-Oriented Allocation of Industrial Land Affect Carbon Emissions? Evidence from China. J. Environ. Manag. 2023, 342, 118288. [Google Scholar] [CrossRef] [PubMed]
- Tobler, W.R. A Computer Movie Simulating Urban Growth in the Detroit Region. Econ. Geogr. 1970, 46, 234–240. [Google Scholar] [CrossRef]
- Han, L.; Zhao, J.; Gao, Y.; Gu, Z.; Xin, K.; Zhang, J. Spatial Distribution Characteristics of PM2.5 and PM10 in Xi’an City Predicted by Land Use Regression Models. Sustain. Cities Soc. 2020, 61, 102329. [Google Scholar] [CrossRef]
- Huang, X.; Ye, Y.; Zhao, X.; Guo, X.; Ding, H. Identification and Stability Analysis of Critical Ecological Land: Case Study of a Hilly County in Southern China. Ecol. Indic. 2022, 141, 109091. [Google Scholar] [CrossRef]
- Xie, P.; Zhuo, L.; Yang, X.; Huang, H.; Gao, X.; Wu, P. Spatial-Temporal Variations in Blue and Green Water Resources, Water Footprints and Water Scarcities in a Large River Basin: A Case for the Yellow River Basin. J. Hydrol. 2020, 590, 125222. [Google Scholar] [CrossRef]
- Yang, Z.; Zhang, X.; Lei, J.; Duan, Z.; Li, J. Spatio-Temporal Pattern Characteristics of Relationship between Urbanization and Economic Development at County Level in China. Chin. Geogr. Sci. 2019, 29, 553–567. [Google Scholar] [CrossRef]
- Sun, H.; Chen, F. The Impact of Green Finance on China’s Regional Energy Consumption Structure Based on System Gmm. Resour. Policy 2022, 76, 102588. [Google Scholar] [CrossRef]
- Zhao, S.; Tian, H.; Luo, L.; Liu, H.; Wu, B.; Liu, S.; Bai, X.; Liu, W.; Liu, X.; Wu, Y.; et al. Temporal Variation Characteristics and Source Apportionment of Metal Elements in PM2.5 in Urban Beijing During 2018–2019. Environ. Pollut. 2021, 268, 115856. [Google Scholar] [CrossRef]
- Wu, Q.; Guo, R.; Luo, J.; Chen, C. Spatiotemporal Evolution and the Driving Factors of PM2.5 in Chinese Urban Agglomerations between 2000 and 2017. Ecol. Indic. 2021, 125, 107491. [Google Scholar] [CrossRef]
- GB3095-2012; Ambient Air Quality Standards. Ministry of Environmental Protection: Beijing, China, 2012.
- Liu, R.; Shao, M.; Wang, Q.G. Multi-Timescale Variation Characteristics of PM2.5 in Different Regions of China During 2014–2022. Sci. Total Environ. 2024, 920, 171008. [Google Scholar] [CrossRef] [PubMed]
- Wei, J.; Li, Z.; Lyapustin, A.; Sun, L.; Peng, Y.; Xue, W.; Su, T.; Cribb, M. Reconstructing 1-Km-Resolution High-Quality PM2.5 Data Records from 2000 to 2018 in China: Spatiotemporal Variations and Policy Implications. Remote Sens. Environ. 2021, 252, 112136. [Google Scholar] [CrossRef]


| Variable | Name | Calculation Method | Attributes | Data Source |
|---|---|---|---|---|
| Explanatory variable | PM2.5 concentration | Arcgis 10.5 Extraction | National Earth System Science Data Center (http://geodata.nnu.edu.cn/, accessed on 7 February 2025) | |
| Core explanatory variables | Transaction Frequency | Summarize and organize | + | China Land Market Network (https://www.landchina.com, accessed on 7 February 2025) |
| Transaction Area | Summarize and organize | + | ||
| Total Transaction Price | Summarize and organize | + | ||
| Gross Regional Product | Direct access | + | China City Statistical Yearbook and China Urban Construction Statistical Yearbook (https://data.cnki.net/yearBook, accessed on 7 February 2025) | |
| City Industrial Structure | Value Added of Secondary Industry/Value Added of Tertiary Industry | + | ||
| Public Fixed Asset Investment | Direct access | + | ||
| Control variable | Length of Road | Direct access | + | |
| Size of Built-up Area | Direct access | + | ||
| Local Financial Gap | (Current year’s fiscal revenue—Current year’s fiscal expenditure)/Per capita GDP of the previous year | + | ||
| Year-end Resident Population | Direct access | + |
| 2010 | 2012 | 2014 | 2016 | 2018 | 2021 | |
|---|---|---|---|---|---|---|
| M | 0.8733 | 0.9353 | 0.9017 | 0.9615 | 0.9802 | 0.9507 |
| P | 0.01 | 0.01 | 0.01 | 0.01 | 0.01 | 0.01 |
| Z | 47.9978 | 54.4117 | 49.5791 | 52.8516 | 53.8538 | 52.2478 |
| Year | 2010 | 2012 | 2014 | 2016 | 2018 | 2021 | ||||||
|---|---|---|---|---|---|---|---|---|---|---|---|---|
| B | t | B | t | B | t | B | t | B | t | B | t | |
| Constant | −0.246 | −0.108 | −1.853 | −0.705 | 0.19 | 0.1 | 2.039 *** | 3.106 | 2.256 *** | 5.328 | 2.921 *** | 7.902 |
| TF | 0.172 ** | 2.167 | 0.416 *** | 5.489 | 0.444 * | 1.856 | 0.136 * | 2.053 | 0.107 ** | 2.4 | 0.058 ** | 2.144 |
| TA | 1.168 *** | 5.448 | 0.742 *** | 3.146 | 1.143 ** | 2.137 | 0.268 ** | 2.447 | 0.184 ** | 2.574 | 0.415 *** | 2.87 |
| TTP | 0.227 * | 1.87 | 0.516 ** | 2.142 | 0.403 *** | 2.807 | 0.243 *** | 4.004 | 0.234 * | 2.041 | 0.209 *** | 3.382 |
| GDP | −0.494 *** | −3.497 | −0.992 | −1.384 | −0.35 ** | −2.243 | −0.234 *** | −4.036 | −0.215 ** | −2.648 | −0.362 *** | −3.975 |
| IND | −0.203 | −1.134 | −0.245 | −0.691 | −0.31 | −1.379 | −0.158 ** | −2.287 | −0.161 *** | −3.701 | −0.274 *** | −3.576 |
| FI | −0.118 | −0.709 | −0.122 | −0.917 | −0.289 *** | −3.188 | −0.145 *** | −2.855 | −0.135 ** | −2.491 | −0.071 *** | −3.571 |
| Road | −0.008 | −0.04 | −0.019 | −0.372 | −0.064 | −0.637 | −0.033 | −1.283 | −0.023 | −0.735 | −0.067 | −1.127 |
| UA | 0.024 | 0.188 | 0.052 | 0.348 | −0.054 | −0.354 | −0.018 | −0.663 | −0.004 | −0.22 | 0.011 | 0.381 |
| FG | 0.064 | 0.279 | 0.063 | 0.322 | 0.078 | 0.563 | 0.086 * | 1.724 | 0.022 | 0.313 | 0.024 | 1.385 |
| Pop | 0.433 | 0.599 | 0.149 | 0.768 | 0.575 | 1.588 | 0.125 | 1.338 | 0.103 * | 2.068 | 0.038 * | 1.921 |
| R2 | 0.933 | 0.873 | 0.846 | 0.841 | ||||||||
| R2adjust | 0.903 | 0.818 | 0.779 | 0.772 | ||||||||
| F | 31.826 | 15.852 | 12.632 | 12.166 | ||||||||
| Year | 2010 | 2012 | 2014 | 2016 | 2018 | 2021 | ||||||
|---|---|---|---|---|---|---|---|---|---|---|---|---|
| B | t | B | t | B | t | B | t | B | t | B | t | |
| Constant | 2.155 *** | 4.453 | 2.786 *** | 6.615 | 2.219 *** | 4.641 | 1.496 ** | 2.202 | 0.721 | 1.239 | 1.971 *** | 4.028 |
| TF | 0.183 *** | 3.871 | 0.093 *** | 3.242 | 0.129 ** | 2.442 | 0.141 ** | 2 | 0.282 *** | 3.427 | 0.068 * | 1.855 |
| TA | 0.191 *** | 3.192 | 0.149 *** | 3.555 | 0.81 *** | 5.334 | 0.225 ** | 2.494 | 0.34 ** | 2.575 | 0.391 *** | 3.629 |
| TTP | 0.284 *** | 3.496 | 0.123 *** | 2.724 | 0.236 *** | 3.551 | 0.168 ** | 2.601 | 0.313 *** | 4.617 | 0.262 *** | 4.999 |
| GDP | −0.054 | −0.777 | −0.121 *** | −5.37 | −0.456 *** | −4.32 | −0.107 | −1.439 | −0.244 ** | −2.307 | −0.02 | −0.537 |
| IND | −0.196 ** | −2.61 | −0.03 | −0.767 | −0.09 *** | −4.917 | −0.046 | −0.453 | −0.157 ** | −2.211 | −0.24 *** | −3.91 |
| FI | −0.022 | −0.437 | 0.002 | 0.028 | 0.105 ** | 2.61 | −0.125 | −1.262 | −0.098 | −1.531 | −0.216 ** | −2.623 |
| Road | 0.096 | 1.478 | 0.027 | 0.437 | 0.004 | 0.103 | −0.083 *** | −2.985 | −0.064 | −0.916 | −0.095 ** | −2.032 |
| UA | 0.012 | 0.409 | 0.035 | 0.756 | −0.376 *** | −4.571 | −0.038 | −0.872 | −0.042 | −0.709 | −0.029 | −0.545 |
| FG | −0.084 * | −1.993 | 0.129 | 1.577 | −0.043 | −0.775 | 0.061 | 1.064 | 0.019 | 0.847 | −0.028 | −1.224 |
| Pop | −0.073 *** | −3.789 | −0.086 | −1.335 | −0.061 | −1.045 | 0.175 * | 1.845 | 0.055 | 0.989 | 0.03 | 0.401 |
| R2 | 0.518 | 0.566 | 0.565 | 0.369 | 0.493 | 0.569 | ||||||
| R2adjust | 0.448 | 0.503 | 0.502 | 0.277 | 0.419 | 0.506 | ||||||
| F | 7.42 | 9.01 | 8.974 | 4.032 | 6.702 | 9.107 | ||||||
| Year | 2010 | 2012 | 2014 | 2016 | 2018 | 2021 | ||||||
|---|---|---|---|---|---|---|---|---|---|---|---|---|
| B | t | B | t | B | t | B | t | B | t | B | t | |
| Constant | −3.021 *** | −2.862 | −0.257 | −0.247 | −1.395 | −0.863 | −0.16 | −0.142 | 1.319 | 1.405 | 0.296 | 0.471 |
| TF | 0.317 * | 1.681 | 0.168 *** | 3.232 | 0.312 *** | 2.916 | 0.167 *** | 3.279 | 0.332 *** | 2.662 | 0.223 * | 1.867 |
| TA | 0.54 *** | 7.207 | 0.426 * | 1.811 | 0.615 *** | 3.845 | 0.618 *** | 2.96 | 0.768 *** | 5.262 | 0.569 *** | 6.35 |
| TTP | 0.406 *** | 3.176 | 0.242 *** | 2.733 | 0.577 * | 1.969 | 0.415 * | 1.681 | 0.515 ** | 2.248 | 0.295 *** | 3.286 |
| GDP | −0.559 ** | −2.441 | 0.128 | 1.131 | 0.145 | 0.366 | −0.186 | −1.55 | −0.214 * | −1.838 | 0.16 * | 1.698 |
| IND | −0.101 | −1.303 | −0.128 | 1.213 | −0.118 | −0.705 | −0.186 | −1.153 | −0.178 | −1.544 | −0.074 | −1.064 |
| FI | 0.061 * | 1.748 | −0.271 ** | −2.504 | −0.01 | −0.052 | −0.173 | −0.602 | −0.158 | −1.439 | 0.028 | 0.412 |
| Road | 0.085 * | 1.723 | −0.22 * | −1.82 | −0.003 | −0.033 | −0.061 | −0.528 | −0.035 | −0.765 | 0.029 | 0.914 |
| UA | 0.089 | 0.818 | −0.108 | −0.511 | 0.154 | 0.414 | 0.029 | 0.241 | 0.015 | 0.131 | 0.041 | 0.937 |
| FG | 0.174 | 1.414 | 0.141 * | 1.837 | 0.168 | 0.775 | 0.037 | 0.5 | 0.025 | 0.336 | 0.044 | 1.388 |
| Pop | 0.311 | 1.284 | 0.26 | 1.396 | 0.17 | 1.083 | 0.086 | 0.942 | 0.032 | 0.491 | 0.08 | 1.252 |
| R2 | 0.783 | 0.788 | 0.789 | 0.783 | 0.774 | 0.846 | ||||||
| R2adjust | 0.753 | 0.759 | 0.76 | 0.754 | 0.743 | 0.825 | ||||||
| F | 26.37 | 27.195 | 27.276 | 26.401 | 24.978 | 41.083 | ||||||
| Year | 2010 | 2012 | 2014 | 2016 | 2018 | 2021 | ||||||
|---|---|---|---|---|---|---|---|---|---|---|---|---|
| B | t | B | t | B | t | B | t | B | t | B | t | |
| Constant | −1.767 * | −1.963 | −0.361 ** | −2.237 | −0.308 | −1.582 | −2.191 * | −1.905 | 0.213 | 0.176 | −2.116 ** | −2.056 |
| TF | 0.393 *** | 3.784 | 0.301 *** | 3.53 | 0.177 *** | 2.927 | 0.214 *** | 3.327 | 0.114 ** | 2.339 | 0.108 ** | 2.044 |
| TA | 0.779 *** | 5.056 | 0.437 *** | 6.465 | 0.701 *** | 4.307 | 0.686 *** | 10.503 | 0.866 *** | 6.528 | 0.689 *** | 9.237 |
| TTP | 0.413 *** | 3.221 | 0.321 ** | 2.403 | 0.442 ** | 2.614 | 0.378 ** | 2.197 | 0.382 ** | 2.173 | 0.435 *** | 2.832 |
| GDP | −0.083 | −0.899 | −0.745 | −0.683 | −0.232 | −1.486 | 0.11 | 1.128 | −0.054 | −0.917 | 0.085 | 0.526 |
| IND | −0.015 | −0.581 | −0.036 | −0.373 | −0.174 | −1.196 | −0.152 | −0.962 | −0.348 ** | −2.072 | −0.103 | −0.552 |
| FI | −0.012 | −0.164 | −0.208 | −1.118 | −0.139 | −0.1 | −0.024 | −0.16 | −0.28 ** | −2.074 | −0.057 | −1.069 |
| Road | −0.002 | −0.059 | 0.019 | 0.609 | 0.006 | 0.144 | −0.009 | −0.248 | −0.163 | −1.043 | −0.044 | −0.369 |
| UA | 0.041 | 0.527 | 0.067 | 1.534 | 0.01 | 0.1 | 0.007 | 0.136 | 0.008 | 0.157 | 0.01 | 0.141 |
| FG | 0.047 | 0.468 | 0.15 | 1.219 | 0.035 | 0.299 | 0.028 | 0.202 | 0.03 | 0.144 | 0.08 | 0.412 |
| Pop | 0.21 | 1.54 | 0.2 | 1.275 | 0.154 | 0.795 | 0.173 | 1.45 | 0.221 | 1.419 | 0.29 | 1.428 |
| R2 | 0.812 | 0.821 | 0.806 | 0.875 | ||||||||
| R2adjust | 0.787 | 0.797 | 0.787 | 0.858 | ||||||||
| F | 32.383 | 34.442 | 31.256 | 52.306 | ||||||||
Disclaimer/Publisher’s Note: The statements, opinions and data contained in all publications are solely those of the individual author(s) and contributor(s) and not of MDPI and/or the editor(s). MDPI and/or the editor(s) disclaim responsibility for any injury to people or property resulting from any ideas, methods, instructions or products referred to in the content. |
© 2025 by the authors. Licensee MDPI, Basel, Switzerland. This article is an open access article distributed under the terms and conditions of the Creative Commons Attribution (CC BY) license (https://creativecommons.org/licenses/by/4.0/).
Share and Cite
Liu, Q.; Huang, W.; Wu, S.; Tian, L.; Ren, H. A Study of the Impact of Industrial Land Development on PM2.5 Concentrations in China. Sustainability 2025, 17, 5327. https://doi.org/10.3390/su17125327
Liu Q, Huang W, Wu S, Tian L, Ren H. A Study of the Impact of Industrial Land Development on PM2.5 Concentrations in China. Sustainability. 2025; 17(12):5327. https://doi.org/10.3390/su17125327
Chicago/Turabian StyleLiu, Qing, Weihao Huang, Shilong Wu, Lianghui Tian, and Hui Ren. 2025. "A Study of the Impact of Industrial Land Development on PM2.5 Concentrations in China" Sustainability 17, no. 12: 5327. https://doi.org/10.3390/su17125327
APA StyleLiu, Q., Huang, W., Wu, S., Tian, L., & Ren, H. (2025). A Study of the Impact of Industrial Land Development on PM2.5 Concentrations in China. Sustainability, 17(12), 5327. https://doi.org/10.3390/su17125327