Article

Habitat Suitability Dynamics of Yellow River Delta Nature Reserves for Rare Waterbirds

School of Ecological and Environmental Sciences, East China Normal University, Shanghai 200241, China
*
Authors to whom correspondence should be addressed.
Sustainability 2025, 17(12), 5326; https://doi.org/10.3390/su17125326 (registering DOI)
Submission received: 7 April 2025 / Revised: 25 May 2025 / Accepted: 1 June 2025 / Published: 9 June 2025

Abstract

:
Coastal wetland degradation continues to threaten the stability and ecological function of rare waterbird habitats, highlighting the need for a multi-species, long-term habitat assessment framework. This study examines the YRDNR using an integrated approach that combines MaxEnt and HSI models, high-resolution Land Use/Land Cover (LULC) data, and Fuzzy Comprehensive Evaluation to assess habitat dynamics for five rare waterbird species from 2005 to 2024. The key findings include the following: (1) The total wetland area first declined, then increased, with natural wetlands decreasing and artificial wetlands expanding. (2) Land Use/Land Cover (LULC) emerged as the primary factor influencing habitat suitability, with species-specific environmental responses. (3) Habitats for Ciconia boyciana, Larus saundersi, Grus japonensis, and Numenius madagascariensis declined and then recovered, while the Cygnus olor’s habitat steadily expanded. Habitat fragmentation increased for Larus saundersi and Numenius madagascariensis, while patch size and connectivity improved for Ciconia boyciana, Grus japonensis, and Cygnus olor. (4) Overall, the suitable habitat area of rare waterbird increased, accompanied by a structural shift from natural to artificial wetlands. The proposed framework supports the long-term monitoring and precise management of coastal wetlands, offering valuable insights for global waterbird conservation and sustainable wetland governance.

1. Introduction

Coastal wetlands, as vital ecosystems for the conservation of global biodiversity, play a crucial role in supporting migratory waterbird networks, regulating the climate, and purifying water bodies [1]. Waterbirds serve as sensitive indicators of wetland ecosystems’ health and are highly susceptible to habitat loss driven by ongoing anthropogenic exploitation and degradation [2,3]. Global studies have projected that, as a result of sea level rises and intensified human activity, between 20% and 90% of coastal wetlands may be lost by the end of this century [4,5]. Such losses would pose catastrophic risks to migratory waterbirds worldwide, particularly to rare and ecologically sensitive species, pushing them toward the brink of extinction. In response to these challenges, the 15th meeting of the Conference of the Parties to the Convention on Biological Diversity (COP15) adopted the Kunming-Montreal Global Biodiversity Framework in 2022. The framework emphasizes the restoration of at least 30% of degraded ecosystems by 2030, prioritizing coastal wetlands as key areas for intervention [6].
China has taken active steps to advance this conservation agenda [7]. Following the call for “strengthening the protection and restoration of wetlands” at the 19th CPC Congress, the National Development and Reform Commission and the Ministry of Natural Resources issued the “Master Plan for Major Projects of National Important Ecosystem Protection and Restoration (2021–2035)”. In parallel, the “Wetland Protection Law of the People’s Republic of China” was enacted in 2021, underscoring the urgent need for strengthened wetland governance. These national policy initiatives have driven significant advancements in scientific inquiry and practical strategies for coastal wetland conservation. Improved management of existing coastal wetlands can substantially enhance their capacity to support diverse waterbird communities, thereby promoting species stability and ecological resilience [8]. In this context, numerous studies have been conducted to investigate waterbird–habitat relationships, examining the spatiotemporal dynamics of wetland landscapes, environmental drivers, and avian populations [9,10,11]. Researchers have sought to elucidate the underlying mechanisms linking fluctuations in waterbird abundance to changes in environmental variables [12,13]. In addition, conservation strategies grounded in the concepts of focal species and umbrella species have been employed, whereby protecting key waterbird taxa may yield broader benefits for wetland ecosystems as a whole [14,15,16,17]. In recent years, increasing attention has been paid to the conservation of endangered and rare waterbirds and their habitats [18]. Compared to more widespread species, rare taxa such as G. japonensis and L. saundersi are acutely sensitive to habitat alterations and exhibit highly specific habitat preferences within wetland systems [19]. Therefore, identifying suitable habitats for these species can provide critical insights into their spatial distribution and support a targeted restoration of habitats.
With rapid advances in geospatial technologies (GIS, remote sensing, and GPS), habitat suitability assessments have progressed from qualitative descriptions to robust quantitative modeling. Techniques such as the Habitat Suitability Index (HSI), maximum entropy (MaxEnt), and Random Forest (RF) have been widely adopted for predicting bird species distributions and evaluating habitat quality [10,20,21]. Among them, species distribution models (SDMs) like MaxEnt, based on ecological niche theory, integrate species occurrence data with environmental variables to effectively simulate potential distribution patterns and quantify the contribution of each environmental factor [22]. The HSI model, relying on a GIS-based spatial analysis, offers a quantitative approach that does not require species occurrence data, making it particularly advantageous for long-term, temporally continuous habitat assessments [23]. In the context of rapid global environmental change, single-timepoint habitat evaluations are increasingly inadequate for informing habitat restoration or management. Consequently, the development of methodologies suitable for the analysis of long-term habitat dynamics has become a key research frontier [24,25]. Although several studies have explored long-term habitat simulations for wildlife using integrated modeling approaches [24], there remains a significant gap in research on the temporal evolution of suitable habitats for waterbirds, especially for rare and endangered species.
The Yellow River Delta Wetland, a core area of the newly established UNESCO World Natural Heritage Site (Migratory Bird Sanctuaries along the Coast of Yellow Sea-Bohai Gulf of China (Phase I)) designated in 2019, occupies a pivotal position along the East Asian–Australasian Flyway (EAAF). The region holds exceptional conservation value as a critical stopover site for migratory waterbirds [26]. In recent years, the establishment of protected areas and implementation of wetland restoration projects have markedly enhanced the ecological function in the region, creating favorable foraging habitats for rare waterbirds [27]. Since its inception as a World Heritage site, the state of habitat conservation in the Yellow River Delta has received increasing scrutiny. Nevertheless, studies indicate that climate change, seawater intrusion, coastal reclamation, and resource extraction have led to a marked contraction of natural wetland areas, degradation of ecological functions, and substantial loss of suitable habitat [28,29,30]. This underscores the urgent need for comprehensive data and scientifically informed spatial planning to guide the conservation of rare waterbirds and their habitats. Existing research has primarily focused on habitat selection for single species or on evaluating the significance of individual wetland patches [27]. However, integrated assessments of habitat suitability for multiple species, especially studies examining habitat structure and landscape configuration, remain limited and warrant further exploration.
To address these limitations, this study selected the Yellow River Delta Nature Reserve (YRDNR) as study area and five rare waterbird species as focal taxa. By integrating high-resolution Land Use/Land Cover (LULC) data with MaxEnt, HSI, and Fuzzy Comprehensive Evaluation models, we aim to (1) develop a multi-species, long-term dynamic habitat assessment framework combining MaxEnt and HSI models; (2) identify key environmental drivers influencing the potential distribution of the five focal species and analyze their spatial patterns and temporal dynamics; and (3) assess the evolutionary trends of suitable habitats for rare waterbirds in the study area. The findings are intended to inform fine-scale management strategies for coastal wetlands and promote synergistic conservation across multiple species. The technical framework of this study is illustrated in Figure 1.

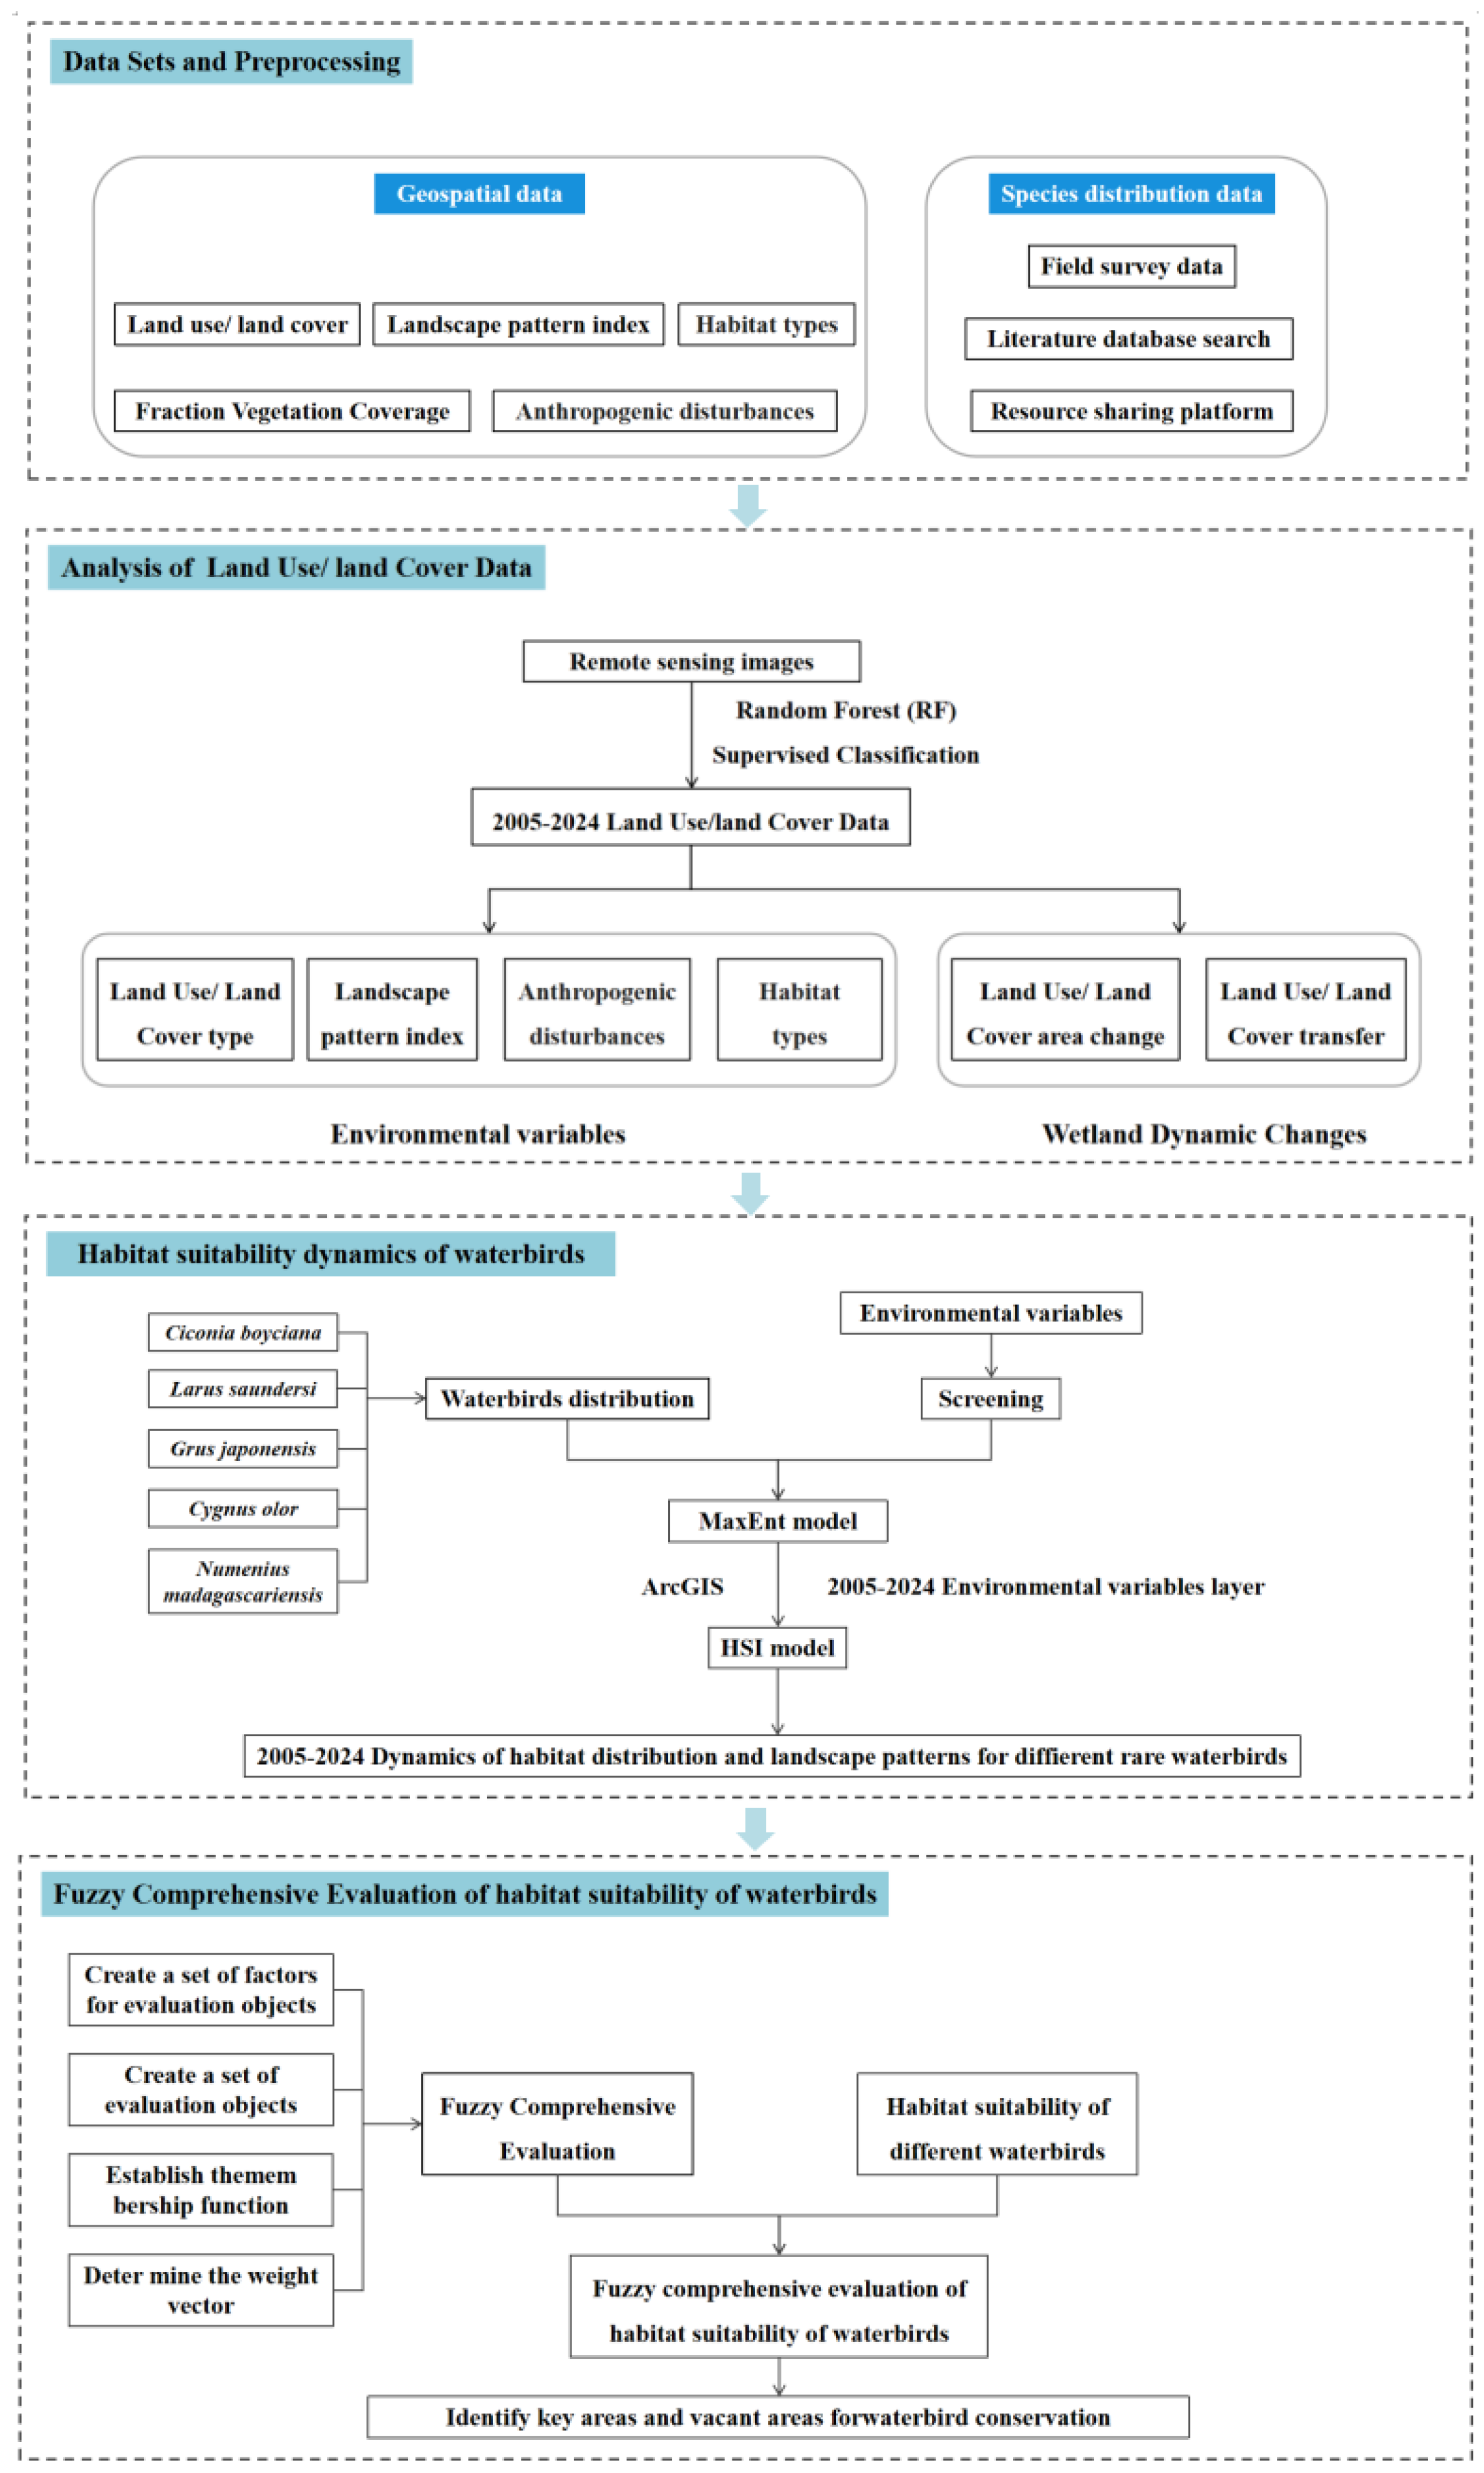
2. Materials and Methods
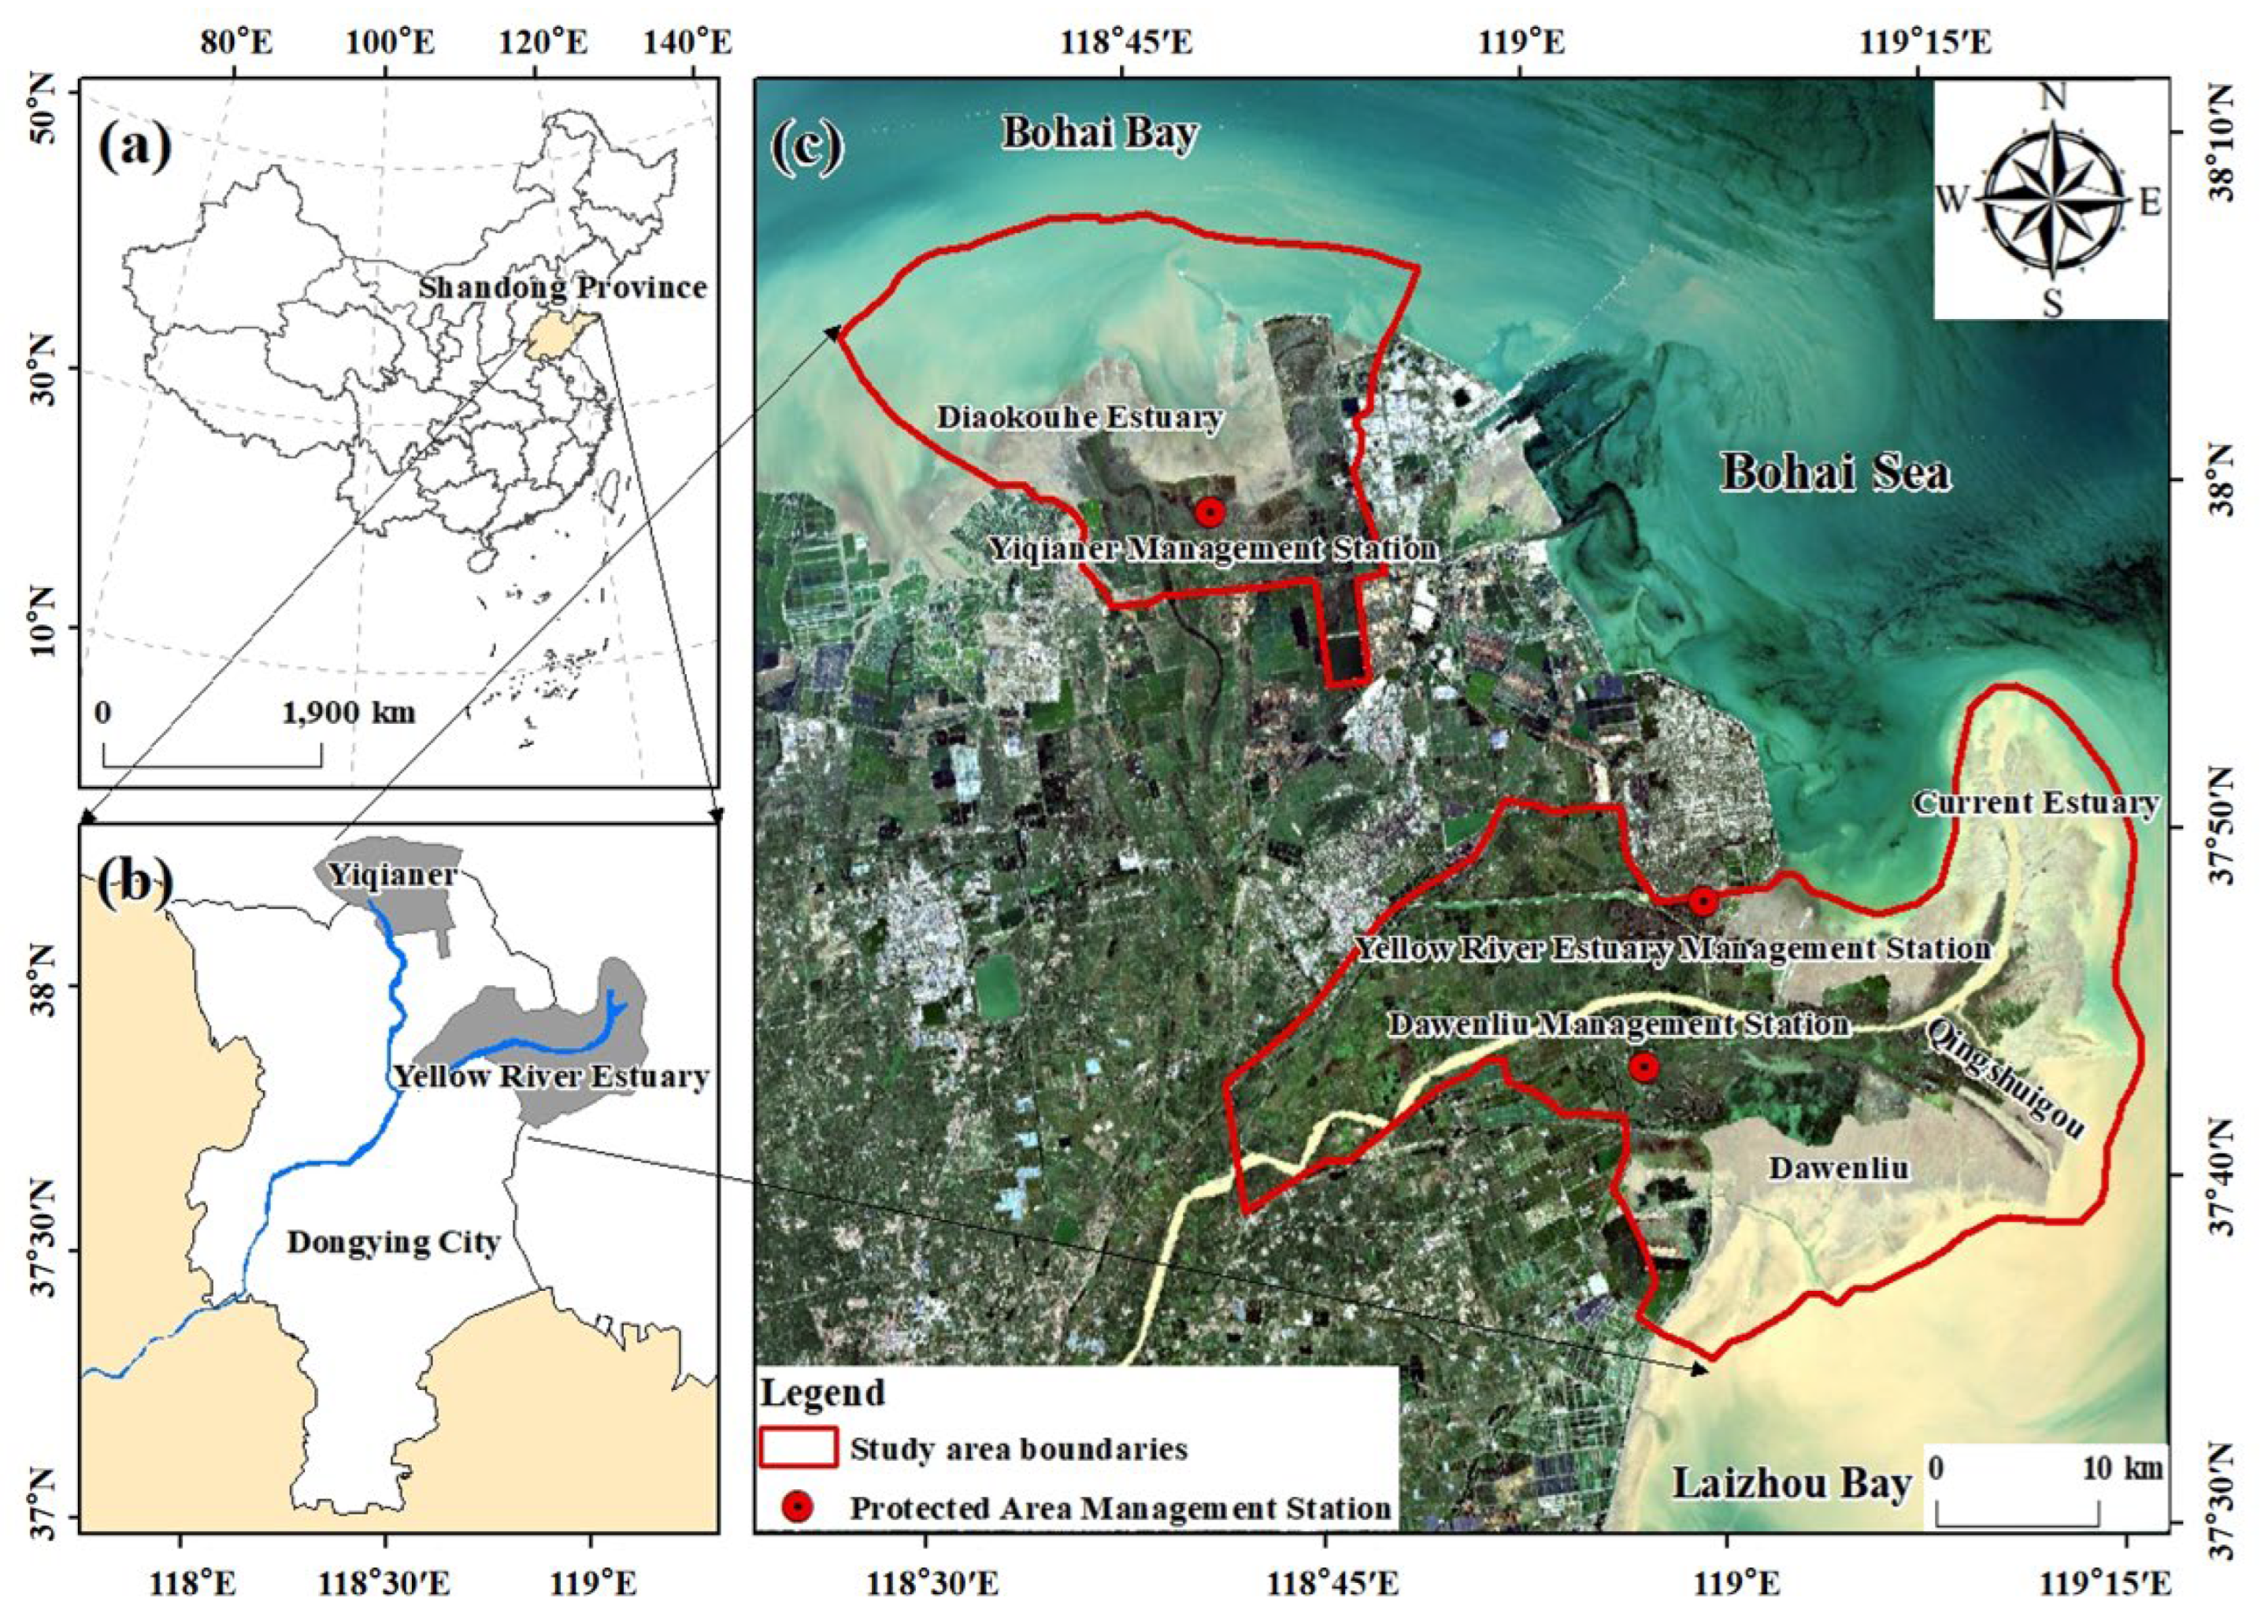
2.1. Study Area

The YRDNR (118°33′–119°20′ E, 37°35′–38°12′ N) is located on the Yellow River Estuary in Dongying, Shandong Province, China, bordered by Bohai Bay to the north and Laizhou Bay to the east (Figure 2). Established in 1992 to protect emergent estuarine wetlands and endangered bird species, the reserve spans approximately 1530 km2, making it the largest estuarine delta nature reserve in China [31]. The reserve comprises two sections: the northern Qianli Chuan area (485 km2) and the southern area, including the Yellow River Estuary and Dawenliu sub-reserves (1045 km2) [32]. The region experiences a warm-temperate, semi-humid monsoon climate, with mean annual temperatures of 11.7–12.5 °C and an annual precipitation of 537–630 mm. Influenced by both fluvial and marine dynamics, the landscape features diverse wetland types, including salt marshes and tidal flats. The reserve supports a high biodiversity, with 1632 recorded animal species, 685 plant species, and 373 bird species [33,34]. Native vegetation includes Phragmites australis, Tamarix chinensis, and Suaeda salsa, while Spartina alterniflora is a prominent invasive species [35,36]. It serves as a key stopover and wintering site for rare and threatened birds such as C. boyciana and G. japonensis. Avian abundance during migration and overwintering periods can reach several million individuals [37], underscoring the reserve’s global significance for biodiversity conservation.

2.2. Data and Methods

2.2.1. Target Species Selection

To ensure the scientific validity and representativeness of the species selection, this study systematically identified five rare waterbird species as target taxa based on multiple criteria, including conservation/threat status, regional distribution patterns, ecological indicator value, and data availability. The selection was guided by multi-source data and authoritative species lists, and it was carried out according to the following criteria:

Conservation Status and International Concern

Priority was given to species meeting the 1% population threshold—defined as a species whose count at a given wetland reaches or exceeds 1% of its flyway or global population—and those listed as Endangered (EN), Vulnerable (VU), or Near Threatened (NT) in the IUCN Red List of Threatened Species (2023) [38], as well as species included in the List of National Key Protected Wild Animals of China (2021) [39] and the China Biodiversity Red List—Vertebrates (2021) [40]. Eligible species fall under China’s Class I or II national protection categories.

Regional Distribution and Occurrence Frequency

Based on field survey data collected from March 2023 to March 2024, as well as historical monitoring reports and the published literature from the YRDNR [41,42,43], priority was given to species with a wide distribution, high observation frequency, stable habitat use, and well-documented historical records within the study area. Observation records of these species are provided in Table S1.

Ecological Function and Indicator Potential

Drawing on Lambeck’s focal species concept [44] and the umbrella species framework proposed by Roberge and Angelstam [45], priority was given to species that are sensitive to habitat change and capable of indicating ecosystems’ health. These species represent different habitat types within the YRDNR—such as Phragmites marshes, tidal flats, paddy fields, and pond wetlands—and reflect varying ecological functional requirements. As such, they serve as effective indicators of habitat change and ecosystem stability.

Ecological Niche Complementarity and Representativeness

To comprehensively reflect the heterogeneity of regional habitats and the complexity of the ecosystem, species were selected based on both migratory and resident characteristics. This included typical migratory waterbirds with marked population fluctuations, as well as dominant resident species with stable populations and broad distribution within the study area. This classification approach aims to capture both short-term responses to habitat change and long-term indicators of ecosystem stability.
Based on these criteria, five rare waterbird species were selected as target taxa: C. boyciana, L. saundersi, G. japonensis, C. olor, and N. madagascariensis. Detailed descriptions are provided in Table 1.

2.2.2. Data Sources and Processing

Species Distribution Data

Species occurrence data for this study were obtained through a combination of field surveys, open-access biodiversity databases—including the Global Biodiversity Information Facility (GBIF) http://www.gbif.org/ (accessed on 1 October 2024), the China Bird Report Center http://www.birdreport.cn/ (accessed on 28 September 2024), and eBird https://ebird.org/ (accessed on 3 October 2024) and a review of the relevant literature. Only records from 2015 to 2024 with clearly defined geographic coordinates and observation dates were retained, to ensure spatial and temporal consistency. The geographic coordinates of distribution points were georeferenced using the Chinese Satellite Map System and GIS tools. Field surveys were conducted from March 2023 to March 2024 using a combination of line transect and fixed-point observation methods, during clear weather and peak waterbird activity periods (08:00–11:00 and 14:00–17:00). A total of eight transects were established, covering all accessible areas within the Yellow River Delta National Nature Reserve. Each transect exceeded 1 km in length (Table S2). Surveys were conducted on foot or by slowly moving vehicles. Upon detecting waterbirds, observers halted movement and used Leica APO-Televid 82 spotting scopes and Zeiss Victory SF 10 × 42 binoculars for detailed observation, supplemented by telephoto photography to ensure accurate species identification and the data’s completeness. The exact location of each observation point was recorded using a Garmin GPSMAP 66i handheld GPS device. At each point, bird species, abundance, and habitat type within a 100 m radius were recorded. Species identification was primarily based on Birds of the Yellow River Delta [46] and the Field Guide to the Birds of China [47], and further validated using the eBird database. Direct counts were used for individual species, while flock estimation methods were employed for large aggregations [48]. To avoid double-counting, only individuals entering the field of view or flying toward the rear of the transect were recorded; birds startled from ahead of the transect were excluded. In cases where large flocks took flight suddenly, high-resolution telephoto images were used to aid in estimating numbers, thereby enhancing the data’s accuracy and reliability.
To reduce any potential spatial bias caused by species clustering, all field and historical data were integrated and processed in ArcGIS 10.8. The coordinate system was set to WGS_1984_UTM_Zone_50N. Using the Buffer tool, occurrence points of the same species within a 100 m radius were merged. A total of 510 occurrence points for the five target waterbird species were obtained: 132 for C. boyciana, 129 for L. saundersi, 106 for G. japonensis, 78 for C. olor, and 65 for N. madagascariensis (Figure S1).

Environmental Variable Data

Drawing on previous studies of C. boyciana and other species [27,37,49,50], and considering the habitat requirements of the five target species alongside field observations, this study selected five categories of environmental variables to evaluate habitat suitability for rare waterbirds in the study area. These included Land Use/Land Cover types, landscape metrics, vegetation coverage, and others (Table 2). (1) Land Use/Land Cover (LULC) Types: Data acquisition, preprocessing, and image classification were conducted using the Google Earth Engine (GEE) cloud platform https://code.earthengine.google.com/ (accessed on 1 September 2024). Time-series satellite images were obtained for the periods April–October in 2005, 2010, 2015, 2020, and 2024, using Landsat 5 TM, Landsat 8 OLI, and Landsat 9 OLI imagery with a spatial resolution of 30 m. Cloud masking was performed using the QA60 band, and images were clipped accordingly. Training samples were selected based on field surveys and Google Earth imagery, and land cover classification was conducted using the Random Forest (RF) algorithm. To avoid overfitting, stratified random sampling was applied: 70% of the samples were used as the training set and 30% as the test set. Based on the Ramsar Convention, the wetland characteristics of the study area, the habitat preferences of the waterbirds, and previous research [27,51], a hierarchical classification scheme was developed, consisting of 3 primary and 13 secondary wetland classes (Table 3). The overall classification accuracy exceeded 90%, and all Kappa coefficients were ≥0.85. (2) Landscape Pattern Indices: Using Fragstats 4.2, landscape indices were calculated with a moving window method (radius 100 m). The selected indices included the percentage of landscape (PLAND) for each LULC type, Shannon’s Diversity Index (SHDI), and the Contagion Index (CONTAG). (3) Habitat Selection Variables: Based on the LULC classification results, habitat elements such as LULC types, coastlines, and water bodies were extracted. Euclidean distances to these features were calculated in ArcGIS 10.8. (4) Vegetation Coverage: Normalized Difference Vegetation Index (NDVI) values for the period 2005–2024 were computed from the selected satellite imagery. Fractional vegetation cover (FVC) was estimated using the pixel dichotomy model. (5) Human Disturbance Variables: Human disturbance factors included proximity to roads and industrial/mining infrastructure. Road distance was calculated using national road vector data from the National Geographic Information Resource Directory Service System http://www.webmap.cn/ (accessed on 20 September 2024). Distances to industrial/mining areas were derived from the LULC classification.
To prevent overfitting due to multicollinearity among environmental variables [52], a two-step screening process was employed. Firstly, variables with a Pearson correlation coefficient > 0.8 were filtered, with preference given to those with higher relative contributions. Secondly, the retained variables were input into the MaxEnt model alongside distribution data for the indicator species. The model’s preliminary percentage contributions and Jackknife analysis results were used to eliminate variables contributing less than 1.0%. In cases of highly correlated pairs (r > 0.8), the variable with a higher training gain was retained. The final set of habitat variables used for each indicator species is listed in Table 4. All spatial data were imported into ArcGIS 10.8, with coordinate systems standardized to WGS_1984_UTM_Zone_50N and spatial resolution set to 30 m × 30 m. All environmental layers were converted to ASCII format for model input.

2.2.3. Research Methods

Habitat Suitability Analysis

The MaxEnt model, grounded in the principle of maximum entropy, predicts the potential distribution of species based on known occurrence points and environmental variables [53]. By contrasting environmental characteristics at presence sites with those at background locations, the model identifies the optimal environmental conditions associated with species’ presence, thereby inferring the most probable distribution of suitable habitat for the target species [54]. The model’s performance was assessed using the Area Under the Receiver Operating Characteristic Curve (AUC), with values ranging from 0 to 1. AUC scores were interpreted as follows: 0.5–0.6 (unsatisfactory), 0.6–0.7 (poor), 0.7–0.8 (fair), 0.8–0.9 (good), and 0.9–1.0 (excellent) [55]. Habitat variables and occurrence data for the target species were input into the MaxEnt model, with 75% of the data used for training and 25% for testing. The model was run 10 times, following parameter settings based on the relevant literature. Outputs were generated in logistic format, with AUC values used as the primary metric of the model’s accuracy [27]. Following established studies [27,49] and field-based assessments of avian habitat use, the natural breaks method was used to classify habitat suitability into four categories: Mostly Suitable Habitat, Moderately Suitable Habitat, Poorly Suitable Habitat, and Unsuitable Habitat.
Due to temporal and spatial limitations in monitoring species activity, historical distribution data were unavailable. Thus, the study used environmental variables from the years 2005, 2010, 2015, 2020, and 2024 to examine temporal changes in habitat suitability. Suitability thresholds for each habitat category were determined based on MaxEnt response curves and model outputs, and variables were further classified and weighted accordingly. All environmental layers were integrated to compute habitat suitability scores for each year using the Habitat Suitability Index (HSI), defined as
H S I = i = 1 n w i f i
In the formula, f i represents the i -th evaluation factor, w i denotes the weight of the i -th factor, and n is the total number of evaluation factors.
After computing habitat suitability scores, areas classified as Mostly Suitable Habitat, Moderately Suitable Habitat and Poorly Suitable Habitat were collectively defined as Suitable Habitat for further analysis. The number of pixels in each suitability class was calculated to quantify spatial distribution patterns across suitability levels.

Habitat Landscape Pattern Analysis

To comprehensively assess the landscape pattern characteristics and temporal dynamics of suitable habitats for the target bird species, we employed Fragstats 4.2 to calculate landscape metrics for areas classified as Highly Suitable Habitat (including both Mostly Suitable Habitat and Moderately Suitable Habitat). To evaluate habitat fragmentation and aggregation, the following metrics were selected: Number of Patches (NP), Patch Density (PD), Largest Patch Index (LPI), and Mean Patch Area (AREA_MN). To analyze habitat complexity and landscape diversity, we further examined the Area-weighted Fractal Dimension (FRAC_AM), Contagion Index (CONTAG), Landscape Shape Index (LSI), Shannon’s Diversity Index (SHDI), and Shannon’s Evenness Index (SHEI).

Fuzzy Comprehensive Evaluation Method

The Fuzzy Comprehensive Evaluation (FCE) method is derived from the fuzzy set theory proposed by L.A. Zadeh [56]. Based on the concept of membership functions in fuzzy mathematics, this method transforms qualitative assessments into quantitative evaluations [57]. It is particularly effective in reducing subjective bias in assessments and in providing more precise judgments for phenomena characterized by uncertainty or vagueness [58]. In this study, the FCE method was applied to comprehensively assess the habitat suitability of rare waterbirds in the study area. The procedure consisted of the following steps: (1) Establishment of the Evaluation Index Set: Five rare waterbird species C. boyciana, L. saundersi, G. japonensis, C. olor, and N. madagascariensis were selected for evaluation. Habitat suitability values for these species were used as the evaluation indicators, denoted as U = {µ1, µ2, µ3, µ4, µ5}. (2) Determination of Evaluation Grades: Evaluation grades were defined based on the four habitat suitability levels established earlier. Accordingly, the grade set was defined as V = {V1, V2, V3, V4}, corresponding to Unsuitable Habitat, Poorly Suitable Habitat, Moderately Suitable Habitat, and Mostly Suitable Habitat. (3) Establishment of Membership Functions: Determining membership is a critical step in FCE [59]. This study employed trapezoidal membership functions corresponding to the four habitat suitability grades. Let rmn denote the degree of membership of the m-th species for the n-th grade, where m = {1, 2, 3, 4, 5} represents the five species, and n = {1, 2, 3, 4} denotes the four habitat categories. The calculation formula is below:
μ V 1 u i = 1 u i a 1 , u i a 2 a 2 u i < a 1 , a 1 a 2 O t h e r s
μ V 2 u i = a 1 u i a 1 a 2 a 2 u i < a 1 , 1 a 3 u i < a 2 , u i a 3 a 2 a 3 a 3 u i < a 2 , 0 O t h e r s
μ V 3 u i = a 2 u i a 2 a 3 a 3 u i < a 2 , 1 a 4 u i < a 3 , u i a 4 a 3 a 4 a 4 u i < a 3 , 0 O t h e r s
μ V 4 u i = a 3 u i a 3 a 4 a 4 u i < a 3 , 1 u i < a 4 , 0 O t h e r s
The breakpoints a 1 , a 2 , a 3 , a 4 define the thresholds between habitat categories, with a 1 < a 2 < a 3 < a 4 . Suitability values were segmented accordingly, and the minimum value of the standard deviation and mean from each raster layer was used to define the interval width Δ (Table 5).
(4) Determination of Weight Vector: Weights were determined based on prior studies [57], expert consultation, and the specific ecological context of the study area. A multi-tiered evaluation index system (Table S3) was constructed, and an analytic hierarchy process (AHP) was employed to form a judgment matrix. Pairwise comparisons were conducted to evaluate the relative importance of each Land Use/Land Cover type for each species, as well as the relative conservation priority among species. Final weights were derived and are presented in Table 6. (5) Fuzzy Comprehensive Evaluation: Using the Raster Calculator tool in ArcGIS 10.8, each indicator’s membership function under different grade standards was calculated and processed. A weighted overlay analysis was then performed to generate membership maps for each grade. Following the principle of maximum membership, the highest membership value and corresponding grade were assigned to each raster cell, producing a spatial map of fuzzy comprehensive habitat suitability for rare waterbirds across the study area.

3. Results

3.1. Overview of Waterbirds in the Study Area

A total of 29,305 individual waterbird observations were recorded within the study area, encompassing 78 species across 14 families and 7 orders (Table S1). Among these, five target species accounted for 502 occurrence points and 2780 individual records. Specifically, 469 individuals of C. boyciana were recorded at 156 locations; 2057 individuals of L. saundersi at 106 locations; 102 individuals of G. japonensis at 91 locations; 76 individuals of C. olor at 70 locations; and 76 individuals of N. madagascariensis at 68 locations.

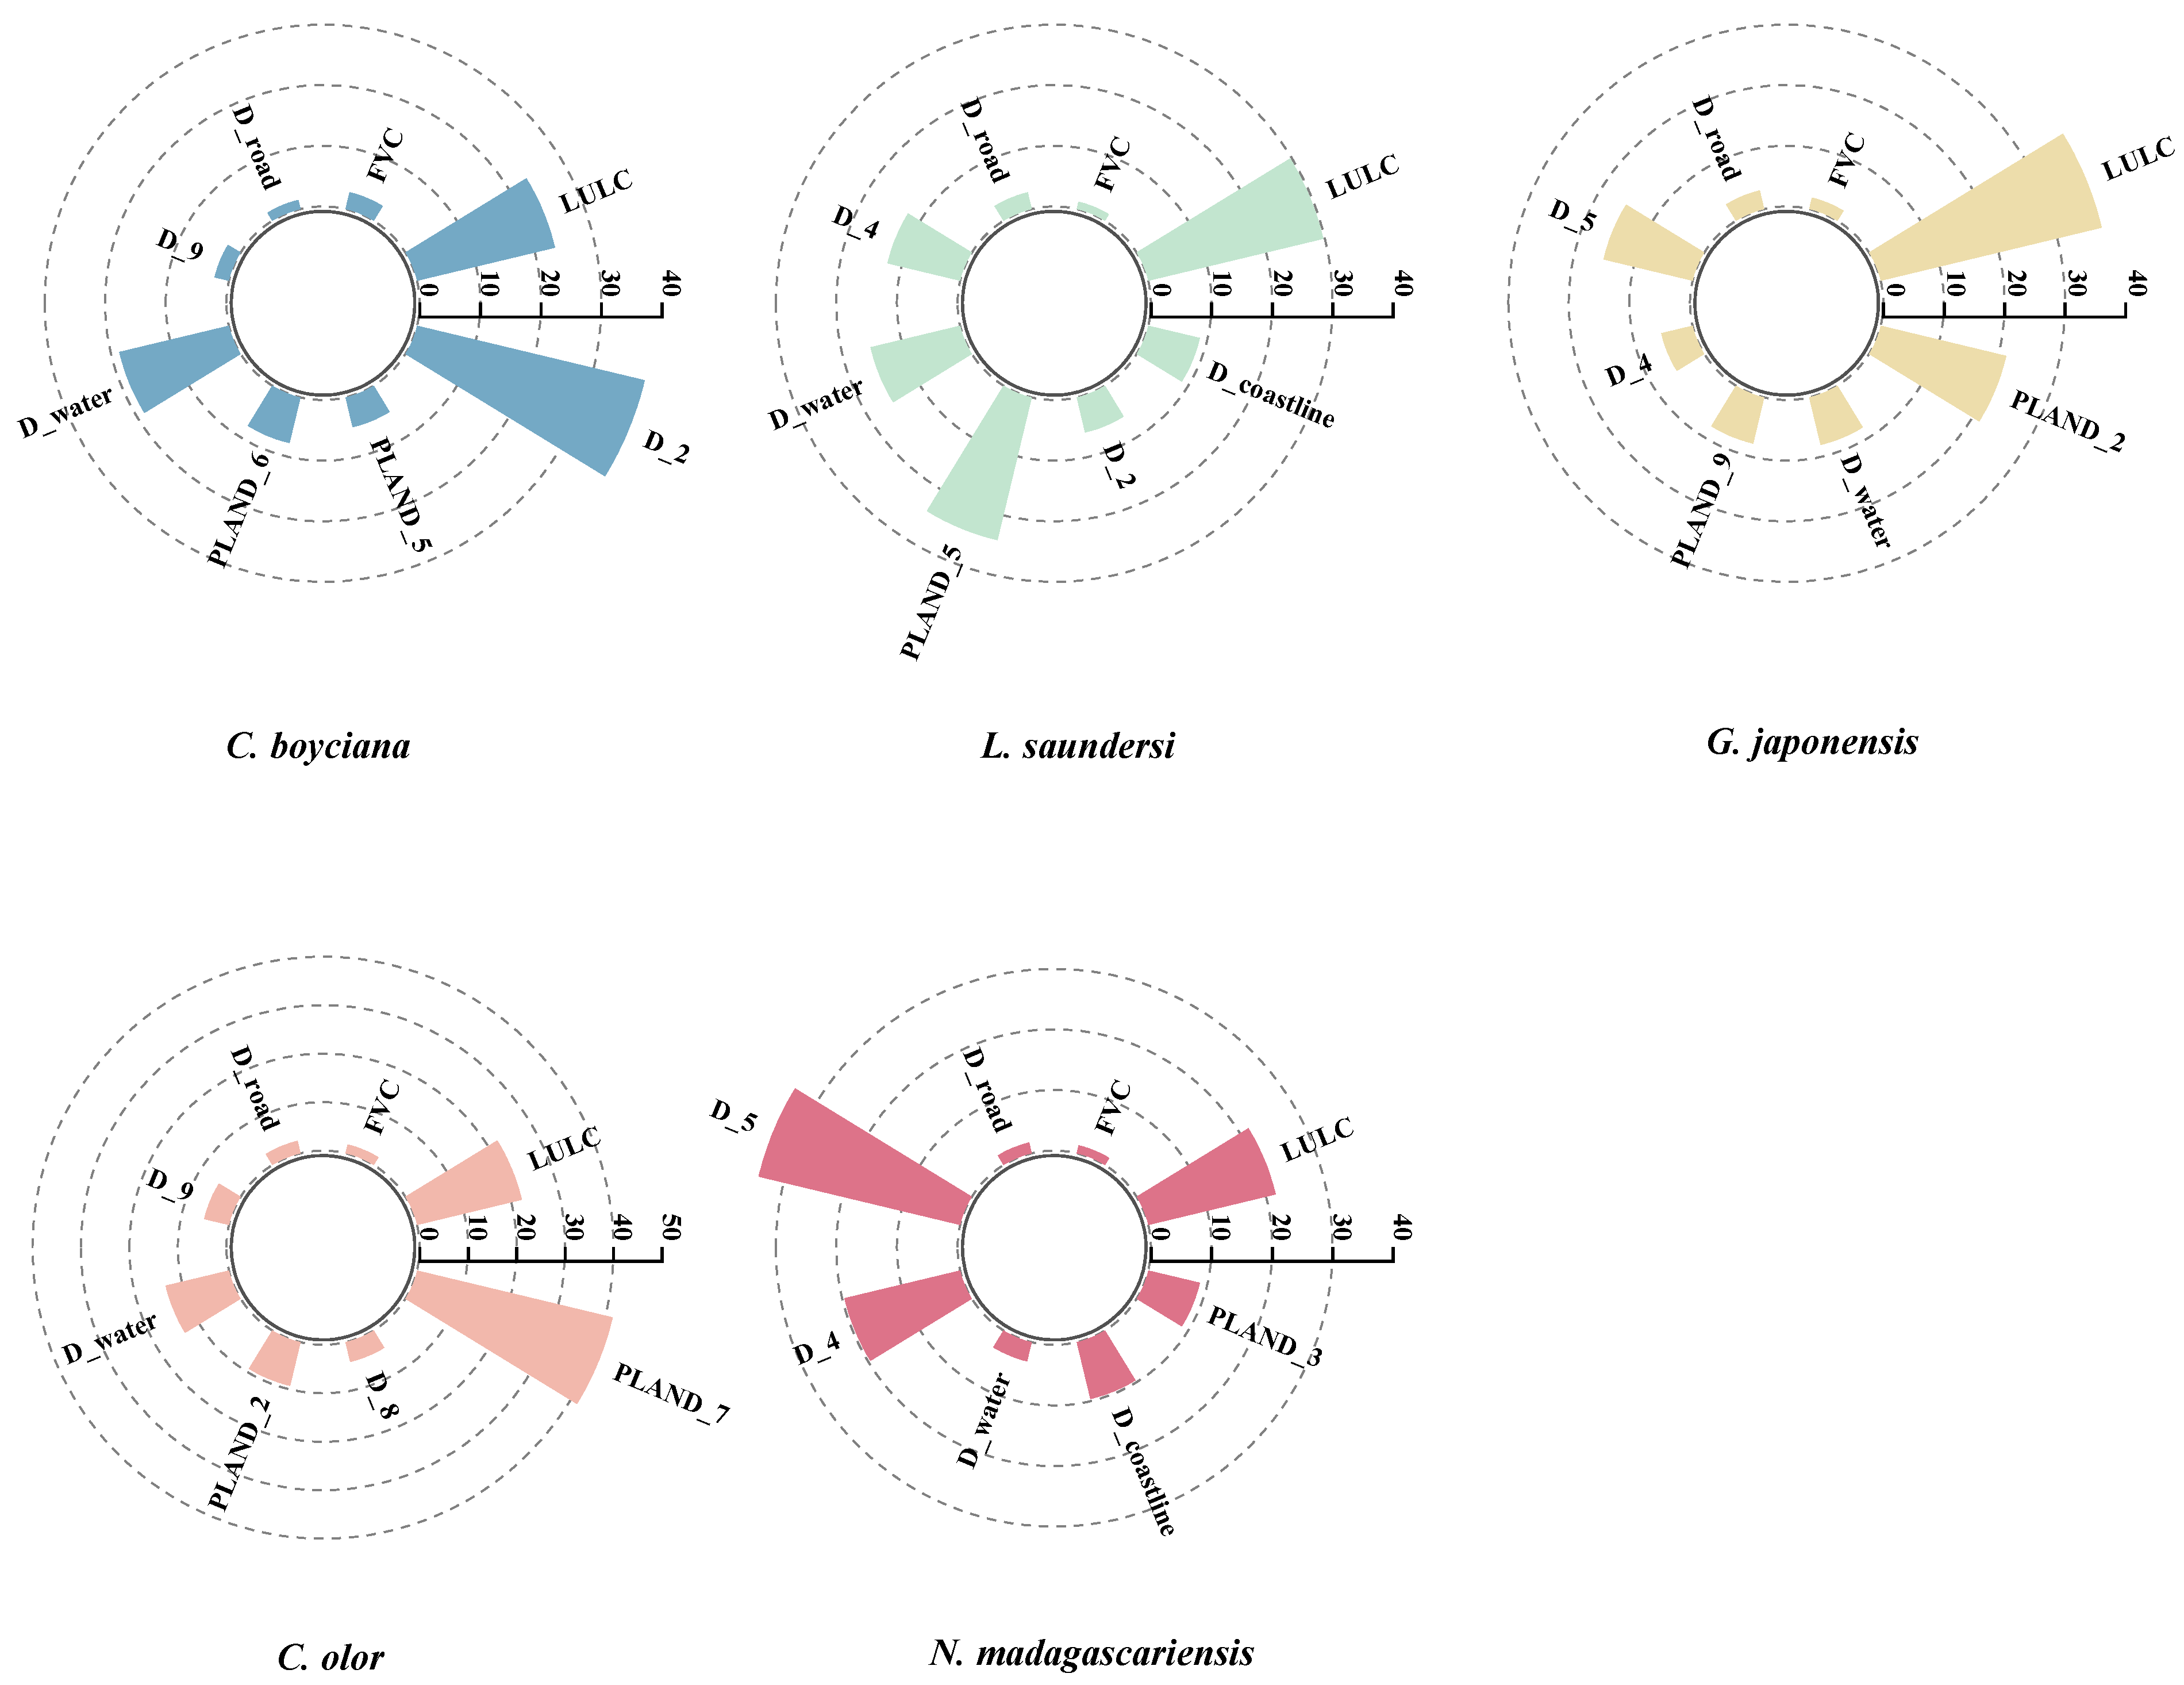
3.2. Environmental Variable Analysis

The prediction results showed that the average AUC value for the five bird species (C. boyciana, L. saundersi, G. japonensis, C. olor, and N. madagascariensis) was 0.902 ± 0.045, indicating a high level of model accuracy. To identify the key actors influencing the spatial distribution and habitat suitability differences among the selected bird species, the environmental variables were ranked mainly based on their relative contribution to the MaxEnt model (Figure 3). The results revealed that the common environmental variables affecting the habitat suitability of all five species were Land Use/Land Cover (LULC), Fractional Vegetation Cover (FVC), distance to roads (D_road), and distance to water (D_water). Among these, LULC had a contribution rate exceeding 20% for all species, accounting for 23.4%, 29.7%, 37.5%, 22.2%, and 21.6% for C. boyciana, L. saundersi, G. japonensis, C. olor, and N. madagascariensis, respectively. This highlights LULC as a key factor influencing the geographical distribution of waterbirds. In addition to the shared variables, other environmental factors exhibited species-specific effects. For C. boyciana, the distance to Phragmites marsh and distance to reservoir/pond areas were the dominant habitat factors, contributing 38.6% and 18.6% to the model, respectively. L. saundersi and N. madagascariensis demonstrated similar environmental preferences; however, L. saundersi was more strongly influenced by the proportion of mudflat landscape (PLAND_7), which contributed 24.2%, whereas N. madagascariensis was more constrained by the distance to mudflats (D_7), contributing 34.2%. G. japonensis was less affected by FVC (1.9%) but showed a notable sensitivity to the proportion of Phragmites landscape (PLAND_2), with a contribution of 21.3%. Compared to the other species, C. olor was more heavily limited by the proportion of reservoir/pond landscape (PLAND_5), which contributed 41.3%.

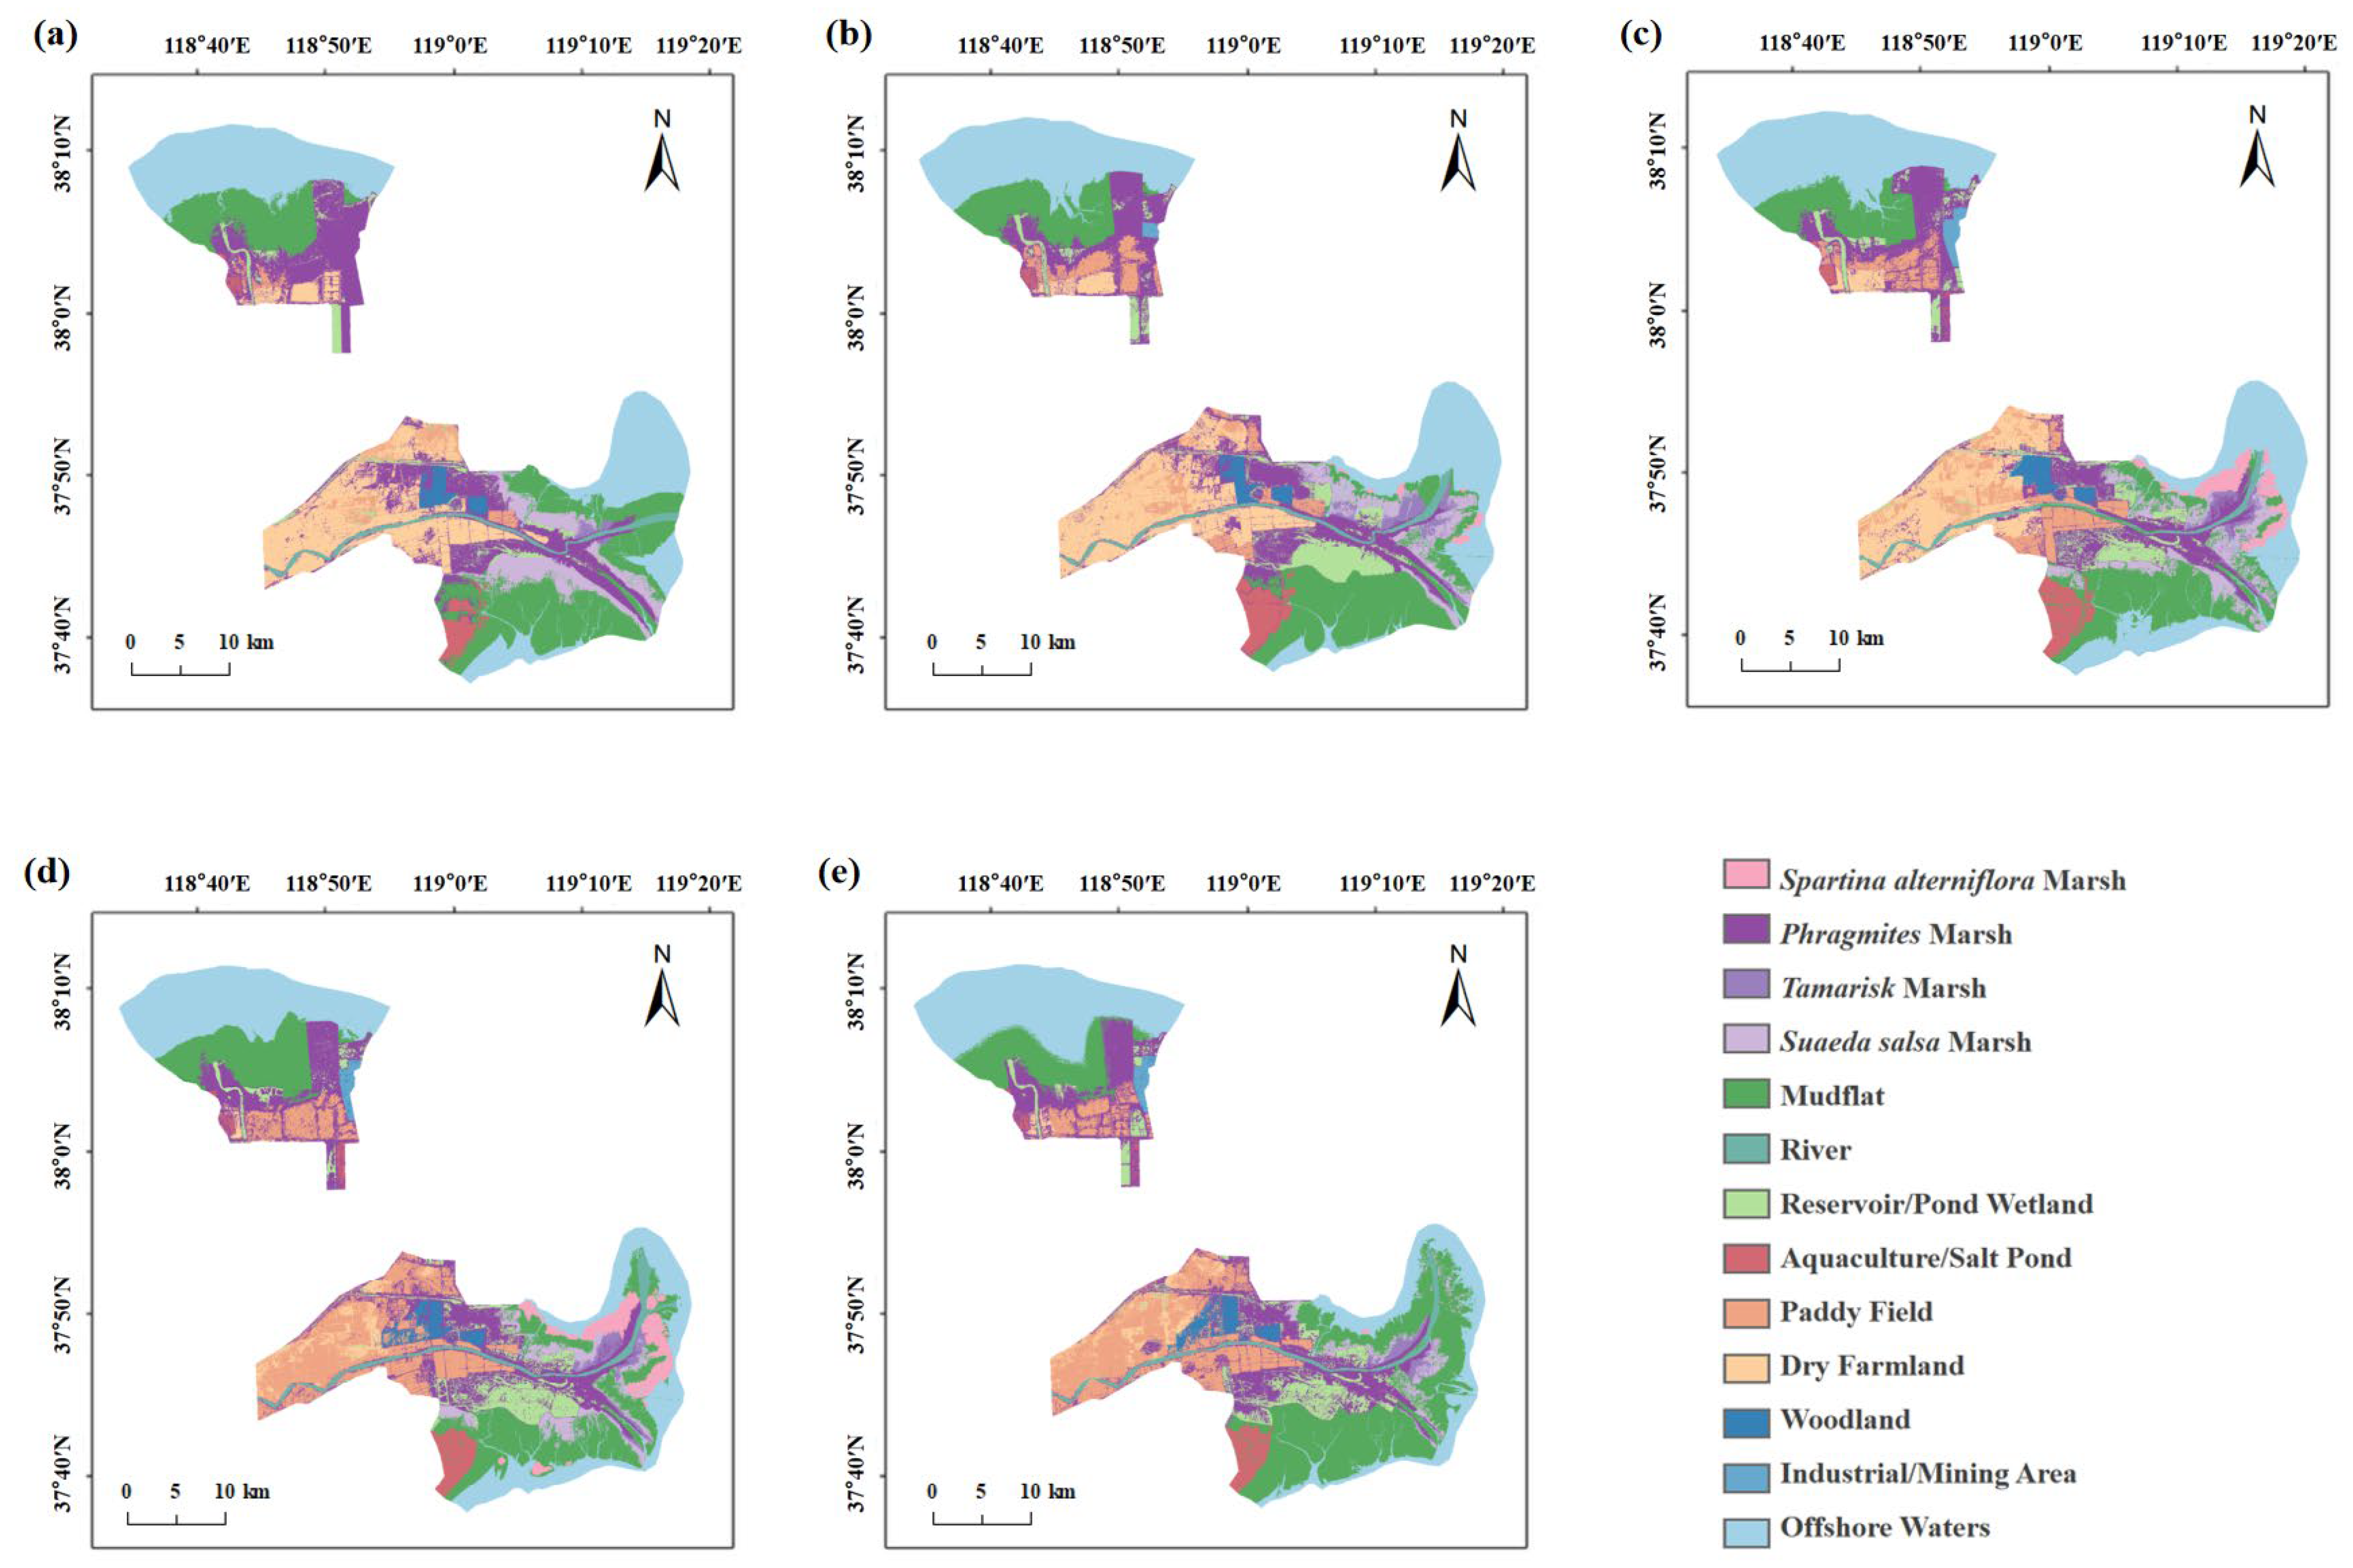
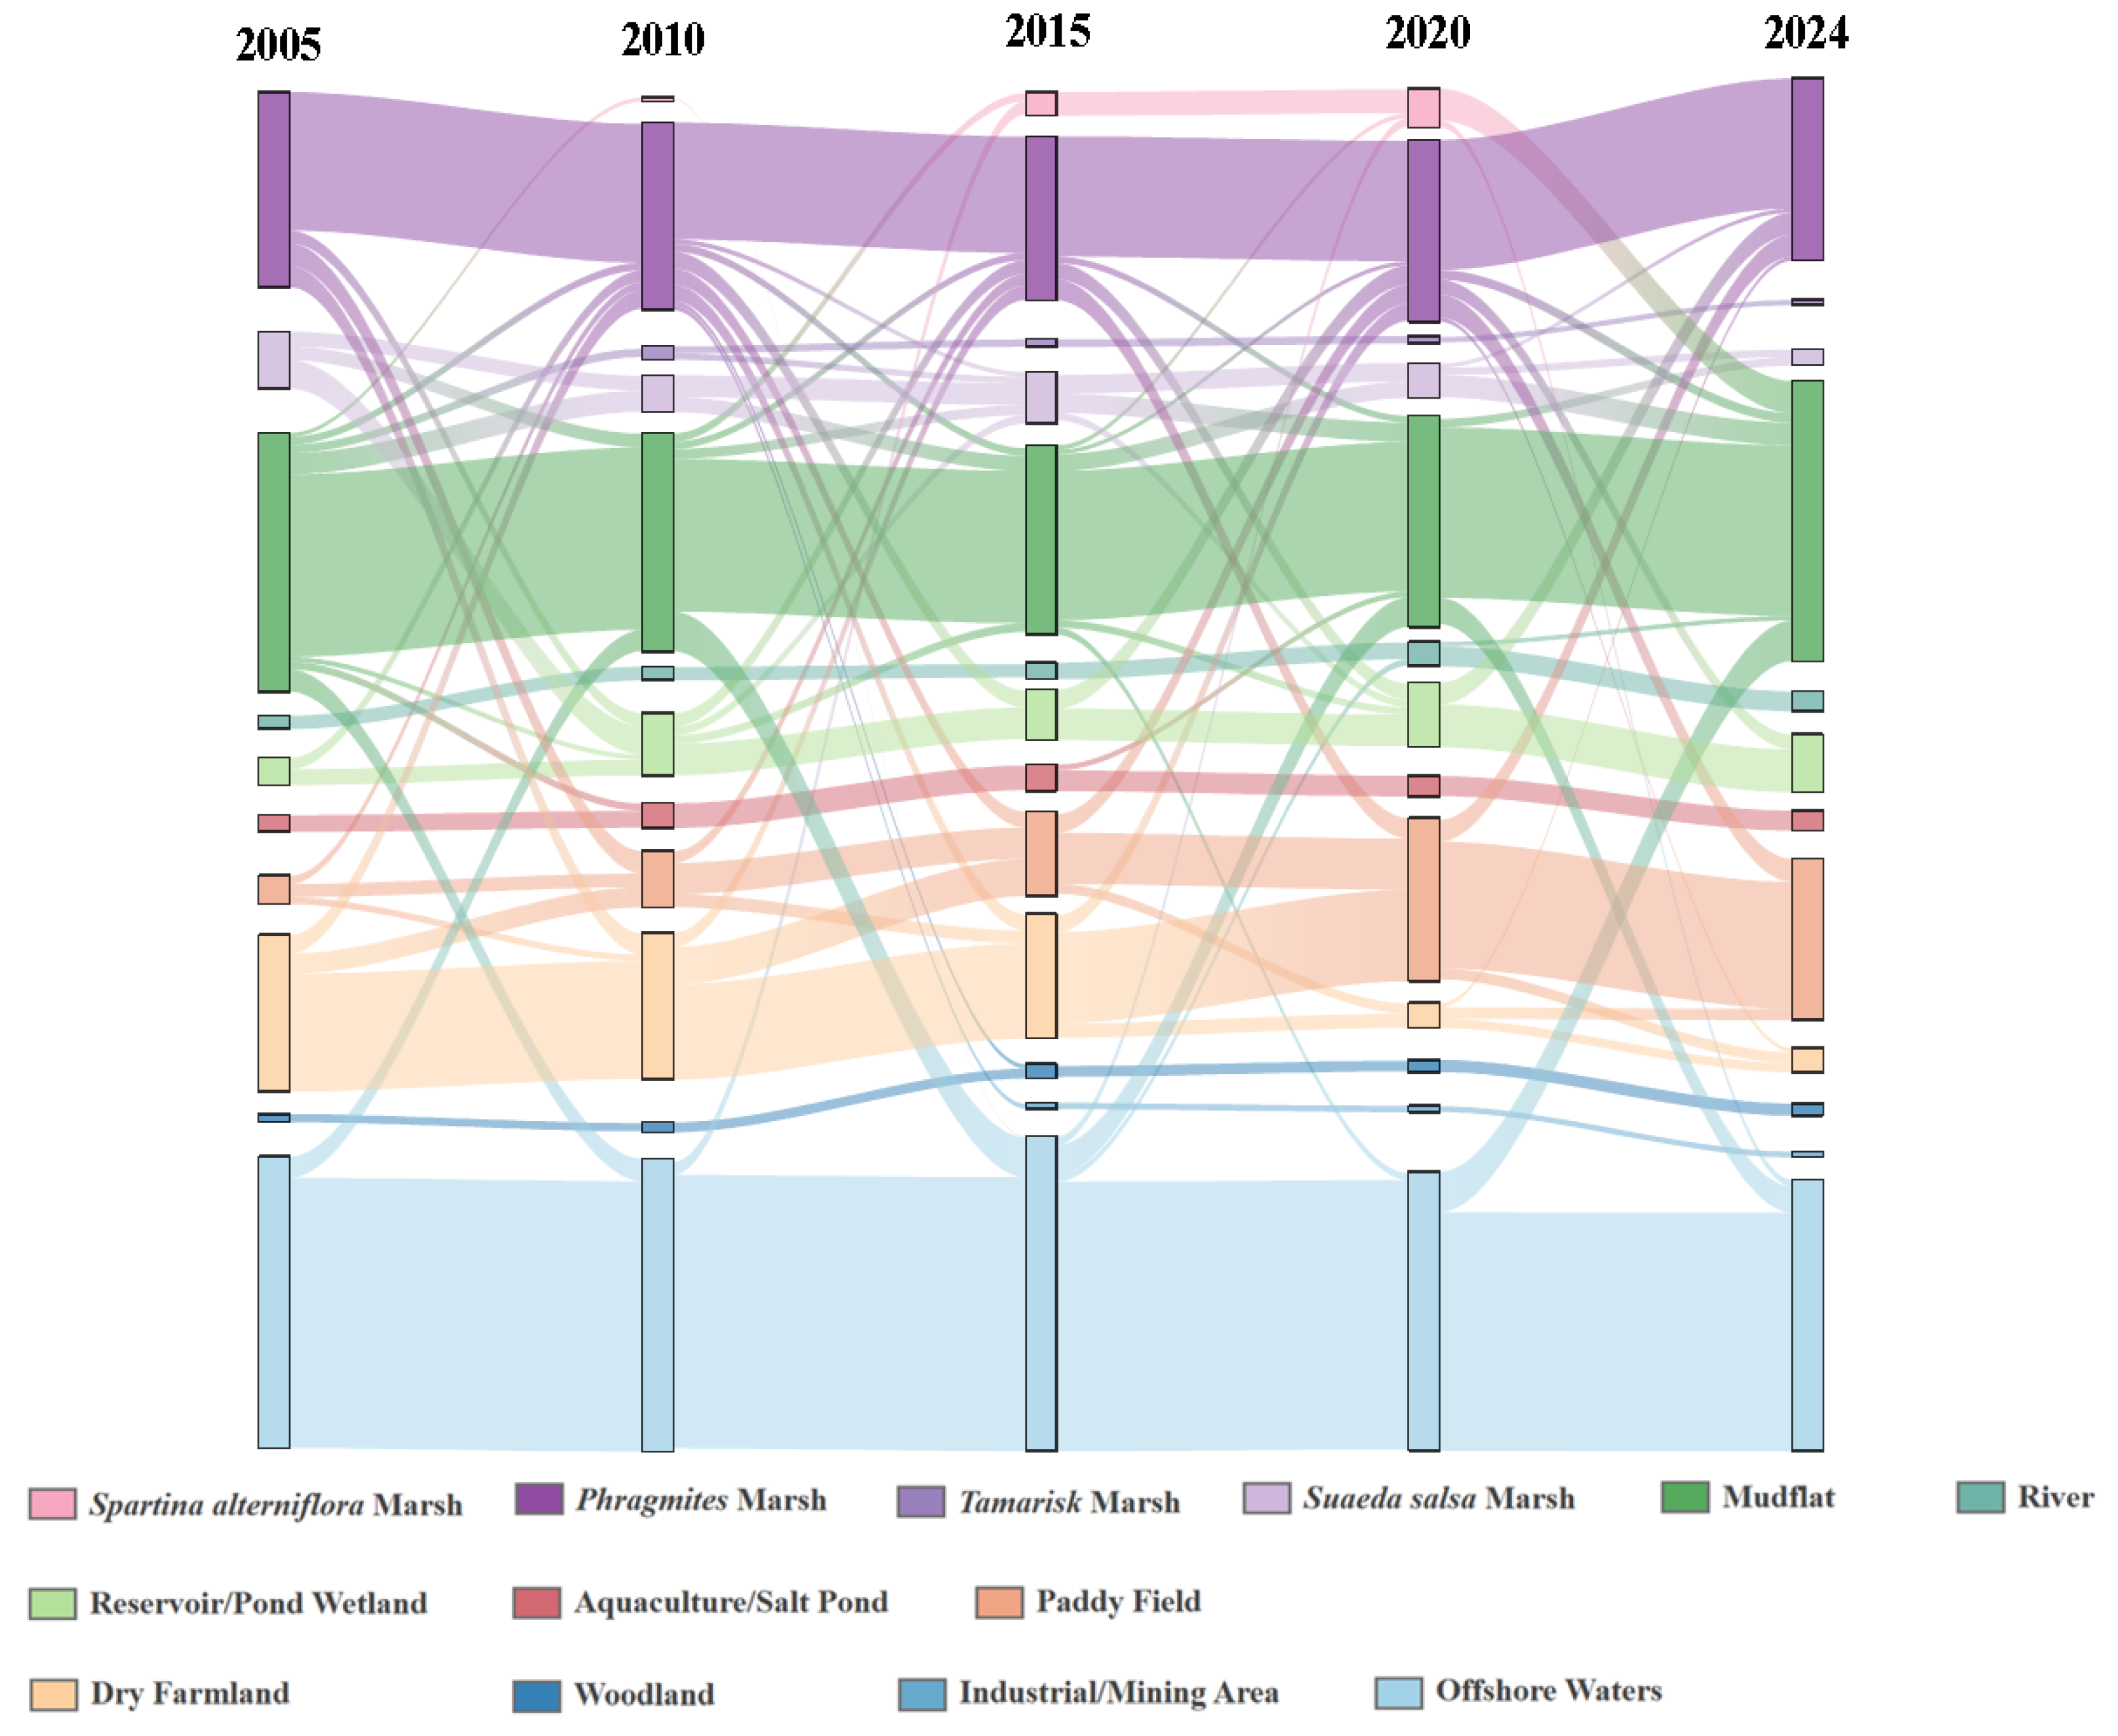
3.3. Wetland Dynamics in the YRDNR

Between 2005 and 2024, the total wetland area within the reserve exhibited a trend of initial decline followed by subsequent expansion (Table 7). Natural wetlands showed a consistent decrease, shrinking from 695.44 km2 in 2005 to 586.97 km2 in 2024, with a reduction of 15.60%. In contrast, although artificial wetlands occupied a smaller proportion of the total area, they expanded markedly from 118.65 km2 to 288.07 km2, representing a 142.78% increase. As the total wetland area grew, non-wetland areas correspondingly declined, decreasing from 556.45 km2 to 495.55 km2, with a net loss of 10.94%.
From 2005 to 2024, the study area has undergone dramatic land use/cover changes (Figure 4 and Figure 5). Since 2005, the Northern Yiqian’er Station area has been dominated by relatively homogenous wetland types, primarily composed of mudflats and marshes. In the southern estuarine region, shifts in the Yellow River’s lower course have caused realignments of the tidal zone, leading to alternating strips of intertidal marshes across the mudflats. The areas of Spartina alterniflora marsh and Tamarix marsh increased by 5.78 km2 and 15.03 km2, respectively, while reservoir/pond wetlands expanded by 102.87%. After 2010, significant fragmentation of the northern mudflats occurred due to coastal erosion, and land allocated for industrial and mining purposes increased by 136.17%. In the south, Spartina alterniflora marshes rapidly expanded from 5.78 km2 to 48.83 km2, with an average annual increase of approximately 4.31 km2. Aquaculture saltpans also grew from 33.92 km2 to 40.11 km2. Wetland type conversions became increasingly dynamic, with a marked shift from natural to artificial wetlands. The reservoir/pond wetlands were primarily formed from Phragmites and Suaeda marshes, contributing 40.04 km2 and 35.69 km2, respectively. Meanwhile, mudflats and Suaeda marshes lost 28.12 km2 and 26.34 km2 to other land uses. Conversions from non-wetlands to artificial wetlands, especially paddy fields, also rose significantly. Between 2015 and 2020 alone, 80.24 km2 of the non-wetland area was converted to paddy fields, while 14.76 km2 and 11.94 km2 of pond wetlands and saltpans, respectively, were converted from mudflats and non-wetlands.
Following the large-scale eradication of Spartina alterniflora after 2020, its marsh area plummeted to 0.43 km2, with a reduction of 48.41 km2 or 3.56% of the total wetland area. Concurrently, the areas of Suaeda and Tamarix marshes rebounded by 48.35% and 12.27%, respectively. The mudflat area expanded to 291.83 km2 due to increased sediment deposition from upstream and targeted restoration efforts. The artificial wetland area has since stabilized, with Spartina alterniflora marshes reverting to mudflats and coastal waters, accounting for 40.12 km2 and 8.51 km2 of the reversion, respectively. However, due to insufficient sediment and water supply in the Northern Yiqian’er Station area, the erosion of mudflats intensified, with 53.94 km2 of land lost to the sea.

3.4. Dynamics of Habitat Suitability for Rare Waterbirds

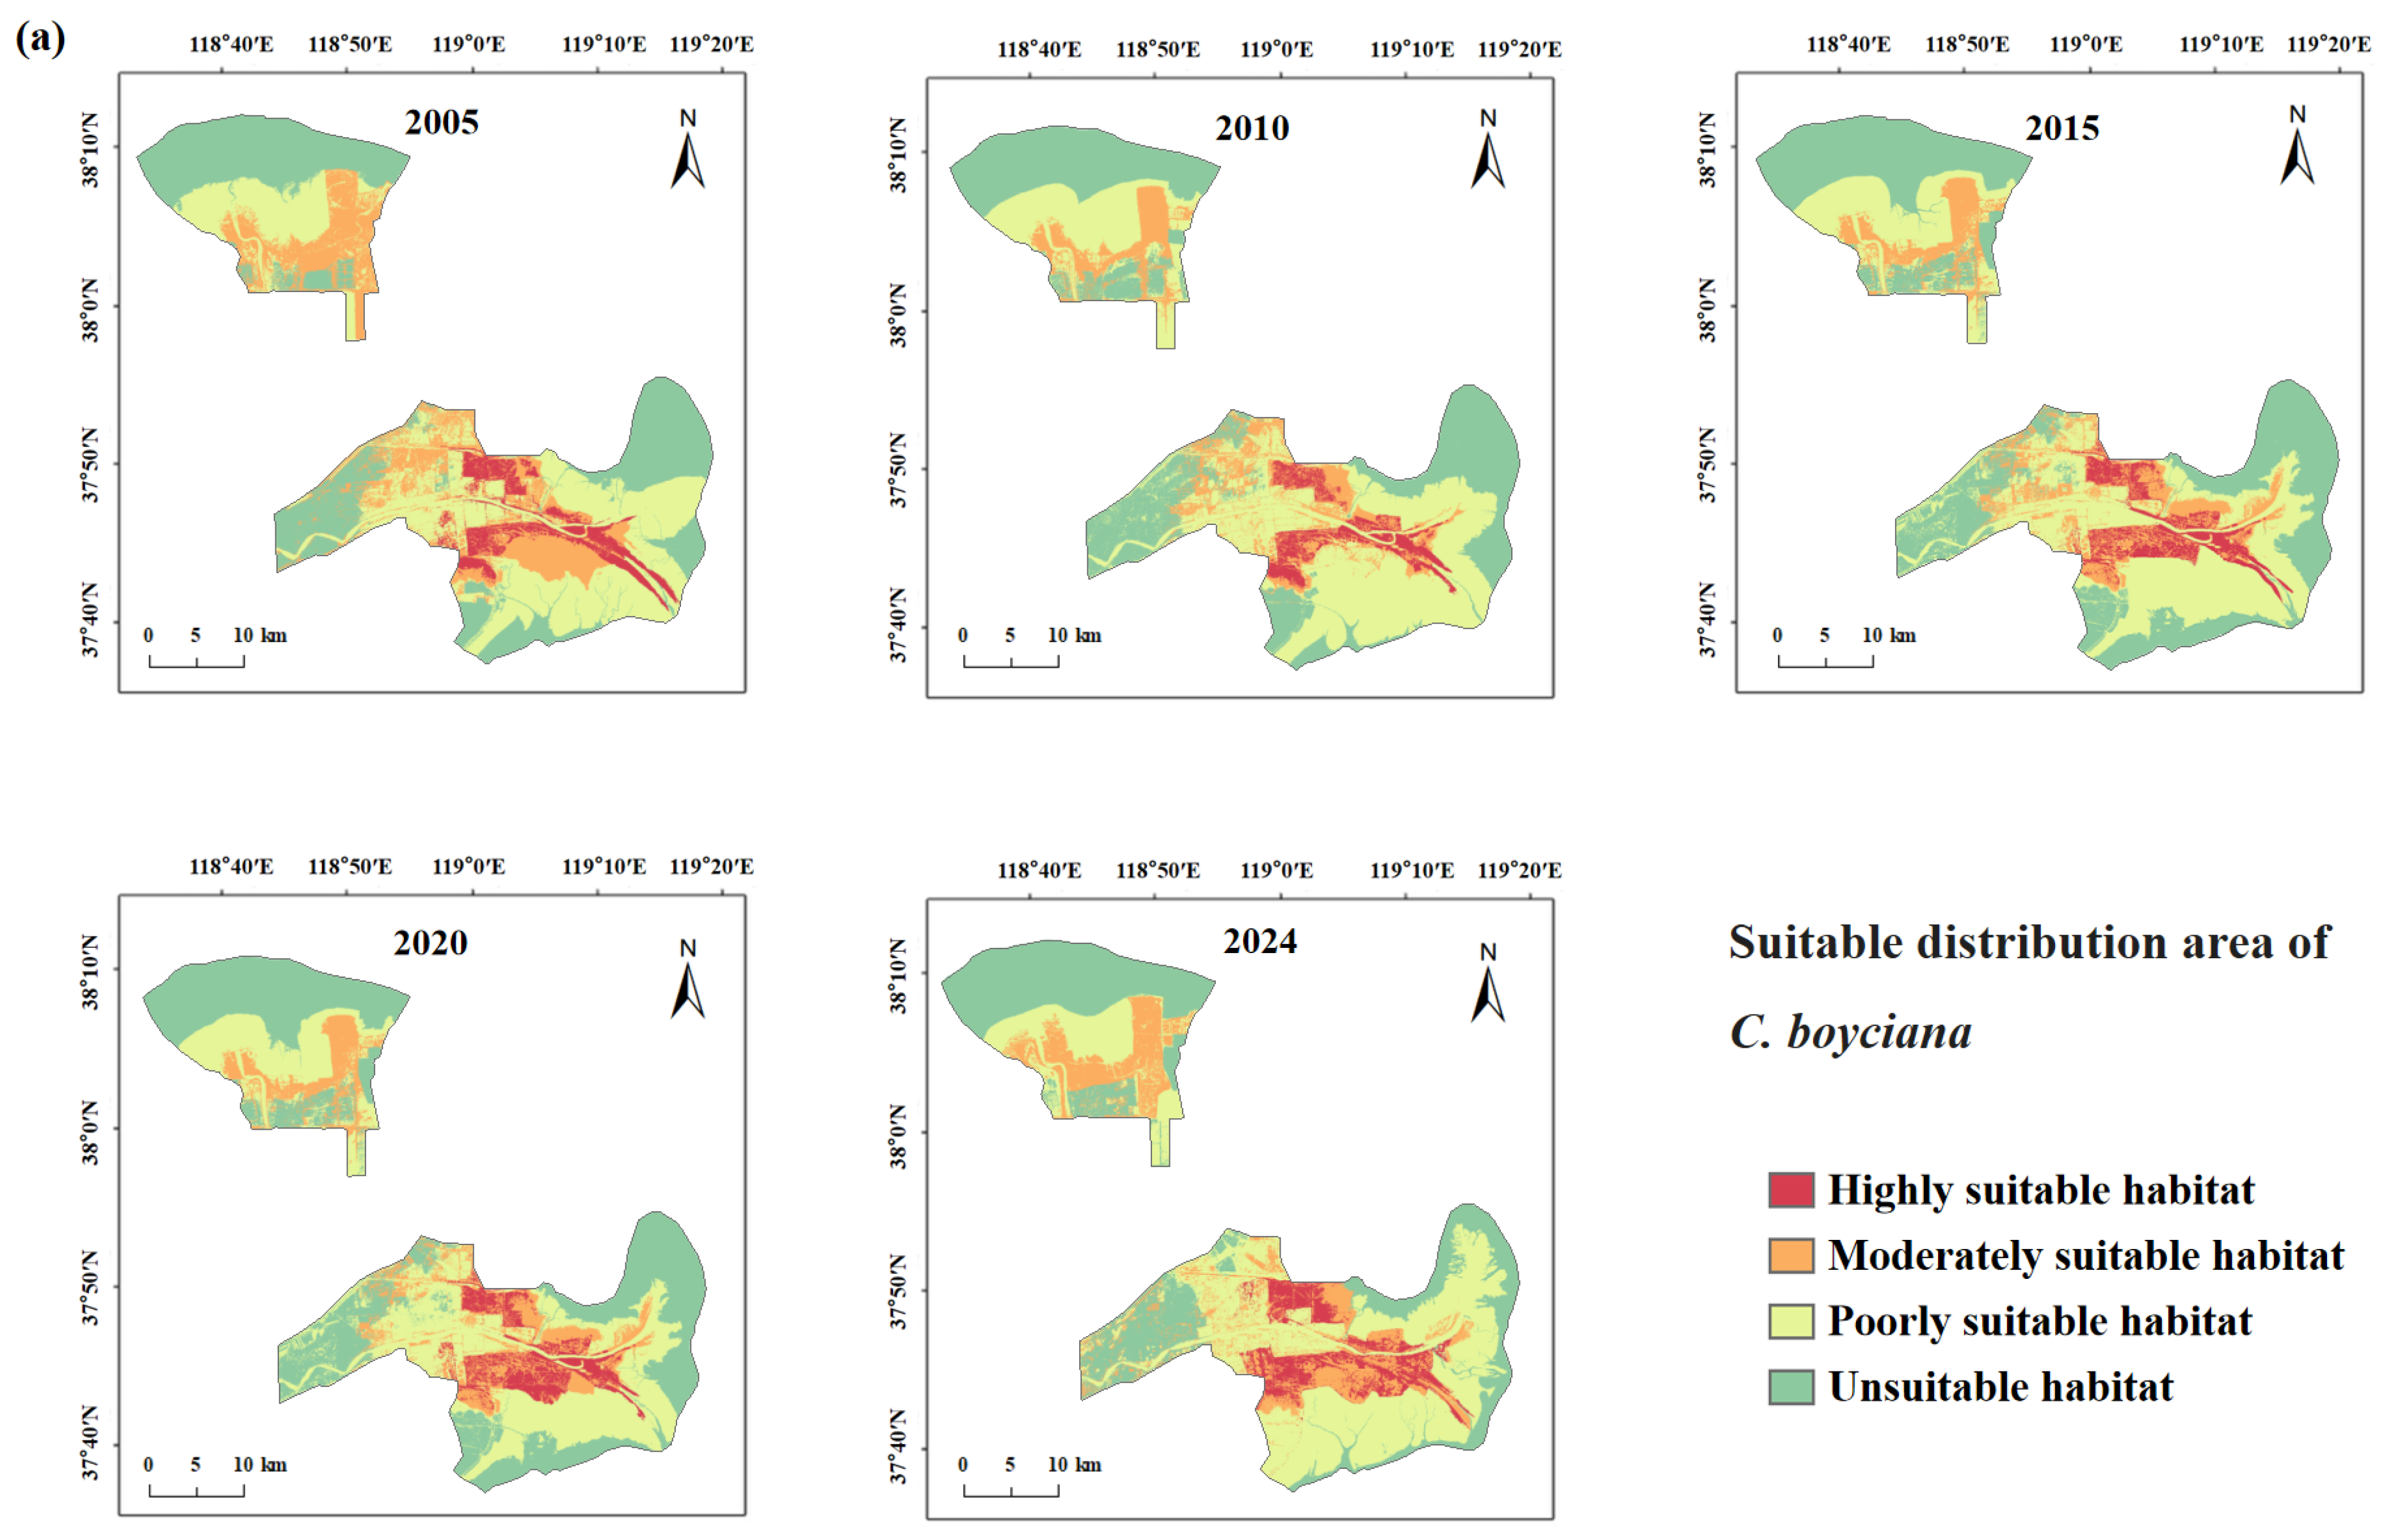
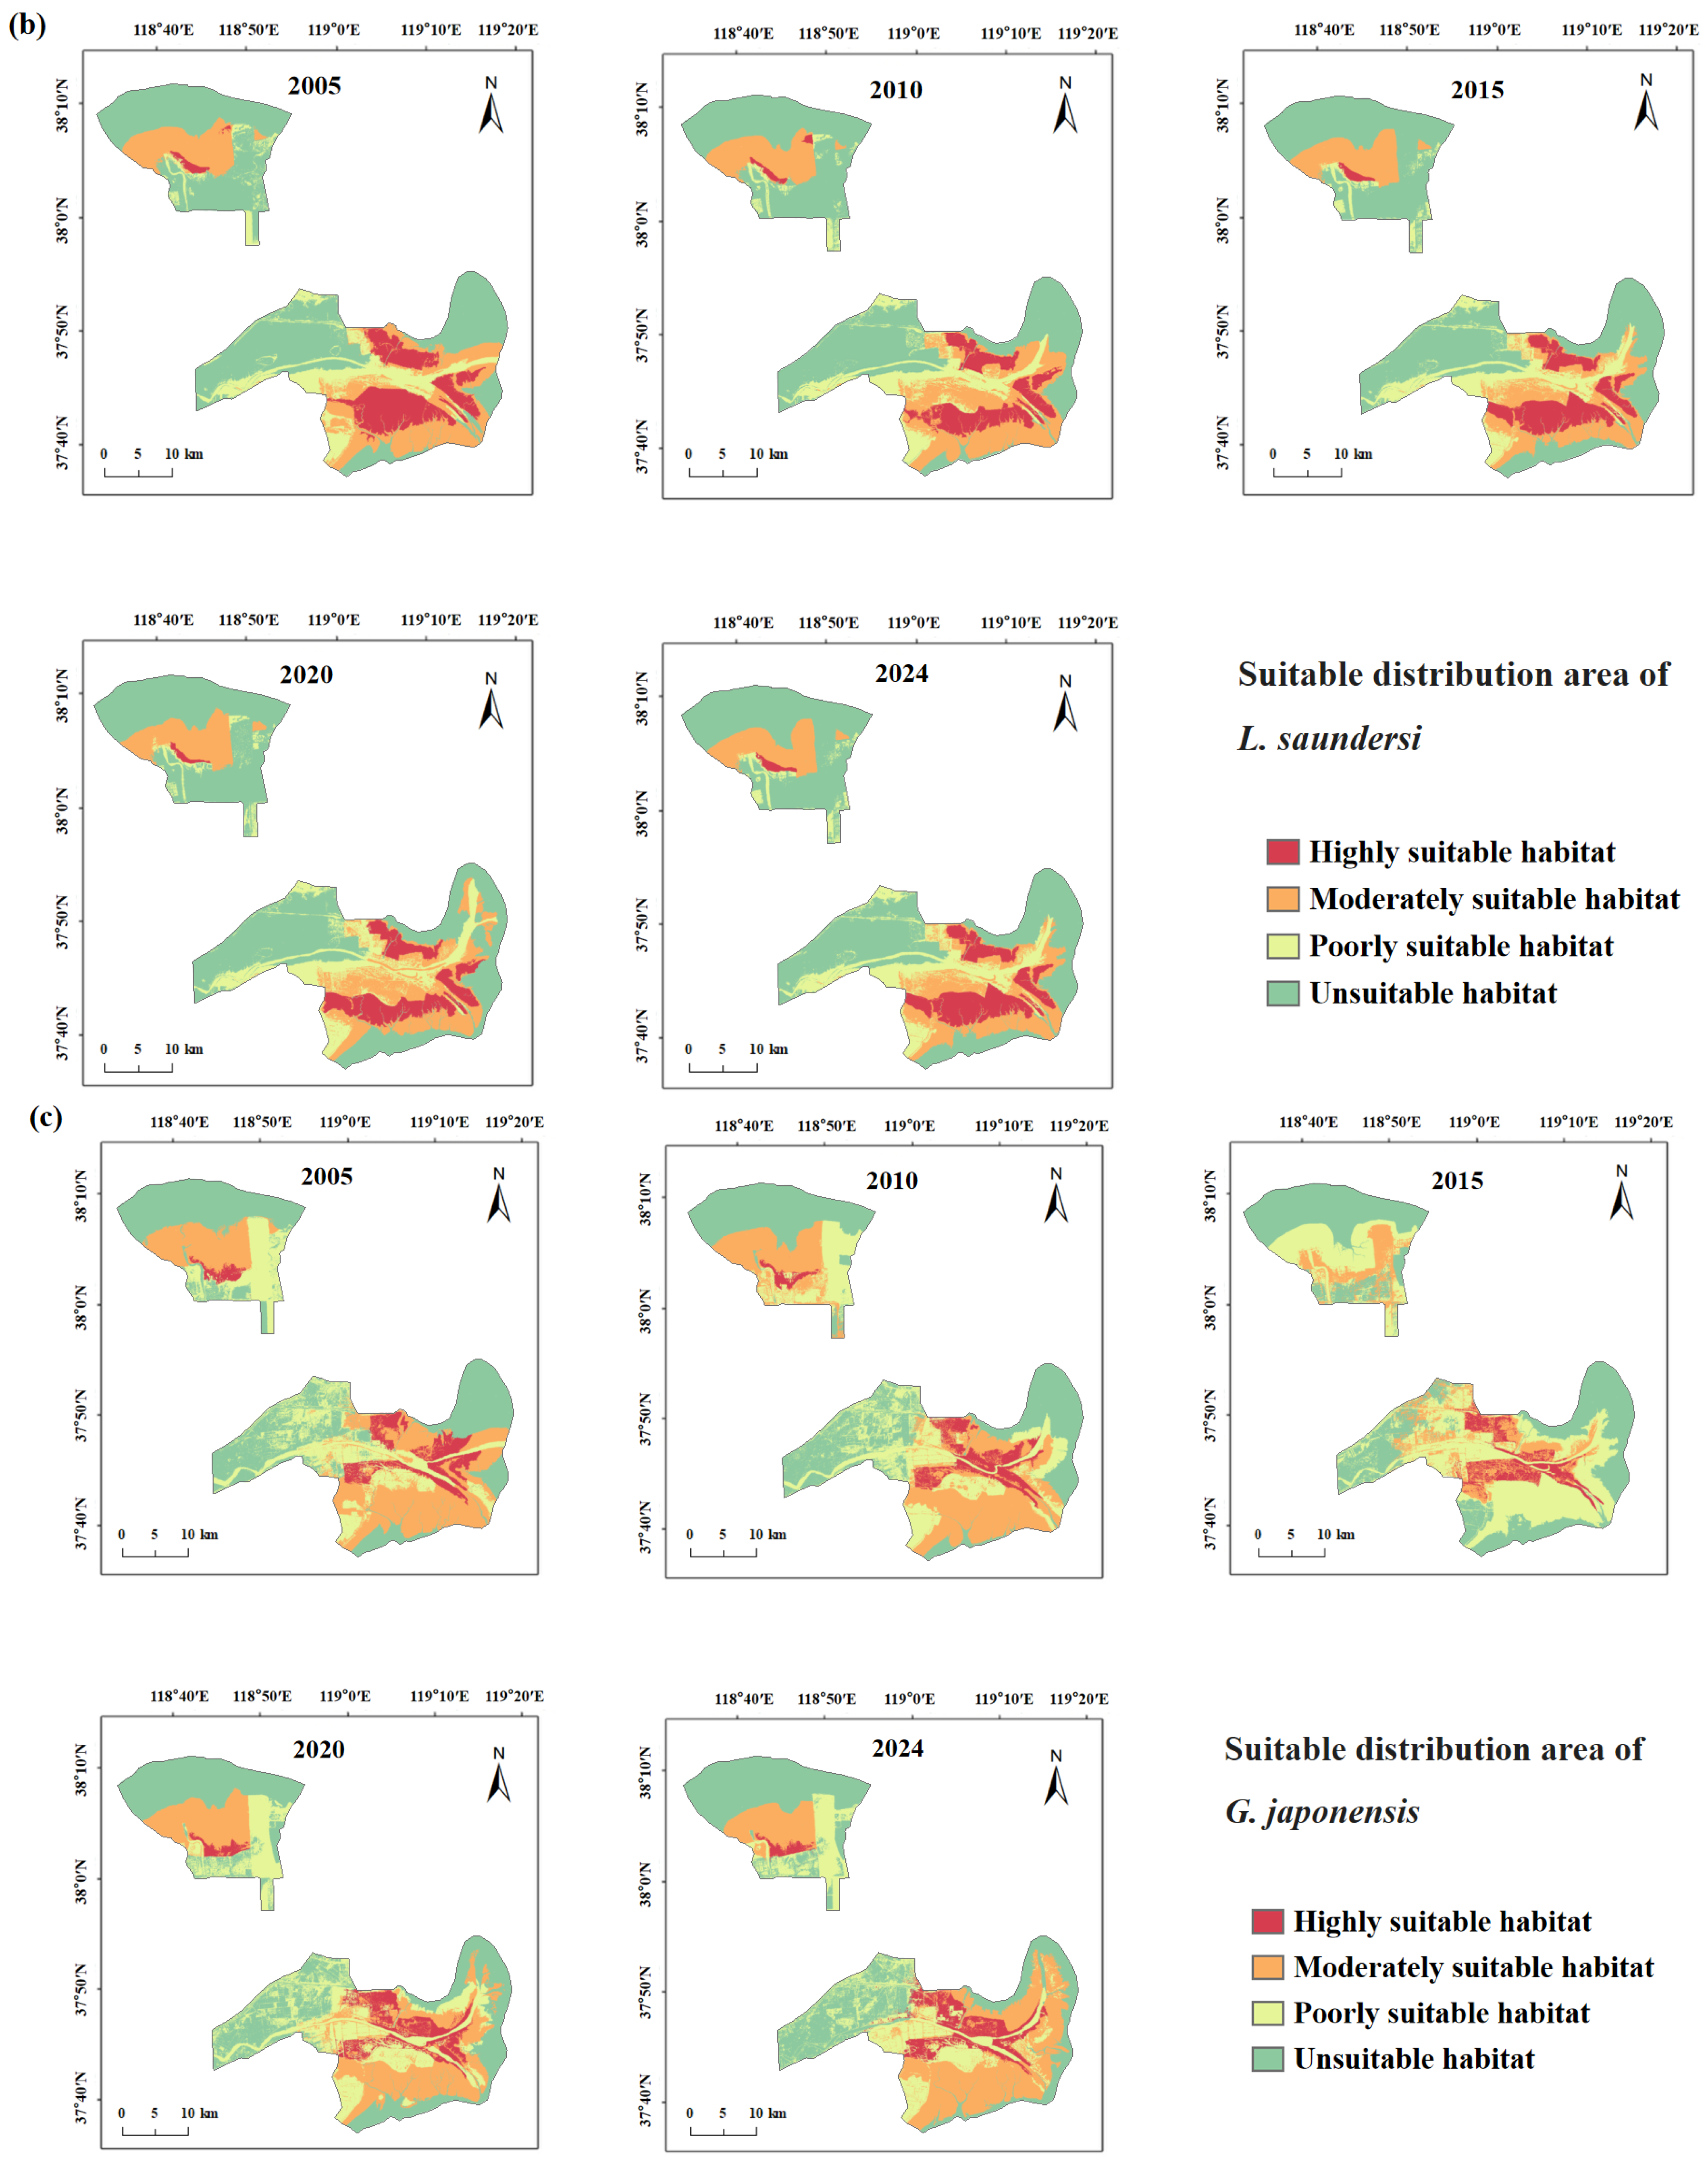
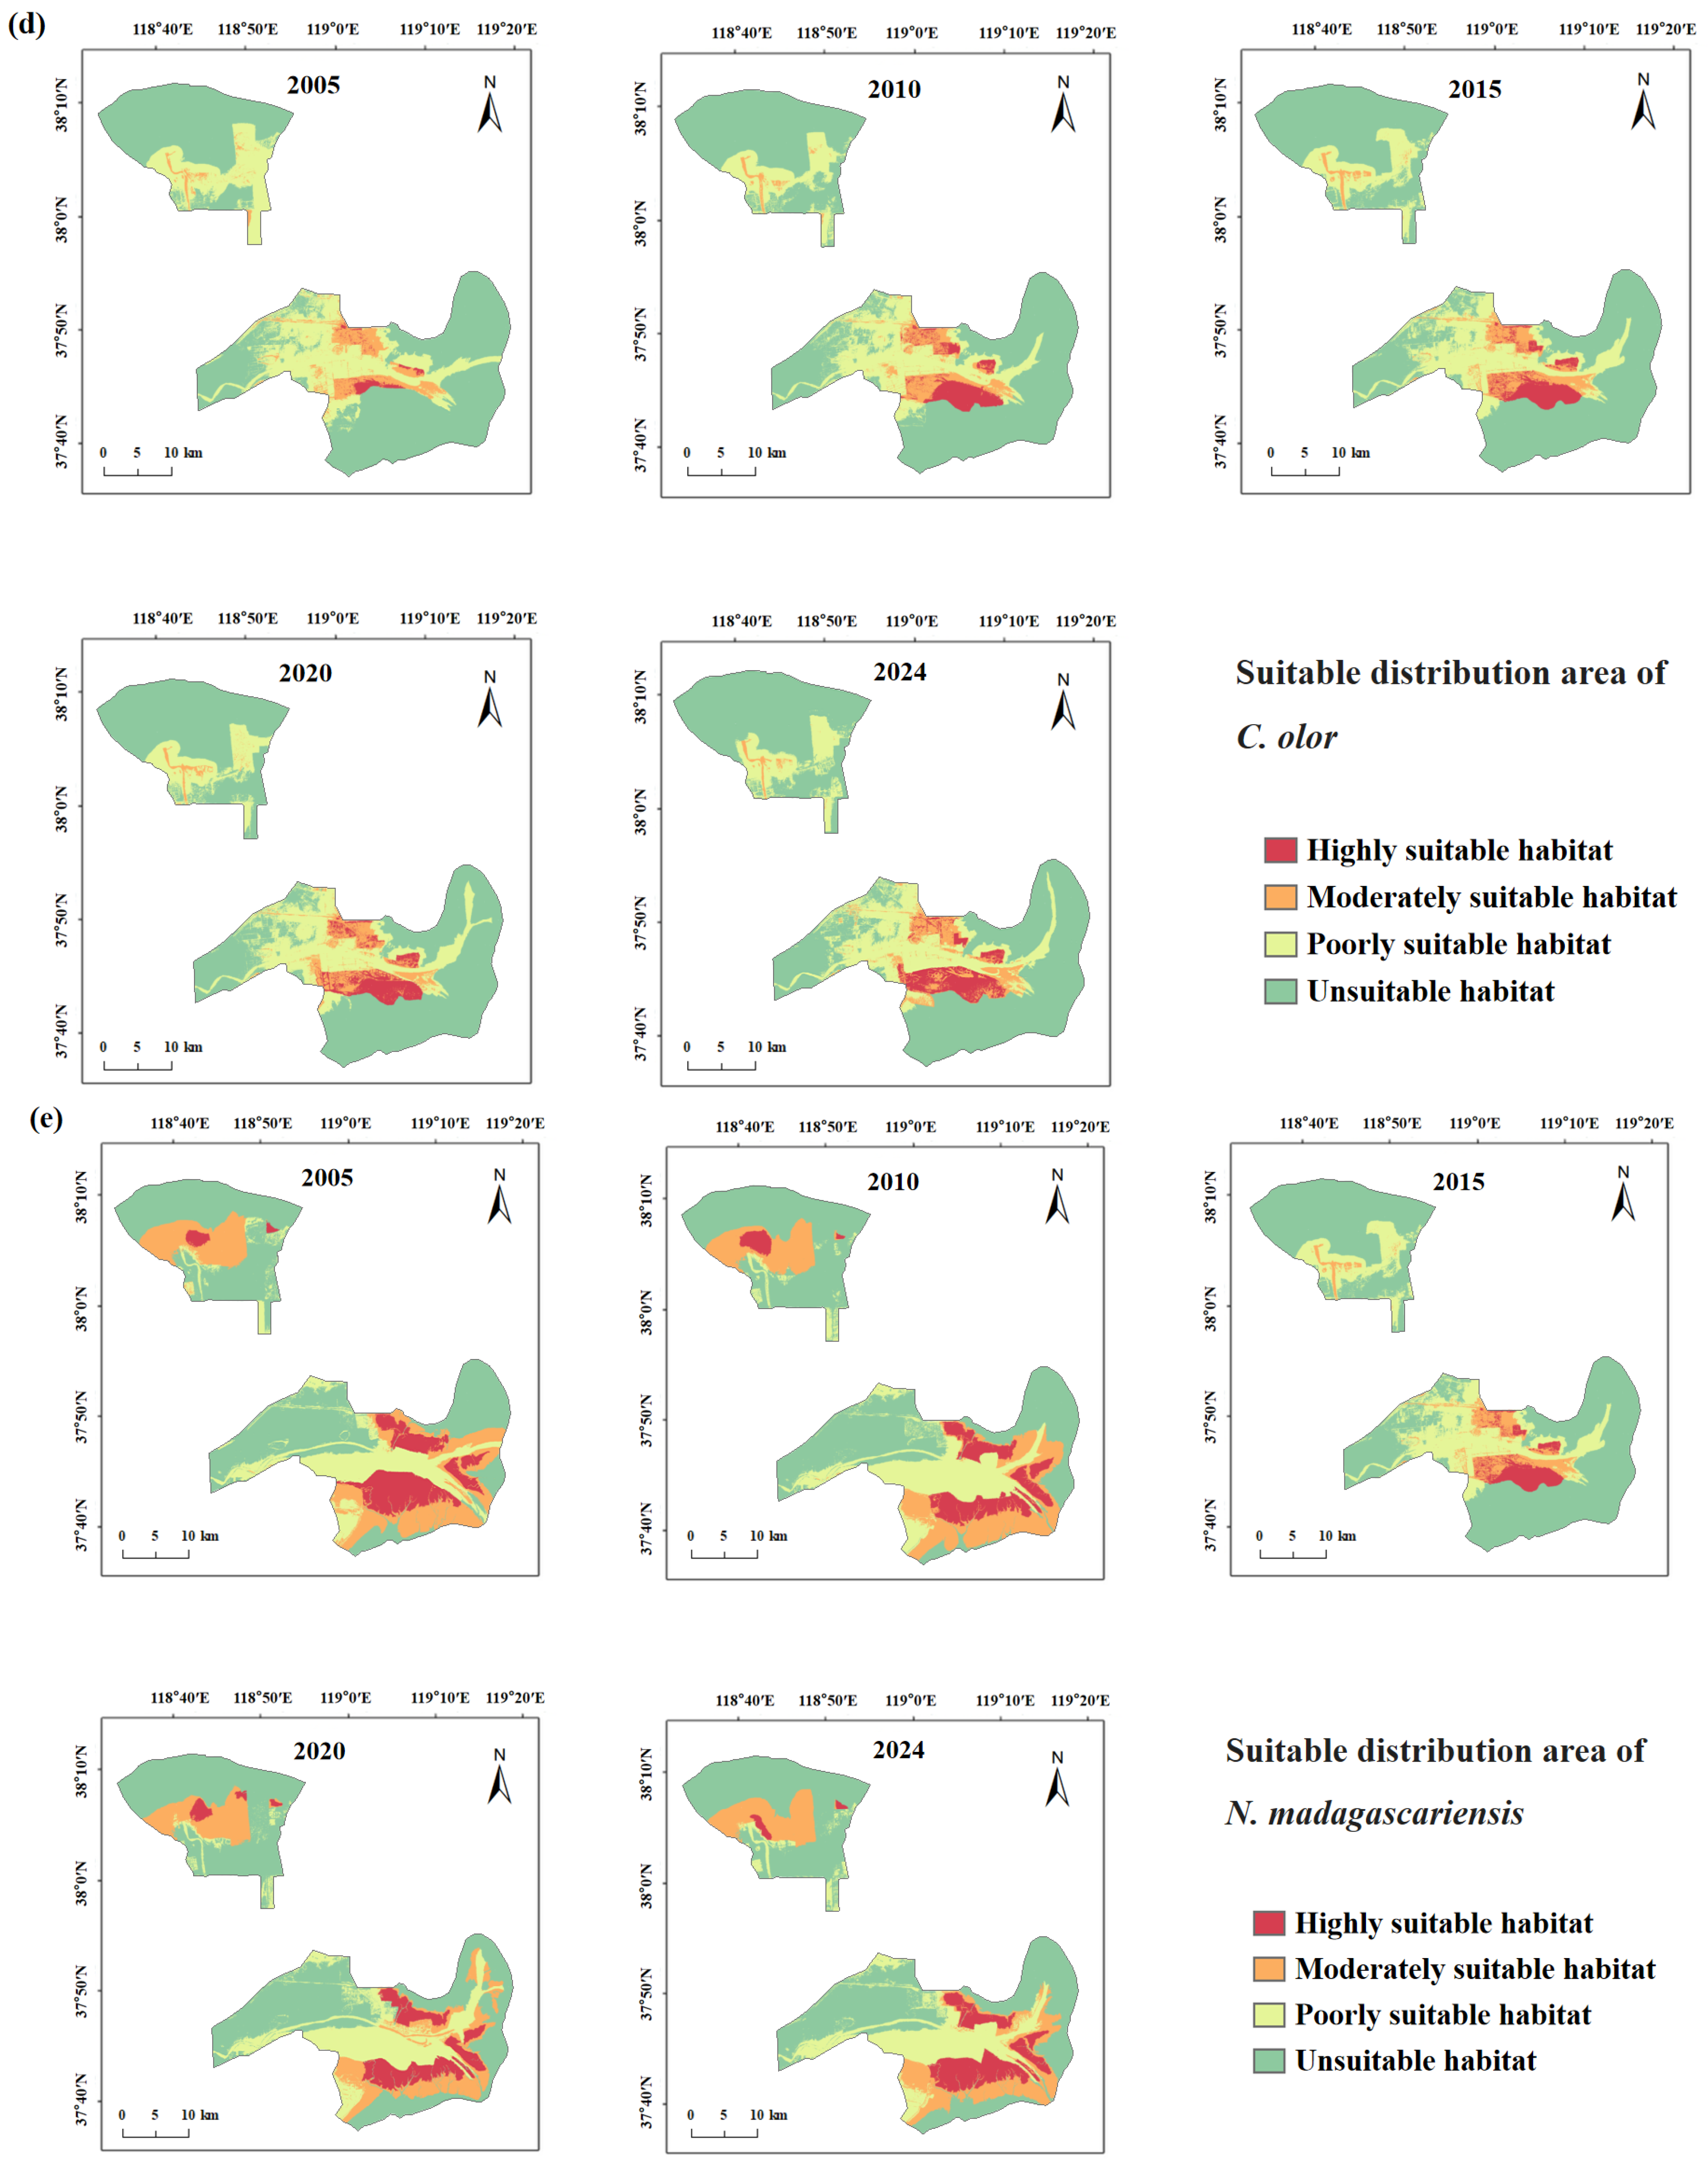
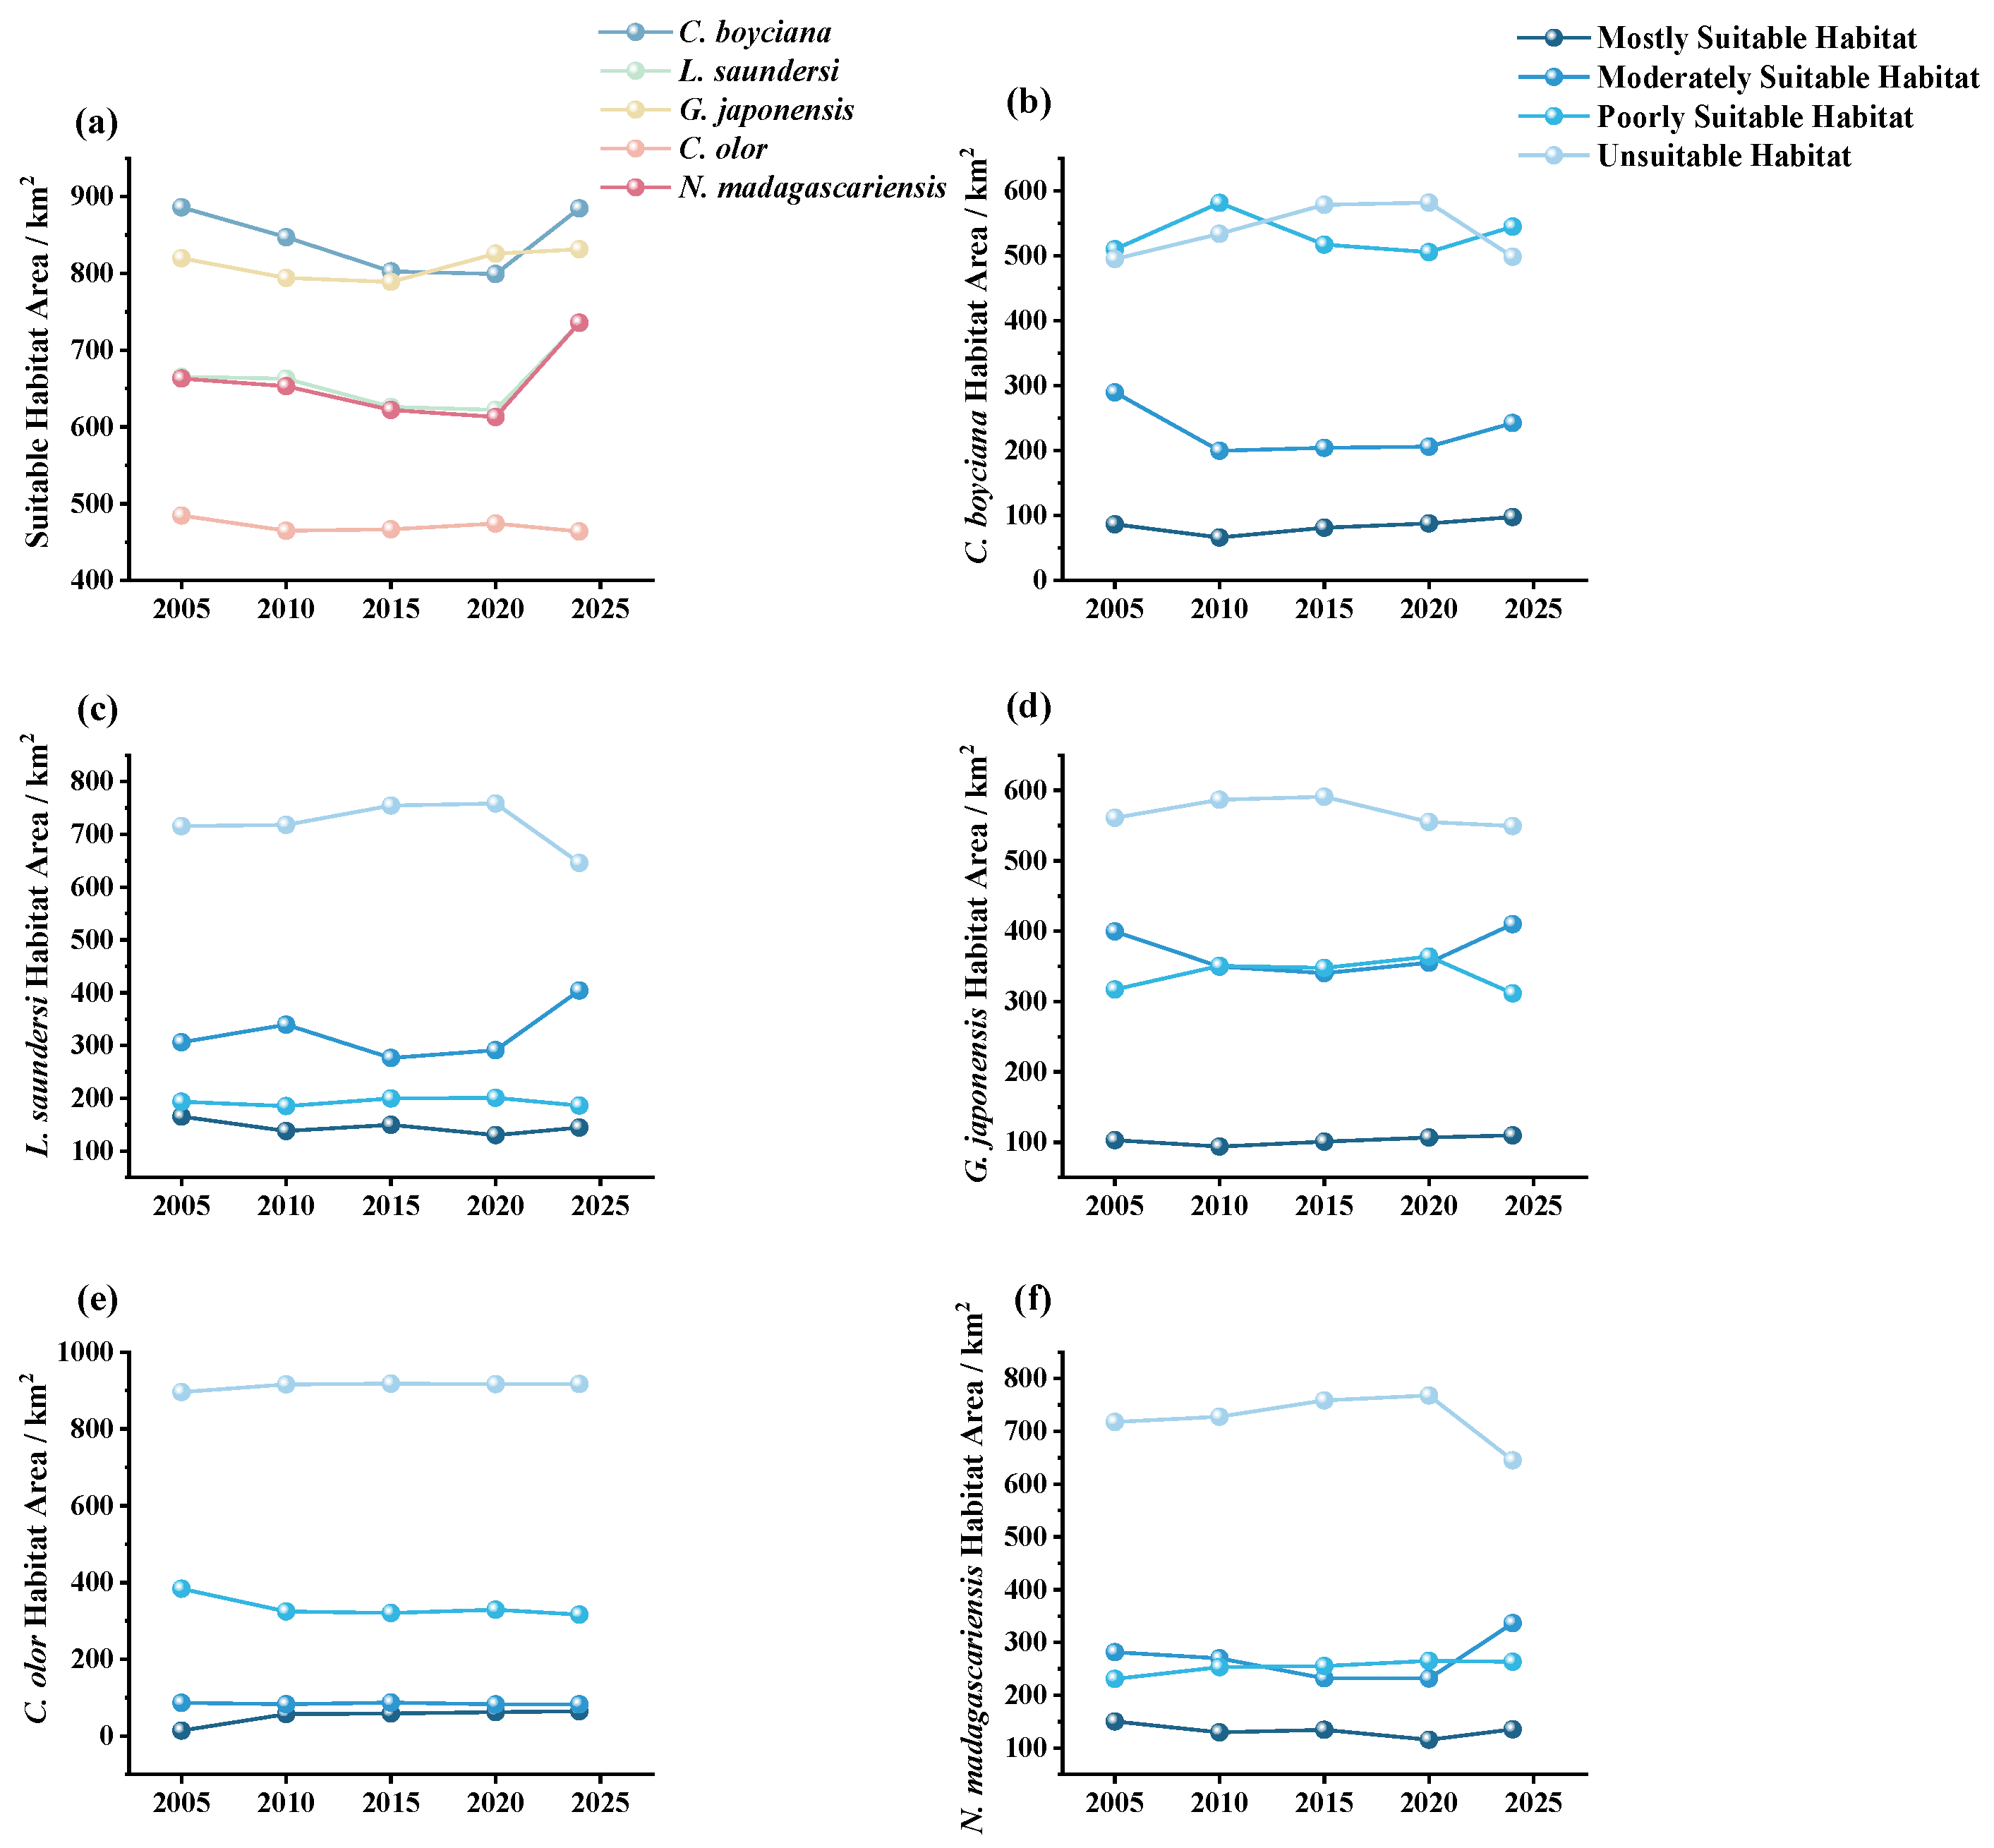
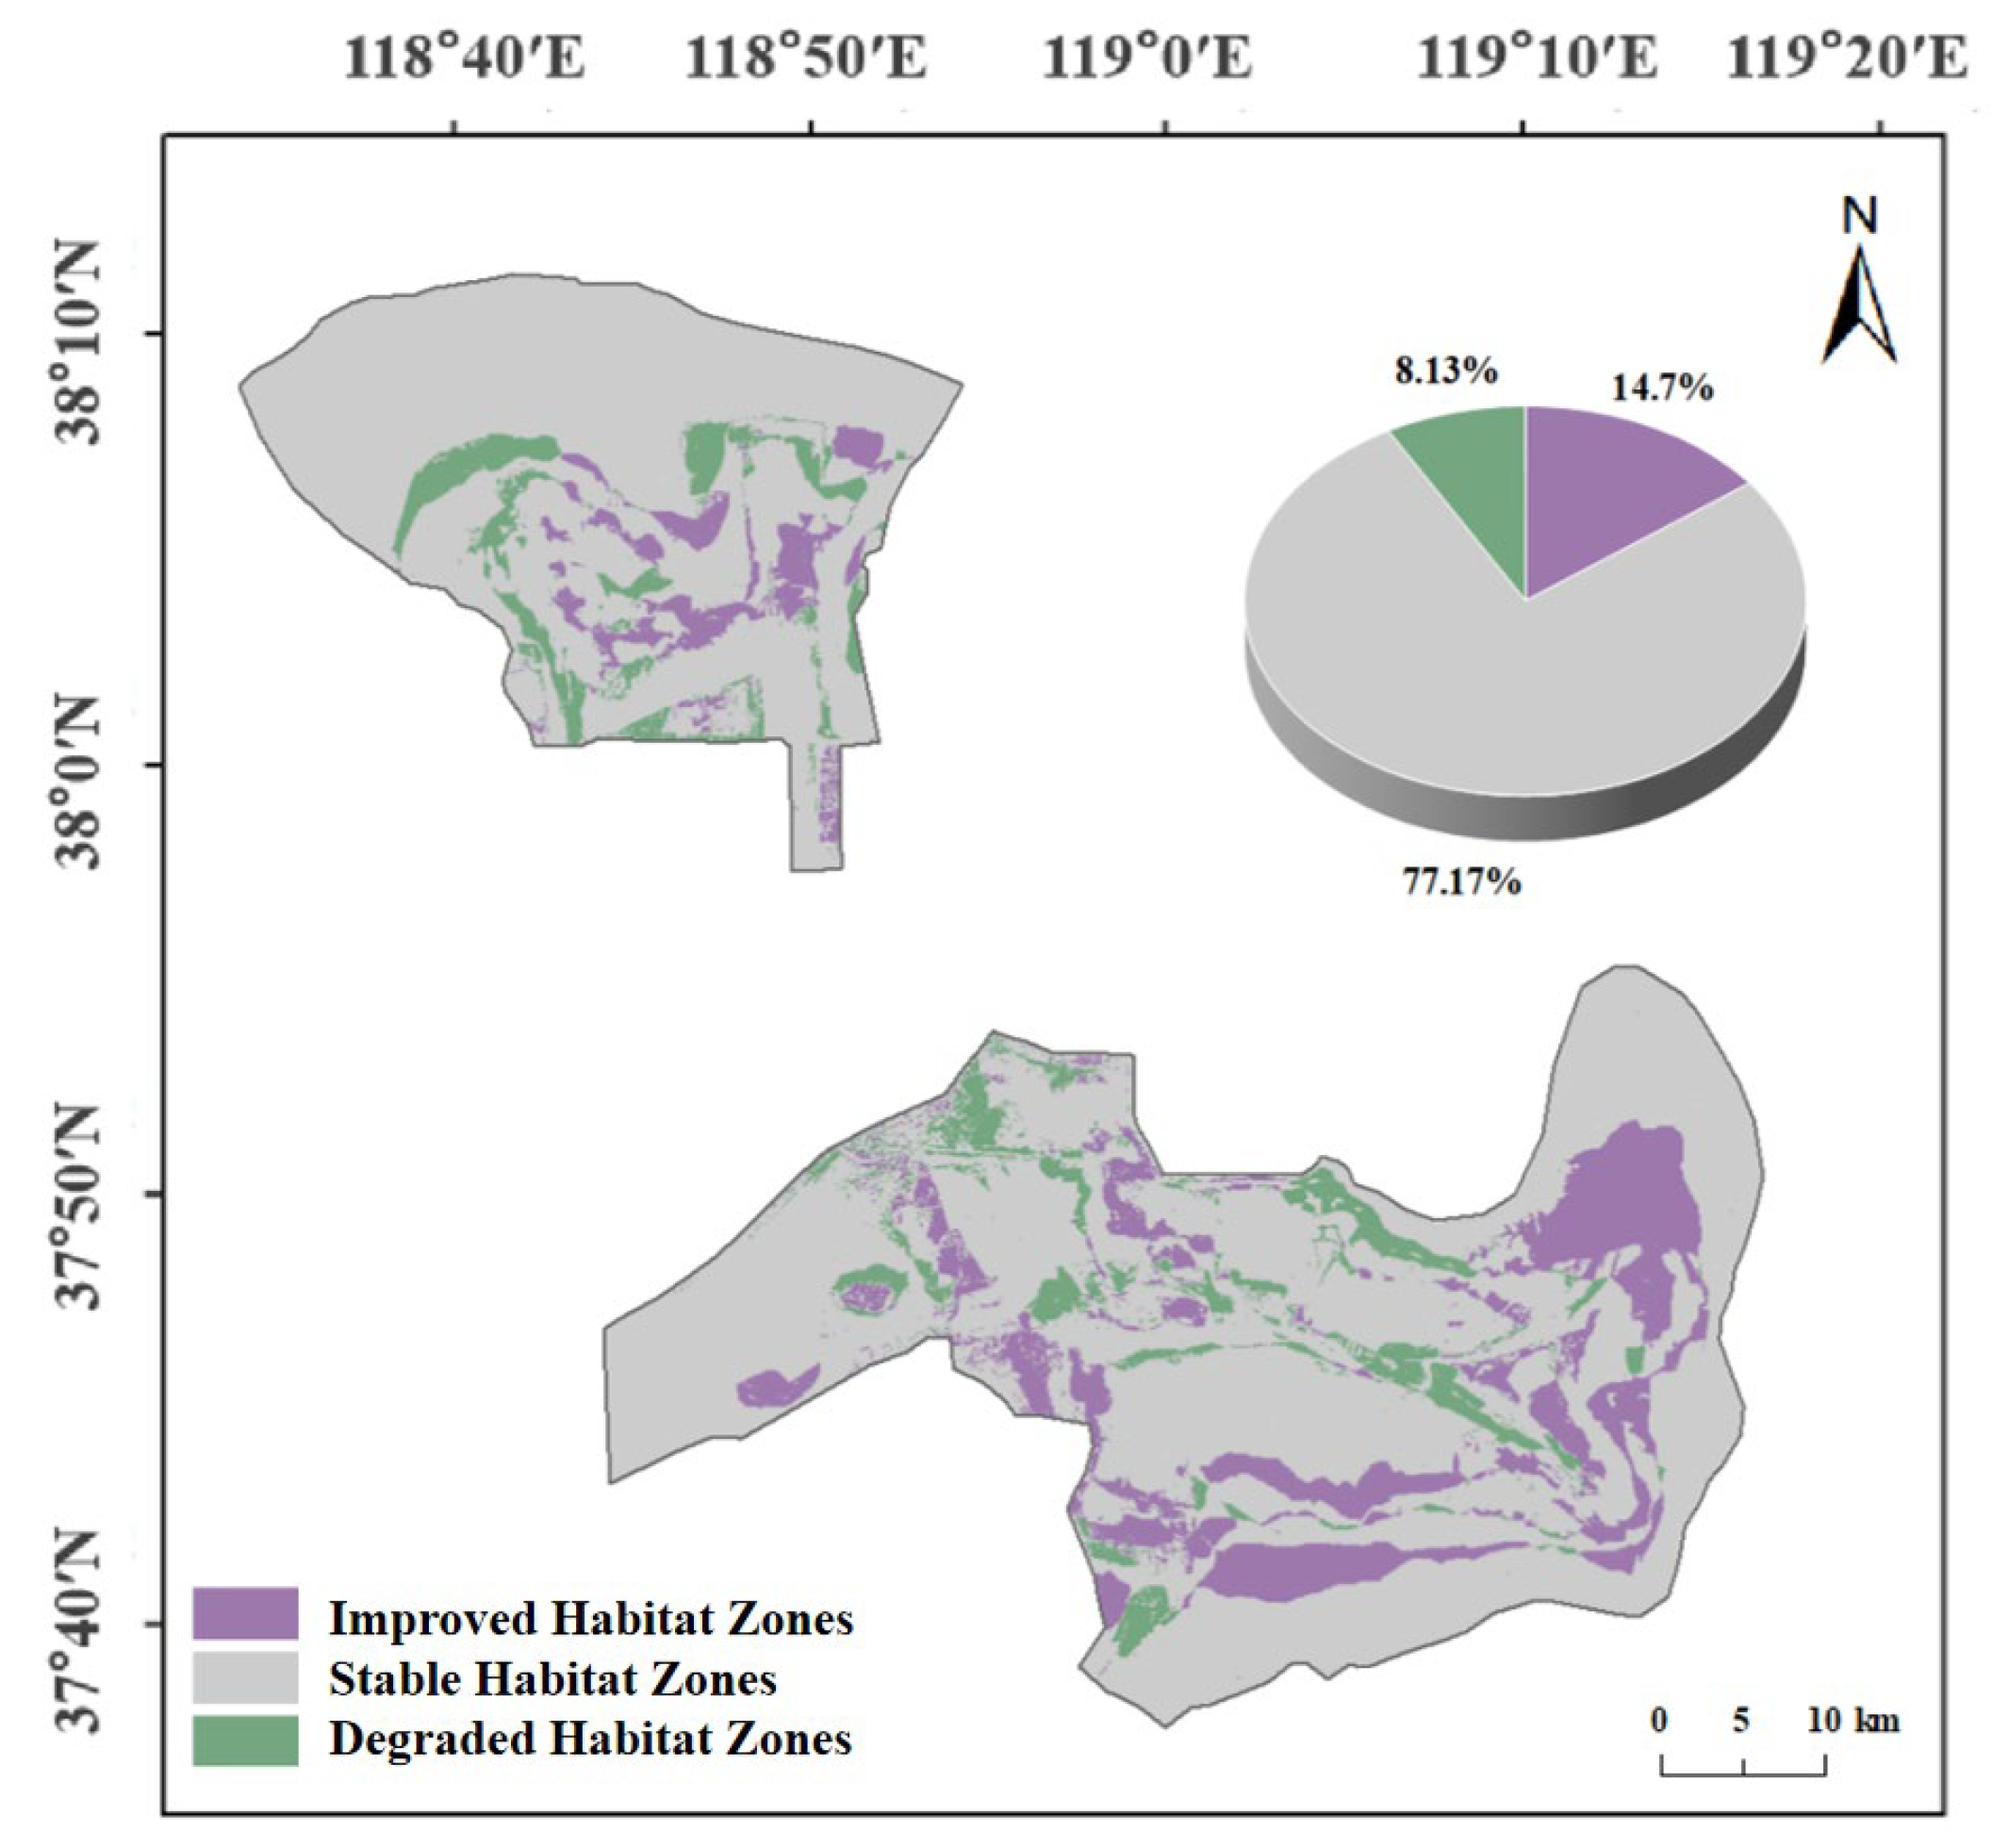
3.4.1. Spatiotemporal Changes in Suitable Habitat for Target Species

An overlay analysis of MaxEnt model outputs was conducted using ArcGIS 10.8 to produce spatial distributions of habitat suitability for waterbirds in the YRDNR, based on key habitat variables (Figure 6). The results revealed a distinct spatial heterogeneity in the distribution of suitable habitats across the five target species: C. boyciana, L. saundersi, G. japonensis, C. olor, and N. madagascariensis. Among the five species, C. olor had the smallest area of suitable habitat, concentrated primarily in open water bodies in the northern part of the reserve, including restored artificial wetlands along the Yellow River and historical channels near the Yiqian’er Station. L. saundersi and N. madagascariensis shared similar habitat preferences, predominantly inhabiting expansive mudflats and salt marshes rich in benthic resources. However, L. saundersi’s range extended further inland along the Yellow River. The Mostly Suitable Habitat for G. japonensis was mainly located along both banks of the Yellow River in the northern reserve, with additional areas south of the Yiqian’er Station. C. boyciana exhibited the broadest suitable habitat range, with Mostly Suitable Habitat and moderately suitable zones concentrated in the Dawenliu and Yellow River Estuary management areas; notably, little to no Mostly Suitable Habitat was observed near the old Yellow River mouth in the Yiqian’er region. Over the past two decades, all species, except C. olor, exhibited a general trend of initial decline followed by an increase in suitable habitat area (Figure 7). For C. boyciana and G. japonensis, the area of Mostly Suitable Habitat peaked in 2024 at 97.61 km2 and 109.90 km2, representing 7.06% and 7.96% of the total study area, respectively, compared to minimums of 4.80% and 6.80% in 2010. For L. saundersi and N. madagascariensis, Mostly Suitable Habitat declined overall before 2024, reaching minimum areas of 130.13 km2 and 115.82 km2 in 2020, decreases of 21.39% and 23.00% from 2005 levels. For C. olor, Mostly Suitable Habitat expanded rapidly from 2005 to 2010, with a 299.28% increase, then stabilized in subsequent years. Its Unsuitable Habitat peaked in 2015 at 918.28 km2, after which conditions improved and stabilized. From 2005 to 2020, Unsuitable Habitat for C. boyciana, L. saundersi, and N. madagascariensis increased overall, peaking in 2020 at 42.12%, 54.93%, and 5.62% of the study area, respectively, representing increases of 86.81 km2, 42.94 km2, and 50.14 km2 from 2005. For G. japonensis, the peak in Unsuitable Habitat occurred in 2015 (591.00 km2). From 2020 to 2024, as the total wetland area expanded, Unsuitable Habitat areas decreased by 14.31% (C. boyciana), 14.85% (L. saundersi), 7.49% (G. japonensis), and 16.00% (N. madagascariensis).

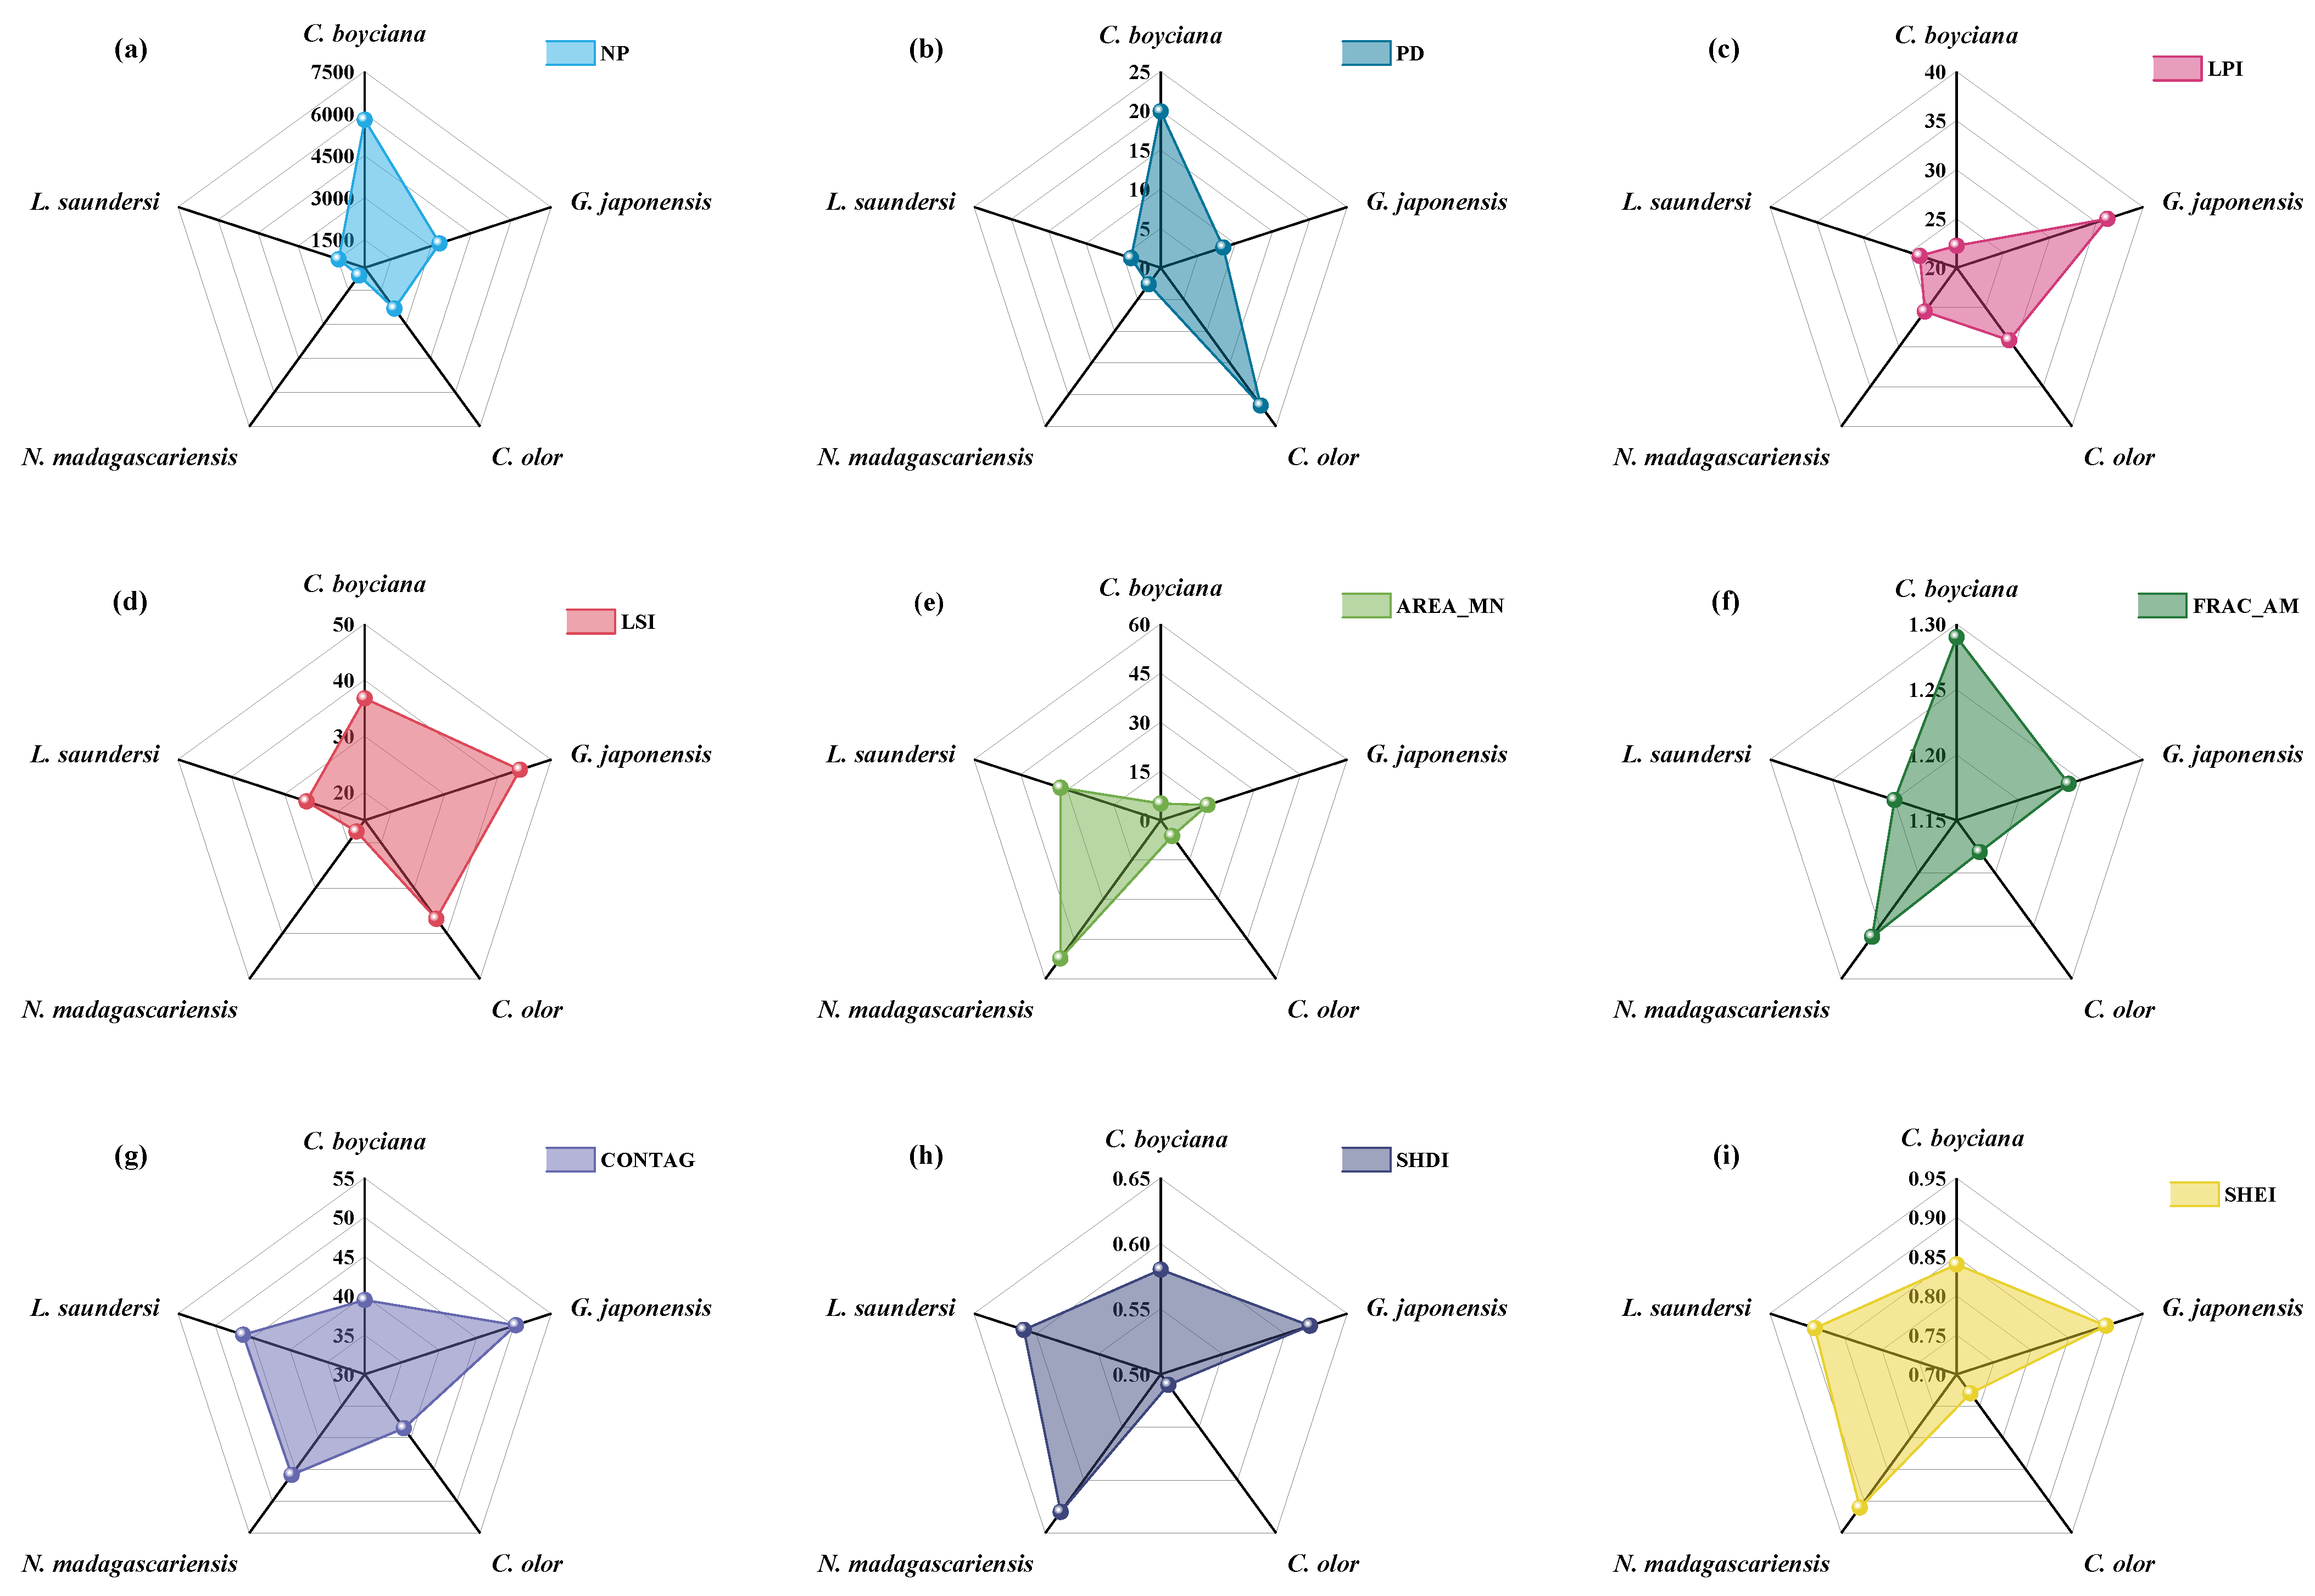
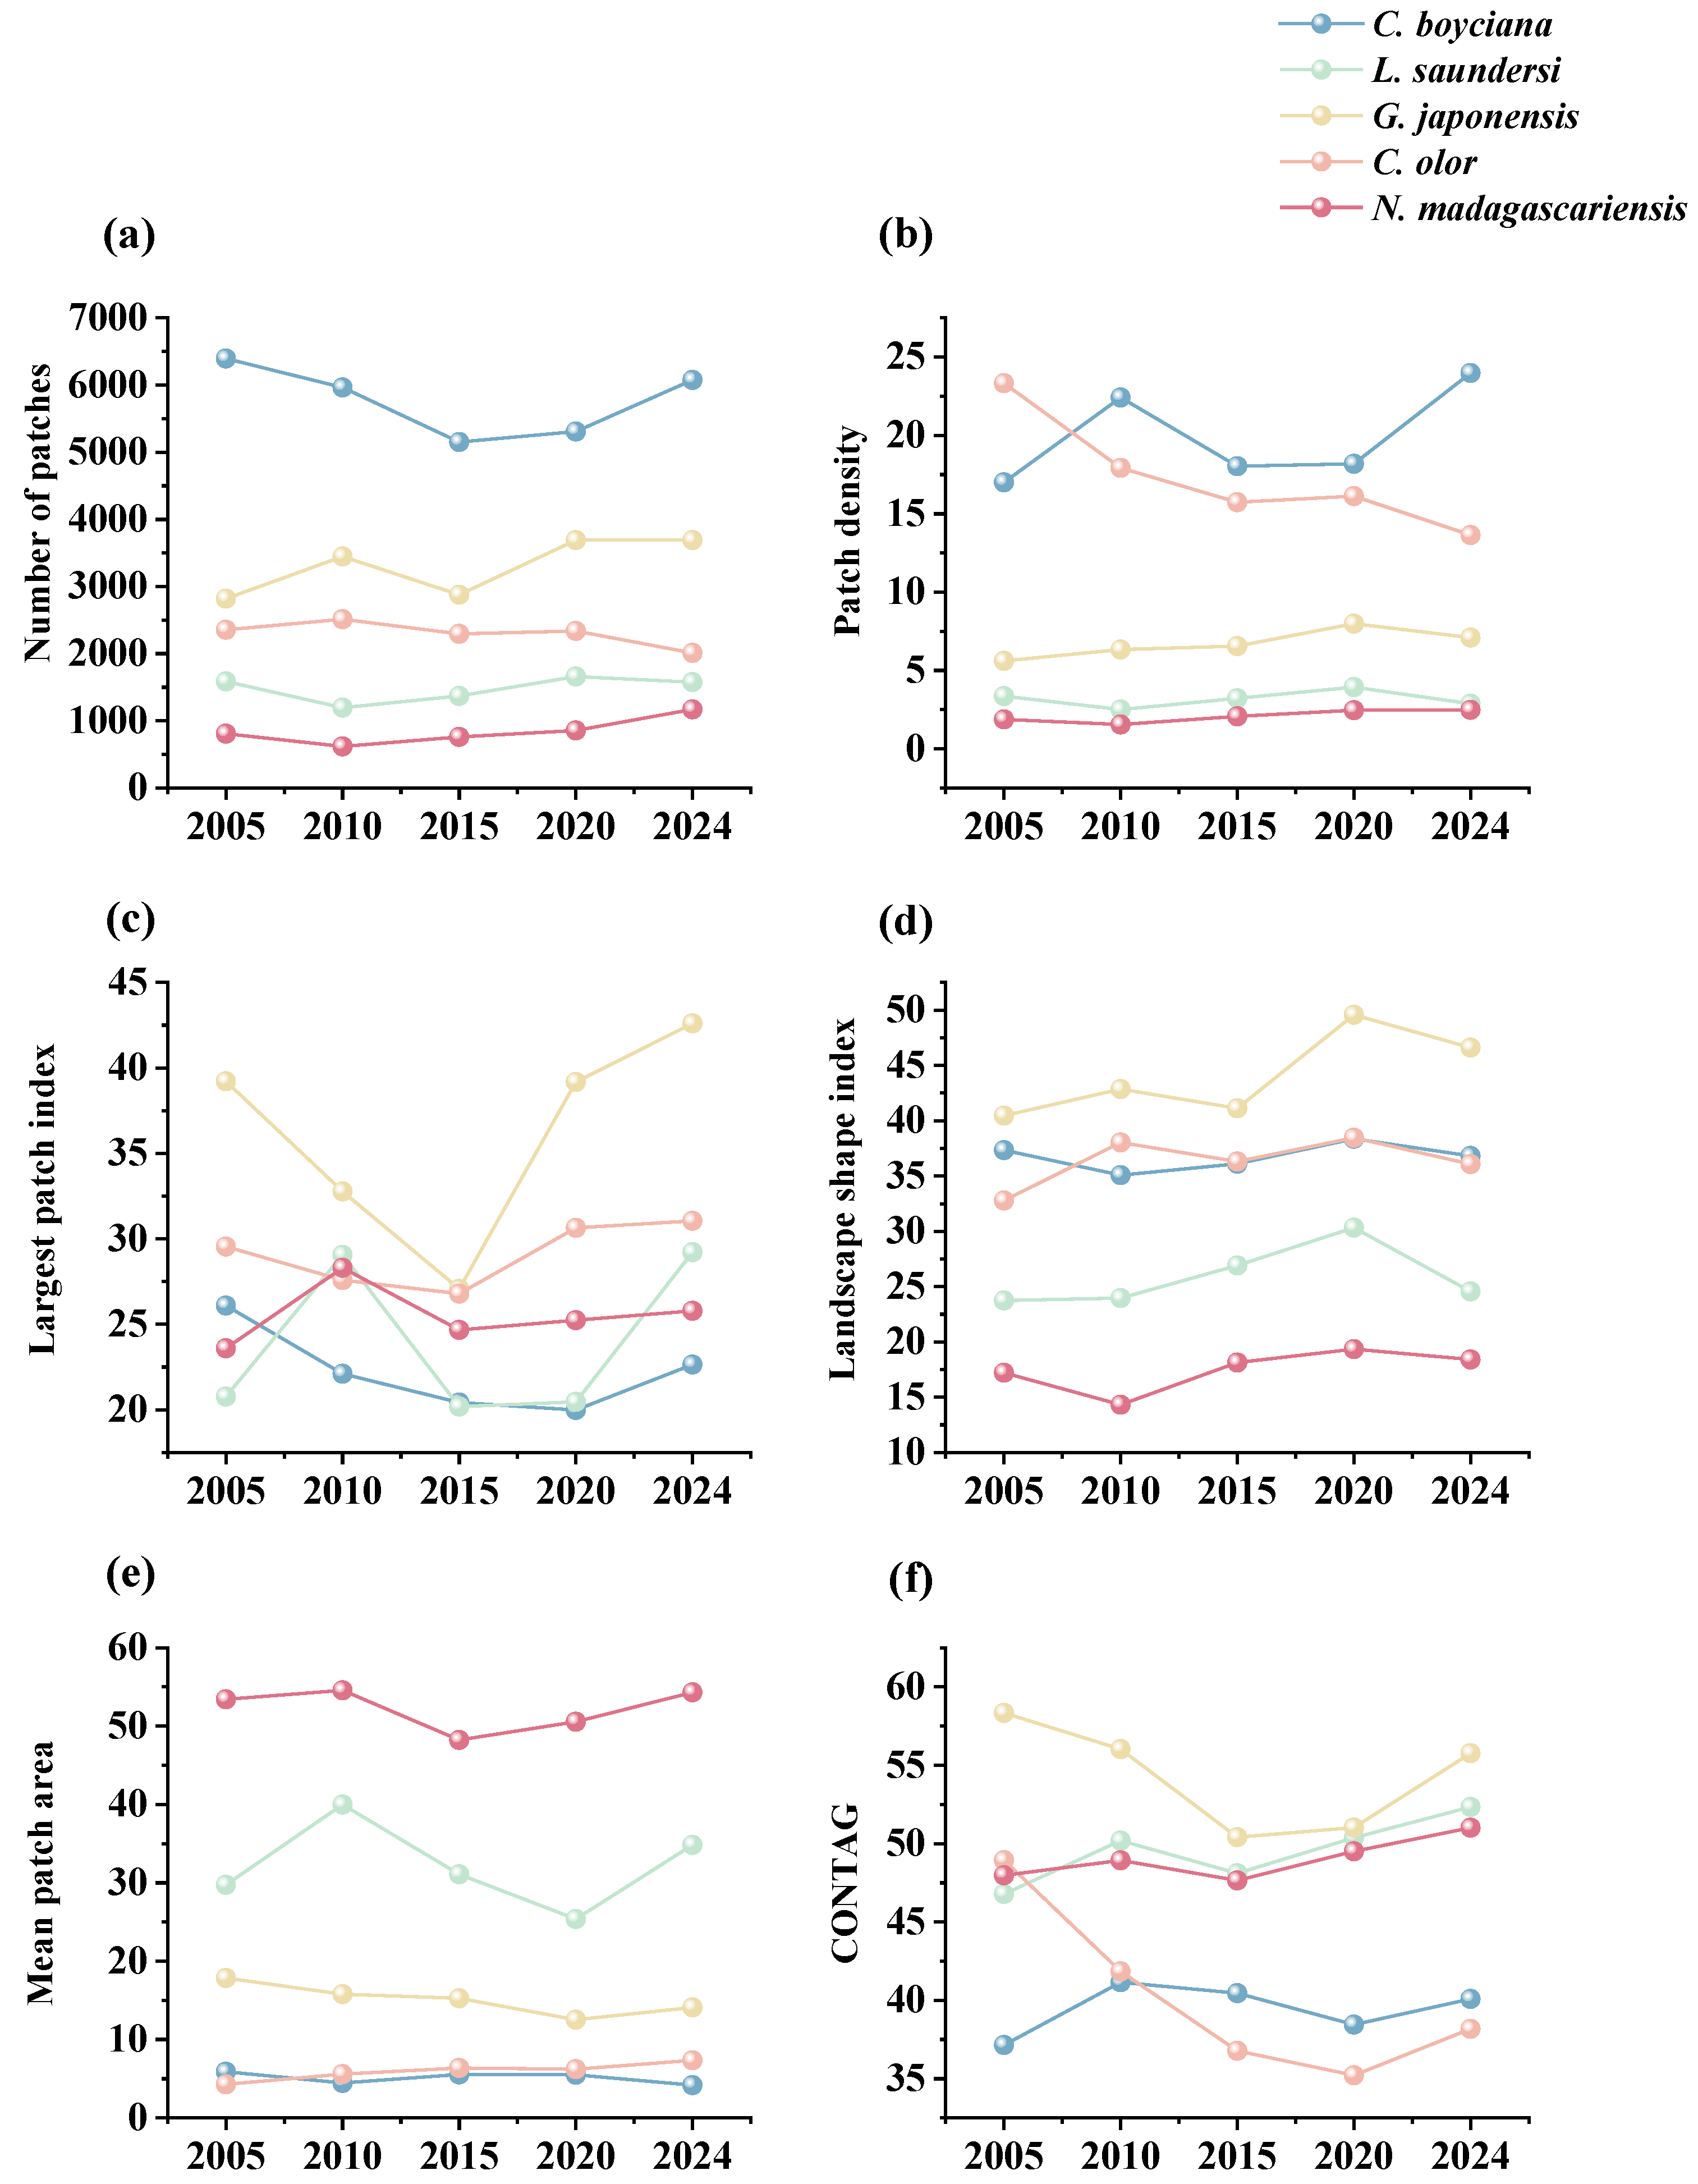
3.4.2. Changes in Landscape Pattern of Suitable Habitat

Analysis of the landscape indices for the Highly Suitable Habitat of waterbirds (Figure 8) revealed that L. saundersi and N. madagascariensis had significantly lower NP, PD, and LSI values compared to the other three rare waterbird species. The average NP values were 1477 and 843, PD values were 3.18 and 2.09, and LSI values were 25.90 and 17.48, respectively. The AREA_MN values for these species were significantly higher than those for the other three species, with average values of 52.22 and 32.2. These results indicate that the Highly Suitable Habitat of L. saundersi and N. madagascariensis exhibits a high spatial aggregation and low landscape fragmentation, with relatively low complexity in patch shape and a weaker influence from human activities. For C. boyciana, the NP, PD, and FRAC_AM values of its Highly Suitable Habitat were higher than those of the other four species, with average values of 5778, 19.92, and 1.29, respectively. However, the CONTAG, AREA_MN, and LPI values were lower than those of the other four species, with average values of 39.46, 5.11, and 22.25. This suggests that the Highly Suitable Habitat of C. boyciana is fragmented into many small patches, and the landscape contains scattered patch types and lacks large dominant patches. However, the patch shape still retains natural and complex characteristics. For G. japonensis, the LPI, CONTAG, and LSI values of its Highly Suitable Habitat were significantly higher than those of the other four species, with average values of 36.16, 54.31, and 44.12, respectively. This indicates that the Highly Suitable Habitat of G. japonensis is characterized by a high connectivity and dominance of core habitats, reflecting the presence of large, continuous core habitats in the landscape, although the boundaries are highly fragmented or naturally shaped into complex forms. The FRAC_AM, SHDI, and SHEI values for C. olor’s Highly Suitable Habitat were lower than those of the other four species, with average values of 1.18, 0.51, and 0.73, respectively. This suggests that the landscape of C. olor’s Highly Suitable Habitat contains fewer patch types, with a small number of types occupying an overwhelming dominance.
From a temporal perspective (Figure 9), the NP and PD values for L. saundersi and N. madagascariensis showed a trend of initial decline followed by an increase from 2005 to 2024. The lowest values occurred in 2010, with NP values of 115 and 619 and PD values of 2.50 and 1.55, respectively. This indicates that habitat fragmentation for L. saundersi and N. madagascariensis began to intensify after 2010. Between 2005 and 2024, the Largest Patch Index (LPI) values for the suitable habitats of C. boyciana and G. japonensis showed a decreasing trend followed by an increase, with the lowest values recorded in 2015 and 2020, respectively. By 2024, LPI values had increased to 22.64 and 42.60. Meanwhile, the Contagion Index (CONTAG) showed an overall increasing trend, reaching 38.18 and 55.78 in 2024. These changes suggest that over the past decade, the core habitats of C. boyciana and G. japonensis have become more concentrated, with the improved connectivity of suitable habitat patches and reduced habitat complexity. For C. olor, the Mean Patch Area (AREA_MN) of its suitable habitat exhibited a continuous upward trend from 2005 to 2024, with an overall increase of 71.04%. This indicates that the patch size of C. olor’s suitable habitat has steadily expanded, reflecting a gradual increase in the species’ habitat capacity.

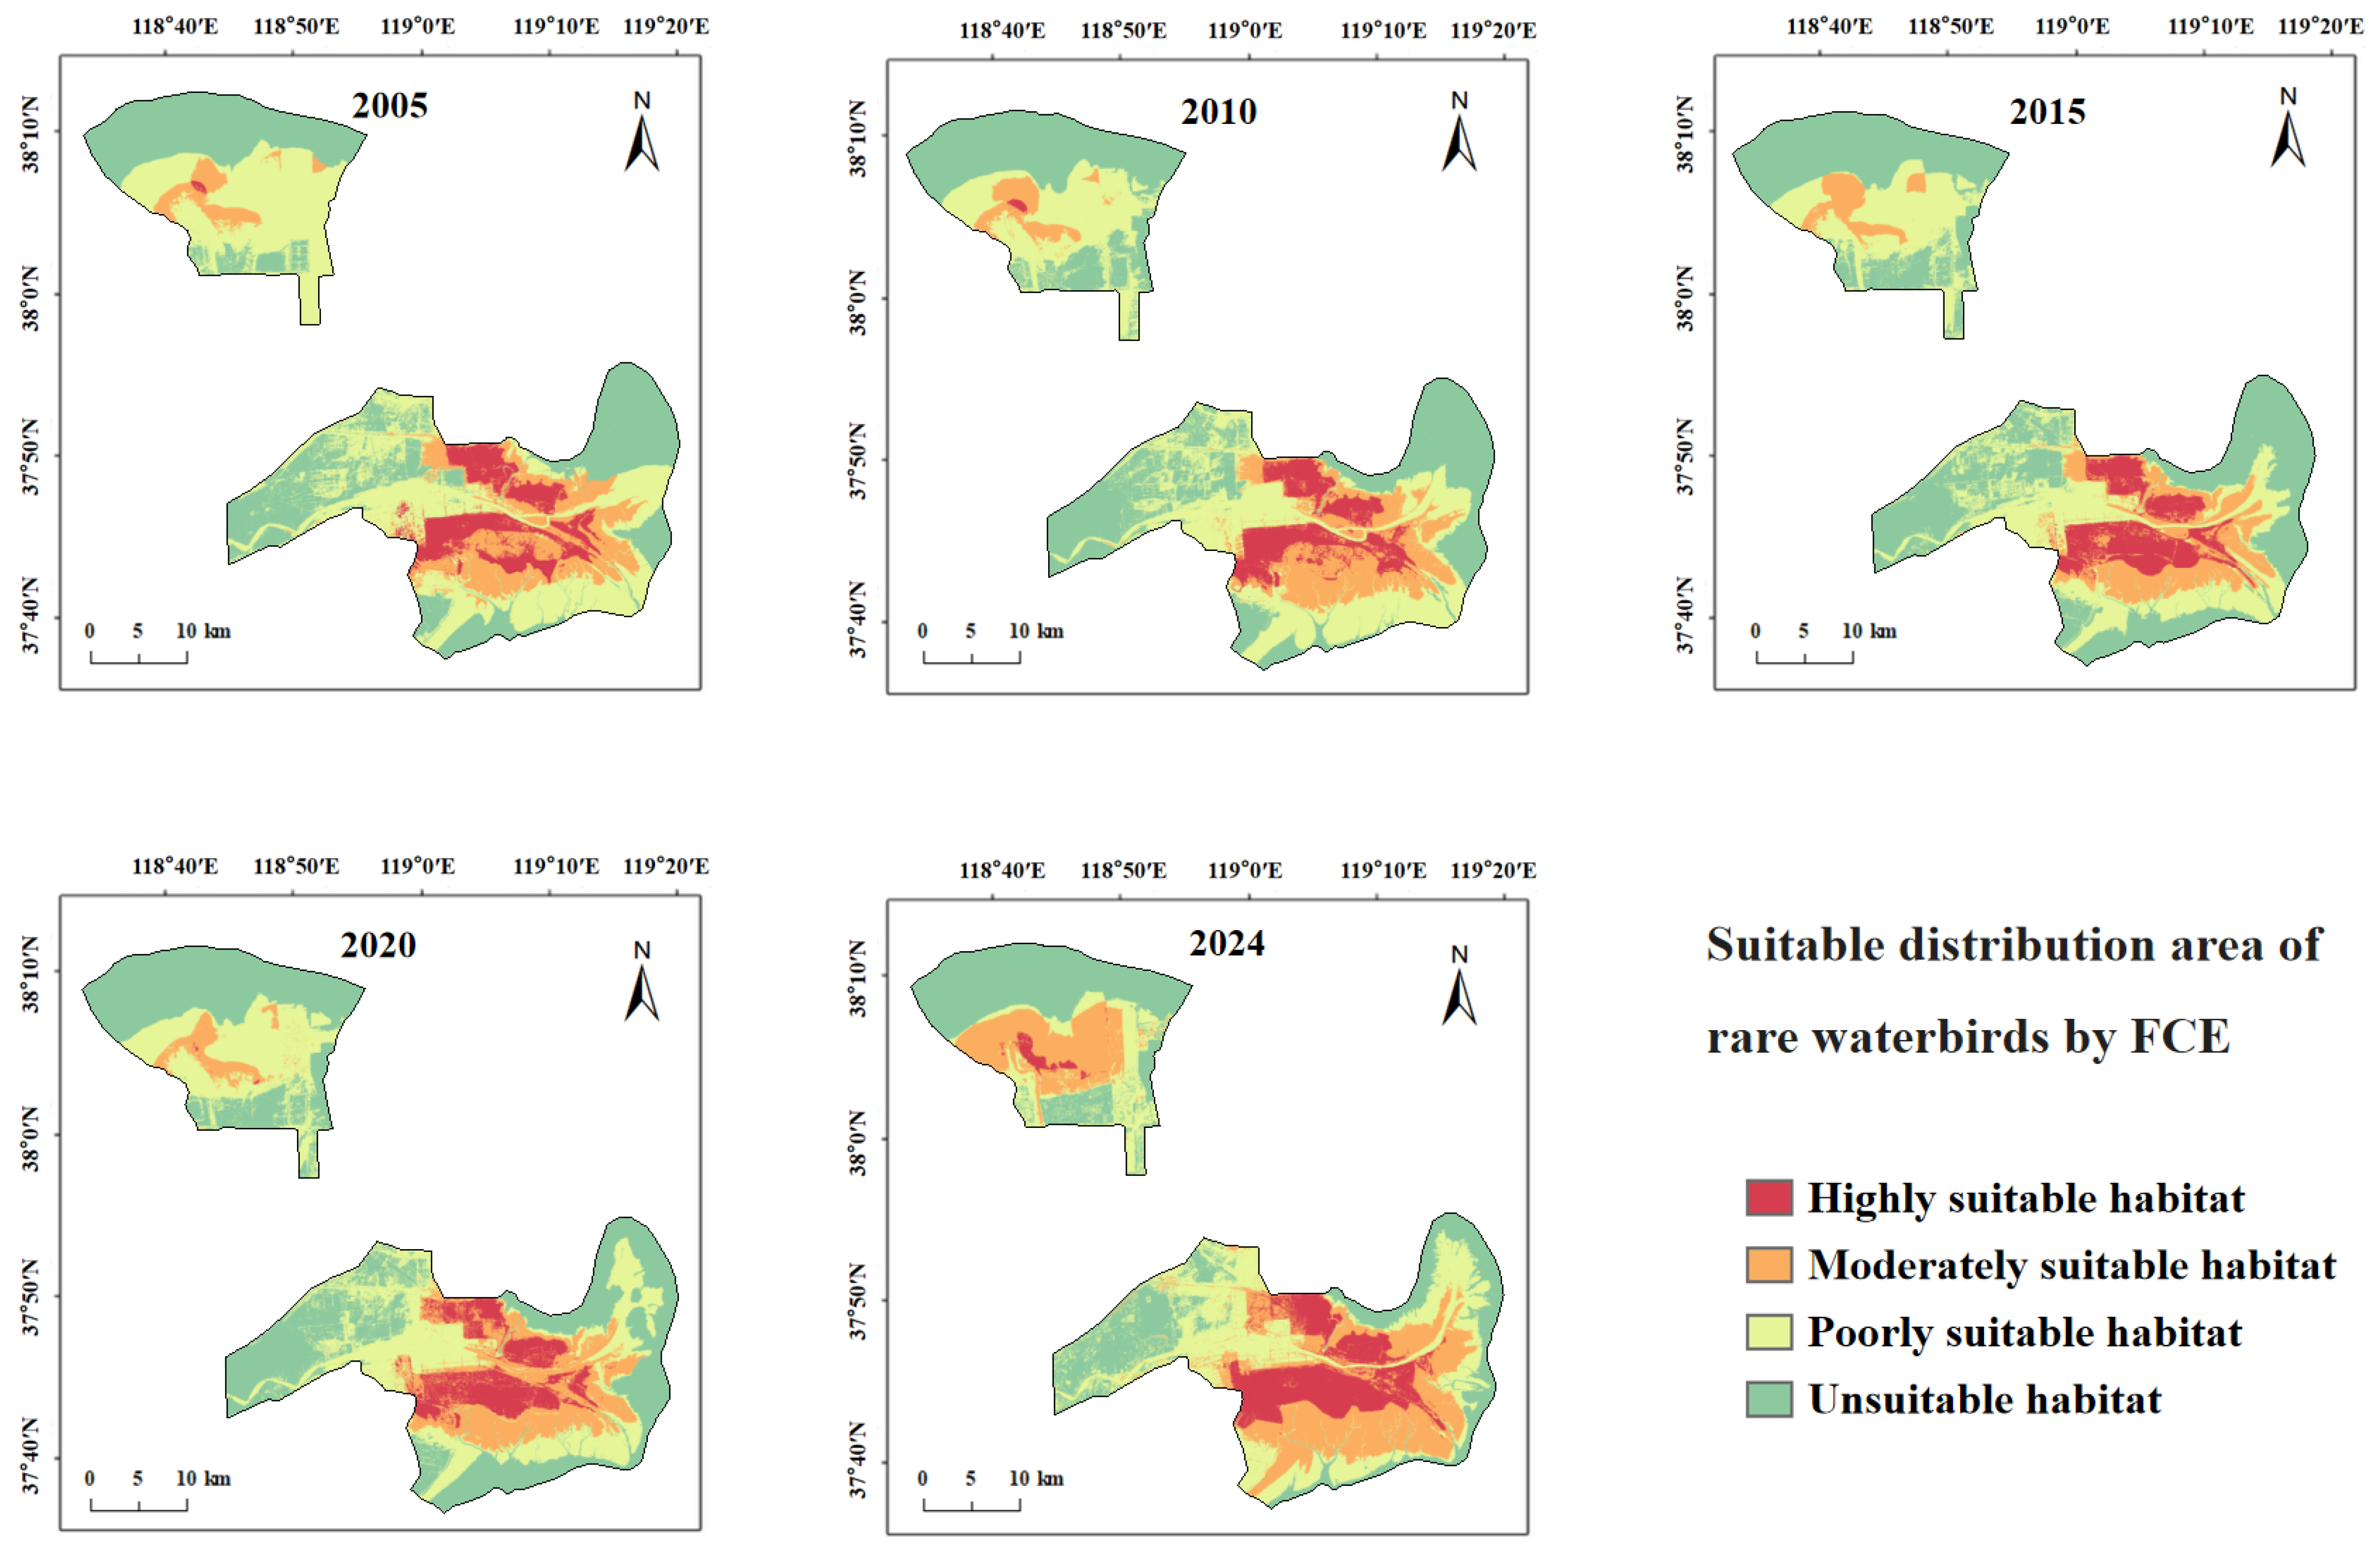
3.4.3. Fuzzy Comprehensive Evaluation Results of Rare Waterbird Habitat Suitability

Using the FCE model, the habitat suitability of rare waterbirds in the YRDNR from 2005 to 2024 was assessed. The results revealed notable temporal dynamics in habitat suitability across the study period (Figure 10). Overall, the area of Mostly Suitable Habitat exhibited a fluctuating upward trend, increasing from 238.23 km2 in 2005 to 259.79 km2 in 2024, a net gain of 9.04%. The extent of Moderately Suitable Habitat peaked in 2010, followed by a notable decline, with a partial recovery by 2024. Poorly Suitable Habitat showed a consistent downward trend, decreasing by 12.12% over the two decades. Unsuitable Habitat reached its maximum extent in 2015, then declined steadily, showing a 15.32% reduction by 2024.
Comparing habitat changes between 2005 and 2024 (Figure 11), areas of Improved Habitat Zones covered 202.98 km2, accounting for 14.71% of the study area. These zones were mainly concentrated in the Yiqian’er Station, the Dawenliu Station (particularly around the old Qingshuigou river channel), and the intertidal and marsh zones of the Yellow River Estuary Station. Stable Habitat Zones totaled 1065.63 km2 (77.22% of the study area), primarily distributed along both banks of the Yellow River, in offshore waters, and inland regions. Degraded Habitat Zones accounted for 112.31 km2 (8.14%), mainly located at the mouth of the Diaokou River near Yiqian’er Station and in the northern mudflats of the Yellow River Estuary Station.
Land Use/Land Cover statistics for Suitable Habitat types of rare waterbirds from 2005 to 2024 (Table 8) indicate a shift in habitat composition. In 2005, the dominant habitat types included Phragmites marshes (32.16%), mudflats (28.02%), and drylands (12.84%). By 2024, Suitable Habitat was primarily composed of mudflats (31.48%), Phragmites marshes (27.74%), paddy fields (12.85%), and pond wetlands (10.52%). Within Suitable Habitat, the proportional increase in paddy fields exceeded that of pond wetlands. In Mostly Suitable Habitat zones, pond wetlands represented 29.83% of the area, while paddy fields accounted for only 1.04%. However, in Moderately and Poorly Suitable Habitats, the proportion of pond wetlands declined to 5.10% and 3.95%, respectively, whereas paddy fields increased to 11.03% and 20.00%. These patterns reflect an ongoing transformation of wetland structure and land use composition in the region, with potential implications for species-specific habitat preferences and management strategies.

4. Discussion

4.1. Discussion of Findings

4.1.1. Differential Influence of Environmental Variables on Waterbird Species

Our analysis underscores the importance of environmental variables in shaping waterbirds’ distribution. In general, habitat type, water availability, and anthropogenic disturbance are key factors influencing waterbird habitat suitability. In this study, environmental variables exhibited species-specific effects on the five rare waterbirds, reflecting differential habitat preferences and ecological adaptations. Among all the variables, Land Use/Land Cover (LULC) emerged as the most influential factor determining habitat distribution for rare waterbirds in the YRDNR. This finding is consistent with previous research conducted in the Liaohe Estuary and Yancheng National Nature Reserves [57,60]. The results further reveal interspecific variation in responses to environmental factors. The models successfully recovered known habitat use patterns and also yielded new ecological insights. Specifically, mudflats and proximity to coastlines significantly influenced the habitat suitability of L. saundersi and N. madagascariensis. L. saundersi favored large, continuous tidal flats (PLAND_7), while N. madagascariensis responded more strongly to the accessibility of mudflats (D_7), indicating divergent foraging strategies and niche partitioning, findings aligned with previous research [61,62]. The present study accurately identified these key variables, reinforcing their ecological relevance for both species. For G. japonensis, the proportion of Phragmites marsh (PLAND_2) was a primary determinant of habitat suitability, confirming Phragmites marshes as its core habitat. This result closely aligns with findings in the Yancheng National Nature Reserve [63]. Additionally, mudflats, Suaeda marshes, and paddy fields also served as supplementary habitats, enriching our understanding of the species’ spatial habitat use. C. boyciana was primarily influenced by proximity to Phragmites beds and ponds, showing a preference for low-lying wetlands, river channels, mudflats, and pond systems. This aligns well with earlier studies suggesting that C. boyciana favors open water and wet meadows [64], confirming the validity of our model outputs in reflecting known habitat preferences. For C. olor, proximity to water bodies and the proportion of pond wetlands were the dominant variables. The species showed a strong dependence on aquatic habitats, particularly Phragmites marshes and open water. These preferences are consistent with its known behavior at migratory stopovers and breeding sites [65].
In summary, this study not only effectively reproduced known habitat use patterns for each species but also highlighted the differentiated influence of specific environmental factors. These findings offer a scientific foundation and new perspective for refining habitat conservation and spatial planning strategies. By implementing species-specific habitat management, conservation efforts can better accommodate ecological requirements and improve the carrying capacity of wetland ecosystems.

4.1.2. Response of Rare Waterbird Habitats to Wetland Dynamics

Between 2005 and 2024, the suitable habitat area and landscape configuration of the five target waterbird species exhibited a tightly coupled relationship with regional wetland dynamics. However, the direction and magnitude of ecological responses varied significantly among the species. Three key drivers of these dynamics were identified:
(1)
Spartina alterniflora Invasion and Control: Introduced in 1989 for shoreline stabilization, Spartina alterniflora began expanding rapidly across the intertidal zones after 2008, displacing native species such as Suaeda, Phragmites, and seagrasses [66]. This study found that after 2010, the suitable habitat area and mean patch size (AREA_MN) for L. saundersi and N. madagascariensis declined, while the patch density (PD) and landscape shape index (LSI) increased, patterns that correspond with habitat fragmentation due to Spartina alterniflora’s encroachment. These shorebirds rely on saltmarshes and tidal flats for breeding and foraging, feeding primarily on small fish and benthic invertebrates [61]. The invasion of Spartina alterniflora degrades the benthic habitat quality, reduces biodiversity, and limits access to feeding grounds, negatively impacting reproductive success [67]. After 2021, management efforts began restoring mudflat patches in the reserve [68]. As a result, the proportion of unsuitable habitat declined for L. saundersi, and the number of highly suitable patches (NP) stabilized. However, the Largest Patch Index (LPI) recovered more slowly, suggesting that while the habitat structure improved, core area recovery lagged behind.
(2)
Human Development Activities: Following the establishment of the Yellow River Delta Efficient Ecological Economic Zone in 2010, coastal development intensified. Natural wetlands and unused land were increasingly converted into aquaculture ponds and saltpans, leading to a steady increase in artificial wetland coverage [69]. This transformation directly threatened species dependent on natural habitats (e.g., L. saundersi and N. madagascariensis), while benefiting those reliant on freshwater availability (e.g., C. boyciana and C. olor) [70]. In this study, C. boyciana’s habitat showed high NP and PD values, indicating fragmented and dispersed habitat patches lacking dominant core areas, consistent with prior assessments of wetland fragmentation in the delta [71]. For C. olor, the expansion in open water bodies (pond wetlands and saltpans) resulted in a 71.04% increase in AREA_MN. Patch shapes remained regular and structurally stable, as reflected by low FRAC_AM and LSI values. Although landscape diversity (SHDI < 0.6) remained low, a high connectivity and spatial continuity met the species’ need for safe, open aquatic habitats [72]. It is important to note that while the conversion from natural to functionally homogeneous artificial wetlands may support short-term increases in habitat area and population size, it may also reduce overall ecosystem resilience and heterogeneity, potentially undermining community diversity and reproductive stability [73,74].
(3)
Ecological Restoration Projects: To improve wetland health, the Yellow River Conservancy Commission initiated ecological water replenishment projects in 2010, targeting the restoration of degraded freshwater wetlands. These efforts effectively improved the water–salt balance and vegetation recovery within the reserve, curbing fragmentation in the northern mudflats and facilitating land accretion in the modern delta region [75]. The resulting mudflat expansion benefited habitat availability for L. saundersi, G. japonensis, and N. madagascariensis. Simultaneously, Phragmites became the dominant vegetation in restored areas [75], providing an optimal habitat for species like C. boyciana and G. japonensis that favor Phragmites marshes. This study observed that the highly suitable habitats for G. japonensis and C. boyciana expanded significantly following ecological water supplementation. Metrics such as CONTAG and LPI also improved, indicating not only an increase in habitat area but also an enhanced spatial cohesion and structural integration of habitat patches.

4.1.3. Habitat Suitability Dynamics Based on FCE Evaluation

This study applied the FCE model to analyze the spatiotemporal evolution of habitat suitability for rare waterbirds from 2005 to 2024. The results indicate that the area of highly suitable habitat increased overall, while the extent of unsuitable habitat began to decline after 2015. These trends reflect a general improvement in habitat quality within the reserve. Natural wetlands, such as mudflats and Phragmites marshes, were identified as critical core habitats for rare waterbirds. The recovery of ecological functions in these areas has been a key factor in improving habitat quality [76]. These habitats are typically located in regions with dense wetland networks, a high vegetation cover, and good food availability, all of which align with the ecological requirements of multiple waterbird species [77]. Changes in land use have also contributed to fluctuations in moderately and marginally suitable habitats. In particular, the increasing presence of paddy fields and pond wetlands has highlighted their role in supporting habitat services. Although artificial wetlands can provide short-term habitat alternatives, their long-term stability and resistance to disturbance are generally lower than those of natural wetlands. This distinction should be considered in future reserve management planning [78]. By 2024, pond wetlands accounted for 29.83 percent of the highly suitable habitat area. This suggests that well-designed artificial water bodies can provide important habitat functions for certain species. Previous studies have also shown that degraded wetlands can quickly recover biodiversity functions through ecological restoration [79]. In terms of spatial distribution, areas with improved habitat conditions were primarily located in well-managed zones with limited land reclamation activity. In contrast, habitat degradation was concentrated in the northern mudflats and certain estuarine areas where human disturbance was more intense. These patterns reinforce the strong association between habitat change and land-use intensity, consistent with findings from other regions [78,79].
Overall, future conservation should prioritize the in situ protection of natural wetlands such as mudflats and Phragmites marshes. At the same time, management strategies for artificial wetlands, including paddy fields and pond systems, should be guided by ecological suitability. Enhancing the ecological function of moderately suitable areas and controlling the expansion of marginal and unsuitable zones will be essential to sustaining habitat quality and waterbird diversity in the region in the long term.

4.2. Conservation Recommendations

Based on the results of this study, species-specific and refined habitat conservation strategies are proposed in response to the ecological characteristics and environmental responses of the five target waterbird species in the YRDNR. For C. boyciana, which is highly dependent on “Phragmites–pond” composite wetland, it is recommended to establish ecological buffer zones in its distribution hotspots (such as the Dawenliu and Yellow River Estuary management stations), optimize hydrological conditions and vegetation composition, and reconstruct suitable habitat patches in the Yiqian’er Station area through water regulation and Phragmites replanting. L. saundersi and N. madagascariensis prefer mudflat wetlands rich in benthic resources. It is necessary to enhance the integrity of southern mudflats, delineate “waterbird priority protection zones”, and improve the availability of foraging resources through substrate enhancement, seasonal tidal regulation, and the introduction of salt-tolerant wetland vegetation. For G. japonensis, which depends on large, contiguous Phragmites marshes, human-induced fragmentation should be strictly controlled. A connectivity strategy combining “core patches and ecological corridors” is recommended to strengthen the habitat network structure. Given the high sensitivity of C. olor to artificial wetlands, a “water quality zoning–habitat complex system” should be developed in the old river channel area of the Yellow River. Additionally, human activity exclusion zones should be established during winter to maintain water quality and habitat security.
Regarding habitat dynamics, for areas of habitat improvement (such as the active estuary and old Qingshuigou river channel), priority should be given to implementing wetland restoration projects guided by “protective use and natural succession”. Native plants (such as Phragmites and Suaeda) should replace Spartina alterniflora to enhance its ecological function and stability. For degraded areas (such as the Diaokou estuary and the northern mudflats of the Yellow River Estuary), integrated measures of “disturbance isolation, hydrological restoration, and substrate enhancement” should be carried out. At the landscape level, habitat connectivity should be improved through the integration of patches, with the establishment of ecological nodes such as wetland green islands to serve as patch bridges. Meanwhile, habitats’ heterogeneity should be maintained by preserving dominant patches in core areas and constructing diverse microhabitats in marginal zones. These differentiated strategies provide scientific support and practical pathways for achieving the long-term stability of wetland ecosystem functions and the continued recovery of rare waterbird populations.

4.3. Limitations and Future Directions

This study highlights the effectiveness of habitat modeling based on the MaxEnt and HSI approaches as a tool for long-term ecological monitoring, particularly in regions lacking continuous biological survey data. This method enables the systematic tracking of temporal changes in habitat suitability, supporting the identification of critical conservation areas and degradation trends. As a result, it offers a quantitative foundation for the allocation of resources and management interventions. Compared with traditional field-based methods, this approach demonstrates clear advantages in terms of cost, efficiency, and spatiotemporal coverage. It holds promise as a complement, and potentially a partial substitute, for on-the-ground monitoring. Moreover, the model outputs can be integrated with UAV imagery, remote sensing data, or other GIS platforms to enable multi-source data fusion, facilitating the development of continuous and dynamic ecological monitoring systems.
Although this study provides important insights into habitat suitability assessments for rare waterbirds in the Yellow River Delta, several limitations remain and should be addressed in future research: (1) Nutrient dynamics have a significant impact on vegetations’ structure and succession, which may in turn indirectly affect habitat selection by waterbirds. Overlooking this process may result in the omission of key ecological mechanisms that influence both vegetation changes and waterbirds’ distribution. Future studies should consider incorporating nutrient dynamics into habitat modeling, particularly in potential nesting breeding areas, to more comprehensively understand the ecological causal relationships underlying habitat suitability. (2) Wetlands exhibit a marked intra-annual and inter-annual variability. Assessments based on annual surveys may not fully reflect the dynamic changes in wetland systems. Therefore, future research should implement long-term, seasonal ecological monitoring to capture the seasonal variations in wetlands, thereby improving the scientific validity and practical relevance of habitat suitability assessments for rare waterbirds.

5. Conclusions

This study integrated the MaxEnt and HSI models, using field survey data in combination with high-resolution time-series Land Use/Land Cover (LULC) data to systematically assess annual-scale habitat suitability dynamics from 2005 to 2024 for five rare waterbird species—C. boyciana, L. saundersi, G. japonensis, C. olor, and N. madagascariensis—in the YRDNR. The following conclusions were drawn:
(1)
The integrated modeling approach effectively supports long-term habitat suitability assessment for waterbirds. The combination of MaxEnt and HSI models enabled precise, multi-species, multi-factor, long-term habitat suitability evaluations. The results confirm the reliability and applicability of this approach for monitoring species habitats and analyzing spatiotemporal changes.
(2)
Suitable Habitat distribution patterns are highly heterogeneous. Clear interspecific differences in habitat preferences were observed: C. boyciana was primarily associated with Phragmites–pond composite wetlands; L. saundersi and N. madagascariensis depended on continuous mudflats; G. japonensis favored Phragmites marshes; and C. olor preferred large open water bodies. Suitable Habitats were mainly distributed along the Yellow River mainstem and in the southern intertidal zone.
(3)
Habitat suitability declined and then recovered during the study period, reflecting the early effectiveness of ecological restoration. From 2010 to 2020, the area of Mostly Suitable Habitat for several species declined. However, following the implementation of Spartina alterniflora’s removal and wetland water replenishment projects after 2020, habitat quality improved significantly. By 2024, the total area of Mostly Suitable Habitat exceeded that of 2005.
(4)
Landscape pattern changes reflect trends in habitat fragmentation and connectivity. The Highly Suitable Habitats of L. saundersi and N. madagascariensis were characterized by a low fragmentation and high spatial aggregation. For C. boyciana and G. japonensis, although patch numbers were high, habitat connectivity improved. C. olor occupied large, structurally simple patches. Overall, the landscape structure became increasingly complex.
(5)
Habitat changes were strongly influenced by wetland succession and human activities. The reduction in mudflats and Phragmites marshes, along with the expansion of artificial wetlands such as paddy fields and pond systems, altered the habitat structure for some species. In contrast, ecological restoration projects enhanced the connectivity and diversity of Mostly Suitable Habitat, playing a positive role in overall habitat quality.

Supplementary Materials

The following supporting information can be downloaded at: https://www.mdpi.com/article/10.3390/su17125326/s1, Figure S1: Distribution points of five rare water birds; Table S1: The list of waterbirds in sampling area; Table S2. Habitat and sample lines of bird survey; Table S3. Evaluation index system in FCE.

Author Contributions

Conceptualization, Method, Writing—review and editing, Supervision: Q.W.; Software, Data management, Writing—manuscript preparation, Visualization: H.W.; Verification, formal analysis, Investigation, Project management: Y.C., Y.Z. and H.W. All authors have read and agreed to the published version of the manuscript.

Funding

This work was supported by the National Key Research and Development Program of China (Project No. 2022YFC3204300).

Institutional Review Board Statement

Not applicable.

Informed Consent Statement

Not applicable.

Data Availability Statement

Data will be made available on request.

Acknowledgments

This study was funded by the National Key Research and Development Program of China (Project No. 2022YFC3204300). We is thanks to L for her insightful discussion of the experimental design, and D for his theoretical support of bird observations in the field. Finally, we extend our gratitude to the anonymous reviewers for their constructive comments.

Conflicts of Interest

The authors declare that they have no known competing financial interests or personal relationships that could have appeared to influence the work reported in this paper.

References

  1. Liu, N.; Ma, Z. Ecological Restoration of Coastal Wetlands in China: Current Status and Suggestions. Biol. Conserv. 2024, 291, 110513. [Google Scholar] [CrossRef]
  2. Mokany, K.; Ware, C.; Harwood, T.D.; Schmidt, R.K.; Ferrier, S. Habitat-based Biodiversity Assessment for Ecosystem Accounting in the Murray-Darling Basin. Conserv. Biol. 2022, 36, e13915. [Google Scholar] [CrossRef] [PubMed]
  3. Zhang, L.; Ouyang, Z. Focusing on Rapid Urbanization Areas Can Control the Rapid Loss of Migratory Water Bird Habitats in China. Glob. Ecol. Conserv. 2019, 20, e00801. [Google Scholar] [CrossRef]
  4. Blankespoor, B.; Dasgupta, S.; Laplante, B. Sea-Level Rise and Coastal Wetlands. Ambio 2014, 43, 996–1005. [Google Scholar] [CrossRef] [PubMed]
  5. Schuerch, M.; Spencer, T.; Temmerman, S.; Kirwan, M.L.; Wolff, C.; Lincke, D.; McOwen, C.J.; Pickering, M.D.; Reef, R.; Vafeidis, A.T. Future Response of Global Coastal Wetlands to Sea-Level Rise. Nature 2018, 561, 231–234. [Google Scholar] [CrossRef]
  6. Streck, C. Synergies between the Kunming-Montreal Global Biodiversity Framework and the Paris Agreement: The Role of Policy Milestones, Monitoring Frameworks and Safeguards. Clim. Policy 2023, 23, 800–811. [Google Scholar] [CrossRef]
  7. Wang, W.; Feng, C.; Liu, F.; Li, J. Biodiversity Conservation in China: A Review of Recent Studies and Practices. Environ. Sci. Ecotechnology 2020, 2, 100025. [Google Scholar] [CrossRef]
  8. Duan, H.; Yu, X.; Xia, S.; Zhang, G. Waterbird Habitat Loss: Fringes of the Yellow and Bohai Seas along the East Asian-Australasian Flyway. Land Degrad. Dev. 2021, 32, 4174–4182. [Google Scholar] [CrossRef]
  9. Ma, T.; Li, X.; Bai, J.; Cui, B. Habitat Modification in Relation to Coastal Reclamation and Its Impacts on Waterbirds along China’s Coast. Glob. Ecol. Conserv. 2019, 17, e00585. [Google Scholar] [CrossRef]
  10. Wang, C.; Liu, H.; Li, Y.; Dong, B.; Qiu, C.; Yang, J.; Zong, Y.; Chen, H.; Zhao, Y.; Zhang, Y. Study on Habitat Suitability and Environmental Variable Thresholds of Rare Waterbirds. Sci. Total Environ. 2021, 785, 147316. [Google Scholar] [CrossRef]
  11. Zhang, X.; Zhang, Z.; Wang, W.; Fang, W.-T.; Chiang, Y.-T.; Liu, X.; Ju, H. Vegetation Successions of Coastal Wetlands in Southern Laizhou Bay, Bohai Sea, Northern China, Influenced by the Changes in Relative Surface Elevation and Soil Salinity. J. Environ. Manag. 2021, 293, 112964. [Google Scholar] [CrossRef] [PubMed]
  12. Bai, M.-L.; Chih, W.-C.; Lai, Y.-C.; Lee, P.-F.; Lien, Y.-Y. Aquaculture Ponds as Important High-Tide Habitats for Waterbirds along the West Coast of Taiwan. Ornithol. Sci. 2018, 17, 55–67. [Google Scholar] [CrossRef]
  13. Wang, C.; Wang, G.; Dai, L.; Liu, H.; Li, Y.; Qiu, C.; Zhou, Y.; Chen, H.; Dong, B.; Zhao, Y. Study on the Effect of Habitat Function Change on Waterbird Diversity and Guilds in Yancheng Coastal Wetlands Based on Structure-Function Coupling. Ecol. Indic. 2021, 122, 107223. [Google Scholar] [CrossRef]
  14. Xie, Y.; Zou, J.; Chen, Y.; Li, F.; Jiang, Q. Are Wading Birds the Ideal Focal Species for Broader Bird Conservation? A Cost-Effective Approach to Ecological Network Planning. Ecol. Indic. 2024, 160, 111785. [Google Scholar] [CrossRef]
  15. Yang, X.; Liu, W.; Li, S.; Ma, Z.; Chen, C.; Gu, W.; Qu, M.; Zhang, C.; Ding, Z.; Xu, Y. Restoration of Urban Waterbird Diversity: A Case Study of the Construction of a Waterbird Ecological Corridor in the Guangdong-Hong Kong-Macao Greater Bay Area, Southern China. Glob. Ecol. Conserv. 2022, 39, e02277. [Google Scholar] [CrossRef]
  16. Simberloff, D. Flagships, Umbrellas, and Keystones: Is Single-Species Management Passé in the Landscape Era? Biol. Conserv. 1998, 83, 247–257. [Google Scholar] [CrossRef]
  17. Kim, J.H.; Park, S.; Kim, S.H.; Lee, E.J. Identifying High-Priority Conservation Areas for Endangered Waterbirds Using a Flagship Species in the Korean DMZ. Ecol. Eng. 2021, 159, 106080. [Google Scholar] [CrossRef]
  18. Duan, H.; Xia, S.; Jackson, M.V.; Zhao, N.; Liu, Y.U.; Teng, J.; Meng, Z.; Yu, X.; Shi, J. Identifying New Sites of Significance to Waterbirds Conservation and Their Habitat Modification in the Yellow and Bohai Seas in China. Glob. Ecol. Conserv. 2020, 22, e01031. [Google Scholar] [CrossRef]
  19. Yang, W.; Pei, J.; Li, X.X.; Sun, T.; Wang, W.Y. Systematic Assessment and Countermeasures for Ecological Restoration of Degraded Wetlands in the Yellow River Delta. J. Beijing Norm. Univ. Nat. Sci. 2018, 54, 98–103. [Google Scholar] [CrossRef]
  20. Kaky, E.; Nolan, V.; Alatawi, A.; Gilbert, F. A Comparison between Ensemble and MaxEnt Species Distribution Modelling Approaches for Conservation: A Case Study with Egyptian Medicinal Plants. Ecol. Inform. 2020, 60, 101150. [Google Scholar] [CrossRef]
  21. Yan, Z.S.; Shao, M.Q.; Wang, J.Y. Prediction of Wintering Habitat Suitability and Key Influencing Factors for the Common Crane in China. Chin. J. Appl. Ecol. 2025, 36, 578–586. [Google Scholar] [CrossRef]
  22. Elith, J.; Leathwick, J.R. Species Distribution Models: Ecological Explanation and Prediction across Space and Time. Annu. Rev. Ecol. Evol. Syst. 2009, 40, 677–697. [Google Scholar] [CrossRef]
  23. Liao, Y.; Wang, X.Y.; Zhou, J.M. Habitat Suitability Evaluation Model and Validation for the Giant Panda Based on Geographical Detector. J. Geo-Inf. Sci. 2016, 18, 767–778. [Google Scholar]
  24. Chen, F.; Zhang, J.J.; Wang, L.F.; Xiong, C.Y.; Fan, H. Spatiotemporal Changes and Conservation Effectiveness of Asian Elephant Habitats in Transboundary Areas of China and Laos. Acta Ecol. Sin. 2024, 44, 10222–10233. [Google Scholar] [CrossRef]
  25. Zhang, J.J.; Chen, F.; Xie, F.; Zhang, X.; Yin, W.P.; Fan, H. Long-Term Habitat Dynamics of Asian Elephants and Their Influence on Human-Elephant Conflicts: A Habitat Suitability Assessment Based on Integrated MaxEnt and HSI Models. Acta Ecol. Sin. 2023, 43, 3807–3818. [Google Scholar]
  26. Cong, P.; Chen, K.; Qu, L.; Han, J. Dynamic Changes in the Wetland Landscape Pattern of the Yellow River Delta from 1976 to 2016 Based on Satellite Data. Chin. Geogr. Sci. 2019, 29, 372–381. [Google Scholar] [CrossRef]
  27. Li, D.; Li, B.; Hou, X.; Wang, X.; Li, X.; Zhang, Y. Habitat Suitability Assessment for Saunders’s Gull (Saundersilarus saundersi) in the Yellow River Delta, China. Ecol. Inform. 2024, 79, 102393. [Google Scholar] [CrossRef]
  28. Ryu, J.; Liu, K.; McCloskey, T.A.; Yun, S.-L. An Integrated Methodology for Assessing Ecosystem Response to Environmental Stressors under Changing Climatic Conditions in Coastal Wetlands. Heliyon 2023, 9, e21263. [Google Scholar] [CrossRef] [PubMed]
  29. Li, X.; Hou, X.; Song, Y.; Shan, K.; Zhu, S.; Yu, X.; Mo, X. Assessing Changes of Habitat Quality for Shorebirds in Stopover Sites: A Case Study in Yellow River Delta, China. Wetlands 2019, 39, 67–77. [Google Scholar] [CrossRef]
  30. Ren, G.; Zhao, Y.; Wang, J.; Wu, P.; Ma, Y. Ecological Effects Analysis of Spartina alterniflora Invasion within Yellow River Delta Using Long Time Series Remote Sensing Imagery. Estuar. Coast. Shelf Sci. 2021, 249, 107111. [Google Scholar] [CrossRef]
  31. Liu, L.; Han, M.; Liu, Y.B.; Pan, B. Spatial Distribution of Wetland Vegetation Biomass and Its Influencing Factors in the Yellow River Delta Nature Reserve. Acta Ecol. Sin. 2017, 37, 4346–4355. [Google Scholar]
  32. Liu, C.; Wang, Y.; Wang, C.; Sheng, H.; Xu, M.M.; Liu, S.W. Wetland Information Extraction in the Yellow River Delta Using Combined Sentinel-1 and Sentinel-2 Imagery. Mar. Sci. 2023, 47, 2–14. [Google Scholar]
  33. Ottinger, M.; Kuenzer, C.; Liu, G.; Wang, S.; Dech, S. Monitoring Land Cover Dynamics in the Yellow River Delta from 1995 to 2010 Based on Landsat 5 TM. Appl. Geogr. 2013, 44, 53–68. [Google Scholar] [CrossRef]
  34. Li, F.; Xie, Y.H.; Chen, X.S.; Deng, Z.M.; Li, X. Composition and Ecological Niches of Aquatic Plants in the Yellow River Delta Wetlands. Acta Ecol. Sin. 2009, 29, 6257–6265. [Google Scholar]
  35. Wang, Y.; Wu, Y.N.; Yan, G.X.; Zhang, Z.M. Spatial Point Pattern Analysis of Mixed Phragmites and Suaeda Salsa Communities in Coastal Wetlands of the Yellow River Delta. Ecol. Sci. 2020, 39, 51–59. [Google Scholar] [CrossRef]
  36. Xing, S.J.; Xi, J.B.; Zhang, J.F.; Song, Y.M.; Ma, B.Y. Basic Characteristics and Major Types of Vegetation in the Yellow River Delta. J. Northeast. For. Univ. 2003, 6, 85–86. [Google Scholar]
  37. IUCN. The IUCN Red List of Threatened Species. Version 2025-1. 2025. Available online: https://www.iucnredlist.org (accessed on 10 May 2025).
  38. Jiang, Z.G. List, Standards and Management of National Protected Species in China. Biodiversity 2019, 27, 698. [Google Scholar]
  39. Jiang, Z.G.; Xie, F.; Li, C.; Zhang, Y.; Wang, Z.; Zheng, G. China’s Red List of Biodiversity: Vertebrates. In Amphibians; Science Press: Beijing, China, 2021; Volume 4. [Google Scholar]
  40. Sun, X.P.; Zhang, Y.L.; Cao, M.C.; Zhu, S.Y.; Shan, K. Analysis of Autumn and Winter Waterbird Communities and Their Habitat Relationships in the Yellow River Delta Nature Reserve. J. Ecol. Rural Environ. 2015, 31, 514–521. [Google Scholar]
  41. Huang, Z.Q.; Che, C.G.; Tan, H.T.; Bi, Z.G.; Liu, W.H.; Zhang, X.T.; Zhang, S.Y.; Li, D.L. Survey and Population Monitoring of Waterbird Diversity in the Yellow River Delta. Shandong For. Sci. Technol. 2018, 48, 41–45. [Google Scholar]
  42. Zhu, Z.Q.; Liu, Z.X.; Xie, Y.C.; He, J.L.; Li, J.Q.; Xu, J.L.; Zhang, Z.W. Impact of Oil Extraction on Waterbird Diversity and Distribution in the Yellow River Delta Nature Reserve. Acta Ecol. Sin. 2023, 43, 7157–7169. [Google Scholar] [CrossRef]
  43. Lambeck, R.J. Focal Species: A Multi-species Umbrella for Nature Conservation: Especies Focales: Una Sombrilla Multiespecífica Para Conservar La Naturaleza. Conserv. Biol. 1997, 11, 849–856. [Google Scholar] [CrossRef]
  44. Roberge, J.-M.; Angelstam, P.E.R. Usefulness of the Umbrella Species Concept as a Conservation Tool. Conserv. Biol. 2004, 18, 76–85. [Google Scholar] [CrossRef]
  45. Liu, Y.L. Birds of the Yellow River Delta; China Forestry Publishing House: Beijing, China, 2013; ISBN 978-7-5038-6740-8. [Google Scholar]
  46. MacKinnon, J.; Phillipps, K. A Field Guide to the Birds of China; Hunan Education Press: Changsha, China, 2000; ISBN 978-7-5355-3224-4. [Google Scholar]
  47. Chai, Z.W.; Lei, W.P.; Mo, X.Q.; Que, P.J.; Shang, C.H.; Yang, J.W.; Zhang, Z.W. Avian Diversity in Beidagang Wetland Nature Reserve, Tianjin. Wetl. Sci. 2020, 18, 667–678. [Google Scholar] [CrossRef]
  48. Duan, Y.B.; Tian, X.H.; Ma, J.Z.; Zhu, S.Y.; Shan, K. Foraging Habitat Use by Oriental Storks during the Breeding Season in the Yellow River Delta. Acta Ecol. Sin. 2015, 35, 2628–2634. [Google Scholar]
  49. Cao, M.C.; Liu, G.H.; Xu, H.G. Multi-Scale Habitat Selection Mechanisms of Red-Crowned Cranes: A Case Study of the Yellow River Delta Nature Reserve. Acta Ecol. Sin. 2011, 31, 6344–6352. [Google Scholar] [CrossRef]
  50. Zhu, M.C.; Cao, M.C.; Wang, Z.X.; Xu, H.G.; Lei, J.C.; Wu, Y.; Zhao, J. Fuzzy Comprehensive Evaluation of Waterbird Habitat Suitability in the Yellow River Delta Nature Reserve. J. Cent. China Norm. Univ. Nat. Sci. 2015, 49, 287–294. [Google Scholar] [CrossRef]
  51. Panthi, S.; Pariyar, S.; Low, M. Factors Influencing the Global Distribution of the Endangered Egyptian Vulture. Sci. Rep. 2021, 11, 21901. [Google Scholar] [CrossRef]
  52. Pearson, R.G.; Raxworthy, C.J.; Nakamura, M.; Townsend Peterson, A. Predicting Species Distributions from Small Numbers of Occurrence Records: A Test Case Using Cryptic Geckos in Madagascar. J. Biogeogr. 2007, 34, 102–117. [Google Scholar] [CrossRef]
  53. Phillips, S.J.; Dudík, M. Modeling of Species Distributions with Maxent: New Extensions and a Comprehensive Evaluation. Ecography 2008, 31, 161–175. [Google Scholar] [CrossRef]
  54. Swets, J.A. Measuring the Accuracy of Diagnostic Systems. Science 1988, 240, 1285–1293. [Google Scholar] [CrossRef]
  55. Zadeh, L.A. Fuzzy Sets, Information and Control. Inf. Control 1965, 8, 338–353. [Google Scholar] [CrossRef]
  56. Sun, X.; Shen, J.; Xiao, Y.; Li, S.; Cao, M. Habitat Suitability and Potential Biological Corridors for Waterbirds in Yancheng Coastal Wetland of China. Ecol. Indic. 2023, 148, 110090. [Google Scholar] [CrossRef]
  57. Zhu, W.; Zhou, H.F.; Li, L.H.; Yan, Y.J. Evaluation of Agricultural Water and Land Resource Carrying Capacity and Identification of Its Influencing Factors in Kazakhstan. Arid Zone Res. 2020, 37, 254–263. [Google Scholar] [CrossRef]
  58. Xu, M.D.; Cao, L.; He, J.; Li, J.; Wang, H.R. Fuzzy Comprehensive Evaluation of Ecological Environmental Vulnerability Based on GIS. Soil Water Conserv. China 2011, 6, 19–21. [Google Scholar] [CrossRef]
  59. Chang, Y.; Chang, C.; Li, Y.; Liu, M.; Lv, J.; Hu, Y. Predicting Dynamics of the Potential Breeding Habitat of Larus saundersi by MaxEnt Model under Changing Land-Use Conditions in Wetland Nature Reserve of Liaohe Estuary, China. Remote Sens. 2022, 14, 552. [Google Scholar] [CrossRef]
  60. Jiang, H.X.; Hou, Y.Q.; Chu, G.Z.; Qian, F.W.; Wang, H.; Zhang, G.G.; Zheng, G.M. Breeding Population Dynamics and Habitat Transition of Saunders’s Gull Larus Saundersi in Yancheng National Nature Reserve, China. Bird Conserv. Int. 2010, 20, 13–24. [Google Scholar] [CrossRef]
  61. Li, D.; Liu, K.; Gao, Y.; Wu, Y.; Hou, X. Stopover Habitat Use of Coastal Pied Avocet Revealed by Satellite Tracking and Remote Sensing Technology. Glob. Ecol. Conserv. 2024, 56, e03290. [Google Scholar] [CrossRef]
  62. Cao, M.C.; Sun, X.P.; Le, Z.F.; Cui, P.; Gong, X.; Xu, H.G. Analysis of Wintering Habitat Changes of Red-Crowned Cranes Based on the MaxEnt Model: A Case Study of Yancheng Nature Reserve. J. Ecol. Rural Environ. 2016, 32, 964–970. [Google Scholar]
  63. Li, Y.; Lu, L.Y.; Tian, X.H.; Duan, Y.B. Predicted Distribution of Suitable Habitats for Oriental Storks in Shandong Province. Acta Ecol. Sin. 2023, 43, 2194–2201. [Google Scholar]
  64. Wang, C.; Wang, G.; Dai, L.; Liu, H.; Li, Y.; Zhou, Y.; Chen, H.; Dong, B.; Lv, S.; Zhao, Y. Diverse Usage of Waterbird Habitats and Spatial Management in Yancheng Coastal Wetlands. Ecol. Indic. 2020, 117, 106583. [Google Scholar] [CrossRef]
  65. Min, Y.K.; Ke, Y.H.; Han, Y.; Yin, X.L.; Zhou, D.M. Dynamic Monitoring of Spartina alterniflora Removal Using Time-Series Sentinel-2 and GF-1 Imagery. J. Remote Sens. 2023, 27, 1467–1479. [Google Scholar]
  66. Chen, P.; Zhang, Y.; Zhu, X.J.; Lu, C.H. Ecological Impact of Spartina alterniflora Invasion on Birds. Acta Ecol. Sin. 2019, 39, 2282–2290. [Google Scholar]
  67. Li, Z.J.; Wang, Z.Y.; Liu, X.T.; Sun, S.C.; Ma, X.K.; Zuo, Y.N. Effects of Spartina alterniflora Control on Wetland Use and Landscape Pattern in the Yellow River Delta: Using Random Forest and Improved CA-Markov Model. Acta Ecol. Sin. 2024, 44, 8366–8382. [Google Scholar] [CrossRef]
  68. Gao, H.L.; Li, D.W.; Li, P.P.; Li, X.H.; Di, G.S. Spatiotemporal Analysis of Coastline Changes in the Yellow River Delta from 2020 to 2024. Surv. Mapp. Eng. 2025, 34, 22–30. [Google Scholar] [CrossRef]
  69. Rajpar, M.N.; Ahmad, S.; Zakaria, M.; Ahmad, A.; Guo, X.; Nabi, G.; Wanghe, K. Artificial Wetlands as Alternative Habitat for a Wide Range of Waterbird Species. Ecol. Indic. 2022, 138, 108855. [Google Scholar] [CrossRef]
  70. Kong, X.L.; Li, Y.L.; Han, M.; Tian, L.X.; Niu, X.R.; Zhu, J.Q.; Wang, M.; Huang, S.P. Distribution and Driving Factors of Natural Wetlands in the Yellow River Delta across Three Periods Since 1990. Wetl. Sci. 2020, 18, 603–612. [Google Scholar] [CrossRef]
  71. Gayet, G.; Matthieu, G.; François, M.; Hervé, F.; Laurence, C.; Joël, B. Annual Use of Man-Made Wetlands by the Mute Swan (Cygnus Olor). J. Environ. Manag. 2013, 120, 120–126. [Google Scholar] [CrossRef]
  72. Cheng, C.; Ma, Z. Conservation Interventions Are Required to Improve Bird Breeding Performance in Artificial Wetlands. Biol. Conserv. 2023, 278, 109872. [Google Scholar] [CrossRef]
  73. Fan, J.; Wang, X.; Wu, W.; Chen, W.; Ma, Q.; Ma, Z. Function of Restored Wetlands for Waterbird Conservation in the Yellow Sea Coast. Sci. Total Environ. 2021, 756, 144061. [Google Scholar] [CrossRef]
  74. Pang, B.; Yang, W.X.; Cui, B.S.; Zhang, S.Y.; Xie, T.; Ning, Z.H.; Gao, F.; Zhang, H.S. Evaluation of Vegetation Restoration Effects in the Biodiversity Conservation Project of the Yellow River Delta Wetlands. Environ. Eng. 2023, 41, 213–221. [Google Scholar] [CrossRef]
  75. Li, D.; Chen, S.; Lloyd, H.; Zhu, S.; Shan, K.; Zhang, Z. The Importance of Artificial Habitats to Migratory Waterbirds within a Natural/Artificial Wetland Mosaic, Yellow River Delta, China. Bird Conserv. Int. 2013, 23, 184–198. [Google Scholar] [CrossRef]
  76. Yu, X.; Zhu, W.; Wei, J.; Jia, S.; Wang, A.; Huang, Y.; Zhao, Y. Estimation of Ecological Water Supplement for Typical Bird Protection in the Yellow River Delta Wetland. Ecol. Indic. 2021, 127, 107783. [Google Scholar] [CrossRef]
  77. Casazza, M.L.; McDuie, F.; Jones, S.; Lorenz, A.A.; Overton, C.T.; Yee, J.; Feldheim, C.L.; Ackerman, J.T.; Thorne, K.M. Waterfowl Use of Wetland Habitats Informs Wetland Restoration Designs for Multi-species Benefits. J. Appl. Ecol. 2021, 58, 1910–1920. [Google Scholar] [CrossRef]
  78. Zhang, S.; Zhang, P.; Pan, B.; Zou, Y.; Xie, Y.; Zhu, F.; Chen, X.; Li, F.; Deng, Z.; Zhang, H.; et al. Wetland Restoration in the East Dongting Lake Effectively Increased Waterbird Diversity by Improving Habitat Quality. Glob. Ecol. Conserv. 2021, 27, e01535. [Google Scholar] [CrossRef]
  79. Kan, Z.; Chen, B.; Yu, W.; Chen, G.; Ma, Z.; Hu, W.; Liao, J.; Du, H. Forecasting Land-Cover Change Effects on Waterbirds in Xiamen Bay, China: Determining Prospective Species Winners and Losers. Mar. Environ. Res. 2023, 188, 106003. [Google Scholar] [CrossRef]
Figure 1. Technical road map.
Sustainability 17 05326 g001
Figure 2. Schematic diagram of the geographical location of the study area and the remote sensing image of Sentinel-2A. (a) Location of Shandong Province. (b) Location in Dongying urban area. (c) Sentinel-2A remote sensing images and study area locations.
Sustainability 17 05326 g002
Figure 3. Relative contribution rates of key habitat variables for different birds (PLAND_9: Proportion of paddy field landscape, PLAND_7: Proportion of reservoir/pond landscape, PLAND_6: Proportion of river landscape, PLAND_5: Proportion of mudflat landscape, PLAND_3: Proportion of Tamarix landscape, PLAND_2: Proportion of Phragmites landscape, D_9: Distance to paddy fields, D_8: Distance to aquaculture areas, D_5: Distance to mudflats, D_4: Distance to Suaeda Marsh, D_2: Distance to Phragmites Marsh, D_road: Distance to roads, D_water: Distance to water, D_coastline: Distance to coastline, FVC: Fractional Vegetation Cover, LULC: Land Use/Land Cover).
Sustainability 17 05326 g003
Figure 4. Land Use/Land Cover classes in the YRDNR from 2005 to 2024. (a) 2005; (b) 2010; (c) 2015; (d) 2020; (e) 2024.
Sustainability 17 05326 g004
Figure 5. String diagram of wetland Land Use/Land Cover transfer from 2005 to 2024, where the width of the flow represents the size of the transition area between different types (km2).
Sustainability 17 05326 g005
Figure 6. Habitat distribution of different rare waterbirds in the YRDNR: (a) C. boyciana; (b) L. saundersi; (c) G. japonensis; (d) C. olor; (e) N. madagascariensis.
Sustainability 17 05326 g006aSustainability 17 05326 g006bSustainability 17 05326 g006c
Figure 7. Habitat area of five rare waterbirds in the YRDNR: (a) Changes in suitable habitat area of five species of waterbirds from 2005 to 2024 (km2). (bf) Habitat area of five rare waterbirds at all levels from 2005 to 2024 (km2).
Sustainability 17 05326 g007
Figure 8. Landscape indices of Highly Suitable Habitat for 5 rare waterbirds: (a) NP; (b) PD; (c) LPI; (d) LSI; (e) AREA_MN; (f) FRAC_AM; (g) CONTAG; (h) SHDI; (i) SHEI.
Sustainability 17 05326 g008
Figure 9. Landscape indices of Highly Suitable Habitat for five species of waterbirds from 2005 to 2024: (a) NP; (b) PD; (c) LPI; (d) LSI; (e) AREA_MN; (f) CONTAG.
Sustainability 17 05326 g009
Figure 10. Results of the Fuzzy Comprehensive Evaluation of Habitat Suitability for rare waterbirds from 2005 to 2024.
Sustainability 17 05326 g010
Figure 11. Changes in the habitat range of rare waterbirds from 2005 to 2024.
Sustainability 17 05326 g011
Table 1. Basic characteristics of target waterbirds are introduced.
SpeciesPicturesConservation/Endangered StatusHabitat and History DistributionEcological Function/Indicator RoleMigratory Status and Representativeness
C. boycianaSustainability 17 05326 i001IUCN: Endangered (EN); National Class I Protected Species (China); CBRL: Endangered (EN)Shallow wetlands, swamps, and Phragmites marshes; choose tall transmission towers or artificial nest-building frames for nesting; mainly distributed in the Yellow River estuary and reservoir and pond wetlands in the YRDNRHighly sensitive to water quality and connectivity; reflects health of river–pond systemsLong-distance migrant; indicates long-term habitat changes
L. saundersiSustainability 17 05326 i002IUCN: Vulnerable (VU); National Class I Protected Species (China); CBRL: Vulnerable (VU)Coastal saline–alkaline mudflats and intertidal zones; mainly distributed in coastal mudflats and salt marshes in the YRDNRDepends on continuous mudflats and benthic resources; sensitive to intertidal structure and disturbanceMigratory species; indicates tidal flat integrity and fragmentation
G. japonensisSustainability 17 05326 i003IUCN: Endangered (EN); National Class I Protected Species (China); CBRL: Endangered (EN)Shallow wetlands and marshes with abundant riparian vegetation; mainly distributed in northern Phragmites marshes and shallow wetlands in the YRDNRStrongly responds to vegetation composition and habitat connectivity; flagship species for wetland healthLong-distance migrant; reflects wetland continuity and quality
C. olorSustainability 17 05326 i004IUCN: Least Concern (LC); National Class II Protected Species (China); CBRL: Near Threatened (NT)Large freshwater lakes, reservoirs, and rivers; mainly distributed in pond wetlands and Phragmites marshes characterized by large expanses of open water in the YRDNRDepends on extensive open water; useful indicator for artificial wetland restoration outcomesResident species; represents restored aquatic ecosystems
N. madagascariensisSustainability 17 05326 i005IUCN: Endangered (EN); National Class II Protected Species (China); CBRL: Vulnerable (VU)Intertidal mudflats and estuarine sandbars; mainly distributed in southern tidal flats and salt marshes in the YRDNRBenthic forager; highly sensitive to sediment structure and mudflat degradationAsian–Australasian Flyway; reflects mudflat quality dynamics
Table 2. Environmental variables considered in the suitability analysis of 5 rare waterbirds.
VariableAbbreviation
(Unit)
DescriptionImpact on the Habitat
Land Use/Land Cover TypeLULC (−)Natural or anthropogenic land cover and usageProvides the material basis for habitat environments
Landscape MetricsPercentage of LandscapePLAND(%)Percentage of each patch type in the landscapeReflect landscape characteristics and habitat quality
Shannon’s Diversity IndexSHDI (−)Diversity of landscape composition
Contagion IndexCONTAG (%)Degree of aggregation or dispersion of patch types across the landscape
Vegetation CoverageFVC (%)Level of vegetation growth and coverageProvides cover, nesting, and foraging resources for waterbirds
Human DisturbanceDistance to RoadsD_road (km)Euclidean distance to nearest roadNegatively affects waterbird roosting and breeding
Distance to Industrial/Mining FacilitiesD_industrial/mining facilities (km)Euclidean distance to industrial/mining facilities
Habitat Selection VariablesDistance to Different Land Use/Land Cover TypesD_different land use/land cover types (km)Euclidean distance to different Land Use/Land Cover typesReflects the accessibility of food and water sources for waterbirds
Distance to CoastlineD_coastline (km)Euclidean distance to the coastline
Distance to WaterD_water (km)Euclidean distance to all water
Table 3. Land Use/Land Cover classification system.
Level 1
Classification
Level 2
Classification
Type DescriptionCode
Natural WetlandsSpartina alterniflora MarshIntertidal marsh dominated by Spartina alterniflora1
Phragmites MarshIntertidal and freshwater marsh dominated by Phragmites spp.2
Tamarisk MarshIntertidal marsh dominated by Tamarix spp.3
Suaeda MarshIntertidal marsh dominated by Suaeda spp.4
MudflatVegetation cover <30%, composed of muddy/sandy substrate5
RiverPerennial and seasonal/intermittent rivers6
Artificial WetlandsReservoir/Pond WetlandPermanent water bodies including reservoirs and artificial freshwater restoration areas7
Aquaculture/Salt PondMan-made wetlands for aquaculture or salt production8
Paddy FieldFields suitable for rice cultivation or seasonally flooded/waterlogged9
Non-wetlandsDry FarmlandArable land for crops such as wheat, cotton, and maize without irrigation infrastructure10
WoodlandLand dominated by herbaceous plants, trees, or shrubs (excluding marshy grassland); high vegetation cover11
Industrial/Mining AreaBuilt-up areas including settlements, transportation, industrial, and other impervious surfaces12
Offshore WatersPermanently submerged coastal, estuarine, and bay waters, typically less than 6 m deep at low tide13
Table 4. Key environment variables used to build the model.
SpeciesKey Variable (Abbreviation)
C. boycianaLand Use/Land Cover (LULC), Fractional Vegetation Cover (FVC), Distance to roads (D_road), Distance to paddy fields (D_9), Distance to water (D_water), Distance to Phragmites Marsh(D_2), Proportion of river landscape (PLAND_6), Proportion of mudflat landscape (PLAND_5)
L. saundersiLand Use/Land Cover (LULC), Fractional Vegetation Cover (FVC), Distance to roads (D_road), Distance to water (D_water), Distance to coastline (D_coastline), Proportion of mudflat landscape (PLAND_5), Distance to Suaeda Marsh (D_4), Distance to Phragmites Marsh (D_2)
G. japonensisLand Use/Land Cover (LULC), Fractional Vegetation Cover (FVC), Distance to roads (D_road), Proportion of paddy field landscape (PLAND_9), Distance to water (D_water), Distance to mudflats (D_5), Distance to Suaeda Marsh (D_4), Proportion of Phragmites landscape (PLAND_2)
C. olorLand Use/Land Cover (LULC), Fractional Vegetation Cover (FVC), Distance to roads (D_road), Distance to water (D_water), Distance to aquaculture areas (D_8), Proportion of Phragmites landscape (PLAND_2), Distance to paddy fields (D_9), Proportion of reservoir/pond landscape (PLAND_7)
N. madagascariensisLand Use/Land Cover (LULC), Fractional Vegetation Cover (FVC), Distance to roads (D_road), Distance to water (D_water), Distance to coastline (D_coastline), Distance to mudflats (D_5), Distance to Suaeda Marsh(D_4), Proportion of Tamarix landscape (PLAND_3)
Table 5. Hierarchical boundary values of membership functions.
Evaluation Variable a 1 a 2 a 3 a 4 Δ
C. boyciana0.0450.1650.3150.5400.045
L. saundersi0.0850.2200.3950.6800.055
G. japonensis0.1200.2750.4850.7500.065
C. olor0.1550.3350.580.8200.075
N. madagascariensis0.1950.4000.6600.8900.085
Table 6. Weight values of evaluation indicators.
SpeciesConservation Priority WeightHabitat Type WeightTotal Weight
C. boyciana0.2300.2860.263
L. saundersi0.1970.2140.207
G. japonensis0.1800.0710.115
C. olor0.2130.2860.257
N. madagascariensis0.1800.1430.158
Table 7. Wetland and non-wetland area in the YRDNR from 2005 to 2024 (km2).
Land Cover Type20052010201520202024
Natural wetlands695.44599.45598.93595.21586.97
Artificial wetlands118.65211.55231.45278.97288.07
Total Wetlands814.09811.00830.38874.18875.03
Non-wetlands556.45559.54540.13496.35495.55
Table 8. Changes in Land Use/Land Cover of rare waterbird habitats from 2005 to 2024.
Land Use/Land Cover Type20052024
The Proportion in the Mostly Suitable Habitat
(%)
The Proportion in the Moderately Suitable Habitat
(%)
The Proportion in the Poorly Suitable Habitat
(%)
The Proportion in the Unsuitable Habitat
(%)
The Proportion in the Mostly Suitable Habitat
(%)
The Proportion in the Moderately Suitable Habitat
(%)
The Proportion in the Poorly Suitable Habitat
(%)
The Proportion in the Unsuitable Habitat
(%)
Spartina alterniflora Marsh-------0.08
Phragmites Marsh38.6330.9030.053.7441.2531.6218.492.23
Tamarisk Marsh2.300.67--2.143.070.40-
Suaeda Marsh31.697.401.200.785.914.850.850.34
Mudflat14.3234.9629.4417.8219.2934.5335.8617.40
River0.533.691.731.50-3.542.951.47
Reservoir/Pond Wetland7.195.363.560.2529.835.103.950.27
Aquaculture/Salt Pond0.330.884.240.850.002.843.431.31
Paddy Field1.163.035.271.261.0411.0320.0017.36
Dry Farmland3.389.3219.7616.00-0.234.032.61
Woodland-3.042.58-0.322.414.370.34
Industrial/Mining Area------1.440.49
Offshore Waters0.460.762.1757.790.200.774.2356.19
Disclaimer/Publisher’s Note: The statements, opinions and data contained in all publications are solely those of the individual author(s) and contributor(s) and not of MDPI and/or the editor(s). MDPI and/or the editor(s) disclaim responsibility for any injury to people or property resulting from any ideas, methods, instructions or products referred to in the content.

