

Enhancing Community Waste Recycling in Taiwan: Key Drivers Affecting Consumers in Waste Recycling


Abstract
1. Introduction
1.1. Literature Review
1.1.1. Municipal Solid Waste (MSW) Management
1.1.2. Role of Consumer in Recycling
1.1.3. AHP in Waste Management
1.2. Research Objectives
- To identify and evaluate the influential factors and indicators that encourage Taiwan consumers’ involvement in recycling using AHP
- To produce policy insights based on Taiwan consumers’ priorities in enhancing the effectiveness of the waste recycling system in Taiwan
2. Materials and Methods
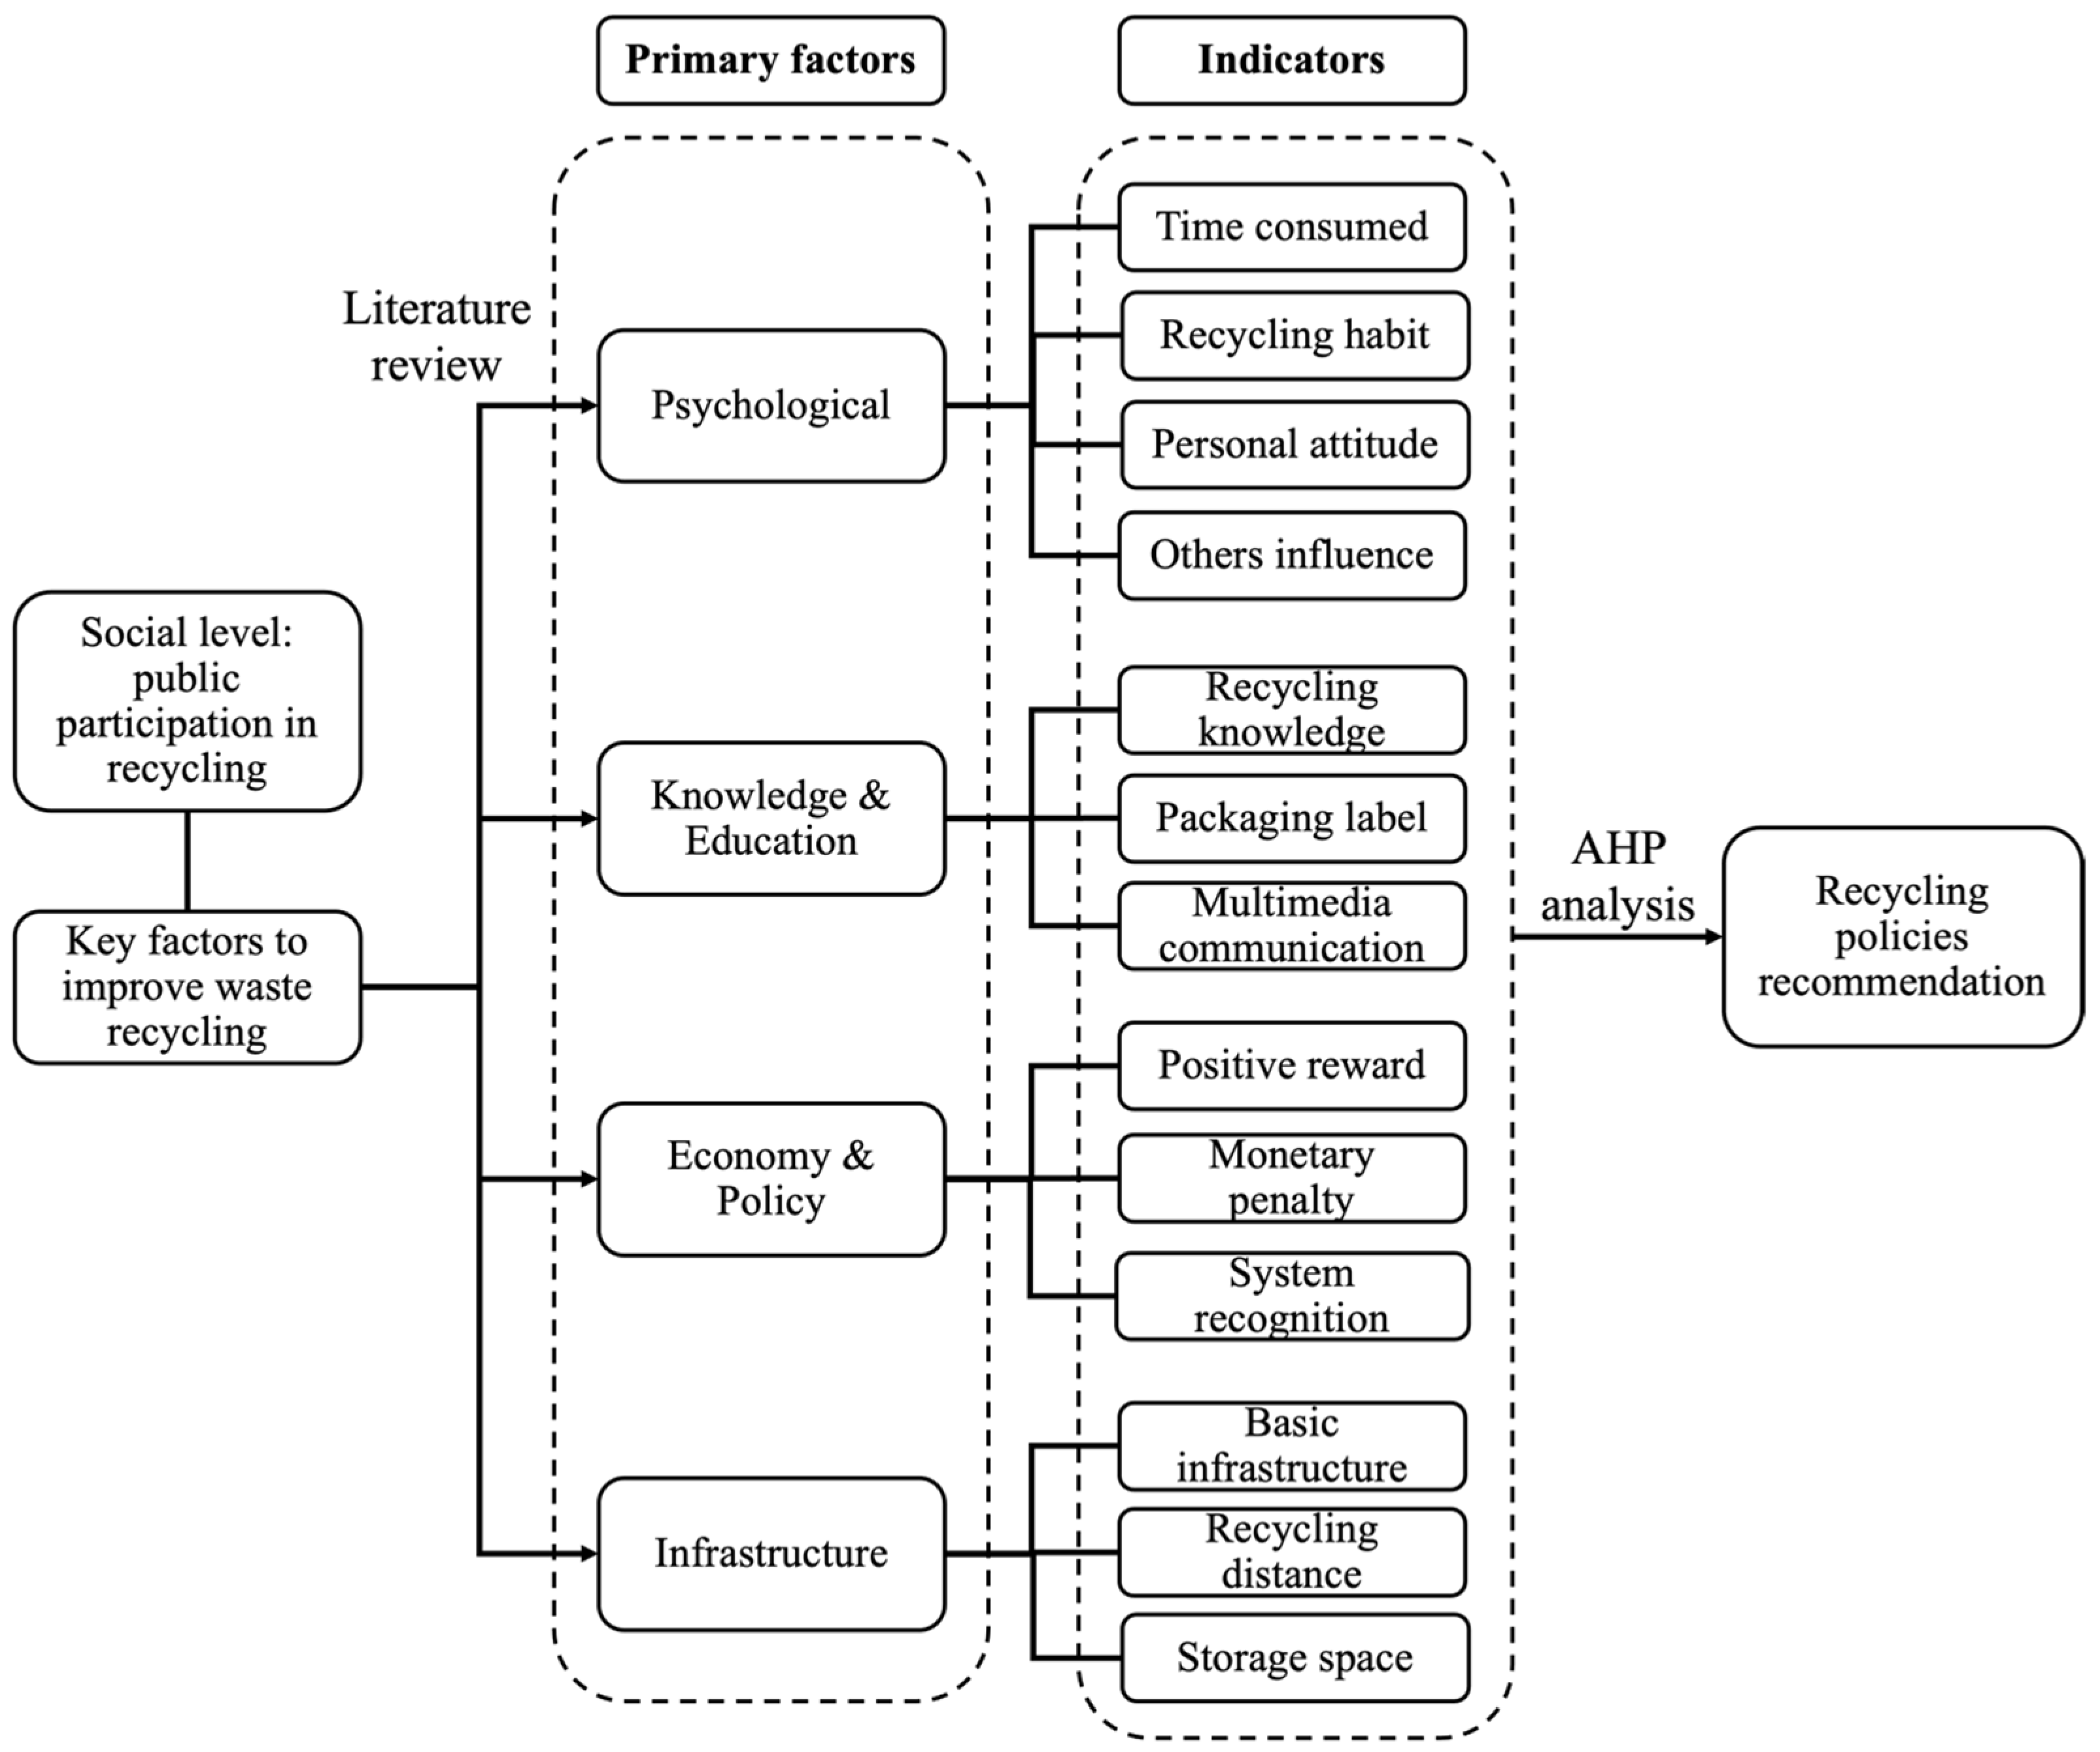
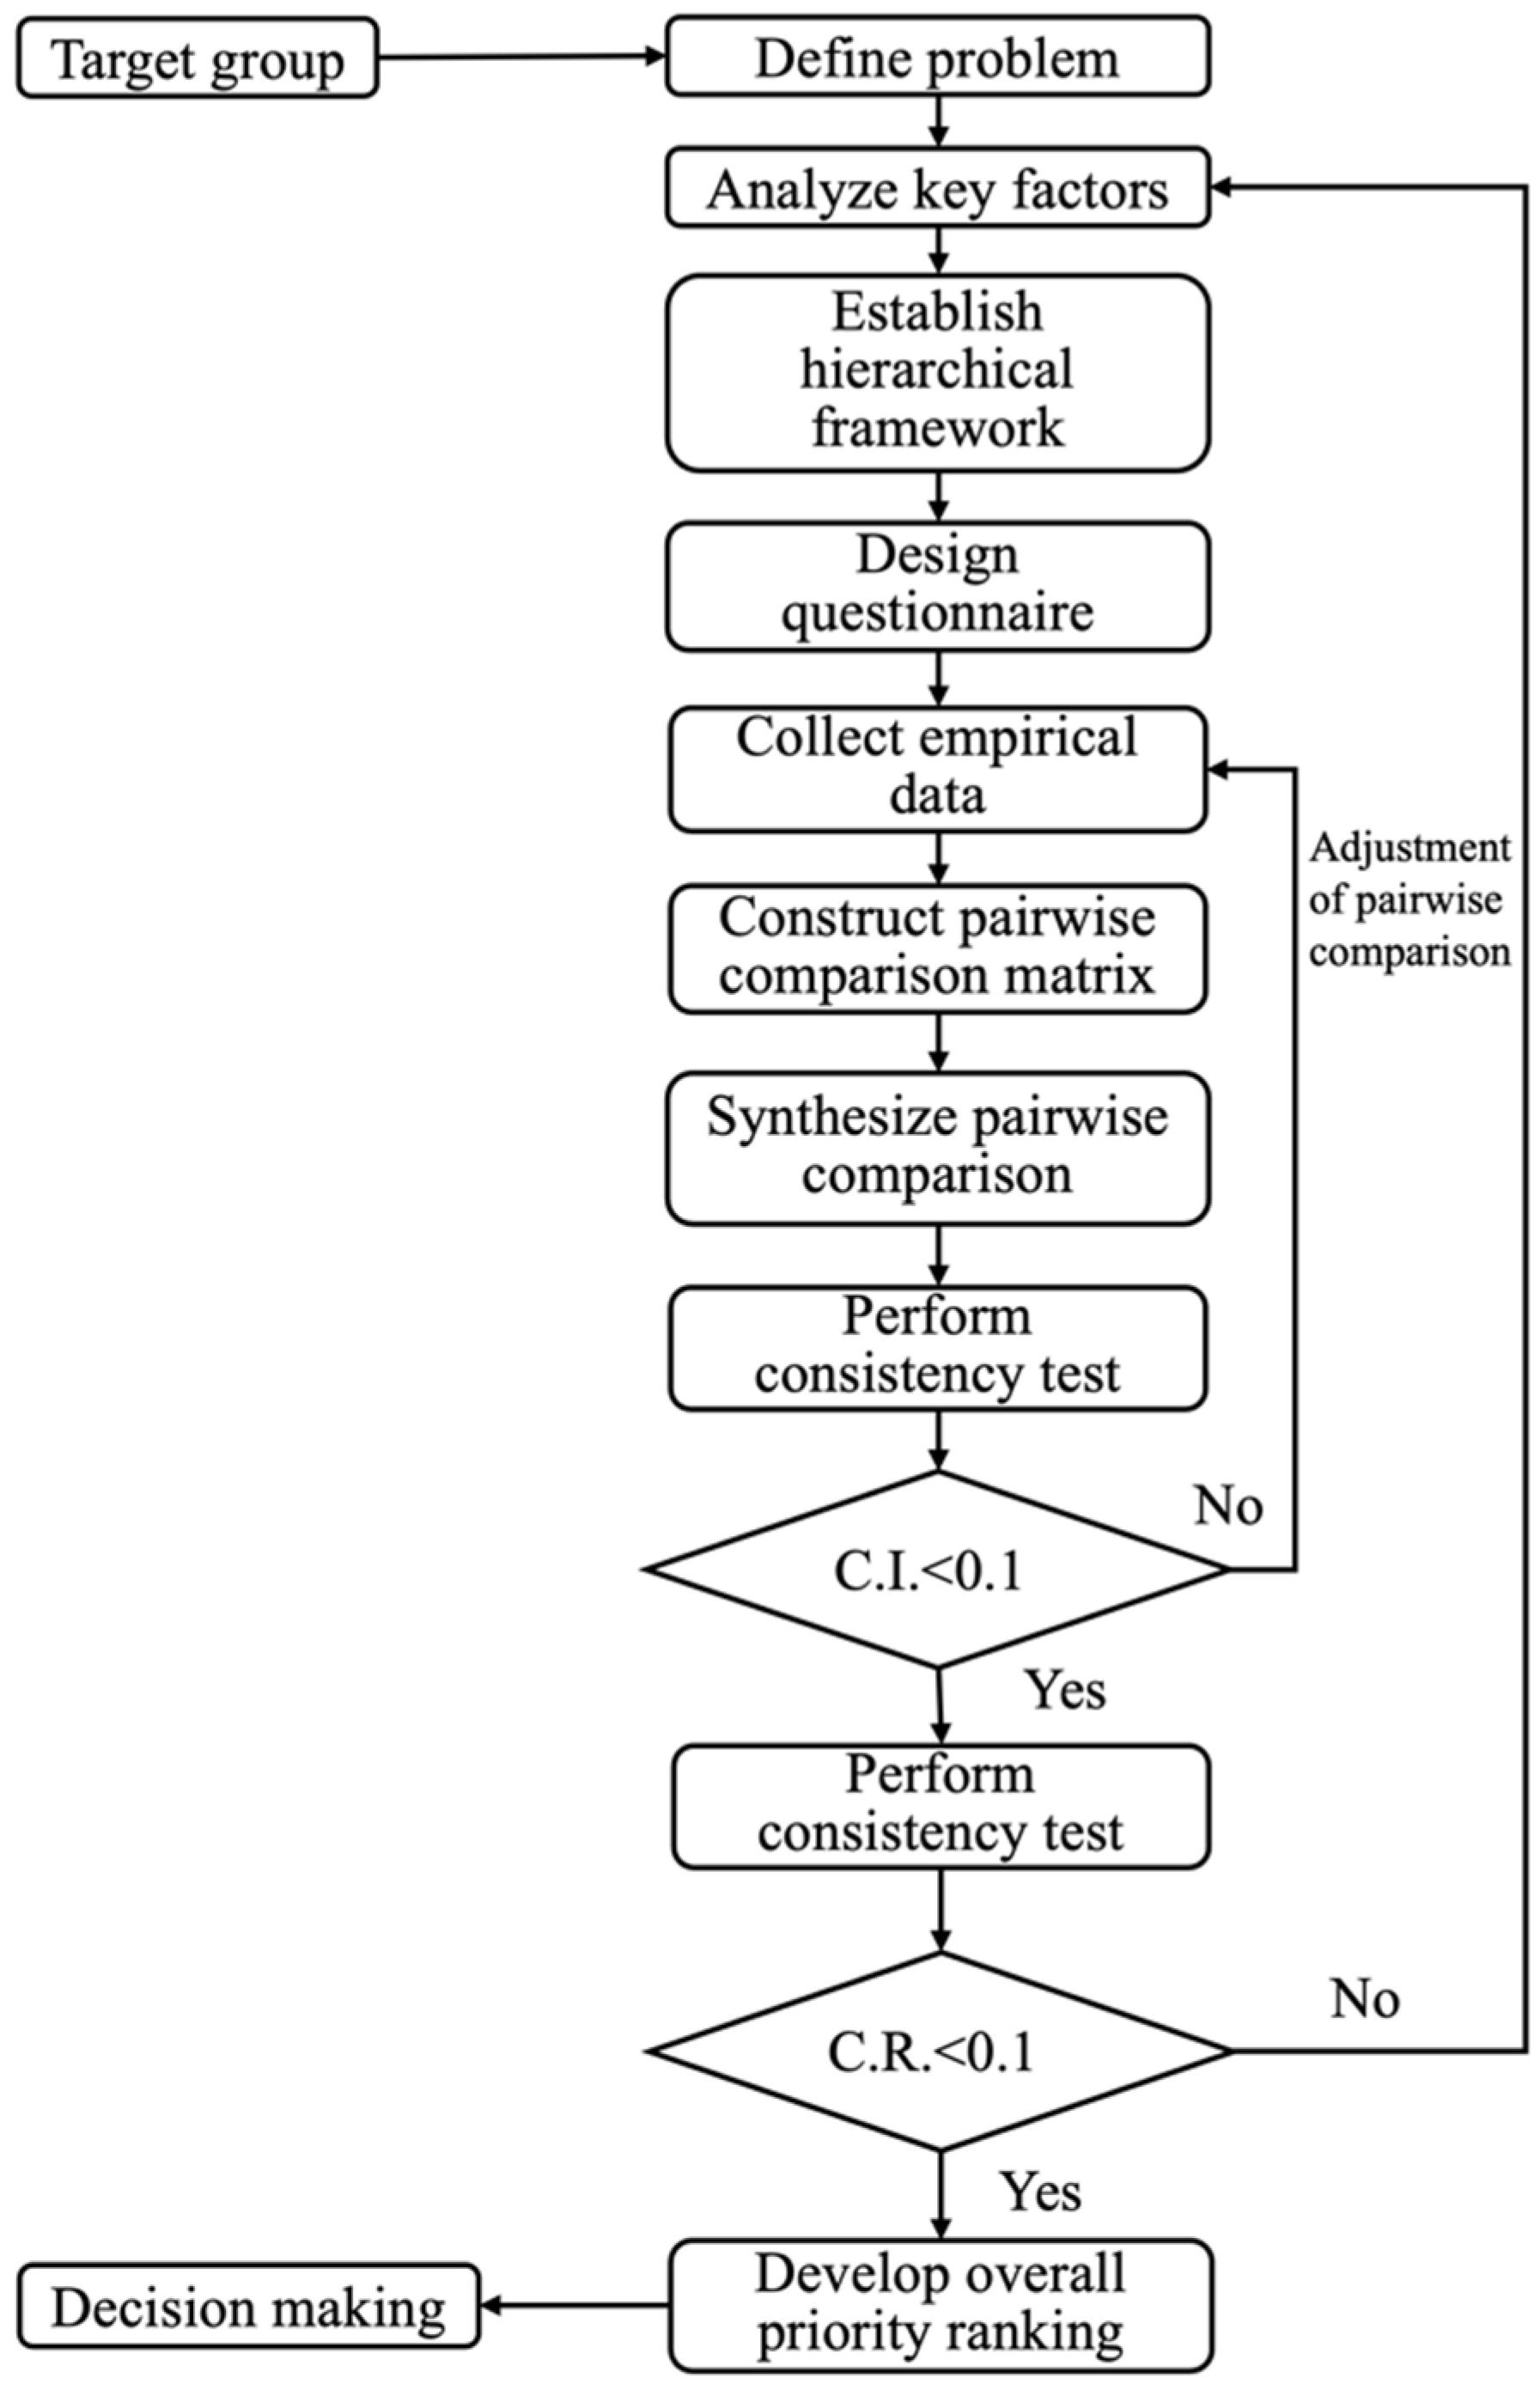
2.1. Analytical Hierarchy Process (AHP)
- 1.
- Problem definition
- 2.
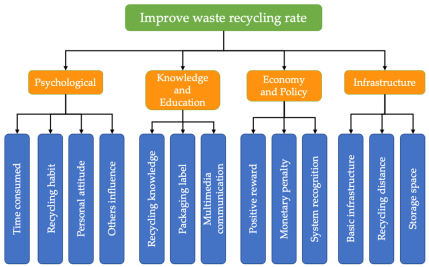
- Establishing a hierarchical framework
- 3.
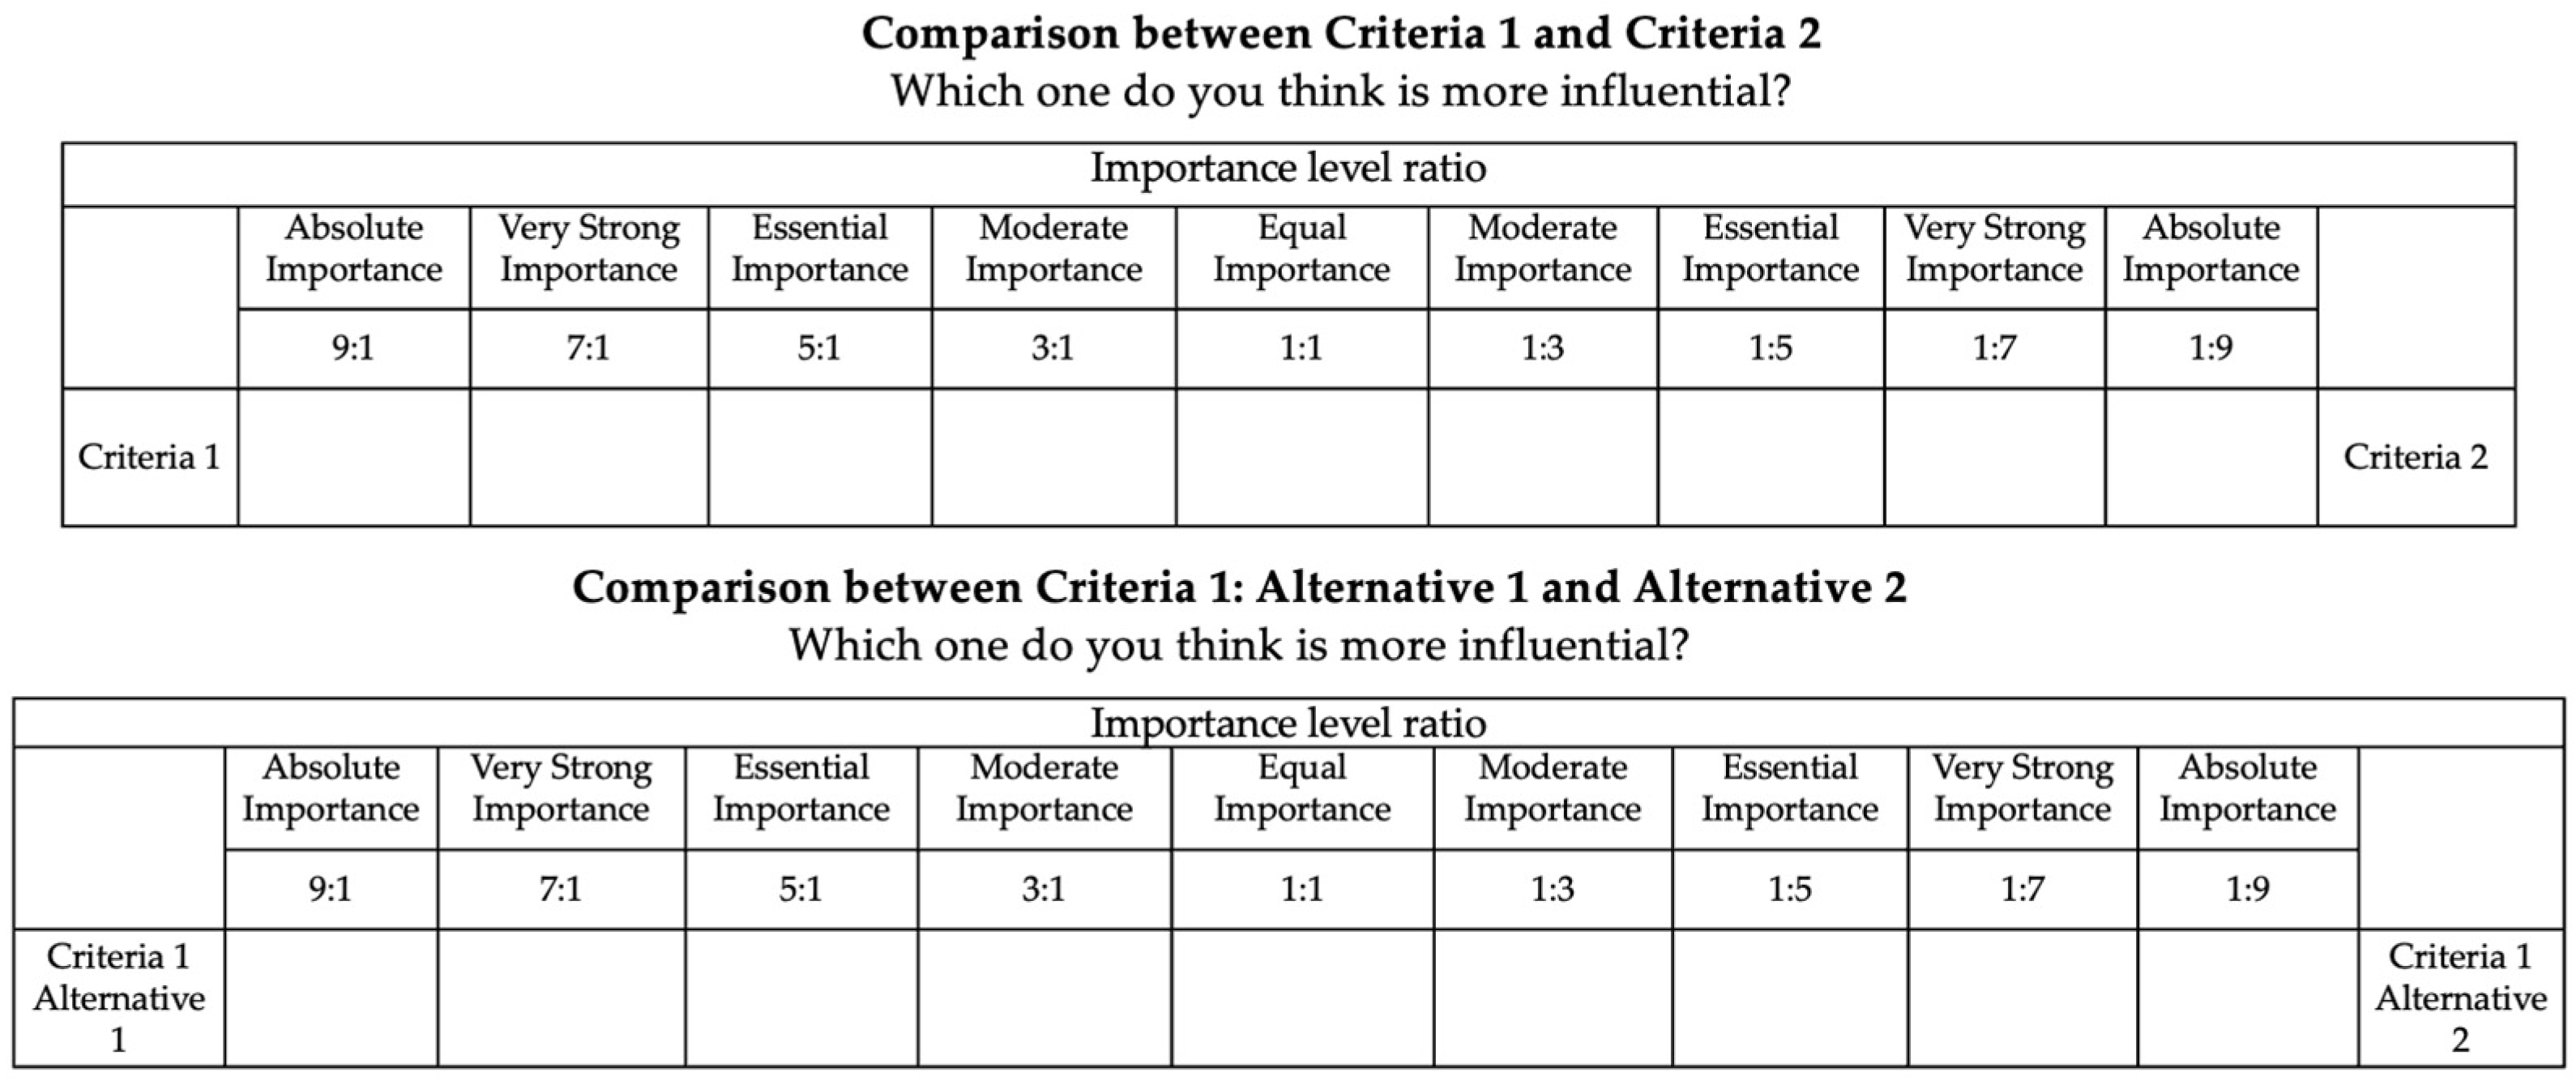
- Questionnaire design and survey
- 4.
- Weightage calculation
- Establishment of pairwise comparison matrix: The values used for pairwise comparison are obtained from the questionnaire survey Each respondent compares factors at the same hierarchical level, and their judgments are entered into the upper triangular part of the comparison matrix. By definition, the diagonal elements of the matrix are set to 1, as they represent the comparison of a factor with itself. The lower triangular elements are the reciprocals of the corresponding upper triangle values, such that . The general form of the pairwise comparison matrix A is:
- Eigenvalue and eigenvector calculation: Once the matrix is constructed, the eigenvector representing the relative weights of the criteria or alternatives is calculated. In this study, Microsoft Excel was used for computation. The row vector average standardisation method is typically employed when calculating vector values in the AHP, and the calculation accuracy is higher [74]. Method of standardising row vector averages:
- 5.
- Consistency test
- Consistency Index, C.I.
- Consistency Ratio, C.R.
2.2. Statistical Test
3. Results
3.1. Factors Influencing Consumer Recycling
3.2. Demographic Characteristics That Influence Consumer Involvement in Waste Recycling
3.2.1. Gender
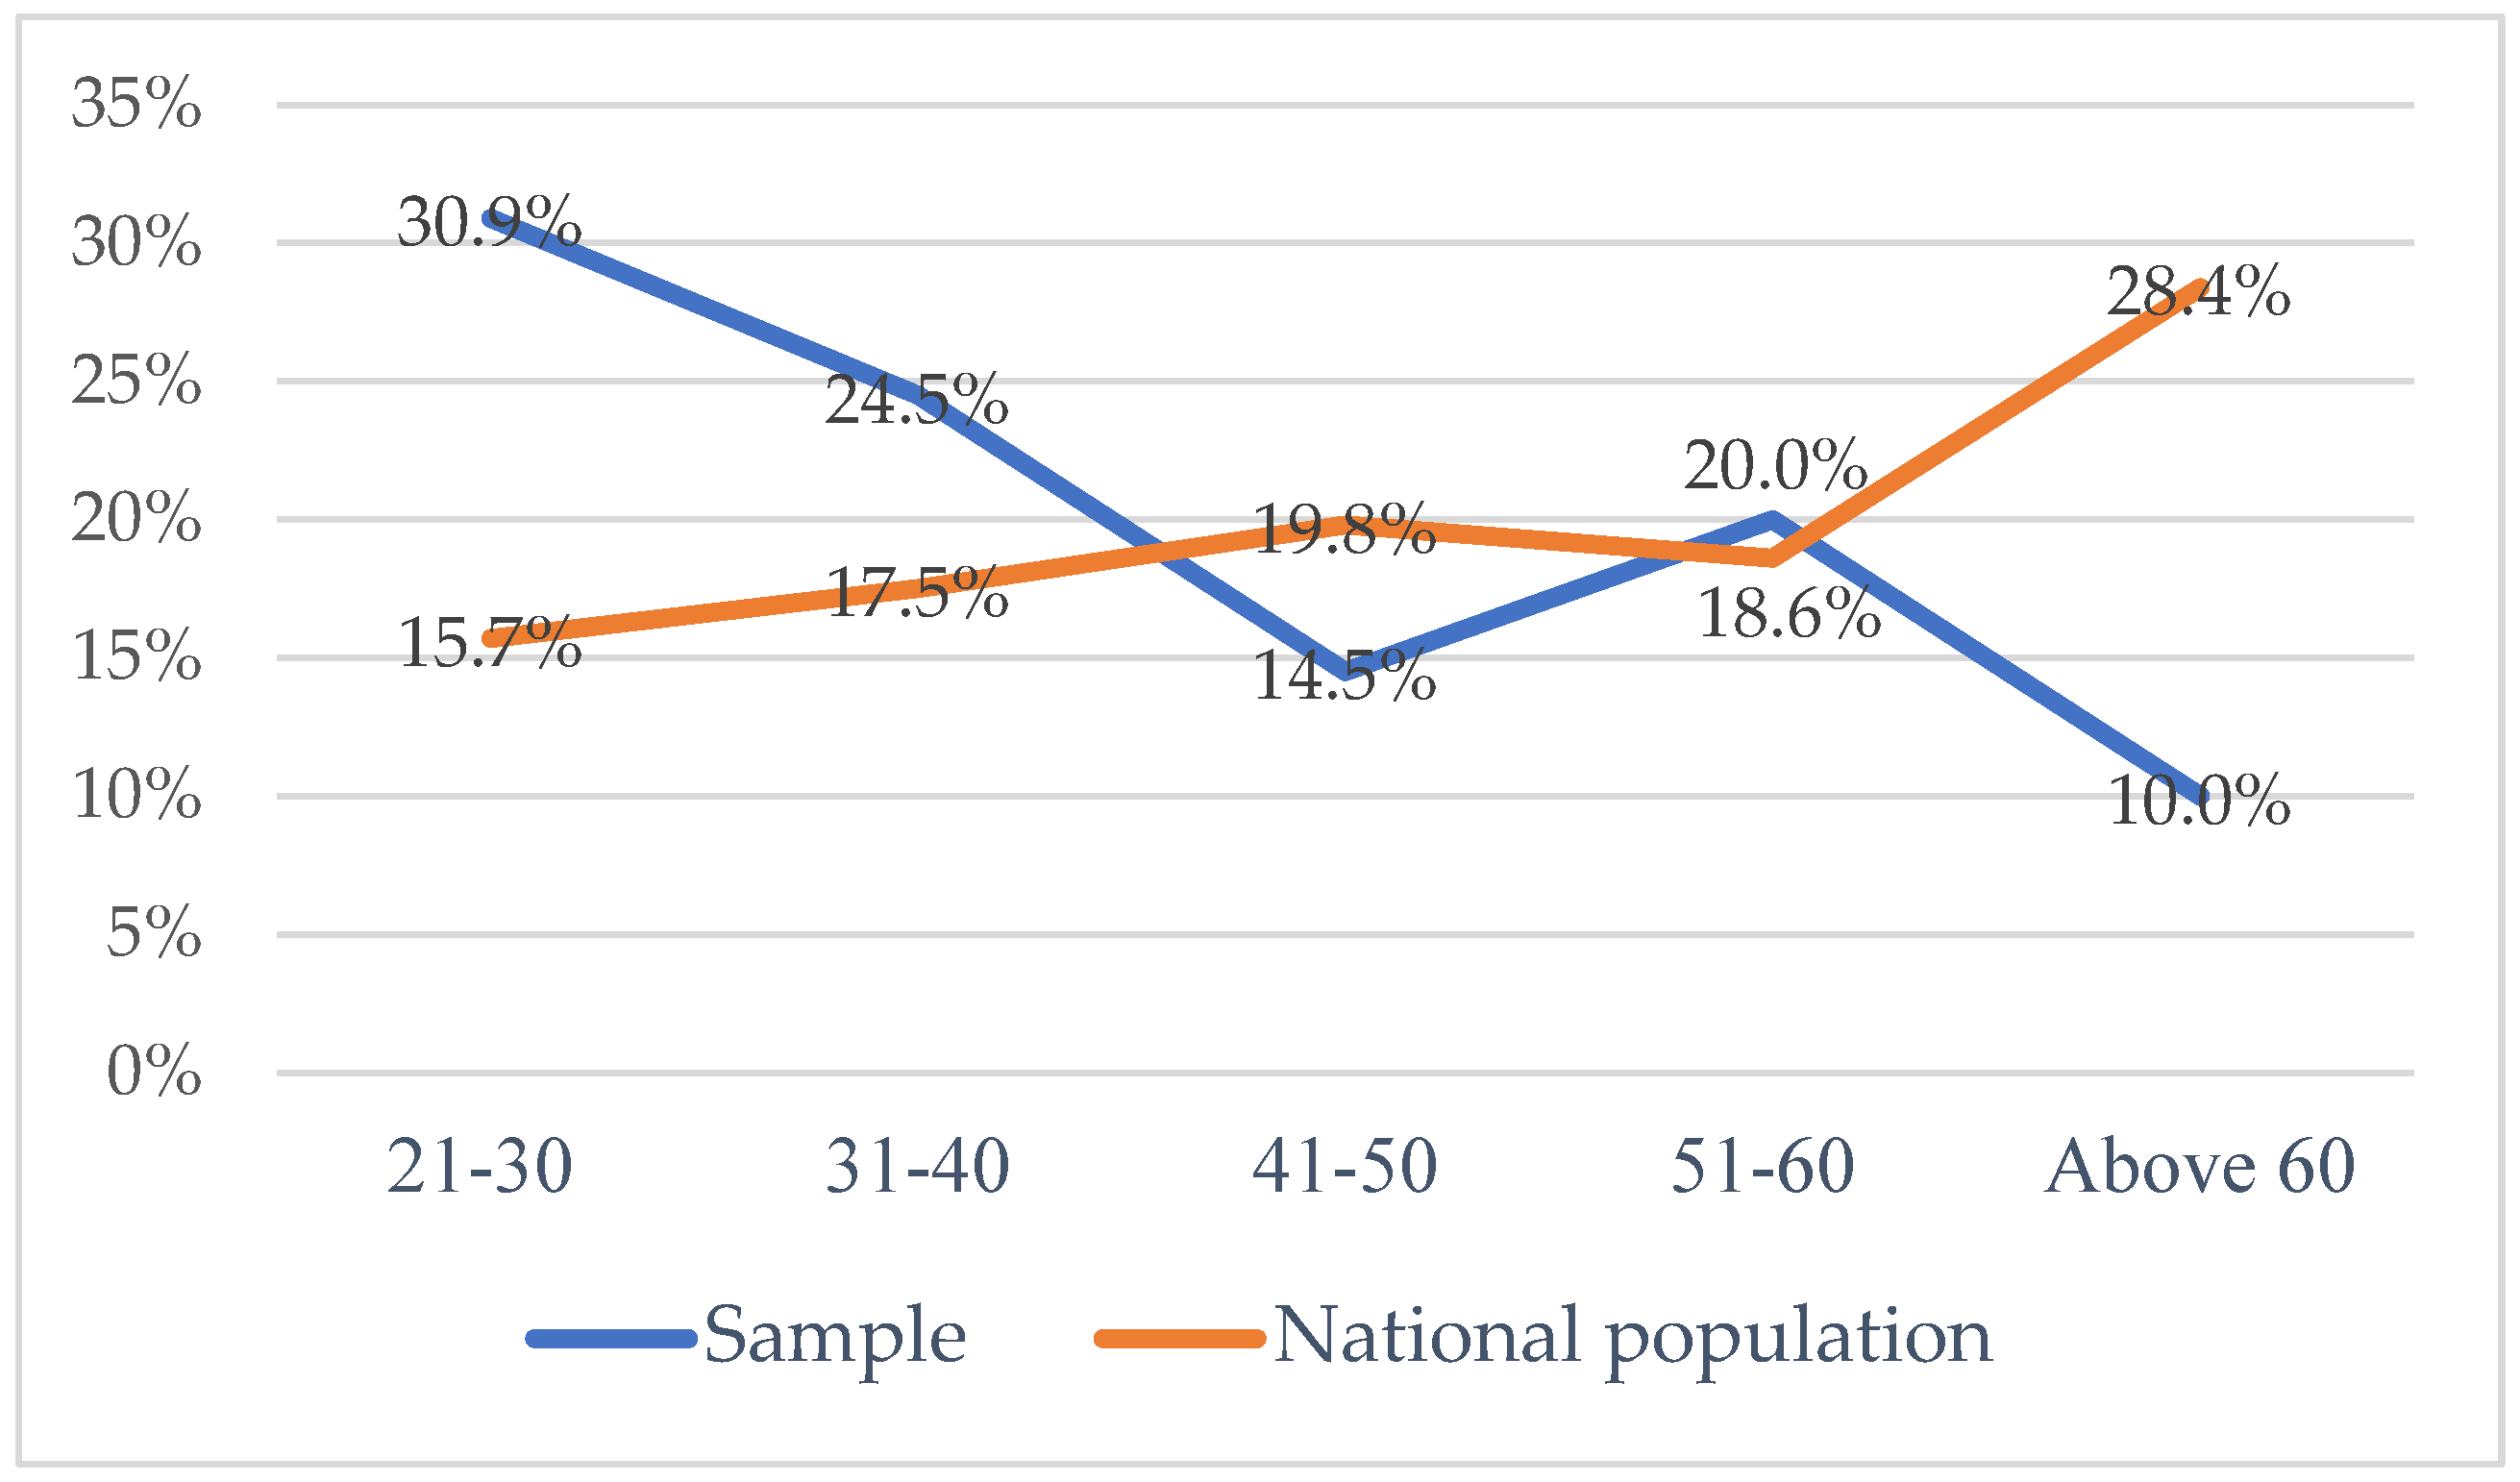
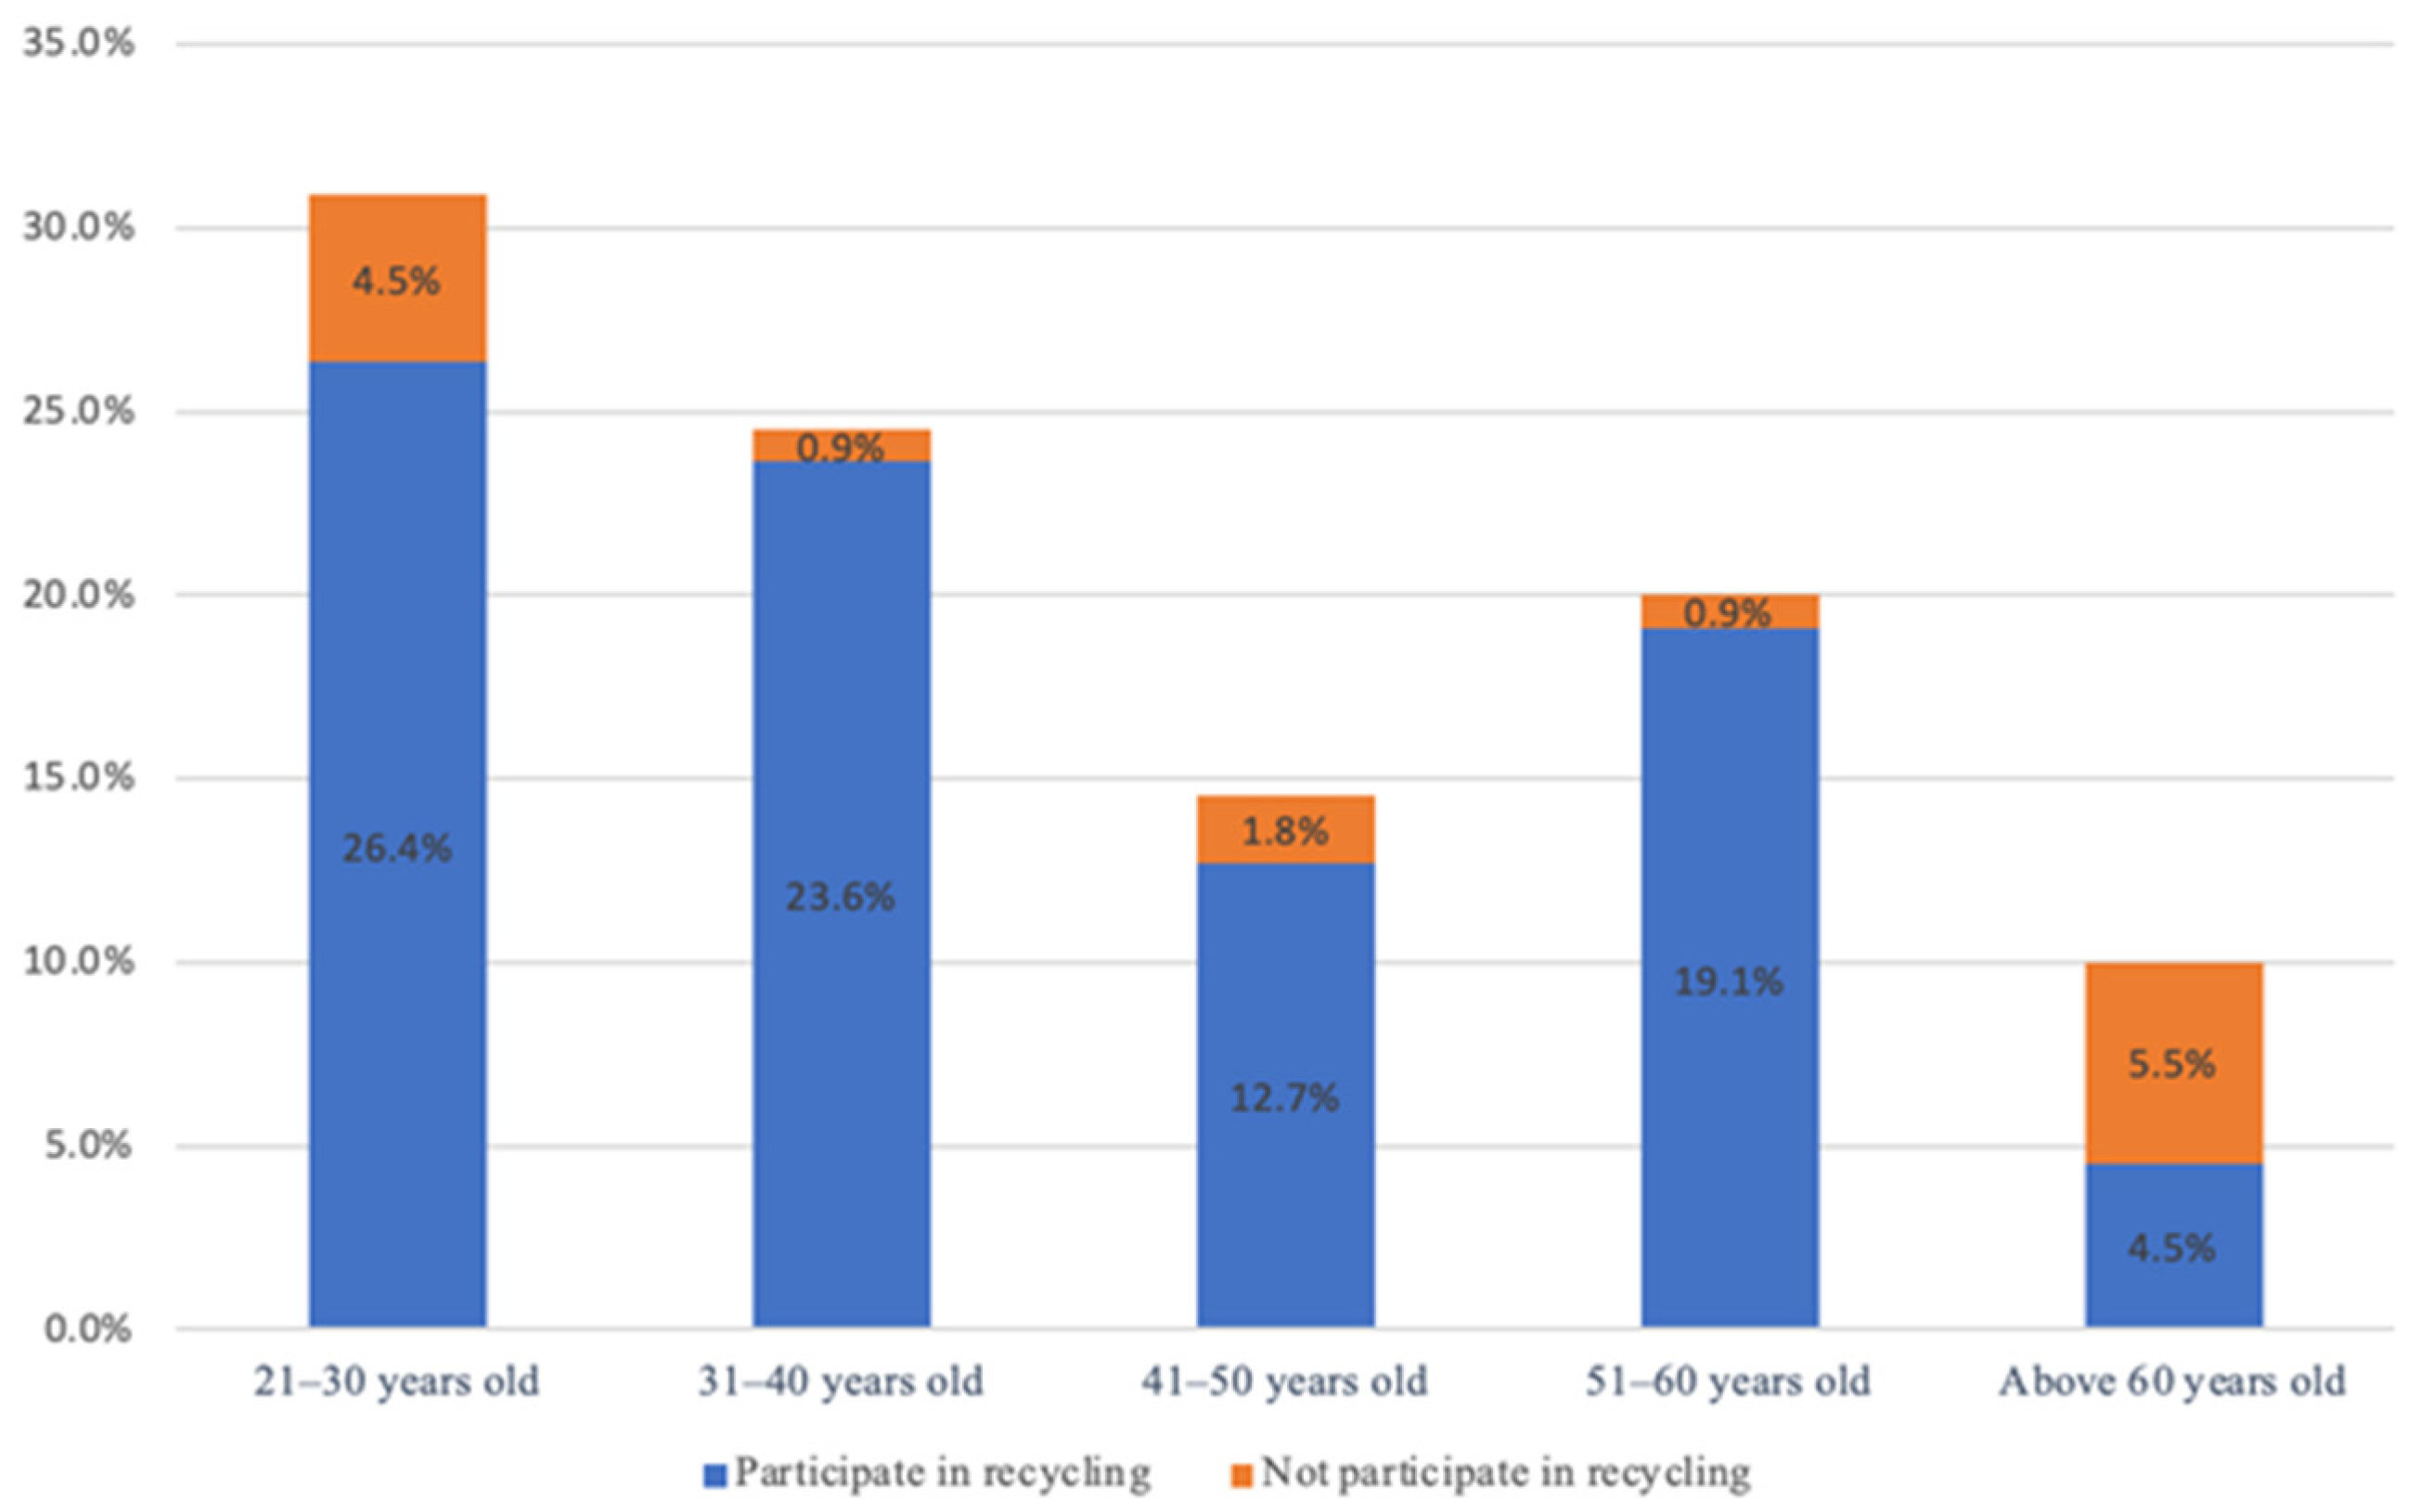
3.2.2. Age
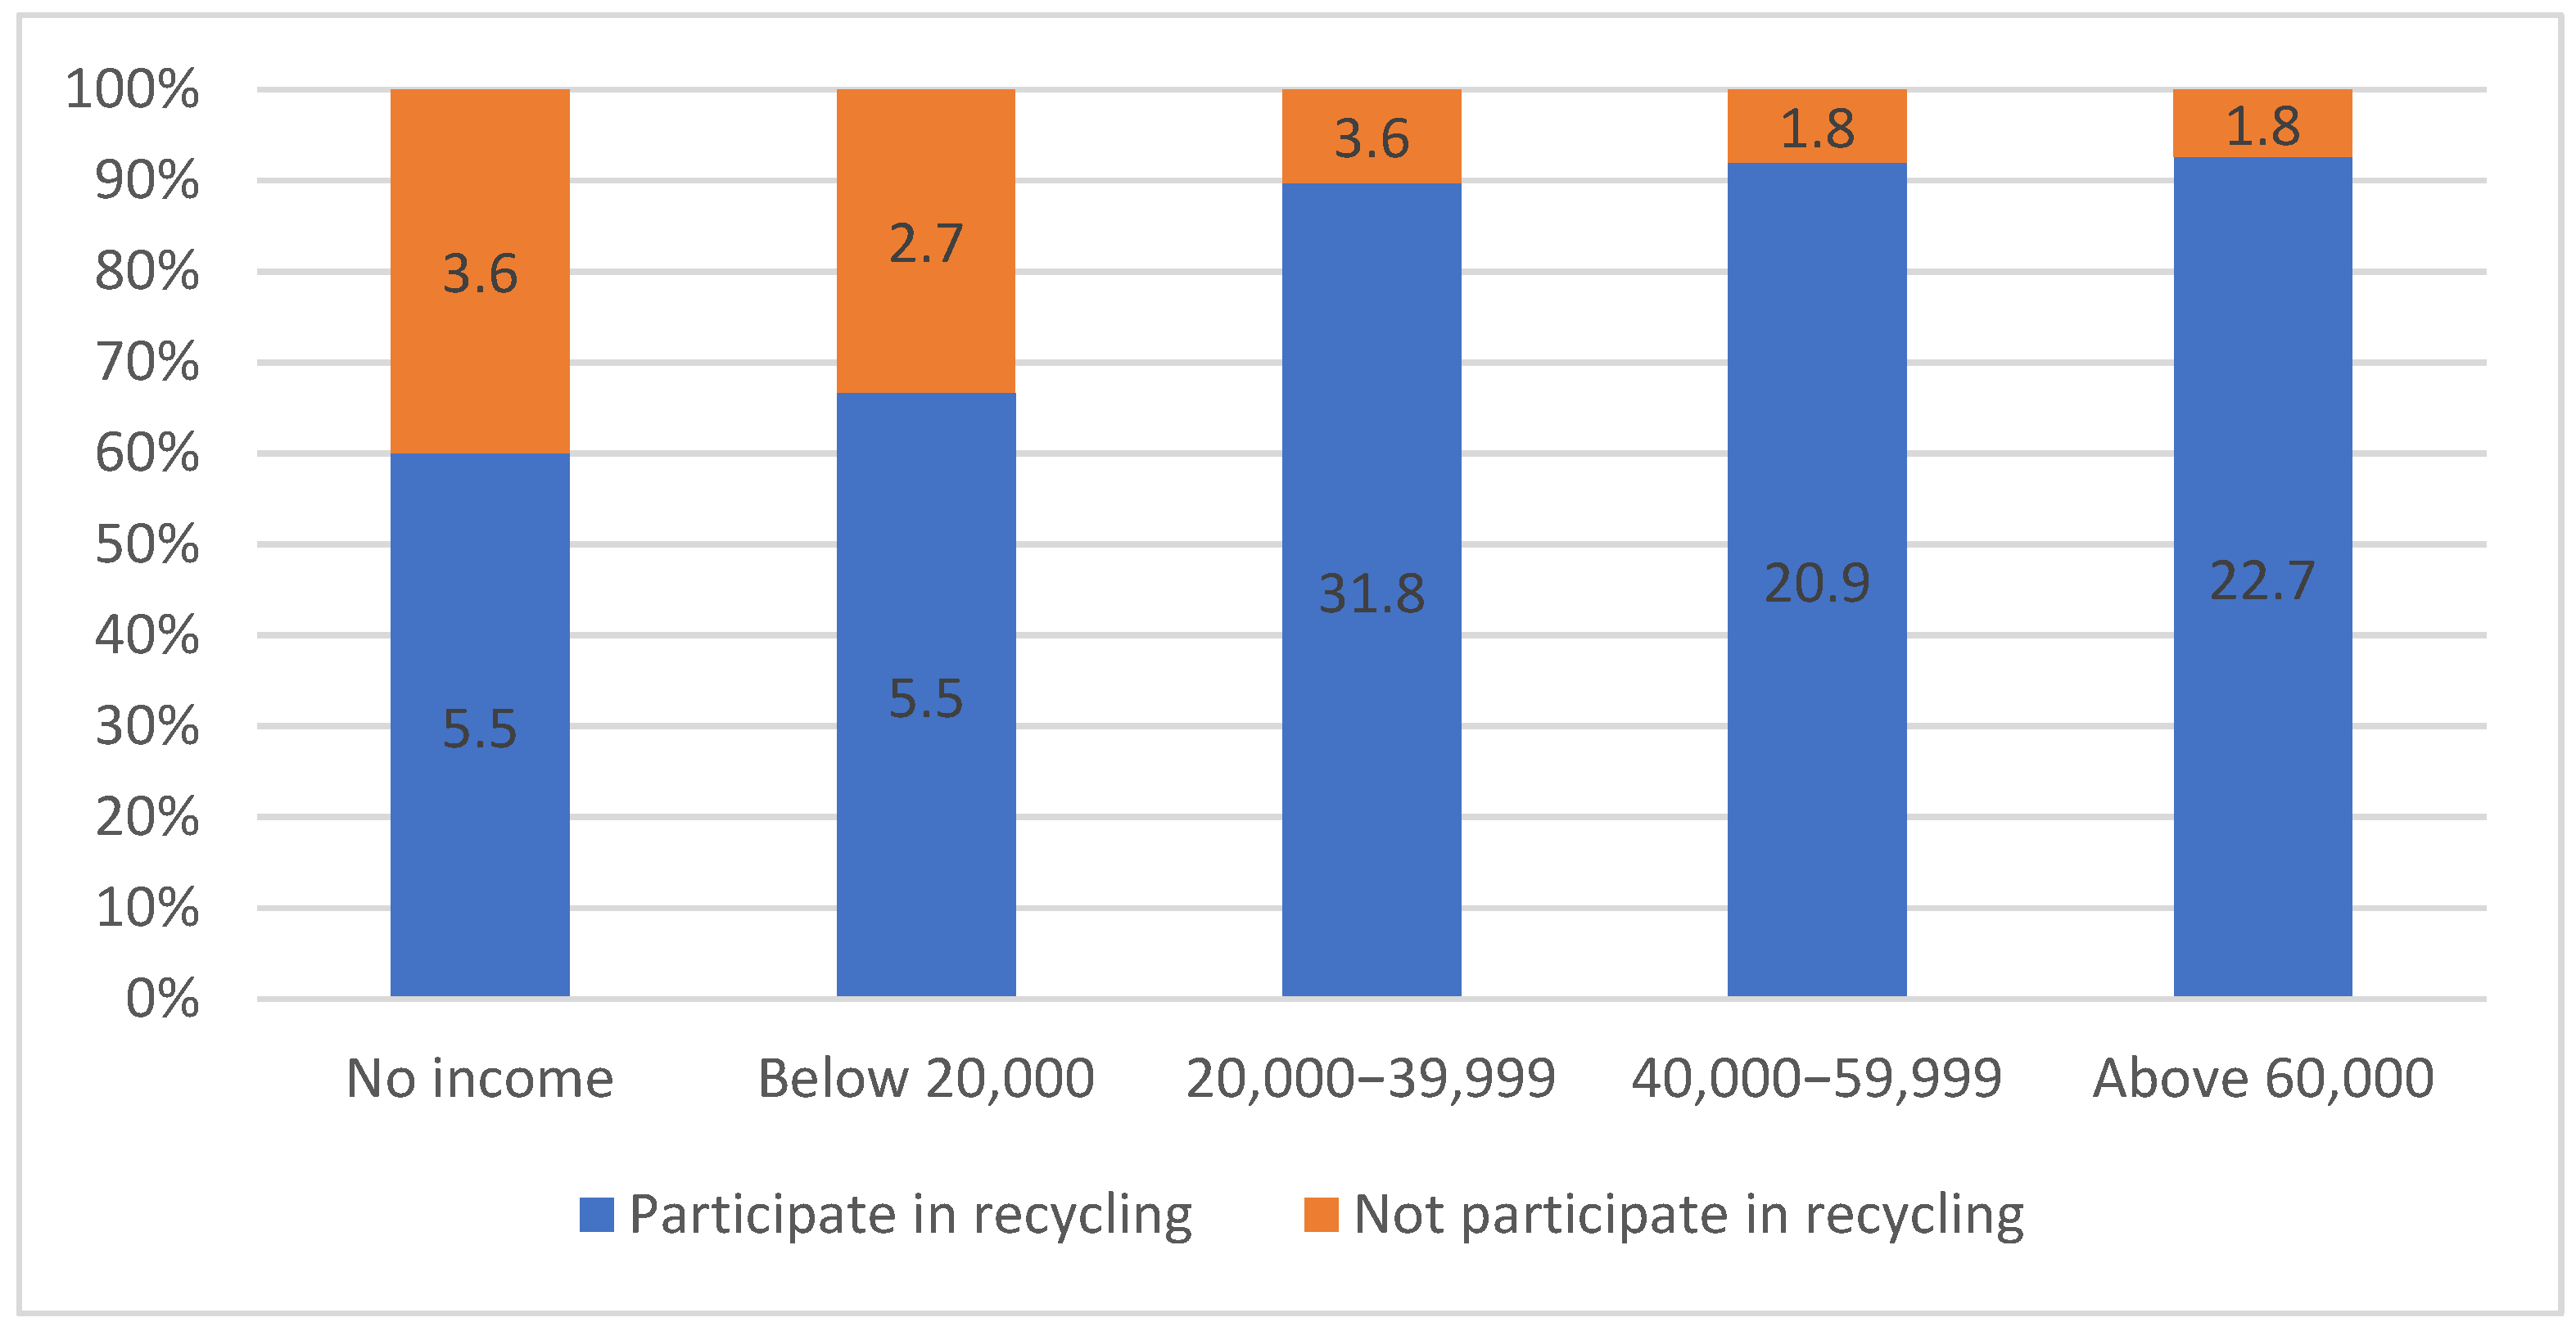
3.2.3. Income
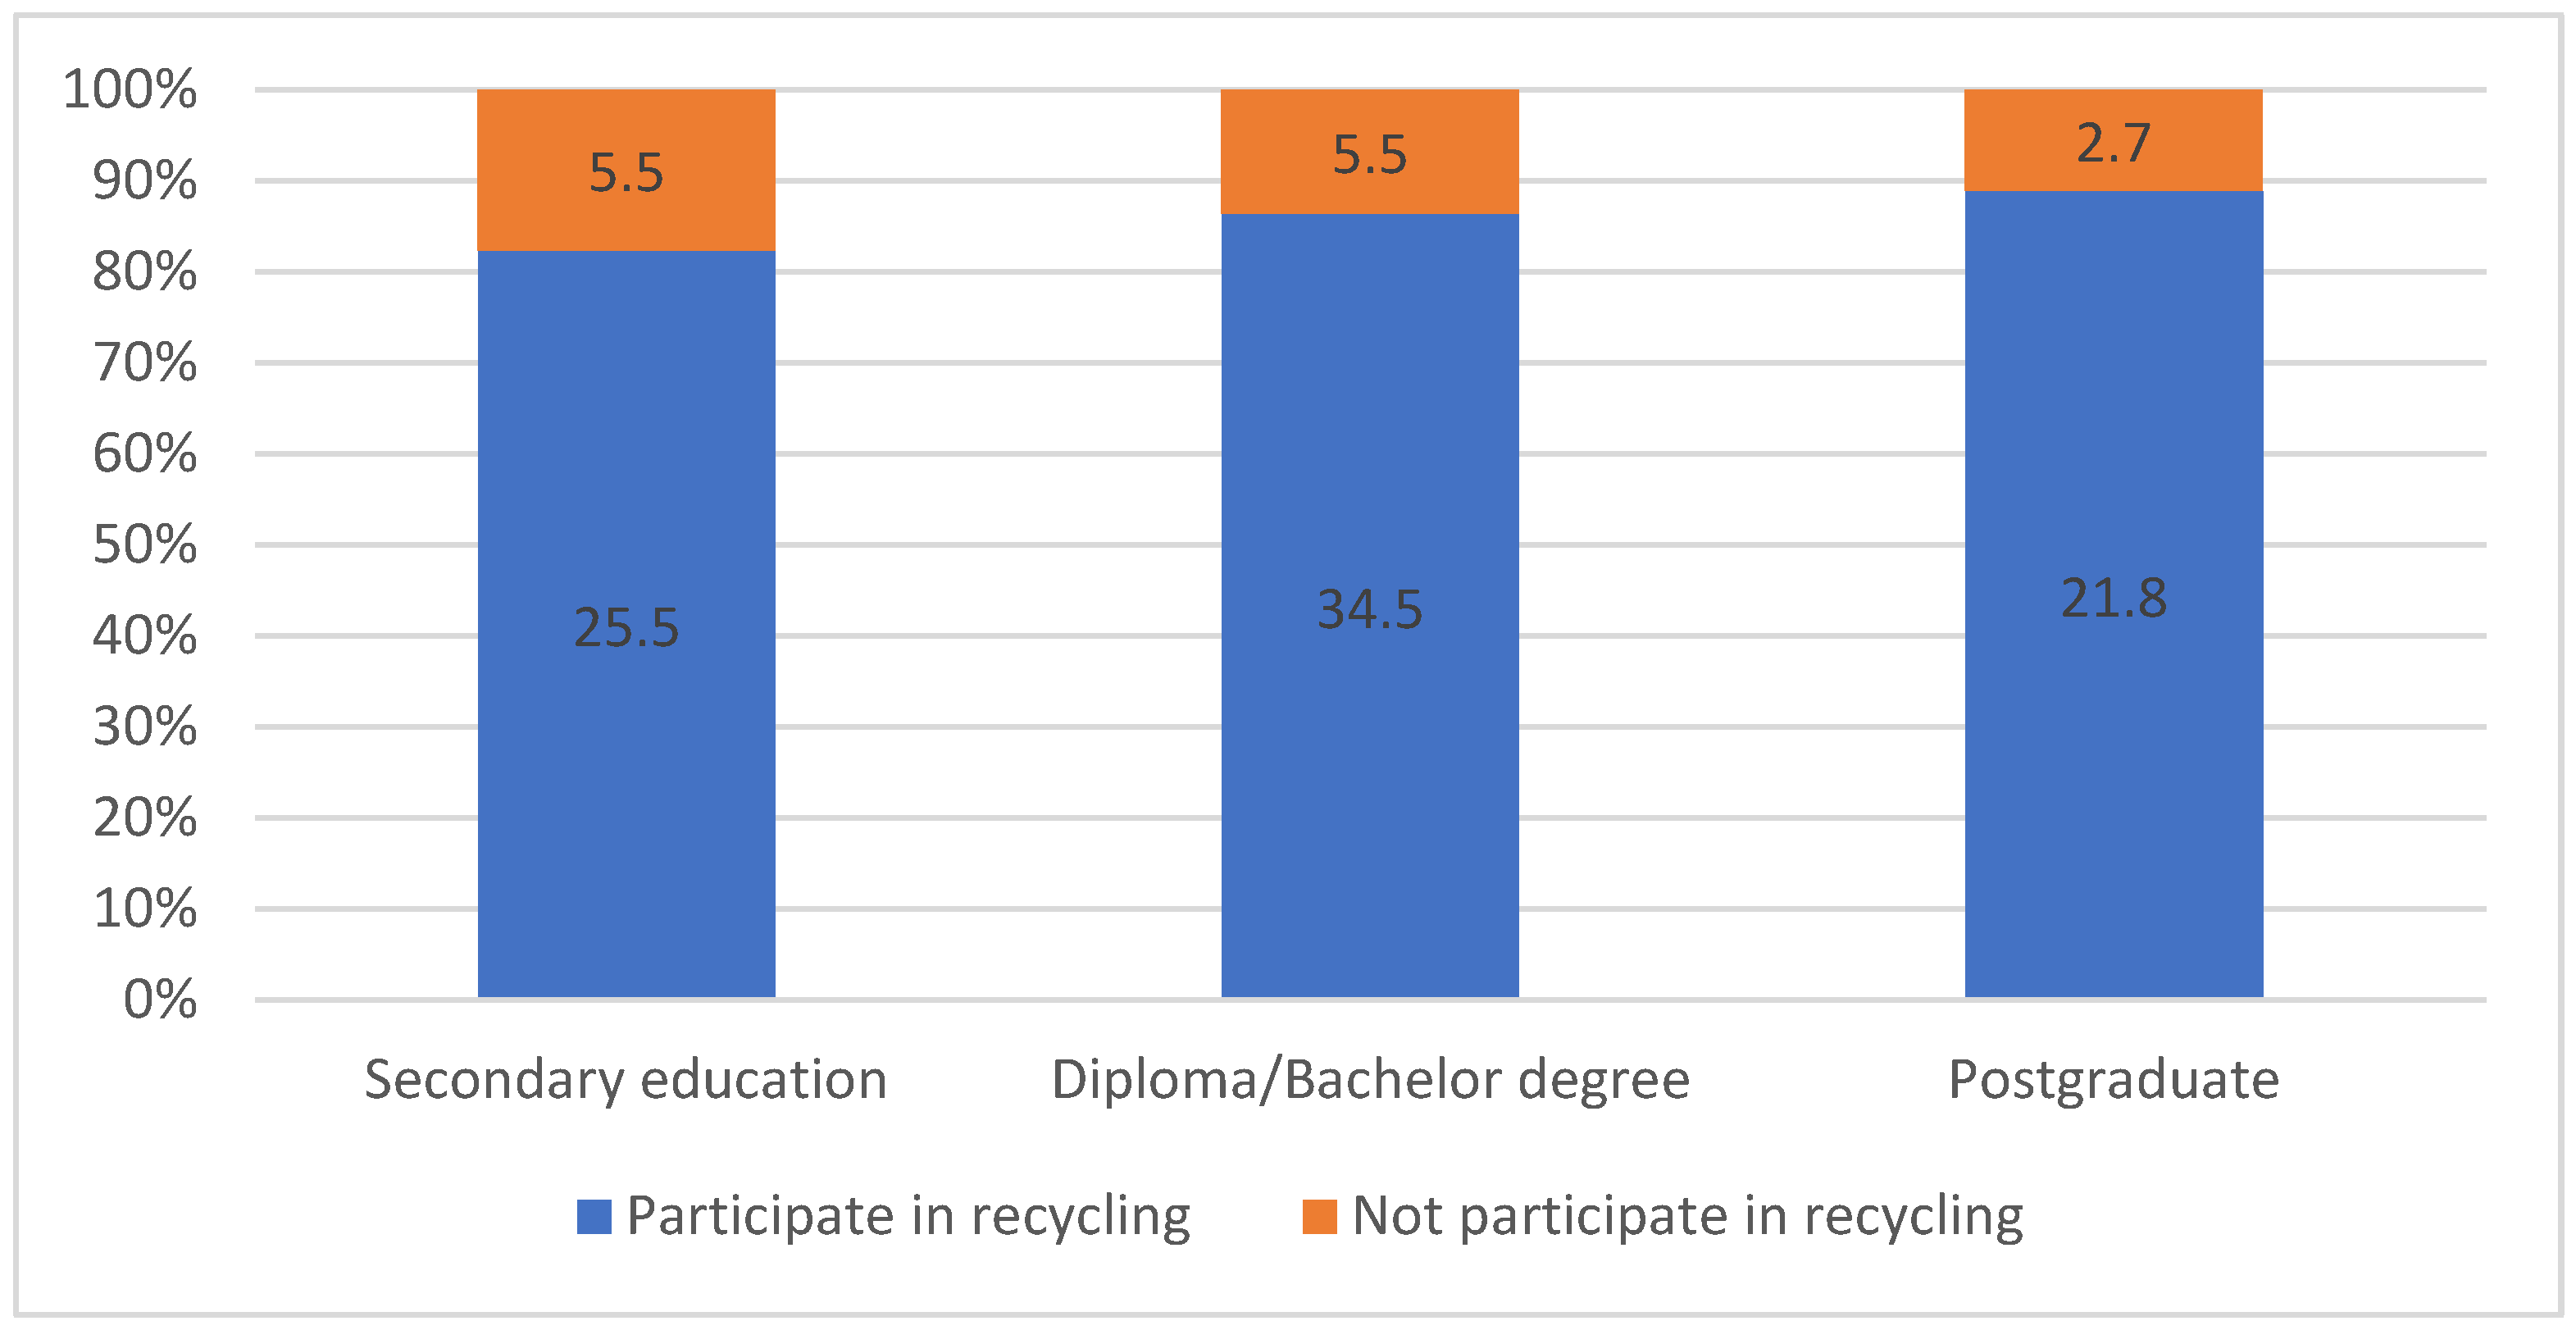
3.2.4. Education Level
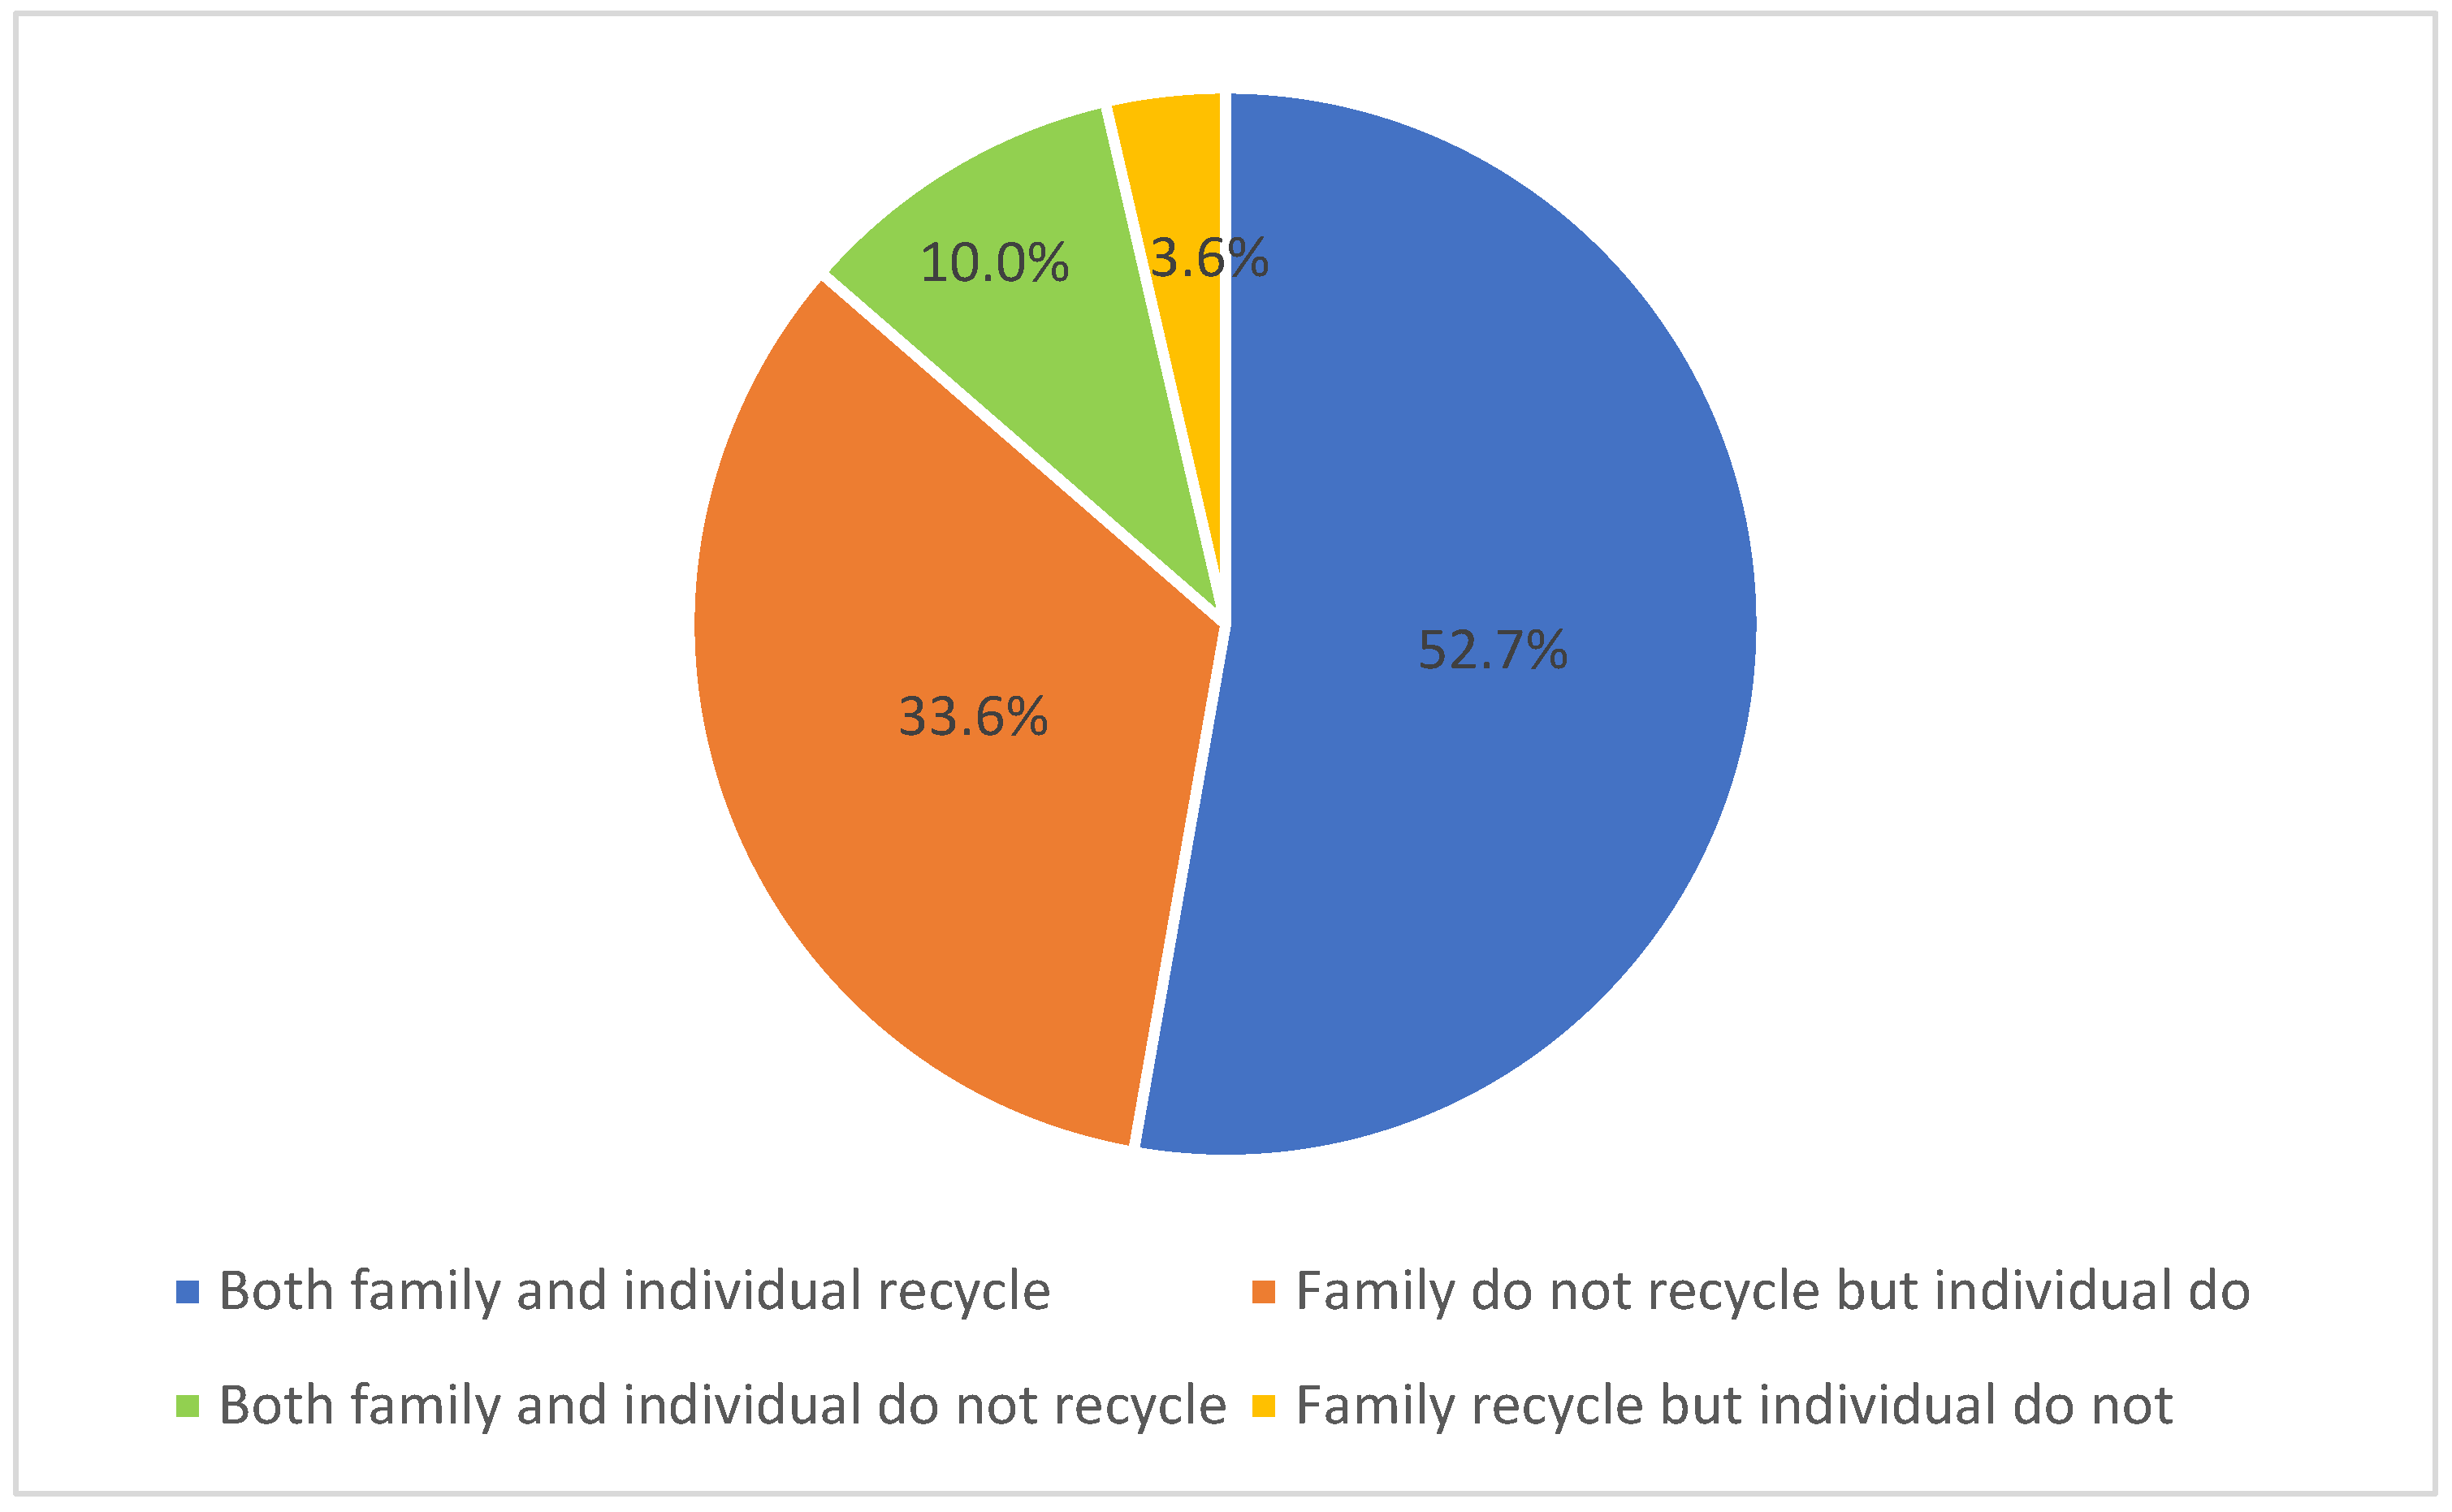
3.2.5. Family Recycling Habits Influence on Personal Behaviour
3.3. Analysis
3.3.1. Data Normality Test
- Null hypotheses (H0): The sample distribution is the same as the theoretical distribution (i.e., normal distribution).
3.3.2. Mann-Whitney U Test
- A.
- Gender
- B.
- Originating family influences on recycling behaviour
- C.
- Personal recycling habit
3.3.3. Kruskal-Wallis Test
- A.
- Age
- B.
- Education level
- C.
- Income
4. Discussion
4.1. Recommendations to Improve Recycling Policies
4.1.1. Positive Rewards
4.1.2. Basic Infrastructure
4.1.3. Recycling Knowledge
5. Conclusions
Author Contributions
Funding
Institutional Review Board Statement
Informed Consent Statement
Data Availability Statement
Conflicts of Interest
Abbreviations
| AHP | Analytical Hierarchy Process |
| ANOVA | Analysis of Variance |
| C.I. | Consistency Index |
| C.R. | Consistency Ratio |
| EPA | Environmental Protection Administration |
| FMADM | Fuzzy Multi-attribute Decision Making |
| ICT | Information and communication technology |
| ISWA | International Solid Waste Association |
| MADM | Multiple Attribute Decision Making |
| MODM | Multiple Object Decision Making |
| MSW | Municipal solid waste |
| PBC | Perceived behavioural control |
| SAW | Simple Additive Weighting |
| TOPSIS | Technique for Order Preference by Similarity to Ideal Solution |
| UNEP | United Nations Environment Programme |
Appendix A
Appendix A.1

| Demographic Traits | Time Consumed | Recycling Habit | Personal Attitude | Others Influence | Recycling Knowledge | Packaging Label | Multimedia Communication | Positive Reward | Monetary Penalty | System Recognition | Basic Infrastructure | Recycling Distance | Storage Space | |
|---|---|---|---|---|---|---|---|---|---|---|---|---|---|---|
| Gender | Male | 7.20 × 10⁻¹⁴ | 1.10 × 10⁻¹⁴ | 1.72 × 10⁻¹⁴ | 1.97 × 10⁻¹³ | 1.50 × 10⁻¹⁴ | 9.37 × 10⁻¹⁴ | 7.37 × 10⁻¹⁴ | 2.57 × 10⁻¹⁴ | 4.59 × 10⁻¹⁴ | 9.37 × 10⁻¹⁴ | 3.91 × 10⁻¹⁵ | 4.59 × 10⁻¹⁴ | 6.37 × 10⁻¹⁴ |
| Female | 2.85 × 10⁻¹⁴ | 2.50 × 10⁻¹⁶ | 4.40 × 10⁻¹⁵ | 7.69 × 10⁻¹⁴ | 7.94 × 10⁻¹⁵ | 2.03 × 10⁻¹⁴ | 2.03 × 10⁻¹⁴ | 9.14 × 10⁻¹⁵ | 2.50 × 10⁻¹⁴ | 1.34 × 10⁻¹⁴ | 1.16 × 10⁻¹⁴ | 1.45 × 10⁻¹⁴ | 2.50 × 10⁻¹⁴ | |
| Age | 21–30 | 6.17 × 10⁻⁹ | 1.93 × 10⁻⁹ | 2.55 × 10⁻⁹ | 9.45 × 10⁻⁹ | 5.21 × 10⁻¹⁰ | 3.50 × 10⁻⁹ | 6.39 × 10⁻⁹ | 3.59 × 10⁻⁹ | 3.60 × 10⁻⁹ | 4.26 × 10⁻⁹ | 4.10 × 10⁻⁹ | 2.14 × 10⁻⁹ | 3.35 × 10⁻⁹ |
| 31–40 | 3.75 × 10⁻⁷ | 3.80 × 10⁻⁸ | 1.52 × 10⁻⁷ | 6.05 × 10⁻⁷ | 1.54 × 10⁻⁷ | 3.86 × 10⁻⁷ | 2.70 × 10⁻⁷ | 1.27 × 10⁻⁷ | 3.18 × 10⁻⁷ | 3.86 × 10⁻⁷ | 2.43 × 10⁻⁷ | 2.41 × 10⁻⁷ | 3.51 × 10⁻⁷ | |
| 41–50 | 1.74 × 10⁻⁴ | 5.97 × 10⁻⁶ | 9.80 × 10⁻⁵ | 2.38 × 10⁻⁴ | 2.08 × 10⁻⁵ | 7.19 × 10⁻⁵ | 1.55 × 10⁻⁴ | 1.27 × 10⁻⁵ | 1.81 × 10⁻⁴ | 1.91 × 10⁻⁴ | 1.30 × 10⁻⁴ | 1.55 × 10⁻⁴ | 1.55 × 10⁻⁴ | |
| 51–60 | 5.82 × 10⁻⁶ | 1.58 × 10⁻⁶ | 3.22 × 10⁻⁶ | 6.38 × 10⁻⁶ | 3.82 × 10⁻⁶ | 1.69 × 10⁻⁶ | 4.84 × 10⁻⁶ | 1.11 × 10⁻⁶ | 4.84 × 10⁻⁶ | 3.55 × 10⁻⁶ | 1.25 × 10⁻⁷ | 4.84 × 10⁻⁶ | 4.70 × 10⁻⁶ | |
| Above 60 | 1.75 × 10⁻³ | 7.84 × 10⁻⁴ | 2.04 × 10⁻³ | 3.15 × 10⁻³ | 1.48 × 10⁻³ | 1.90 × 10⁻³ | 2.97 × 10⁻³ | 9.15 × 10⁻⁵ | 1.40 × 10⁻³ | 2.33 × 10⁻³ | 1.48 × 10⁻³ | 4.99 × 10⁻⁴ | 2.04 × 10⁻³ | |
| Education level | Secondary | 4.24 × 10⁻¹⁰ | 5.84 × 10⁻¹² | 1.29 × 10⁻¹⁰ | 4.16 × 10⁻¹⁰ | 1.74 × 10⁻¹⁰ | 3.35 × 10⁻¹⁰ | 3.35 × 10⁻¹⁰ | 1.13 × 10⁻¹¹ | 3.87 × 10⁻¹⁰ | 1.53 × 10⁻¹⁰ | 1.74 × 10⁻¹⁰ | 2.64 × 10⁻¹⁰ | 3.35 × 10⁻¹⁰ |
| Diploma/bachelor | 2.14 × 10⁻¹¹ | 6.08 × 10⁻¹³ | 4.23 × 10⁻¹² | 4.84 × 10⁻¹¹ | 5.92 × 10⁻¹² | 2.64 × 10⁻¹¹ | 2.17 × 10⁻¹¹ | 9.19 × 10⁻¹² | 1.47 × 10⁻¹¹ | 2.64 × 10⁻¹¹ | 1.24 × 10⁻¹¹ | 1.47 × 10⁻¹¹ | 1.93 × 10⁻¹¹ | |
| Postgraduate | 5.88 × 10⁻⁷ | 1.28 × 10⁻⁷ | 2.99 × 10⁻⁷ | 1.05 × 10⁻⁶ | 5.17 × 10⁻⁸ | 3.81 × 10⁻⁷ | 3.34 × 10⁻⁷ | 3.88 × 10⁻⁷ | 2.88 × 10⁻⁷ | 5.75 × 10⁻⁷ | 4.30 × 10⁻⁷ | 2.65 × 10⁻⁷ | 6.19 × 10⁻⁷ | |
| Income range | No income | 5.07 × 10⁻³ | 2.38 × 10⁻³ | 3.74 × 10⁻³ | 5.62 × 10⁻³ | 2.09 × 10⁻³ | 4.25 × 10⁻³ | 1.65 × 10⁻³ | 1.11 × 10⁻³ | 3.73 × 10⁻³ | 4.87 × 10⁻³ | 4.13 × 10⁻³ | 3.90 × 10⁻³ | 5.45 × 10⁻³ |
| Below 20,000 | 9.44 × 10⁻³ | 3.54 × 10⁻³ | 7.47 × 10⁻³ | 9.20 × 10⁻³ | 5.26 × 10⁻³ | 8.12 × 10⁻³ | 8.47 × 10⁻³ | 8.17 × 10⁻³ | 7.37 × 10⁻³ | 7.73 × 10⁻³ | 8.47 × 10⁻³ | 5.02 × 10⁻³ | 6.86 × 10⁻³ | |
| 20,000–39,999 | 4.24 × 10⁻¹⁰ | 1.57 × 10⁻¹¹ | 2.38 × 10⁻¹¹ | 5.8310−10 | 1.15 × 10⁻¹⁰ | 3.35 × 10⁻¹⁰ | 3.35 × 10⁻¹⁰ | 1.65 × 10⁻¹¹ | 3.35 × 10⁻¹⁰ | 2.34 × 10⁻¹⁰ | 1.23 × 10⁻¹² | 2.64 × 10⁻¹⁰ | 3.35 × 10⁻¹⁰ | |
| 40,000–59,999 | 9.91 × 10⁻⁷ | 2.37 × 10⁻⁷ | 5.40 × 10⁻⁷ | 1.68 × 10⁻⁶ | 8.29 × 10⁻⁸ | 1.19 × 10⁻⁶ | 5.53 × 10⁻⁷ | 2.49 × 10⁻⁷ | 8.56 × 10⁻⁷ | 1.19 × 10⁻⁶ | 7.73 × 10⁻⁷ | 2.28 × 10⁻⁷ | 9.96 × 10⁻⁷ | |
| Above 60,000 | 3.38 × 10⁻⁷ | 1.32 × 10⁻⁷ | 1.52 × 10⁻⁷ | 6.05 × 10⁻⁷ | 1.54 × 10⁻⁷ | 1.83 × 10⁻⁷ | 3.42 × 10⁻⁷ | 1.27 × 10⁻⁷ | 3.51 × 10⁻⁷ | 3.25 × 10⁻⁷ | 2.02 × 10⁻⁷ | 2.70 × 10⁻⁷ | 2.61 × 10⁻⁷ | |
| Family influence in recycling | Yes | 7.60 × 10⁻²⁴ | 1.97 × 10⁻²⁵ | 4.21 × 10⁻²⁵ | 4.10 × 10⁻²³ | 8.72 × 10⁻²⁵ | 8.47 × 10⁻²⁴ | 4.30 × 10⁻²⁴ | 1.11 × 10⁻²⁴ | 6.09 × 10⁻²⁴ | 8.47 × 10⁻²⁴ | 1.66 × 10⁻²⁴ | 2.41 × 10⁻²⁴ | 6.10 × 10⁻²⁴ |
| No | 3.04 × 10⁻⁴ | 1.28 × 10⁻⁴ | 2.09 × 10⁻⁴ | 3.48 × 10⁻⁴ | 1.04 × 10⁻⁴ | 1.65 × 10⁻⁴ | 3.14 × 10⁻⁴ | 1.95 × 10⁻⁵ | 1.42 × 10⁻⁴ | 3.02 × 10⁻⁴ | 5.47 × 10⁻⁵ | 1.47 × 10⁻⁴ | 2.36 × 10⁻⁴ | |
| Personal recycling habit | Yes | 7.60 × 10⁻²⁴ | 1.97 × 10⁻²⁵ | 4.21 × 10⁻²⁵ | 4.10 × 10⁻²³ | 8.72 × 10⁻²⁵ | 8.47 × 10⁻²⁴ | 4.30 × 10⁻²⁴ | 1.11 × 10⁻²⁴ | 6.09 × 10⁻²⁴ | 8.47 × 10⁻²⁴ | 1.66 × 10⁻²⁴ | 2.41 × 10⁻²⁴ | 6.10 × 10⁻²⁴ |
| No | 3.04 × 10⁻⁴ | 1.28 × 10⁻⁴ | 2.09 × 10⁻⁴ | 3.48 × 10⁻⁴ | 1.04 × 10⁻⁴ | 1.65 × 10⁻⁴ | 3.14 × 10⁻⁴ | 1.95 × 10⁻⁵ | 1.42 × 10⁻⁴ | 3.02 × 10⁻⁴ | 5.47 × 10⁻⁵ | 1.47 × 10⁻⁴ | 2.36 × 10⁻⁴ | |
Appendix A.2
| Performance Indicators | Gender | Whether Family Engaged in Recycling | Whether Individual Engaged in Recycling |
|---|---|---|---|
| Time consumed | 3.05 × 10⁻¹ | 6.90 × 10⁻² | 3.64 × 10⁻² * |
| Recycling habit | 5.94 × 10⁻¹ | 7.38 × 10⁻¹ | 3.20 × 10⁻¹ |
| Personal attitude | 2.61 × 10⁻¹ | 8.89 × 10⁻² | 9.03 × 10⁻³ * |
| Others influence | 4.93 × 10⁻¹ | 6.23 × 10⁻¹ | 1.53 × 10⁻¹ |
| Recycling knowledge | 7.26 × 10⁻¹ | 3.27 × 10⁻¹ | 2.83 × 10⁻¹ |
| Packaging label | 9.45 × 10⁻¹ | 3.08 × 10⁻¹ | 3.01 × 10⁻¹ |
| Multimedia communication | 2.82 × 10⁻¹ | 4.64 × 10⁻¹ | 1.32 × 10⁻¹ |
| Positive reward | 1.74 × 10⁻² * | 5.89 × 10⁻¹ | 2.67 × 10⁻¹ |
| Monetary penalty | 1.73 × 10⁻¹ | 2.91 × 10⁻¹ | 1.65 × 10⁻¹ |
| System recognition | 9.81 × 10⁻² | 7.40 × 10⁻¹ | 1.86 × 10⁻² * |
| Basic infrastructure | 3.22 × 10⁻² * | 3.88 × 10⁻¹ | 1.90 × 10⁻¹ |
| Recycling distance | 5.44 × 10⁻² | 2.17 × 10⁻¹ | 4.32 × 10⁻¹ |
| Storage space | 1.12 × 10⁻¹ | 7.81 × 10⁻¹ | 2.60 × 10⁻¹ |
Appendix A.3
| Performance Indicators | Age | Education Level | Income |
|---|---|---|---|
| Time consumed | 1.11 × 10⁻¹ * | 1.48 × 10⁻¹ | 3.69 × 10⁻¹ |
| Recycling habit | 2.51 × 10⁻¹ | 1.62 × 10⁻² | 3.24 × 10⁻² |
| Personal attitude | 4.63 × 10⁻¹ * | 1.87 × 10⁻¹ | 1.32 × 10⁻¹ |
| Others influence | 3.17 × 10⁻¹ | 7.87 × 10⁻¹ | 2.97 × 10⁻¹ |
| Recycling knowledge | 1.34 × 10⁻² | 7.08 × 10⁻¹ | 3.19 × 10⁻¹ |
| Packaging label | 9.09 × 10⁻¹ | 7.81 × 10⁻¹ | 6.36 × 10⁻¹ |
| Multimedia communication | 3.31 × 10⁻² | 1.69 × 10⁻¹ | 8.37 × 10⁻² * |
| Positive reward | 3.05 × 10⁻¹ | 4.15 × 10⁻¹ | 6.97 × 10⁻² |
| Monetary penalty | 3.04 × 10⁻¹ | 5.29 × 10⁻¹ | 6.56 × 10⁻² |
| System recognition | 4.55 × 10⁻¹ | 1.21 × 10⁻¹ | 6.52 × 10⁻¹ |
| Basic infrastructure | 6.07 × 10⁻¹ | 5.64 × 10⁻¹ | 2.96 × 10⁻³ |
| Recycling distance | 2.54 × 10⁻¹ | 1.22 × 10⁻¹ | 5.93 × 10⁻¹ |
| Storage space | 6.82 × 10⁻¹ | 2.69 × 10⁻¹ | 4.24 × 10⁻¹ |
Appendix A.4
|
|
| Notes There are several methods to evaluate in the Analytic Hierarchy Process (AHP). In its basic form, importance is categorized into five levels: absolute importance, very strong importance, essential importance, moderate importance, and equal importance. These qualitative judgements correspond to numerical values of 9, 7, 5, 3 and 1, respectively. If making a judgement is difficult, even numbers (e.g., 2, 4, 6, 8) may also be used as intermediate values. Since AHP requires pairwise comparisons between factors, the resulting scale includes the following ratios: 9:1, 7:1, 5:1, 3:1, 1:1, 1:3, 1:5, 1:7, and 1:9. Please select the value that best reflects your perception of the relative importance between each pair of factors—the greater the importance of a factor, the higher the assigned value. |
| Analytic Hierarchy Process (AHP) hierarchical framework |
| The image shown below serve as the basis for the questions that you will be answering. In this study, the factor will be evaluated through pairwise comparisons. |
 Please answer the following questions based on the notes and hierarchical framework. |
| ||||||||||
| Psychological Dimension V.S. Knowledge and Education Dimension Comparison | ||||||||||
| Which one do you think is more influential? (Left represent Psychological dimension, Right represent Knowledge and Education dimension) | ||||||||||
| Importance level ratio | ||||||||||
| Absolute importance | Very Strong Importance | Essential Importance | Moderate Importance | Equal Importance | Moderate Importance | Essential Importance | Very Strong Importance | Absolute importance | ||
| 9:1 | 7:1 | 5:1 | 3:1 | 1:1 | 1:3 | 1:5 | 1:7 | 1:9 | ||
| Psycho logical | Knowledge And Education | |||||||||
| Psychological Dimension V.S. Economy and Policy Dimension Comparison | ||||||||||
| Which one do you think is more influential? (Left represent Psychological dimension, Right represent Economy and Policy dimension) | ||||||||||
| Importance level ratio | ||||||||||
| Absolute importance | Very Strong Importance | Essential Importance | Moderate Importance | Equal Importance | Moderate Importance | Essential Importance | Very Strong Importance | Absolute importance | ||
| 9:1 | 7:1 | 5:1 | 3:1 | 1:1 | 1:3 | 1:5 | 1:7 | 1:9 | ||
| Psycho logical | Economy And Policy | |||||||||
| Psychological Dimension V.S. Infrastructure Dimension Comparison | ||||||||||
| Which one do you think is more influential? (Left represent Psychological dimension, Right represent Infrastructure dimension) | ||||||||||
| Importance level ratio | ||||||||||
| Absolute importance | Very Strong Importance | Essential Importance | Moderate Importance | Equal Importance | Moderate Importance | Essential Importance | Very Strong Importance | Absolute importance | ||
| 9:1 | 7:1 | 5:1 | 3:1 | 1:1 | 1:3 | 1:5 | 1:7 | 1:9 | ||
| Psycho logical | Infrastruc ture | |||||||||
| Knowledge and Education Dimension V.S. Economy and Policy Dimension Comparison | ||||||||||
| Which one do you think is more influential? (Left represent Knowledge and Education dimension, Right represent Economy and Policy dimension) | ||||||||||
| Importance level ratio | ||||||||||
| Absolute importance | Very Strong Importance | Essential Importance | Moderate Importance | Equal Importance | Moderate Importance | Essential Importance | Very Strong Importance | Absolute importance | ||
| 9:1 | 7:1 | 5:1 | 3:1 | 1:1 | 1:3 | 1:5 | 1:7 | 1:9 | ||
| Knowledge And Education | Economy And Policy | |||||||||
| Knowledge and Education Dimension V.S. Infrastructure Dimension Comparison | ||||||||||
| Which one do you think is more influential? (Left represent Knowledge and Education dimension, Right represent Infrastructure dimension) | ||||||||||
| Importance level ratio | ||||||||||
| Absolute importance | Very Strong Importance | Essential Importance | Moderate Importance | Equal Importance | Moderate Importance | Essential Importance | Very Strong Importance | Absolute importance | ||
| 9:1 | 7:1 | 5:1 | 3:1 | 1:1 | 1:3 | 1:5 | 1:7 | 1:9 | ||
| Knowledge And Education | Infrastruc ture | |||||||||
| Economy and Policy Dimension V.S. Infrastructure Dimension Comparison | ||||||||||
| Which one do you think is more influential? (Left represent Economy and Policy dimension, Right represent Infrastructure dimension) | ||||||||||
| Importance level ratio | ||||||||||
| Absolute importance | Very Strong Importance | Essential Importance | Moderate Importance | Equal Importance | Moderate Importance | Essential Importance | Very Strong Importance | Absolute importance | ||
| 9:1 | 7:1 | 5:1 | 3:1 | 1:1 | 1:3 | 1:5 | 1:7 | 1:9 | ||
| Economy And Policy | Infrastruc ture | |||||||||
| ||||||||||
| Time consumed V.S. Recycling habit Comparison | ||||||||||
| Which one do you think is more influential? (Left represent Time consumed, Right represent Recycling habit) | ||||||||||
| Importance level ratio | ||||||||||
| Absolute importance | Very Strong Importance | Essential Importance | Moderate Importance | Equal Importance | Moderate Importance | Essential Importance | Very Strong Importance | Absolute importance | ||
| 9:1 | 7:1 | 5:1 | 3:1 | 1:1 | 1:3 | 1:5 | 1:7 | 1:9 | ||
| Time consumed | Recycling habit | |||||||||
| Time consumed V.S. Personal attitude Comparison | ||||||||||
| Which one do you think is more influential? (Left represent Time consumed, Right represent Personal attitude) | ||||||||||
| Importance level ratio | ||||||||||
| Absolute importance | Very Strong Importance | Essential Importance | Moderate Importance | Equal Importance | Moderate Importance | Essential Importance | Very Strong Importance | Absolute importance | ||
| 9:1 | 7:1 | 5:1 | 3:1 | 1:1 | 1:3 | 1:5 | 1:7 | 1:9 | ||
| Time consumed | Personal attitude | |||||||||
| Time consumed V.S. Other influences Comparison | ||||||||||
| Which one do you think is more influential? (Left represent Time consumed, Right represent Other influences) | ||||||||||
| Importance level ratio | ||||||||||
| Absolute importance | Very Strong Importance | Essential Importance | Moderate Importance | Equal Importance | Moderate Importance | Essential Importance | Very Strong Importance | Absolute importance | ||
| 9:1 | 7:1 | 5:1 | 3:1 | 1:1 | 1:3 | 1:5 | 1:7 | 1:9 | ||
| Time consumed | Other influences | |||||||||
| Recycling habit V.S. Personal attitude Comparison | ||||||||||
| Which one do you think is more influential? (Left represent Recycling habit, Right represent Personal attitude) | ||||||||||
| Importance level ratio | ||||||||||
| Absolute importance | Very Strong Importance | Essential Importance | Moderate Importance | Equal Importance | Moderate Importance | Essential Importance | Very Strong Importance | Absolute importance | ||
| 9:1 | 7:1 | 5:1 | 3:1 | 1:1 | 1:3 | 1:5 | 1:7 | 1:9 | ||
| Recycling habit | Personal attitude | |||||||||
| Recycling habit V.S. Other influences Comparison | ||||||||||
| Which one do you think is more influential? (Left represent Recycling habit, Right represent Other influences) | ||||||||||
| Importance level ratio | ||||||||||
| Absolute importance | Very Strong Importance | Essential Importance | Moderate Importance | Equal Importance | Moderate Importance | Essential Importance | Very Strong Importance | Absolute importance | ||
| 9:1 | 7:1 | 5:1 | 3:1 | 1:1 | 1:3 | 1:5 | 1:7 | 1:9 | ||
| Recycling habit | Other influences | |||||||||
| Personal attitude V.S. Other influences Comparison | ||||||||||
| Which one do you think is more influential? (Left represent Personal attitude, Right represent Other influences) | ||||||||||
| Importance level ratio | ||||||||||
| Absolute importance | Very Strong Importance | Essential Importance | Moderate Importance | Equal Importance | Moderate Importance | Essential Importance | Very Strong Importance | Absolute importance | ||
| 9:1 | 7:1 | 5:1 | 3:1 | 1:1 | 1:3 | 1:5 | 1:7 | 1:9 | ||
| Personal attitude | Other influences | |||||||||
| ||||||||||
| Recycling knowledge V.S. Packaging labels Comparison | ||||||||||
| Which one do you think is more influential? (Left represent Recycling knowledge, Right represent Packaging labels) | ||||||||||
| Importance level ratio | ||||||||||
| Absolute importance | Very Strong Importance | Essential Importance | Moderate Importance | Equal Importance | Moderate Importance | Essential Importance | Very Strong Importance | Absolute importance | ||
| 9:1 | 7:1 | 5:1 | 3:1 | 1:1 | 1:3 | 1:5 | 1:7 | 1:9 | ||
| Recycling knowledge | Packaging labels | |||||||||
| Recycling knowledge V.S. Multimedia communication Comparison | ||||||||||
| Which one do you think is more influential? (Left represent Recycling knowledge, Right represent Multimedia communication) | ||||||||||
| Importance level ratio | ||||||||||
| Absolute importance | Very Strong Importance | Essential Importance | Moderate Importance | Equal Importance | Moderate Importance | Essential Importance | Very Strong Importance | Absolute importance | ||
| 9:1 | 7:1 | 5:1 | 3:1 | 1:1 | 1:3 | 1:5 | 1:7 | 1:9 | ||
| Recycling knowledge | Multi media commu nication | |||||||||
| Packaging labels V.S. Multimedia communication Comparison | ||||||||||
| Which one do you think is more influential? (Left represent Packaging labels, Right represent Multimedia communication) | ||||||||||
| Importance level ratio | ||||||||||
| Absolute importance | Very Strong Importance | Essential Importance | Moderate Importance | Equal Importance | Moderate Importance | Essential Importance | Very Strong Importance | Absolute importance | ||
| 9:1 | 7:1 | 5:1 | 3:1 | 1:1 | 1:3 | 1:5 | 1:7 | 1:9 | ||
| Packaging labels | Multi media commu nication | |||||||||
| ||||||||||
| Positive rewards V.S. Monetary penalties Comparison | ||||||||||
| Which one do you think is more influential? (Left represent Positive rewards, Right represent Monetary penalties) | ||||||||||
| Importance level ratio | ||||||||||
| Absolute importance | Very Strong Importance | Essential Importance | Moderate Importance | Equal Importance | Moderate Importance | Essential Importance | Very Strong Importance | Absolute importance | ||
| 9:1 | 7:1 | 5:1 | 3:1 | 1:1 | 1:3 | 1:5 | 1:7 | 1:9 | ||
| Posiitive rewards | Monetary penalties | |||||||||
| Positive rewards V.S. System recognition Comparison | ||||||||||
| Which one do you think is more influential? (Left represent Positive rewards, Right represent System recognition) | ||||||||||
| Importance level ratio | ||||||||||
| Absolute importance | Very Strong Importance | Essential Importance | Moderate Importance | Equal Importance | Moderate Importance | Essential Importance | Very Strong Importance | Absolute importance | ||
| 9:1 | 7:1 | 5:1 | 3:1 | 1:1 | 1:3 | 1:5 | 1:7 | 1:9 | ||
| Posiitive rewards | System recognition | |||||||||
| Monetary penalties V.S. System recognition Comparison | ||||||||||
| Which one do you think is more influential? (Left represent Monetary penalties, Right represent System recognition) | ||||||||||
| Importance level ratio | ||||||||||
| Absolute importance | Very Strong Importance | Essential Importance | Moderate Importance | Equal Importance | Moderate Importance | Essential Importance | Very Strong Importance | Absolute importance | ||
| 9:1 | 7:1 | 5:1 | 3:1 | 1:1 | 1:3 | 1:5 | 1:7 | 1:9 | ||
| Monetary penalties | System recognition | |||||||||
| ||||||||||
| Basic infrastructure V.S. Recycling distance Comparison | ||||||||||
| Which one do you think is more influential? (Left represent Basic infrastructure, Right represent Recycling distance) | ||||||||||
| Importance level ratio | ||||||||||
| Absolute importance | Very Strong Importance | Essential Importance | Moderate Importance | Equal Importance | Moderate Importance | Essential Importance | Very Strong Importance | Absolute importance | ||
| 9:1 | 7:1 | 5:1 | 3:1 | 1:1 | 1:3 | 1:5 | 1:7 | 1:9 | ||
| Basic infra structure | Recycling distance | |||||||||
| Basic infrastructure V.S. Storage space Comparison | ||||||||||
| Which one do you think is more influential? (Left represent Basic infrastructure, Right represent Storage space) | ||||||||||
| Importance level ratio | ||||||||||
| Absolute importance | Very Strong Importance | Essential Importance | Moderate Importance | Equal Importance | Moderate Importance | Essential Importance | Very Strong Importance | Absolute importance | ||
| 9:1 | 7:1 | 5:1 | 3:1 | 1:1 | 1:3 | 1:5 | 1:7 | 1:9 | ||
| Basic infra structure | Storage space | |||||||||
| Recycling distance V.S. Storage space Comparison | ||||||||||
| Which one do you think is more influential? (Left represent Recycling distance, Right represent Storage space) | ||||||||||
| Importance level ratio | ||||||||||
| Absolute importance | Very Strong Importance | Essential Importance | Moderate Importance | Equal Importance | Moderate Importance | Essential Importance | Very Strong Importance | Absolute importance | ||
| 9:1 | 7:1 | 5:1 | 3:1 | 1:1 | 1:3 | 1:5 | 1:7 | 1:9 | ||
| Recycling distance | Storage space | |||||||||
| ||||||||||
References
- Kaza, S.; Yao, L.C.; Bhada-Tata, P.; Van Woerden, F. What a Waste 2.0: A Global Snapshot of Solid Waste Management to 2050; World Bank: Washington, DC, USA, 2018. [Google Scholar] [CrossRef]
- United Nations Environment Programme; International Solid Waste Association. Global Waste Management Outlook 2024-Beyond an Age of Waste: Turning Rubbish into a Resource; United Nations Environment Programme: Nairobi, Kenya, 2024. [Google Scholar] [CrossRef]
- EPA. National Overview: Facts and Figures on Materials, Wastes and Recycling. United States Environmental Protection Agency. Available online: https://www.epa.gov/facts-and-figures-about-materials-waste-and-recycling/national-overview-facts-and-figures-materials (accessed on 12 April 2025).
- Ministry of Environment. Recycling of Waste Plastic Containers: Annual Output Value of Nearly 5 Billion Yuan. Ministry of Environment News. Taiwan 2012. Available online: https://enews.moenv.gov.tw/page/3b3c62c78849f32f/66940ad9-2ca0-455e-9c34-2052af6d9a19 (accessed on 12 April 2025).
- Karak, T.; Bhagat, R.M.; Bhattacharyya, P. Municipal Solid Waste Generation, Composition, and Management: The World Scenario. Crit. Rev. Environ. Sci. Technol. 2012, 42, 1509–1630. [Google Scholar] [CrossRef]
- Bogner, J.; Pipatti, R.; Hashimoto, S.; Diaz, C.; Mareckova, K.; Diaz, L.; Kjeldsen, P.; Monni, S.; Faaij, A.; Gao, Q.; et al. Mitigation of Global Greenhouse Gas Emissions from Waste: Conclusions and Strategies from the Intergovernmental Panel on Climate Change (IPCC) Fourth Assessment Report. Working Group III (Mitigation). Waste Manag. Res. 2008, 26, 11–32. [Google Scholar] [CrossRef] [PubMed]
- Ramachandra, T.V.; Bharath, H.A.; Kulkarni, G.; Han, S.S. Municipal Solid Waste: Generation, Composition and GHG Emissions in Bangalore, India. Renew. Sustain. Energy Rev. 2018, 82, 1122–1136. [Google Scholar] [CrossRef]
- Ma, J.; Hipel, K.W. Exploring Social Dimensions of Municipal Solid Waste Management around the Globe–A Systematic Literature Review. Waste Manag. 2016, 56, 3–12. [Google Scholar] [CrossRef]
- Knickmeyer, D. Social Factors Influencing Household Waste Separation: A Literature Review on Good Practices to Improve the Recycling Performance of Urban Areas. J. Clean. Prod. 2020, 245, 118605. [Google Scholar] [CrossRef]
- Thomas, C. Public Understanding and Its Effect on Recycling Performance in Hampshire and Milton Keynes. Resour. Conserv. Recycl. 2001, 32, 259–274. [Google Scholar] [CrossRef]
- Varotto, A.; Spagnolli, A. Psychological Strategies to Promote Household Recycling. A Systematic Review with Meta-Analysis of Validated Field Interventions. J. Environ. Psychol. 2017, 51, 168–188. [Google Scholar] [CrossRef]
- Adu-Gyamfi, G.; Asamoah, A.N.; Nketiah, E.; Obuobi, B.; Adjei, M.; Cudjoe, D.; Zhu, B. Reducing Waste Management Challenges: Empirical Assessment of Waste Sorting Intention among Corporate Employees in Ghana. J. Retail. Consum. Serv. 2023, 72, 103261. [Google Scholar] [CrossRef]
- Rousta, K.; Zisen, L.; Hellwig, C. Household Waste Sorting Participation in Developing Countries—A Meta-Analysis. Recycling 2020, 5, 6. [Google Scholar] [CrossRef]
- Li, Z.; Zhang, T.; Sun, Y.; Zheng, L.; Zhou, H.; Wang, H.; Chen, T.; Yan, J. Identifying the Key Policy Drivers for Behavioral Improvement in Waste Source Separation in the Yangtze Delta Region, China. J. Clean. Prod. 2022, 351, 131379. [Google Scholar] [CrossRef]
- Raghu, S.J.; Rodrigues, L.L.R. Behavioral Aspects of Solid Waste Management: A Systematic Review. J. Air Waste Manag. Assoc. 2020, 70, 1268–1302. [Google Scholar] [CrossRef] [PubMed]
- Govindan, K.; Zhuang, Y.; Chen, G. Analysis of Factors Influencing Residents’ Waste Sorting Behavior: A Case Study of Shanghai. J. Clean. Prod. 2022, 349, 131126. [Google Scholar] [CrossRef]
- Bandura, A. Self-Efficacy Mechanism in Human Agency. Am. Psychol. 1982, 37, 122–147. [Google Scholar] [CrossRef]
- Davis, G.; Phillips, P.S.; Read, A.D.; Iida, Y. Demonstrating the Need for the Development of Internal Research Capacity: Understanding Recycling Participation Using the Theory of Planned Behaviour in West Oxfordshire, UK. Resour. Conserv. Recycl. 2006, 46, 115–127. [Google Scholar] [CrossRef]
- Sheeran, P. Intention—Behavior Relations: A Conceptual and Empirical Review. Eur. Rev. Soc. Psychol. 2002, 12, 1–36. [Google Scholar] [CrossRef]
- Wang, H.; Liu, X.; Wang, N.; Zhang, K.; Wang, F.; Zhang, S.; Wang, R.; Zheng, P.; Matsushita, M. Key Factors Influencing Public Awareness of Household Solid Waste Recycling in Urban Areas of China: A Case Study. Resour. Conserv. Recycl. 2020, 158, 104813. [Google Scholar] [CrossRef]
- Struk, M. Distance and Incentives Matter: The Separation of Recyclable Municipal Waste. Resour. Conserv. Recycl. 2017, 122, 155–162. [Google Scholar] [CrossRef]
- Chen, M.-F.; Tung, P.-J. The Moderating Effect of Perceived Lack of Facilities on Consumers’ Recycling Intentions. Environ. Behav. 2010, 42, 824–844. [Google Scholar] [CrossRef]
- Cudjoe, D.; Nketiah, E.; Obuobi, B.; Adjei, M.; Zhu, B.; Adu-Gyamfi, G. Predicting Waste Sorting Intention of Residents of Jiangsu Province, China. J. Clean. Prod. 2022, 366, 132838. [Google Scholar] [CrossRef]
- Cudjoe, D.; Yuan, Q.; Han, M.S. An Assessment of the Influence of Awareness of Benefits and Perceived Difficulties on Waste Sorting Intention in Beijing. J. Clean. Prod. 2020, 272, 123084. [Google Scholar] [CrossRef]
- Karim Ghani, W.A.W.A.; Rusli, I.F.; Biak, D.R.A.; Idris, A. An Application of the Theory of Planned Behaviour to Study the Influencing Factors of Participation in Source Separation of Food Waste. Waste Manag. 2013, 33, 1276–1281. [Google Scholar] [CrossRef] [PubMed]
- Loan, L.T.T.; Nomura, H.; Takahashi, Y.; Yabe, M. Psychological Driving Forces behind Households’ Behaviors toward Municipal Organic Waste Separation at Source in Vietnam: A Structural Equation Modeling Approach. J. Mater. Cycles Waste Manag. 2017, 19, 1052–1060. [Google Scholar] [CrossRef]
- Miafodzyeva, S.; Brandt, N. Recycling Behaviour Among Householders: Synthesizing Determinants Via a Meta-Analysis. Waste Biomass Valor 2013, 4, 221–235. [Google Scholar] [CrossRef]
- Negash, Y.T.; Sarmiento, L.S.C.; Tseng, M.-L.; Lim, M.K.; Ali, M.H. Engagement Factors for Household Waste Sorting in Ecuador: Improving Perceived Convenience and Environmental Attitudes Enhances Waste Sorting Capacity. Resour. Conserv. Recycl. 2021, 175, 105893. [Google Scholar] [CrossRef]
- Ramayah, T.; Lee, J.W.C.; Lim, S. Sustaining the Environment through Recycling: An Empirical Study. J. Environ. Manag. 2012, 102, 141–147. [Google Scholar] [CrossRef]
- Stoeva, K.; Alriksson, S. Influence of Recycling Programmes on Waste Separation Behaviour. Waste Manag. 2017, 68, 732–741. [Google Scholar] [CrossRef]
- Strydom, W.F. Barriers to Household Waste Recycling: Empirical Evidence from South Africa. Recycling 2018, 3, 41. [Google Scholar] [CrossRef]
- Wan, C.; Shen, G.Q.; Choi, S. Experiential and Instrumental Attitudes: Interaction Effect of Attitude and Subjective Norm on Recycling Intention. J. Environ. Psychol. 2017, 50, 69–79. [Google Scholar] [CrossRef]
- Wang, C.; Zhu, T.; Yao, H.; Sun, Q. The Impact of Green Information on the Participation Intention of Consumers in Online Recycling: An Experimental Study. Sustainability 2020, 12, 2498. [Google Scholar] [CrossRef]
- Xu, L.; Lin, T.; Xu, Y.; Xiao, L.; Ye, Z.; Cui, S. Path Analysis of Factors Influencing Household Solid Waste Generation: A Case Study of Xiamen Island, China. J. Mater. Cycles Waste Manag. 2016, 18, 377–384. [Google Scholar] [CrossRef]
- Zen, I.S.; Noor, Z.Z.; Yusuf, R.O. The Profiles of Household Solid Waste Recyclers and Non-Recyclers in Kuala Lumpur, Malaysia. Habitat Int. 2014, 42, 83–89. [Google Scholar] [CrossRef]
- Jesson, J.K.; Pocock, R.; Stone, I. Barriers to Recycling: A Review of Evidence Since 2008. 2014. Available online: https://www.healthandsafetybookstore.co.uk/members/WRAP%20BarrierstoRecycling.pdf (accessed on 12 April 2025).
- Klöckner, C.A.; Oppedal, I.O. General vs. Domain Specific Recycling Behaviour—Applying a Multilevel Comprehensive Action Determination Model to Recycling in Norwegian Student Homes. Resour. Conserv. Recycl. 2011, 55, 463–471. [Google Scholar] [CrossRef]
- Li, C.J.; Huang, Y.Y.; Harder, M.K. Incentives for Food Waste Diversion: Exploration of a Long Term Successful Chinese City Residential Scheme. J. Clean. Prod. 2017, 156, 491–499. [Google Scholar] [CrossRef]
- Rebehy, P.C.P.W.; Salgado Junior, A.P.; Ometto, A.R.; Espinoza, D.D.F.; Rossi, E.; Novi, J.C. Municipal Solid Waste Management (MSWM) in Brazil: Drivers and Best Practices towards to Circular Economy Based on European Union and BSI. J. Clean. Prod. 2023, 401, 136591. [Google Scholar] [CrossRef]
- Alhassan, H.; Kwakwa, P.A.; Owusu-Sekyere, E. Households’ Source Separation Behaviour and Solid Waste Disposal Options in Ghana’s Millennium City. J. Environ. Manag. 2020, 259, 110055. [Google Scholar] [CrossRef]
- Jekria, N.; Daud, S. Environmental Concern and Recycling Behaviour. Procedia Econ. Financ. 2016, 35, 667–673. [Google Scholar] [CrossRef]
- Pakpour, A.H.; Zeidi, I.M.; Emamjomeh, M.M.; Asefzadeh, S.; Pearson, H. Household Waste Behaviours among a Community Sample in Iran: An Application of the Theory of Planned Behaviour. Waste Manag. 2014, 34, 980–986. [Google Scholar] [CrossRef]
- Wang, S.; Wang, J.; Zhao, S.; Yang, S. Information Publicity and Resident’s Waste Separation Behavior: An Empirical Study Based on the Norm Activation Model. Waste Manag. 2019, 87, 33–42. [Google Scholar] [CrossRef]
- Xu, D.Y.; Lin, Z.Y.; Gordon, M.P.R.; Robinson, N.K.L.; Harder, M.K. Perceived Key Elements of a Successful Residential Food Waste Sorting Program in Urban Apartments: Stakeholder Views. J. Clean. Prod. 2016, 134, 362–370. [Google Scholar] [CrossRef]
- Yuan, Y.; Nomura, H.; Takahashi, Y.; Yabe, M. Model of Chinese Household Kitchen Waste Separation Behavior: A Case Study in Beijing City. Sustainability 2016, 8, 1083. [Google Scholar] [CrossRef]
- Zhang, Y.; Wang, G.; Zhang, Q.; Ji, Y.; Xu, H. What Determines Urban Household Intention and Behavior of Solid Waste Separation? A Case Study in China. Environ. Impact Assess. Rev. 2022, 93, 106728. [Google Scholar] [CrossRef]
- Matiiuk, Y.; Liobikienė, G. The Impact of Informational, Social, Convenience and Financial Tools on Waste Sorting Behavior: Assumptions and Reflections of the Real Situation. J. Environ. Manag. 2021, 297, 113323. [Google Scholar] [CrossRef] [PubMed]
- Zelenika, I.; Moreau, T.; Zhao, J. Toward Zero Waste Events: Reducing Contamination in Waste Streams with Volunteer Assistance. Waste Manag. 2018, 76, 39–45. [Google Scholar] [CrossRef] [PubMed]
- Zhang, H.; Liu, J.; Wen, Z.; Chen, Y.-X. College Students’ Municipal Solid Waste Source Separation Behavior and Its Influential Factors: A Case Study in Beijing, China. J. Clean. Prod. 2017, 164, 444–454. [Google Scholar] [CrossRef]
- Bonatti, V. Taking out the Garbage: Migrant Women’s Unseen Environmental Work. Eur. J. Women’s Stud. 2018, 25, 41–55. [Google Scholar] [CrossRef]
- Budihardjo, M.A.; Humaira, N.G.; Ramadan, B.S.; Wahyuningrum, I.F.S.; Huboyo, H.S. Strategies to Reduce Greenhouse Gas Emissions from Municipal Solid Waste Management in Indonesia: The Case of Semarang City. Alex. Eng. J. 2023, 69, 771–783. [Google Scholar] [CrossRef]
- Lee, M.; Choi, H.; Koo, Y. Inconvenience Cost of Waste Disposal Behavior in South Korea. Ecol. Econ. 2017, 140, 58–65. [Google Scholar] [CrossRef]
- Nemat, B.; Razzaghi, M.; Bolton, K.; Rousta, K. The Role of Food Packaging Design in Consumer Recycling Behavior—A Literature Review. Sustainability 2019, 11, 4350. [Google Scholar] [CrossRef]
- Rousta, K.; Bolton, K.; Lundin, M.; Dahlén, L. Quantitative Assessment of Distance to Collection Point and Improved Sorting Information on Source Separation of Household Waste. Waste Manag. 2015, 40, 22–30. [Google Scholar] [CrossRef]
- Sun, M.; Yang, X.; Huisingh, D.; Wang, R.; Wang, Y. Consumer Behavior and Perspectives Concerning Spent Household Battery Collection and Recycling in China: A Case Study. J. Clean. Prod. 2015, 107, 775–785. [Google Scholar] [CrossRef]
- Chung, S.-S.; Poon, C.-S. A Comparison of Waste-Reduction Practices and New Environmental Paradigm of Rural and Urban Chinese Citizens. J. Environ. Manag. 2001, 62, 3–19. [Google Scholar] [CrossRef] [PubMed]
- Okonta, F.N.; Mohlalifi, M. Assessment of Factors Affecting Source Recycling among Metropolitan Johannesburg Residents. Waste Manag. 2020, 105, 445–449. [Google Scholar] [CrossRef] [PubMed]
- Zhu, N. Impact of Communication Appeals on Recycling Behaviors among Undergraduate Students. Ph.D. Thesis, Purdue University, West Lafayette, IN, USA, 2016. [Google Scholar]
- Wang, S.; Wang, J.; Yang, S.; Li, J.; Zhou, K. From Intention to Behavior: Comprehending Residents’ Waste Sorting Intention and Behavior Formation Process. Waste Manag. 2020, 113, 41–50. [Google Scholar] [CrossRef] [PubMed]
- Eghbali, H.; Arkat, J.; Tavakkoli-Moghaddam, R. Sustainable Supply Chain Network Design for Municipal Solid Waste Management: A Case Study. J. Clean. Prod. 2022, 381, 135211. [Google Scholar] [CrossRef]
- Hellwig, C.; Häggblom-Kronlöf, G.; Bolton, K.; Rousta, K. Household Waste Sorting and Engagement in Everyday Life Occupations After Migration—A Scoping Review. Sustainability 2019, 11, 4701. [Google Scholar] [CrossRef]
- Bakshi, G. Taiwan Has One of the World’s Most Efficient Recycling Systems. Global Citizen. Available online: https://www.globalcitizen.org/en/content/taiwan-musical-garbage-trucks-recycling/ (accessed on 12 April 2025).
- Liu, C.; Jing, Q.; Cong, J.; Zhang, W. How Do Integrity Level and Economic Punishment Affect Residents’ Willingness and Behavior to Separate Household Waste? New Evidence from 1293 Questionnaires in Jinan. J. Clean. Prod. 2022, 365, 132713. [Google Scholar] [CrossRef]
- Harring, N.; Jagers, S.C.; Nilsson, F. Recycling as a Large-Scale Collective Action Dilemma: A Cross-Country Study on Trust and Reported Recycling Behavior. Resour. Conserv. Recycl. 2019, 140, 85–90. [Google Scholar] [CrossRef]
- Southerton, D.; McMeekin, A.; Evans, D. International Review of Behaviour Change Initiatives: Climate Change Behaviours Research Programme; Scottish Government Social Research: Edinburgh, Scotland, 2011. [Google Scholar]
- DiGiacomo, A.; Wu, D.W.-L.; Lenkic, P.; Fraser, B.; Zhao, J.; Kingstone, A. Convenience Improves Composting and Recycling Rates in High-Density Residential Buildings. J. Environ. Plan. Manag. 2018, 61, 309–331. [Google Scholar] [CrossRef]
- Mamady, K. Factors Influencing Attitude, Safety Behavior, and Knowledge Regarding Household Waste Management in Guinea: A Cross-Sectional Study. J. Environ. Public Health 2016, 2016, 1–9. [Google Scholar] [CrossRef]
- Sheau-Ting, L.; Sin-Yee, T.; Weng-Wai, C. Preferred Attributes of Waste Separation Behaviour: An Empirical Study. Procedia Eng. 2016, 145, 738–745. [Google Scholar] [CrossRef]
- Viljoen, J.M.M.; Schenck, C.J.; Blaauw, P.F. The Role and Linkages of Buy-Back Centres in the Recycling Industry: Pretoria and Bloemfontein (South Africa). Acta Commer. 2012, 12, 1–12. [Google Scholar] [CrossRef]
- Ekmekçioğlu, M.; Kaya, T.; Kahraman, C. Fuzzy Multicriteria Disposal Method and Site Selection for Municipal Solid Waste. Waste Manag. 2010, 30, 1729–1736. [Google Scholar] [CrossRef] [PubMed]
- Moeinaddini, M.; Khorasani, N.; Danehkar, A.; Darvishsefat, A.A.; Zienalyan, M. Siting MSW Landfill Using Weighted Linear Combination and Analytical Hierarchy Process (AHP) Methodology in GIS Environment (Case Study: Karaj). Waste Manag. 2010, 30, 912–920. [Google Scholar] [CrossRef]
- Shahrasbi, A.; Shokouhyar, S.; Zeidyahyaee, N. Consumers’ Behavior towards Electronic Wastes from a Sustainable Development Point of View: An Exploration of Differences between Developed and Developing Countries. Sustain. Prod. Consum. 2021, 28, 1736–1756. [Google Scholar] [CrossRef]
- Soltani, A.; Hewage, K.; Reza, B.; Sadiq, R. Multiple Stakeholders in Multi-Criteria Decision-Making in the Context of Municipal Solid Waste Management: A Review. Waste Manag. 2015, 35, 318–328. [Google Scholar] [CrossRef]
- Saaty, R.W. The Analytic Hierarchy Process—What It Is and How It Is Used. Math. Model. 1987, 9, 161–176. [Google Scholar] [CrossRef]
- McGinnis, H.A.; Wright, A.W. Adoption and Child Health and Psychosocial Well-Being. In Encyclopedia of Child and Adolescent Health; Elsevier: Amsterdam, The Netherlands, 2023; pp. 582–598. [Google Scholar] [CrossRef]
- De Mol, J.; Lemmens, G.; Kuczynski, L. Intergenerational Transmission in a Bidirectional Context. Psychol. Belg. 2013, 53, 7. [Google Scholar] [CrossRef]
- Bianchi, S.M.; Milkie, M.A.; Sayer, L.C.; Robinson, J.P. Is Anyone Doing the Housework? Trends in the Gender Division of Household Labor. Soc. Forces 2000, 79, 191. [Google Scholar] [CrossRef]
- Afroz, R.; Hanaki, K.; Tuddin, R.; Ayup, K. A Survey of Recycling Behaviour in Households in Dhaka, Bangladesh. Waste Manag. Res. 2010, 28, 552–560. [Google Scholar] [CrossRef]
- Rhein, S.; Sträter, K.F. Intended and Unintended Effects of Statutory Deposit Return Schemes for Single-Use Plastic Bottles: Lessons Learned from the German Experience. GAIA Ecol. Perspect. Sci. Soc. 2021, 30, 250–256. [Google Scholar] [CrossRef]
- New Taipei City Government. [SDG 12] Environmental Protection and Novel Technology: Smart Recycling Machines. Available online: https://sdgs.ntpc.gov.tw/en/home.jsp?id=3d145d2a095e211d&act=be4f48068b2b0031&dataserno=6ff571c5aa19eb1621fe0698ec4a01ad (accessed on 12 April 2025).
- EPA. Science Fair Fun: Designing Environmental Science Projects. United States Environmental Protection Agency. Available online: https://www.epa.gov/students/science-fair-fun-designing-environmental-science-projects (accessed on 12 April 2025).
- UN. Osaki Recycling System of Japan (Separation-Collection-Processing) Achieved 83.4% Recycling Rate with 27 Items Separation by Community and Makes Not Only Environmental But Also Economical and Social Outcomes. United Nations Department of Economic and Social Affairs. Available online: https://sdgs.un.org/partnerships/osaki-recycling-system-japan-separation-collection-processing-achieved-834-recycling (accessed on 12 April 2025).
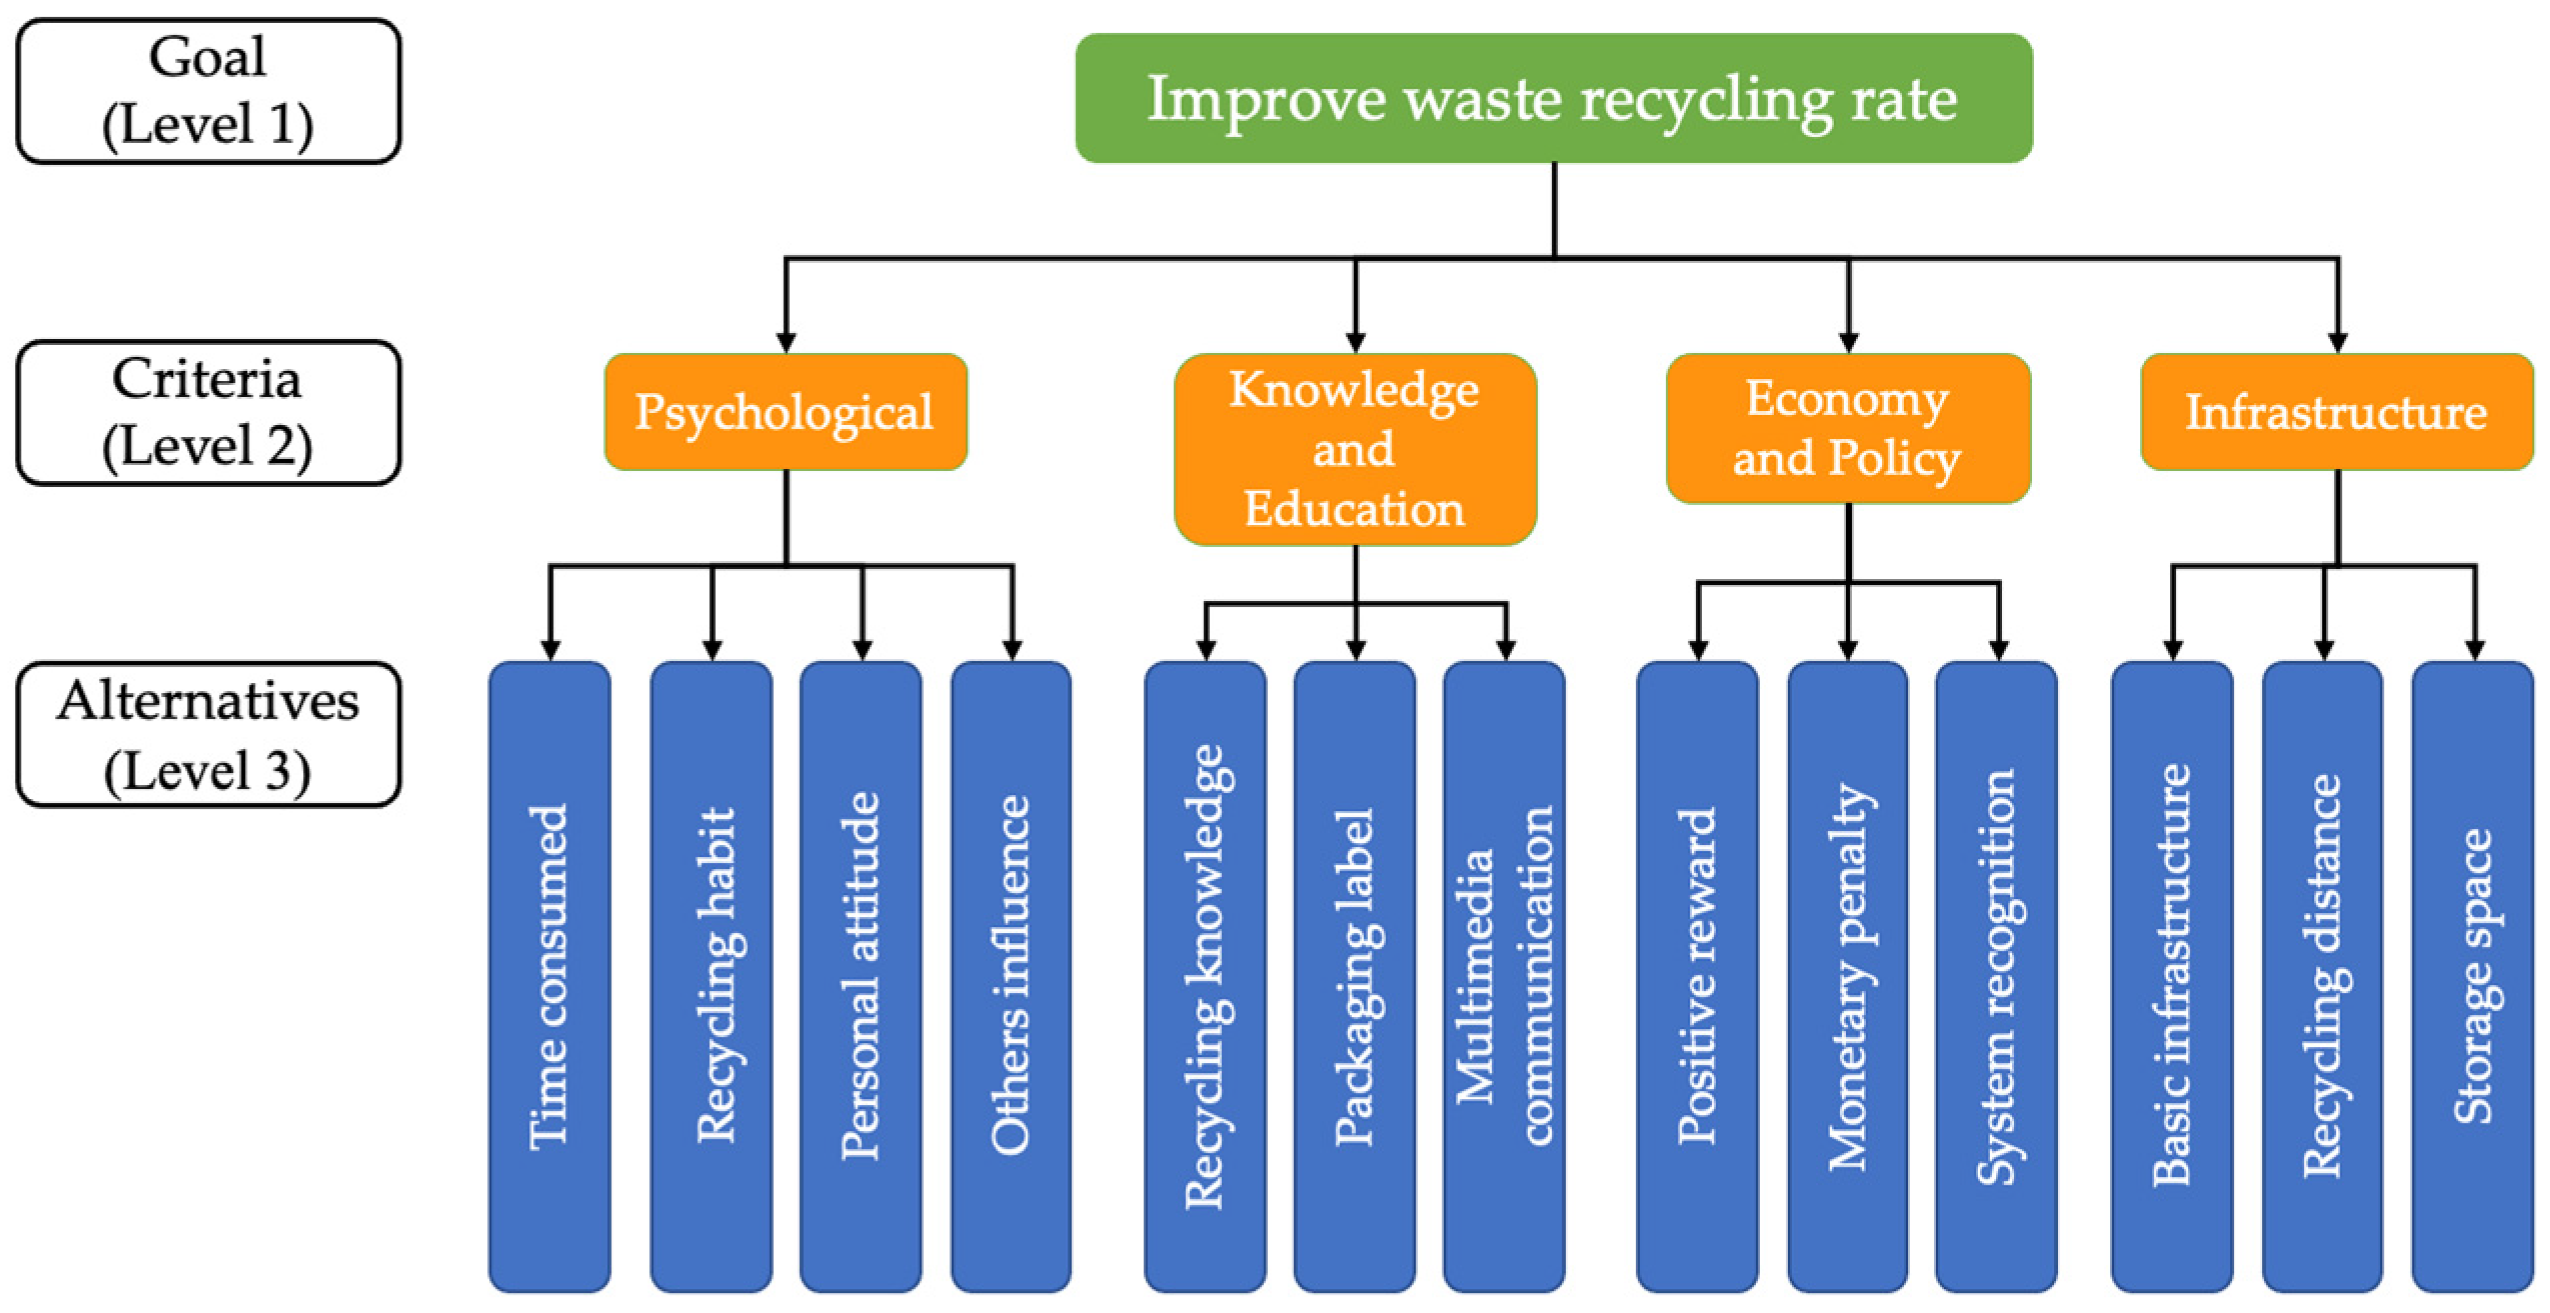
| Dimensions | Indicators | Definition | Reference Number |
|---|---|---|---|
| Psychological | (1) Time consumed | Effort and time required to clean and sort recyclable items | [9,12,13,20,22,23,24,25,26,27,28,29,30,31,32,33,34,35] |
| (2) Recycling habit | A mode of automatically recycling and sorting waste | [9,12,13,22,23,28,29,30,32,33,34,36,37,38,39] | |
| (3) Personal attitude | Have positive attitude and responsibility for waste classification | [9,13,26,27,29,30,32,33,34,36,40,41,42,43,44,45,46] | |
| (4) Other influences | Change own behaviour patterns due to other people influences | [9,13,22,27,30,32,33,34,35,37,43,44,47,48,49] | |
| Knowledge and education | (5) Recycling knowledge | Ability to identify and classify recyclable items | [8,11,12,13,15,17,19,21,25,26,29,33,39,41,42,43,44,45] |
| (6) Packaging labels | Complex packaging with single label affects recycling | [9,12,13,23,27,28,29,33,36,39,47,50,51,52,53,54,55] | |
| (7) Multimedia communication | Raise awareness on recycling through multimedia | [9,13,14,24,25,33,43,44,47,48,49,55,56,57,58] | |
| Economy and policy | (8) Positive rewards | Rewards like money, prizes, vouchers, discount coupons, etc. | [8,10,11,12,16,21,26,28,33,35,38,39,44,50,51,52,53,54,55,57,59] |
| (9) Monetary penalties | Penalties like taxes, fines, etc. | [9,32,33,36,43,56,60,61,62,63] | |
| (10) System recognition | Recognition of local authority recycling system | [9,14,24,27,33,35,36,40,43,44,46,51,61,64] | |
| Infrastructure | (11) Basic infrastructure | Adequacy of recycling bins and recycling stations | [8,11,15,16,17,19,20,21,23,25,26,28,33,36,38,39,41,47,48,50,52,53,55,59,61] |
| (12) Recycling distance | Distance to the nearest recycling facility | [9,12,21,23,27,28,29,33,57,61,65,66,67,68,69] | |
| (13) Storage space | Extra spaces for temporary storage of recycling items | [9,12,23,26,27,28,29,31,33,35,47,61,66] |
| Evaluation Scale | Definition | Explanation |
|---|---|---|
| 1 | Equal Importance | The importance of two factors and degree of influence is equally strong |
| 3 | Moderate Importance | The importance slightly inclined to a certain factor and the degree of influence is slightly stronger |
| 5 | Essential Importance | The importance strongly inclined to a certain factor and the degree of influence is strong |
| 7 | Very Strong Importance | The importance very strongly inclined to a certain factor and the degree of influence is very strong |
| 9 | Absolute Importance | The importance must be absolute to a certain factor and the degree of influence is extremely strong |
| 2, 4, 6, 8 | Intermediate values between two adjacent judgements | Use when compromise is needed |
| Dimensions | Weightage (A) | Indicators | Weightage (B) | Overall Weightage (A × B) |
|---|---|---|---|---|
| Psychological | 0.256 | Time consumed | 0.212 | 0.053 |
| Recycling habit | 0.335 | 0.084 | ||
| Personal attitude | 0.293 | 0.073 | ||
| Others influence | 0.159 | 0.040 | ||
| Knowledge and Education | 0.218 | Recycling knowledge | 0.472 | 0.118 |
| Packaging label | 0.282 | 0.071 | ||
| Multimedia communication | 0.245 | 0.061 | ||
| Economy and Policy | 0.251 | Positive reward | 0.480 | 0.120 |
| Monetary penalty | 0.280 | 0.070 | ||
| System recognition | 0.240 | 0.060 | ||
| Infrastructure | 0.275 | Basic infrastructure | 0.450 | 0.113 |
| Recycling distance | 0.320 | 0.080 | ||
| Storage space | 0.230 | 0.057 |
| Dimensions | Performance Indicators | Male | Female |
|---|---|---|---|
| Psychological | Time consumed | 0.058 | 0.049 |
| Recycling habit | 0.084 | 0.083 | |
| Personal attitude | 0.069 | 0.078 | |
| Others influence | 0.039 | 0.040 | |
| Knowledge and Education | Recycling knowledge | 0.119 | 0.117 |
| Packaging label | 0.071 | 0.071 | |
| Multimedia communication | 0.060 | 0.062 | |
| Economy and Policy | Positive reward | 0.131 | 0.109 |
| Monetary penalty | 0.064 | 0.076 | |
| System recognition | 0.055 | 0.065 | |
| Infrastructure | Basic infrastructure | 0.126 | 0.100 |
| Recycling distance | 0.072 | 0.088 | |
| Storage space | 0.052 | 0.062 |
| Dimensions | Performance Indicators | Age Group (Years Old) | ||||
|---|---|---|---|---|---|---|
| 21–30 | 31–40 | 41–50 | 51–60 | Above 60 | ||
| Psychological | Time consumed | 0.043 | 0.048 | 0.071 | 0.042 | 0.092 |
| Recycling habit | 0.084 | 0.085 | 0.086 | 0.082 | 0.081 | |
| Personal attitude | 0.077 | 0.075 | 0.065 | 0.085 | 0.046 | |
| Others influence | 0.046 | 0.042 | 0.028 | 0.041 | 0.031 | |
| Knowledge and Education | Recycling knowledge | 0.115 | 0.130 | 0.134 | 0.107 | 0.097 |
| Packaging label | 0.075 | 0.061 | 0.063 | 0.078 | 0.075 | |
| Multimedia communication | 0.060 | 0.059 | 0.052 | 0.065 | 0.078 | |
| Economy and Policy | Positive reward | 0.117 | 0.108 | 0.143 | 0.117 | 0.129 |
| Monetary penalty | 0.068 | 0.079 | 0.065 | 0.061 | 0.077 | |
| System recognition | 0.065 | 0.063 | 0.042 | 0.071 | 0.044 | |
| Infrastructure | Basic infrastructure | 0.127 | 0.097 | 0.113 | 0.116 | 0.101 |
| Recycling distance | 0.075 | 0.088 | 0.080 | 0.069 | 0.098 | |
| Storage space | 0.048 | 0.065 | 0.057 | 0.065 | 0.051 | |
| Dimensions | Performance Indicators | Income Level (TWD) | ||||
|---|---|---|---|---|---|---|
| No Income | Below 20,000 | 20,000–39,999 | 40,000–59,999 | Above 60,000 | ||
| Psychological | Time consumed | 0.067 | 0.067 | 0.041 | 0.060 | 0.054 |
| Recycling habit | 0.081 | 0.081 | 0.085 | 0.076 | 0.091 | |
| Personal attitude | 0.054 | 0.055 | 0.081 | 0.074 | 0.075 | |
| Others influence | 0.048 | 0.047 | 0.043 | 0.039 | 0.031 | |
| Knowledge and Education | Recycling knowledge | 0.076 | 0.110 | 0.117 | 0.122 | 0.133 |
| Packaging label | 0.067 | 0.065 | 0.069 | 0.079 | 0.069 | |
| Multimedia communication | 0.107 | 0.075 | 0.064 | 0.049 | 0.048 | |
| Economy and Policy | Positive reward | 0.098 | 0.132 | 0.124 | 0.123 | 0.115 |
| Monetary penalty | 0.097 | 0.073 | 0.060 | 0.068 | 0.074 | |
| System recognition | 0.055 | 0.046 | 0.066 | 0.058 | 0.061 | |
| Infrastructure | Basic infrastructure | 0.094 | 0.122 | 0.111 | 0.120 | 0.112 |
| Recycling distance | 0.101 | 0.081 | 0.079 | 0.067 | 0.085 | |
| Storage space | 0.055 | 0.047 | 0.059 | 0.063 | 0.054 | |
| Dimensions | Performance Indicators | Education Level | ||
|---|---|---|---|---|
| Secondary Education | Diploma/Bachelor Degree | Postgraduate Degree | ||
| Psychological | Time consumed | 0.054 | 0.049 | 0.058 |
| Recycling habit | 0.088 | 0.080 | 0.086 | |
| Personal attitude | 0.069 | 0.080 | 0.069 | |
| Others influence | 0.038 | 0.041 | 0.037 | |
| Knowledge and Education | Recycling knowledge | 0.109 | 0.122 | 0.128 |
| Packaging label | 0.075 | 0.069 | 0.063 | |
| Multimedia communication | 0.066 | 0.060 | 0.059 | |
| Economy and Policy | Positive reward | 0.127 | 0.125 | 0.100 |
| Monetary penalty | 0.061 | 0.070 | 0.086 | |
| System recognition | 0.061 | 0.056 | 0.065 | |
| Infrastructure | Basic infrastructure | 0.109 | 0.112 | 0.121 |
| Recycling distance | 0.082 | 0.076 | 0.081 | |
| Storage space | 0.059 | 0.062 | 0.048 | |
| Dimensions | Performance Indicators | Family Influence | Without Family Influence | ||
|---|---|---|---|---|---|
| Recycle | Do Not Recycle | Recycle | Do Not Recycle | ||
| Psychological | Time consumed | 0.045 | 0.058 | 0.074 | 0.073 |
| Recycling habit | 0.086 | 0.083 | 0.082 | 0.060 | |
| Personal attitude | 0.081 | 0.071 | 0.054 | 0.046 | |
| Others influence | 0.039 | 0.038 | 0.040 | 0.072 | |
| Knowledge and Education | Recycling knowledge | 0.114 | 0.130 | 0.106 | 0.103 |
| Packaging label | 0.074 | 0.070 | 0.053 | 0.070 | |
| Multimedia communication | 0.062 | 0.050 | 0.090 | 0.076 | |
| Economy and Policy | Positive reward | 0.120 | 0.114 | 0.127 | 0.156 |
| Monetary penalty | 0.067 | 0.071 | 0.082 | 0.064 | |
| System recognition | 0.063 | 0.065 | 0.042 | 0.030 | |
| Infrastructure | Basic infrastructure | 0.114 | 0.104 | 0.118 | 0.158 |
| Recycling distance | 0.079 | 0.085 | 0.081 | 0.043 | |
| Storage space | 0.057 | 0.060 | 0.051 | 0.049 | |
| Time Consumed | |||||
| Age | 21–30 | 31–40 | 41–50 | 51–60 | Above 60 |
| 21–30 | 1 | 1 | 1 | 1 | 0.022004 |
| 31–40 | 1 | 1 | 1 | 1 | 0.029117 |
| 41–50 | 1 | 1 | 1 | 1 | 1 |
| 51–60 | 1 | 1 | 1 | 1 | 0.02575 |
| Above 60 | 0.022004 | 0.029117 | 1 | 0.02575 | 1 |
| Personal Attitude | |||||
| Age | 21–30 | 31–40 | 41–50 | 51–60 | Above 60 |
| 21–30 | 1 | 1 | 1 | 1 | 0.045252 |
| 31–40 | 1 | 1 | 1 | 1 | 0.115199 |
| 41–50 | 1 | 1 | 1 | 1 | 0.709448 |
| 51–60 | 1 | 1 | 1 | 1 | 0.02608 |
| Above 60 | 0.045252 | 0.115199 | 0.709448 | 0.02608 | 1 |
| Multimedia Communication | |||||
|---|---|---|---|---|---|
| Income (TWD) | No Income | Below 20,000 | 20,000–39,999 | 40,000–59,999 | Above 60,000 |
| No income | 1 | 1 | 0.215073 | 0.029925 | 0.001781 |
| Below 20,000 | 1 | 1 | 1 | 1 | 0.797636 |
| 20,000–39,999 | 0.215073 | 1 | 1 | 1 | 0.221793 |
| 40,000–59,999 | 0.029925 | 1 | 1 | 1 | 1 |
| Above 60,000 | 0.001781 | 0.797636 | 0.221793 | 1 | 1 |
Disclaimer/Publisher’s Note: The statements, opinions and data contained in all publications are solely those of the individual author(s) and contributor(s) and not of MDPI and/or the editor(s). MDPI and/or the editor(s) disclaim responsibility for any injury to people or property resulting from any ideas, methods, instructions or products referred to in the content. |
© 2025 by the authors. Licensee MDPI, Basel, Switzerland. This article is an open access article distributed under the terms and conditions of the Creative Commons Attribution (CC BY) license (https://creativecommons.org/licenses/by/4.0/).
Share and Cite
Kuo, C.-J.; Nah, X.J.; Hsu, H.-W. Enhancing Community Waste Recycling in Taiwan: Key Drivers Affecting Consumers in Waste Recycling. Sustainability 2025, 17, 5322. https://doi.org/10.3390/su17125322
Kuo C-J, Nah XJ, Hsu H-W. Enhancing Community Waste Recycling in Taiwan: Key Drivers Affecting Consumers in Waste Recycling. Sustainability. 2025; 17(12):5322. https://doi.org/10.3390/su17125322
Chicago/Turabian StyleKuo, Ching-Jung, Xiao Jin Nah, and Hsin-Wei Hsu. 2025. "Enhancing Community Waste Recycling in Taiwan: Key Drivers Affecting Consumers in Waste Recycling" Sustainability 17, no. 12: 5322. https://doi.org/10.3390/su17125322
APA StyleKuo, C.-J., Nah, X. J., & Hsu, H.-W. (2025). Enhancing Community Waste Recycling in Taiwan: Key Drivers Affecting Consumers in Waste Recycling. Sustainability, 17(12), 5322. https://doi.org/10.3390/su17125322