

Building an Agent-Based Simulation Framework of Smartphone Reuse and Recycling: Integrating Privacy Concern and Behavioral Norms


Abstract

1. Introduction
2. Methods
2.1. Overview
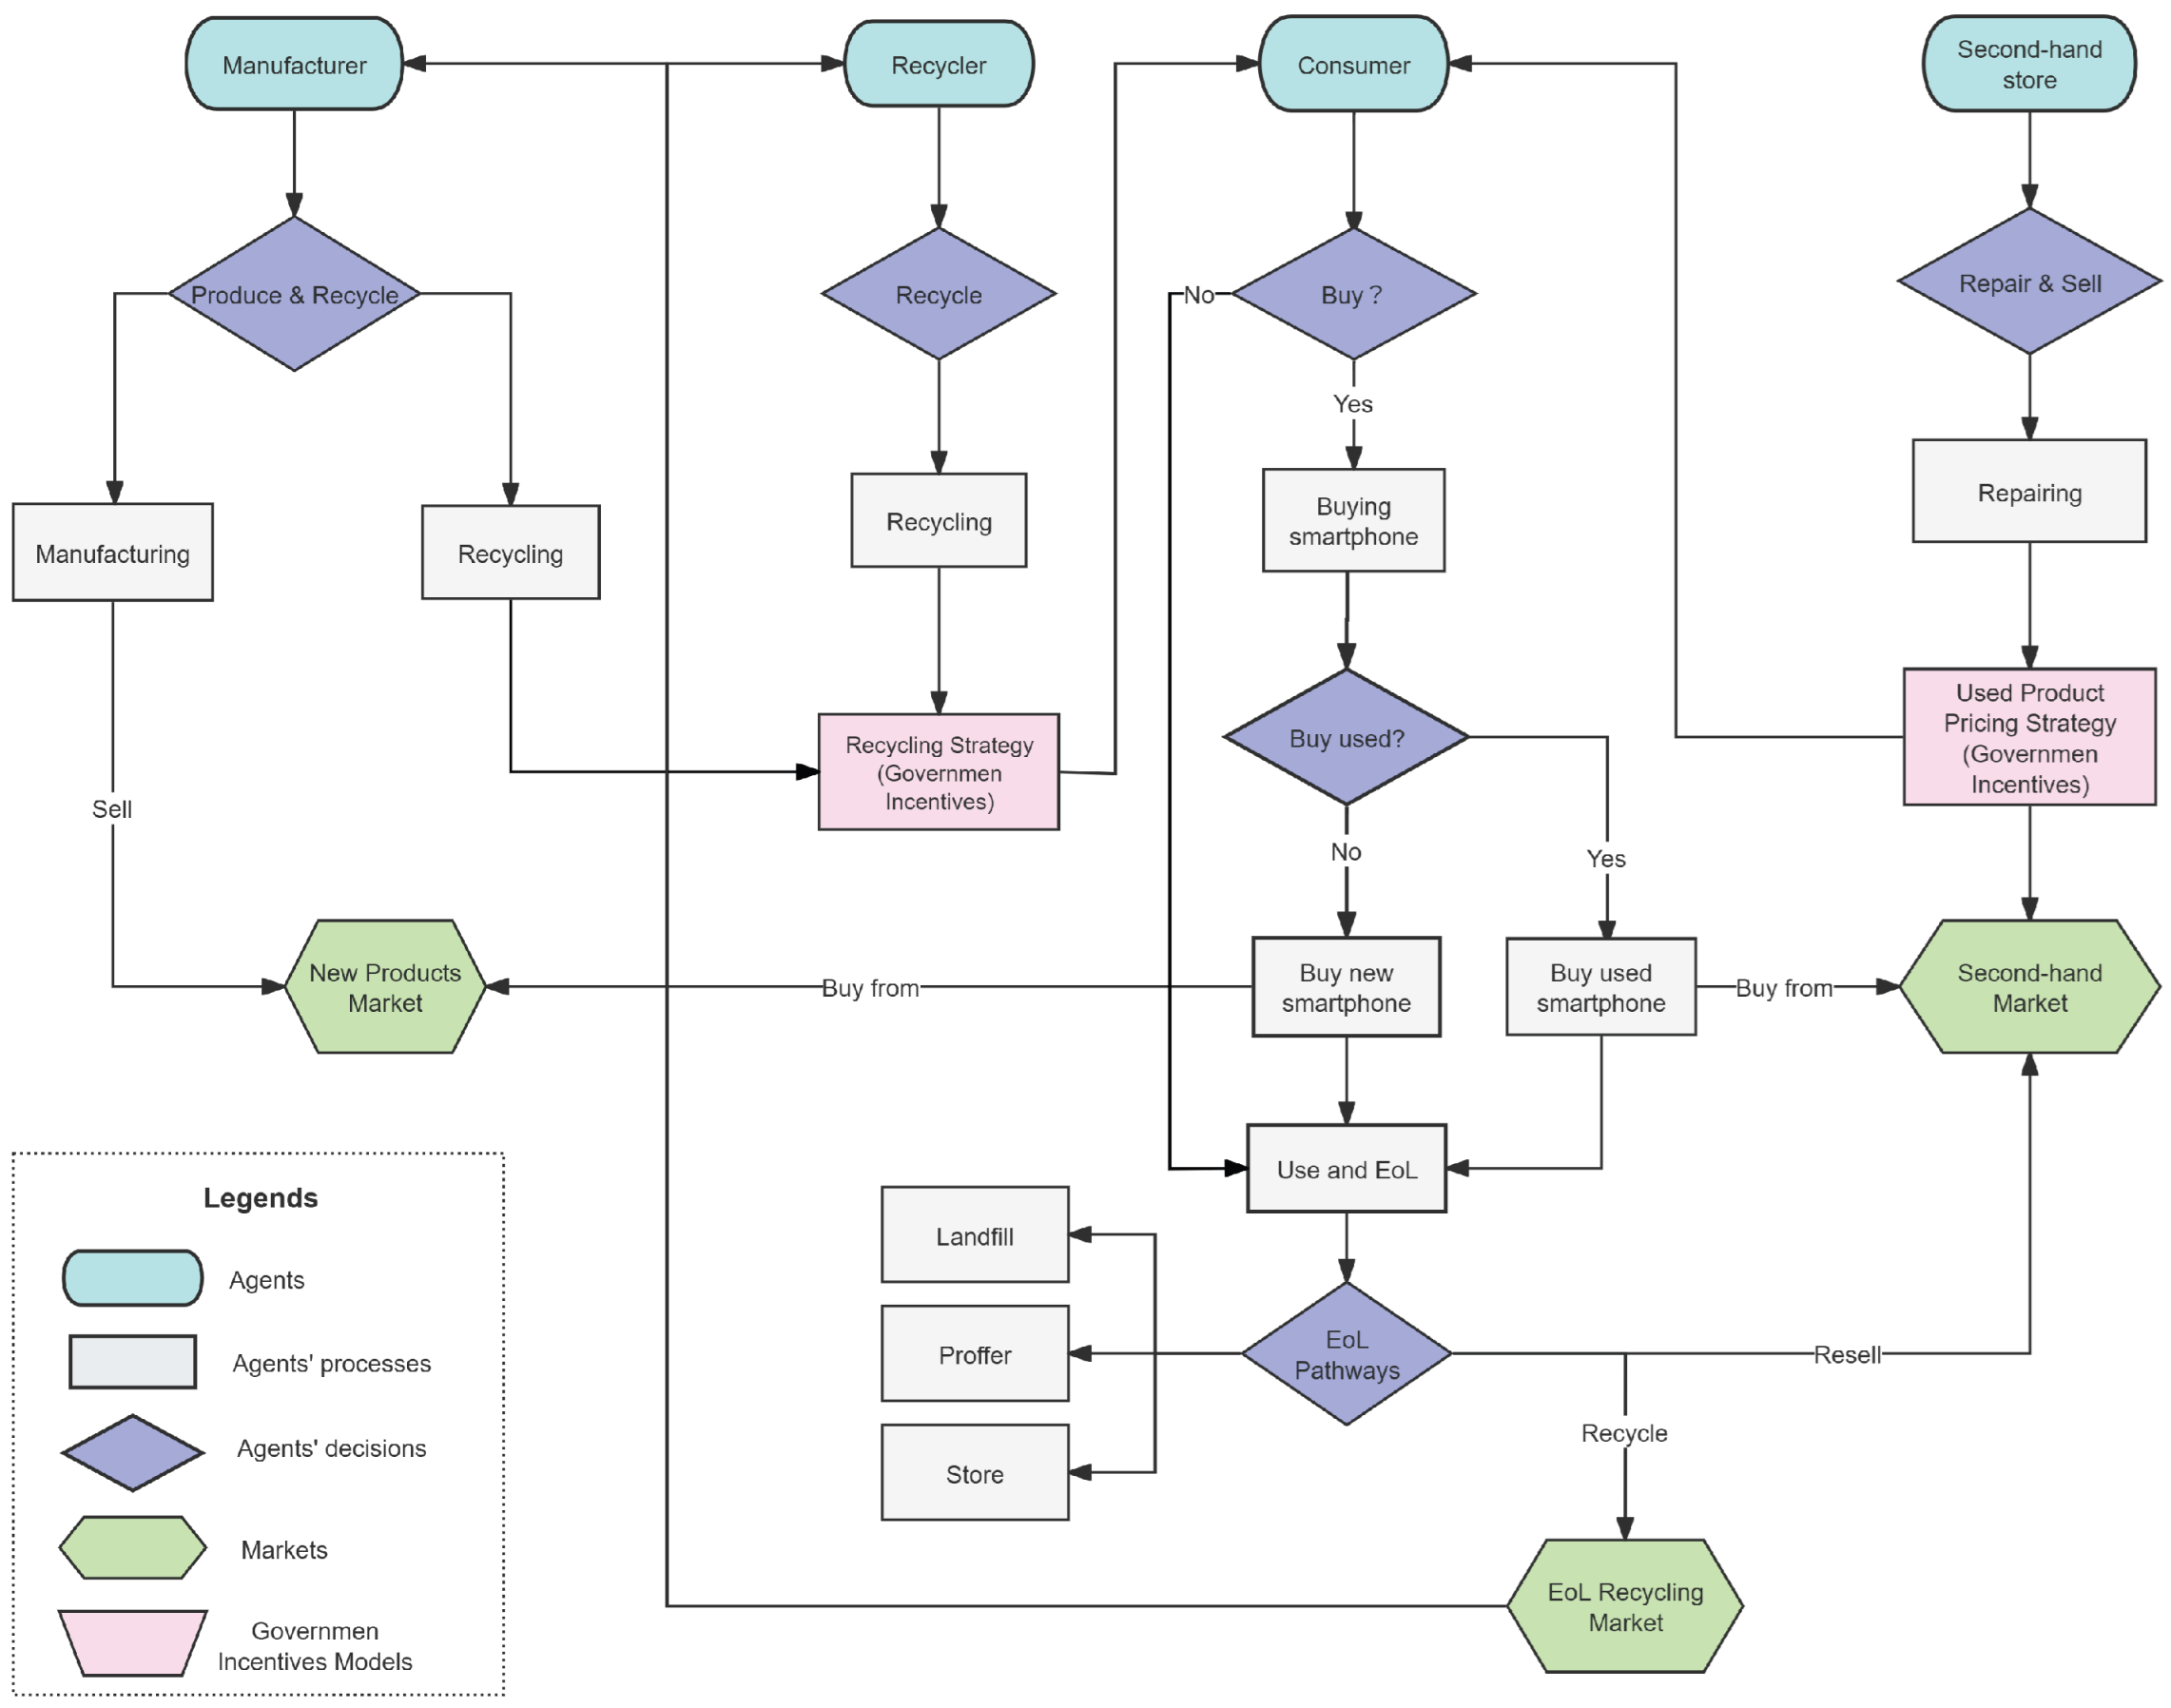
2.2. System Definition
2.3. Properties of Agents
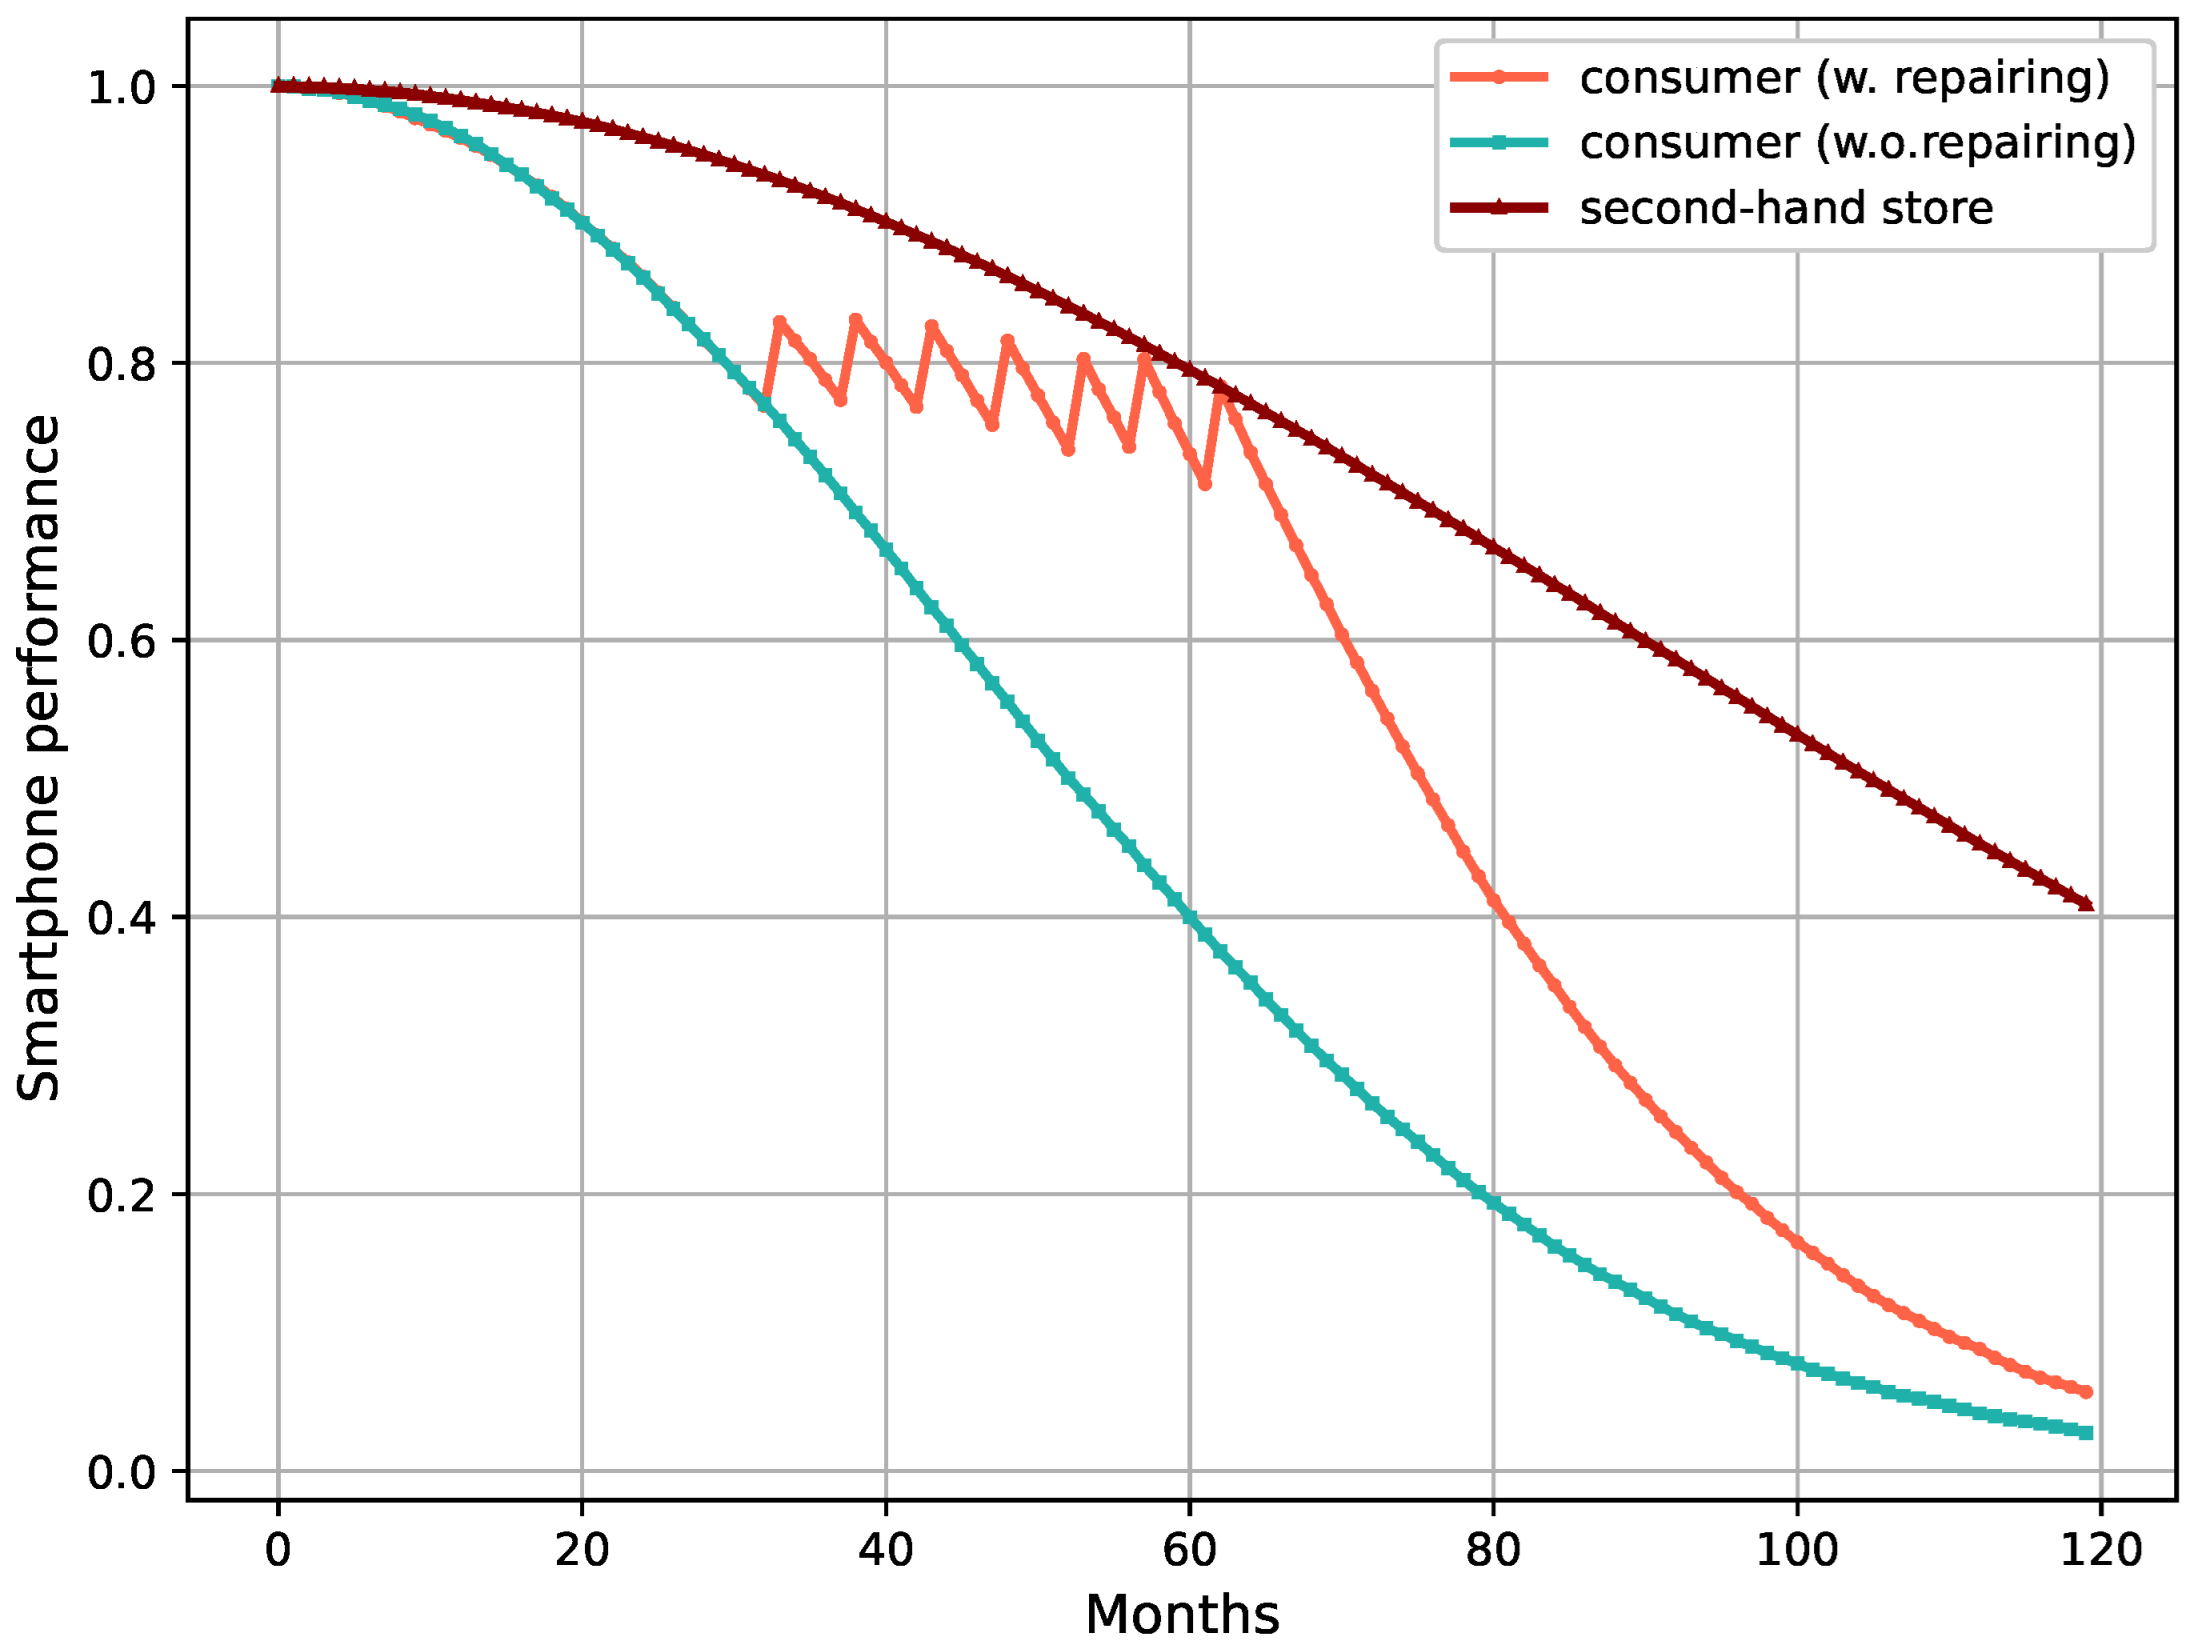
- Smartphones are represented as resource agents that undergo performance degradation and repairs over time, simulating the physical decline and maintenance typical of real-world devices.
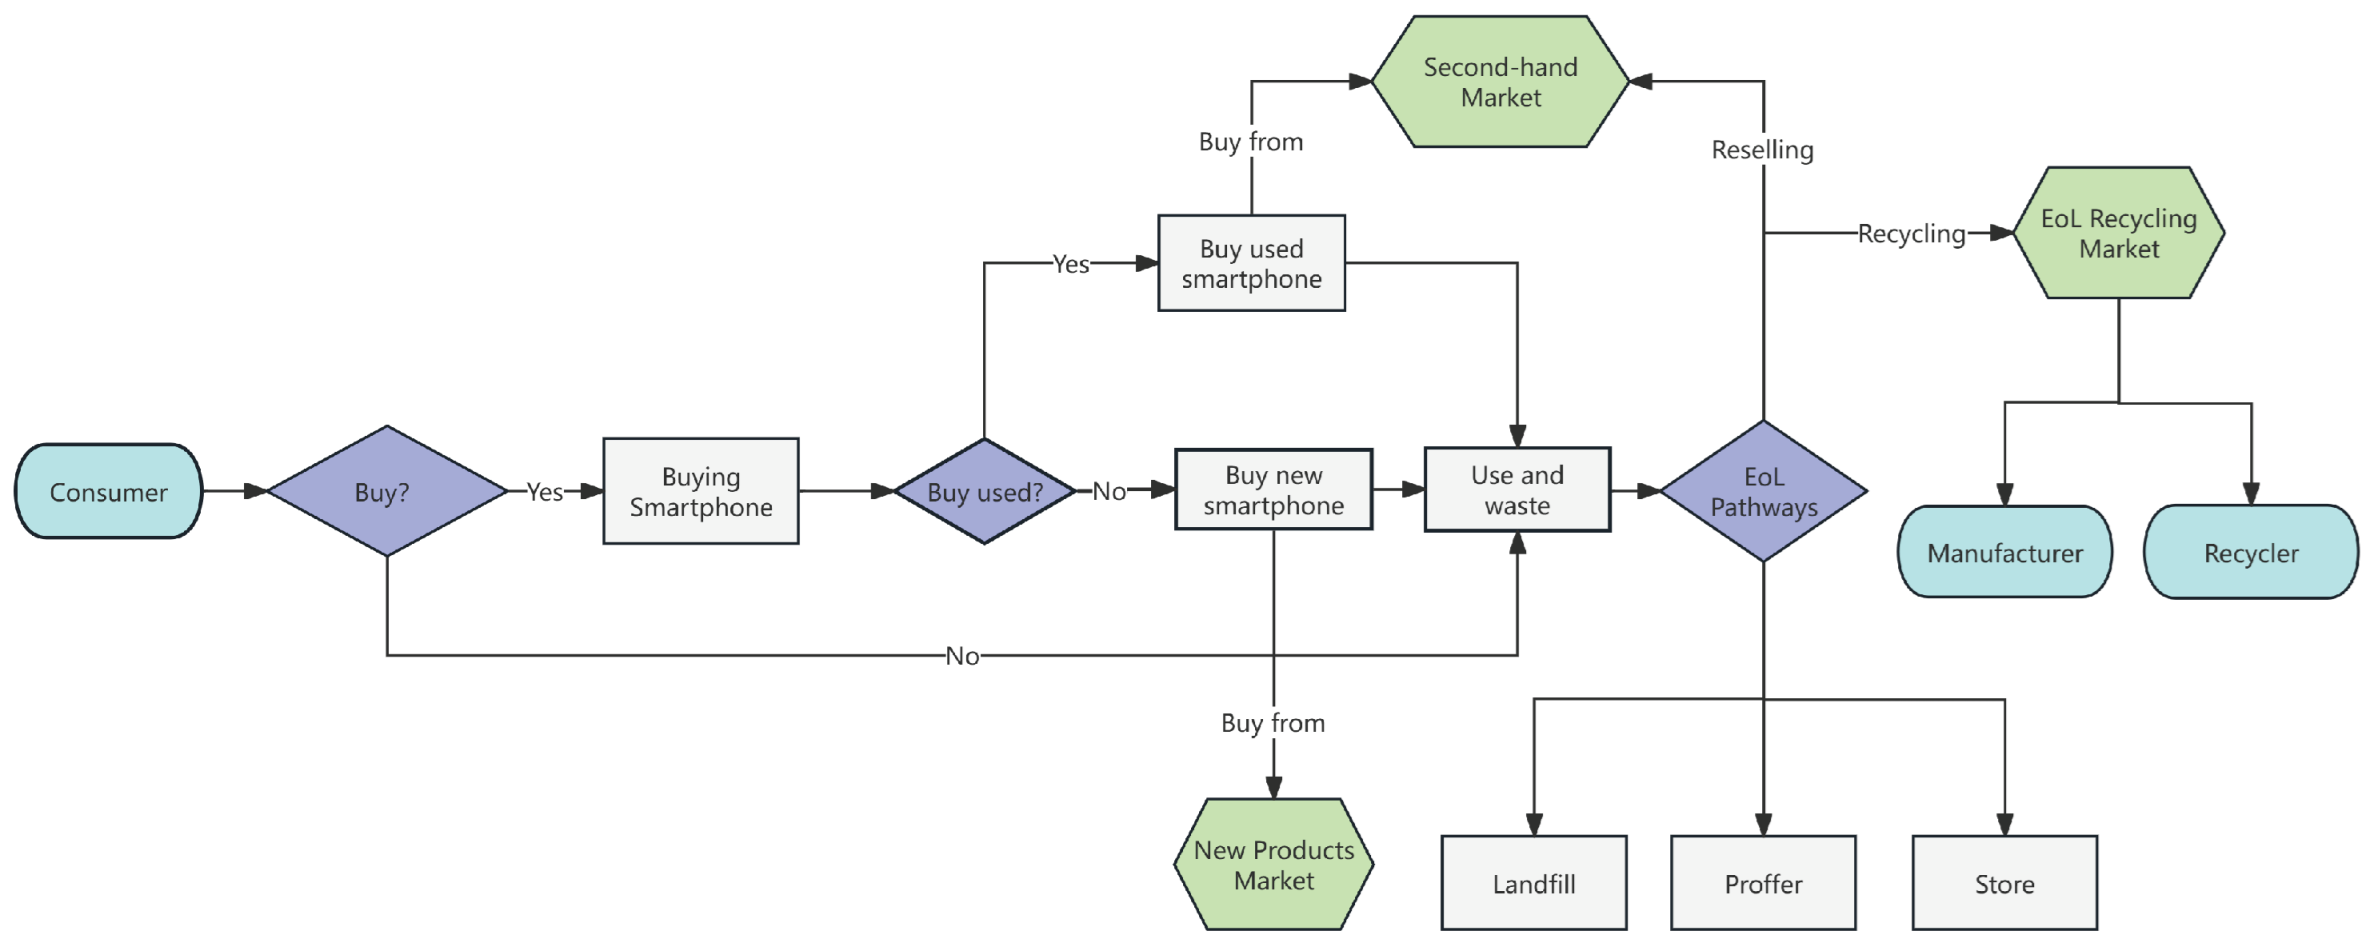
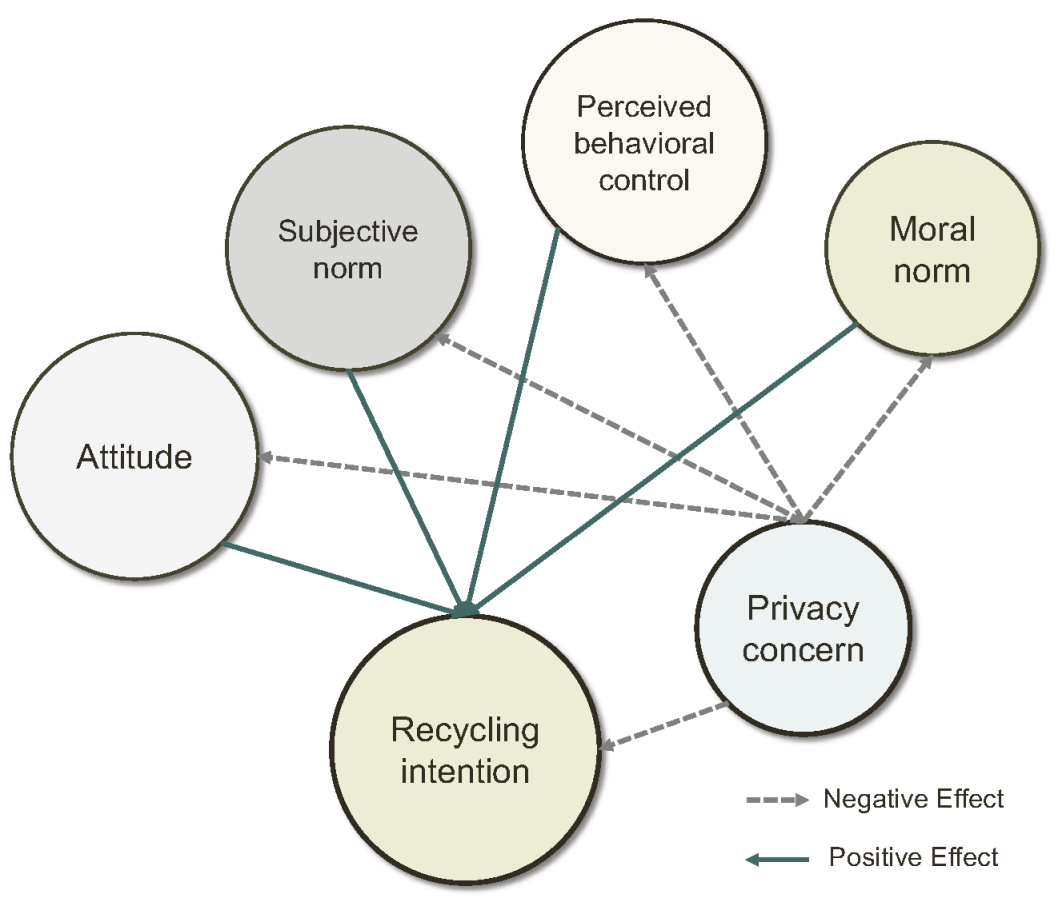
- Consumers act as decision-makers whose purchasing and end-of-life (EoL) behaviors are influenced by income, product attributes, and social norms. Their choices are modeled using utility-based frameworks and the Theory of Planned Behavior to reflect both economic and psychological drivers.
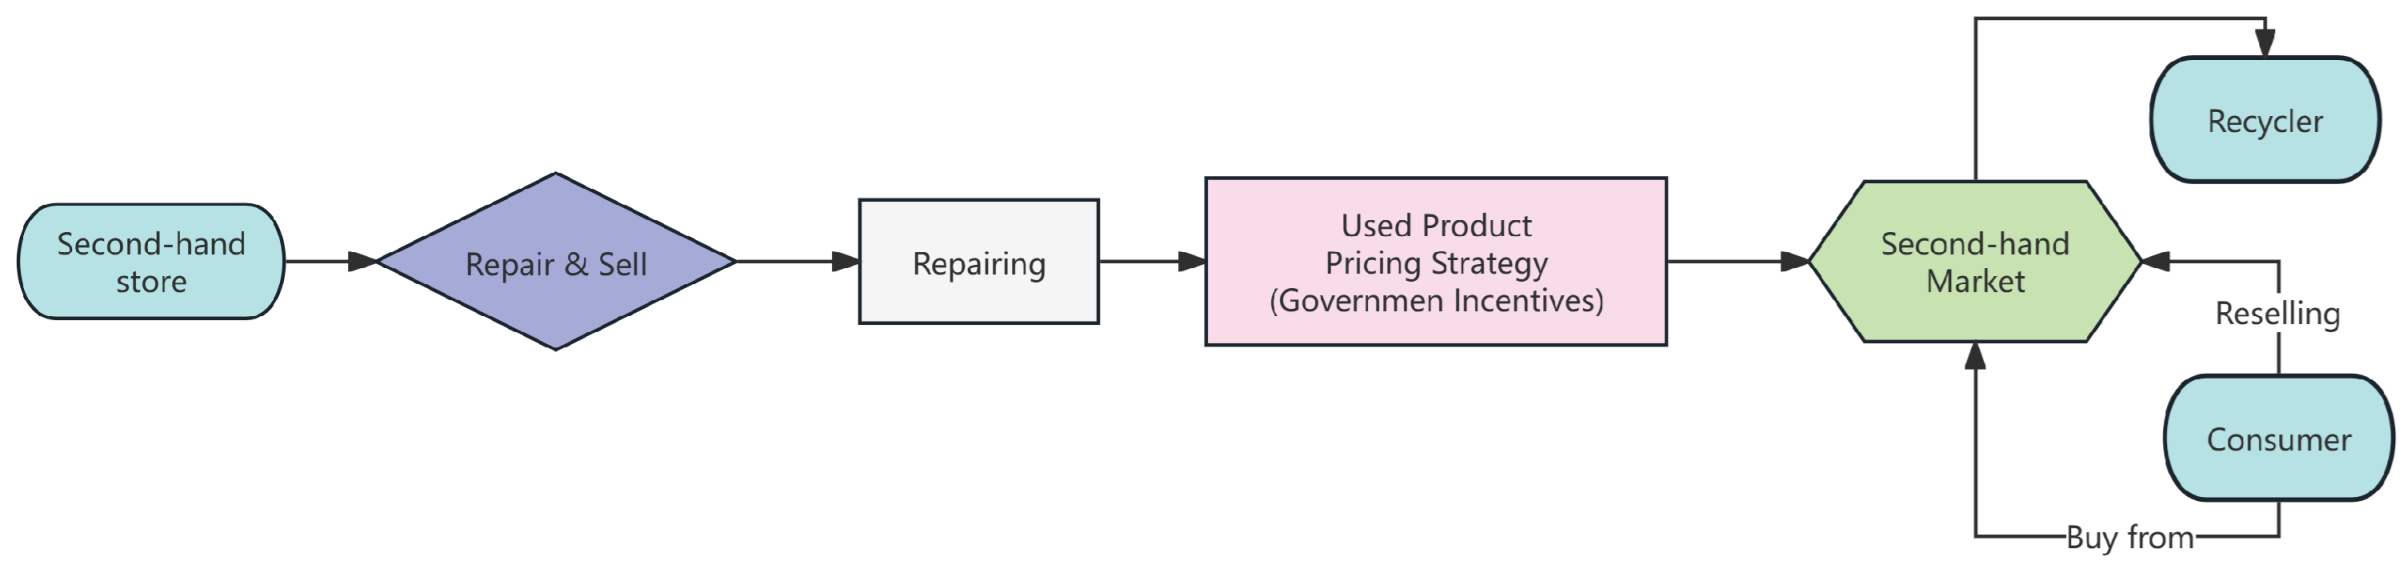
- Second-hand stores function as intermediaries that acquire, refurbish, and resell used smartphones. Their decisions are shaped by repair costs, inventory levels, and prevailing market conditions.
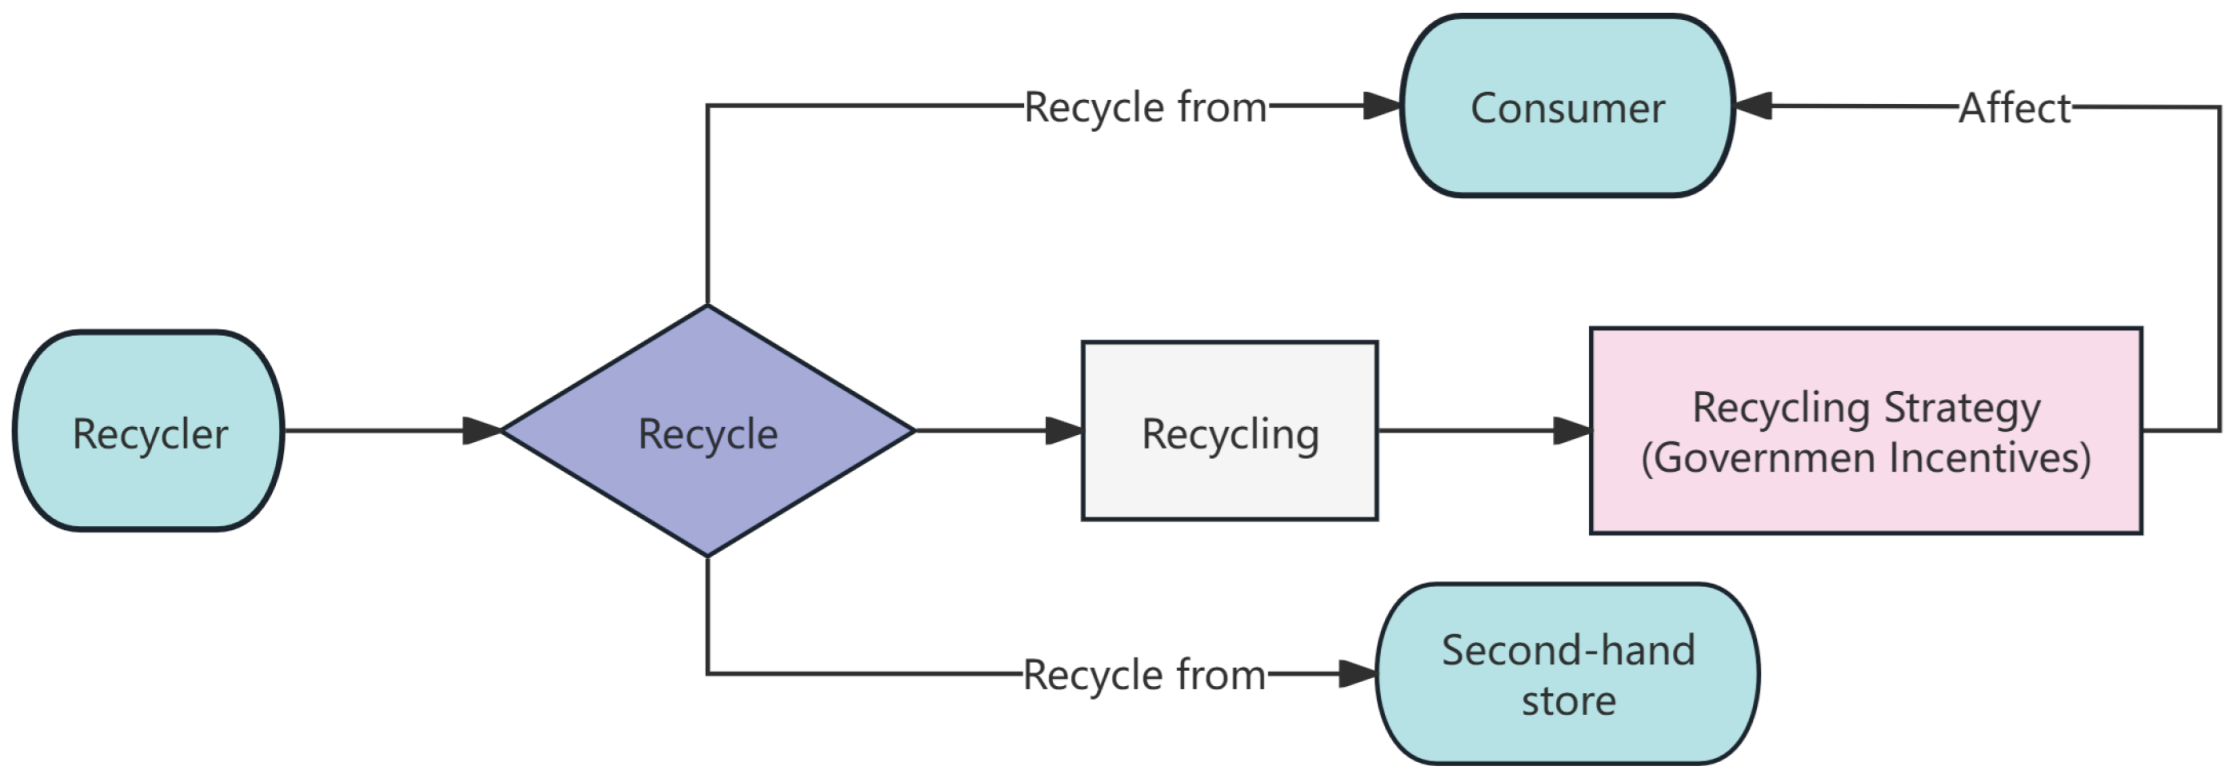
- Recyclers handle smartphones from consumers and second-hand stores, with operations guided by pricing strategies and government incentives aimed at optimizing material recovery.
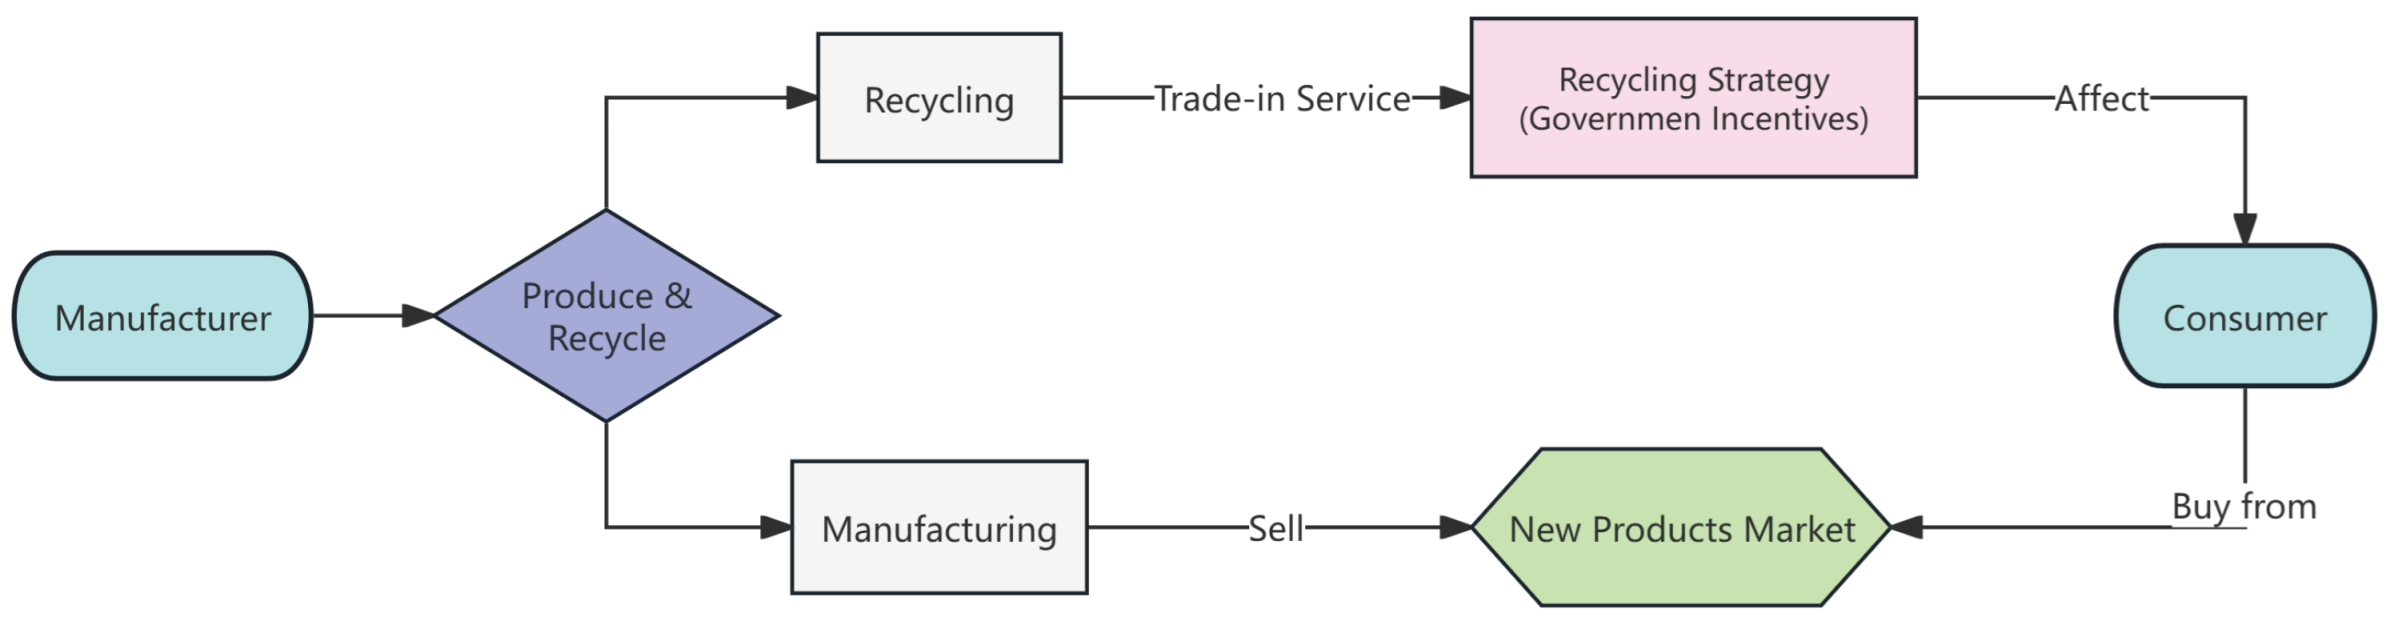
- Manufacturers are responsible for producing new smartphones and facilitating trade-in or take-back programs, thereby influencing product demand and the flow of devices into recycling channels.
2.3.1. Smartphone Agent
2.3.2. Consumer Agent
2.3.3. Second-Hand Store Agent
2.3.4. Manufacturer Agent
2.3.5. Recycler Agent
2.3.6. Government Incentive Model
2.3.7. Publicity Education Model
2.4. Experimental Settings
3. Results
3.1. Analysis of Consumer Behavior
3.2. Impact of Government Incentives
3.3. Impact of Publicity Education
3.4. Validation
4. Conclusions
Author Contributions
Funding
Institutional Review Board Statement
Informed Consent Statement
Data Availability Statement
Conflicts of Interest
References
- Sarath, P.; Bonda, S.; Mohanty, S.; Nayak, S.K. Mobile phone waste management and recycling: Views and trends. Waste Manag. 2015, 46, 536–545. [Google Scholar] [CrossRef]
- Hazelwood, D.A.; Pecht, M.G. Life extension of electronic products: A case study of smartphones. IEEE Access 2021, 9, 144726–144739. [Google Scholar] [CrossRef]
- Prabhu, N.S.; Majhi, R. Disposal of obsolete mobile phones: A review on replacement, disposal methods, in-use lifespan, reuse and recycling. Waste Manag. Res. 2023, 41, 18–36. [Google Scholar] [CrossRef] [PubMed]
- Sari, D.P.; Masruroh, N.A.; Asih, A.M.S. Eco-Efficiency Comparative Analysis of Informal and Formal Smartphone Recycling Practices Using Life Cycle Assessment. Int. J. Adv. Sci. Eng. Inf. Technol. 2023, 13, 3. [Google Scholar] [CrossRef]
- Khan, F.; Ahmed, W.; Najmi, A. Understanding consumers’ behavior intentions towards dealing with the plastic waste: Perspective of a developing country. Resour. Conserv. Recycl. 2019, 142, 49–58. [Google Scholar] [CrossRef]
- Klymenko, O.; Meisenbacher, S.; Matthes, F. Identifying practical challenges in the implementation of technical measures for data privacy compliance. arXiv 2023, arXiv:2306.15497. [Google Scholar] [CrossRef]
- Souza Piao, R.; Vincenzi, T.B.; Vazquez-Brust, D.A.; Yakovleva, N.; Bonsu, S.; Carvalho, M.M. Barriers toward circular economy transition: Exploring different stakeholders’ perspectives. Corp. Soc. Responsib. Environ. Manag. 2024, 31, 153–168. [Google Scholar] [CrossRef]
- Zhang, H.; Wen, Z. The consumption and recycling collection system of PET bottles: A case study of Beijing, China. Waste Manag. 2014, 34, 987–998. [Google Scholar] [CrossRef]
- Nash, N.; Whitmarsh, L.; Capstick, S.; Hargreaves, T.; Poortinga, W.; Thomas, G.; Sautkina, E.; Xenias, D. Climate-relevant behavioral spillover and the potential contribution of social practice theory. Wiley Interdiscip. Rev. Clim. Change 2017, 8, e481. [Google Scholar] [CrossRef]
- Seyfang, G.; Haxeltine, A. Growing grassroots innovations: Exploring the role of community-based initiatives in governing sustainable energy transitions. Environ. Plan. C Gov. Policy 2012, 30, 381–400. [Google Scholar] [CrossRef]
- Geiger, S.; Fischer, D.; Schrader, U. Measuring what matters in sustainable consumption: An integrative framework for the selection of relevant behaviors. Sustain. Dev. 2018, 26, 18–33. [Google Scholar] [CrossRef]
- Lieder, M.; Rashid, A. Towards circular economy implementation: A comprehensive review in context of manufacturing industry. J. Clean. Prod. 2016, 115, 36–51. [Google Scholar] [CrossRef]
- Terano, T. Why agent-based modeling in social system analysis. J. Stage Oukan 2010, 2, 56–62. [Google Scholar]
- Patrao, G.; Karnik, A. Identifying Drivers and Hindrances to the Disposal of Used Mobile Phones: A Study of User Behavior in the UAE. SAGE Open 2023, 13, 21582440231196757. [Google Scholar] [CrossRef]
- Pramanik, P.K.D.; Sinhababu, N.; Mukherjee, B.; Padmanaban, S.; Maity, A.; Upadhyaya, B.K.; Holm-Nielsen, J.B.; Choudhury, P. Power consumption analysis, measurement, management, and issues: A state-of-the-art review of smartphone battery and energy usage. IEEE Access 2019, 7, 182113–182172. [Google Scholar] [CrossRef]
- Xu, B.; Oudalov, A.; Ulbig, A.; Andersson, G.; Kirschen, D.S. Modeling of lithium-ion battery degradation for cell life assessment. IEEE Trans. Smart Grid 2016, 9, 1131–1140. [Google Scholar] [CrossRef]
- Rahmati, A.; Qian, A.; Zhong, L. Understanding human-battery interaction on mobile phones. In Proceedings of the 9th International Conference on Human Computer Interaction with Mobile Devices and Services, Singapore, 9–12 September 2007; pp. 265–272. [Google Scholar]
- Meng, C.; Gustafsson, B.; Knight, J. Economic Transformation and Income Distribution in China Over Three Decades; Cambridge University Press: Cambridge, UK, 2023. [Google Scholar]
- Skare, M.; Gil-Alana, L.A.; Claudio-Quiroga, G.; Pržiklas Družeta, R. Income inequality in China 1952-2017: Persistence and main determinants. Oeconomia Copernic. 2021, 12, 863–888. [Google Scholar] [CrossRef]
- Charpentier, A.; Flachaire, E. Pareto models for top incomes and wealth. J. Econ. Inequal. 2022, 20, 1–25. [Google Scholar] [CrossRef]
- Yi, X.; Jue, W.; Huan, H. Does economic development bring more livability? Evidence from Jiangsu Province, China. J. Clean. Prod. 2021, 293, 126187. [Google Scholar] [CrossRef]
- Wang, N.; Chen, Z.; Li, T.; Zhen, M. Spatiotemporal pattern evolution and influence mechanism of urban vertical expansion: A case study of Jiangsu Province, China. Land 2022, 11, 433. [Google Scholar] [CrossRef]
- Axtell, R.L.; Farmer, J.D. Agent-based modeling in economics and finance: Past, present, and future. J. Econ. Lit. 2025, 63, 197–287. [Google Scholar] [CrossRef]
- Kerr, C.C.; Stuart, R.M.; Mistry, D.; Abeysuriya, R.G.; Rosenfeld, K.; Hart, G.R.; Núñez, R.C.; Cohen, J.A.; Selvaraj, P.; Hagedorn, B.; et al. Covasim: An agent-based model of COVID-19 dynamics and interventions. PLoS Comput. Biol. 2021, 17, e1009149. [Google Scholar] [CrossRef] [PubMed]
- Ferreira, L.N.; Hong, I.; Rutherford, A.; Cebrian, M. The small-world network of global protests. Sci. Rep. 2021, 11, 19215. [Google Scholar] [CrossRef]
- Song, Y.; Li, G.; Li, T.; Li, Y. A purchase decision support model considering consumer personalization about aspirations and risk attitudes. J. Retail. Consum. Serv. 2021, 63, 102728. [Google Scholar] [CrossRef]
- Esmeli, R.; Bader-El-Den, M.; Abdullahi, H. Towards early purchase intention prediction in online session based retailing systems. Electron. Mark. 2021, 31, 697–715. [Google Scholar] [CrossRef]
- Zhang, L.; Ran, W.; Jiang, S.; Wu, H.; Yuan, Z. Understanding consumers’ behavior intention of recycling mobile phone through formal channels in China: The effect of privacy concern. Resour. Environ. Sustain. 2021, 5, 100027. [Google Scholar] [CrossRef]
- Walzberg, J.; Carpenter, A.; Heath, G. Integrating Sociotechnical Factors to Assess Efficacy of PV Recycling and Reuse Interventions. 2021. Available online: https://www.researchgate.net/publication/349068466_Integrating_sociotechnical_factors_to_assess_efficacy_of_PV_recycling_and_reuse_interventions (accessed on 11 June 2025).
- Bocken, N.M.P.; De Pauw, I.; Bakker, C.; Van Der Grinten, B. Product design and business model strategies for a circular economy. J. Ind. Prod. Eng. 2016, 33, 308–320. [Google Scholar] [CrossRef]
- Steffen, A. Second-hand consumption as a lifestyle choice. In Proceedings of the International Conference on Consumer Research, Bonn, Germany, 26–27 September 2017; pp. 189–207. [Google Scholar]
- Gobbi, C. Designing the reverse supply chain: The impact of the product residual value. Int. J. Phys. Distrib. Logist. Manag. 2011, 41, 768–796. [Google Scholar] [CrossRef]
- Shu, T.; Liao, H.; Chen, S.; Wang, S.; Lai, K.K.; Gan, L. Analysing remanufacturing decisions of supply chain members in uncertainty of consumer preferences. Appl. Econ. 2016, 48, 3208–3227. [Google Scholar] [CrossRef]
- Wangsa, I.D.; Yang, T.M.; Wee, H.M. The effect of price-dependent demand on the sustainable electrical energy supply chain. Energies 2018, 11, 1645. [Google Scholar] [CrossRef]
- Zink, T.; Maker, F.; Geyer, R.; Amirtharajah, R.; Akella, V. Comparative life cycle assessment of smartphone reuse: Repurposing vs. refurbishment. Int. J. Life Cycle Assess. 2014, 19, 1099–1109. [Google Scholar] [CrossRef]
- Atasu, A.; Guide, V., Jr.; Van Wassenhove, L. Product reuse economics in closed-loop supply chain research. Prod. Oper. Manag. 2008, 17, 483–496. [Google Scholar] [CrossRef]
- Wu, C. Product-design and pricing strategies with remanufacturing. Eur. J. Oper. Res. 2012, 222, 204–215. [Google Scholar] [CrossRef]
- Wang, H.; Gu, Y.; Li, L.; Liu, T.; Wu, Y.; Zuo, T. Operating models and development trends in the extended producer responsibility system for waste electrical and electronic equipment. Resour. Conserv. Recycl. 2017, 127, 159–167. [Google Scholar] [CrossRef]
- Hartley, K.; van Santen, R.; Kirchherr, J. Policies for transitioning towards a circular economy: Expectations from the European Union (EU). Resour. Conserv. Recycl. 2020, 155, 104634. [Google Scholar] [CrossRef]
- Rye, T.; Ison, S. The Implementation and Effectiveness of Transport Demand Management Measures: An International Perspective; Routledge: Oxfordshire, UK, 2016. [Google Scholar]
- Barr, S. Strategies for sustainability: Citizens and responsible environmental behaviour. Area 2003, 35, 227–240. [Google Scholar] [CrossRef]
- Martinez, M.; Scicchitano, M. Who listens to trash talk?: Education and public media effects on recycling behavior. Soc. Sci. Q. 1998, 79, 287–300. [Google Scholar]
- Zeng, Z.; Han, Z.; Zhou, B.; Liu, Y.; Zheng, S.; Wang, H.; Shi, D. Effect of publicity on public awareness and willingness for domestic waste management: A case study in a model village in China. J. Mater. Cycles Waste Manag. 2023, 25, 3228–3236. [Google Scholar] [CrossRef]
- Ma, H.; Chen, W.; Ma, H.; Yang, H. Influence of publicity and education and environmental values on the green consumption behavior of urban residents in Tibet. Int. J. Environ. Res. Public Health 2021, 18, 10808. [Google Scholar] [CrossRef] [PubMed]
- Liu, J.; Bai, H.; Zhang, Q.; Jing, Q.; Xu, H. Why are obsolete mobile phones difficult to recycle in China? Resour. Conserv. Recycl. 2019, 141, 200–210. [Google Scholar] [CrossRef]
- Ylä-Mella, J.; Keiski, R.L.; Pongrácz, E. Electronic waste recovery in Finland: Consumers’ perceptions towards recycling and re-use of mobile phones. Waste Manag. 2015, 45, 374–384. [Google Scholar] [CrossRef] [PubMed]
- Wieser, H.; Tröger, N. Exploring the inner loops of the circular economy: Replacement, repair, and reuse of mobile phones in Austria. J. Clean. Prod. 2018, 172, 3042–3055. [Google Scholar] [CrossRef]
- Yin, J.; Gao, Y.; Xu, H. Survey and analysis of consumers’ behaviour of waste mobile phone recycling in China. J. Clean. Prod. 2014, 65, 517–525. [Google Scholar] [CrossRef]
- Li, B.; Yang, J.; Song, X.; Lu, B. Survey on disposal behaviour and awareness of mobile phones in Chinese university students. Procedia Environ. Sci. 2012, 16, 469–476. [Google Scholar] [CrossRef]
- Arain, A.L.; Pummill, R.; Adu-Brimpong, J.; Becker, S.; Green, M.; Ilardi, M.; Van Dam, E.; Neitzel, R.L. Analysis of e-waste recycling behavior based on survey at a Midwestern US University. Waste Manag. 2020, 105, 119–127. [Google Scholar] [CrossRef]
- Ongondo, F.O.; Williams, I.D. Greening academia: Use and disposal of mobile phones among university students. Waste Manag. 2011, 31, 1617–1634. [Google Scholar] [CrossRef]
- Bai, H.; Wang, J.; Zeng, A.Z. Exploring Chinese consumers’ attitude and behavior toward smartphone recycling. J. Clean. Prod. 2018, 188, 227–236. [Google Scholar] [CrossRef]
- Tan, Q.; Duan, H.; Liu, L.; Yang, J.; Li, J. Rethinking residential consumers’ behavior in discarding obsolete mobile phones in China. J. Clean. Prod. 2018, 195, 1228–1236. [Google Scholar] [CrossRef]

| Notation | Agent | Description |
|---|---|---|
| Consumer | Active agent | |
| Second-hand Store | Active agent | |
| Recycler | Active agent | |
| Manufacturer | Active agent | |
| Smartphone | Resource agent |
| Study | Location | Proffer | Landfill | Store | Resell | Manufacturer Recycle | Third-Party Recycle |
|---|---|---|---|---|---|---|---|
| [45] | China | 25.0 | 6.0 | 54.0 | - | - | 15.0 |
| [46] | Finland | 16.0 | 8.5 | 55.0 | 2.4 | - | 18.0 |
| [47] | Austria | 12.2 | 1.4 | 51.4 | 6.7 | - | 19.1 |
| [48] | China | 24.8 | 6.9 | 47.1 | - | - | - |
| [49] | China | 20.0 | 3.0 | 64.0 | 7.0 | 1.0 | 5.0 |
| [50] | USA | 41.0 | 3.0 | 43.0 | 3.0 | 9.0 | 1.0 |
| [51] | UK | 18.7 | 1.6 | 55.7 | 3.1 | 5.2 | 9.4 |
| [52] | China | 35.7 | - | 79.3 | 6.0 | - | - |
| [53] | China | 12.7 | 8.9 | 62.1 | - | 1.4 | 0.8 |
| [28] | China | 19.0 | 1.0 | 49.0 | 4.0 | 11.0 | 14.0 |
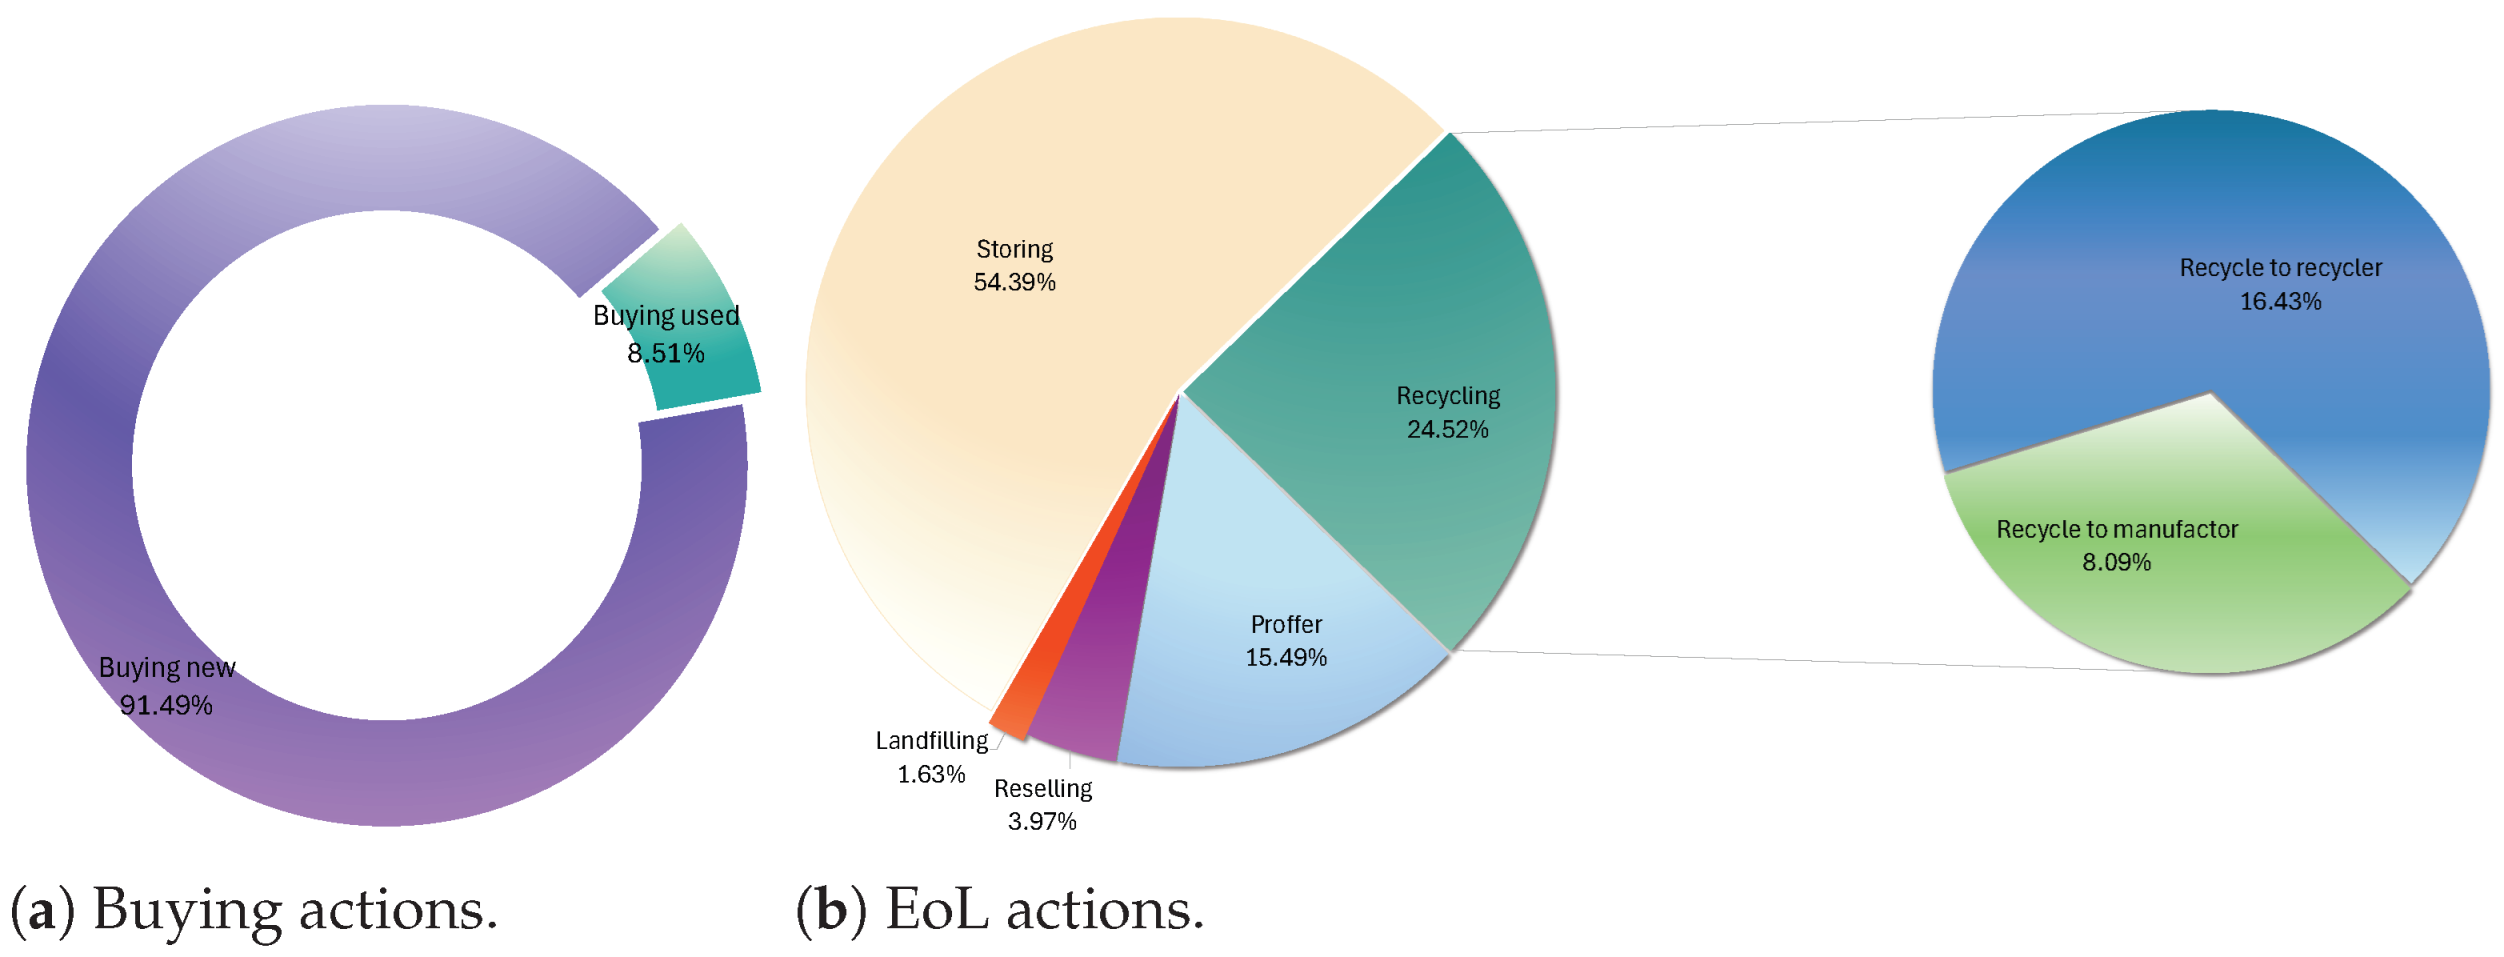
| Ours | - | 15.5 | 1.6 | 54.4 | 4.0 | 8.1 | 16.4 |
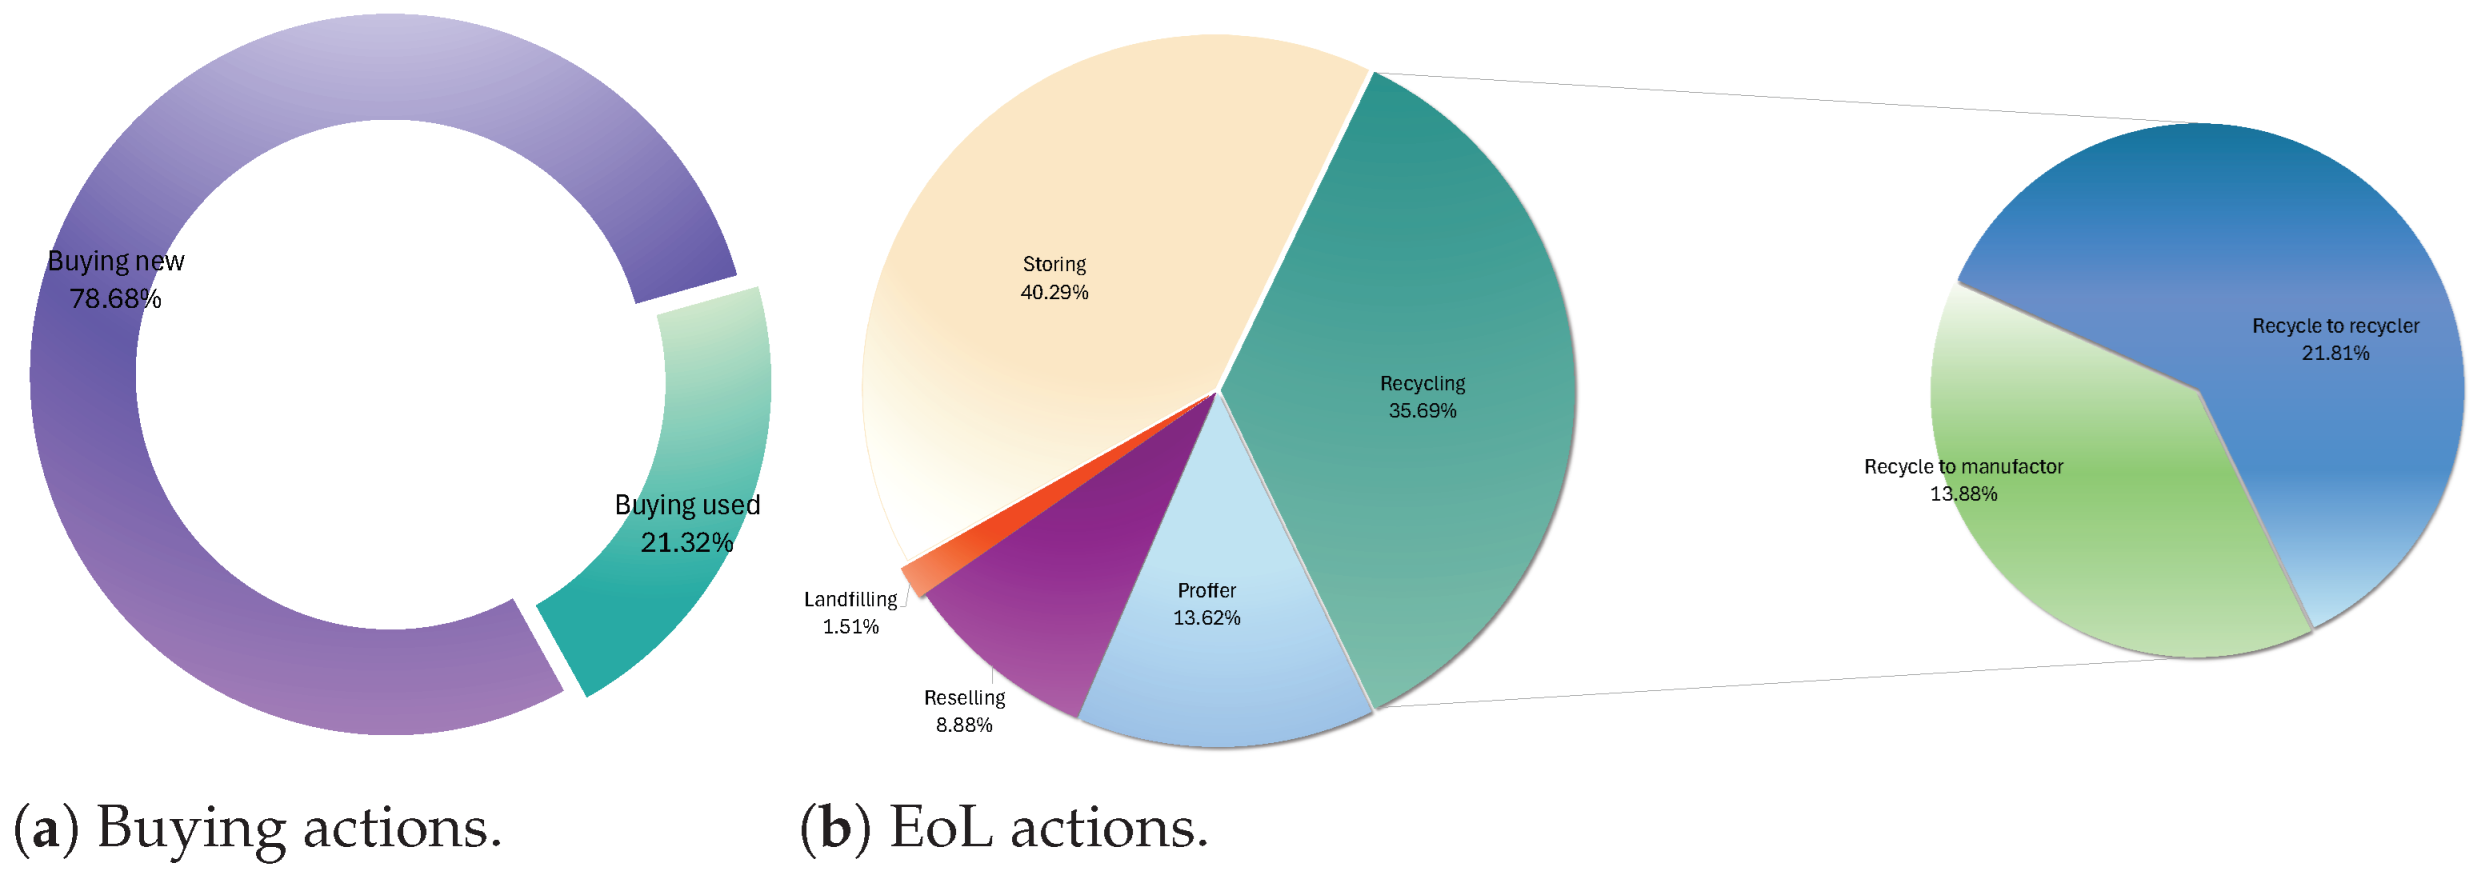
| Ours + GI | - | 13.6 | 1.5 | 40.3 | 8.9 | 13.9 | 21.8 |
| Ours + PE | - | 15.2 | 1.5 | 38.5 | 9.4 | 18.6 | 16.8 |
Disclaimer/Publisher’s Note: The statements, opinions and data contained in all publications are solely those of the individual author(s) and contributor(s) and not of MDPI and/or the editor(s). MDPI and/or the editor(s) disclaim responsibility for any injury to people or property resulting from any ideas, methods, instructions or products referred to in the content. |
© 2025 by the authors. Licensee MDPI, Basel, Switzerland. This article is an open access article distributed under the terms and conditions of the Creative Commons Attribution (CC BY) license (https://creativecommons.org/licenses/by/4.0/).
Share and Cite
Hou, W.; Peng, D.; Chu, J.; Jiang, Y.; Chen, Y.; Chen, F. Building an Agent-Based Simulation Framework of Smartphone Reuse and Recycling: Integrating Privacy Concern and Behavioral Norms. Sustainability 2025, 17, 6885. https://doi.org/10.3390/su17156885
Hou W, Peng D, Chu J, Jiang Y, Chen Y, Chen F. Building an Agent-Based Simulation Framework of Smartphone Reuse and Recycling: Integrating Privacy Concern and Behavioral Norms. Sustainability. 2025; 17(15):6885. https://doi.org/10.3390/su17156885
Chicago/Turabian StyleHou, Wenbang, Dingjie Peng, Jianing Chu, Yuelin Jiang, Yu Chen, and Feier Chen. 2025. "Building an Agent-Based Simulation Framework of Smartphone Reuse and Recycling: Integrating Privacy Concern and Behavioral Norms" Sustainability 17, no. 15: 6885. https://doi.org/10.3390/su17156885
APA StyleHou, W., Peng, D., Chu, J., Jiang, Y., Chen, Y., & Chen, F. (2025). Building an Agent-Based Simulation Framework of Smartphone Reuse and Recycling: Integrating Privacy Concern and Behavioral Norms. Sustainability, 17(15), 6885. https://doi.org/10.3390/su17156885