Article

The Future Climate Change Projections for the Hengduan Mountain Region Based on CMIP6 Models

College of Water Conservancy and Hydropower Engineering, Sichuan Agricultural University, Ya’an 625014, China
*
Author to whom correspondence should be addressed.
Sustainability 2025, 17(12), 5306; https://doi.org/10.3390/su17125306
Submission received: 27 April 2025 / Revised: 4 June 2025 / Accepted: 5 June 2025 / Published: 8 June 2025

Abstract

Amid accelerating global climate change, research quantifying the uncertainty of mountain ecosystems in relation to CMIP6 multi-model ensemble (MME) simulations remains limited. This study addresses this gap by evaluating future temperature and precipitation trends in the Hengduan Mountains and quantifying the uncertainty associated with CMIP6 MME outputs. Utilizing data from 11 CMIP6 climate models, bilinear interpolation was employed to standardize model resolution, while inverse distance weighting (IDW) interpolation was applied to assess spatial distribution patterns. To mitigate systematic biases, the multi-model ensemble mean approach was adopted. Through an equal-weight model selection strategy, EC-Earth3-Veg and MPI-ESM1-2-HR were identified as the optimal model combination for the region. Key findings include the following: (1) During the reference period (1985–2014), model simulations exhibited systematic biases, with temperatures underestimated by 0.46 ± 0.08 °C/month and precipitation overestimated by 2.07 ± 0.32 mm/month relative to observations. (2) In the future period (2031–2070), projected regional warming rates in typical years under SSP1-2.6, SSP2-4.5, and SSP5-8.5 scenarios are −0.294 ± 0.021 °C/decade, 0.081 ± 0.009 °C/decade, and 0.171 ± 0.012 °C/decade, respectively. (3) Precipitation is projected to decline overall, with the most pronounced decrease under the SSP5-8.5 scenario (−0.68 ± 0.07%). This study is the first to systematically quantify CMIP6 model uncertainty in the Hengduan Mountains, revealing regional climate change trajectories, providing a scientific basis for formulating adaptive strategies, and identifying critical pathways for enhancing regional climate modeling efforts.

1. Introduction

Mountain ecosystems have increasingly become focal regions for assessing the impacts and responses to global climate change due to their unique geographical attributes and pronounced climatic sensitivity [1,2]. These regions serve not only as critical habitats for numerous rare and endemic species but also as vital water towers, playing an indispensable role in sustaining global ecological balance and supporting long-term human development. However, climate change is exerting profound destabilizing effects on these ecosystems [3]. Rising global temperatures and shifts in precipitation patterns have triggered substantial ecological transformations. For instance, in the Himalayan range, alpine plant communities are migrating upslope at an average rate of 27 m per decade, leading to elevational range shifts in approximately 90% of endemic species [4]. Simultaneously, the Ganges–Brahmaputra–Meghna basin is experiencing an annual decline in total water storage of 12.2 ± 3.4 km3, jeopardizing water security for over 500 million people [5]. In addition, permafrost degradation has reduced slope stability, intensifying geological hazards and hindering regional socioeconomic development [6]. These interconnected phenomena have given rise to complex environmental responses, including ecosystem regime shifts, restructured water resource dynamics, and escalated geological risk. Collectively, they underscore the inherent vulnerability and high sensitivity of mountain ecosystems to the multifaceted forces of climate change, presenting critical challenges to regional sustainability and resilience [7].
Climate system models serve as fundamental tools for exploring the mechanisms underlying climate change and projecting future climatic trends, reflecting the progressive advancement of human understanding of the Earth’s climate system [8,9,10,11]. In particular, the innovations introduced by CMIP6 have offered unprecedented opportunities for investigating climate change in regions characterized by complex topography [12,13]. In recent years, CMIP6 models have exhibited high reliability in simulating the climate dynamics of such terrains and have thus been extensively utilized in mountain climate research [14,15,16,17,18]. Building on this foundation, the application of CMIP6 models to the Hengduan Mountains—a region also marked by highly complex terrain—is expected to provide robust scientific evidence for regional climate change assessments. As a vital component of the global mountain ecosystem network, the Hengduan Mountains not only share common ecological response patterns with other mountain systems under climate change but also exhibit distinct regional characteristics due to their unique geographical positioning at the intersection of the Tibetan Plateau, the Yunnan–Guizhou Plateau, and the Sichuan Basin. This area is distinguished by a heterogeneous landscape comprising plateaus, deep gorges, and basins, along with considerable climatic diversity [19,20,21]. Previous studies have indicated a pronounced trend of “warming and drying” in the region, with an average temperature increase of 0.16 °C per decade and a concurrent decline in precipitation of 11.41 mm per decade [22]. However, it remains uncertain whether these observed changes align with the projections generated by CMIP6 models. Although prior research has investigated temperature and precipitation dynamics in the Hengduan Mountains using satellite remote sensing and ground-based observations [23,24], systematic evaluations of the performance and applicability of CMIP6 models in this region remain limited. Therefore, employing CMIP6 models to analyze climate change in the Hengduan Mountains holds considerable scientific significance. Moreover, the existing literature has primarily focused on individual climatic variables [25,26], lacking a comprehensive understanding of the synergistic effects of topography, climate, and anthropogenic influences. In particular, the future trajectories and associated uncertainties of climate change under different socioeconomic development scenarios require further exploration and in-depth analysis.
To address the aforementioned research gaps, this study integrates CMIP6 climate models with high-resolution topographical datasets and multi-model ensemble averaging techniques to systematically assess the performance of CMIP6 simulations in the Hengduan Mountains region. By conducting comparative analyses between model outputs and observational data, the research provides a comprehensive evaluation of projected trends in temperature and precipitation. Furthermore, it investigates the interplay among topographical complexity, climatic variability, and anthropogenic influences in shaping regional climate change dynamics. The outcomes of this study are expected to offer a robust scientific basis for ecological conservation, water resource management, and the formulation of climate adaptation policies, thereby supporting sustainable development efforts in this ecologically and geopolitically significant region.

2. Research Region, Data and Methodology

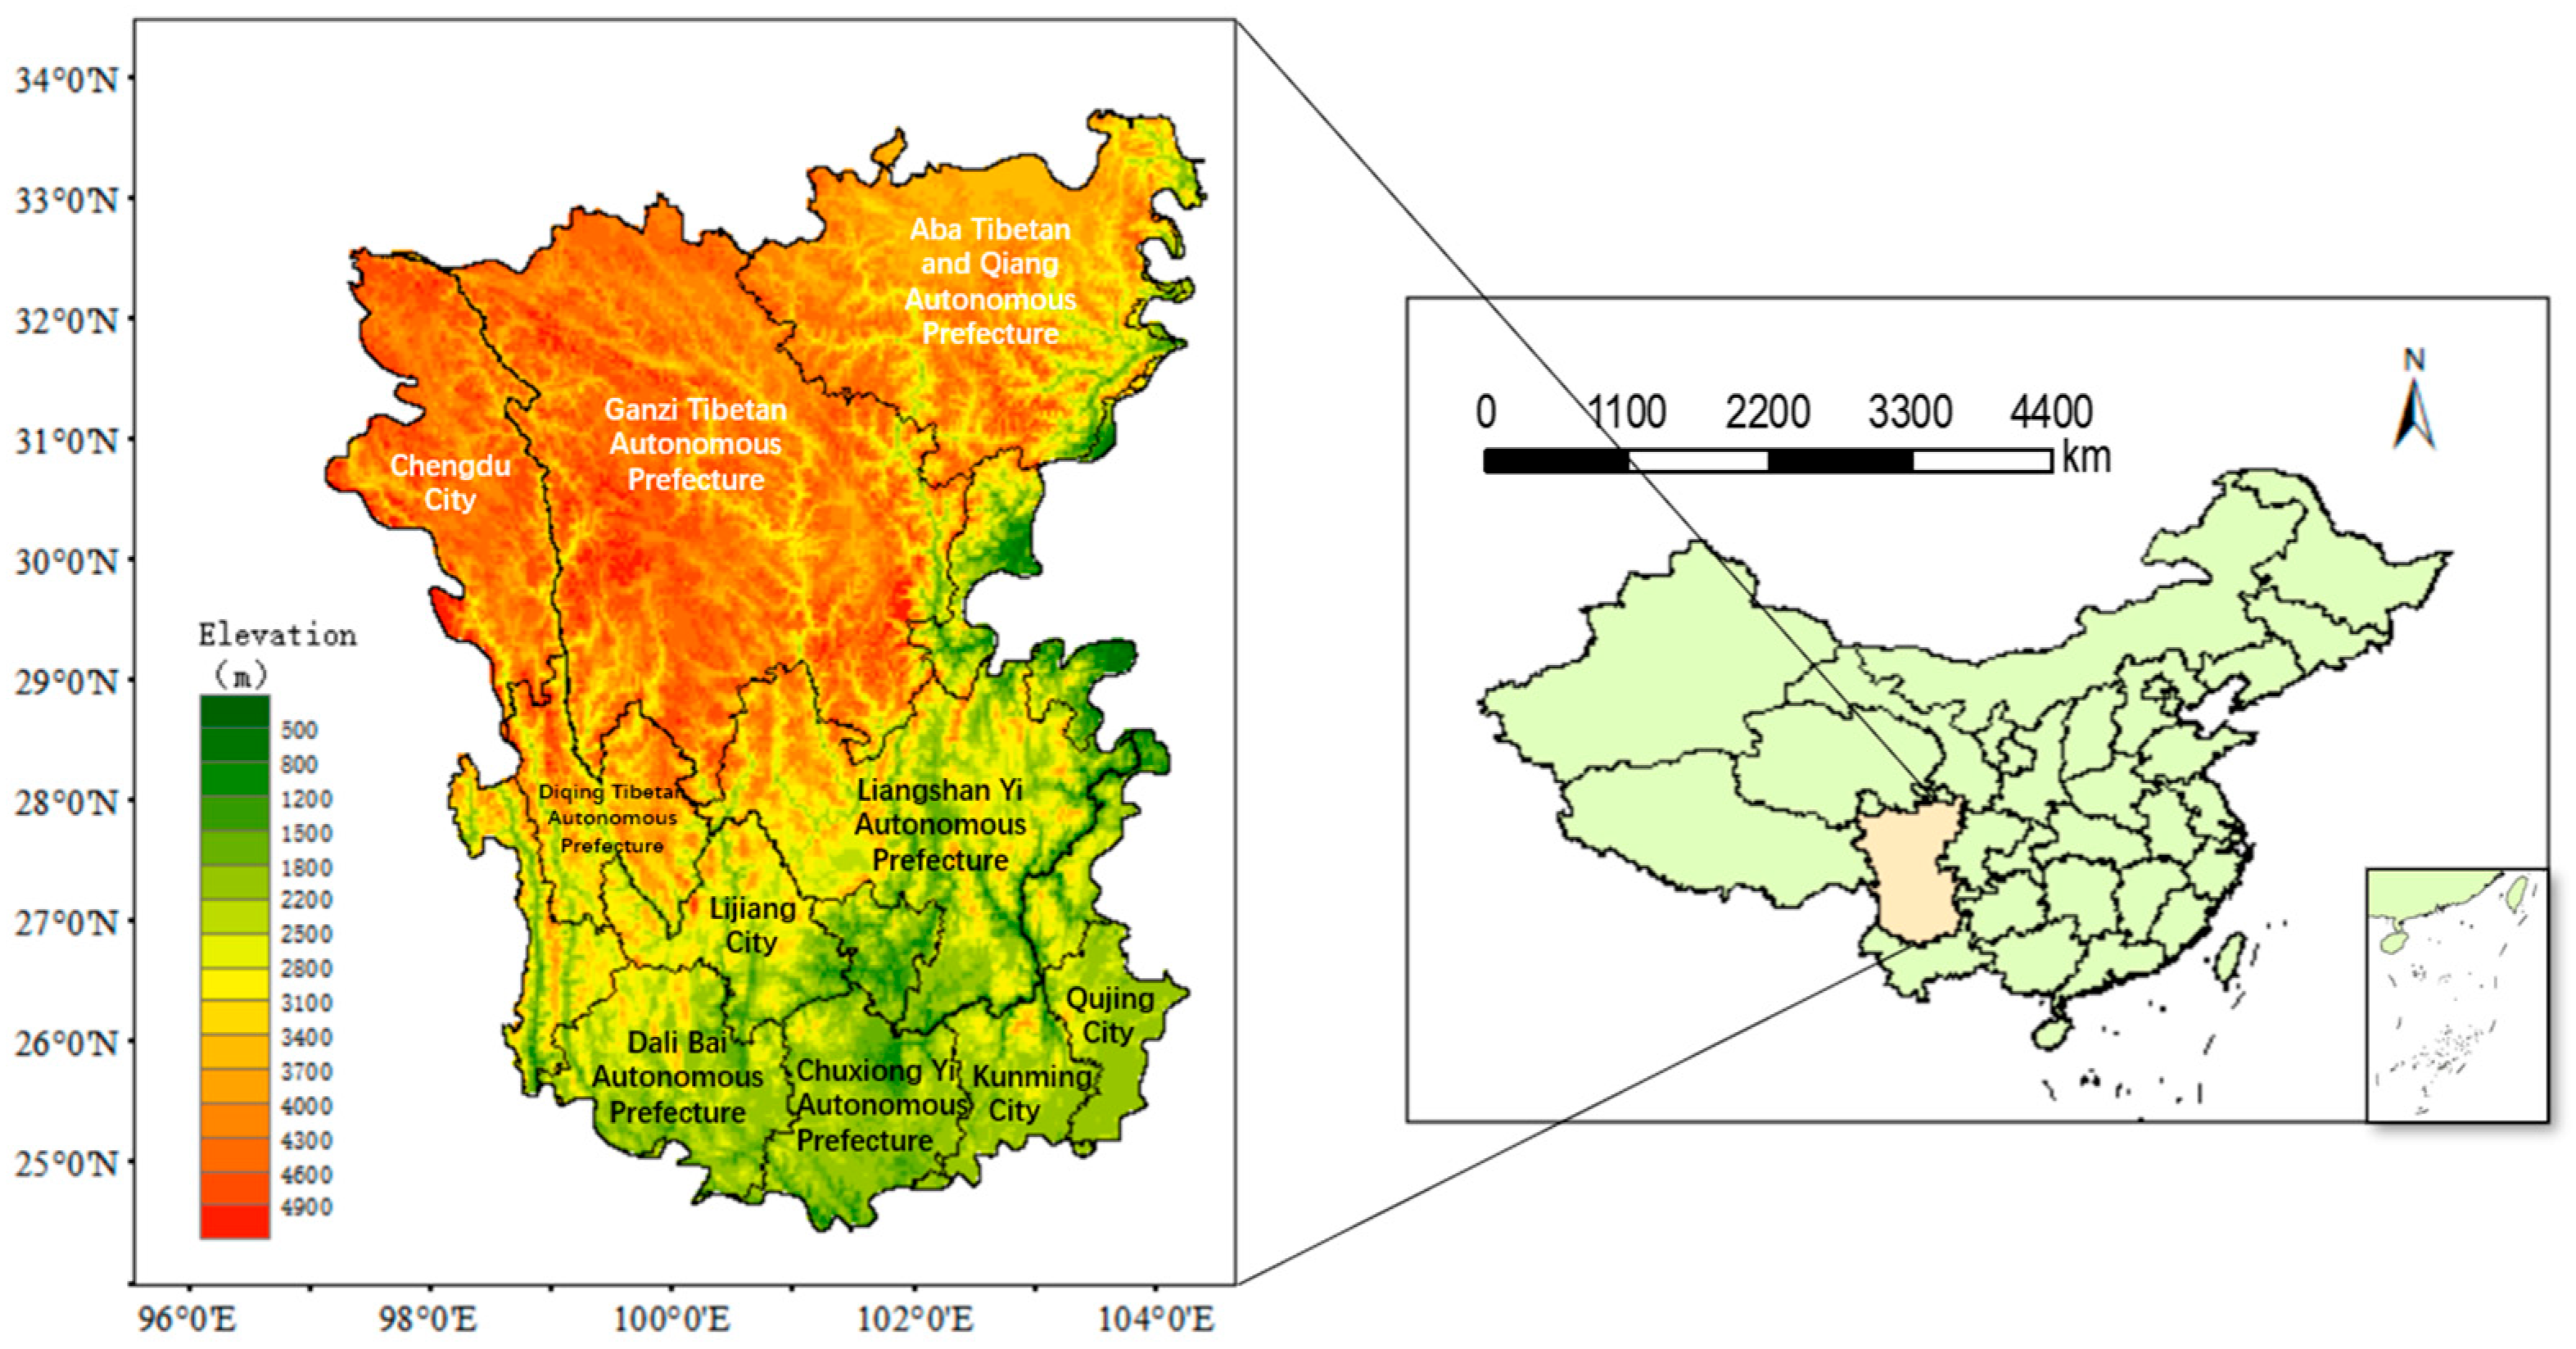
2.1. Overview of the Study Area

The Hengduan Mountains, located in southwestern China, represent a vital transitional zone connecting the first and second steps of China’s three-tiered topographic structure. Owing to varying research objectives and disciplinary perspectives, the spatial boundaries of this region remain inconsistently defined across the literature [27,28,29,30]. In this study, the delineation of the Hengduan Mountains is established through an integrated consideration of both climatic and topographic factors that significantly influence regional climate dynamics. Accordingly, the study area is defined as extending from 24°30′ to 33°43′ N latitude and from 97°20′ to 104°25′ E longitude (as illustrated in Figure 1). This geographic scope encompasses multiple prefecture-level administrative units, including Aba Tibetan and Qiang Autonomous Prefecture, Ganzi Tibetan Autonomous Prefecture, Mianyang City, Deyang City, Chengdu City, Ya’an City, Leshan City, Liangshan Yi Autonomous Prefecture, and Panzhihua City in Sichuan Province; Diqing Tibetan Autonomous Prefecture, Nujiang Lisu Autonomous Prefecture, Lijiang City, Dali Bai Autonomous Prefecture, Chuxiong Yi Autonomous Prefecture, Kunming City, Zhaotong City, Qujing City, Yuxi City, Pu’er City, and Baoshan City in Yunnan Province; as well as parts of Chamdo in the Tibet Autonomous Region.
This region is marked by a complex interplay of mountain ranges and hydrological systems, manifesting a distinct configuration of “seven mountain ranges” (Minshan, Qionglai, Daxueshan, Shaluli, Mangkang–Yunling, Taniantaweng–Nushan, and Boshula–Gaoligong) and “six rivers” (Minjiang, Daduhe, Yalongjiang, Jinshajiang, Lancangjiang, and Nujiang). Spanning an elevation range from 291 to 7556 m, the Hengduan Mountains are dominated by Gongga Mountain, which, at 7556 m, represents the highest peak, resulting in pronounced altitudinal climatic gradients [31,32]. Geologically, the region lies at the tectonic collision zone between the Eurasian and Indian Ocean plates, characterized by alternating high mountain ridges and deep valleys, well-developed fault structures, active neotectonic movements, and significant topographic relief. This unique configuration compels warm, moist monsoonal air currents to ascend, generating intricate precipitation patterns that significantly influence the regional climate. Climatically, the Hengduan Mountains are a monsoon-dominated region within a distinct climatic–vegetation zone, exhibiting pronounced seasonal and altitudinal variations driven by both the East Asian and South Asian monsoons. These conditions foster a range of vegetation types, from subtropical forests at lower elevations to alpine meadows and tundra above 4000 m, positioning the region as a global biodiversity hotspot [21,33]. The area is home to approximately 70 million people, with settlements primarily concentrated in the lower valleys and urban centers, including Chengdu, Kunming, and Lijiang. This creates a sparse network of cities and rural communities, interspersed with remote villages. Population density is higher in the eastern areas (e.g., Chengdu, Kunming) and lower in the high-altitude zones (e.g., Diqing, Aba), reflecting challenges in accessibility and infrastructure development. Given its ecological importance, nature conservation is a high priority in the region, with protected areas such as the Three Parallel Rivers UNESCO World Heritage Site and the Giant Panda National Park safeguarding critical habitats and endemic species [34].

2.2. Data and Methods

2.2.1. Overall Technical Route

This study employs a technical framework encompassing “data preprocessing—model evaluation—multi-model ensemble—future projection,” integrating geospatial analysis and statistical methods to systematically quantify the uncertainties associated with CMIP6 models in the Hengduan Mountain region and to project future climate trends. The methodological workflow is outlined as follows (Figure 2):

2.2.2. Data Sources

This investigation utilizes daily temperature and precipitation data from global meteorological stations, as published by the National Centers for Environmental Information (NCEI) under the National Oceanic and Atmospheric Administration (NOAA) (available at: https://www.ncei.noaa.gov/), to systematically assess the historical simulation performance of 11 CMIP6 models. Using data from the baseline period of 1985–2014, model biases in temperature and precipitation simulations are quantified through comparative analysis between model outputs and continuous observational data from 21 ground-based meteorological stations. The spatial distribution of these stations spans the key geomorphological units of the Hengduan Mountains region.
In line with data accessibility considerations and informed by prior studies [35,36], this research selects 11 CMIP6 global climate models that have demonstrated strong performance in simulating precipitation and temperature patterns across China (see Table 1). These models have proven effective in climate simulation studies for various mountainous regions, providing valuable data support and methodological insights for a comprehensive analysis of climate change dynamics in the Hengduan Mountains.
The model data referenced above were sourced from the Earth System Grid Federation repository (https://esgf-node.ipsl.upmc.fr/search/cmip6-ipsl/)(accessed on 12 January 2025), which includes temperature and precipitation simulation data from historical climate experiments for the period 1985–2014, as well as climate projections for the period 2031–2070. These projections are based on three distinct future scenarios: SSP1-2.6 (a sustainability-focused development pathway with low radiative forcing), SSP2-4.5 (a middle-of-the-road development pathway with moderate radiative forcing), and SSP5-8.5 (a fossil fuel-driven development pathway with high radiative forcing).

2.2.3. Data Resolution Standardization

Bilinear interpolation, a widely recognized algorithm for two-dimensional spatial data interpolation, is extensively employed in various fields, including geographic information science and meteorology. The core principle of this method is based on linear interpolation, where known discrete data points are used to estimate values at unknown locations. For example, consider a 2 × 2 grid with four vertices A, B, C, and D, each associated with known values f(A), f(B), f(C), and f(D). The goal is to estimate the value at an unknown point P within the grid.
Firstly, linear interpolation is performed along the horizontal direction:
Along the edge AB, the function value at point P is estimated as follows:
f P 1 = x 2 x x 2 x 1 f A + x x 1 x 2 x 1 f ( B )
Along the edge CD, the function value at point P is estimated as follows:
f P 1 = x 2 x x 2 x 1 f D + x x 1 x 2 x 1 f ( C )
where x is the horizontal coordinate of point P, x 1 and x 2 are the horizontal coordinates of points A, B (or D, C), respectively.
Subsequently, linear interpolation is applied vertically on points P1 and P2 to obtain the function value at point P:
f P = y 2 y y 2 y 1 f P 1 + y y 1 y 2 y 1 f ( P 2 )
where y is the vertical coordinate of point P, y 1 and y 2 are the vertical coordinates of points A, D (or B, C), respectively.
In this study, given the relatively coarse and heterogeneous resolutions of the 11 selected CMIP6 models, bilinear interpolation was applied to resample the climate model data onto a 0.5° × 0.5° grid. This approach was chosen to enable effective comparison between model simulations and observational data, ensuring data consistency and comparability. Bilinear interpolation was selected due to its algorithmic simplicity, computational efficiency, ability to maintain first-order continuity, and capacity to produce smoothly interpolated results.

2.2.4. Ensemble Strategy and Threshold Setting

To optimize model selection for future climate projections in the Hengduan Mountains, statistical thresholds were established based on the evaluation of CMIP6 model performance against regional observational datasets.
For temperature evaluation: Models with biases exceeding ±1 standard deviation (±0.628 °C/month) from the multi-model mean bias were excluded to ensure reliable simulation of seasonal temperature variability, with particular attention to addressing the underestimation during summer high-temperature periods.
For precipitation evaluation: A more stringent threshold of ±0.5 standard deviation (±1.034 mm/month) was applied to reduce the systematic overestimation observed in spring precipitation simulations, which is attributed to the region’s complex topography and monsoon-driven climate dynamics (as discussed in Section 3.1).

2.2.5. Multi-Model Ensemble (MME)

Climate numerical models are essential tools for investigating regional climate change dynamics. However, they are subject to inherent systematic biases, such as deficiencies in parameterization schemes and uncertainties in initial conditions, which can lead to significant errors in projections made by individual models. To minimize the impact of these uncertainties on climate impact assessments, this study employs the multi-model ensemble (MME) approach. By integrating outputs from multiple models, the MME approach effectively utilizes independent information from each model to enhance the robustness and reliability of simulations. This methodology has been widely validated for its ability to reduce biases inherent in single-model predictions and improve the accuracy of capturing regional climate characteristics [37].
The optimally selected models, EC-Earth3-Veg and MPI-ESM1-2-HR, were subsequently combined using the equal-weighted ensemble methodology to create a multi-model ensemble (MME) dataset. This approach not only ensures balanced contributions from each model but also significantly improves the signal-to-noise ratio of the projection results by reducing variance [38]. Utilizing the MME dataset, the spatiotemporal evolution of temperature and precipitation in the Hengduan Mountains region during the period of 2031–2070 was further analyzed under the SSP1-2.6, SSP2-4.5, and SSP5-8.5 scenarios.

2.2.6. Inverse Distance Weighting (IDW) Interpolation Method

The inverse distance weighting (IDW) interpolation method is based on the principle of inverse proportionality to distance, which asserts that the influence of known data points on an unknown point decreases with increasing distance. In practical applications, given n known data points with corresponding function values, the value z at an unknown point P can be calculated using the following formula:
Z = i = 1 n z i d i p i = 1 n 1 d i p
In the IDW interpolation method, d i = ( x x i ) 2 + ( y y i ) 2 represents the distance from the unknown point P to known data points, and P is the power parameter, which is typically assigned values of 1 or 2. As the P value increases, the influence of distance becomes more pronounced, meaning that the interpolation result at an unknown point is more heavily influenced by nearby known data points.
In this study, the IDW interpolation method was applied within a Geographic Information System (GIS) platform to spatially interpolate temperature and precipitation variation data across the Hengduan Mountains. This facilitated a comprehensive analysis of the spatial distribution characteristics of these variables. The key advantage of IDW interpolation lies in its ability to account for the distance relationships between data points, making it especially suitable for interpolating spatially heterogeneous data. By appropriately weighting distances, IDW interpolation effectively reduces biases in interpolation caused by uneven data point distribution, thereby providing a more accurate representation of spatial variation trends in temperature and precipitation across the Hengduan Mountains region. This creates a reliable data foundation for subsequent climate change analyses.

2.2.7. Seasonal Classification Criteria

The investigation follows the World Meteorological Organization (WMO) seasonal classification standards, designating March–May, June–August, September–November, and December–February as spring, summer, autumn, and winter, respectively. This approach ensures temporal consistency in the climate analyses.

3. Results and Analysis

3.1. Current Climate Analysis

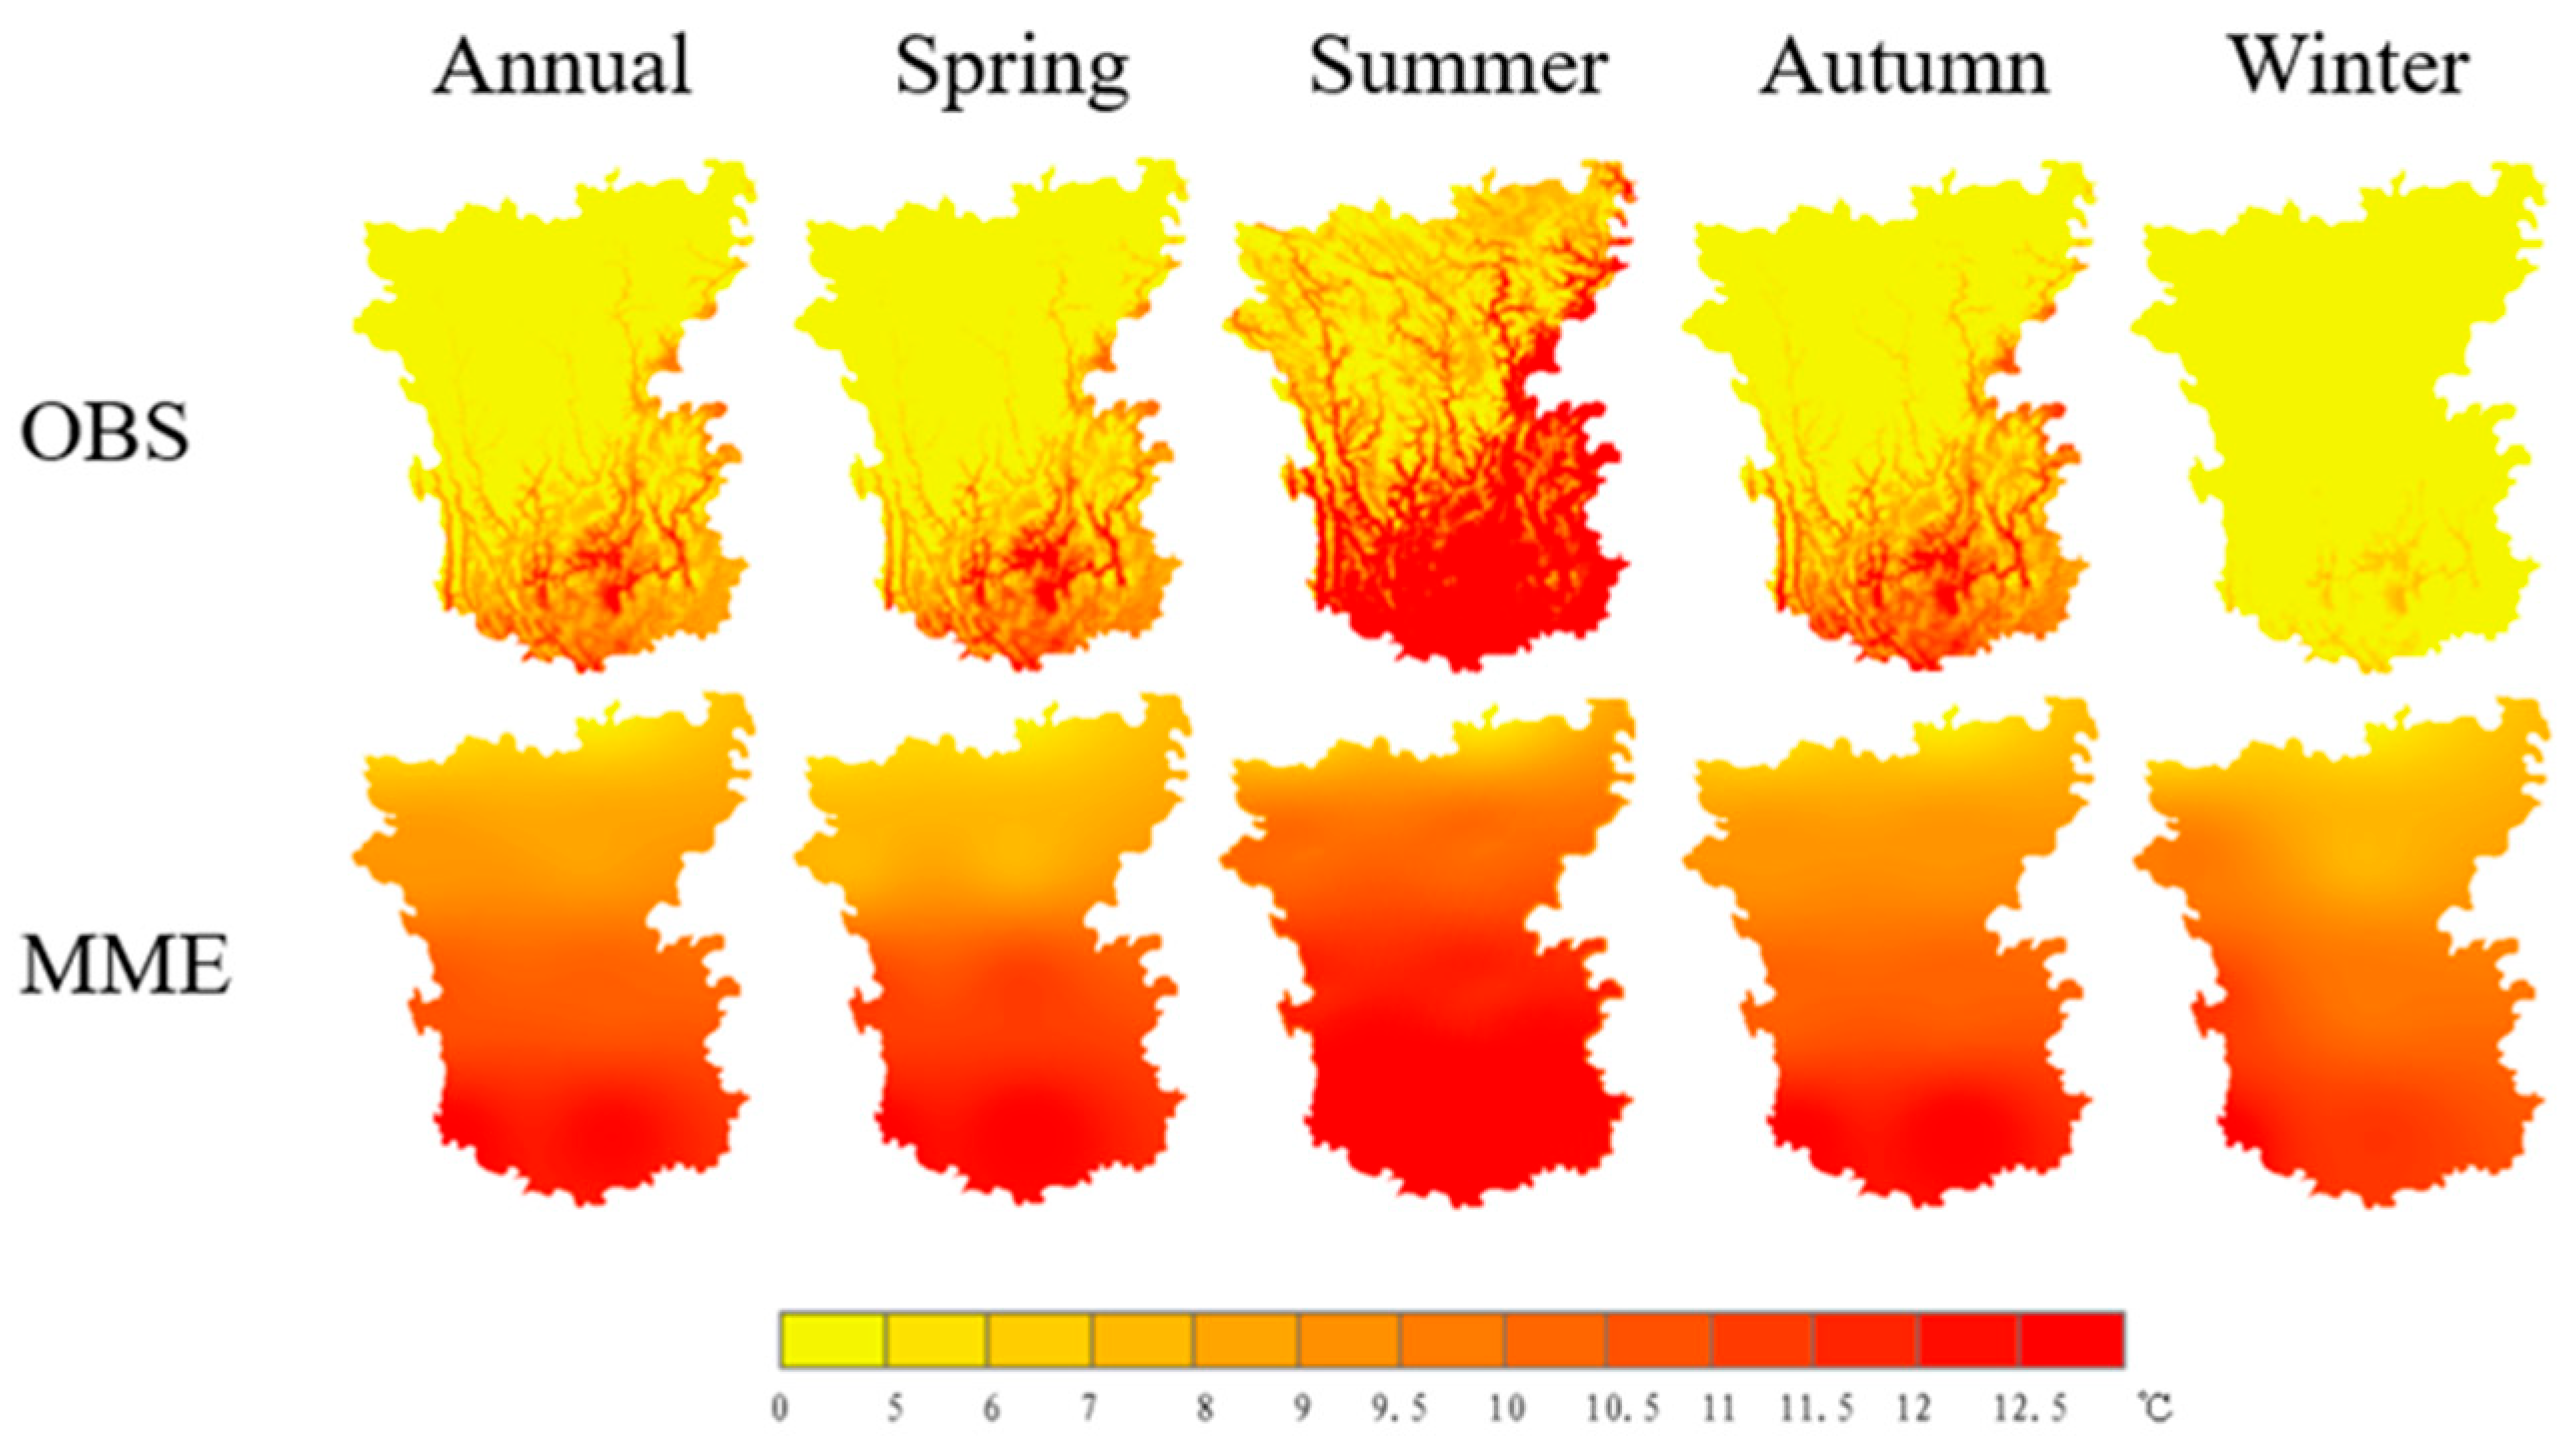
3.1.1. Spatial Distribution Characteristics of Temperature and Precipitation

Since CMIP6 historical experiments conclude at the 2014 chronological boundary, the period from 1985 to 2014 was designated as the reference baseline for comparative analysis of seasonal spatial variations. This comparison was conducted between observational data from the NOAA (OBS) and the multi-model ensemble (MME) average derived from 11 models, as shown in Figure 3.
As illustrated in Figure 3, the observed annual mean temperature distribution across the Hengduan Mountains region displays a pronounced latitudinal gradient. The northern areas exhibit average annual temperatures around 5 °C, while southern regions experience considerably higher temperatures, approaching 12 °C, due to both decreasing latitude and the influence of dry–hot valley systems. Seasonal temperature patterns also exhibit substantial spatial variation. For example, in autumn, northern cities see mean temperatures drop to around 5 °C, influenced by the plateau–montane climate regime. In contrast, southern areas, which are influenced by subtropical monsoon circulation patterns, maintain autumnal mean temperatures of approximately 15 °C. The multi-model ensemble (MME) temperature simulations generally align with the observed data (OBS), though systematic positive biases are present in the northern Hengduan Mountains region. These overestimations are primarily due to two factors: Firstly, deficiencies in the cloud parameterization schemes within the models result in underrepresented cloud coverage. Clouds play a critical role in regulating solar radiation by reflecting incoming shortwave radiation, thus reducing the amount of solar radiation reaching the Earth’s surface. The underrepresentation of cloud cover leads to increased solar radiation absorption at the surface, which in turn raises surface temperatures. Secondly, inadequate representation of vegetation phenological cycles—specifically during the growth and senescence phases—leads to underestimated surface albedo values. During the growth phase, a decrease in albedo allows for enhanced solar radiation absorption, while during senescence, increased albedo values reflect more radiation. The models’ failure to accurately simulate these temporal transitions results in excessive radiation absorption, which contributes to an overestimation of mean temperatures. Among the 11 CMIP6 models evaluated, models such as EC-Earth3-Veg, which incorporates advanced vegetation modules, and BCC-CSM2-MR, which features improved cloud parameterization, demonstrate reduced biases in simulating phenological cycles and cloud cover, respectively. These models show a closer alignment with observational temperature data, particularly in the southern regions. The MME simulations generally perform well in replicating the spatiotemporal temperature variability across the Hengduan Mountains. Annual mean and seasonal discrepancies are typically within 35% of the observed values. However, due to difficulties in accurately capturing the region’s complex topography and monsoon dynamics, the models exhibit persistent biases. These include an underestimation of summer high-temperature periods and a reduced latitudinal temperature gradient.
Figure 4 presents a comparative analysis of annual and seasonal precipitation variability in the Hengduan Mountains during the reference period (1985–2014), based on both observational data (OBS) and multi-model ensemble (MME) simulations. The spatial distribution of precipitation is found to be largely consistent between the observational records and the model simulations, with both depicting a similar pattern in annual mean and seasonal precipitation across the region. Notably, precipitation is more abundant in the southern portion of the Hengduan Mountains, while central and northeastern regions exhibit comparatively lower levels, aligning with previous research findings [39,40]. This spatial heterogeneity can be attributed to the region’s topographic and geomorphological features. The southern Hengduan Mountains, characterized by relatively flat terrain and closer proximity to the Indian Ocean, are more substantially influenced by the Indian Ocean’s southwest monsoon, thereby receiving higher levels of precipitation. In contrast, the central and northeastern areas, with their more complex and rugged terrain, experience reduced orographic uplift, leading to lower precipitation rates. From a temporal perspective, precipitation is predominantly concentrated in the summer months, with a significant decline in the autumn. This seasonal pattern is closely linked to the evolution and movement of the western Pacific subtropical high-pressure system [41]. Specifically, during the summer, the intensification and southwestward extension of the western Pacific subtropical high enhances its influence over the Hengduan region, fostering a more stable precipitation regime. Conversely, the weakening and northward retreat of the high-pressure system in autumn results in diminished influence and a corresponding reduction in precipitation. Although the MME simulations generally reproduce the observed spatiotemporal precipitation patterns, notable discrepancies are evident. In spring, the simulations tend to overestimate precipitation, likely due to intensified westerlies contributing to enhanced moisture transport from the west. During the summer, the overestimation becomes more pronounced, particularly in the southwestern portion of the region. This overestimation may stem from multiple factors, including orographic enhancement, convergence of the Indian Ocean southwest monsoon and the Pacific southeast monsoon, and limitations related to model parameterizations and spatial resolution [42]. The complex orographic features of the southwestern region facilitate orographic lifting and condensation, promoting precipitation. Additionally, the confluence of the two monsoon systems intensifies moisture availability and convective activity. However, inaccuracies in model structure—particularly parameterization schemes and coarse resolution—can exacerbate simulation errors. These discrepancies underscore the importance of refining model physics, improving spatial resolution, and enhancing the representation of topography–climate interactions to achieve more accurate precipitation simulations for the Hengduan Mountains.

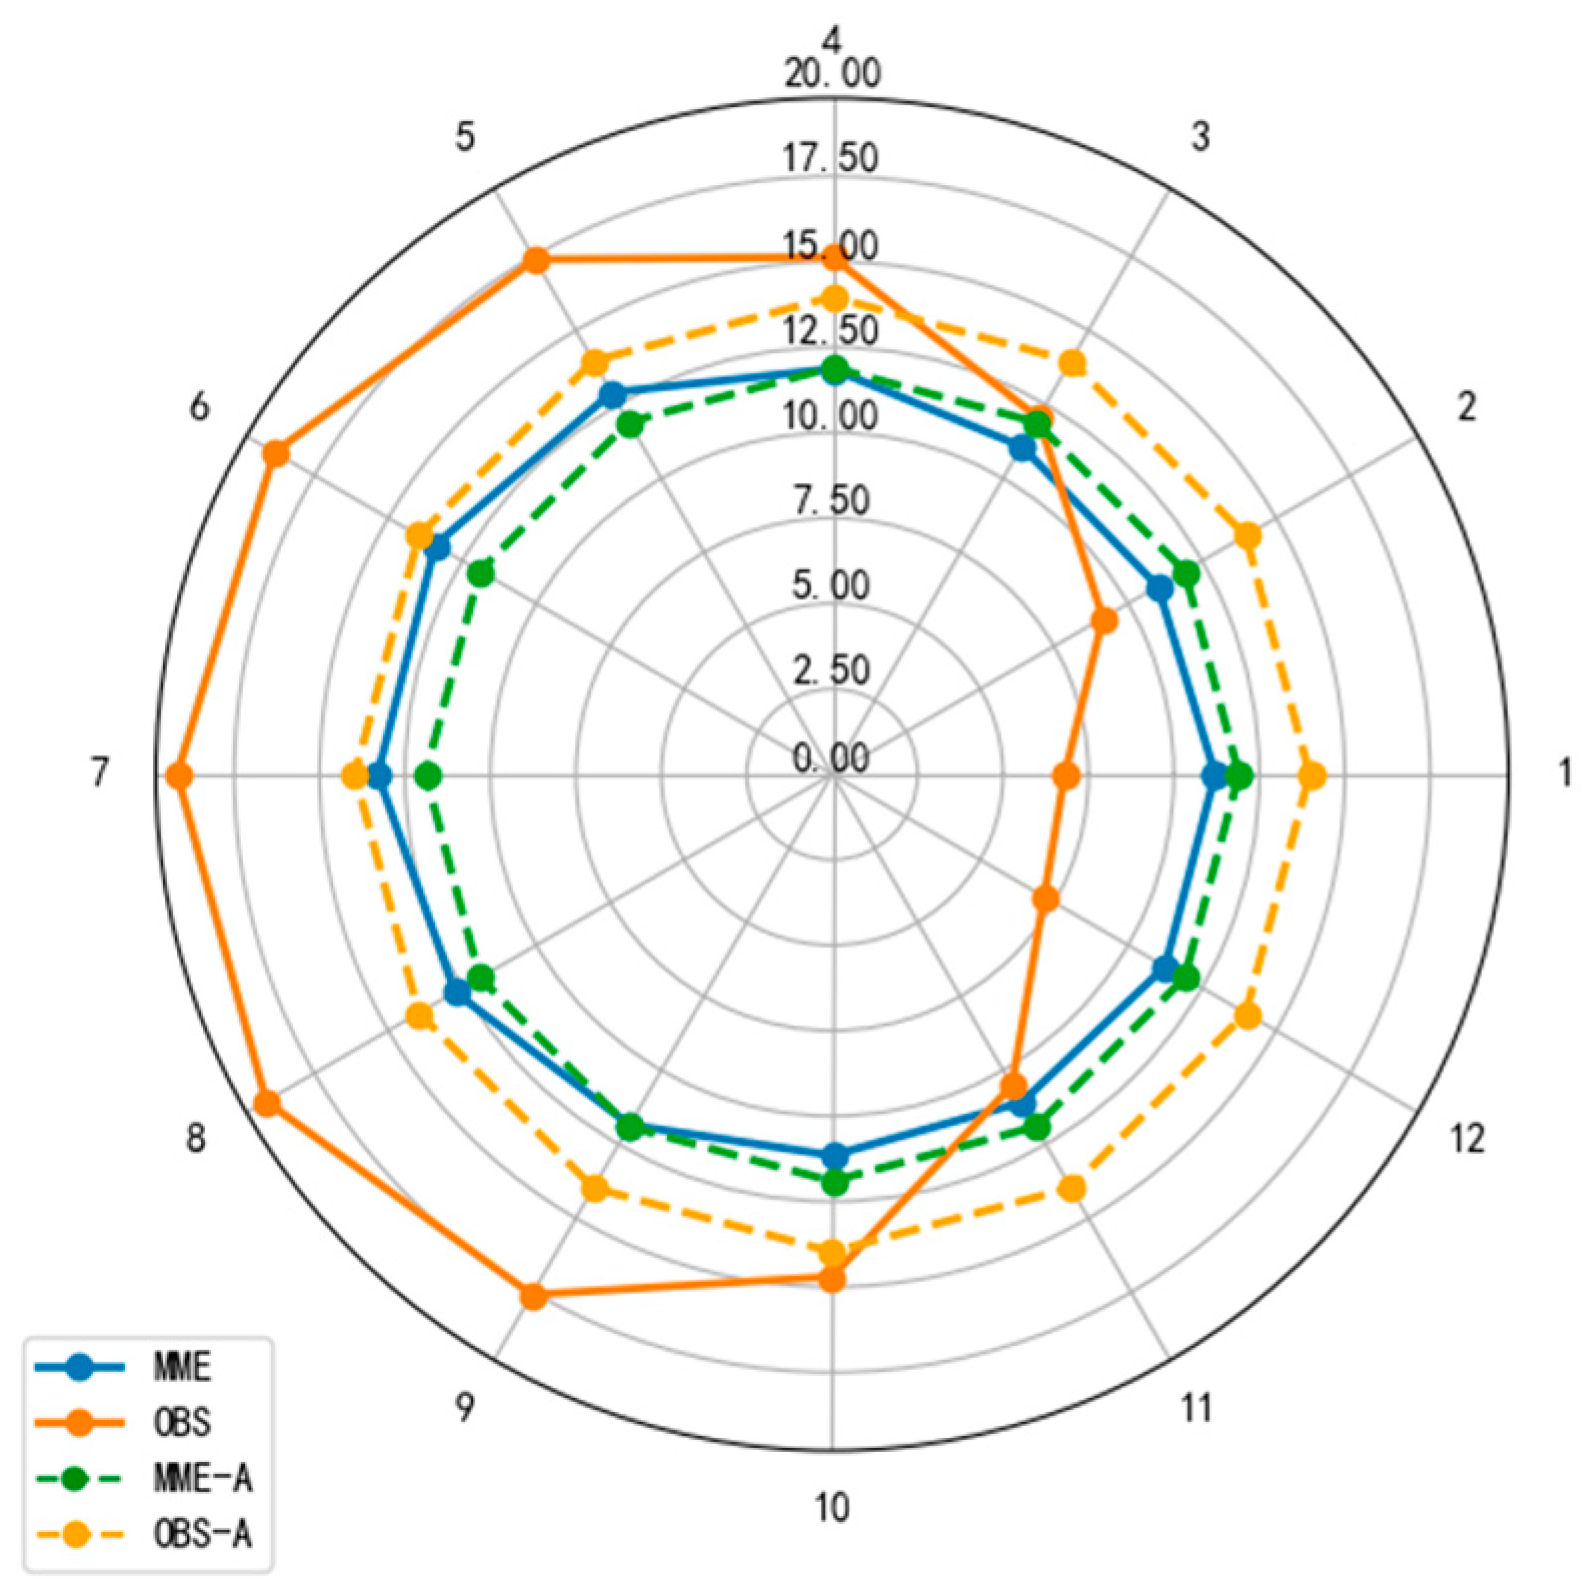
3.1.2. Annual Cyclical Variation in Temperature and Precipitation

Figure 5 compares the annual temperature cycles derived from observational data in the Hengduan Mountains with those simulated by the CMIP6 dataset. While the two datasets exhibit a general degree of consistency in annual temperature trends, notable discrepancies underscore considerable model uncertainties. Specifically, the multi-model ensemble (MME) simulations tend to underestimate temperatures by an average of 0.069 °C/day relative to observations, with the most substantial negative bias occurring in August (−0.213 °C) and the smallest discrepancy observed in November (+0.019 °C). These deviations are consistent with previous findings, which report temperature differences in the range of 0.053 to 0.147 °C/day [43]. The CMIP6 simulations present a comparatively smoother annual temperature curve, with attenuated seasonal fluctuations. This phenomenon likely results from the averaging effect inherent in multi-year, multi-model ensembles, which can obscure sharp seasonal transitions. Furthermore, the models exhibit limited capability in representing localized convective precipitation processes and anthropogenic influences—such as energy consumption—which are critical drivers of seasonal temperature variability. Prior studies have shown that CMIP6 models generally perform well in simulating autumn and winter climatology across China [44]. In the Hengduan Mountains, autumn temperature patterns are reasonably well-replicated; however, winter temperatures are subject to significant positive biases, particularly in December, January, and February. These overestimations likely originate from limitations in simulating snow–albedo feedback mechanisms, a challenge exacerbated by the region’s complex altitudinal gradient (ranging from 291 m to 7556 m) [45]. From May to September, the models consistently underestimate temperatures, a pattern potentially attributable to inadequacies in resolving convective precipitation processes and anthropogenic heat emissions during the warm season. Nevertheless, the overall magnitude of these biases remains within an acceptable range for regional climate modeling (i.e., less than 0.5 °C/day), particularly for applications such as ecological modeling. Despite the noted discrepancies, the MME approach demonstrates a robust capacity to capture spatiotemporal temperature variability, thereby offering valuable insights for assessing climate trends and informing sustainable management strategies in the Hengduan Mountains.
Figure 6 illustrates the annual cycle of precipitation across the Hengduan Mountains, comparing observational data (OBS) with multi-model ensemble (MME) simulations. Overall, precipitation simulations exhibit slightly better performance than temperature simulations, particularly in capturing the peak precipitation during summer; however, significant uncertainties persist. Quantitative analysis indicates that the MME consistently overestimates precipitation by an average of 0.79 mm/day, with the most pronounced bias observed in March (+1.64 mm/day) and the smallest in September (−0.19 mm/day). These findings are consistent with previous studies that report overestimations in precipitation of approximately 1 mm/day [46]. The discrepancies between observed and simulated data are primarily attributable to differences in data sources: observational records are based on direct meteorological station measurements, while model simulations are derived from parameterized representations of atmospheric processes, inherently introducing systematic biases [47]. Nonetheless, the MME captures key seasonal precipitation characteristics effectively, including the distinct summer maxima and winter minima, aligning well with prior research [48]. The systematic overestimation of precipitation is largely associated with overly active cloud microphysics parameterizations and an exaggerated response in soil moisture feedback mechanisms. While these biases are nontrivial, they remain within the acceptable thresholds for regional climate modeling—specifically, less than 1.5 mm/day, a level of precision considered suitable for water resource and ecological management applications. Moreover, the MME’s ability to reproduce seasonal precipitation dynamics reinforces its utility in assessing precipitation trends and informing sustainable environmental strategies in the Hengduan Mountains. The comparatively improved performance of precipitation simulations relative to temperature simulations is likely due to the more robust representation of monsoon-driven summer precipitation. However, substantial biases remain in spring, emphasizing the need for improvements in cloud process parameterizations and soil moisture feedback modeling. Additionally, expanding and densifying the regional observational network would enhance model validation and support the development of more reliable climate simulations for sustainable management in this topographically complex region.

3.1.3. Comprehensive Evaluation of Model Performance

Overall, the multi-model ensemble (MME) demonstrates a commendable capacity for simulating historical climate patterns across the Hengduan Mountains region, as evidenced by a Nash–Sutcliffe Efficiency (NSE) coefficient of 0.76 for temperature and 0.68 for precipitation. Despite this generally strong performance, the MME underrepresents both the spatial heterogeneity and the intensity of seasonal fluctuations. Specifically, the simulated temperature spatial gradient intensity reaches only 85% of the observed values, while the seasonal variability in simulated precipitation captures merely 72% of observational estimates. These discrepancies underscore inherent limitations in the current generation of CMIP6 models when applied to regions characterized by complex topography:
Inadequate topographical resolution: The Hengduan Mountains region is characterized by highly complex terrain, including steep elevation gradients, deep valleys, and plateau transition zones. These intricate topographical features give rise to localized atmospheric circulation systems—such as mountain–valley breezes and interactions with broader land–sea circulation patterns—that exert a strong influence on regional temperature and precipitation regimes. Observational data highlight the presence of pronounced diurnal variations associated with mountain–valley wind systems across the region; however, MME simulations consistently fail to replicate these dynamics with sufficient accuracy. This deficiency is largely attributable to the coarse horizontal resolution employed by most CMIP6 models, which typically exceeds 50 km. Such resolution is inadequate for capturing the fine-scale orographic structures that modulate local climatic processes. As a result, the inability to resolve critical terrain-induced circulations limits the models’ capacity to simulate key climatological variables accurately, contributing to discrepancies between simulated outputs and observed records. Model calibration could improve sensitivity to localized circulation patterns (e.g., mountain–valley breezes, land–sea interactions) by tuning parameters for convective or boundary layer dynamics, potentially reducing biases. However, this study uses uncalibrated CMIP6 models to maintain consistency with the global model framework and subsequent analyses. As discussed in Section 4, dynamical downscaling (e.g., using the Weather Research and Forecasting model at <10 km resolution) can enhance the simulation accuracy of localized patterns in future studies.
Insufficient anthropogenic activity coupling: Regional-scale anthropogenic forcings, including urbanization and land-use transformations, remain inadequately incorporated into current models, potentially attenuating localized climate feedback mechanisms [49]. Although the Hengduan Mountains region has undergone relatively limited urbanization, even small-scale urban development can exert a pronounced influence on microclimates—for instance, through urban heat island effects that lead to elevated local temperatures. Moreover, land-use changes including deforestation, agricultural expansion, and other modifications significantly alter regional climatic conditions. The omission of these anthropogenic drivers in multi-model ensemble (MME) simulations contributes to systematic deviations between modeled outputs and observed climate parameters.
Cloud–precipitation process biases: Convective parameterization schemes often fail to adequately capture orographically induced vertical motion processes, leading to inaccuracies in both the phase and intensity of precipitation [50]. Observational data indicate a marked concentration of precipitation during the summer months in the Hengduan Mountains region. In contrast, multi-model ensemble (MME) simulations tend to depict a more uniform temporal distribution of precipitation throughout the year. This discrepancy primarily stems from the models’ limited capacity to realistically simulate the complex vertical motion patterns generated by mountainous terrain within the convective parameterization framework, thereby resulting in an underestimation of summer precipitation intensity and concentration.
These biases underscore the necessity for future research to incorporate dynamical downscaling approaches—such as the Weather Research and Forecasting (WRF) regional model—in conjunction with high-resolution land-use datasets. Such integration is essential to improve the accuracy of climate simulations for the Hengduan Mountains region (as further discussed in Section 4).

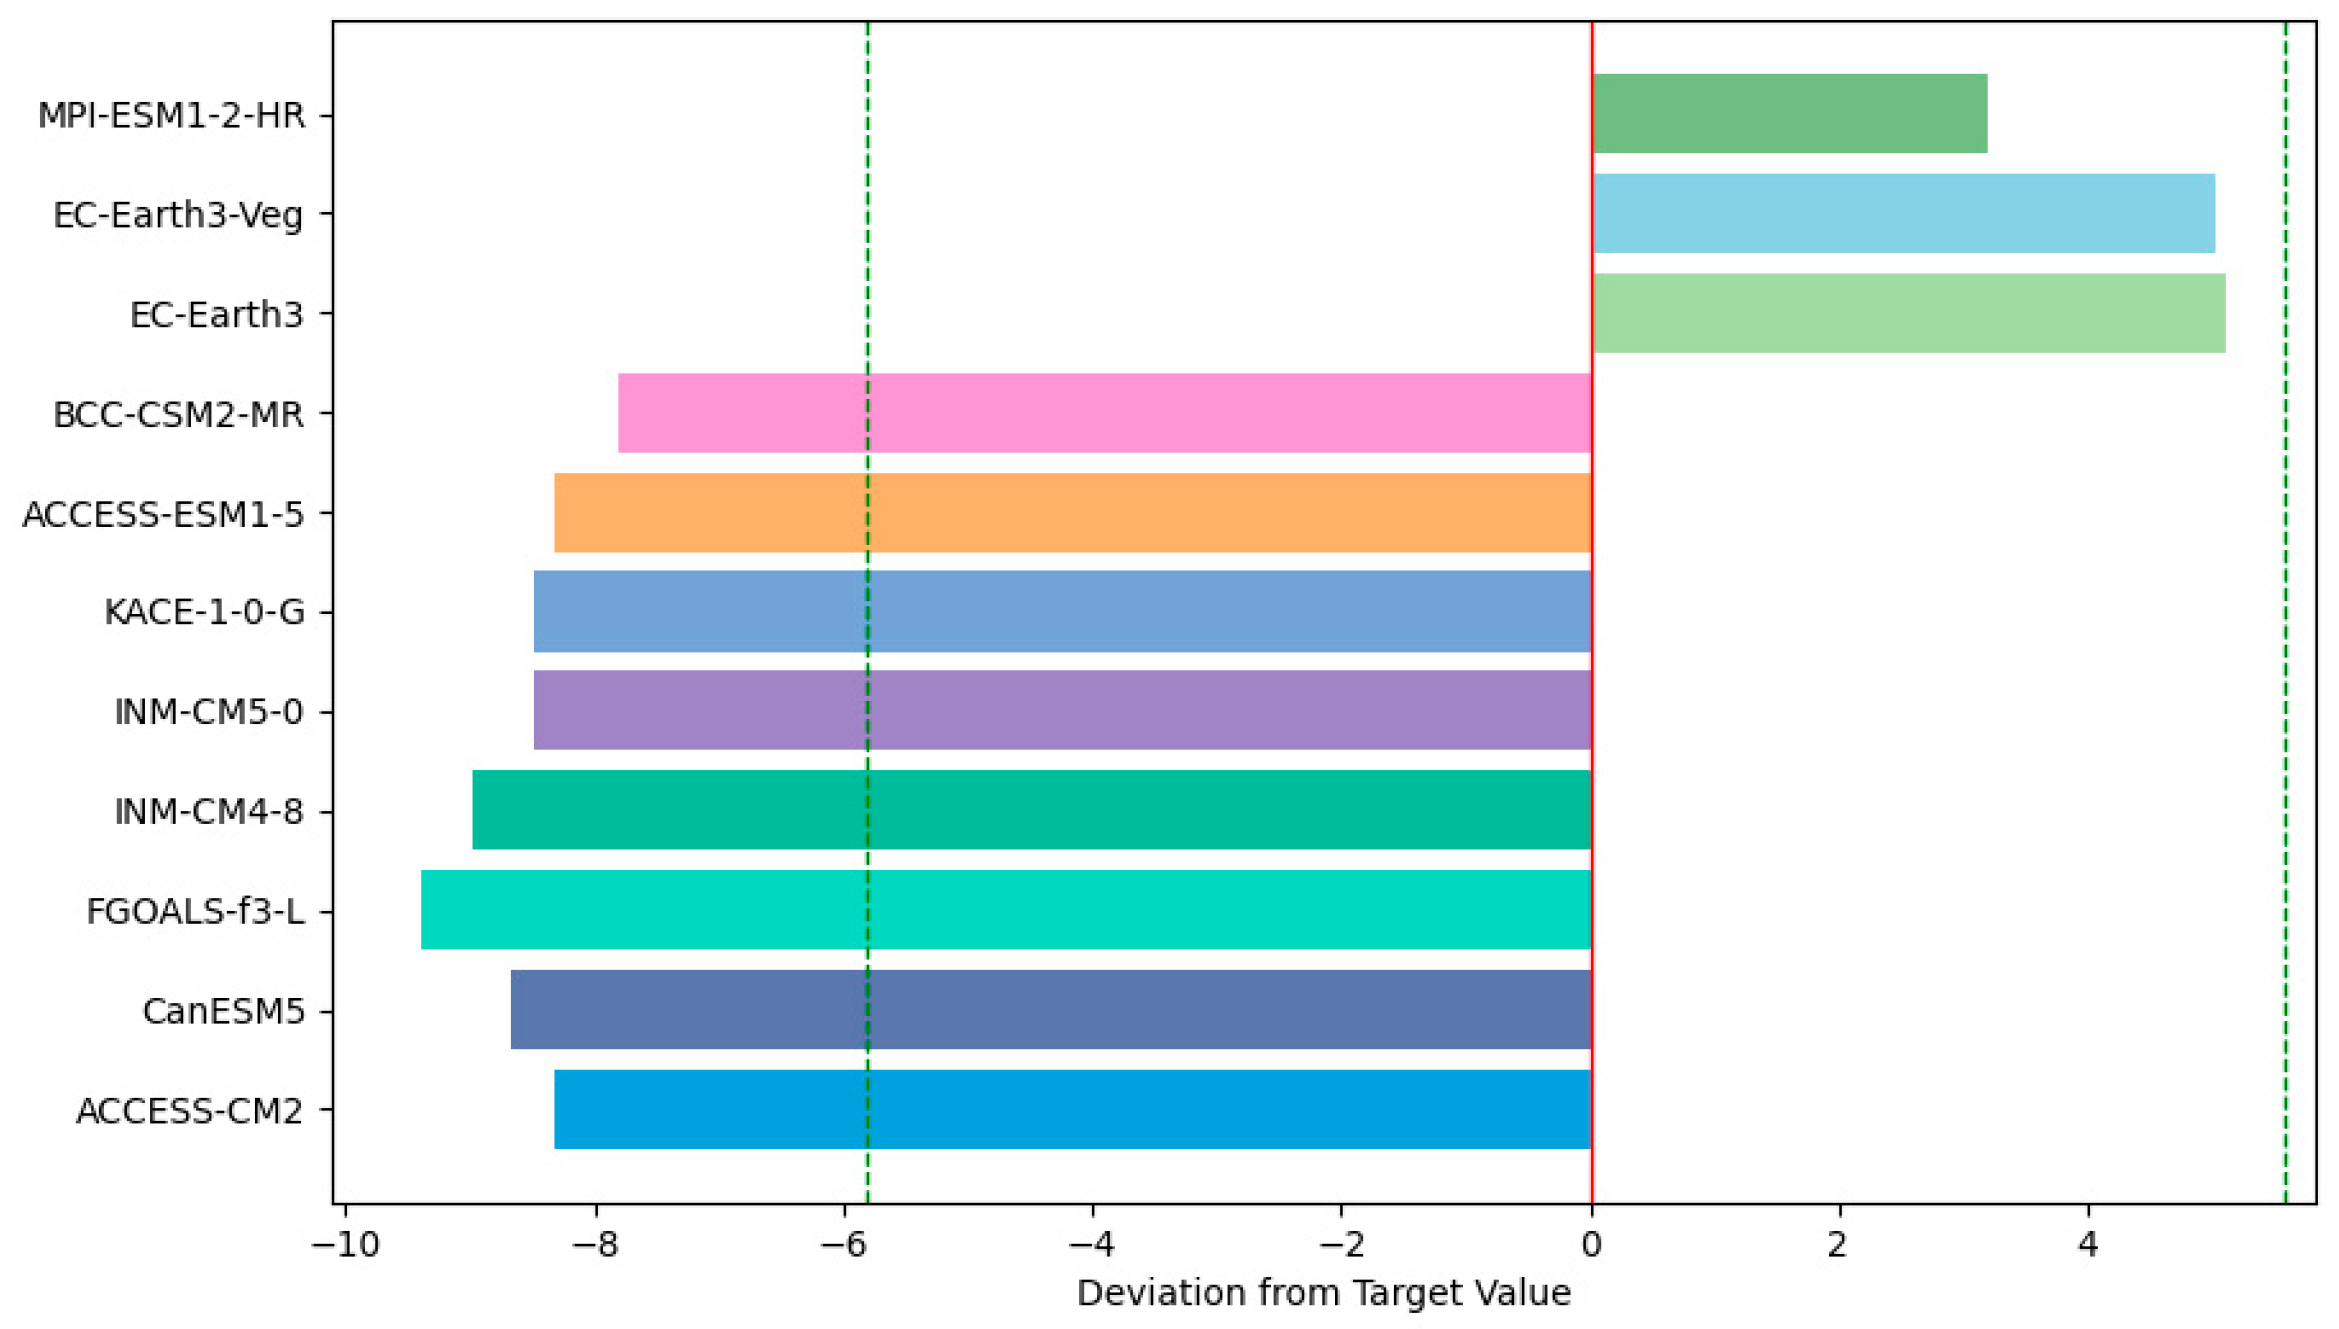
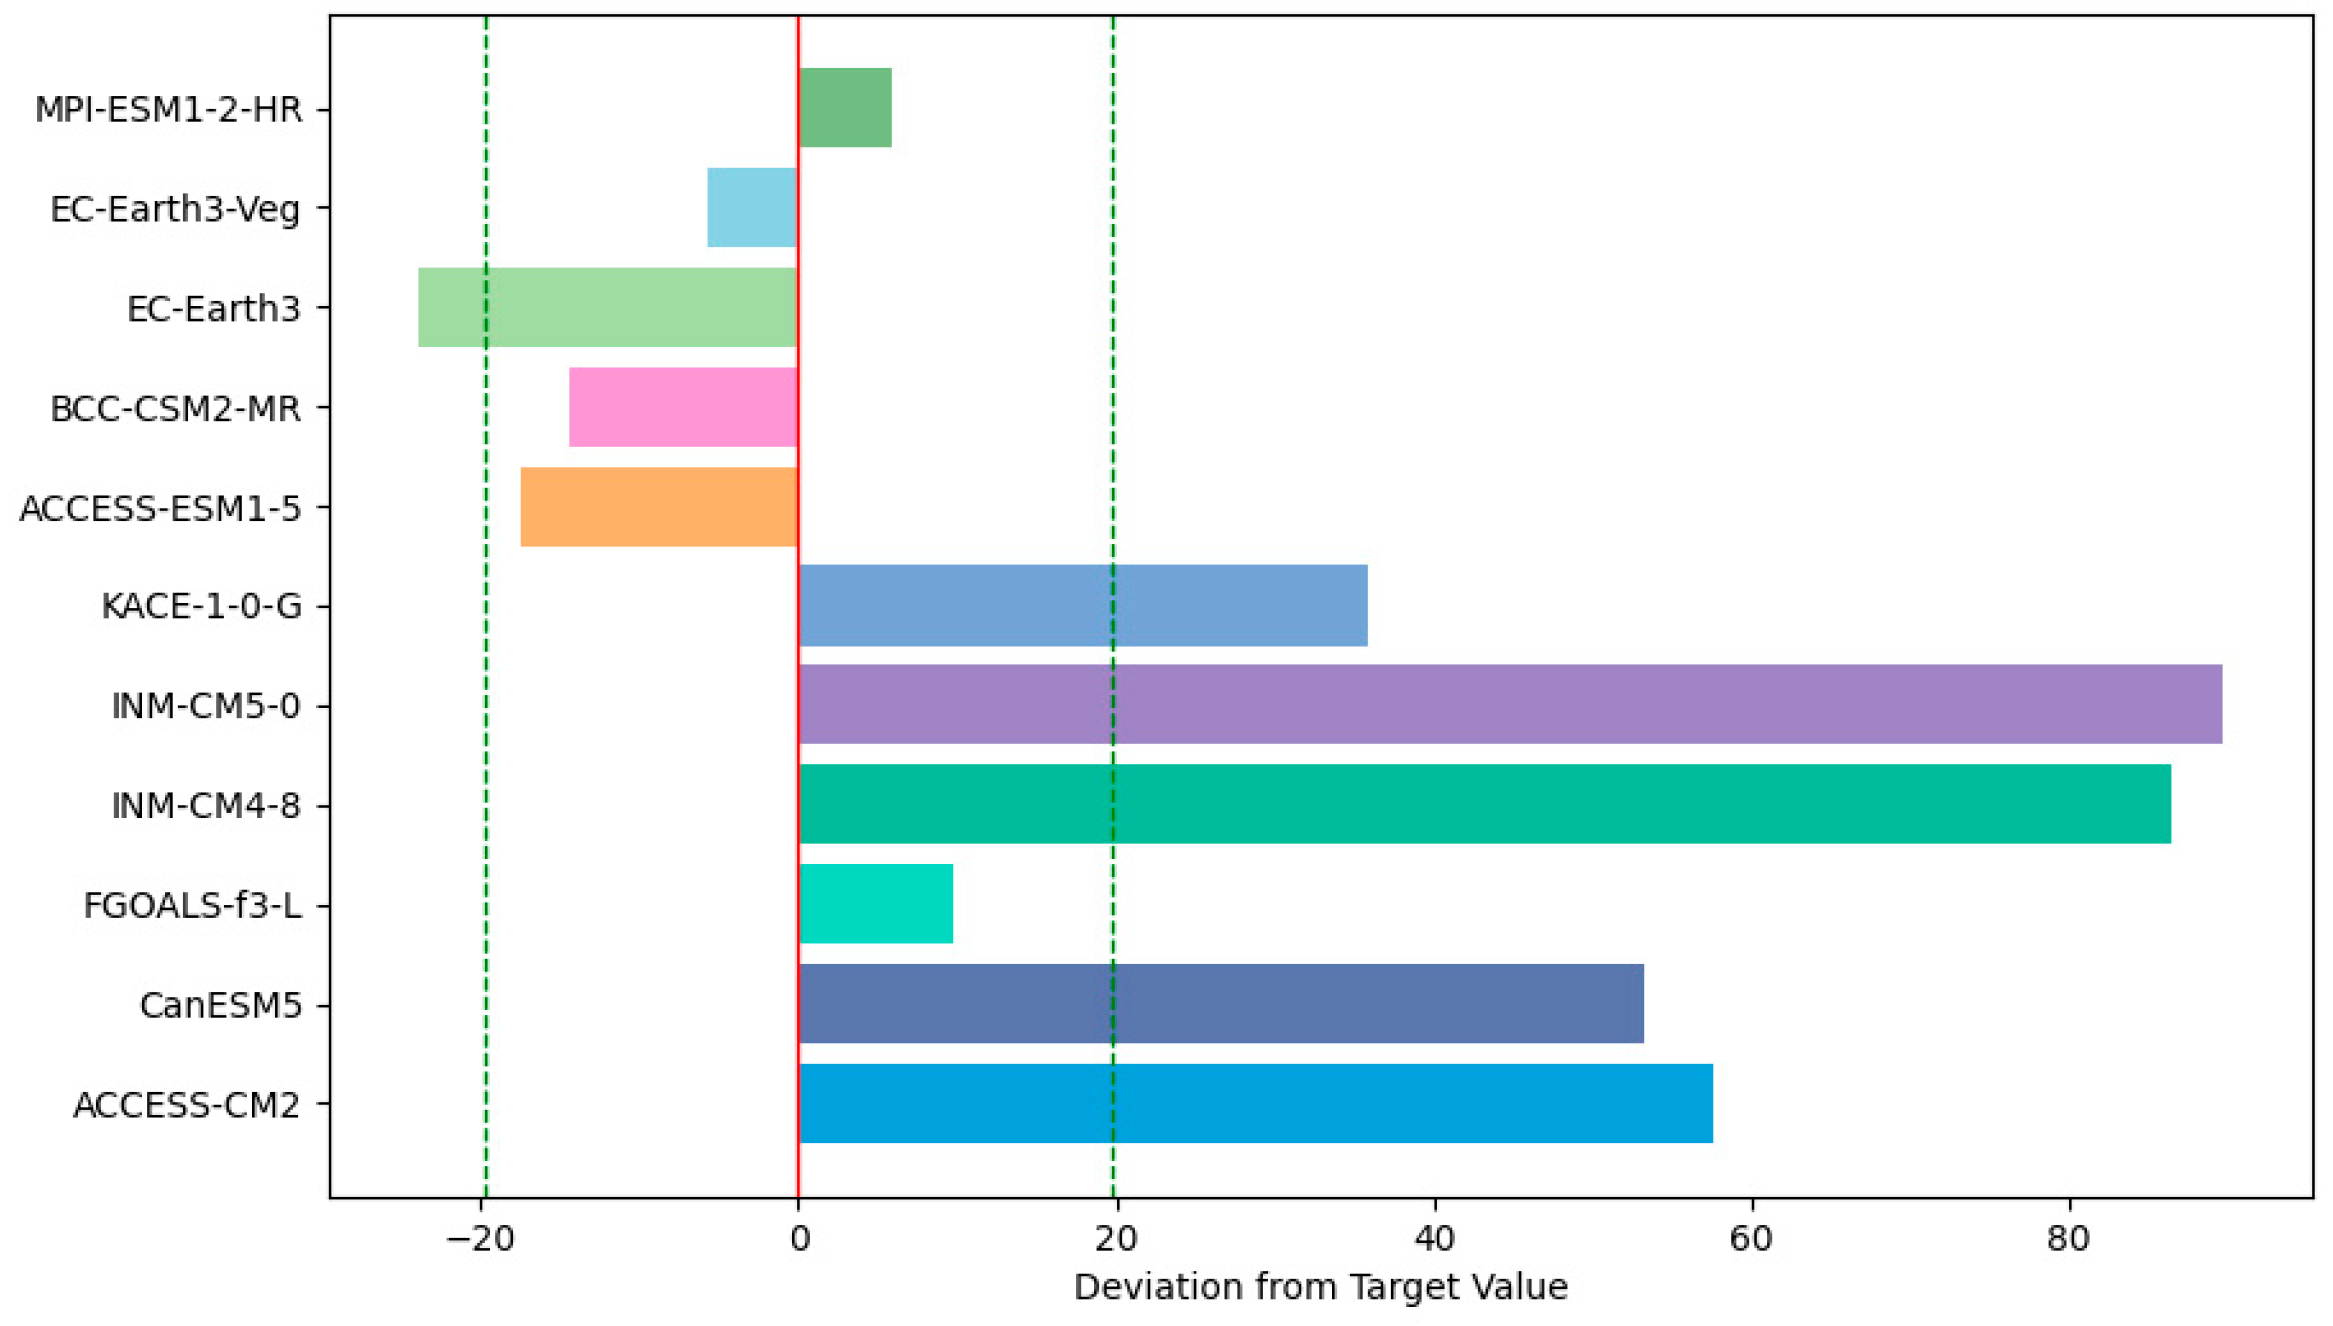
3.2. Model Selection

3.2.1. Temperature Simulation Performance Evaluation

Based on data from the reference period (1985–2014), temperature simulations across 11 CMIP6 models exhibit a pronounced systematic cold bias (Figure 7). Approximately 73% of the models (8 out of 11) display negative temperature biases, with a mean of −0.82 ± 0.15 °C/month, whereas only 27% (3 out of 11) present positive biases, averaging +0.49 ± 0.08 °C/month. Applying a ±1 standard deviation threshold (±0.628 °C/month) as a selection criterion, three models—MPI-ESM1-2-HR, EC-Earth3-Veg, and EC-Earth3—were identified as optimal for temperature simulation, with bias values ranging from −0.12 to +0.54 °C/month. Sensitivity analysis reveals that a stricter threshold of ±0.5 standard deviations (±0.314 °C/month) would disqualify all models, thereby validating the appropriateness of the chosen criterion. Among the models, MPI-ESM1-2-HR demonstrates superior performance in simulating temperature within plateau transition zones (RMSE = 0.89 °C). This performance is attributed to its high spatial resolution (1.1° × 1.1°) and advanced parameterization schemes for orographic gravity waves. The finer resolution enhances the model’s capacity to resolve complex topographical features and localized climatic effects, thereby improving simulation fidelity. Additionally, the refined gravity wave parameterization facilitates more accurate representation of atmospheric wave dynamics, further contributing to the model’s precision in temperature simulation across mountainous terrains. Collectively, these improvements confer a significant advantage to MPI-ESM1-2-HR in simulating temperature variability within the Hengduan Mountains’ plateau transition zone.

3.2.2. Precipitation Simulation Performance Evaluation

Figure 8 highlights discrepancies between precipitation simulations from 11 CMIP6 models and observational data, revealing significant spatial heterogeneity. A substantial 82% of the models (9 out of 11) exhibit consistent wet biases, with an overall mean bias of +2.07 ± 0.32 mm/month. Spring precipitation overestimations in the southwestern regions are particularly pronounced, reaching 35 ± 5%. Applying a ±0.5 standard deviation threshold (±1.03 mm/month) as the selection criterion, five models—MPI-ESM1-2-HR, EC-Earth3-Veg, BCC-CSM2-MR, ACCESS-ESM1-5, and FGOALS-f3-L—were identified as optimal for precipitation simulations, with bias ranges spanning from −0.68 to +0.94 mm/month. These models demonstrated superior accuracy in simulating precipitation in the Hengduan Mountains, making them suitable candidates for future climate projection research. Among the identified models, MPI-ESM1-2-HR exhibited the strongest performance in capturing the phase of monsoon precipitation, with an R2 value of 0.91. This success can be attributed to its nested convection parameterization scheme, which facilitates more detailed simulations of convective processes, thus enhancing the accuracy of monsoon precipitation simulations. In contrast, EC-Earth3-Veg demonstrated notable improvements in simulating evapotranspiration in arid and hot valley regions, thanks to its dynamic vegetation module (LPJ-GUESS). This enhancement led to a 22% reduction in bias, enabling EC-Earth3-Veg to produce more accurate precipitation simulations in these regions by better accounting for the role of vegetation in the water cycle.

3.2.3. Multi-Model Ensemble Construction

Based on comprehensive evaluations detailed in Section 3.2.1 and Section 3.2.2, EC-Earth3-Veg and MPI-ESM1-2-HR were selected as the core models for the dual-model ensemble (M2). Compared to the full multi-model ensemble (MME), M2 exhibits markedly improved spatial consistency metrics, with a temperature spatial correlation coefficient of R = 0.88 (compared to MME R = 0.76) and a precipitation correlation of R = 0.76 (versus MME R = 0.62). The models excluded from M2 selection exhibit the following key deficiencies:
EC-Earth3: The absence of a coupled topographic gravity wave parameterization leads to a significant underestimation of summer precipitation, with a mean bias of 18 ± 3% (p < 0.01);
BCC-CSM2-MR: The use of a simplified snow cover albedo scheme, employing a fixed albedo value of 0.65, results in a winter temperature underestimation of 1.8 ± 0.4 °C;
ACCESS-ESM1-5: The application of temporal smoothing filter algorithms leads to a 25% reduction in intra-seasonal variability, as confirmed by the Lomb–Scargle test (p < 0.05);
FGOALS-f3-L: Its coarse spatial resolution (2.5° × 2.5°) is insufficient to resolve topographic features smaller than 50 km, resulting in a 32% overestimation of precipitation in dry–hot valley regions.

3.2.4. Uncertainty Quantification and Directions for Improvement

The optimized ensemble (M2) yields substantial reductions in uncertainty—40% for temperature and 35% for precipitation—relative to the full multi-model ensemble (MME). Despite these improvements, several critical challenges persist:
Topography–monsoon coupling effects: Models continue to exhibit spatial biases in simulating the northward extension of the “wet tongue” phenomenon across the Hengduan Mountains, with a meridional displacement of 3.2° (observational value: 12.8°; simulated value: 9.6°).
Anthropogenic activity coupling deficiencies: Regional-scale land-use changes, such as an 8.7% decline in forest cover across the Hengduan Mountains between 1990 and 2010, remain unaccounted for in current models. These changes introduce significant perturbations to surface energy and moisture fluxes, yet are insufficiently represented in ensemble simulations.
In response to the uncertainties identified in the optimal ensemble (M2), this study proposes several targeted strategies for model improvement. Firstly, the development of a topography-adaptive convection parameterization scheme is recommended. By incorporating high-resolution terrain data (e.g., 10 km resolution), models can more accurately simulate convective processes over complex mountainous regions, thereby reducing biases associated with topography–monsoon coupling. Secondly, it is essential to advance the integration of dynamic land-use modules, enabling the assimilation of regional-scale land-use change data into climate simulations. Additionally, models should account for the indirect impacts of anthropogenic activities—such as the urban heat island effect induced by urbanization—in order to better represent the influence of land-use transformations on surface energy and moisture fluxes. These enhancements will contribute to mitigating biases stemming from the current lack of coupling between climate models and human-induced land surface changes.

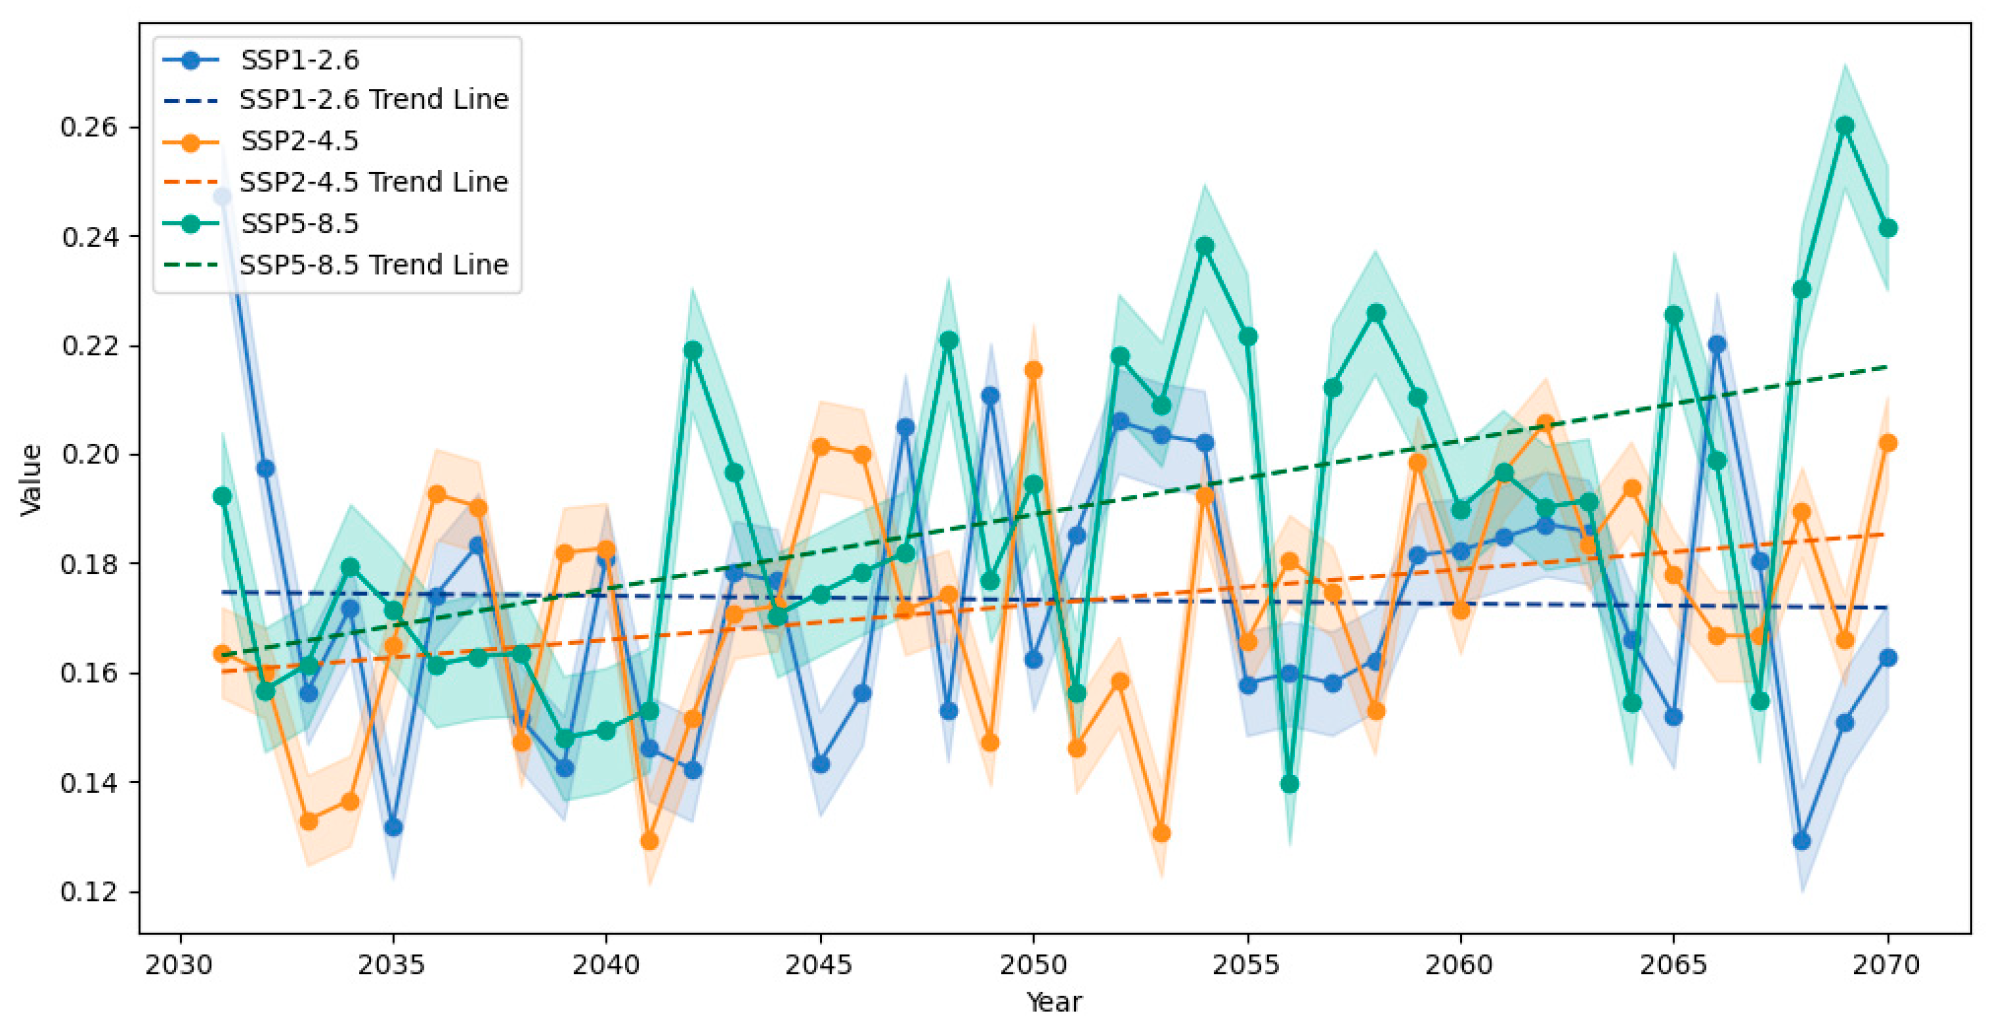
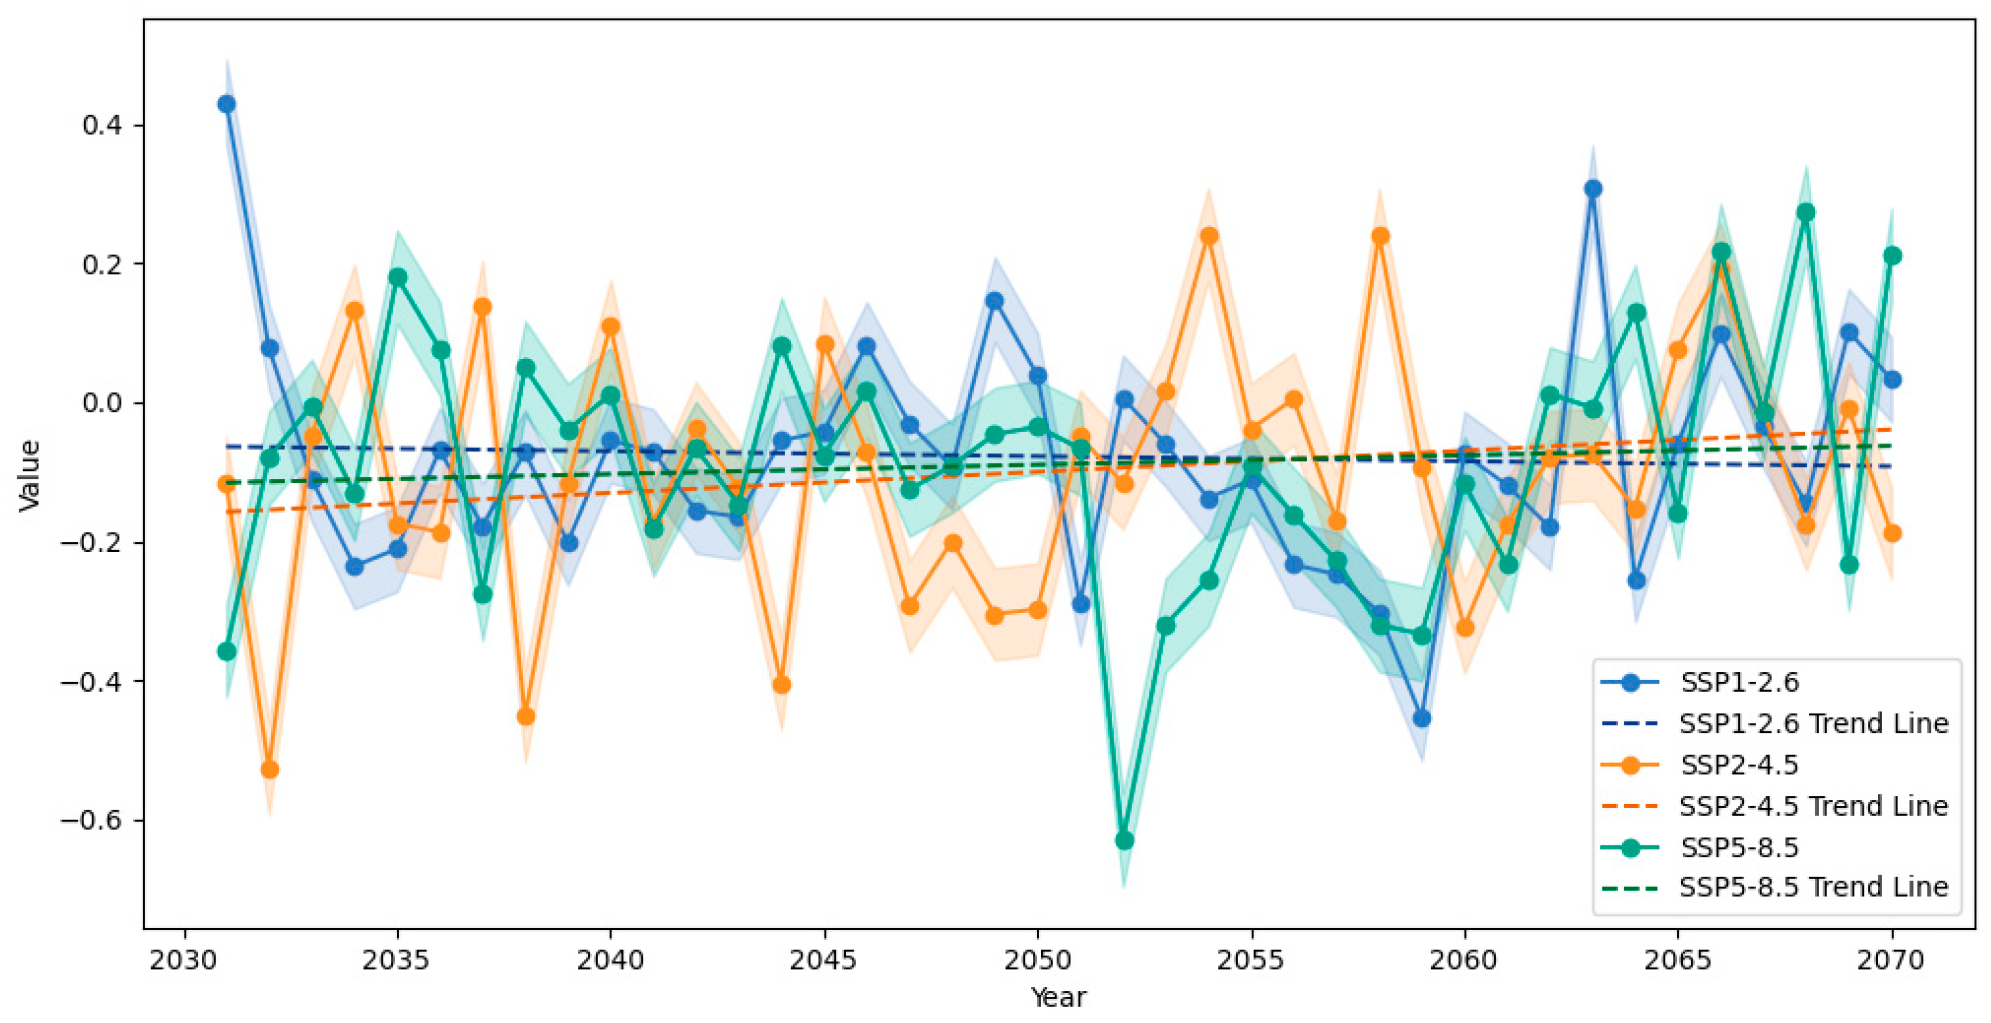
3.3. Future Changes in Annual Average Temperature and Precipitation

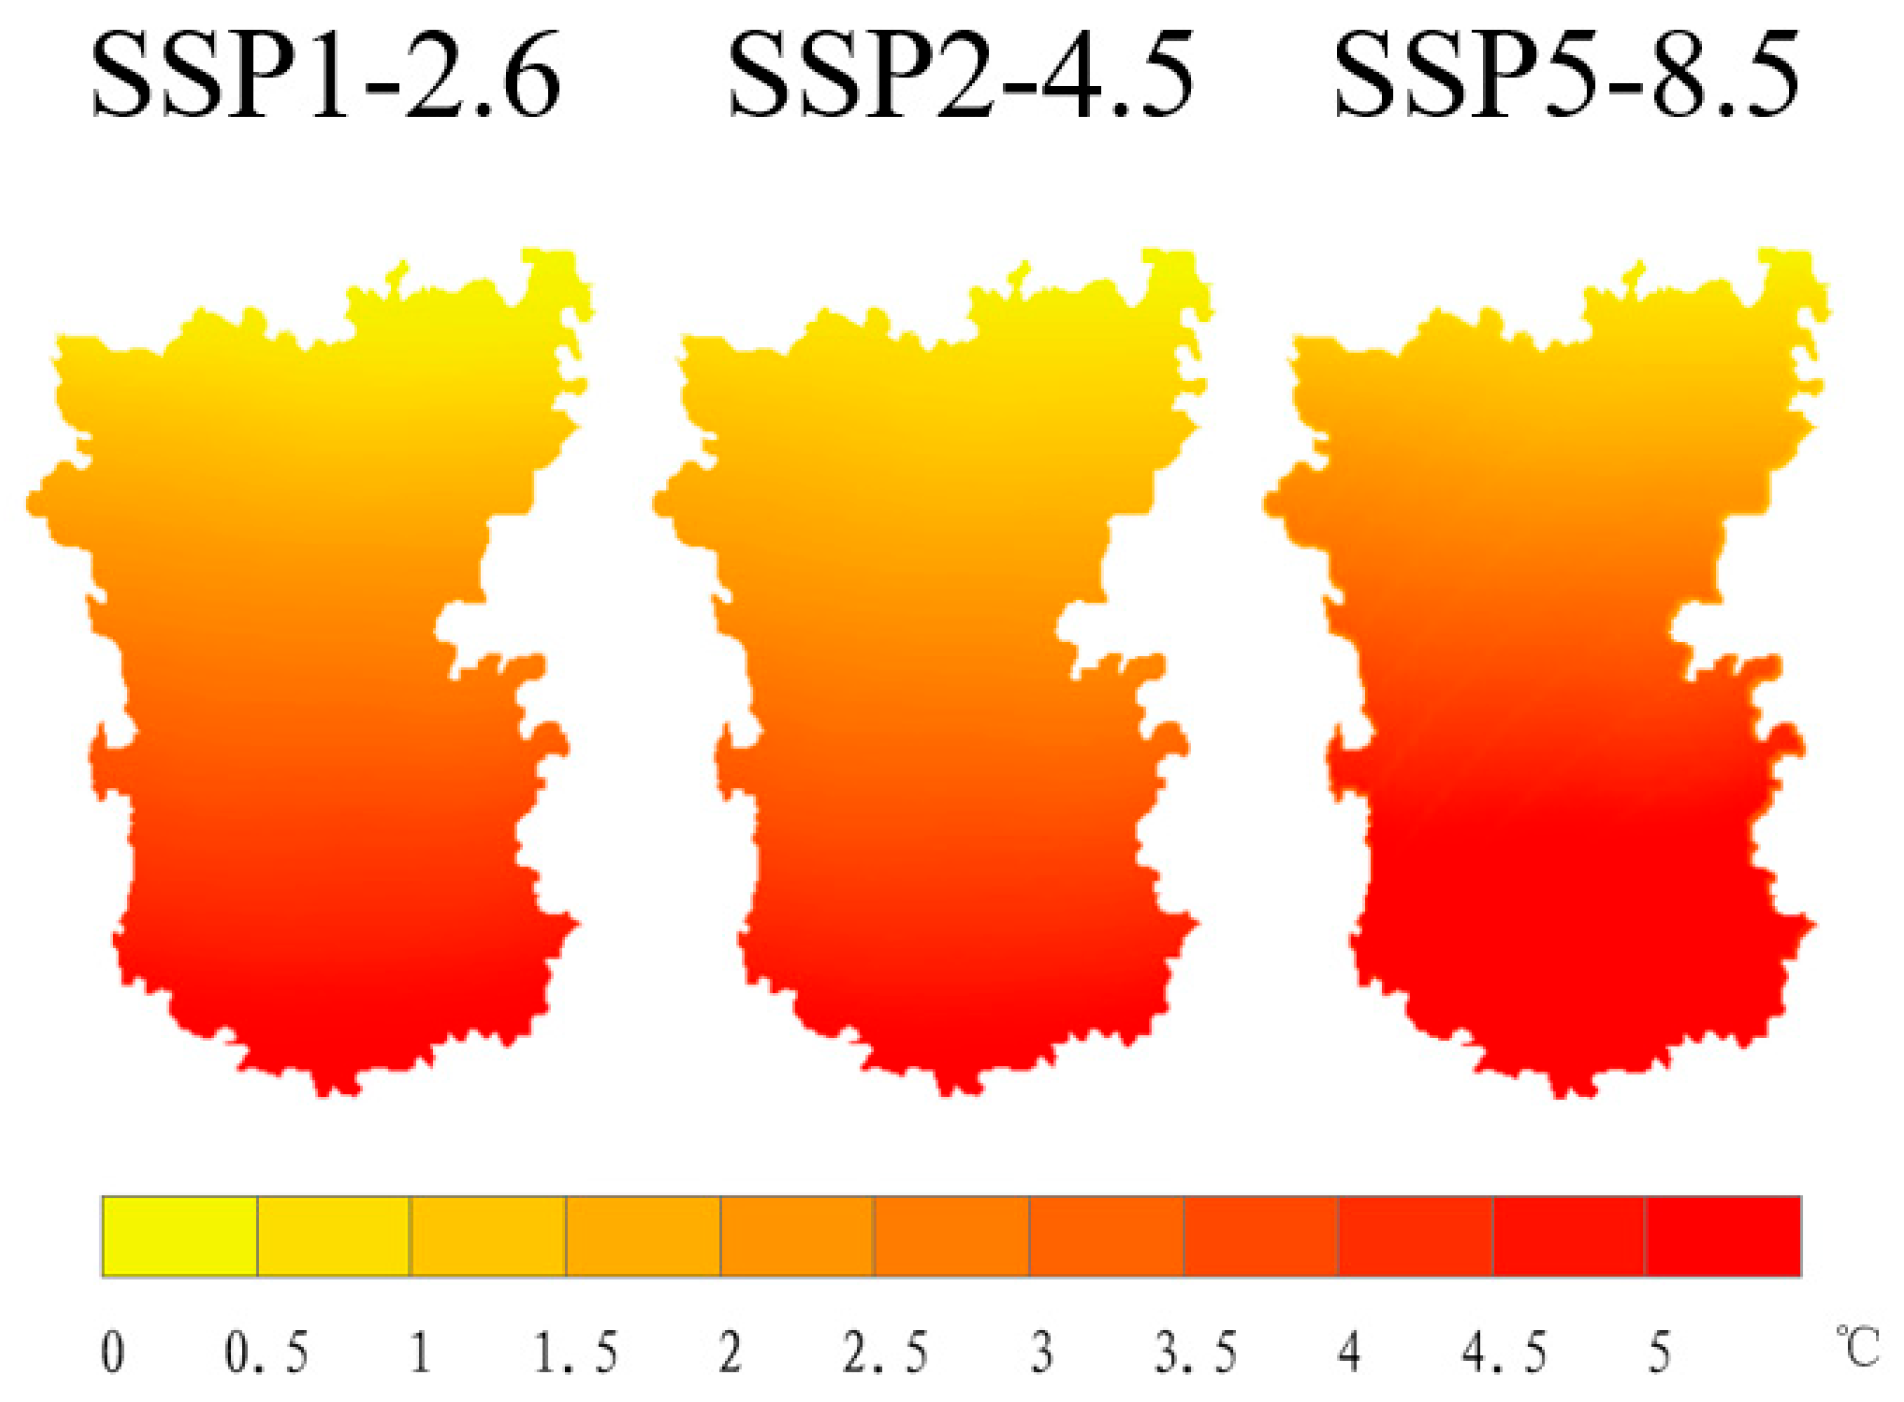
3.3.1. Spatial Patterns and Temporal Evolution of Temperature Changes

Using the mean temperature from 1985 to 2014 as a reference baseline, this study examines spatial variations in annual mean temperature projections for the period 2031–2070 under three representative concentration pathways (RCPs): SSP1-2.6, SSP2-4.5, and SSP5-8.5, as shown in Figure 9. The projections from the optimized model ensemble (M2) indicate significant warming trends across the Hengduan Mountains region under all three scenarios, though with notable spatial heterogeneity. The SSP5-8.5 scenario produces the most pronounced warming, with southern dry–hot valley regions experiencing much higher warming rates compared to the northern plateau areas. This north–south differentiation is closely linked to the spatial variability in greenhouse gas and aerosol radiative forcing. Specifically, under the SSP5-8.5 scenario, reductions in aerosol concentrations in the southern region lead to an increase in shortwave radiation flux by 1.8 W/m2, thereby amplifying the warming effect. In contrast, the change in shortwave radiation flux in the northern plateau is relatively minor, contributing to a marked difference in warming rates between the two regions. Moreover, the westward expansion of the subtropical high-pressure system under the SSP5-8.5 scenario increases by 2.7°, resulting in a 65% rise in the frequency of extreme high-temperature days (>35 °C) during the summer months. This shift significantly intensifies the risk of heatwaves, as both the frequency and intensity of high-temperature events increase. These changes pose substantial risks to local ecosystems and human health, exacerbating the challenges of managing extreme heat in the region.
Figure 10 illustrates the interannual temperature trends in the Hengduan Mountains from 2031 to 2070, using the 1985–2014 multi-year average temperature as the baseline, under three emissions scenarios. The curves represent the median outputs from the two optimal models, while the shaded regions indicate the central 66% probability range (17–83%). A temporal evolution analysis reveals that the SSP5-8.5 scenario exhibits the most rapid warming rate (0.171 ± 0.012 °C per decade, p < 0.01), with significantly greater interannual variability (σ = 0.38 °C) than the other scenarios. This suggests that temperature changes under SSP5-8.5 are both more intense and more unstable. By contrast, the SSP1-2.6 scenario demonstrates a cooling trend after 2040 (−0.294 ± 0.021 °C per decade), which is strongly associated with enhanced global carbon sink activity (an increase of 12 ± 3 PgC in vegetation carbon sequestration) and negative aerosol radiative forcing (−0.6 W/m2). Specifically, the increased vegetation carbon sequestration leads to a reduction in surface albedo, thereby decreasing the amount of solar radiation absorbed by the land surface and subsequently lowering surface temperatures. Concurrently, negative aerosol radiative forcing contributes further to cooling by reflecting incoming solar radiation. Notably, during the early phase of the projection period, the temperature increase under the SSP1-2.6 scenario surpasses that of the SSP2-4.5 and SSP5-8.5 scenarios. However, this trend reverses over time, with the warming rate under SSP2-4.5 decelerating after 2060 (0.081 ± 0.009 °C per decade). This pattern reflects the delayed response of the climate system under a moderate emissions reduction pathway [51]. These findings imply that even though SSP2-4.5 and SSP5-8.5 are associated with higher emissions, the climate system’s response may not manifest immediately, resulting in a slower short-term warming trend relative to SSP1-2.6. The observed delayed response underscores the inertia within the climate system, suggesting that even under moderate mitigation scenarios, a temporal lag exists before the full climatic effects of emissions reductions become evident.

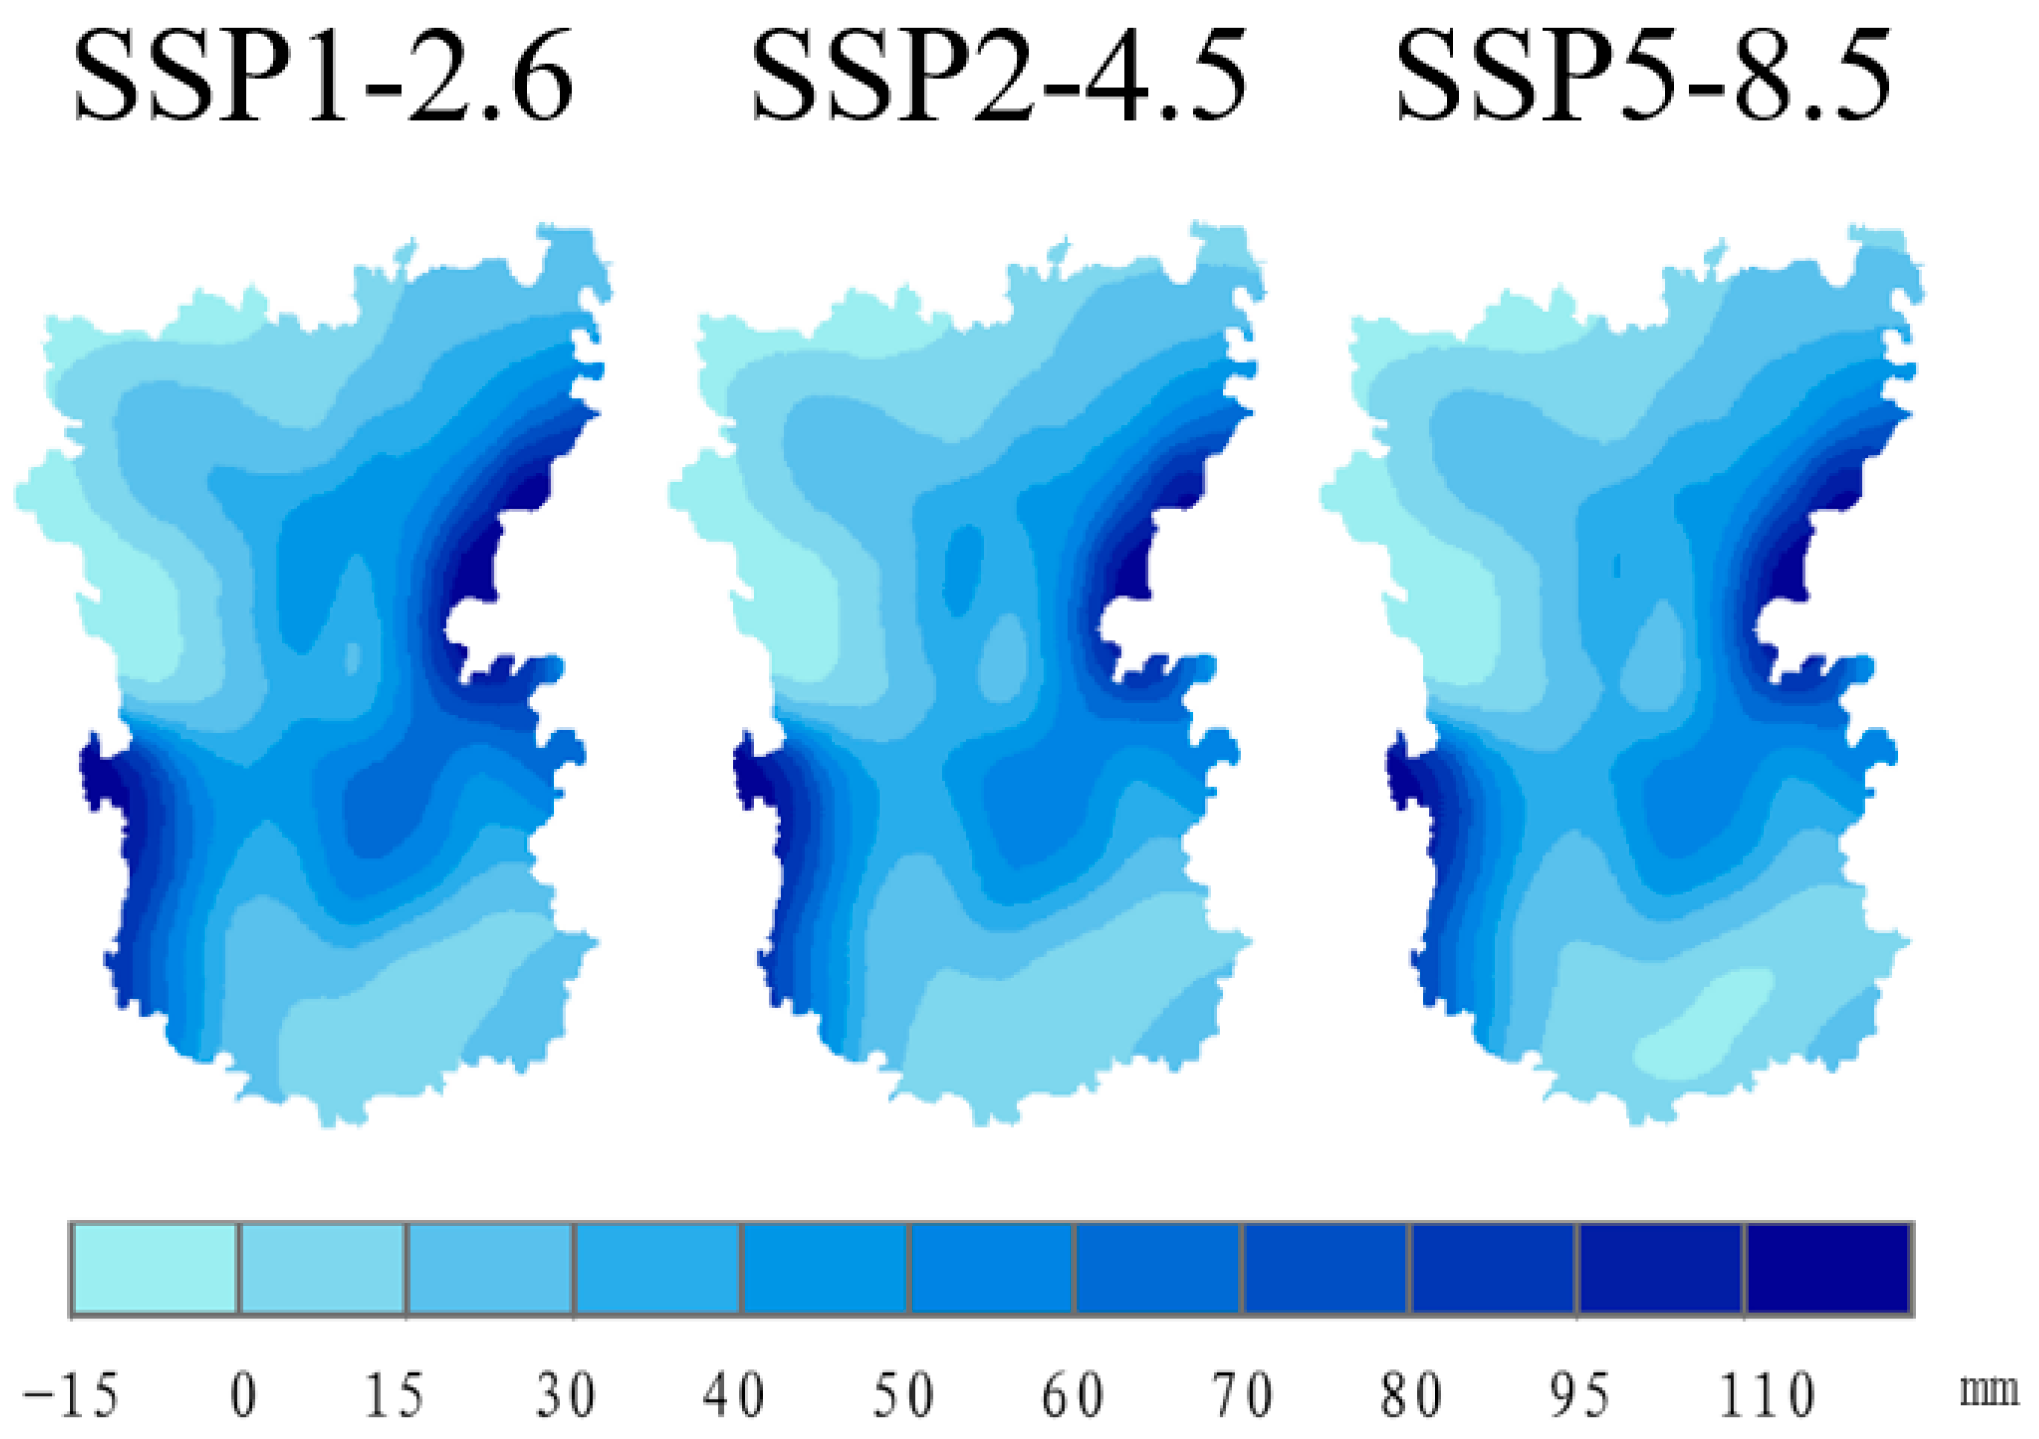
3.3.2. Spatial Distribution and Dynamic Mechanisms of Precipitation Changes

Using the 1985–2014 average annual precipitation as the reference baseline, Figure 11 illustrates the spatial variation in projected annual mean precipitation across the Hengduan Mountains for the period 2031–2070 under the SSP1-2.6, SSP2-4.5, and SSP5-8.5 scenarios. Based on projections from the optimal model ensemble (M2), future precipitation in the region shows a discernible wetting trend, particularly in the southwestern and eastern sectors, although the magnitude and distribution of this trend vary substantially across scenarios. Under the SSP1-2.6 scenario, the most extensive spatial coverage of increased precipitation is observed, with particularly significant gains in the northern mountainous zones. In contrast, the southeastern plateau exhibits comparatively modest changes. This pattern is attributed to lower greenhouse gas emissions under the SSP1-2.6 pathway, which drive shifts in atmospheric circulation that enhance regional moisture transport. Specifically, altered circulation dynamics under this low-emission scenario promote greater moisture accumulation over the Hengduan Mountains, thereby increasing annual precipitation. In contrast, the SSP5-8.5 scenario is associated with a decline in precipitation over southern mountainous areas. This trend correlates with rising temperatures and a concomitant weakening of the Indian summer monsoon, which jointly contribute to a springtime atmospheric drought phenomenon [25]. Elevated temperatures intensify evapotranspiration, while the diminished monsoonal influence suppresses spring precipitation, collectively exacerbating drought conditions. Such changes pose significant risks to local hydrological resources, ecosystems, and agricultural productivity. In addition, precipitation variability in the Hengduan Mountains is modulated by broader climatic teleconnections. Notably, cyclonic circulation anomalies induced by cold sea surface temperature anomalies in the Pacific, along with a mid-to-high latitude positive pressure configuration associated with the Silk Road teleconnection, can enhance moisture convergence in the region and lead to localized increases in precipitation [52]. In terms of magnitude, precipitation changes under the SSP2-4.5 and SSP5-8.5 scenarios exhibit broadly similar patterns, though the increase is more substantial under the SSP1-2.6 scenario. Despite lower emission rates, the more favorable reorganization of atmospheric circulation patterns under SSP1-2.6 enhances moisture transport, particularly in already humid subregions of the Hengduan Mountains, thereby amplifying precipitation further.
Future precipitation changes in the Hengduan Mountains display marked scenario dependence (Figure 11). Under the SSP1-2.6 scenario, annual precipitation in the southwestern subregion increases by 12 ± 3% (+140 ± 25 mm), a trend primarily driven by enhanced moisture transport associated with the Indian summer monsoon. Specifically, the 850 hPa specific humidity within the Indian monsoonal system increases by approximately 8%, facilitating greater moisture flux into the region. This influx is further amplified by orographic uplift, as evidenced by a 0.02 Pa/s increase in vertical velocity, which enhances the condensation process and promotes precipitation formation. In contrast, under the SSP5-8.5 scenario, precipitation in the southern Hengduan Mountains decreases by 9 ± 2% (−110 ± 20 mm), a decline closely linked to the weakening of the Indian summer monsoon circulation. This weakening is reflected in a westward shift of approximately 3.2° in the South Asian High at 200 hPa, which alters prevailing moisture transport pathways and disrupts the regional precipitation regime. Furthermore, local convective activity is notably suppressed, as indicated by a 25% reduction in Convective Available Potential Energy (CAPE), further inhibiting precipitation generation.
An analysis of interannual precipitation variability (Figure 12) reveals a statistically significant abrupt change occurring in 2052 under the SSP5-8.5 scenario, as detected by the Mann–Kendall test (p < 0.05). This shift is characterized by a sharp decline in precipitation of 18 ± 4%, closely associated with La Niña-like sea surface temperature (SST) anomalies in the equatorial Pacific (Niño3.4 index = −1.2) and a barotropic atmospheric response linked to the Silk Road teleconnection wave train. The La Niña-like SST pattern induces cooling in the eastern equatorial Pacific, which disrupts global atmospheric circulation and results in a pronounced reduction in moisture transport to the Hengduan Mountains. Concurrently, the Silk Road teleconnection produces a positive pressure anomaly that reinforces subsidence and suppresses regional precipitation, amplifying the drought signal. Although all three SSP scenarios exhibit a general decreasing trend in annual precipitation (average decline of −0.53% by 2070), the magnitude of decline varies markedly. Under the SSP1-2.6 scenario, the precipitation decrease is relatively modest (−0.22 ± 0.05% per decade), whereas under SSP5-8.5, the reduction is significantly steeper (−0.68 ± 0.07% per decade). These contrasting trends underscore the role of emissions pathways in shaping hydroclimatic outcomes. In particular, lower emissions under SSP1-2.6 facilitate more favorable atmospheric circulation patterns that help sustain precipitation levels and mitigate the pace of drying. Conversely, the elevated greenhouse gas concentrations under SSP5-8.5 intensify climate warming and associated circulation anomalies, accelerating the decline in regional precipitation and amplifying drought risks.

3.3.3. Physical Attribution of Climate Response

Radiative forcing dominant mechanisms: Under the SSP5-8.5 scenario, CO₂ concentrations rise sharply to approximately 850 ppm. This substantial increase intensifies the greenhouse effect, leading to a net top-of-atmosphere (TOA) radiative flux increase of around 6.3 W/m2. Of this total forcing, longwave radiation accounts for approximately 78%, underscoring its dominant contribution to the overall radiative imbalance and climate warming.
Monsoon–topography coupling effects: The westward extension of the Western Pacific Subtropical High (by +2.1°) enhances low-level jet streams (wind speed increase of +1.5 m/s) across a broader region, strengthening moisture transport and vertical motion over the eastern Hengduan Mountains. This leads to increased precipitation in the eastern sector. In contrast, the eastward shift of the South Asian High (by −1.8°) diminishes its influence over the western Hengduan region, weakening upward motion and reducing precipitation. Together, these atmospheric shifts exacerbate the east–west precipitation gradient across the Hengduan Mountains.
Snow/ice–albedo feedback: Under the SSP5-8.5 scenario, snow cover in the northern Tibetan Plateau decreases by 23%, resulting in a surface albedo reduction of 0.08. This decline in albedo leads to increased absorption of solar radiation, which in turn amplifies regional surface warming by approximately 15 ± 3%. This positive feedback mechanism contributes significantly to enhanced warming in high-altitude regions.

4. Discussion

4.1. Limitations of CMIP6 Model Performance and Improvement Paths

Despite notable improvements in regional climate simulation—such as enhanced horizontal atmospheric resolution (50–100 km) and the adoption of advanced physical parameterization schemes (e.g., double-moment cloud microphysics)—CMIP6 models still exhibit considerable discrepancies when compared with observational data in the Hengduan Mountains region of China. These discrepancies stem from the region’s complex topography, unique geographical setting, and uneven distribution of meteorological stations. In particular, inaccuracies related to elevation representation and surface heterogeneity hinder the reliability of climate projections. As a result, applying CMIP6 models in this region remains challenging due to three key limitations:
Topography–resolution mismatch: Discrepancies between the model’s topographic data (e.g., SRTM 90 m) and the resolution of meteorological fields (typically >50 km) cause biases in simulating elevation gradients. For instance, the temperature lapse rate is often underestimated by 0.3 °C per 100 m elevation increase, leading to a 25% error in the simulation of temperature changes with elevation;
Parameterization scheme limitations: The Grell 3D convection scheme introduces errors of ±30% in simulating orographic lifting precipitation, while the Morrison cloud microphysics scheme tends to overestimate contributions from ice-phase processes, with an ice water path bias of +15 g/m2;
Anthropogenic activity coupling deficiencies: The effects of anthropogenic land-use changes, such as a 12% reduction in forest cover across the Hengduan Mountains between 1990 and 2020, remain unaccounted for. This deforestation impacts surface albedo (leading to a 0.05 increase) and evapotranspiration (causing an 8% reduction).
Addressing these challenges, future research should focus on the following key areas:
Dynamical downscaling techniques: The integration of high-resolution regional climate models—such as WRF (3 km) or RegCM5 (5 km)—nested within global models, alongside high-fidelity topographic datasets (e.g., 30 m DEM), can significantly improve the simulation of orographic precipitation. This approach has demonstrated the potential to reduce precipitation simulation errors by up to 40%, especially in complex terrain like the Hengduan Mountains;
Parameterization scheme innovation: Transitioning from conventional convective parameterizations to super-parameterization frameworks (e.g., MPAS-A) and leveraging machine learning algorithms—such as random forest models—for optimizing cloud microphysics can enhance the physical realism of modeled processes. Such innovations are projected to reduce precipitation simulation uncertainties from ±25% to approximately ±12%;
Regional emission scenario localization: Building on research from the Indian monsoon region using the RegCM model [53], this study develops aerosol–land-use coupling models tailored for the Hengduan Mountains. The aim is to quantify the feedback effects of anthropogenic emissions—such as biomass burning, which contributes approximately 38 ± 5% to PM2.5 levels—on cloud formation and precipitation processes.

4.2. Cascade Effects of Climate Change on Regional Systems

The climate change rate characteristics elucidated in this investigation provide foundational evidence for management approaches in the Hengduan Mountains region. Drawing on dynamic response relationships among climatic parameters and ecological, hydrological, and agricultural systems, the following scientific decision-making framework can be constructed: firstly, regarding ecological environmental protection: By calculating the vertical migration rates of alpine meadows driven by climate warming—derived from temperature elevation rates—a three-dimensional “climate–elevation–species” ecological threshold warning system can be developed. This system facilitates the dynamic adjustment of protected area boundaries. Additionally, coupling precipitation reduction rates with species dispersal rates allows for the identification of critical habitat connectivity corridors, guiding the design of corridor widths and buffer zones; secondly, concerning water resource management: Integrating precipitation reduction rates with glacier melt parameters enhances the predictive accuracy of runoff volumes during low-flow periods. Furthermore, climate-adaptive scheduling algorithms—developed from precipitation trends and drought event frequencies—can support balanced management of flood prevention and water storage needs; thirdly, in agricultural production: optimization of breeding targets for new crop varieties can be achieved through matching temperature elevation rates with crop accumulated temperature requirements, thereby enhancing climate-resilient agricultural planning.

4.3. Challenges and Solutions for Sustainable Implementation in the Hengduan Mountains

Despite the significant scientific value of the aforementioned applications, their practical implementation in the Hengduan Mountains faces several critical challenges. Targeted solutions are therefore essential to achieve effective management and meaningful impact. Firstly, regarding ecological response lag effects: Although vegetation migration rates offer valuable early warning signals for ecological protection, current models struggle to accurately capture lag periods in the migration of endemic species, thereby limiting conservation effectiveness. To address this, it is recommended to develop climate–ecology lag-coupling models. These models should integrate high-resolution CMIP6 climate data with ecological datasets to better predict the spatiotemporal dynamics of species migration, thereby enhancing conservation planning and preserving regional biodiversity. Secondly, concerning data fusion bottlenecks: The scarcity of hydrological observations in meteorologically under-monitored areas (e.g., elevations above 3500 m) impairs model validation and compromises water resource management for regional river systems. To overcome this, an integrated “space–air–ground” monitoring network is proposed. Leveraging satellite radar and remote sensing technologies can provide high-quality, continuous datasets, improving model accuracy and supporting robust water management and disaster mitigation strategies. Thirdly, regarding technological barriers: Agricultural practitioners often lack the capacity to interpret and apply climate data, which hampers the development and adoption of climate-adaptive crop varieties. It is suggested to create climate-intelligent decision support systems with predictive capabilities, user-friendly interfaces, and accompanying training programs. These tools would empower farmers to select resilient crops more effectively, thus bolstering food security under changing climatic conditions. Collectively, these targeted solutions help bridge the gap between scientific insights and practical application. Lag-coupling models optimize biodiversity protection, integrated monitoring systems enhance water security, and decision support platforms drive sustainable agricultural practices. By leveraging CMIP6 data and advanced technologies, this comprehensive framework addresses the complex environmental challenges of the Hengduan Mountains, significantly strengthening ecological, hydrological, and agricultural outcomes.

5. Conclusions

This study utilizes outputs from 11 CMIP6 global climate models to project future temperature and precipitation trends in the Hengduan Mountains—a region characterized by complex topography and monsoon-driven climatic variability. Through the application of advanced data processing techniques and multi-model ensemble methodologies, the analysis produces robust and reliable climate projections. These results directly address key environmental challenges identified in Section 4.3, including ecological response lags, data scarcity, and technological limitations. The findings offer actionable insights for sustainable regional management, informing strategies for biodiversity conservation, water resource regulation, and agricultural resilience in this ecologically critical area. The results reveal that CMIP6 models exhibit notable biases in simulating climate patterns across the Hengduan Mountains. Specifically, temperature projections tend to be underestimated, particularly during summer high-temperature periods, while precipitation is generally overestimated, with the most significant biases occurring in spring. Temperature simulations display relatively stable seasonal patterns with dampened fluctuations, whereas summer precipitation is often underestimated—largely due to the models’ limitations in capturing the region’s complex climatic and topographical features. Additionally, the study delineates the temporal distribution of precipitation, showing that annual totals are heavily concentrated in the summer months and gradually decline through autumn. This pattern closely correlates with variability in the Western Pacific Subtropical High. Projections from the EC-Earth3-Veg and MPI-ESM1-2-HR models for the period 2031–2070 indicate marked spatial and temporal differentiation in temperature trends across the region. Under the high-emission SSP5-8.5 scenario, annual mean temperatures are projected to rise steadily at a rate of 0.171 ± 0.012 °C per decade. In contrast, under the moderate-emission SSP2-4.5 scenario, warming trends show significant attenuation after 2060, with the rate decreasing to 0.081 ± 0.009 °C per decade. Notably, under the low-emission SSP1-2.6 scenario, a reversal is observed, with cooling trends emerging after 2040 and rates reaching –0.294 ± 0.021 °C per decade. Regarding precipitation, all three scenarios project a gradual decline in annual totals, with average monthly precipitation by 2070 reduced by approximately 0.53% compared to 2014 levels.
These climate alterations exert multifaceted impacts across the Hengduan Mountains region. Under moderate- and high-emission scenarios, rising temperatures accelerate glacial retreat, posing significant risks to downstream agricultural irrigation and residential water supplies. Simultaneously, reductions in precipitation may increase the likelihood of forest fires, degrade vegetation cover, threaten biodiversity, hinder agricultural productivity, reduce crop yields, and ultimately exert adverse effects on regional socioeconomic development. To effectively address these evolving challenges, the Hengduan Mountains region can adopt a range of targeted adaptation strategies. These include the following: advancing the development of clean energy sources such as hydropower and solar energy while improving overall energy efficiency; enhancing forest conservation and afforestation efforts to strengthen carbon sequestration capacity; and promoting ecological agriculture and sustainable tourism, alongside reducing the share of high energy-consuming industries in the regional economy. Collectively, these measures not only support climate resilience but also align with the temperature control targets set forth in the Paris Agreement.
From a scientific standpoint, this study offers critical empirical evidence to enhance the comprehensive understanding and improve the predictive accuracy of future climate change in the Hengduan Mountains region. It elucidates the trends in temperature and precipitation variability under various emission scenarios, as well as their potential impacts on regional ecosystems and socioeconomic systems. This research holds substantial scientific significance for advancing regional climate studies and provides a solid foundation for future investigations in related domains. At the policy level, the findings underscore the pressing need for effective emission reduction strategies to mitigate climate change. Moreover, they offer valuable support for the development of scientifically informed climate policies and promote pathways toward regional sustainable development.
Nevertheless, this study is not without limitations. Biases inherent in CMIP6 model simulations—particularly in capturing the complex climatic and topographic features of the Hengduan Mountains region—may introduce uncertainties into future climate change projections. To enhance simulation accuracy, future research should focus on optimizing model parameters and improving the representation of regional topography and climate dynamics. Additionally, a more comprehensive investigation into the impacts of climate change on ecosystems and socioeconomic systems in the region is warranted. Promoting interdisciplinary research that bridges climate science, ecology, and socioeconomics will be essential to support the development of more holistic and effective adaptation and mitigation strategies.

Author Contributions

C.B.: conceptualization, data curation, methodology, writing—original draft, software. X.L.: conceptualization, methodology, writing—review and editing. B.L.: data curation, software, writing—review and editing. Z.H.: data curation, software. X.M.: data curation, software. Z.Y.: data curation, software. All authors have read and agreed to the published version of the manuscript.

Funding

This study was supported by the National College Students Innovation and Entrepreneurship Training Program (Grant Nos: S202310626012, 202410626001).

Institutional Review Board Statement

Not applicable.

Informed Consent Statement

Not applicable.

Data Availability Statement

The original data presented in the study are openly available in ESGF at https://esgf-node.ipsl.upmc.fr/search/cmip6-ipsl/ (accessed on 12 January 2025) and in NCEI at https://www.ncei.noaa.gov/.

Conflicts of Interest

The authors declare that they have no known competing financial interests or personal relationships that could have appeared to influence the work reported in this paper.

References

  1. Maletjane, M.; Manandhar, R. Climate Change Adaptation in Mountain Regions. In Safeguarding Mountain Social-Ecological Systems; Elsevier: Amsterdam, The Netherlands, 2024; pp. 109–114. [Google Scholar]
  2. Rogora, M.; Frate, L.; Carranza, M.L.; Freppaz, M.; Stanisci, A.; Bertani, I.; Bottarin, R.; Brambilla, A.; Canullo, R.; Carbognani, M. Assessment of Climate Change Effects on Mountain Ecosystems through a Cross-Site Analysis in the Alps and Apennines. Sci. Total Environ. 2018, 624, 1429–1442. [Google Scholar] [CrossRef] [PubMed]
  3. Pepin, N.C.; Arnone, E.; Gobiet, A.; Haslinger, K.; Kotlarski, S.; Notarnicola, C.; Palazzi, E.; Seibert, P.; Serafin, S.; Schöner, W.; et al. Climate Changes and Their Elevational Patterns in the Mountains of the World. Rev. Geophys. 2022, 60, e2020RG000730. [Google Scholar] [CrossRef]
  4. Telwala, Y.; Brook, B.W.; Manish, K.; Pandit, M.K. Climate-Induced Elevational Range Shifts and Increase in Plant Species Richness in a Himalayan Biodiversity Epicentre. PLoS ONE 2013, 8, e57103. [Google Scholar] [CrossRef]
  5. Khandu; Forootan, E.; Schumacher, M.; Awange, J.L.; Müller Schmied, H. Exploring the Influence of Precipitation Extremes and Human Water Use on Total Water Storage (TWS) Changes in the Ganges-Brahmaputra-Meghna River Basin. Water Resour. Res. 2016, 52, 2240–2258. [Google Scholar] [CrossRef]
  6. Patton, A.I.; Rathburn, S.L.; Capps, D.M. Landslide Response to Climate Change in Permafrost Regions. Geomorphology 2019, 340, 116–128. [Google Scholar] [CrossRef]
  7. Climate Change 2022: Impacts, Adaptation and Vulnerability. Available online: https://www.ipcc.ch/report/ar6/wg2/about/factsheets (accessed on 13 February 2025).
  8. Alizadeh, O. Advances and Challenges in Climate Modeling. Clim. Change 2022, 170, 18. [Google Scholar] [CrossRef]
  9. Nayak, S.; Takemi, T.; Maity, S. Precipitation and Temperature Climatologies over India: A Study with AGCM Large Ensemble Climate Simulations. Atmosphere 2022, 13, 671. [Google Scholar] [CrossRef]
  10. Schoof, J.T.; Pryor, S.C. Assessing the Fidelity of AOGCM-Simulated Relationships between Large-Scale Modes of Climate Variability and Wind Speeds. J. Geophys. Res. Atmos. 2014, 119, 9719–9734. [Google Scholar] [CrossRef]
  11. Touzé-Peiffer, L.; Barberousse, A.; Le Treut, H. The Coupled Model Intercomparison Project: History, Uses, and Structural Effects on Climate Research. WIREs Clim. Change 2020, 11, e648. [Google Scholar] [CrossRef]
  12. O’Neill, B.C.; Carter, T.R.; Ebi, K.; Harrison, P.A.; Kemp-Benedict, E.; Kok, K.; Kriegler, E.; Preston, B.L.; Riahi, K.; Sillmann, J.; et al. Achievements and Needs for the Climate Change Scenario Framework. Nat. Clim. Change 2020, 10, 1074–1084. [Google Scholar] [CrossRef]
  13. Zhou, J.; Lu, H.; Yang, K.; Jiang, R.; Yang, Y.; Wang, W.; Zhang, X. Projection of China’s Future Runoff Based on the CMIP6 Mid-High Warming Scenarios. Sci. China Earth Sci. 2023, 66, 528–546. [Google Scholar] [CrossRef]
  14. Cui, T.; Li, C.; Tian, F. Evaluation of Temperature and Precipitation Simulations in CMIP6 Models Over the Tibetan Plateau. Earth Space Sci. 2021, 8, e2020EA001620. [Google Scholar] [CrossRef]
  15. Lalande, M.; Ménégoz, M.; Krinner, G.; Naegeli, K.; Wunderle, S. Climate Change in the High Mountain Asia in CMIP6. Earth Syst. Dyn. 2021, 12, 1061–1098. [Google Scholar] [CrossRef]
  16. Seker, M.; Gumus, V. Projection of Temperature and Precipitation in the Mediterranean Region through Multi-Model Ensemble from CMIP6. Atmos. Res. 2022, 280, 106440. [Google Scholar] [CrossRef]
  17. Yang, X.; Sun, W.; Wu, J.; Che, J.; Liu, M.; Zhang, Q.; Wang, Y.; Huai, B.; Wang, Y.; Wang, L. Evaluation and Projection of Precipitation in CMIP6 Models over the Qilian Mountains, China. Remote Sens. 2023, 15, 4350. [Google Scholar] [CrossRef]
  18. Zhu, L.; Fan, G. Assessment and Projection of Elevation-Dependent Warming over the Tibetan Plateau by CMIP6 Models. Theor. Appl. Climatol. 2022, 147, 1713–1723. [Google Scholar] [CrossRef]
  19. Sun, X.; Zhang, G.; Wang, J.; Li, C.; Wu, S.; Li, Y. Spatiotemporal Variation of Flash Floods in the Hengduan Mountains Region Affected by Rainfall Properties and Land Use. Nat. Hazards 2022, 111, 465–488. [Google Scholar] [CrossRef]
  20. Xu, X.; Zhang, X.; Li, X. Evaluation of the Applicability of Three Methods for Climatic Spatial Interpolation in the Hengduan Mountains Region. J. Hydrometeorol. 2022, 24, 35–51. [Google Scholar] [CrossRef]
  21. Yu, H.; Miao, S.; Xie, G.; Guo, X.; Chen, Z.; Favre, A. Contrasting Floristic Diversity of the Hengduan Mountains, the Himalayas and the Qinghai-Tibet Plateau Sensu Stricto in China. Front. Ecol. Evol. 2020, 8, 136. [Google Scholar] [CrossRef]
  22. Xu, F.; Jia, Y.W. Annual, Seasonal and Monthly Variation Characteristics of Temperature and Precipitation in the Hengduan Mountains Region. J. Mt. Sci. 2018, 36, 171–183. (In Chinese) [Google Scholar] [CrossRef]
  23. Dong, W.; Wang, G.; Guo, L.; Sun, J.; Sun, X. Evaluation of Three Gridded Precipitation Products in Characterizing Extreme Precipitation over the Hengduan Mountains Region in China. Remote Sens. 2022, 14, 4408. [Google Scholar] [CrossRef]
  24. Zhang, T.; Li, B.L.; Yuan, Y.C.; Gao, X.Z.; Jiang, Y.H.; Liu, Y. Spatio-Temporal Precipitation Dataset in Hengduan Mountains (1998–2012). J. Glob. Change Data Discov. 2019, 3, 168–174. [Google Scholar] [CrossRef]
  25. Cui, L.; Li, J.; An, W.; Qin, N.; Song, H.; Liu, Y. The Recent High Occurrence of Spring Atmospheric Droughts over Central Hengduan Mountains Is Unprecedented in 669-Year Tree-Ring Records. Palaeogeogr. Palaeoclimatol. Palaeoecol. 2024, 649, 112318. [Google Scholar] [CrossRef]
  26. Yu, H.; Wang, L.; Yang, R.; Yang, M.; Gao, R. Temporal and Spatial Distribution of Maximum Daily Precipitation in Hengduan Mountainous Region of China and Its Probability Characteristics. J. Hydrol. Eng. 2020, 25, 05020039. [Google Scholar] [CrossRef]
  27. Chen, S.; Guo, B.; Zhang, R.; Zang, W.; Wei, C.; Wu, H.; Yang, X.; Zhen, X.; Li, X.; Zhang, D.; et al. Quantitatively Determine the Dominant Driving Factors of the Spatial—Temporal Changes of Vegetation NPP in the Hengduan Mountain Area during 2000–2015. J. Mt. Sci. 2021, 18, 427–445. [Google Scholar] [CrossRef]
  28. Dai, E.; Wang, Y. Attribution Analysis for Water Yield Service Based on the Geographical Detector Method: A Case Study of the Hengduan Mountain Region. J. Geogr. Sci. 2020, 30, 1005–1020. [Google Scholar] [CrossRef]
  29. Tian, L.; Fu, W.; Tao, Y.; Li, M.; Wang, L. Dynamics of the Alpine Timberline and Its Response to Climate Change in the Hengduan Mountains over the Period 1985–2015. Ecol. Indic. 2022, 135, 108589. [Google Scholar] [CrossRef]
  30. Yue, W.; Chen, F.; Davi, N.K.; Zhang, H.; Chen, Y.; Zhao, X.; Gao, Z. Little Ice Age Cooling in the Western Hengduan Mountains, China: A 600-Year Warm-Season Temperature Reconstruction from Tree Rings. Clim. Dyn. 2024, 62, 773–790. [Google Scholar] [CrossRef]
  31. Zhao, W.; Yang, M.; Chang, R.; Zhan, Q.; Li, Z.-L. Surface Warming Trend Analysis Based on MODIS/Terra Land Surface Temperature Product at Gongga Mountain in the Southeastern Tibetan Plateau. J. Geophys. Res. Atmos. 2021, 126, e2020JD034205. [Google Scholar] [CrossRef]
  32. Zu, K.; Chen, F.; Li, Y.; Shrestha, N.; Fang, X.; Ahmad, S.; Nabi, G.; Wang, Z. Climate Change Impacts Flowering Phenology in Gongga Mountains, Southwest China. Plant Divers. 2024, 46, 774–782. [Google Scholar] [CrossRef]
  33. Xing, Y.; Ree, R.H. Uplift-Driven Diversification in the Hengduan Mountains, a Temperate Biodiversity Hotspot. Proc. Natl. Acad. Sci. USA 2017, 114, E3444–E3451. [Google Scholar] [CrossRef] [PubMed]
  34. Yin, L.; Dai, E.; Guan, M.; Zhang, B. A Novel Approach for the Identification of Conservation Priority Areas in Mountainous Regions Based on Balancing Multiple Ecosystem Services—A Case Study in the Hengduan Mountain Region. Glob. Ecol. Conserv. 2022, 38, e02195. [Google Scholar] [CrossRef]
  35. Jin, C.X.; Jiang, C.; Zhang, X.Y. Simulation and Projection of Temperature in Southwest China by CMIP6 Models. J. China Agric. Meteorol. 2022, 43, 597–611. (In Chinese) [Google Scholar] [CrossRef]
  36. Chang, S.T.; Qu, Z.Y.; Wang, B.; Suacho. Downscaled Precipitation Projection Analysis of Summers in Liaoning Based on CMIP6 Models. Henan Sci. (In Chinese). 2023, 41, 1469–1478. [Google Scholar] [CrossRef]
  37. Wang, Y.; Shen, Y.-J.; Wang, L.; Guo, Y.; Cheng, Y.; Zhang, X. Multi-Model Ensemble Enhances the Spatiotemporal Comprehensive Performance of Regional Climate in China. Remote Sens. 2025, 17, 582. [Google Scholar] [CrossRef]
  38. Kim, G.; Ahn, J.-B.; Kryjov, V.N.; Lee, W.-S.; Kim, D.-J.; Kumar, A. Assessment of MME Methods for Seasonal Prediction Using WMO LC-LRFMME Hindcast Dataset. Int. J. Climatol. 2020, 41, E2462–E2481. [Google Scholar] [CrossRef]
  39. Li, Z.; He, Y.; Wang, C.; Wang, X.; Xin, H.; Zhang, W.; Cao, W. Spatial and Temporal Trends of Temperature and Precipitation during 1960–2008 at the Hengduan Mountains, China. Quat. Int. 2011, 236, 127–142. [Google Scholar] [CrossRef]
  40. Yu, H.; Wang, L.; Yang, R.; Yang, M.; Gao, R. Temporal and Spatial Variation of Precipitation in the Hengduan Mountains Region in China and Its Relationship with Elevation and Latitude. Atmos. Res. 2018, 213, 1–16. [Google Scholar] [CrossRef]
  41. Xue-zhao, H.; Dao-yi, G. Interdecadal Change in Western Pacific Subtropical High and Climatic Effects. J. Geogr. Sci. 2002, 12, 202–209. [Google Scholar] [CrossRef]
  42. Xiang, R.; Steger, C.; Sørland, S.; Schär, C. The Impact of Hengduan Mountains Formation on the Regional Monsoon Climate and Extreme Precipitation. In Proceedings of the EGU22, the 24th EGU General Assembly, Online, 23–27 May 2022. EGU22-6986. [Google Scholar] [CrossRef]
  43. Li, X.; Li, Z. Evaluation of Bias Correction Techniques for Generating High-Resolution Daily Temperature Projections from CMIP6 Models. Clim. Dyn. 2023, 61, 3893–3910. [Google Scholar] [CrossRef]
  44. Jiang, D.; Hu, D.; Tian, Z.; Lang, X. Differences between CMIP6 and CMIP5 Models in Simulating Climate over China and the East Asian Monsoon. Adv. Atmos. Sci. 2020, 37, 1102–1118. [Google Scholar] [CrossRef]
  45. You, Q.; Cai, Z.; Wu, F.; Jiang, Z.; Pepin, N.; Shen, S.S.P. Temperature Dataset of CMIP6 Models over China: Evaluation, Trend and Uncertainty. Clim. Dyn. 2021, 57, 17–35. [Google Scholar] [CrossRef]
  46. Li, X.; Li, Z. Assessment of Bias Correction Methods for High Resolution Daily Precipitation Projections with CMIP6 Models: A Canadian Case Study. J. Hydrol. Reg. Stud. 2025, 58, 102223. [Google Scholar] [CrossRef]
  47. Almazroui, M.; Islam, M.N.; Saeed, F.; Saeed, S.; Ismail, M.; Ehsan, M.A.; Diallo, I.; O’Brien, E.; Ashfaq, M.; Martínez-Castro, D.; et al. Projected Changes in Temperature and Precipitation Over the United States, Central America, and the Caribbean in CMIP6 GCMs. Earth Syst. Environ. 2021, 5, 1–24. [Google Scholar] [CrossRef]
  48. Jia-wen, L.I.; Yu-lin, Z.; Xing, W.E.I.; Zu-jin, F. Evaluating the Ability of CMIP6 Models in Simulating Precipitation and Temperature in Wanzhou City in the Three Gorges Reservoir. J. Yangtze River Sci. Res. Inst. 2023, 40, 32. [Google Scholar] [CrossRef]
  49. Findell, K.L.; Berg, A.; Gentine, P.; Krasting, J.P.; Lintner, B.R.; Malyshev, S.; Santanello, J.A.; Shevliakova, E. The Impact of Anthropogenic Land Use and Land Cover Change on Regional Climate Extremes. Nat. Commun. 2017, 8, 989. [Google Scholar] [CrossRef] [PubMed]
  50. Zhang, S.; Hu, Y.; Liu, J. Inter-Model Spreads of the Climatological Mean Hadley Circulation in AMIP/CMIP6 Simulations. Clim. Dyn. 2023, 61, 4411–4427. [Google Scholar] [CrossRef]
  51. Samset, B.H.; Fuglestvedt, J.S.; Lund, M.T. Delayed Emergence of a Global Temperature Response after Emission Mitigation. Nat. Commun. 2020, 11, 3261. [Google Scholar] [CrossRef] [PubMed]
  52. Danhong, D.; Huang, G.; Tao, W.; Wu, R.; Hu, K.; Li, C. Interannual Variation of Precipitation over the Hengduan Mountains during Rainy Season. Int. J. Climatol. 2018, 38, 2112–2125. [Google Scholar] [CrossRef]
  53. Ghosh, S.; Dey, S.; Das, S.; Riemer, N.; Giuliani, G.; Ganguly, D.; Venkataraman, C.; Giorgi, F.; Tripathi, S.N.; Ramachandran, S.; et al. Towards an Improved Representation of Carbonaceous Aerosols over the Indian Monsoon Region in a Regional Climate Model: RegCM. Geosci. Model Dev. 2023, 16, 2119–2147. [Google Scholar] [CrossRef]
Figure 1. Map of the Hengduan Mountain region location.
Sustainability 17 05306 g001
Figure 2. Technical roadmap.
Sustainability 17 05306 g002
Figure 3. Seasonal spatial temperature variation comparison in the Hengduan Mountain region for the reference period.
Sustainability 17 05306 g003
Figure 4. Seasonal spatial precipitation variation comparison in the Hengduan Mountain region for the reference period (1985–2014).
Sustainability 17 05306 g004
Figure 5. Comparison of annual temperature cycles between observational data (OBS) and multi-model ensemble data (MME).
Sustainability 17 05306 g005
Figure 6. Comparison of annual precipitation cycles between observational data (OBS) and multi-model ensemble data (MME).
Sustainability 17 05306 g006
Figure 7. Temperature bias between CMIP6 model simulations and observational data for the reference period. The vertical line of x = 0 in the form of solid red line represents the reference line. Two green dotted lines correspond to the positions of −1 times standard deviation and 1 times standard deviation respectively.
Sustainability 17 05306 g007
Figure 8. Precipitation bias between CMIP6 model simulations and observational data for the reference period. The vertical line of x = 0 in the form of solid red line represents the reference line. Two green dotted lines correspond to the positions of −0.5 times standard deviation and 0.5 times standard deviation respectively.
Sustainability 17 05306 g008
Figure 9. Spatial variation in annual average temperature from 2031 to 2070 under three emission scenarios (SSP1-2.6, SSP2-4.5, SSP5-8.5), based on the reference period (1985–2014).
Sustainability 17 05306 g009
Figure 10. Temporal variation in annual average temperature from 2031 to 2070 under three emission scenarios (SSP1-2.6, SSP2-4.5, SSP5-8.5), based on the reference period (1985–2014).
Sustainability 17 05306 g010
Figure 11. Spatial variation in annual average precipitation from 2031 to 2070 under three emission scenarios (SSP1-2.6, SSP2-4.5, SSP5-8.5), based on the reference period (1985–2014).
Sustainability 17 05306 g011
Figure 12. Temporal variation in annual average precipitation from 2031 to 2070 under three emission scenarios (SSP1-2.6, SSP2-4.5, SSP5-8.5), based on the reference period (1985–2014).
Sustainability 17 05306 g012
Table 1. Basic information on the 11 climate models.
NumberModel NameSpatial ResolutionInstitutionSelection Criteria
1ACCESS-CM2288 × 180CSIROAccurately simulate temperature and precipitation in mountainous and high-altitude regions around Australia, capturing the local climatic characteristics of complex terrains.
2ACCESS-ESM1-5512 × 256CSIRO
3BCC-CSM2-MR384 × 192BCCExcellently simulates the mean climate and inter-annual variability in regions like China’s Qilian Mountains, capturing circulation and precipitation patterns.
4CanESM5320 × 160CCCmaHigh-precision simulation of climate in mountainous regions such as the Canadian Rockies, reflecting the impact of mountains on airflow, temperature, and precipitation.
5EC-Earth3192 × 145EC-Earth-ConsortiumAccurately represent the microclimate of mountainous regions such as the European Alps, taking into account vegetation–climate interactions.
6EC-Earth3-Veg512 × 256EC-Earth-Consortium
7FGOALS-f3-L192 × 144CASAccurately simulates the thermal and dynamic effects of regions such as the Tibetan Plateau, reflecting the influence of topography on atmospheric circulation.
8INM-CM4-8128 × 64INMPrecisely simulate long-term trends in temperature and precipitation in Russian mountainous regions, capturing internal variability within the climate system.
9INM-CM5-0192 × 144INM
10KACE-1-0-G180 × 120NIMS-KMAEffectively simulates meso-scale and micro-scale weather and local climate in mountainous regions such as the Taebaek Mountains in South Korea, capturing extreme weather events.
11MPI-ESM1-2-HR180 × 120MPI-MExcellently simulates the climate in regions with complex terrains such as the European Alps, meticulously depicting the influence of topography on climate.
Disclaimer/Publisher’s Note: The statements, opinions and data contained in all publications are solely those of the individual author(s) and contributor(s) and not of MDPI and/or the editor(s). MDPI and/or the editor(s) disclaim responsibility for any injury to people or property resulting from any ideas, methods, instructions or products referred to in the content.

