
Assessment and Simulation of Urban Ecosystem Resilience by Coupling the RAR and Markov–FLUS Models: A Case Study of the Jinan Metropolitan Area


Abstract
1. Introduction
2. Materials and Methods
2.1. Study Area
2.2. Data Sources
2.3. Methodology
2.3.1. Urban Ecosystem Resilience Model
- (1)
- Urban Ecosystem Resistance Model
- (2)
- Urban Ecosystem Adaptation Model
- (3)
- Urban Ecosystem Resilience Model
2.3.2. Optimal Multi-Layered Geo-Detector Model
2.3.3. Markov–FLUS Model
- (1)
- Natural Development
- (2)
- Protection of Cultivated Land
- (3)
- Ecological Priority
3. Results and Analysis
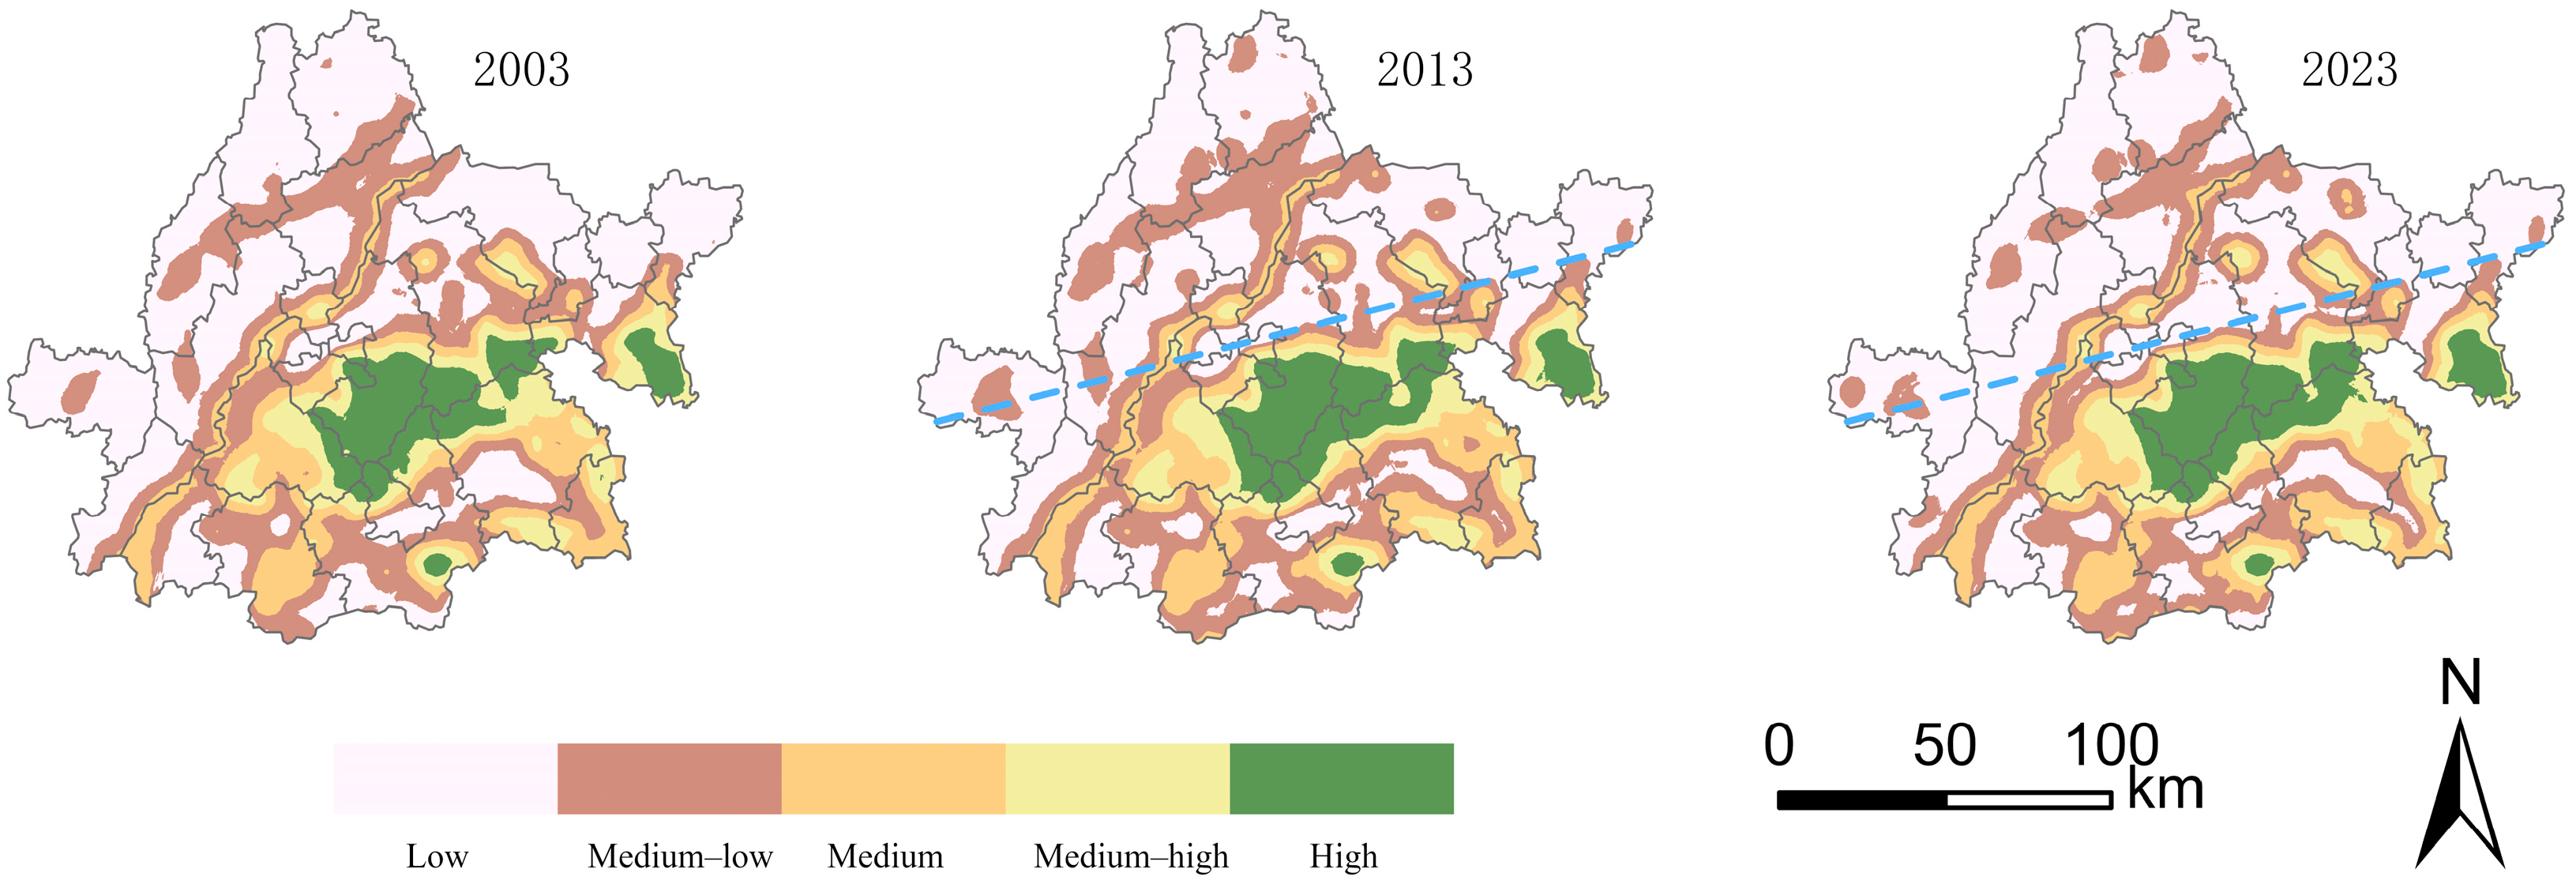
3.1. Spatial and Temporal Analysis of Urban Ecosystem Resilience
3.1.1. Spatial and Temporal Distribution of Urban Ecosystem Resilience
3.1.2. Spatial Distribution of Hot and Cold Spots of Ecosystem Resilience
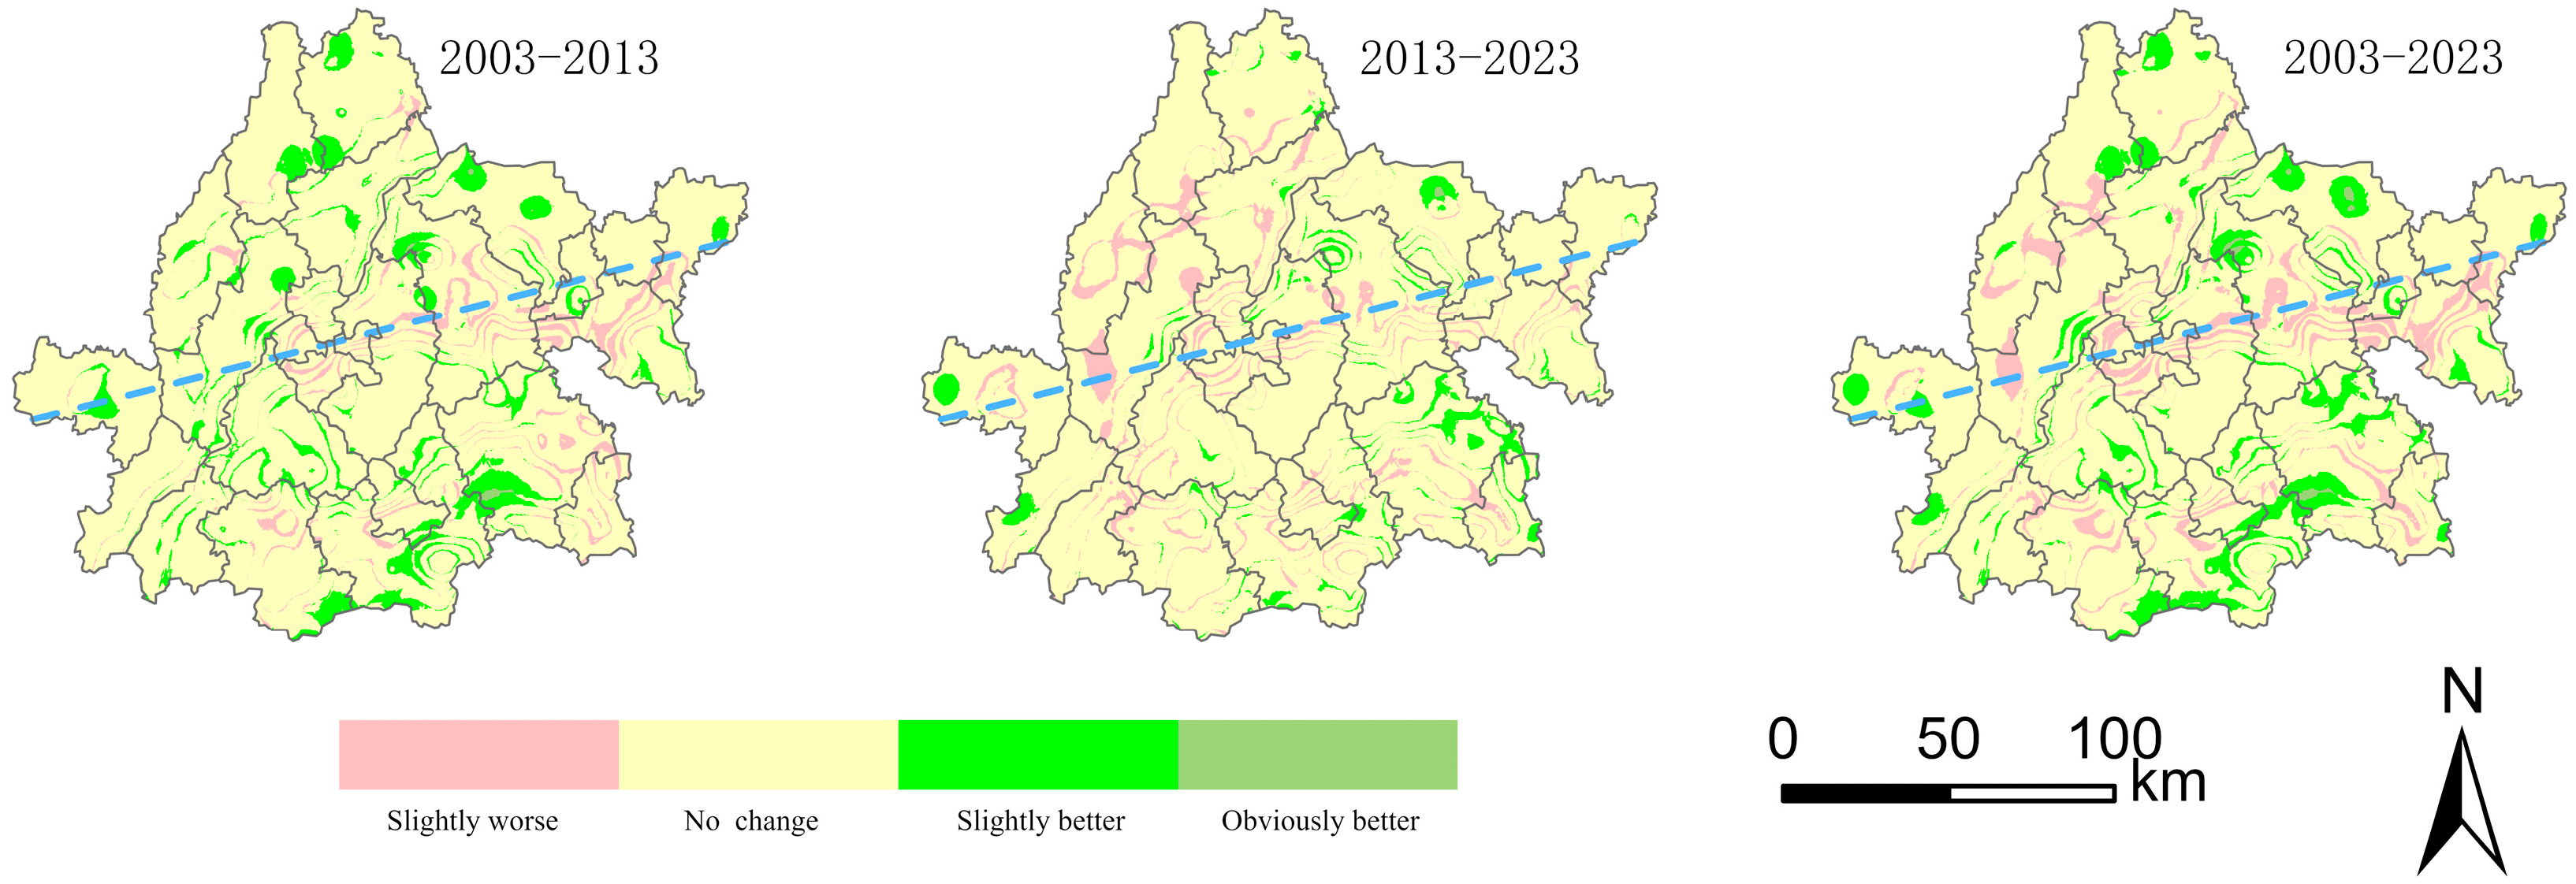
3.1.3. Dynamic Monitoring of Urban Ecosystem Resilience
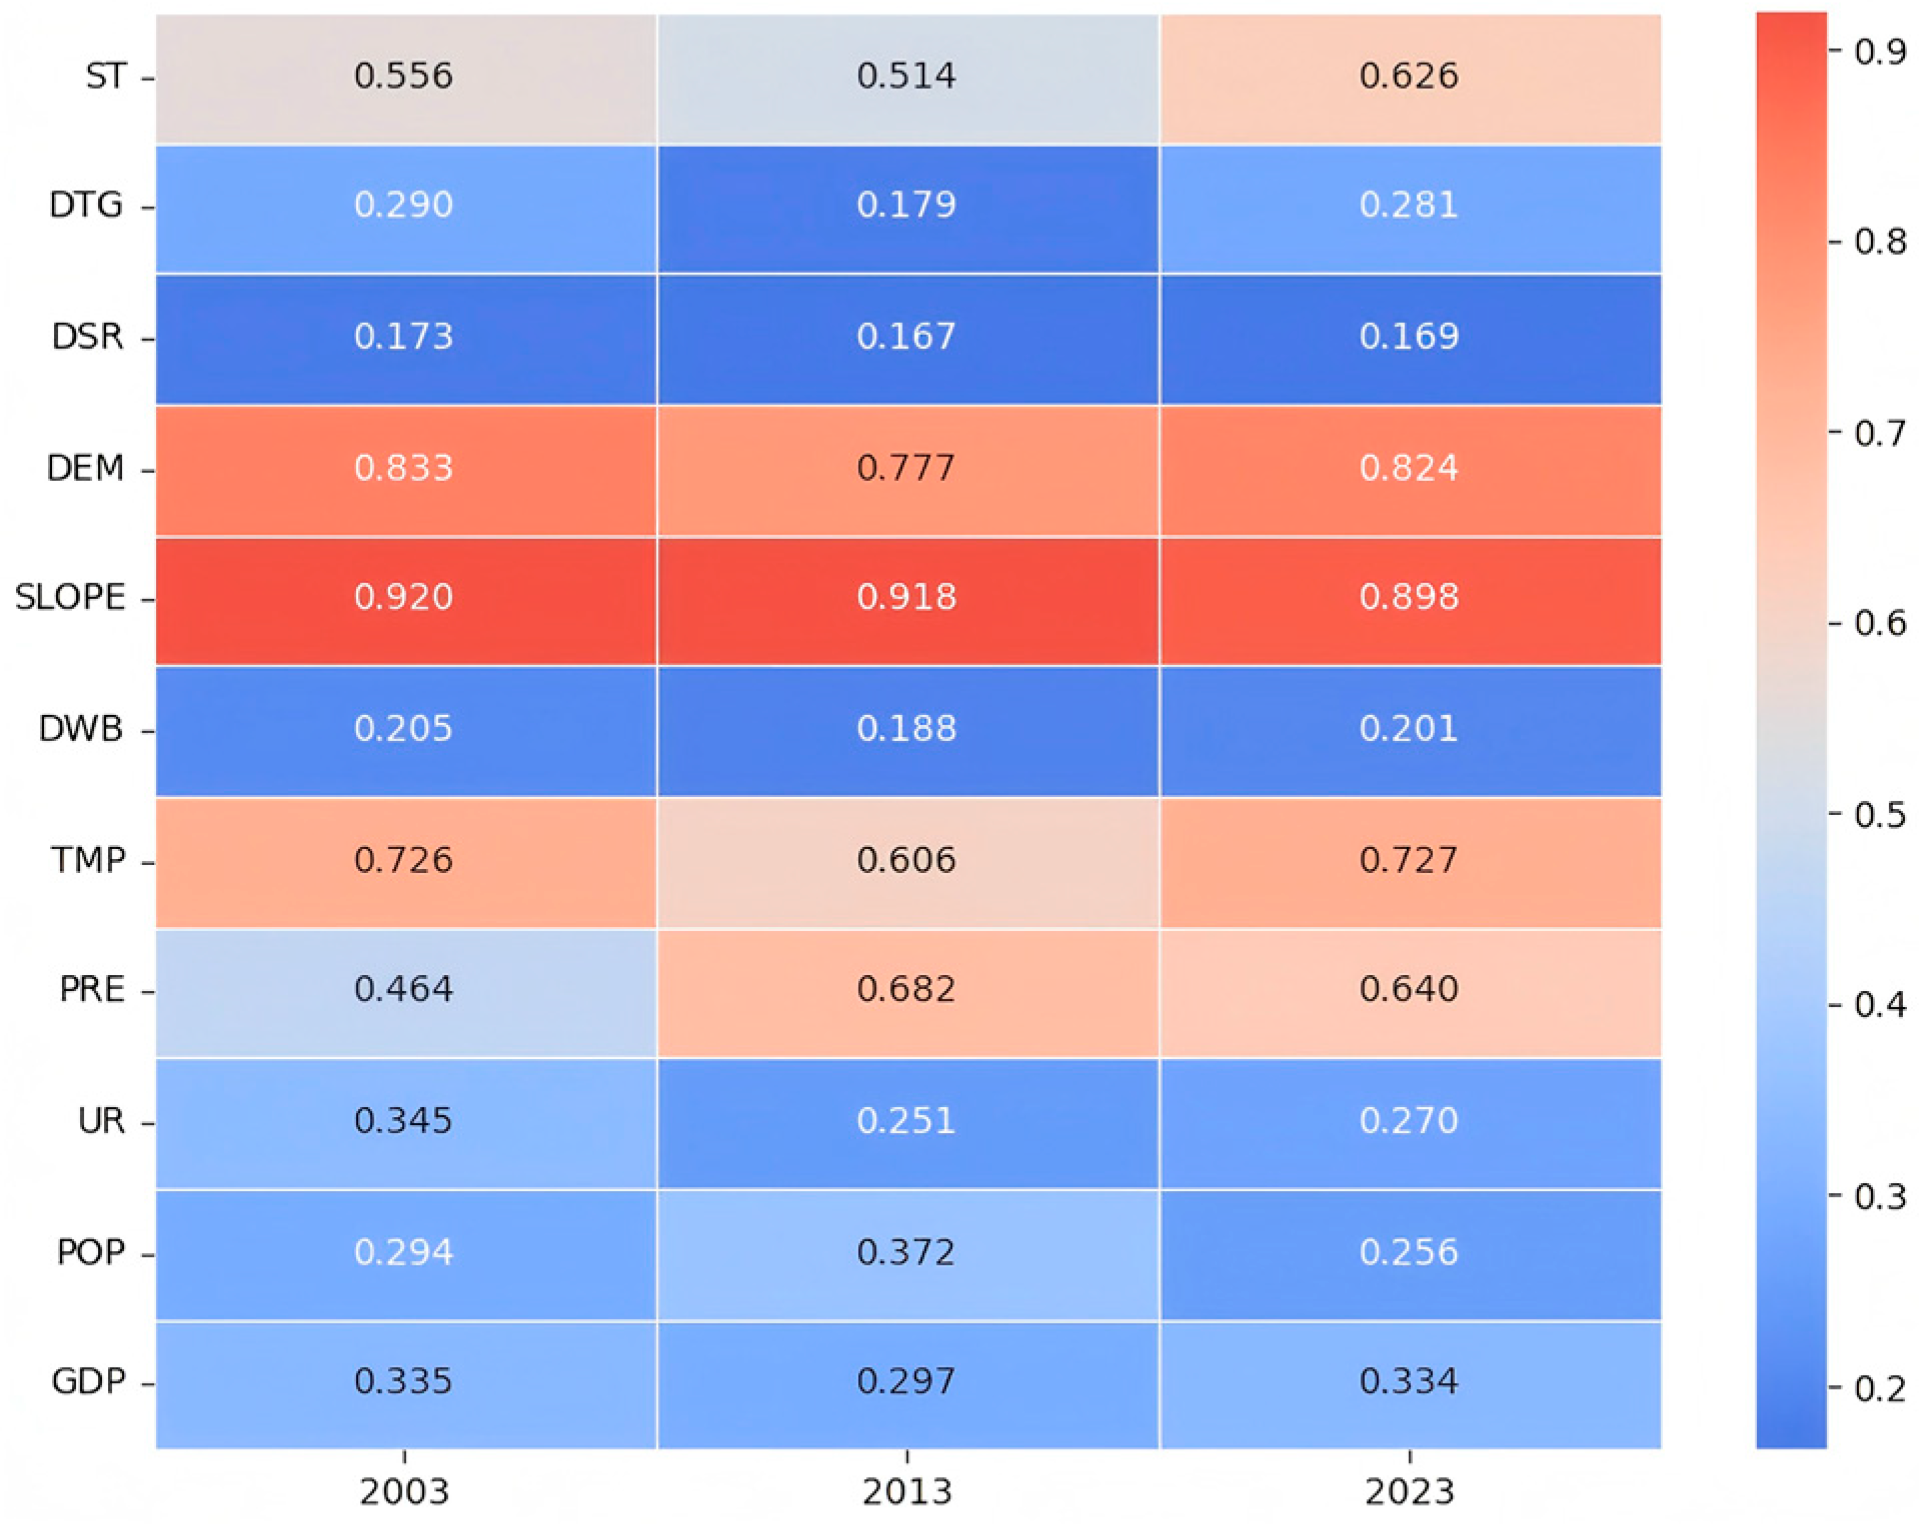
3.2. Analysis of Influencing Factors of Ecosystem Resilience
3.2.1. Single-Factor Detection Analysis
3.2.2. Multi-Actor Interaction
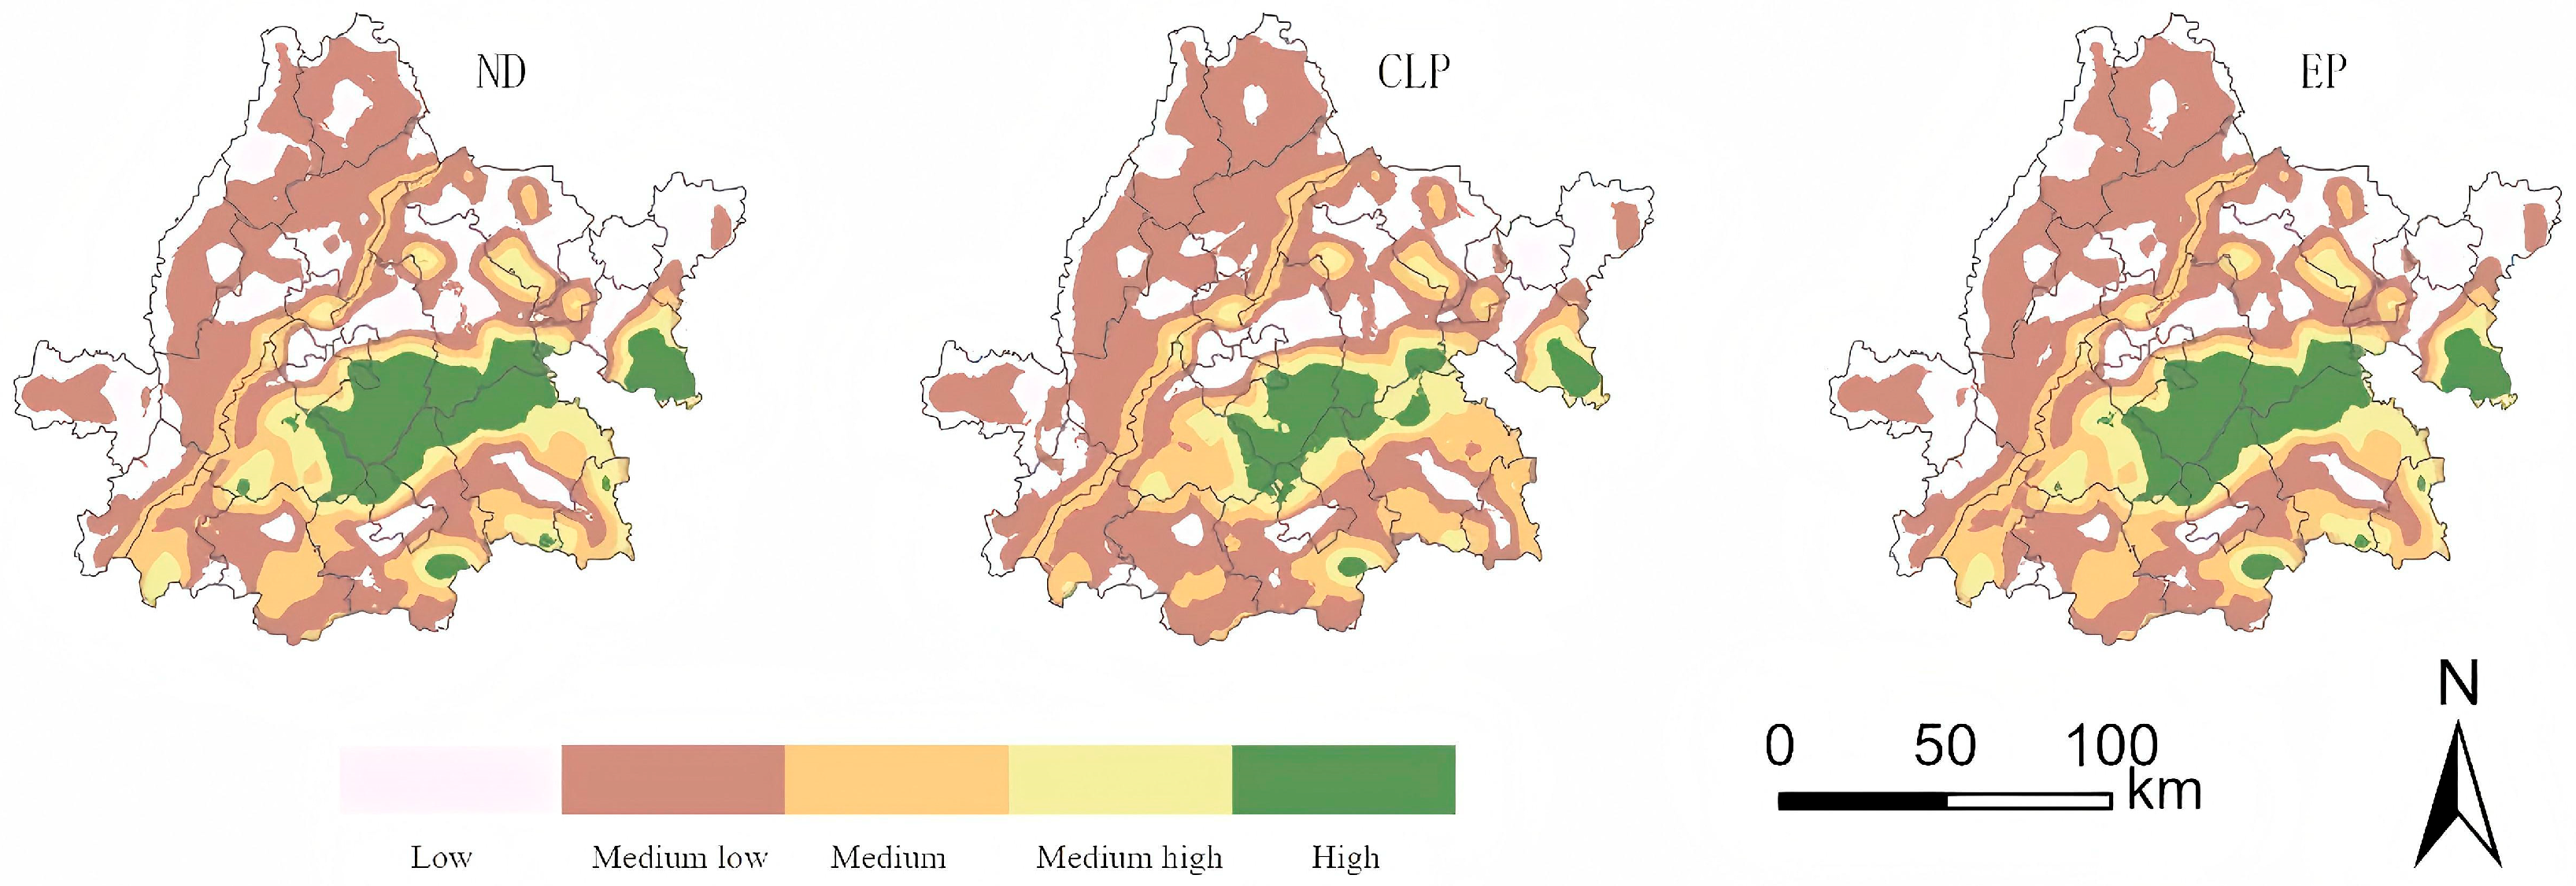
3.3. Ecosystem Resilience Simulation and Prediction
4. Discussion
5. Conclusions
- (1)
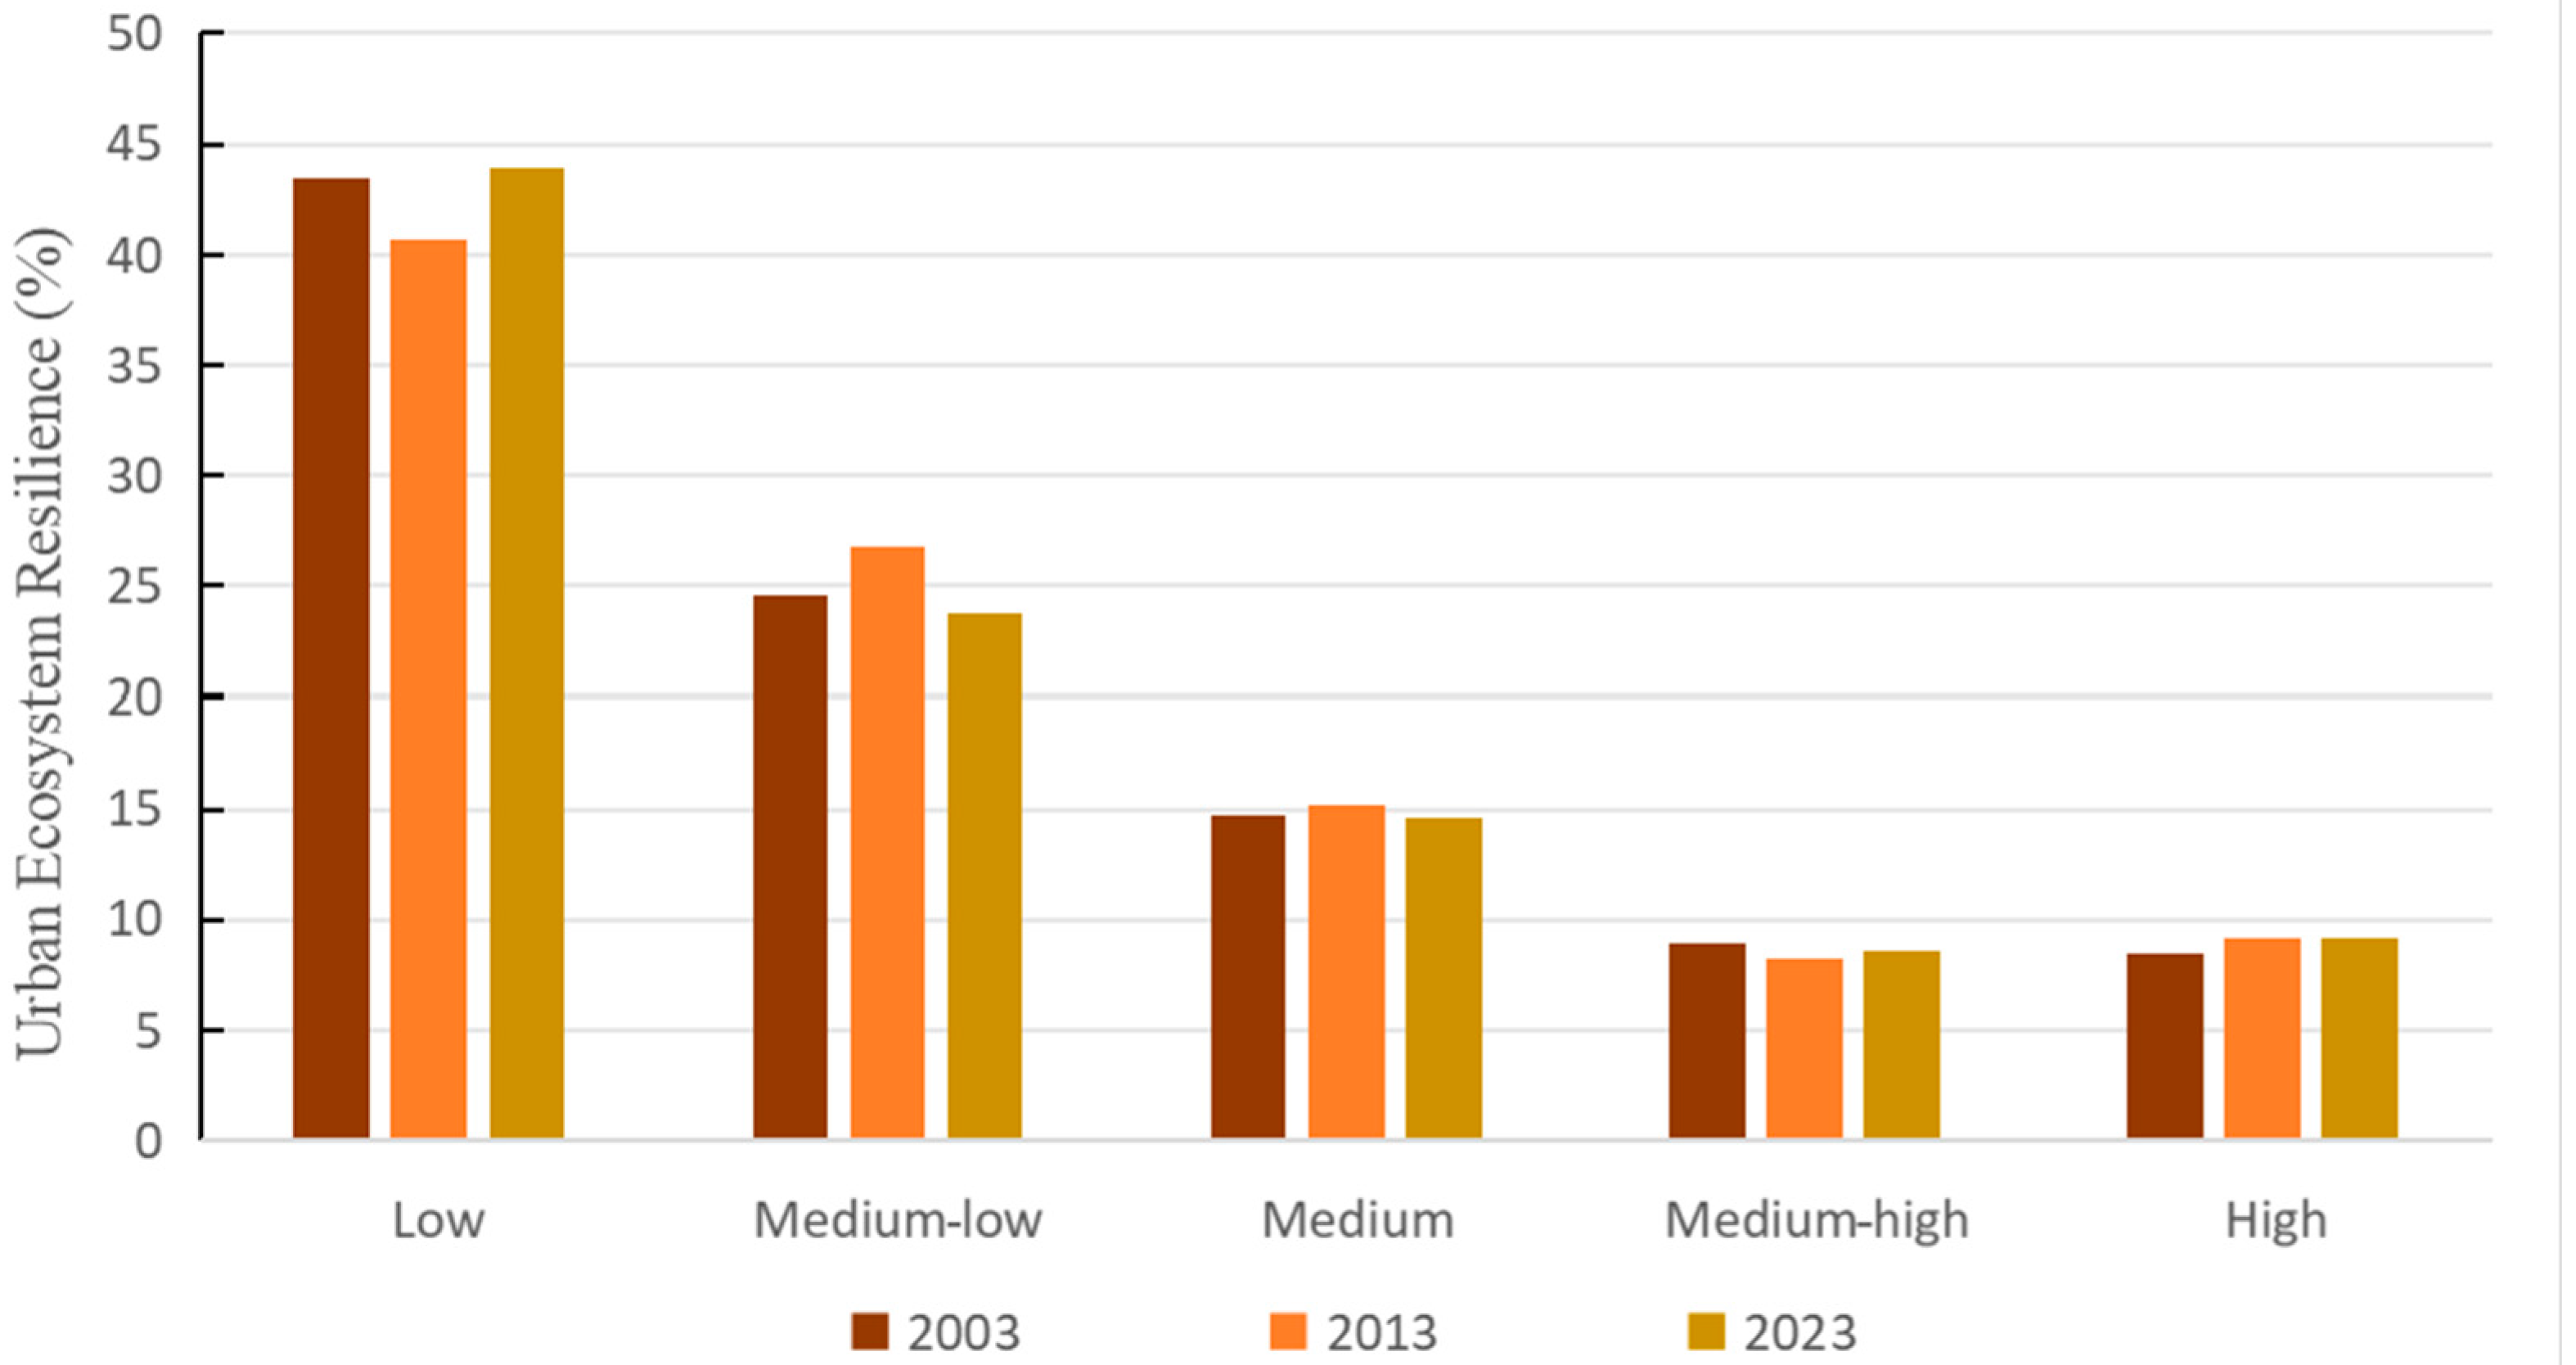
- The Jinan metropolitan area exhibits predominant ecosystem resilience at middle and low levels, with a stable “two regions and three zones” spatial pattern delineated by the Chiping–Linzi boundary, along which the resilience values demonstrate a diminishing gradient. Regional clustering is evident, marked by pronounced cold and hot spot distributions. Rapid land-use conversion has driven the transition of former cold spots to a non-significant status while elevating specific areas to significant hotspots. Our quantitative analysis revealed fluctuating average resilience (0.1863 in 2003 to 0.1876 in 2013 to 0.1863 in 2023), accompanied by divergent trends in extreme values: the maximum resilience increased steadily (0.4940 to 0.5081), while the minimum values declined sharply (0.0332 to 0.0207). Concurrently, the proportional coverage of both high- and low-rated areas expanded, with high-rated zones reaching 9.18% (2023) and low-rated areas persistently exceeding 40% of the total. These dynamics collectively illustrate an asymmetric development paradigm, characterized by functional intensification in the high-value regions coexisting with escalating vulnerability in the low-value zones, as evidenced by the widening resilience gradient (46.8% increase in value extremes) and persistent spatial polarization (>67% dominance of low–medium low areas).
- (2)
- The OMGD model revealed that ecosystem resilience’s global distribution was primarily influenced by natural factors, while also being impacted by social and economic factors. Factors such as slope, elevation, and temperature were identified as key drivers shaping regional ecosystem resilience distribution. Additionally, soil type emerged as a significant factor influencing the spatial distribution of ecosystem resilience, as indicated by the three-factor interaction analysis.
- (3)
- The simulation analysis of three scenarios—inertia development, cultivated land protection, and ecological priority—in the study area in 2033 indicated that the ecological priority scenario was the optimal model for enhancing land use structure and bolstering ecosystem resilience in the Jinan metropolitan area. Additionally, a dynamic relationship was observed between the plains and mountains, as well as between cultivated land protection and ecological priority.
Author Contributions
Funding
Data Availability Statement
Conflicts of Interest
References
- Jun, B. Diversified Challenges Faced by the Prevention and Control of Environmental Risk in China in the New Era. Chin. J. Environ. Manag. 2020, 12, 42–43. [Google Scholar]
- Miao, T.-T.; Shen, J.-J. The Focus Divergence and Solution Ideas of Urban Resilience—Analysis Based on the Theoretical Perspective of Chinese Path to Modernization. Inn. Mong. Soc. Sci. 2024, 45, 25–34. [Google Scholar]
- Li, Y.-N.; Yang, L.; Li, X.-T. Assessment on Urban Ecological Resilience in the Hexi Corridor Based on the “Resistance-Adaptability-Recovery”. Model Chin. J. Ecol. 2024, 1–16. Available online: http://kns.cnki.net/kcms/detail/21.1148.q.20241217.0857.004.html (accessed on 1 June 2025).
- Zhao, R.-D.; Fan, C.; Liu, H.-M. Progress and Prospect of Urban Resilience Research. Prog. Geogr. 2020, 39, 1717–1731. [Google Scholar] [CrossRef]
- Zhang, T.; Sun, Y.-X.; Zhang, X.-B.; Yin, L.; Zhang, B.-L. Potential Heterogeneity of Urban Ecological Resilience and Urbanization in Multiple Urban Agglomerations from a Landscape Perspective. J. Environ. Manag. 2023, 342, 118129. [Google Scholar] [CrossRef]
- Chu, H.-M.; He, S.-F.; He, J.-L.; Wu, Y.-H.; Bai, Q.-G.; Li, Z. Study on the Spatio-Temporal Differentiation Characteristics of Urban Ecological Resilience in the Yellow River Basin Based on the PSR Model. Res. Soil Water Conserv. 2025, 32, 396–404. [Google Scholar] [CrossRef]
- Wang, Z.-F.; Liang, Z.-Q. Spatiotemporal Evolution Pattern and Prediction of Urban Ecological Resilience in the Yangtze River Economic Belt]. Resour. Environ. Yangtze Basin 2025, 34, 268–279. [Google Scholar]
- Meng, Z.; He, M.; Li, X.; Li, H.; Tan, Y.; Li, Z.; Wei, Y. Spatio-Temporal Analysis and Driving Forces of Urban Ecosystem Resilience Based on Land Use: A Case Study in the Great Bay Area. Ecol. Indic. 2024, 159, 111769. [Google Scholar] [CrossRef]
- Lin, G.-T.; Wu, Y.-W.; Yuan, H.-W.; Gong, J.-Z. Construction and Optimization Strategy of Ecological Security Pattern in Eastern China’s Megacity Clusters. Environ. Sci. 2025, 1–18. [Google Scholar] [CrossRef]
- Wu, J.-P.; Pan, Y.; Luo, H.-S.; Gao, D.-S. Spatial-Temporal Pattern Evolution and Dynamic Prediction of Urban Resilience in Dianzhong Urban Agglomeration. Ecol. Econ. 2023, 39, 95–105. [Google Scholar]
- Hudec, O.; Reggiani, A.; Siserová, M. Resilience Capacity and Vulnerability: A Joint Analysis with Reference to Slovak Urban Districts. Cities 2018, 73, 24–35. [Google Scholar] [CrossRef]
- Campanella, T.J. Urban Resilience and the Recovery of New Orleans. J. Am. Plann. Assoc. 2006, 72, 141–146. [Google Scholar] [CrossRef]
- Peng, J.; Liu, Y.; Wu, J.; Lv, H.; Hu, X. Linking Ecosystem Services and Landscape Patterns to Assess Urban Ecosystem Health: A Case Study in Shenzhen City, China. Landsc. Urban Plan. 2015, 143, 56–68. [Google Scholar] [CrossRef]
- Lambin, E.F.; Meyfroidt, P. Global Land Use Change, Economic Globalization, and the Looming Land Scarcity. Proc. Natl. Acad. Sci. USA 2011, 108, 3465–3472. [Google Scholar] [CrossRef]
- Chen, D.; Ji, G.; Deng, Y.-J.; Pan, H.-Y. Effects of Land Use Structure and Landscape Pattern Change on Ecosystem Service Value in Suburbs of Big City-Taking Longquanyi District of Chengdu City as an Example. Jiangsu Agric. Sci. 2018, 46, 328–333. [Google Scholar]
- Ouyang, X.; Wang, K.; Wei, X. Impacts of Urban-Rural Construction Land Linkages on Ecosystem Services: A Case Study of Dongting Lake Area. Acta Ecol. Sin. 2022, 42, 8713–8722. [Google Scholar]
- Wang, J.-F.; Xu, C. Geodetector: Principle and Prospective. Acta Geogr. Sin. 2017, 72, 116–134. [Google Scholar]
- Chai, X.-Y.; Wang, X.; Chen, X.-H.; Wang, Y.; Zhao, X.-T. Multi-Scenario Simulation and Prediction of Land Use in the Pearl River Delta Urban Agglomeration Using Coupled Markov and FLUS Models. Remote Sens. Nat. Resour. 2024, 37, 140–147. [Google Scholar]
- Yang, J.; Huang, X. The 30 m Annual Land Cover Dataset and Its Dynamics in China from 1990 to 2019. Earth Syst. Sci. Data 2021, 13, 3907–3925. [Google Scholar] [CrossRef]
- Ouyang, X.; Chen, J.; Wei, X.; Xie, H.-L.; Huang, T.-F.; Chen, S.-Y. Spatiotemporal Differentiation and Evolutionary Mechanism of Ecological Resilience in the Middle Reaches of the Yangtze River Urban Agglomeration. Acta Geogr. Sin. 2025, 1–13. Available online: http://kns.cnki.net/kcms/detail/11.1856.P.20250319.1325.002.html (accessed on 1 June 2025).
- Xue, F.; Zhang, N.; Xia, C.-Y.; Zhang, J.; Wang, C.-Y.; Li, S.; Zhou, J. Spatial Evaluation of Urban Ecological Resilience and Analysis of Driving Forces: A Case Study of Tongzhou District, Beijing. Acta Ecol. Sin. 2023, 43, 6810–6823. [Google Scholar]
- Ma, G.-B.; Liu, R.; Wu, Z.-J.; Zhang, L.-G. Evaluation of Cultivated Land Resilience and Its Regulatory Pathways—A Case Study of the Pearl River-West River Economic Belt. Res. Soil Water Conserv. 2025, 32, 332–342. [Google Scholar]
- Xie, G.-D.; Zhang, C.-X.; Zhang, L.-M.; Chen, W.-H.; Li, S.-M. Improvement of the Evaluation Method for Ecosystem Service Value Based on Per Unit Area. J. Nat. Resour. 2015, 30, 1243–1254. [Google Scholar]
- Ren, H.; Wu, J.-G.; Peng, S.-L. Evaluation and Monitoring of Ecosystem Health. Trop. Geogr. 2000, 20, 316–319. [Google Scholar]
- Xia, C.-Y.; Du, Z.; Chen, B. Spatio-Temporal Analysis and Simulation of Urban Ecological Resilience: A Case Study of Hangzhou. Acta Ecol. Sin. 2022, 42, 116–126. [Google Scholar]
- Peterson, G.D. Contagious Disturbance, Ecological Memory, and the Emergence of Landscape Pattern. Ecosystems 2002, 5, 329–338. [Google Scholar] [CrossRef]
- Peng, J.; Wang, Y.; Wu, J.; Zhang, Y. Evaluation for Regional Ecosystem Health: Methodology and Research Progress. Acta Ecol. Sin. 2007, 27, 4877–4885. [Google Scholar] [CrossRef]
- Zhao, J. Dynamic Indicator System for Measurement of Spatial Pattern in Landscape Ecology. Acta Ecol. Sin. 1990, 10, 182–186. [Google Scholar]
- Shu, X.; Xu, C.; Li, Y.; Tong, J.-E.; Shi, Z. Relationships Between Carbon Emission, Urban Growth, and Urban Forms of Urban Agglomeration in the Yangtze River Delta. Acta Ecol. Sin. 2018, 38, 6302–6313. [Google Scholar]
- Zha, R.; Huang, Y.; Yu, J.; Xie, C.; Lin, M. Spatial Pattern Optimization of Red Tourism Resources in the Former Central Soviet Area of China under County Regional Resilience Framework. Geogr. Sci. 2024, 44, 693–702. [Google Scholar]
- Guo, Y.; Wang, Z.-F.; Zhang, Z.-H.; Li, X. An Optimal Multivariate-Stratification Geographical Detector Model for Revealing the Impact of Multi-Factor Combinations on the Dependent Variable. GISci. Remote Sens. 2024, 61, 2422941. [Google Scholar] [CrossRef]
- Wang, L.-Q.; Liu, G. Spatial-Temporal Characteristics and Influencing Factors of Urban Ecological Resilience in China. Arid Land Geogr. 2024, 48, 893–904. [Google Scholar]
- Zheng, X.-J.; He, Q.; Kuang, W.; Liu, R.; Yu, T.; Zhang, X. Critical Issues and Optimization Strategies in the Territorial Spatial Planning Monitoring-Evaluation-Warning System. J. Nat. Resour. 2024, 39, 2869–2880. [Google Scholar] [CrossRef]
- Zhang, X.-R.; Zhao, J.; Li, M.-M. Analysis on Spatial and Temporal Changes of Regional Habitat Quality Based on the Spatial Pattern Reconstruction of Land Use. Acta Geogr. Sin. 2020, 75, 160–178. [Google Scholar]
- Liu, L.; Zhang, X.; Gao, Y.; Chen, X.; Shuai, X.; Mi, J. Finer-Resolution Mapping of Global Land Cover: Recent Developments, Consistency Analysis, and Prospects. J. Remote Sens. 2021, 2021, 5289697. [Google Scholar] [CrossRef]
- Chen, L.; Cai, H.; Zhang, T.; Zhang, X.; Zeng, H. Land Use Multi-Scenario Simulation Analysis of Rao River Basin Based on Markov–FLUS Model. Acta Ecol. Sin. 2022, 42, 3947–3958. [Google Scholar]
- Chen, X.-W.; Li, H.-B.; Zhang, W.-B.; Ge, X.-P. Impact of Land Use Transition on Ecosystem Service Value in the Lixiahe Region—Multi-Scenario Simulation Analysis Based on Markov–FLUS Model. Resour. Sci. 2025, 47, 182–195. [Google Scholar]
- Ju, Q.; Bai, Y.; Shen, T.-Q.; Cai, H.-Y.; Wang, Y.-Y.; Jin, J.-L.; Yu, L.; Gesang, Z. Spatio-Temporal Evolution and Tradeoff of Ecosystem Services in the Yellow River Water Conservation Area. Water Resour. Prot. 2025, 41, 38–46. [Google Scholar]
- Cheng, X.; Xiao, Z.-L.; Hu, X.-Y.; Tan, X.-H.; Liu, R. Land Use Simulation and Ecosystem Service Value Assessment of the Panxi Dry Valley Region under Policy-Oriented Scenetarios. Environ. Sci. 2025, 1–18. [Google Scholar] [CrossRef]
- Sun, W.; Liu, H.; Yang, Z.-H. Comparison of Sustainable Development Research on the Yangtze River and Yellow River Basin. Resour. Sci. 2024, 46, 2289–2303. [Google Scholar]
- Wang, Z.-B.; Shen, Z. The Main Systems and Characteristics of Ecosystem Protection in China. Acta Ecol. Sin. 2025, 45, 4131–4140. [Google Scholar]
- Wang, S.-L.; Jiang, X.; Hong, B.-T.; Luo, X.-L.; Liu, J.; Zhou, Y.-K. The Internal Logic and Strategic Conception of Cultivated Land Protection Planning in the New Period. Geogr. Res. 2025, 44, 638–655. [Google Scholar]
- Li, S.-L.; Wang, P. Impact of Land Use Change on Ecosystem Service Value in the Shandong Section of the Yellow River Basin. Ecol. Sci. 2023, 42, 144–155. [Google Scholar] [CrossRef]


| Data Type | Data Name | Year | Data Sources |
|---|---|---|---|
| Land use data | Land use | 2003, 2013, 2023 | Zenodo |
| Natural environment data | Annual precipitation | 2003, 2013, 2023 | National Qinghai–Tibet Plateau Science Data Center |
| Annual average temperature | 2003, 2013, 2023 | National Qinghai–Tibet Plateau Science Data Center | |
| Agrotype | 1995 | Resources and Environmental Science and Data Center | |
| Digital elevation | 2003 | Resources and Environmental Science and Data Center | |
| Slope | 2003 | Based on DEM conversion | |
| Water system data | 2023 | OSM | |
| Socio-economic data | Urbanization rate | 2003, 2013, 2023 | Shandong Statistical Yearbook |
| Density of population | 2003, 2013, 2023 | https://landscan.ornl.gov/ (accessed on 12 November 2024) | |
| Gross domestic product | 2003, 2013, 2023 | Bulletin of Statistics on National Economic and Social Development of China | |
| Distance from township government | 2023 | State Statistical Bureau | |
| Distance from secondary road | 2003 | OSM | |
| Distance from secondary road | 2023 | OSM | |
| Food prices, grain yield | 1988–2023 | Compilation of cost and benefit data of agricultural products in China, Shandong Statistical Yearbook |
| Class I Service | Category II Services | Year | Cultivated Land | Forest Land | Greensward | Waters | Construction Land | Unused Land |
|---|---|---|---|---|---|---|---|---|
| Supply services | Food | 2003 | 774.29 | 264.17 | 346.15 | 728.74 | 0 | 0 |
| 2013 | 1817.75 | 620.17 | 812.64 | 1710.83 | 0 | 0 | ||
| 2023 | 2359.32 | 804.95 | 1054.76 | 2220.54 | 0 | 0 | ||
| Raw material | 2003 | 364.37 | 601.21 | 510.12 | 209.51 | 0 | 0 | |
| 2013 | 855.41 | 1411.43 | 1197.58 | 491.86 | 0 | 0 | ||
| 2023 | 1110.27 | 1831.95 | 1554.38 | 638.41 | 0 | 0 | ||
| Water supply | 2003 | 18.22 | 309.72 | 282.39 | 7551.60 | 0 | 0 | |
| 2013 | 42.77 | 727.10 | 662.94 | 17,728.43 | 0 | 0 | ||
| 2023 | 55.51 | 943.73 | 860.46 | 23,010.35 | 0 | 0 | ||
| Adjustment services | Climate regulation | 2003 | 610.32 | 1976.72 | 1794.53 | 701.42 | 0 | 18.22 |
| 2013 | 1432.82 | 4640.61 | 4212.91 | 1646.67 | 0 | 42.77 | ||
| 2023 | 1859.70 | 6023.21 | 5468.08 | 2137.27 | 0 | 55.51 | ||
| Gas regulation | 2003 | 327.93 | 5921.04 | 4745.94 | 2086.03 | 0 | 0 | |
| 2013 | 769.87 | 13,900.46 | 11,141.75 | 4897.24 | 0 | 0 | ||
| 2023 | 999.24 | 18,041.89 | 14,461.27 | 6356.30 | 0 | 0 | ||
| Waste treatment | 2003 | 91.09 | 1758.09 | 1566.80 | 5055.66 | 0 | 91.09 | |
| 2013 | 213.85 | 4127.37 | 3678.27 | 11,868.85 | 0 | 213.85 | ||
| 2023 | 277.57 | 5357.05 | 4774.16 | 15,405.00 | 0 | 277.57 | ||
| Hydrological regulation | 2003 | 245.95 | 4317.81 | 3479.75 | 93,133.42 | 0 | 27.33 | |
| 2013 | 577.40 | 10,136.64 | 8169.19 | 218,643.47 | 0 | 64.16 | ||
| 2023 | 749.43 | 13,156.70 | 10,603.08 | 283,785.01 | 0 | 83.27 | ||
| Support services | Soil formation and retention | 2003 | 938.26 | 2413.96 | 2186.23 | 847.16 | 0 | 18.22 |
| 2013 | 2202.69 | 5667.11 | 5132.48 | 1988.83 | 0 | 42.77 | ||
| 2023 | 2858.95 | 7355.54 | 6661.62 | 2581.38 | 0 | 55.51 | ||
| Maintain nutrient cycling | 2003 | 109.31 | 182.19 | 163.97 | 63.77 | 0 | 0 | |
| 2013 | 256.62 | 427.71 | 384.94 | 149.70 | 0 | 0 | ||
| 2023 | 333.08 | 555.13 | 499.62 | 194.30 | 0 | 0 | ||
| Biodiversity protection | 2003 | 118.42 | 2195.34 | 1985.83 | 2322.87 | 0 | 18.22 | |
| 2013 | 278.01 | 5153.86 | 4662.00 | 5453.26 | 0 | 42.77 | ||
| 2023 | 360.84 | 6689.38 | 6050.97 | 7077.97 | 0 | 55.51 | ||
| Cultural services | Aesthetic landscape | 2003 | 54.66 | 965.59 | 874.49 | 1721.66 | 0 | 9.11 |
| 2013 | 128.31 | 2266.84 | 2052.99 | 4041.82 | 0 | 21.39 | ||
| 2023 | 166.54 | 2942.22 | 2664.65 | 5246.03 | 0 | 27.76 | ||
| Total | 2003 | 3652.83 | 20,905.83 | 17,936.20 | 114,421.84 | 0 | 182.19 | |
| 2013 | 8575.51 | 49,079.30 | 42,107.69 | 268,620.96 | 0 | 427.71 | ||
| 2023 | 11,130.46 | 63,701.74 | 54,653.04 | 348,652.53 | 0 | 555.13 | ||
| Type | Landscape Index, Landscape Metrics | Weight |
|---|---|---|
| Landscape heterogeneity | Shannon diversity index | 0.25 |
| Area weighted average fractal dimension of patches | 0.25 | |
| Landscape connectivity | Fragmentation of landscape | 0.5 |
| Cultivated Land | Forest Land | Greensward | Waters | Construction Land | Unused Land |
|---|---|---|---|---|---|
| 0.3 | 0.8 | 0.6 | 0.8 | 0.2 | 1 |
| Land Use Type | Cultivated Land | Forest Land | Greensward | Waters | Construction Land | Unused Land |
|---|---|---|---|---|---|---|
| Neighborhood weights | 0.220053 | 0.218255 | 0.106687 | 0.037673 | 0.417226 | 0.000106 |
| Urban Ecosystem Resilience | 2003 | 2013 | 2023 |
|---|---|---|---|
| Minimum | 0.0332 | 0.0276 | 0.0207 |
| Maximum | 0.4940 | 0.4994 | 0.5081 |
| Average value | 0.1863 | 0.1876 | 0.1863 |
| Urban Ecosystem Resilience | 2003 | 2013 | 2023 | |||
|---|---|---|---|---|---|---|
| Area | Percentage | Area | Percentage | Area | Percentage | |
| Low | 9669.83 | 43.40% | 9059.01 | 40.66% | 9778.77 | 43.89% |
| Medium-low | 5471.45 | 24.56% | 5966.01 | 26.78% | 5287.74 | 23.73% |
| Medium | 3272.04 | 14.69% | 3394.21 | 15.23% | 3253.32 | 14.60% |
| Medium-high | 1977.65 | 8.88% | 1833.75 | 8.23% | 1913.37 | 8.59% |
| High | 1888.56 | 8.48% | 2026.55 | 9.10% | 2046.33 | 9.18% |
| Change Grade | Level Change |
|---|---|
| Significantly worse | −4 (high to low) |
| Obviously worse | −3 (high to medium-low/medium-high to low) |
| −2 (high to medium/medium-high to medium-low/medium to low) | |
| Slightly worse | −1 (high to medium-high/medium-high to medium/medium to medium-low/medium-low to low) |
| No change | 0 (no level change, e.g., excellent to excellent) |
| Slightly better | 1 (above, and vice versa) |
| Obviously better | 2 (above, and vice versa) |
| 3 (above, and vice versa) | |
| Significantly better | 4 (above, and vice versa) |
| Change Grade | 2003–2013 | 2013–2023 | 2003–2023 | |||
|---|---|---|---|---|---|---|
| Area | Percentage | Area | Percentage | Area | Percentage | |
| Slightly worse | 989.92 | 4.59 | 1392.39 | 6.46 | 1812.25 | 8.40 |
| No change | 18,793.34 | 87.15 | 19,391.07 | 89.93 | 17,784.98 | 82.48 |
| Slightly better | 1751.37 | 8.12 | 772.54 | 3.58 | 1905.78 | 8.84 |
| Obviously better | 28.96 | 0.13 | 7.59 | 0.04 | 60.58 | 0.28 |
Disclaimer/Publisher’s Note: The statements, opinions and data contained in all publications are solely those of the individual author(s) and contributor(s) and not of MDPI and/or the editor(s). MDPI and/or the editor(s) disclaim responsibility for any injury to people or property resulting from any ideas, methods, instructions or products referred to in the content. |
© 2025 by the authors. Licensee MDPI, Basel, Switzerland. This article is an open access article distributed under the terms and conditions of the Creative Commons Attribution (CC BY) license (https://creativecommons.org/licenses/by/4.0/).
Share and Cite
Li, C.; Shi, J.; Chen, Y.; Zou, W.; Chen, A.; Pan, Y. Assessment and Simulation of Urban Ecosystem Resilience by Coupling the RAR and Markov–FLUS Models: A Case Study of the Jinan Metropolitan Area. Sustainability 2025, 17, 5305. https://doi.org/10.3390/su17125305
Li C, Shi J, Chen Y, Zou W, Chen A, Pan Y. Assessment and Simulation of Urban Ecosystem Resilience by Coupling the RAR and Markov–FLUS Models: A Case Study of the Jinan Metropolitan Area. Sustainability. 2025; 17(12):5305. https://doi.org/10.3390/su17125305
Chicago/Turabian StyleLi, Chenglong, Jingyi Shi, Yihong Chen, Wenwen Zou, Anna Chen, and Yue Pan. 2025. "Assessment and Simulation of Urban Ecosystem Resilience by Coupling the RAR and Markov–FLUS Models: A Case Study of the Jinan Metropolitan Area" Sustainability 17, no. 12: 5305. https://doi.org/10.3390/su17125305
APA StyleLi, C., Shi, J., Chen, Y., Zou, W., Chen, A., & Pan, Y. (2025). Assessment and Simulation of Urban Ecosystem Resilience by Coupling the RAR and Markov–FLUS Models: A Case Study of the Jinan Metropolitan Area. Sustainability, 17(12), 5305. https://doi.org/10.3390/su17125305