Article

Bridging Heritage Conservation and Urban Sustainability: A Multidimensional Coupling Framework for Walkability, Greening, and Cultural Heritage in the Historic City of Shenyang

Jangho Architecture College, Northeastern University, Shenyang 110169, China
*
Author to whom correspondence should be addressed.
Sustainability 2025, 17(12), 5284; https://doi.org/10.3390/su17125284
Submission received: 27 April 2025 / Revised: 2 June 2025 / Accepted: 5 June 2025 / Published: 7 June 2025
(This article belongs to the Section Tourism, Culture, and Heritage)

Abstract

:
Historic cities face a dual challenge of preserving cultural authenticity and adapting to modern urbanization, yet existing studies often overlook the multidimensional coupling mechanisms critical for sustainable urban renewal. This research has proposed a replicable framework to balance heritage conservation, ecological restoration, and pedestrian mobility. Focusing on the historic city of Shenyang, this study evaluated spatial dynamics via the Walkability Index (WI), Green View Index (GVI), and Cultural Heritage Index (CHI), and quantified their coupling coordination patterns. Multisource datasets including OpenStreetMap road networks, POIs, and Baidu street-view imagery were integrated. A Coupling Coordination Degree (CCD) model was developed to assess system interactions. Results revealed moderate overall walkability (WI = 42.66) with stark regional disparities, critically low greening (GVI = 10.14%), and polarized heritage distribution (CHI = 18.73) in Shenyang historic city. Tri-system coupling was moderate (CCD = 0.409–0.608), constrained by green-heritage disconnects in key districts. This work could contribute to interdisciplinary discourse by bridging computational modeling with human-centric urban design, providing scalable insights for global historic cities.

1. Introduction

Cities serve as pivotal platforms for modern tourism development, with their roles becoming increasingly prominent in shaping tourism experiences [1,2]. While urbanization drives tourism growth, a reciprocal relationship manifests through tourism’s substantial contributions to urban economic revitalization, employment generation, and city branding [3,4]. Cultural heritage plays a significant catalytic role in urban tourism, attracting substantial visitor flows while driving urban reconstruction and renewal [5,6,7]. Its dual role in preserving historical identity and enabling economic revitalization has positioned it as a cornerstone of sustainable urban development [8,9]. Scholars increasingly emphasize systematic approaches to heritage integration: Guzmán advocates indicator-based monitoring of heritage-conservation synergies [10], Azzopardi argues for combined natural–cultural assessments [11], and Zhou demonstrates how heritage-centric cities can leverage spatial interventions for sustainable tourism [12].
Collectively, these studies reveal heritage’s agency in reshaping urban morphologies and functional landscapes [13].
Regarding research on urban street greening, scholarly attention has been primarily focused on street trees, encompassing their historical development [14], planning and design [15], and health-promoting effects [16]. Some studies have also mentioned the use of street view imagery to calculate the Green View Index (GVI) for assessing greening levels at the street scale [17]. Other studies have explored the environmental impacts of urban greening at climatic scales [18], as well as conducted surveys on rooftop greening along street corridors [19]. However, there remains a notable research gap in understanding the interaction mechanisms between the Green View Index and cultural heritage resources at the street-level scale.
Urban public spaces, particularly walkable streets, function as vital tourism platforms by integrating service facilities, cultural displays, and social exchanges [20,21]. Their spatial configurations directly influence tourists’ perceptual experiences [22,23], with street walkability having emerged as a critical determinant of visitors’ mobility patterns [24] and overall satisfaction [25]. Beyond transportation, modern streetscapes now embody hybrid spaces where leisure, cultural immersion, and community interaction converge [26], necessitating integrated metrics like GVI and heritage indices to decode their multifunctionality.
The concept of coupling, originally derived from physics to describe interactive systems, has gained interdisciplinary traction in analyzing complex interrelationships [27,28]. In tourism studies, Gunn’s supply–demand system model underscores the functional realization through coordinated interactions between tourism resources and visitor needs [29]. Subsequent empirical investigations have expanded this framework to examine coupling dynamics across tourism demand, destination ecosystems, transportation networks, and environmental sustainability [30,31]. Existing scholarship has investigated tourism-oriented revitalization of heritage streets [32], tourism-induced pressures on urban systems [6], and the interaction between heritage conservation and urban tourism development [7]. Parallel research streams have emphasized green tourism as a sustainable paradigm [33]. However, a persistent gap remains in understanding street-level synergies between street functionality and tangible cultural heritage resources, despite their dual significance for sustainable urban development and heritage conservation.
This study aims to address two fundamental research questions: How do the multidimensional interactions among street functionality, greening levels, and tangible cultural heritage resources shape sustainable development in heritage tourism cities? What methodological framework can effectively assess the coupling coordination among urban streets, greening levels, and historical assets? To resolve these, we pursue a tripartite analytical agenda: First, we intend quantify street-level spatial patterns of functionality, Green View Index (GVI), and tangible heritage density; second, we will develop a coupling coordination model diagnosing their interaction intensity; and finally, we derive urban renewal strategies that balance tourism growth with cultural authenticity preservation. This study applies the proposed framework to Shenyang, a UNESCO-designated historic city, through a tripartite quantitative assessment of street walkability, green view index (GVI), and tangible cultural heritage distribution. By developing a Coupling Coordination Degree (CCD) model, we systematically evaluate interaction intensities and systemic equilibria between streetscapes and heritage assets, thereby generating empirically grounded strategies for optimizing tourism-oriented urban renewal while preserving cultural authenticity. These findings establish a transferable paradigm for addressing the dual imperatives of heritage conservation and sustainable development in historic cities.
Following this introduction, Section 2 will present the study area, data collection methods, and the computational approaches for relevant metrics. Section 3 will then elaborate on the calculation results, followed by analytical interpretations. Finally, the findings will be discussed in relation to existing literature, and conclusions will be drawn to summarize the research.

2. Materials and Methods
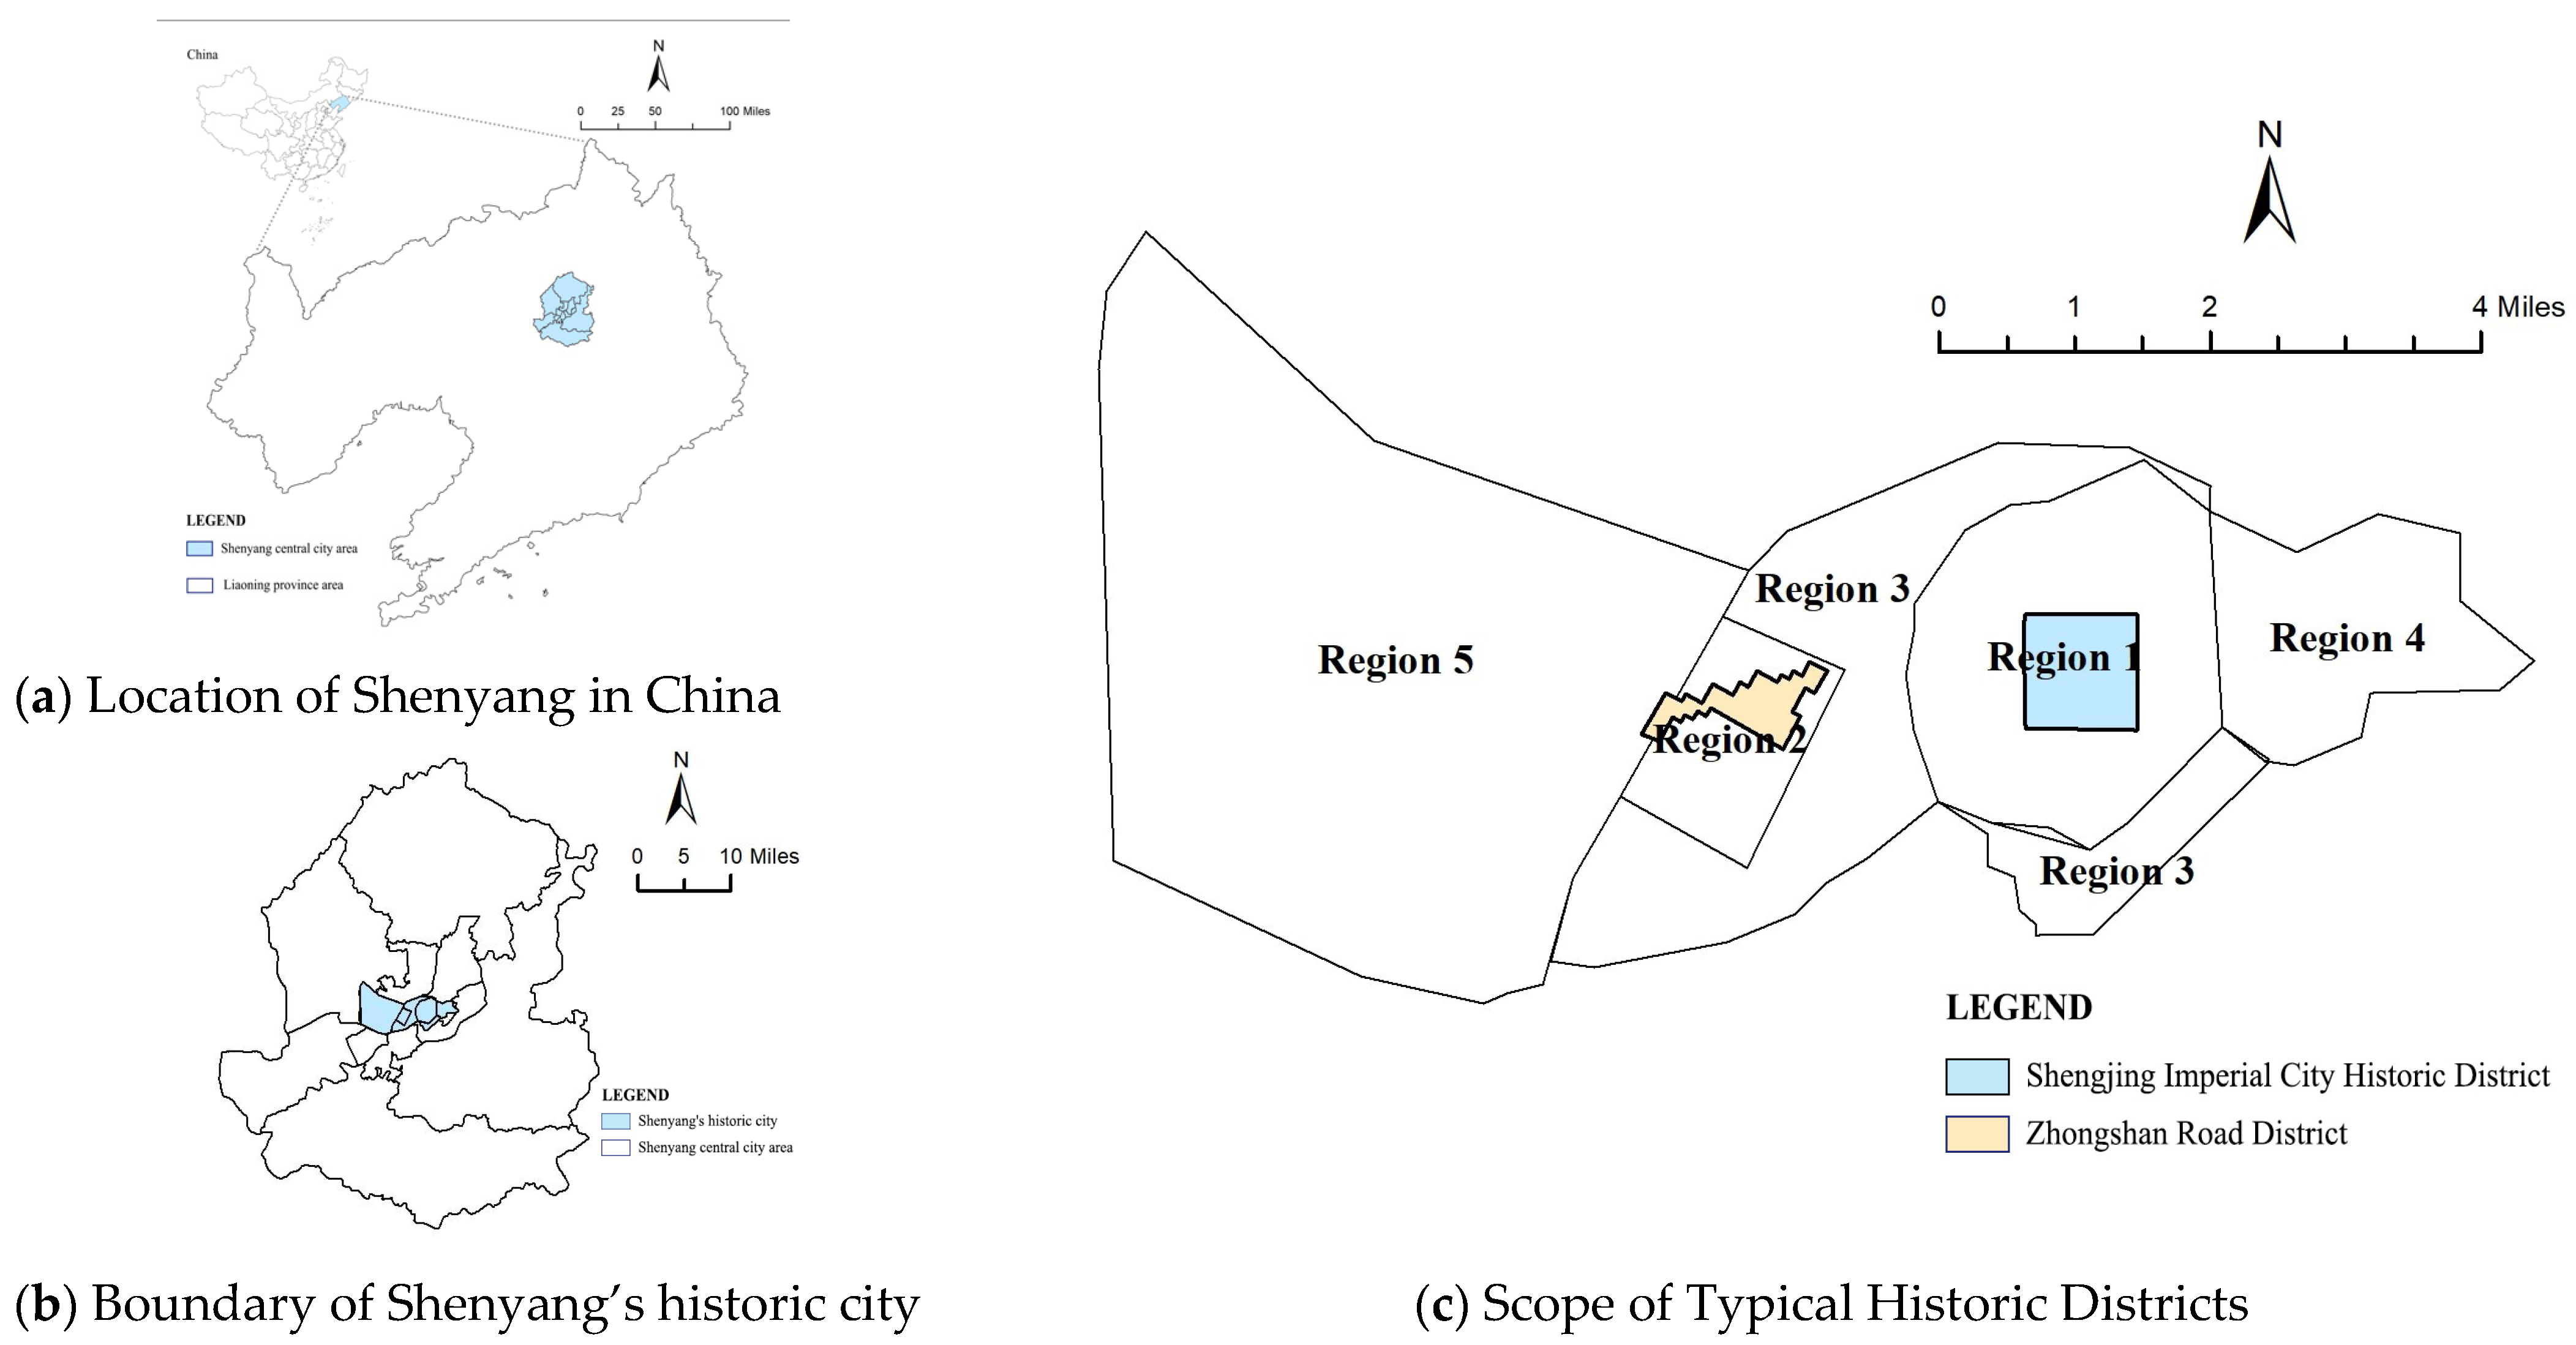
2.1. Study Domain

This research focuses on Shenyang, the provincial capital of Liaoning Province, China. Shenyang serves as the political, economic, and cultural nucleus of Northeast China, functioning as a critical transportation hub for the region. The city’s tourism infrastructure is anchored by its exceptional cultural heritage resources, which span imperial, industrial, and folk traditions. By 2022, Shenyang’s heritage protection system comprised 314 officially protected cultural sites at municipal level or above [34]. The city’s historical significance is exemplified by two UNESCO World Heritage Sites: The Shenyang Imperial Palace, and the Fuling Tomb. Republican-era history is preserved at the Zhang’s Mansion, an imposing warlord residence blending Chinese and Western architectural elements. Shenyang’s industrial legacy is concentrated in Tiexi District, which houses the Industrial Museum of China within a renovated factory complex, chronicling the district’s production of over 400 national industrial firsts. Shenyang is also famous for its vibrant folk culture and intangible cultural heritage. This multilayered heritage profile, spanning imperial, industrial, and folk dimensions, establishes Shenyang as a microcosm of Northeast China’s historical development and cultural identity [35,36].
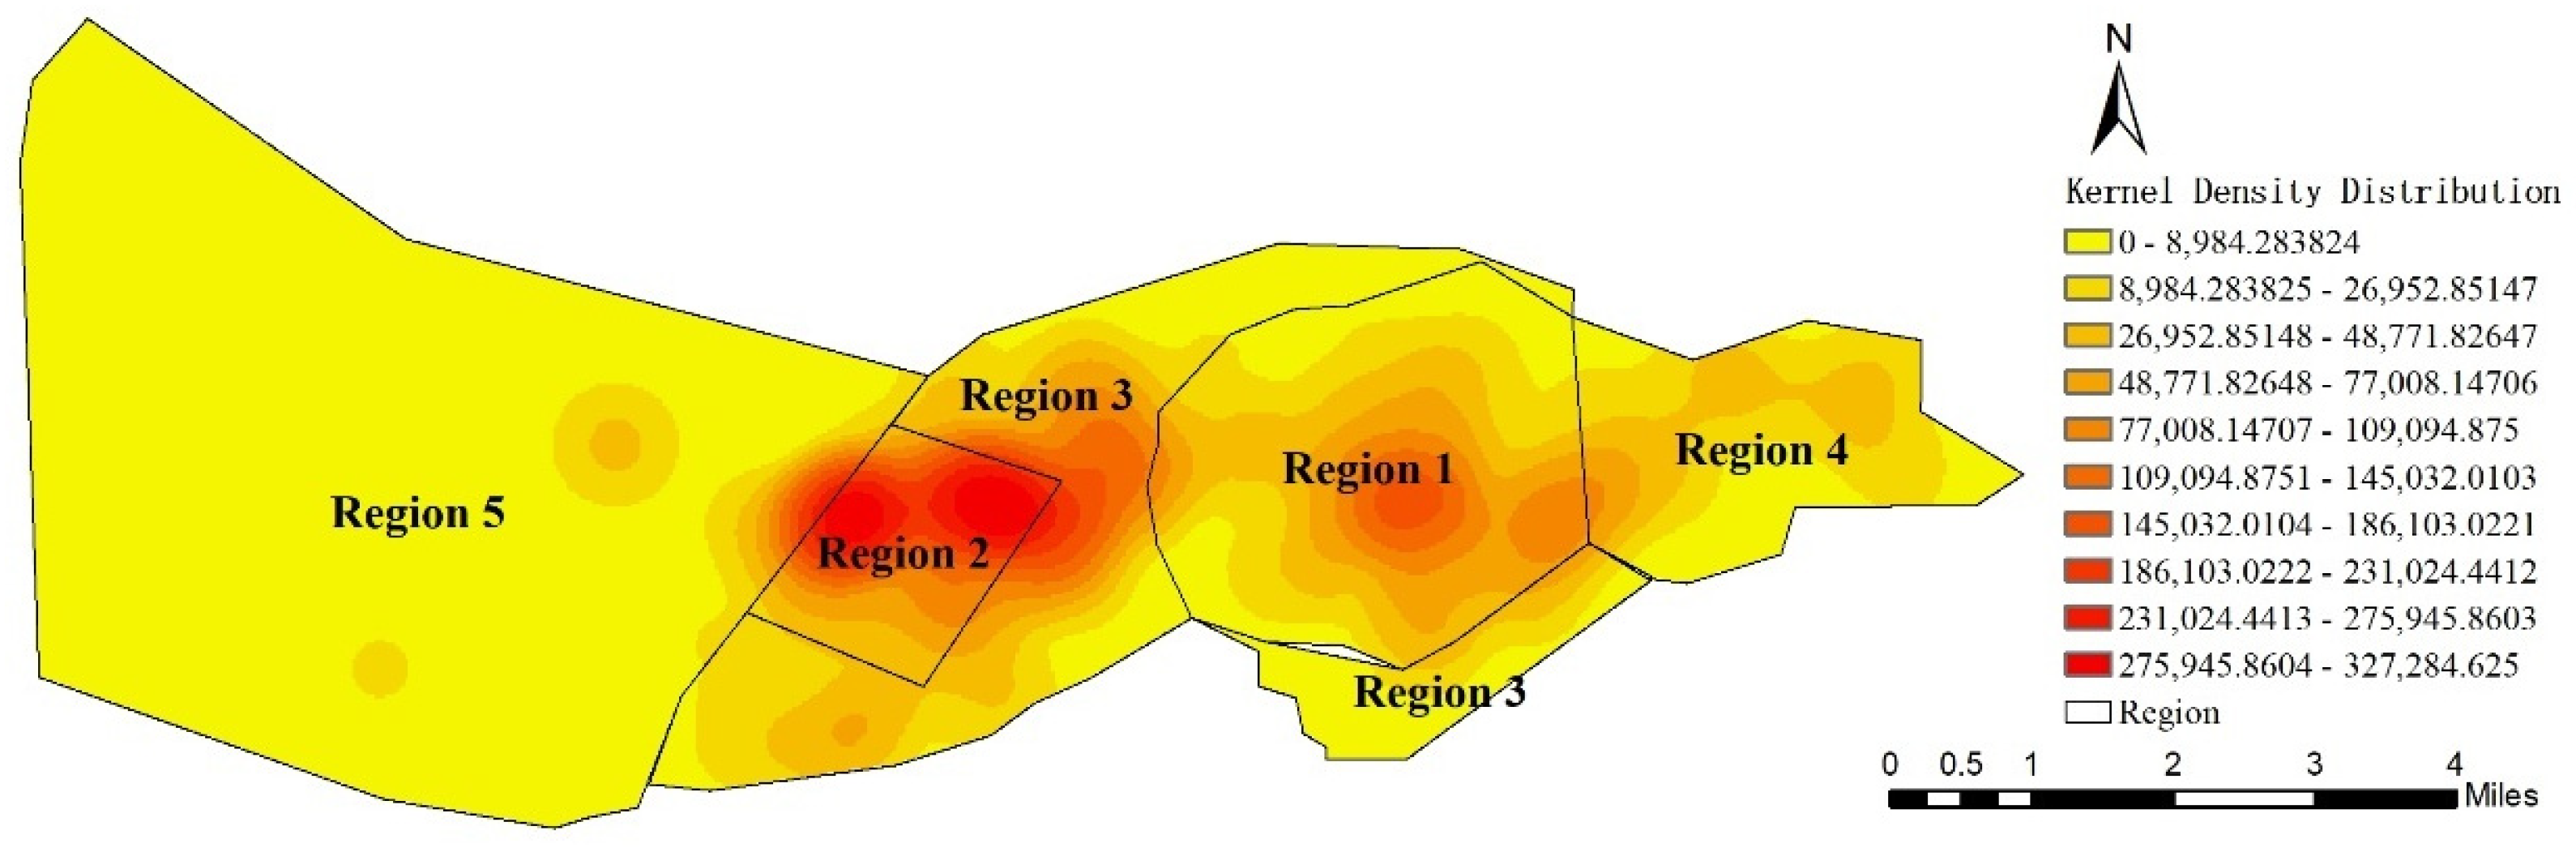
This study concentrates on Shenyang’s historic city, delineated through five constitutive elements of its historical morphology [37,38]: (1) Shengjing City—the foundational Qing Dynasty capital; (2) the South Manchuria Railway Concession—a Japanese colonial administrative enclave; (3) the Commercial Port District—China’s first government-planned treaty port; (4) the Zhang Zuolin-era urban expansion zone—reflecting warlord-period modernization; and (5) the Tiexi Industrial Area—representing Northeast China’s industrialization trajectory. Subsequently, two typical historic districts were selected for in-depth spatial analysis. Collectively spanning 80 km2, these contiguous territories form Shenyang’s strategic urban tourism development zone (hereafter designated Regions 1–5), encapsulating layered historical narratives from imperial to industrial epochs (Figure 1).

2.2. Date Sources

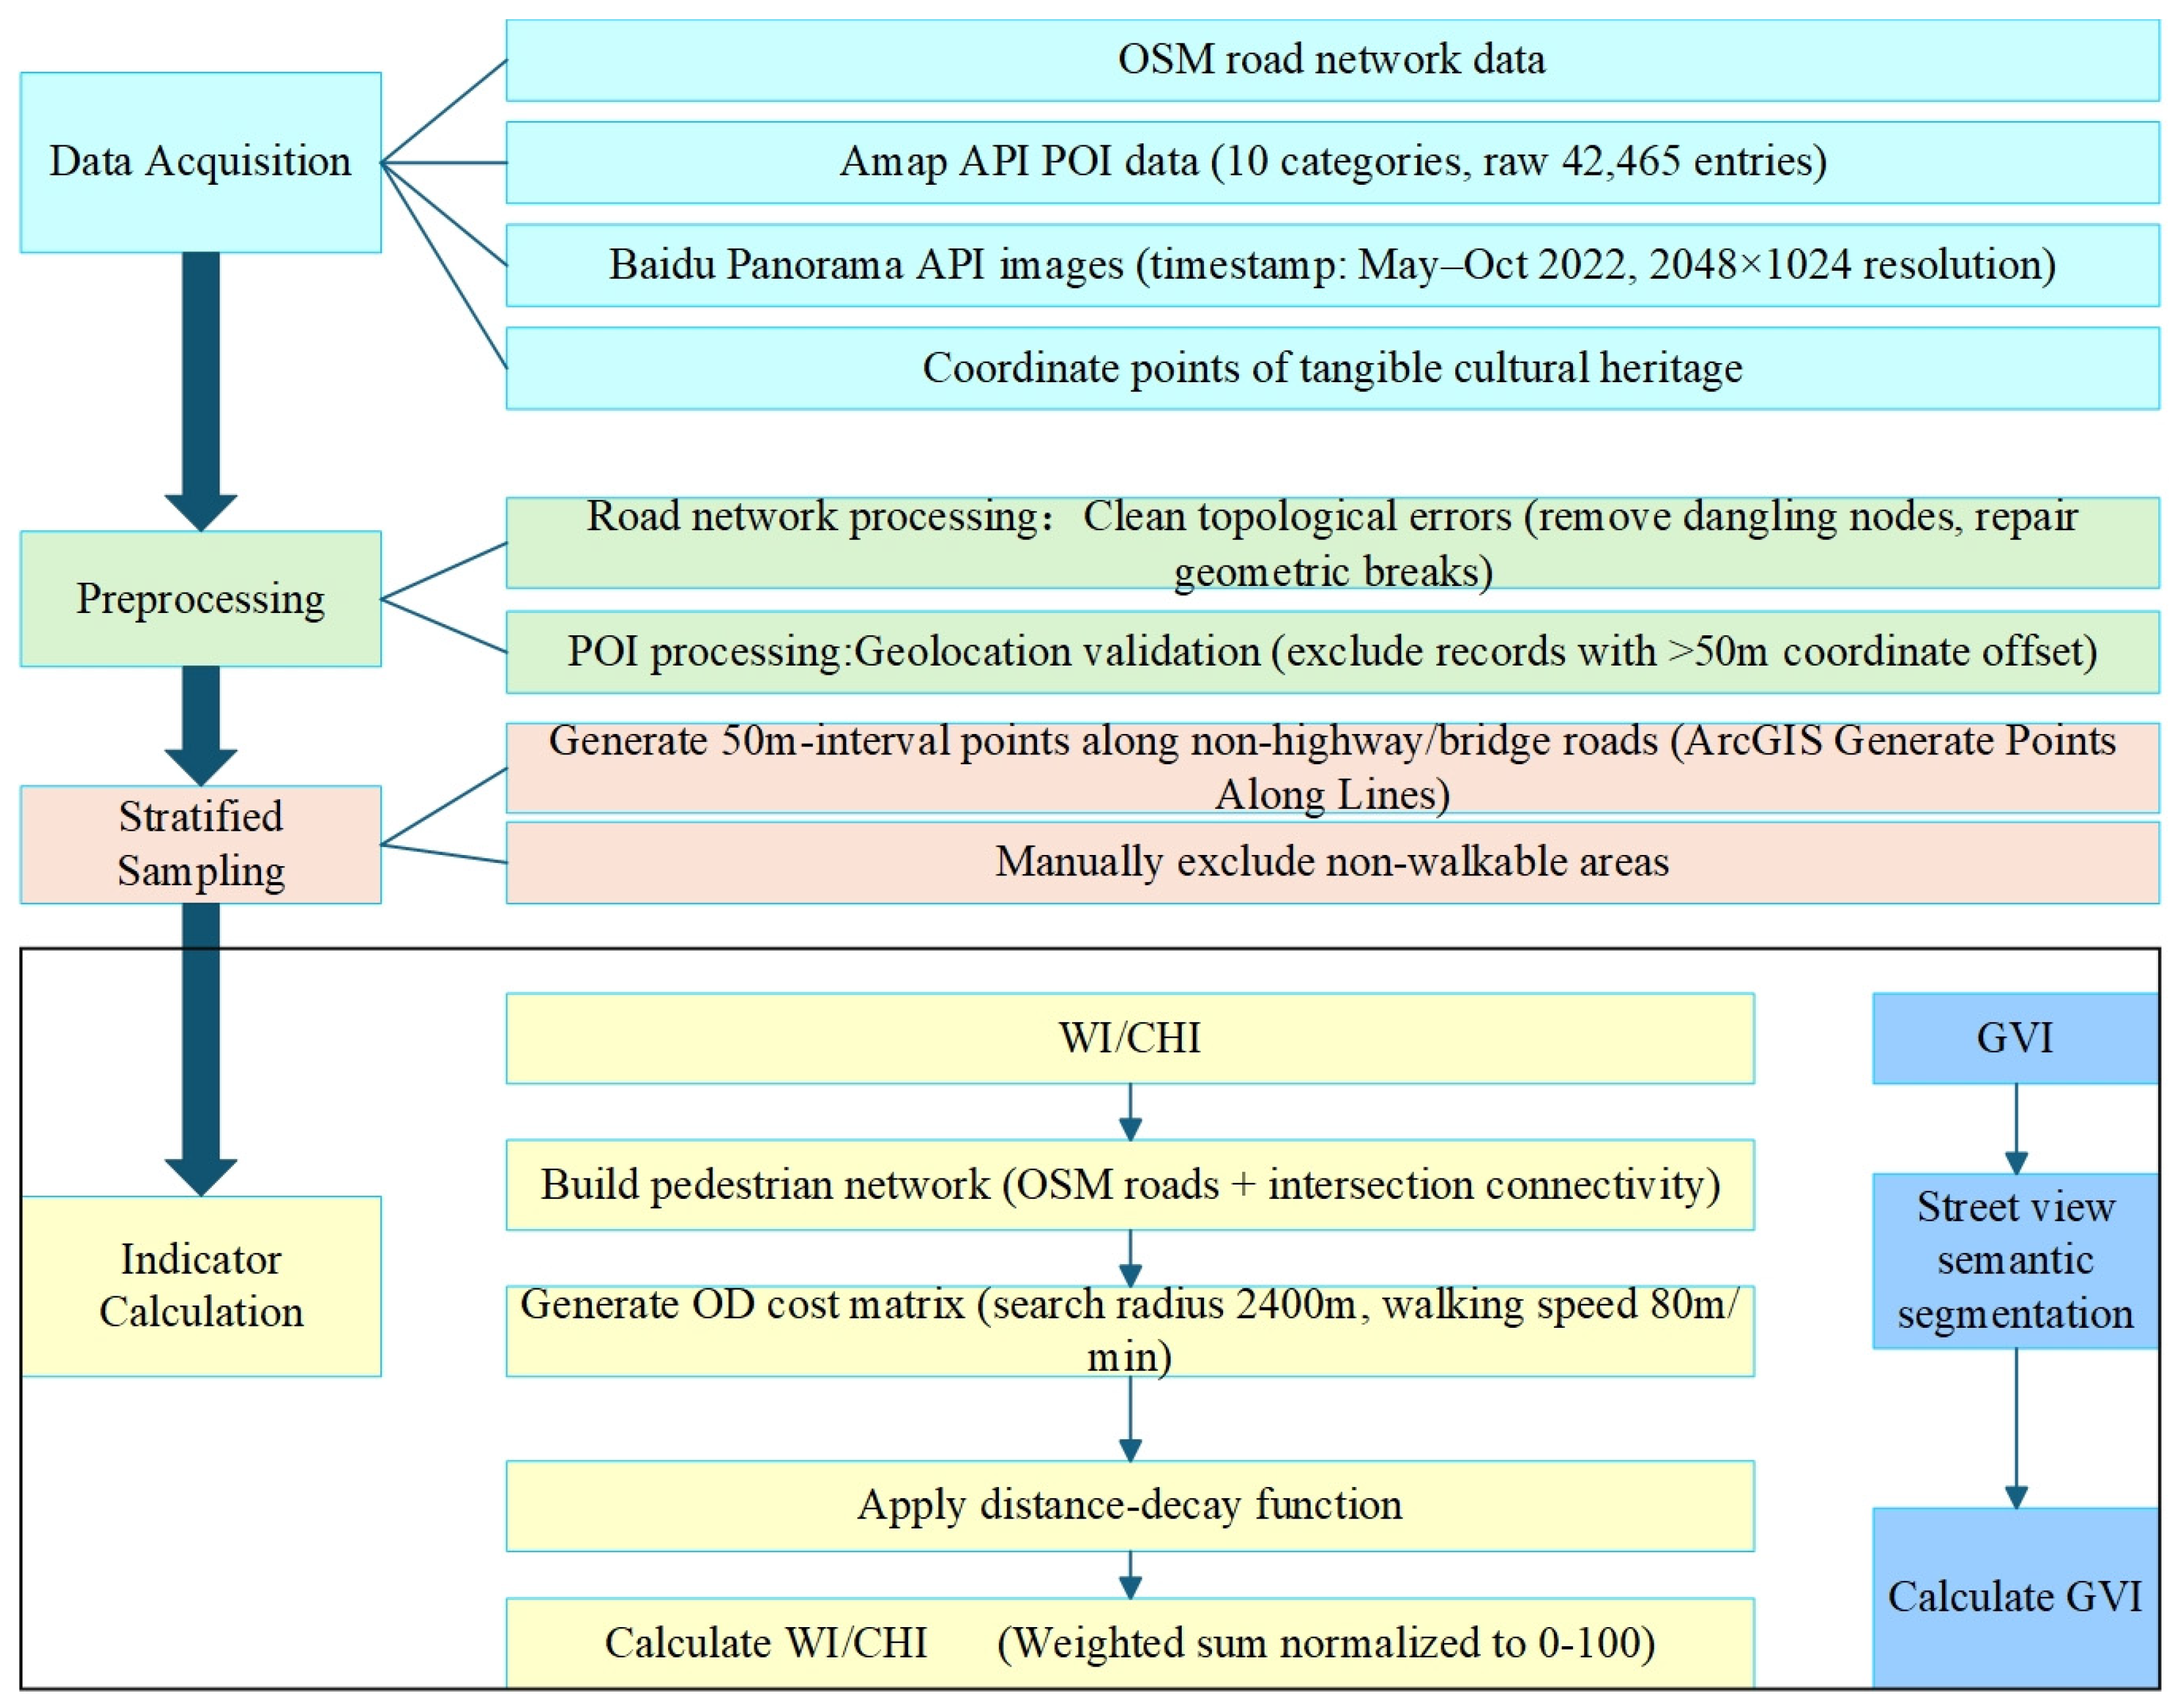
The data used for this study mainly included the following categories (Figure 2):
(1)
Road network topology within the study area was sourced from OpenStreetMap (OSM), classified through the “fclass” attribute. Specifically, roads were categorized into four types: trunk roads (elevated roads and expressways), primary roads (urban arterial roads), secondary roads (urban secondary arterial roads), and other roads (all remaining types of roads).
(2)
POI data were programmatically retrieved via the Amap (Gaode Map) API, encompassing 10 facility categories across commercial, recreational, and cultural domains, including dining establishments, retail stores, green spaces, and cultural venues. Following systematic classification, retrieval, and quality control (duplicate removal, geolocation verification), a validated dataset of 42,465 georeferenced POIs was compiled.
(3)
A stratified sampling framework was implemented to quantify green visibility. ArcGIS 10.7 was used to generate 50 m interval points along road centerlines, with manual exclusion of expressways and bridges (incompatible with pedestrian-oriented greening evaluation). Baidu Panorama Static Image API provided timestamped street views (May–October 2022) to mitigate seasonal foliage variations in cold climates. A total of 13,137 panoramic images were captured at 2048 × 1024 pixel resolution with 90° horizontal and 30° vertical viewing angles, optimizing vertical greenery representation. Biljecki’s research demonstrates that the GVI can capture pedestrian perspectives, but inherent biases exist due to vehicle-based image collection, seasonal variations, and inconsistent image resolution [39]. Therefore, we standardized the street view capture time, image resolution, and shooting angles to simulate pedestrian perspectives and reduce errors. This multi-source approach ensures temporal consistency across datasets while addressing cold-region ecological particularities through seasonal sampling constraints.

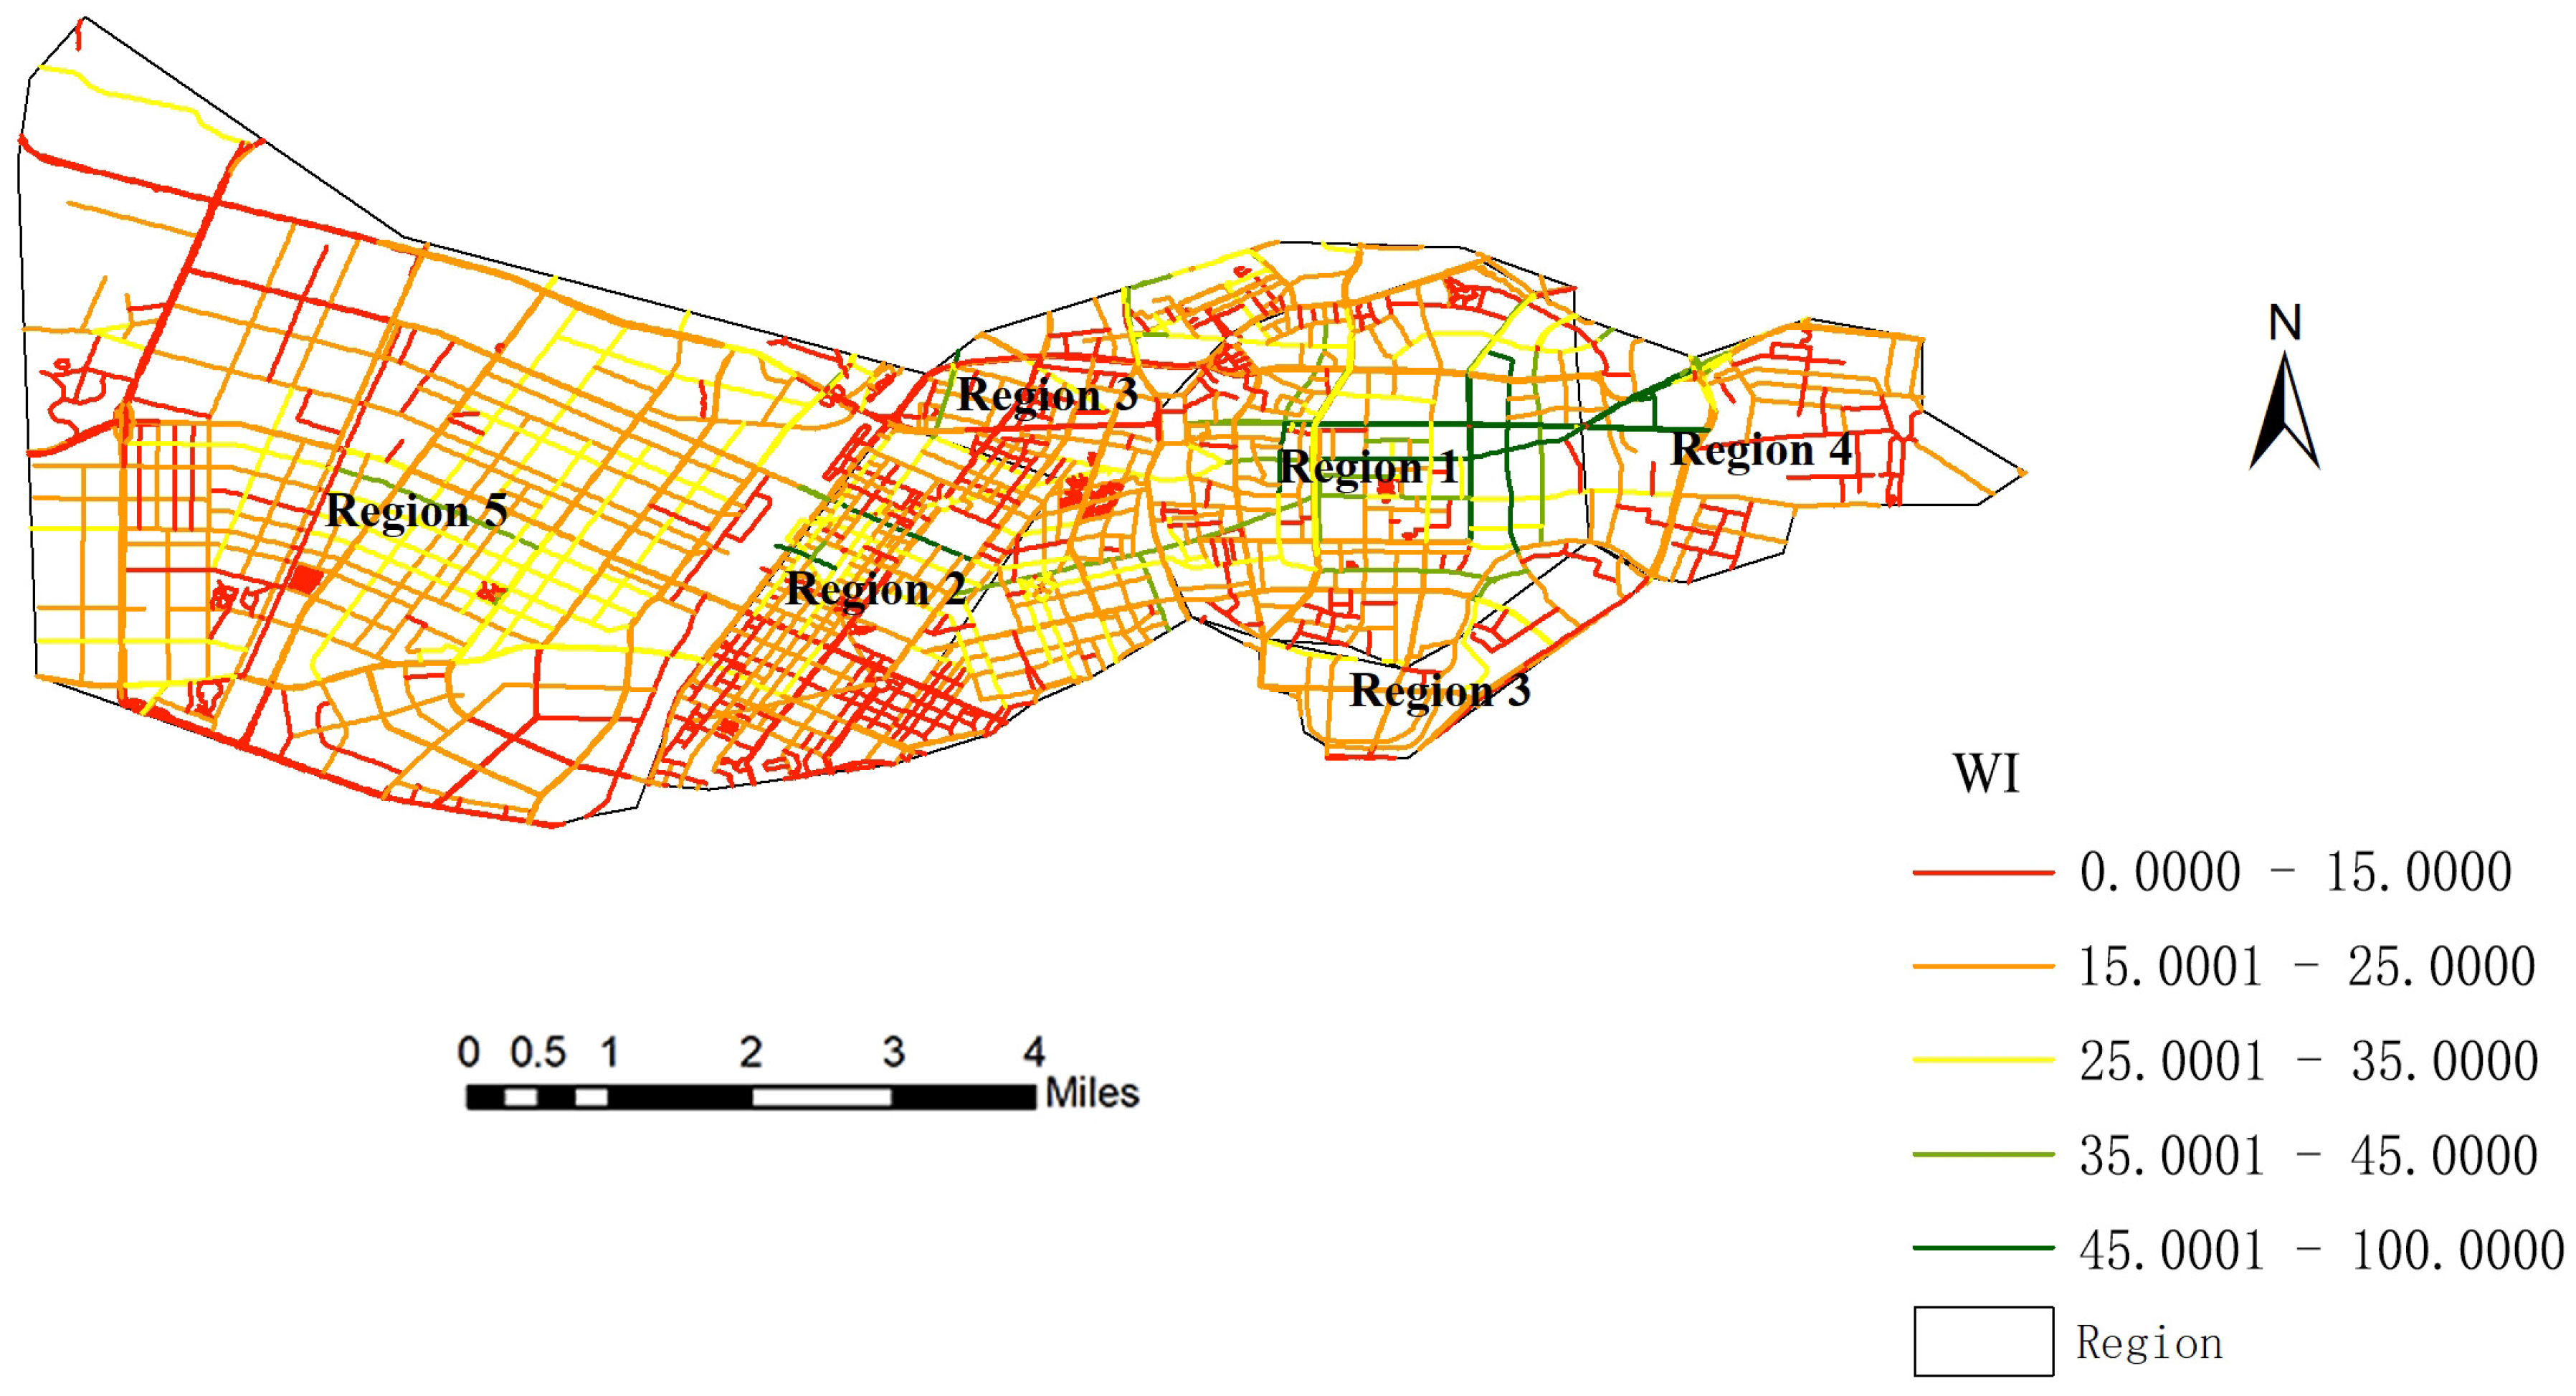
2.3. Evaluation of Walkability Index (WI)

WI is a quantitative indicator for measuring the attractiveness and accessibility of various facilities around streets to pedestrians [40]. It is calculated based on the types and densities of facilities, as well as the convenience for pedestrians to reach these facilities, aiming to reflect the pedestrian-friendly of streets in terms of facility distribution [41]. With the acceleration of urbanization and people’s increasing emphasis on healthy travel modes, WI has gradually become an important evaluation tool in urban planning, transportation design, and community building [42].
The classification and weighting of public service facilities were established through a synthesis of international benchmarks and localized adaptations. Building upon Lu’s foundational methodology [43], initially introduced to China and iteratively refined, we adopted a 50 m interval sampling strategy validated for geographical compatibility with our study area. Classification criteria integrated the Walk Score’s walkability metrics with contextual modifications—for instance, consolidating cafes and teahouses into a unified category reflecting regional consumption patterns. Facility selection and weight allocation adhered to Chinese standards. [44], prioritizing ten core categories: grocery stores, restaurants, bars, parks, cafes/teahouses, shops, bookstores, schools, banks, and entertainment venues. A complete taxonomy with facility-specific weights is systematically presented in Table 1 [45], ensuring methodological transparency and replicability.
The calculation of the WI incorporated the distance decay effect, which accounts for the diminishing accessibility of public facilities as the distance from a given street feature point increases. Specifically, the initial weight assigned to each facility decayed systematically with increasing distance from the starting point, following a cubic distance decay function [40], guided by dual temporal thresholds, with maximum scores for amenities within a 5 min walking radius and zero allocation beyond 30 min. In accordance with the standards adopted by Walk Score, a standard walking speed of 80 m per minute was adopted. The distance decay function was formulated as follows (Table 2):
The calculation of the single-point WI is influenced by the distance of facilities, their weights, and the attenuation effect. In this study, an Origin–Destination Cost Matrix was constructed in ArcGIS10.7 to calculate the WI. The process mainly involves the following steps: (1) A transportation network was created using ArcGIS 10.7, which serves as the basis for calculating walking distances. (2) With the starting point as the center, walking distances to different types of facilities were calculated. Weights were assigned based on these distances and attenuation coefficients, and the sum of these weights was used to derive the basic weight. (3) The corrected single-point WI was normalized to a range of 0 to 100 using a normalization formula. (4) The average value of the walkability indices of characteristic points on each street was calculated and used as the WI for the street.
The WI is calculated as follows:
W = i n ( W i × D l ) / 100
where W i is the impact weight of a certain type of facilities and D l is the distance attenuation coefficient.
The normalization formula is as follows:
W s c o r e = W W min W max W min × 100  
where W max is the maximum value of the WI, and W min is the minimum value of the WI.

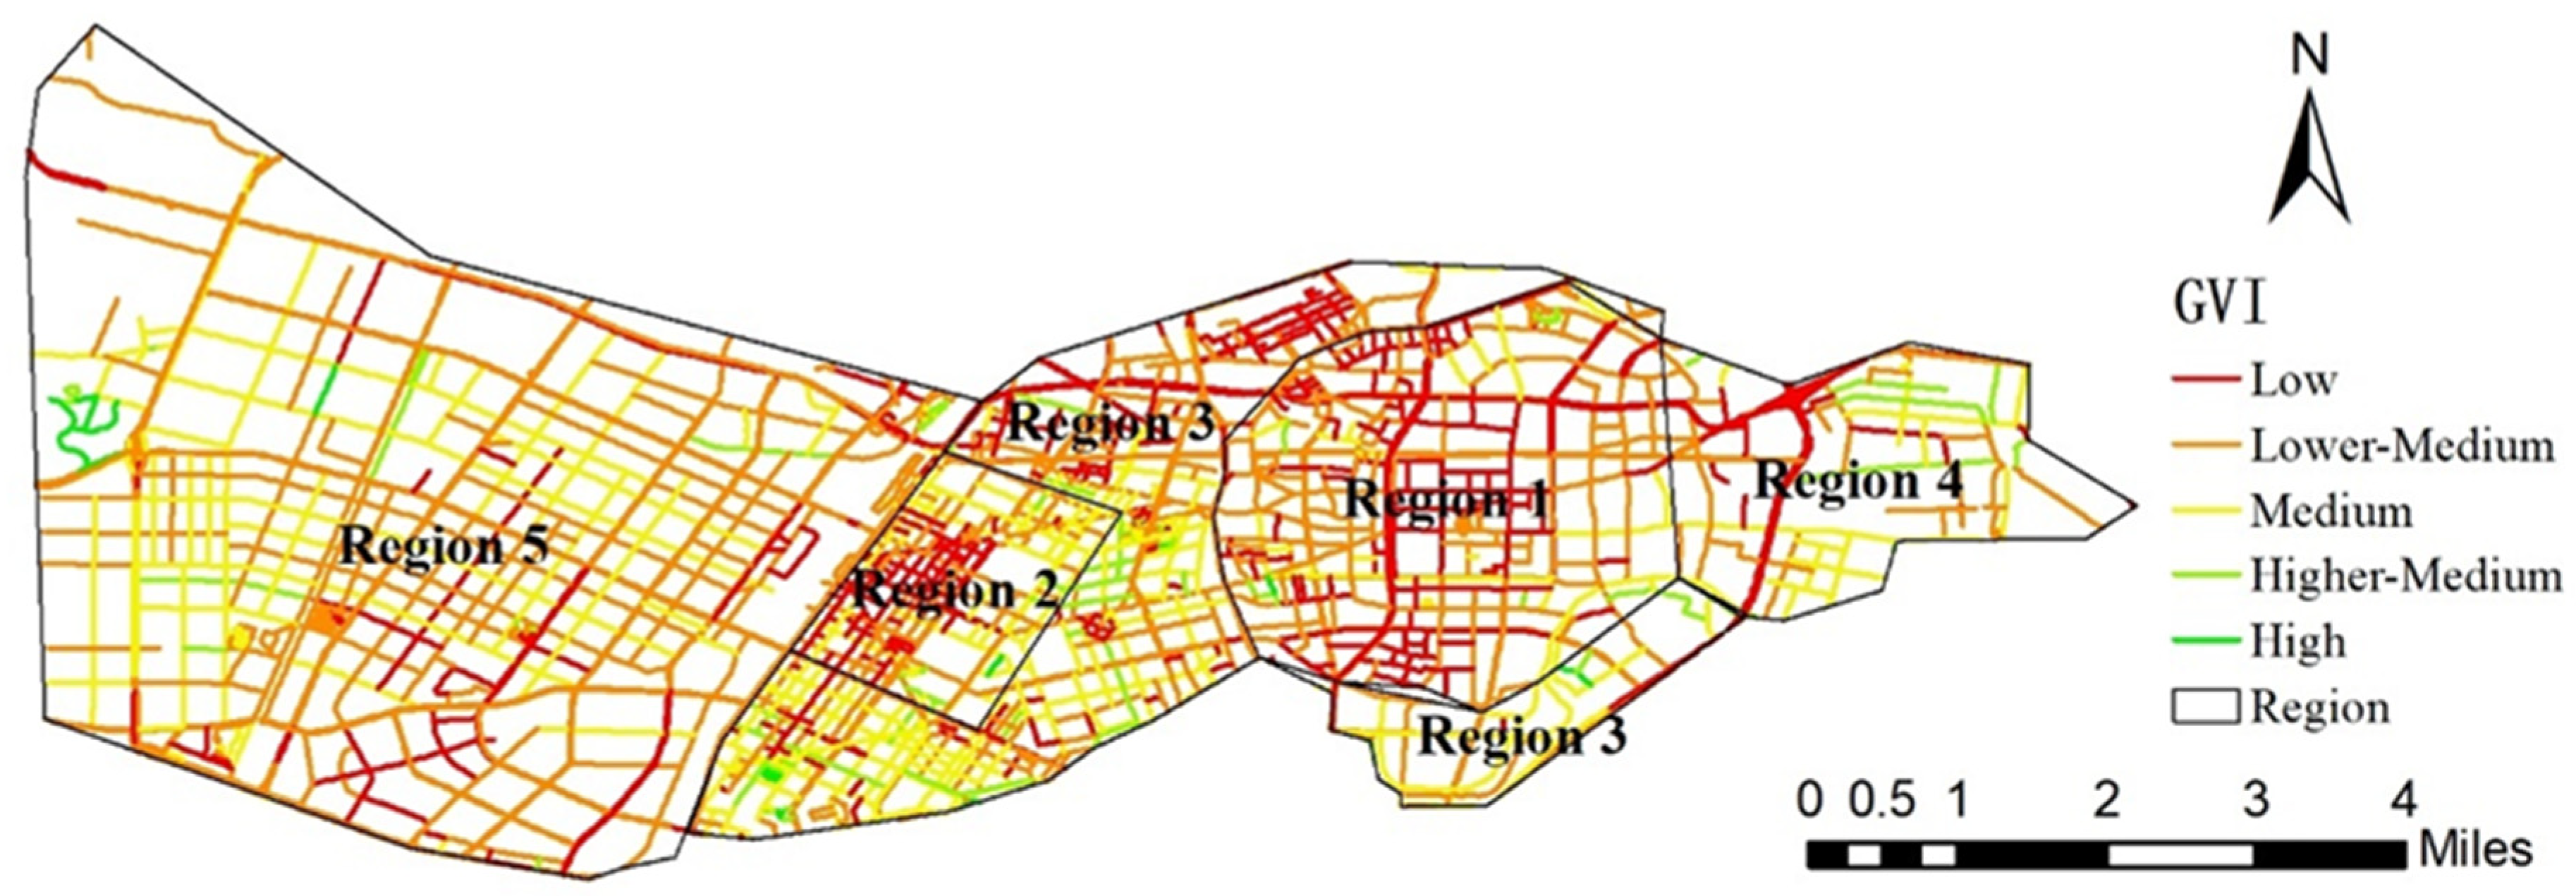
2.4. Evaluation of Green View Index (GVI)

The GVI quantifies street-level vegetation visibility (trees, lawns) through street-view imagery (SVI) processing and semantic segmentation techniques. Although divergent from conventional urban green space metrics in measurement paradigms, GVI uniquely captures human-centric spatial explicitness of greenery, exhibiting robust correlations with residents’ perceptual greenness [17,46,47]. Anchored in this perceptual validity, we operationalize GVI as an empirically grounded proxy for evaluating human-scale greening conditions in streetscapes, bridging objective spatial abundance with subjective environmental experiences.
Panoramic images were captured at 50 m intervals using the equal-spacing method. Then, the images were programmatically converted from the BGR color space to the HSV color space using the OpenCV library (v4.x) via its Python interface (cv2 module) in Python 3.9. The range of HSL values for green pixels was determined through manual calibration to ensure accuracy. Based on these calibrated values, a threshold was set to identify the proportion of green pixels in the street view images. This method effectively quantifies the green cover in urban environments, contributing to the assessment of street greening. The identification of tree-lined areas is shown in Figure 3.
The streetscape images processed as above were used to calculate the GVI for each sample point according to the following formula:
G V I = G r e e n A r e a F i e l d   o f   V i e w A r e a × 100%
where “Green Area” refers to the area occupied by green vegetation within the field of view, and “Field of View Area” refers to the total area within the observer’s field of view.
In this study, the average Green View Index (GVI) of sampling points along each street was used as the GVI for that street, and the average GVI of streets within each area is used as the GVI for that area.

2.5. Evaluation of Cultural Heritage Index (CHI)

Due to the consistency requirements of the coupling coordination degree model, we selected point source data for tangible heritage data [48,49]. Geographic coordinates of each heritage asset were geocoded from registered addresses and subjected to kernel density estimation (KDE) in ArcGIS 10.7, enabling street-level quantification of heritage spatial abundance. This granular approach addresses a critical methodological gap: prevailing heritage metrics prioritize macro-scale indices (e.g., urban competitiveness [50], sustainability monitoring [10], point-of-interest (POI) density analyses [51], and resilience assessments [52]), neglecting streetscape-specific frameworks. However, a critical gap persists in street-level analytical frameworks and standardized methodologies. To resolve this, we adapted the Weighted Index (WI) methodology (Section 2.3) into a street-scale tangible heritage abundance metric.
To quantify the spatial distribution of cultural heritage resources in Shenyang City, Kernel Density Estimation (KDE) was employed to generate a distribution map of listed historic buildings, municipal and above-level cultural heritage sites. In accordance with the aforementioned methods for calculating WI, taking individual heritage sites as attraction points, the CHI was calculated. This index provides a quantitative measure of the richness and spatial concentration of historical resources within the study area.
Cultural heritages were categorized into four hierarchical levels: national-level, provincial-level, municipal-level, and other historic buildings. Each level was assigned a distinct weight based on its significance and conservation status. The weights of these four types of cultural heritage are 4, 3, 2, and 1, respectively.

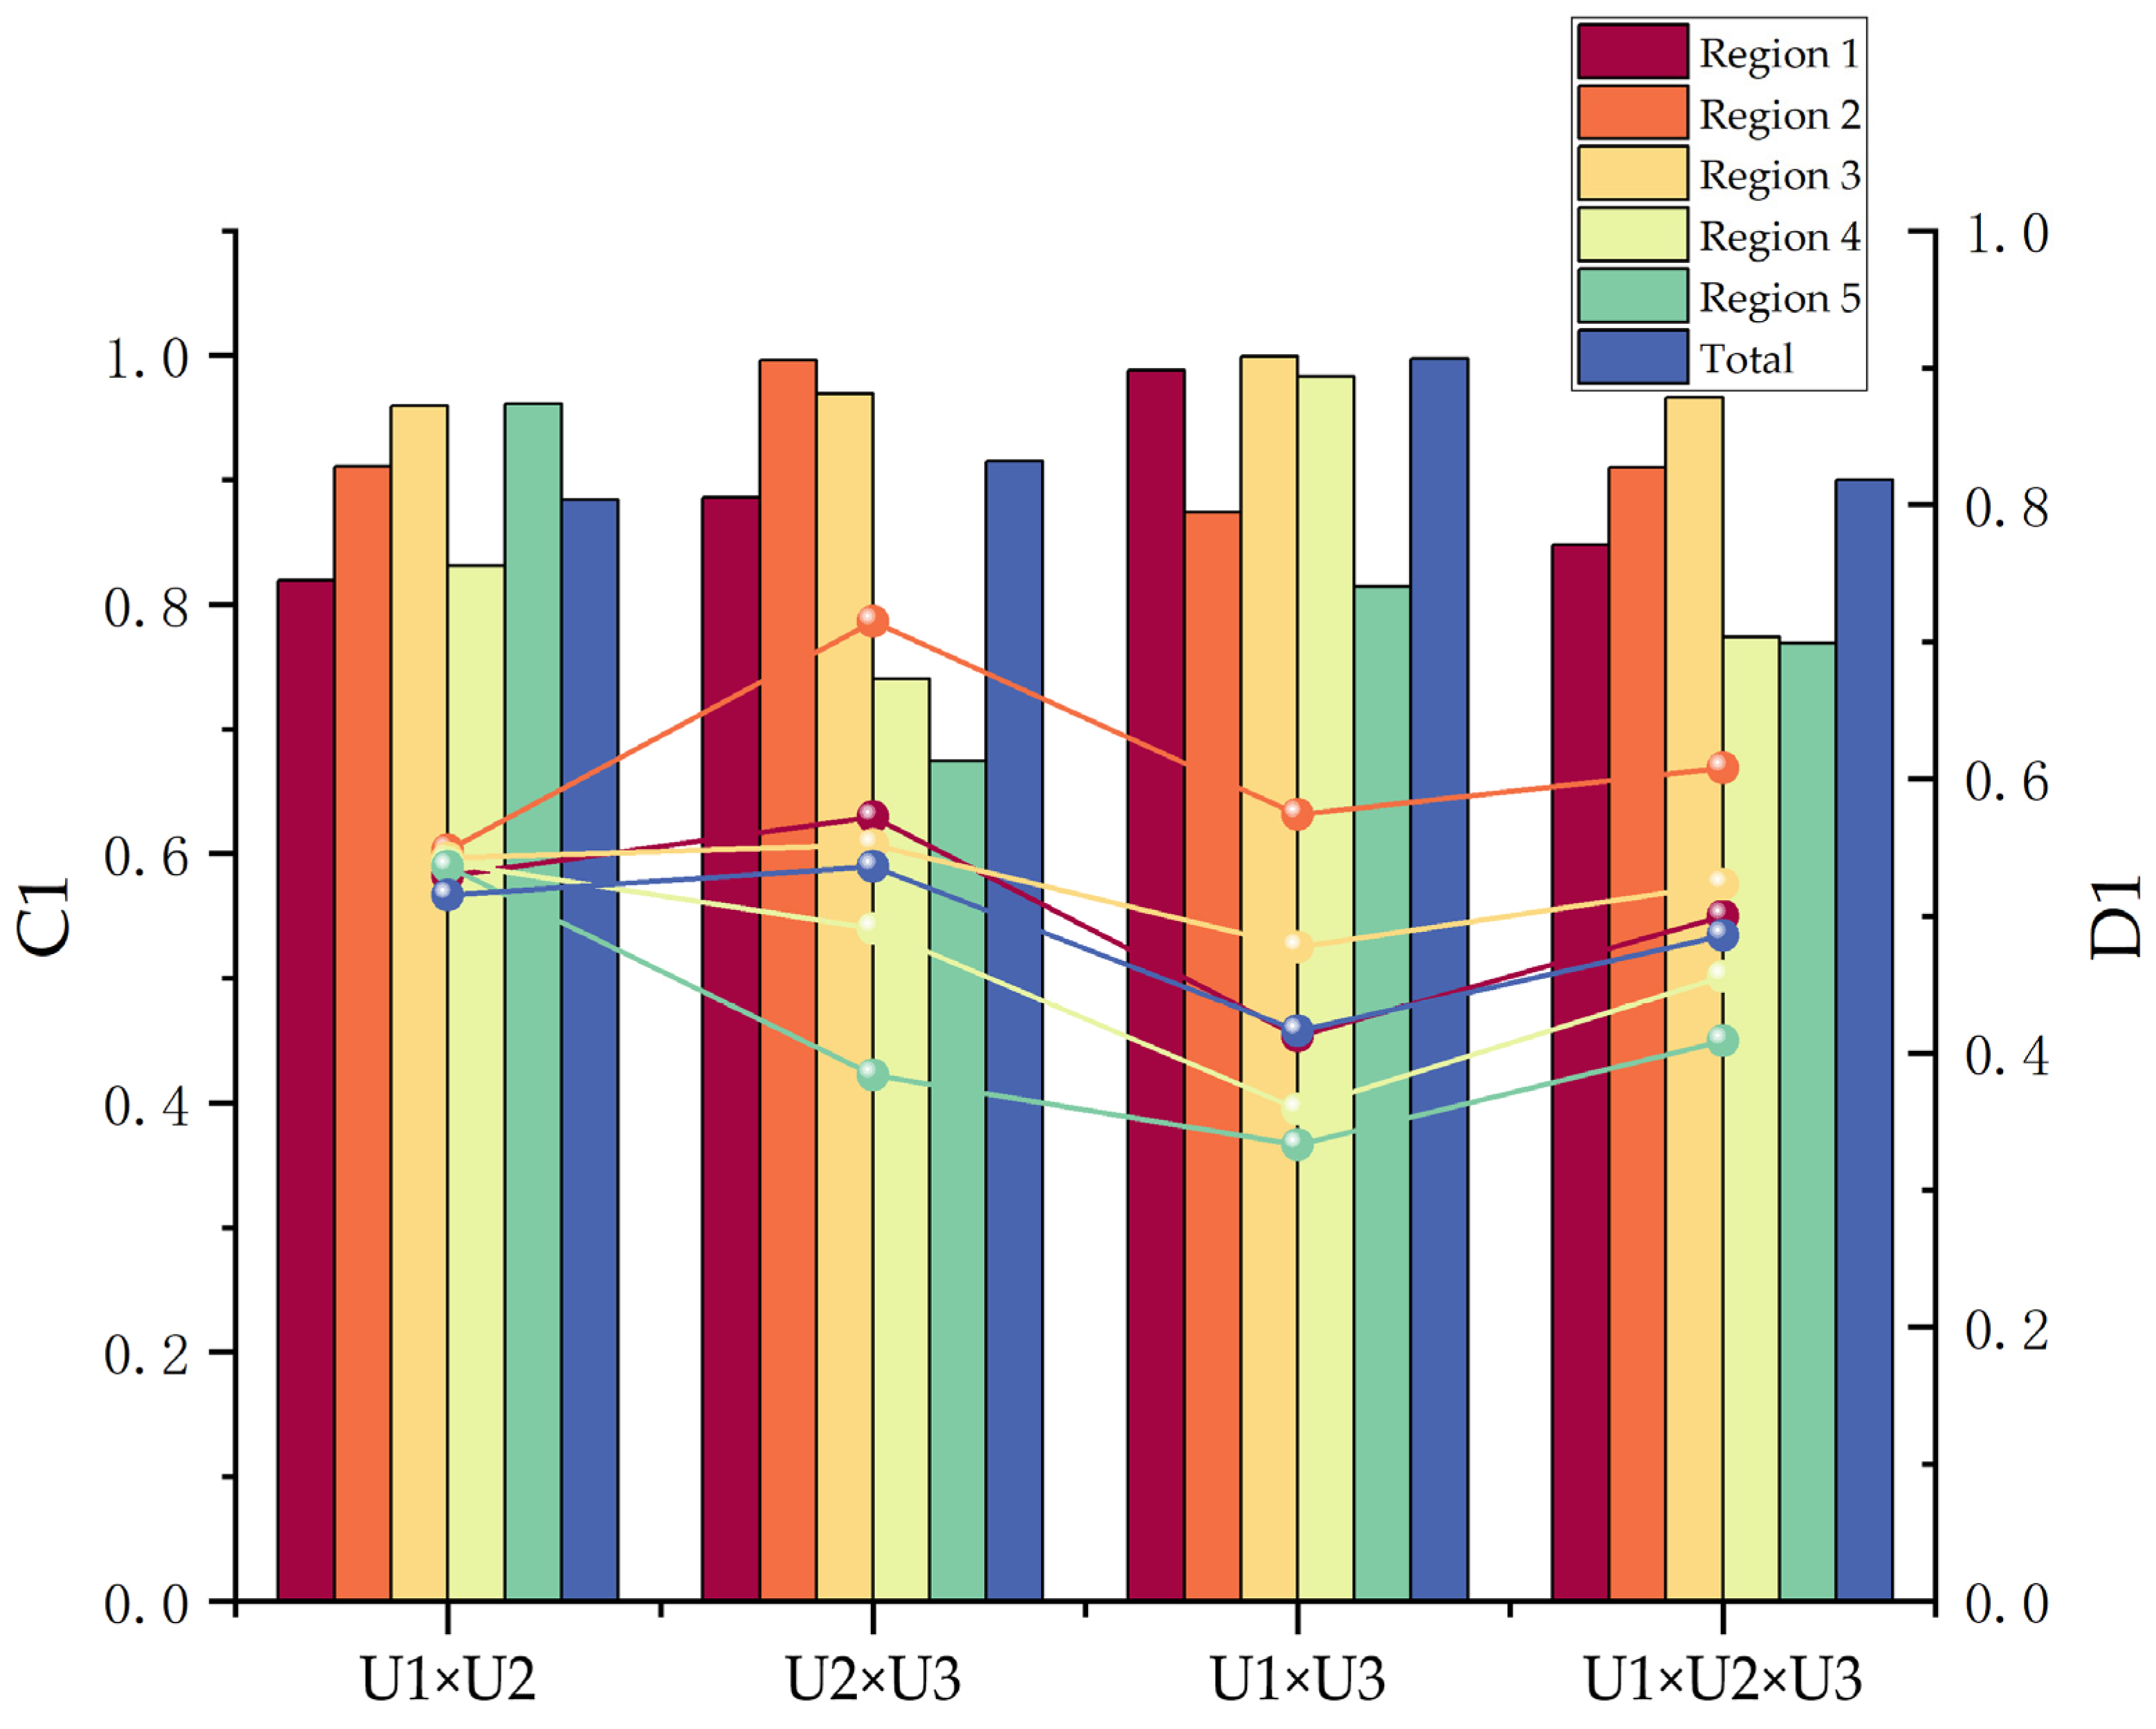
2.6. Coupling Coordination Degree Model (CCD)

Given the complex, dynamic, and imbalanced interactions between different systems, the capacity coupling coefficient model was employed. A coupling coordination degree function that examines the relationship between regional street environments and the spatial distribution of historical and cultural heritage resources was then developed. The N-dimensional coupling degree model is formulated as follows:
C n = n × U 1 U 2 U n U 1 + U 2 + + U n n 1 n
In the formula, C represents the coupling degree between systems, n denotes the number of systems, and Ui = f (xi1, xi2, …, xim), where m is the number of evaluation indicators for system U. This paper investigates the coupling between and among the WI, GVI and CHI. Therefore, n = 2 or 3. In this context, C [ 0 , 1 ] , U i = j = 0 j = m λ i j x i j , j = 0 j = m λ i j = 1 , U1, U2, and U3 represent the comprehensive evaluation indices for the WI, GVI and CHI, respectively. x and λ denote the standard values and weights of each indicator, respectively.
The coupling degree C ranges between 0 and 1. When C tends towards 0, it indicates that the systems or internal elements are in a loose or unrelated state, and the system tends towards disorder. When C tends towards 1, it signifies that the systems or internal elements achieve a benign coupling, and the system tends towards an ordered structure.
Although the coupling degree can indicate the trend and extent of interaction between systems, it cannot fully reflect the overall effectiveness and synergistic effects between systems. Therefore, the coupling coordination index is introduced to measure the degree of harmonious coexistence among systems or elements, reflecting the trend of the system transitioning from disorder to order. The coupling coordination index D is calculated using the following formula:
D = C T
T = i = 1 n α i × U i ,       i = 1 n α i = 1
where T represents the comprehensive harmonization index between systems. Assuming equal importance across all subsystems, α 1 = α 2 = α 3 = = α n = 1 n . This equal-weight allocation aligns with standard practices in entropy-based coupling analysis [53]. A higher value of D indicates a mutually optimizing relationship between the two systems, whereas a lower value of D suggests a mutually constraining relationship between them.

3. Results

3.1. Results of Overall Level of Subsystems

(1)
Results of Walkability Index (WI)
The score of WI represents functional walkability of the street. Higher scores indicate better walkability and greater convenience for residents’ travel, while lower scores suggest poorer walkability and lower convenience. This study adopted the classification standards recommended by Walk Score and categorized the walkability index into five levels based on the score, shown in Table 3.
The average WI of the roads within the research area is 42.66 (±11.4 SD), indicating that the overall functional walkability of Shenyang historic city is relatively poor and there is an overall deficiency of facilities within the area (Figure 4). The WI of each district and roads of different grades are shown in Table 4. There is a large difference in the WI of each district. The WI of Region 1 and Region 4 are relatively high, and the score of Region 5 is the lowest. There is also a large difference in the WI of roads of different grades. The WI of primary and secondary roads are relatively high, while the low-grade roads classified as “other” have the lowest scores.
(2)
Results of Green View Index (GVI)
According to Li’s grading system [54], street greenery visibility can be stratified into five distinct tiers: Low (0–5%), Lower-Medium (5–15%), Medium (15–25%), Higher-Medium (25–35%), and High (>35%). The empirical analysis of Shenyang reveals that the city’s overall GVI is 10.14% (±8.3 SD), falling within the lower-medium range. Significant variations in GVI values were observed across different road hierarchy classifications, with road segments categorized as “others” demonstrating the highest GVI values, while those classified as “trunk” exhibited the lowest readings. At the district level, significant spatial disparities emerge with mean GVI values distributed as follows (Figure 5 and Table 5): Region 1 (7.56%), Region 2 (10.06%), Region 3 (11.37%), Region 4 (8.04%), and Region 5 (11.20%). The inter-district GVI variations exceed those observed across road classification categories, indicating pronounced spatial inequity in urban greenery distribution.
(3)
Results of Cultural Heritage Index (CHI)
The composite CHI across the study area demonstrated substantial spatial heterogeneity, with a mean value of 18.73 (±23.4 SD). Notably, District 2 exhibited exceptional conservation status (CHI = 56.03), contrasting sharply with District 5’s markedly lower score (CHI = 5.73), representing a nearly tenfold differential. This pronounced gradient reveals significant heritage resource disparities across urban sectors, as quantified through geospatial autocorrelation analysis. The spatial clustering patterns, visualized through kernel density estimation (Figure 6), and detailed metric breakdowns (Table 6) collectively confirm the polarized distribution of cultural assets within the metropolitan framework.

3.2. Coupling Coordination Degree

3.2.1. Analysis of Regional Overall Coupling

The coupling coordination degree (CCD) among walkability (U1), green view (U2), and heritage resources (U3) systems was evaluated to assess their synergistic interactions. Following the classification by [55], CCD levels span 10 tiers, from “extreme disorder” to “superior coordination.” As shown in Table 7 and Figure 7, results indicate that most regional systems fall under “on the verge of disorder.” Notably, WI and GVI exhibit consistent “barely coordinated” status across all regions (CCD: 0.515–0.548), reflecting limited but stable synergy. In contrast, GVI and CHI display regional disparities: Region 2 achieves “moderate coordination” (CCD: 0.715), highlighting effective integration, while Region 5 lags with “mild disorder” (CCD: 0.384). The WI-CHI coupling remains notably weak (CCD: 0.333–0.574), underscoring poor alignment between facility distribution and heritage resources. Overall, the tri-system coupling registers a moderate CCD range (0.409–0.608), signaling substantial potential for optimizing multisystem synergy through targeted interventions.

3.2.2. Analysis of Coupling in Typical Historic Districts

To deepen insights into the systemic coupling dynamics, a focused analysis was conducted on two emblematic historic districts: Shengjing Imperial City and Zhongshan Road. These case studies were selected to dissect the interplay of WI, GVI, and CHI with their coupling coordination statuses comparatively evaluated (Table 8). This granular examination reveals how spatial, ecological, and heritage factors interact in culturally significant urban cores, offering actionable context to complement broader regional findings.
(1)
Shengjing Imperial City Historic District
As Shenyang’s cultural and commercial epicenter, Shengjing Imperial City Historic District hosts the city’s densest concentration of heritage sites and vibrant commercial activity. Despite this, systemic coupling remains suboptimal: the tri-system coupling coordination index (CCD) registers 0.54 (“barely coordinated”), reflecting weak pairwise synergies (Table 8). While the Walkability Index (WI: 64.7) aligns with field observations—supported by diverse amenities and bustling zones like Zhongjie pedestrian street—the Green View Index (GVI: 6.9%) reveals critically low greenery. Zhongjie exemplifies this imbalance, with high commercial functionality but minimal vegetation. We invited four experts to conduct field surveys and rate the Green View Index (GVI), street functionality, and perception of surrounding heritage for each street in the study area. Results indicated that expert ratings of street functionality closely aligned with computational measurements. However, the perceived GVI score (40.18 on a 100-point scale, where a street’s perceived GVI equals its rating percentage) suggested a higher subjective greening perception, revealing a significant discrepancy with the computational data. Notably, Nanshuncheng Road demonstrates a perceptual mismatch: despite moderate calculated GVI (20.01%), field surveys observed higher greenery (GVI score = 77.5), likely due to pedestrian-level visibility nuances and algorithmic limitations in capturing micro-scale vegetation. Similarly, the Cultural Heritage Index (CHI: 28.7) diverged from on-site valuations, underscoring computational biases in heritage quantification. This discrepancy might be due to the study area’s location encompassing the Shenyang Imperial City (a UNESCO World Heritage Site), where the prominent cultural ambiance potentially influenced perceptual evaluations. Figure 4 illustrates these contrasts through representative streetscapes of Zhongjie and Nanshuncheng Road.
(2)
Zhongshan Road District
Zhongshan Road District, renowned for its historic architectural clusters (CHI: 72.6), achieves a higher tri-system CCD of 0.635 (“elementary coordination”), signaling improved systemic integration. The Walkability Index (WI: 54.3) reflects moderate functional accessibility, while its Green View Index (GVI: 8.6%) surpasses Shengjing’s, yet remains suboptimal. Field surveys documented dense urban amenities and widespread vegetation, except along major thoroughfares. However, GVI calculations inconsistently captured these patterns: near Zhongshan Square, despite documented greenery, the GVI was ranked moderate-to-low. This disparity likely arises from algorithmic biases in quantifying vegetation within geometrically complex streetscapes. As shown in Figure 8, this disparity is highlighted through the comparison between the observed greening at Zhongshan Square (GVI score = 72.5) and its calculated GVI value (7.56%). The results demonstrate a clear discrepancy between human-centric perceptions of street greening—assessed through expert field surveys from a pedestrian perspective—and computational data-driven evaluations.

4. Discussion and Limitations

4.1. Discussion

Shenyang’s historic city exhibits moderate walkability (WI: 42.66), with stark spatial disparities, which underscore the need for targeted interventions. This could be achieved through increasing street permeability [56,57] and enhancing pedestrian infrastructure. Comprehensive urban improvement strategies must integrate multifaceted dimensions, centering on human-centric perceptual factors such as pedestrian visual cognition, spatial comfort, and environmental psychological engagement [58,59,60,61]. Street greening remains a systemic weakness, with Shenyang’s overall green view (GVI:7.96%) [62] failing to meet moderate standards [54]. Moreover, it remains at a relatively low level compared to cities in the same climatic zone, such as Harbin (GVI: 15.75%) [63] and Changchun (GVI: 12.45%) [62]. To enhance street vegetation coverage, strategic interventions such as establishing street corner parks and implementing multilayered planting systems could include [64,65]. Regarding the CHI, its spatial distribution predominantly correlates with the density pattern of cultural heritage sites, resulting in substantial disparities across different regions. Region 1 exhibits the highest Cultural Heritage Index (CHI), attributable to the presence of the UNESCO World Heritage Site—Shenyang Imperial Palace—within its boundaries. Cultural heritage resources have been shown to stimulate tourism development, potentially through mechanisms such as cultural performance offerings [66]. Concurrently, tourists’ personal engagement with heritage assets has been demonstrated to significantly influence the experiential quality of heritage tourism [67]. The moderate tri-system coupling (CCD: 0.409–0.608) in Shenyang’s historic city reflects fragmented integration, particularly between walkability and heritage conservation. Urban planning must prioritize pedestrian-priority corridors and “green-cultural networks” linking heritage nodes to green spaces [68,69], transforming historic zones into multifunctional landscapes.
In the realm of heritage tourism, Joanna et al. demonstrated that heritage tourists’ primary motivations revolve around recreational activities, with visitation decisions often influenced by recommendations from family and friends. However, audiovisual communication, cultural ambiance, and on-site engagement emerged as the most critical factors shaping their experiential quality during visits [70]. Haywantee further highlighted that tourists’ perceived experiences significantly influence their attachment to cultural heritage sites, which directly correlates with revisit intentions [71]. Complementing this, Tomás identified that among four visitation motivations—hedonic, cultural, convenience, and circumstantial—cultural dimensions exhibit the strongest relevance [72]. Regarding urban heritage conservation and planning, Noha advocated for community- and culture-led sustainable approaches to management and spatial design, arguing that such strategies can synergistically enhance urban tourism and sustainable development [73]. Similarly, the symbiotic relationship between tourism and heritage sites has been recognized as a vital pathway to urban sustainability, necessitating active community participation [74]. These findings collectively underscore that the role of cultural heritage in tourism promotion fundamentally resides in fostering emotional connections between visitors and heritage assets.
Typical historic districts outperform citywide averages in WI and CHI, reflecting robust heritage resources and functional diversity. However, their GVI lags behind urban averages, while exposing a critical trade-off: commercial vitality often occurs at the expense of green infrastructure. From a human-centric perceptual perspective, the heritage sites within this area demonstrate relatively high greening levels, while the surrounding commercial streets exhibit significantly lower greening levels—an observation consistent with our analytical discussions. Although the coupling degrees among the three systems in typical historic districts exceeded the regional average, they still remained at an intermediate level according to relevant research standards. Specifically, the Shengjing Imperial City demonstrated lower coupling between green space quality and cultural heritage conservation, which adversely affected the overall tri-system coupling [75,76]. In contrast, the Zhongshan Road District exhibited a higher coupling degree (0.792) between street functionality and cultural heritage preservation. According to previous studies, the phenomenon of low greening levels in historic districts is not uncommon, while the commercial atmosphere may diminish tourists’ perception of cultural elements [77]. Additionally, busy streets can negatively impact local residents’ experience of urban street public spaces [78], affecting comfort and accessibility, as well as street safety [79]. To address this issue, these two districts should prioritize tree-shrub combinations as primary landscape features, complemented by space-efficient supplementary elements such as roadside vertical greening and potted plants to enhance street greening quality [64,77,80]. Meanwhile, it is crucial to maintain street livability that accommodates all age groups [81], which requires not only fulfilling efficient transportation needs but also integrating social interaction and recreational purposes—this can be achieved through the provision of street amenities [82]. Indeed, leveraging cultural heritage resources for associated greening initiatives can effectively enhance urban vegetation coverage, as exemplified by Aykan’s conceptual framework of cultural landscapes and heritage gardening practices [83]. Simultaneously, strategic emphasis should be placed on the profound significance of both tangible and intangible heritage assets in driving urban regeneration processes and advancing environmental conservation objectives within metropolitan contexts [84]. Simultaneously, it is imperative to regulate the density of commercial buildings and standardize their architectural design to preserve the cultural ambiance of the streetscapes [85].
Building on empirical insights, this study proposes a tripartite intervention framework for heritage cities seeking to harmonize sustainable tourism with cultural preservation:
(1)
Strategically retrofit green infrastructure systems through vegetation coverage optimization and culturally resonant phytodesign, prioritizing heritage-core zones to achieve ecological-cultural symbiosis via native, symbolically significant species that enhance aesthetic coherence between greening initiatives and historic contexts [84].
(2)
Implement pedestrian-centric infrastructure modernization integrating universal accessibility retrofits, microclimate-responsive sidewalks, and heritage-wayfinding systems to synergistically elevate walkability safety and comfort metrics [86].
(3)
Institutionalize tri-system coordination planning by anchoring heritage landmarks as polycentric organizers, explicitly coupling WI-GVI-CHI spatial synergies through multiscalar governance: macroscale land-use regulations aligning development intensity with heritage-green corridors, mesoscale thematic itineraries interlinking high-CHI/GVI clusters, and microscale multisensory interpretation platforms combining olfactory, haptic, and auditory heritage experiences [87,88].

4.2. Limitations and Future Directions

The current study faces several methodological and analytical limitations. The coupling coordination model primarily focuses on quantitative interactions among walkability (WI), green view index (GVI), and cultural heritage index (CHI), but overlooks critical human-centric dimensions, such as pedestrian sensory experiences and socioeconomic dynamics [87]. Future research should adopt hybrid methodologies combining remote sensing (for GVI/CHI mapping) with empirical field measurements [89,90]. The Cultural Heritage Index (CHI) is exclusively based on tangible heritage datasets, while intangible cultural heritage elements and their emotional resonance with residents/visitors are underexplored. This narrow focus may limit the comprehensiveness of heritage–urban interaction assessments [91]. Future research should develop a bimodal heritage index that balances tangible assets (e.g., historic architecture) with intangible elements (e.g., cultural festivals, oral traditions), exploring how their synergies enhance urban tourism appeal and resident identity. In addition, the GVI calculation relies on remote sensing data, which may exhibit discrepancies with field surveys due to uneven vegetation distribution and street geometric variations [64]. The model does not incorporate street hierarchy or pedestrian flow dynamics, which could influence walkability accuracy. The emotional impact of green spaces and local residents’ actual usage patterns should be taken into consideration in future studies [92,93]. Human-Centric indicators, such as pedestrian satisfaction surveys and emotional response metrics should be invested to assess the “emotional coupling” between green spaces, heritage sites, and users.

5. Conclusions

This study revealed critical interdependencies and disparities among walkability, green view, and heritage systems in Shenyang historic city. While moderate walkability and heritage density existed, systemic imbalances constrained sustainable development. The coupling degree between Walkability Index (WI) and Cultural Heritage Index (CHI) in Shenyang’s historic districts reaches 0.997, while their coordination degree registers 0.416. This quantifiable disparity indicates intense bidirectional interactions between the two indices, yet reveals significant systemic disharmony in their developmental synchronization. Historic districts exemplified the tension between functional vitality and ecological neglect, underscoring the need for holistic planning frameworks. The proposed “green-cultural networks” and pedestrian-priority corridors offered actionable pathways to enhance tri-system synergy, balancing preservation with livability. Methodologically, the research highlighted the necessity of hybrid data approaches to mitigate algorithmic biases and incorporate perceptual realities. Ultimately, Shenyang’s case serves as a microcosm for global historic cities grappling with modernization pressures. By prioritizing adaptive reuse of heritage assets [94], ecological restoration, and inclusive pedestrian design [95], cities can cultivate resilient urban landscapes where history, ecology, and mobility coexist dynamically. Future work must expand these principles across diverse cultural and spatial contexts, advancing a unified paradigm for heritage-driven urban sustainability.

Author Contributions

Conceptualization, L.L.; methodology, Y.W.; software, Y.W.; validation, Y.W. and J.Z.; formal analysis, Y.W.; investigation, Y.W. and J.Z.; resources, Y.W.; data curation, Y.W.; writing—original draft, Y.W.; writing—review & editing, L.L.; visualization, L.L.; supervision, L.L.; project administration, L.L.; funding acquisition, L.L. All authors have read and agreed to the published version of the manuscript.

Funding

This research was funded by National Natural Science Foundation of China grant number 42301256 and The Ministry of Industry and Information Technology Project grant number TC220H05X-04.

Institutional Review Board Statement

Not applicable.

Informed Consent Statement

Not applicable.

Data Availability Statement

The data presented in this study are openly available. The data acquisition channels are presented in the Materials and Methods section of the article.

Conflicts of Interest

The authors declare no conflict of interest.

References

  1. Jasrotıa, A.; Gangotıa, A. Smart cities to smart tourism destinations: A review paper. J. Tour. Intell. Smartness 2018, 1, 47–56. [Google Scholar]
  2. Page, S.J.; Connell, J. Urban tourism. In Tourism; Routledge: Abingdon, UK, 2020; pp. 443–465. [Google Scholar]
  3. Williams, S. Tourism Geography: Critical Understandings of Place, Space and Experience, 3rd ed.; Routledge: London, UK, 2014; ISBN 978-0-203-74388-1. [Google Scholar]
  4. Faraji, A.; Khodadadi, M.; Nematpour, M.; Abidizadegan, S.; Yazdani, H.R. Investigating the positive role of urban tourism in creating sustainable revenue opportunities in the municipalities of large-scale cities: The case of Iran. Int. J. Tour. Cities 2020, 7, 177–199. [Google Scholar] [CrossRef]
  5. Lak, A.; Gheitasi, M.; Timothy, D.J. Urban regeneration through heritage tourism: Cultural policies and strategic management. J. Tour. Cult. Change 2020, 18, 386–403. [Google Scholar] [CrossRef]
  6. García-Hernández, M.; De la Calle-Vaquero, M.; Yubero, C. Cultural Heritage and Urban Tourism: Historic City Centres under Pressure. Sustainability 2017, 9, 1346. [Google Scholar] [CrossRef]
  7. Jiang, J.; Zhou, T.; Han, Y.; Ikebe, K. Urban Heritage Conservation and Modern Urban Development from the Perspective of the Historic Urban Landscape Approach: A Case Study of Suzhou. Land 2022, 11, 1251. [Google Scholar] [CrossRef]
  8. Spennemann, D.H.R. The Shifting Baseline Syndrome and Generational Amnesia in Heritage Studies. Heritage 2022, 5, 2007–2027. [Google Scholar] [CrossRef]
  9. Smith, L. Uses of Heritage; Routledge: Abingdon, UK, 2006. [Google Scholar]
  10. Guzmán, P.C.; Roders, A.R.P.; Colenbrander, B.J.F. Measuring links between cultural heritage management and sustainable urban development: An overview of global monitoring tools. Cities 2017, 60, 192–201. [Google Scholar] [CrossRef]
  11. Azzopardi, E.; Kenter, J.O.; Young, J.; Leakey, C.; O’Connor, S.; Martino, S.; Flannery, W.; Sousa, L.P.; Mylona, D.; Frangoudes, K.; et al. What are heritage values? Integrating natural and cultural heritage into environmental valuation. People Nat. 2023, 5, 368–383. [Google Scholar] [CrossRef]
  12. Lei, H.; Zhou, Y. Conducting Heritage Tourism-Led Urban Renewal in Chinese Historical and Cultural Urban Spaces: A Case Study of Datong. Land 2022, 11, 2122. [Google Scholar] [CrossRef]
  13. Ebejer, J.; Smith, A.; Stevenson, N.; Maitland, R. The Tourist Experience of Heritage Urban Spaces: Valletta as a Case Study. Tour. Plan. Dev. 2020, 17, 458–474. [Google Scholar] [CrossRef]
  14. Lawrence, H.W. City Trees: A Historical Geography from the Renaissance through the Nineteenth Century; University of Virginia Press: Charlottesville, VA, USA, 2008. [Google Scholar]
  15. Sarkar, C.; Webster, C.; Pryor, M.; Tang, D.; Melbourne, S.; Zhang, X.; Jianzheng, L. Exploring associations between urban green, street design and walking: Results from the Greater London boroughs. Landsc. Urban Plan. 2015, 143, 112–125. [Google Scholar] [CrossRef]
  16. Lovasi, G.S.; Schwartz-Soicher, O.; Quinn, J.W.; Berger, D.K.; Neckerman, K.M.; Jaslow, R.; Lee, K.K.; Rundle, A. Neighborhood safety and green space as predictors of obesity among preschool children from low-income families in New York City. Prev. Med. 2013, 57, 189–193. [Google Scholar] [CrossRef] [PubMed]
  17. Li, X.; Zhang, C.; Li, W.; Ricard, R.; Meng, Q.; Zhang, W. Assessing street-level urban greenery using Google Street View and a modified green view index. Urban For. Urban Green. 2015, 14, 675–685. [Google Scholar] [CrossRef]
  18. Park, J.; Kim, J.-H.; Lee, D.K.; Park, C.Y.; Jeong, S.G. The influence of small green space type and structure at the street level on urban heat island mitigation. Urban For. Urban Green. 2017, 21, 203–212. [Google Scholar] [CrossRef]
  19. Ouldboukhitine, S.-E.; Belarbi, R.; Sailor, D.J. Experimental and numerical investigation of urban street canyons to evaluate the impact of green roof inside and outside buildings. Appl. Energy 2014, 114, 273–282. [Google Scholar] [CrossRef]
  20. Ashworth, G.; Page, S.J. Urban tourism research: Recent progress and current paradoxes. Tour. Manag. 2011, 32, 1–15. [Google Scholar] [CrossRef]
  21. Anton Clavé, S. Urban Tourism and Walkability. In The Future of Tourism: Innovation and Sustainability; Fayos-Solà, E., Cooper, C., Eds.; Springer International Publishing: Cham, Switzerland, 2019; pp. 195–211. ISBN 978-3-319-89941-1. [Google Scholar]
  22. Gospodini, A. Urban Waterfront Redevelopment in Greek Cities: A Framework for Redesigning Space. Cities 2001, 18, 285–295. [Google Scholar] [CrossRef]
  23. Dai, T.; Zheng, X. Understanding how multi-sensory spatial experience influences atmosphere, affective city image and behavioural intention. Environ. Impact Assess. Rev. 2021, 89, 106595. [Google Scholar] [CrossRef]
  24. Domènech, A.; Gutiérrez, A.; Anton Clavé, S. Built environment and urban cruise tourists’ mobility. Ann. Tour. Res. 2020, 81, 102889. [Google Scholar] [CrossRef]
  25. Gorrini, A.; Bertini, V. Walkability assessment and tourism cities: The case of Venice. Int. J. Tour. Cities 2018, 4, 355–368. [Google Scholar] [CrossRef]
  26. Lesan, M. Public Streets for Multicultural Use: Exploring the Relationship between Cultural Background, Built Environment, and Social Behaviour. Ph.D. Thesis, Te Herenga Waka-Victoria University of Wellington, Wellington, New Zealand, 2015. [Google Scholar]
  27. Li, Y.; Li, Y.; Zhou, Y.; Shi, Y.; Zhu, X. Investigation of a coupling model of coordination between urbanization and the environment. J. Environ. Manag. 2012, 98, 127–133. [Google Scholar] [CrossRef] [PubMed]
  28. Guan, D.; Gao, W.; Su, W.; Li, H.; Hokao, K. Modeling and dynamic assessment of urban economy–resource–environment system with a coupled system dynamics—Geographic information system model. Ecol. Indic. 2011, 11, 1333–1344. [Google Scholar] [CrossRef]
  29. Var, T.; Gunn, C. Tourism Planning: Basics, Concepts, Cases, 4th ed.; Routledge: New York, NY, USA, 2020; ISBN 978-1-003-06165-6. [Google Scholar]
  30. Kim, S.S.; Agrusa, J.; Lee, H.; Chon, K. Effects of Korean television dramas on the flow of Japanese tourists. Tour. Manag. 2007, 28, 1340–1353. [Google Scholar] [CrossRef]
  31. Gössling, S.; Peeters, P.; Hall, C.M.; Ceron, J.-P.; Dubois, G.; Lehmann, L.V.; Scott, D. Tourism and water use: Supply, demand, and security. An international review. Tour. Manag. 2012, 33, 1–15. [Google Scholar] [CrossRef]
  32. Samadi, Z.; Mohd Yunus, R. Urban Heritage Streets’ Revitalizing Attributes. ajE-Bs 2018, 3, 191–199. [Google Scholar] [CrossRef]
  33. Andari, R.; Setiyorini, H.P.D. Green tourism role in creating sustainable urban tourism. South East Asia J. Contemp. 2016, 9, 27–30. [Google Scholar]
  34. List of Officially Protected Monuments and Sites in Shenyang City-Shenyang Municipal Bureau of Culture and Tourism. Available online: https://wlgd.shenyang.gov.cn/zwgk/fdzdgknr/zdmsxx/202207/t20220718_3444041.html (accessed on 20 May 2025).
  35. Li, Q.; Yuichi, F.; Morris, M. Study on the Buffer Zone of a Cultural Heritage Site in an Urban Area: The Case of Shenyang Imperial Palace in China. WIT Trans. Ecol. Environ. 2014, 191, 1115–1124. [Google Scholar]
  36. Liu, M.; Xu, Y.; Hu, Y.; Li, C.; Sun, F.; Chen, T. A Century of the Evolution of the Urban Area in Shenyang, China. PLoS ONE 2014, 9, e98847. [Google Scholar] [CrossRef]
  37. Public Consultation Announcement for the Draft Shenyang Historic and Cultural City Conservation Plan (2011–2020). Available online: https://zrzyj.shenyang.gov.cn/tzgg/202208/t20220822_4099479.html (accessed on 22 May 2025).
  38. Draft of Shenyang City Master Plan (2011–2020). Available online: https://www.planning.org.cn/news/view?id=4958 (accessed on 22 May 2025).
  39. Biljecki, F.; Ito, K. Street view imagery in urban analytics and GIS: A review. Landsc. Urban Plan. 2021, 215, 104217. [Google Scholar] [CrossRef]
  40. Walk Score Methodology. Available online: https://www.walkscore.com/methodology.shtml (accessed on 20 May 2025).
  41. Hall, C.M.; Ram, Y. Walk score® and its potential contribution to the study of active transport and walkability: A critical and systematic review. Transp. Res. Part D: Transp. Environ. 2018, 61, 310–324. [Google Scholar] [CrossRef]
  42. Seguin-Fowler, R.A.; LaCroix, A.Z.; LaMonte, M.J.; Liu, J.; Maddock, J.E.; Rethorst, C.D.; Bird, C.E.; Stefanick, M.L.; Manson, J.E. Association of neighborhood Walk Score with accelerometer-measured physical activity varies by neighborhood socioeconomic status in older women. Prev. Med. Rep. 2022, 29, 101931. [Google Scholar] [CrossRef] [PubMed]
  43. Lu, Y.T.; Wang, D. Research progress and enlightenment of walkability measurement in the United States. Int. Urban Plann 2012, 27, 10–15. [Google Scholar]
  44. GB 50180-2018; Standard for Urban Residential Area Planning and Design. Ministry of Housing and Urban-Rural Development of the People’s Republic of China: Beijing, China, 2018.
  45. Nykiforuk, C.I.J.; McGetrick, J.A.; Crick, K.; Johnson, J.A. Check the score: Field validation of Street Smart Walk Score in Alberta, Canada. Prev. Med. Rep. 2016, 4, 532–539. [Google Scholar] [CrossRef] [PubMed]
  46. Yu, C.; Kwan, M.-P. Dynamic greenspace exposure, individual mental health status and momentary stress level: A study using multiple greenspace measurements. Health Place 2024, 86, 103213. [Google Scholar] [CrossRef]
  47. Su, L.; Chen, W.; Zhou, Y.; Fan, L.; Li, J. Exploring Urban Street Green Perception from the Perspective of Combining GVI and NDVI: A Case Study of Zhongshan City, Guangdong Province 2023. bioRxiv 2023. [Google Scholar] [CrossRef]
  48. Zhang, F.; Xu, N.; Wang, C.; Guo, M.; Kumar, P. Multi-scale coupling analysis of urbanization and ecosystem services supply-demand budget in the Beijing-Tianjin-Hebei region, China. J. Geogr. Sci. 2023, 33, 340–356. [Google Scholar] [CrossRef]
  49. Wang, X.; Zhang, T.; Duan, L.; Liritzis, I.; Li, J. Spatial distribution characteristics and influencing factors of intangible cultural heritage in the Yellow River Basin. J. Cult. Herit. 2024, 66, 254–264. [Google Scholar] [CrossRef]
  50. Guzman, P.; Pereira Roders, A.R.; Colenbrander, B. Impacts of Common Urban Development Factors on Cultural Conservation in World Heritage Cities: An Indicators-Based Analysis. Sustainability 2018, 10, 853. [Google Scholar] [CrossRef]
  51. Zou, H.; Liu, Y.; Li, B.; Luo, W. Sustainable Development Efficiency of Cultural Landscape Heritage in Urban Fringe Based on GIS-DEA-MI, a Case Study of Wuhan, China. Int. J. Environ. Res. Public Health 2022, 19, 13061. [Google Scholar] [CrossRef]
  52. Hu, H.; Qiao, X.; Yang, Y.; Zhang, L. Developing a resilience evaluation index for cultural heritage site: Case study of Jiangwan Town in China. Asia Pac. J. Tour. Res. 2021, 26, 15–29. [Google Scholar] [CrossRef]
  53. Wang, S.-J.; Kong, W.; Ren, L.; Zhi, D.-D.; Dai, B.-T. Research on misuses and modification of coupling coordination degree model in China. J. Nat. Resour. 2021, 36, 793–810. [Google Scholar] [CrossRef]
  54. Li, T.; Zheng, X.; Wu, J.; Zhang, Y.; Fu, X.; Deng, H. Spatial relationship between green view index and normalized differential vegetation index within the Sixth Ring Road of Beijing. Urban For. Urban Green. 2021, 62, 127153. [Google Scholar] [CrossRef]
  55. Wang, Q.; Mao, Z.; Xian, L.; Liang, Z. A study on the coupling coordination between tourism and the low-carbon city. Asia Pac. J. Tour. Res. 2019, 24, 550–562. [Google Scholar] [CrossRef]
  56. Alawadi, K.; Khanal, A.; Doudin, A.; Abdelghani, R. Revisiting transit-oriented development: Alleys as critical walking infrastructure. Transp. Policy 2021, 100, 187–202. [Google Scholar] [CrossRef]
  57. Suminar, L.; Kasim, M.R.; Tasywiq, A.M.M. Measuring urban walkability index in Surakarta historic district to promote sustainable mobility. IOP Conf. Ser. Earth Environ. Sci. 2024, 1394, 012034. [Google Scholar] [CrossRef]
  58. Tapiro, H.; Oron-Gilad, T.; Parmet, Y. Pedestrian distraction: The effects of road environment complexity and age on pedestrian’s visual attention and crossing behavior. J. Saf. Res. 2020, 72, 101–109. [Google Scholar] [CrossRef]
  59. Koohsari, M.J.; McCormack, G.R.; Shibata, A.; Ishii, K.; Yasunaga, A.; Nakaya, T.; Oka, K. The relationship between walk score® and perceived walkability in ultrahigh density areas. Prev. Med. Rep. 2021, 23, 101393. [Google Scholar] [CrossRef]
  60. Sun, D.; Ji, X.; Gao, W.; Zhou, F.; Yu, Y.; Meng, Y.; Yang, M.; Lin, J.; Lyu, M. The Relation between Green Visual Index and Visual Comfort in Qingdao Coastal Streets. Buildings 2023, 13, 457. [Google Scholar] [CrossRef]
  61. Jin, S.; Kim, E.J. Correlation of the Walk Score and Environmental Perceptions with Perceived Neighborhood Walkability: The Quantile Regression Model Approach. Sustainability 2024, 16, 7074. [Google Scholar] [CrossRef]
  62. Li, F.; Li, D.; Xie, L.; Tian, Y. Assessing the Green View Index in Chinese Cities: An Example with Data from Eighty Cities. J. Digit. Landsc. Archit. 2022, 7, 291–300. [Google Scholar] [CrossRef]
  63. Cui, Z.; He, M.; Lu, M. An analysis of green view index in cold region city: A case study of Harbin. J. Chin. Urban 2018, 16, 34–38. [Google Scholar]
  64. Zhu, H.; Nan, X.; Yang, F.; Bao, Z. Utilizing the green view index to improve the urban street greenery index system: A statistical study using road patterns and vegetation structures as entry points. Landsc. Urban Plan. 2023, 237, 104780. [Google Scholar] [CrossRef]
  65. Huang, Z.; Luo, S.; Cai, Y.; Lu, Z. Integrating Accessibility and Green View Index for Human-scale Street Greening Initiatives: A Case Study of Chengdu’s Third Ring Road. J. Resour. Ecol. 2024, 16, 356–367. [Google Scholar] [CrossRef]
  66. Santa, E.D.; Tiatco, S.A. Tourism, heritage and cultural performance: Developing a modality of heritage tourism. Tour. Manag. Perspect. 2019, 31, 301–309. [Google Scholar] [CrossRef]
  67. Poria, Y.; Butler, R.; Airey, D. The core of heritage tourism. Ann. Tour. Res. 2003, 30, 238–254. [Google Scholar] [CrossRef]
  68. Frago, L.; Graziano, T. Public space and the green city: Conflictual narratives of the superblock programme in Poblenou, Barcelona. J. Urban Regen. Renew. 2021, 15, 113–128. [Google Scholar] [CrossRef]
  69. Magrinyà, F.; Mercadé-Aloy, J.; Ruiz-Apilánez, B. Merging Green and Active Transportation Infrastructure towards an Equitable Accessibility to Green Areas: Barcelona Green Axes. Land 2023, 12, 919. [Google Scholar] [CrossRef]
  70. Kempiak, J.; Hollywood, L.; Bolan, P.; McMahon-Beattie, U. The heritage tourist: An understanding of the visitor experience at heritage attractions. Int. J. Herit. Stud. 2017, 23, 375–392. [Google Scholar] [CrossRef]
  71. Ramkissoon, H. Perceived visitor impacts of cultural heritage tourism: The role of place attachment in memorable visitor experiences. In Handbook on the Tourist Experience; Edward Elgar Publishing: Cheltenham, UK, 2022; ISBN 978-1-83910-939-3. [Google Scholar]
  72. López-Guzmán, T.; Gálvez, J.C.P.; Buiza, F.C.; Medina-Viruel, M.J. Emotional perception and historical heritage: A segmentation of foreign tourists who visit the city of Lima. Int. J. Tour. Cities 2019, 5, 451–464. [Google Scholar] [CrossRef]
  73. Nasser, N. Planning for Urban Heritage Places: Reconciling Conservation, Tourism, and Sustainable Development. J. Plan. Lit. 2003, 17, 467–479. [Google Scholar] [CrossRef]
  74. Sudi, W.M. Heritage tourism: Reconciling urban conservation and tourism. WIT Trans. Ecol. Environ. 2013, 179, 1105–1116. [Google Scholar]
  75. Tang, Z. An integrated approach to evaluating the coupling coordination between tourism and the environment. Tour. Manag. 2015, 46, 11–19. [Google Scholar] [CrossRef]
  76. Xing, L.; Xue, M.; Hu, M. Dynamic simulation and assessment of the coupling coordination degree of the economy–resource–environment system: Case of Wuhan City in China. J. Environ. Manag. 2019, 230, 474–487. [Google Scholar] [CrossRef]
  77. Li, Y.; Huang, J. Evaluation of green view perception of walking environment in historical blocks based on green view attenuation curve: A case study of Tongwen area, Zhongshan Road of Xiamen. Landsc. Archit. 2020, 27, 110–115. [Google Scholar] [CrossRef]
  78. Jurkovič, N.B. Perception, experience and the use of public urban spaces by residents of urban neighbourhoods. Urbani Izziv 2014, 25, 107–125. [Google Scholar] [CrossRef]
  79. Ali, A.S.; Baper, S.Y. Assessment of Livability in Commercial Streets via Placemaking. Sustainability 2023, 15, 6834. [Google Scholar] [CrossRef]
  80. Xu, J.; Wang, J.; Zuo, X.; Han, X. Spatial quality optimization analysis of streets in historical urban areas based on street view perception and multisource data. J. Urban Plan. Dev. 2024, 150, 05024036. [Google Scholar] [CrossRef]
  81. Sauter, D.; Huettenmoser, M. Liveable streets and social inclusion. Urban Des. Int. 2008, 13, 67–79. [Google Scholar] [CrossRef]
  82. Wendt, M. The importance of death and life of great American cities (1961) by Jane Jacobs to the profession of urban planning. New Vis. Public Aff. 2009, 1, 1–24. [Google Scholar]
  83. Aykan, B.; Başyurt, İ. From ‘Green Space’ to Tradition: Tangible/Intangible Cultural Heritage Dichotomy, Cultural Landscape and Protecting Yedikule Vegetable Gardening as World Heritage. J. Plan. 2019, 29, 271–287. [Google Scholar] [CrossRef]
  84. Farhan, S.L.; Samir, H.H.; Adelphi, H.S. Urban changes and its impact on the tangible and intangible heritage of City’s Centre: Najaf City as a Case Study. IOP Conf. Ser. Mater. Sci. Eng. 2021, 1058, 012070. [Google Scholar] [CrossRef]
  85. Xu, G.; Zhong, L.; Wu, F.; Zhang, Y.; Zhang, Z. Impacts of Micro-Scale Built Environment Features on Tourists’ Walking Behaviors in Historic Streets: Insights from Wudaoying Hutong, China. Buildings 2022, 12, 2248. [Google Scholar] [CrossRef]
  86. Alnaim, M.M.; Mesloub, A.; Alalouch, C.; Noaime, E. Reclaiming the Urban Streets: Evaluating Accessibility and Walkability in the City of Hail’s Streetscapes. Sustainability 2025, 17, 3000. [Google Scholar] [CrossRef]
  87. Fang, D.; Zhao, Z.; Xiong, C. What leads to an immersive night tourism experience? The relevance of multi-sensory stimuli, emotional involvement, and delight. Asia Pac. J. Tour. Res. 2024, 29, 31–46. [Google Scholar] [CrossRef]
  88. Amen, M.A.; Afara, A.; Nia, H.A. Exploring the Link between Street Layout Centrality and Walkability for Sustainable Tourism in Historical Urban Areas. Urban Sci. 2023, 7, 67. [Google Scholar] [CrossRef]
  89. Wu, J.; Ta, N.; Song, Y.; Lin, J.; Chai, Y. Urban form breeds neighborhood vibrancy: A case study using a GPS-based activity survey in suburban Beijing. Cities 2018, 74, 100–108. [Google Scholar] [CrossRef]
  90. Gómez-Varo, I.; Delclòs-Alió, X.; Miralles-Guasch, C. Jane Jacobs reloaded: A contemporary operationalization of urban vitality in a district in Barcelona. Cities 2022, 123, 103565. [Google Scholar] [CrossRef]
  91. Yang, Y.; Wang, Z.; Shen, H.; Jiang, N. The Impact of Emotional Experience on Tourists’ Cultural Identity and Behavior in the Cultural Heritage Tourism Context: An Empirical Study on Dunhuang Mogao Grottoes. Sustainability 2023, 15, 8823. [Google Scholar] [CrossRef]
  92. Whitsed, R.; Horta, A. Liveability for older residents in regional communities through the lens of walkability and attitudes to nature—A case study in northeast Victoria, Australia. Aust. Geogr. 2023, 54, 405–424. [Google Scholar] [CrossRef]
  93. Kim, E.J.; Jin, S. Walk Score and Neighborhood Walkability: A Case Study of Daegu, South Korea. IJERPH 2023, 20, 4246. [Google Scholar] [CrossRef]
  94. Maselli, G.; Cucco, P.; Nesticò, A.; Ribera, F. Historical heritage–MultiCriteria Decision Method (H-MCDM) to prioritize intervention strategies for the adaptive reuse of valuable architectural assets. MethodsX 2024, 12, 102487. [Google Scholar] [CrossRef]
  95. Newman, A. Inclusive Urban Ecological Restoration in Toronto, Canada. In Human Dimensions of Ecological Restoration: Integrating Science, Nature, and Culture; Egan, D., Hjerpe, E.E., Abrams, J., Eds.; Island Press/Center for Resource Economics: Washington, DC, USA, 2011; pp. 63–75. ISBN 978-1-61091-039-2. [Google Scholar]
Figure 1. Location of the Study Areas.
Sustainability 17 05284 g001
Figure 2. Workflow for WI, GVI, and CHI Calculation.
Sustainability 17 05284 g002
Figure 3. (a) A Baidu Panorama Static Image. (b) Image segmentation corresponding to (a). Street-level urban greenspace was quantified using 13,137 panoramic images and computer vision methods in high spatial resolution on the entire road networks of Shenyang’s historic city in China. Here, a Baidu Panorama Static Image generated for a single point location in Shenyang city (left image) and its corresponding image segmentation, and thus classification, of green vegetation as white in right image is shown.
Sustainability 17 05284 g003
Figure 4. Spatial distribution of WI in the study area.
Sustainability 17 05284 g004
Figure 5. Spatial distribution of Street Green View Index in the study area.
Sustainability 17 05284 g005
Figure 6. Kernel Density Distribution Map of Historical and Cultural Resource Points in the Study Area.
Sustainability 17 05284 g006
Figure 7. Visualization of Multivariable Synergistic Effects in Historic Urban Areas (U1, the comprehensive evaluation indices for the WI; U2, the comprehensive evaluation indices for the GVI; U3, the comprehensive evaluation indices for the CHI.; “C” represents the coupling degree between systems; “D” represents the coordination degree between systems.).
Sustainability 17 05284 g007
Figure 8. Field observation photographs ((a), Zhongjie; (b), Nanshuncheng road; (c), Zhongshanguangchang).
Sustainability 17 05284 g008
Table 1. The facility classification and weights.
ClassificationWeightsClassificationWeights
Grocery3Cafe2
Restaurant3Bar3
Shop2Bank1
School1Park1
Entertainment venues1Bookstore1
Table 2. The distance–decay law.
TimeReachDistance Screening Rule
<5 min<400 mNo distance decay, Y = 0
5–20 min400–1600 mFast distance decay, when the distance is 1600 m, the attenuation is 12%, Y = −153.6558x3 + 419.4604x2 − 395.9706x + 201.1086
20–30 min1600–2400 mSlow distance decay, when the distance is 2400 m, the attenuation is 1, Y = −92.8x3 + 566.6x2 − 1153.1x + 786.6
>30 min>2400 mFacilities have no effect on the FDWI at the starting point, Y = 1
Note: Y is the distance decay rate, in %; x is the distance from the starting point to the facility, in km.
Table 3. Walkability evaluation criteria.
WalkscoreDescription
90–100Walker’s Paradise: Daily trips can be completely solved by walking.
70–89Very Walkable: Most daily trips can be accomplished by walking.
50–69Average Walkability: Some facilities are within walking distance.
25–49Poor Walkability: There are fewer facilities within walking distance.
0–24Car Dependent: Almost all trips depend on cars.
Source: https://www.walkscore.com; Walk Score Methodology.
Table 4. WI of streets within the research area.
RegionWIRoad GradeWI
Region 153.91Trunk48.51
Region 246.6Primary52.55
Region 339.24Secondary55.43
Region 454.4Others33.60
Region 538.11Total42.66
Table 5. Average Green View Index (%) of different grades of roads in various regions.
Region 1Region 2Region 3Region 4Region 5Total
trunk2.474.164.132.159.626.70
primary5.487.597.353.519.387.86
secondary7.5610.618.585.339.128.11
others8.0510.4112.5811.7112.4911.22
total7.5610.0611.378.0411.2010.14
Table 6. CHI within the Research Area.
RegionCHISD
Region 119.8013.2
Region 256.0324.5
Region 323.6923.5
Region 410.656.6
Region 55.7315.2
total18.7323.4
Table 7. Coupling coordination results.
U1×U2U2×U3U1×U3U1×U2×U3
C1D1C2D2C3D3C4D4
Region 10.8190.5290.8860.5720.9880.4120.8480.500
Region 20.9110.5480.9960.7150.8740.5740.9100.608
Region 30.9590.5420.9690.5520.9990.4770.9660.523
Region 40.8310.5390.7400.4910.9830.3590.7740.456
Region 50.9610.5360.6740.3840.8140.3330.7690.409
Total0.8840.5150.9150.5360.9970.4160.9000.486
Note: U1, the comprehensive evaluation indices for the WI; U2, the comprehensive evaluation indices for the GVI; U3, the comprehensive evaluation indices for the CHI.; “C” represents the coupling degree between systems; “D” represents the coordination degree between systems.
Table 8. Calculation results and coupling coordination results.
District U1×U2U2×U3U1×U3U1×U2×U3
C1D1C2D2C3D3C4D4
Shengjing Imperial CityWI64.7
GVI6.90.7530.5420.9310.4420.9230.6560.8190.54
CHI28.7
Zhongshan Road DistrictWI54.3
GVI8.60.8470.5480.7780.5890.990.7920.8420.635
CHI72.6
TotalWI44.04
GVI10.140.8840.5150.9150.5360.9970.4160.9000.486
CHI18.73
Note: U1, the comprehensive evaluation indices for the WI; U2, the comprehensive evaluation indices for the GVI; U3, the comprehensive evaluation indices for the CHI.
Disclaimer/Publisher’s Note: The statements, opinions and data contained in all publications are solely those of the individual author(s) and contributor(s) and not of MDPI and/or the editor(s). MDPI and/or the editor(s) disclaim responsibility for any injury to people or property resulting from any ideas, methods, instructions or products referred to in the content.

