Article

A Comparative Modeling Framework for Forecasting Distributed Energy Resource Adoption Under Trend-Based and Goal-Oriented Scenarios

by
Zheng Grace Ma
*,
Magnus Værbak
and
Bo Nørregaard Jørgensen
SDU Center for Energy Informatics, Maersk Mc-Kinney Moller Institute, The Faculty of Engineering, University of Southern Denmark, 5230 Odense, Denmark
*
Author to whom correspondence should be addressed.
Sustainability 2025, 17(12), 5283; https://doi.org/10.3390/su17125283
Submission received: 2 April 2025 / Revised: 27 May 2025 / Accepted: 4 June 2025 / Published: 7 June 2025
(This article belongs to the Special Issue Modeling, Control, and Optimization of Hybrid Energy Systems)

Abstract

:
Accurate forecasting of Distributed Energy Resource (DER) adoption is essential for decarbonization, effective policy, and infrastructure planning. This paper develops a comparative framework integrating trend-based and goal-oriented approaches using the logistic growth and Bass diffusion models. Using Danish household data for electric vehicles (EVs), heat pumps (HPs), and rooftop photovoltaics (PVs), we evaluate four logistic-growth-based and two Bass-diffusion-based methods. Each method supports standard curve-fitting (trend-based) or incorporates explicit policy goals (goal-based), such as reaching a specified adoption threshold by a target year. An integrated flow diagram visually summarizes the decision process for method selection based on data availability, market maturity, and policy targets. Results show that Bass diffusion excels in early-stage or policy-driven markets like EVs, while logistic approaches perform better for PVs after subsidies are removed, with HP adoption falling in between. A key innovation is integrating future adoption targets into parameter estimation, enabling stakeholders to assess the required acceleration in adoption rates. The findings highlight the need to align model choice with data, market conditions, and policy objectives, offering practical guidance to accelerate DER deployment.

1. Introduction

Accelerating the adoption of Distributed Energy Resources (DERs) is now central to many national strategies aimed at reducing carbon emissions, cutting dependence on fossil fuels, and enhancing energy resilience. The residential energy prosumer sector constitutes a significant part of the energy sector, and among the most notable DERs commonly available to the residential actors are electric vehicles (EVs), heat pumps (HPs), and rooftop photovoltaics (PVs), each of which has grown rapidly in residential markets [1]. Nevertheless, their uptake is shaped by a complex interplay of financial, technological, and behavioral drivers, leading to wide variation in adoption rates across different contexts [2]. As governments set increasingly ambitious decarbonization targets, robust models for forecasting and managing DER adoption have become indispensable.
A substantial body of research on innovation diffusion employs models ranging from the classical S-shaped logistic growth to the imitation-driven Bass diffusion [3,4]. While each method captures certain elements of adoption processes, prior investigations typically focus on a single DER or a single modeling technique, limiting the capacity to compare approaches across technologies [5]. Moreover, although many studies acknowledge the importance of policy instruments (e.g., subsidies, carbon taxes) in shaping adoption [6], relatively few incorporate explicit policy goals, such as “80% adoption by 2030”, directly into their calibration routines. This shortcoming makes it challenging to leverage forecasting outputs in actual policymaking, where scenario analyses must accommodate both historical trends and future targets.
Despite notable progress, three key gaps remain. First, comparative evaluations of major diffusion models (logistic and Bass) have yielded inconsistent findings regarding which framework is most accurate in the early versus later stages of DER adoption [1,4]. Second, data limitations, particularly in nascent markets, often limit efforts to robustly estimate the parameters governing consumer adoption behavior [3]. Third, although goal-based methods have been proposed, studies that systematically align model estimation with future policy milestones remain sparse [7,8]. Addressing these issues is crucial for developing reliable, actionable insights into DER deployment under real-world constraints.
The primary objective of this paper is to establish a systematic modeling framework for forecasting DER adoption under varying data availability and policy scenarios. Specifically, the study aims to
  • Compare the logistic growth and Bass diffusion models for three DERs, EVs, HPs, and PV, using data for a region in Denmark;
  • Demonstrate how these models can function effectively with limited historical data, highlighting the significance of social interaction parameters (Bass) versus simpler S-curve assumptions (logistic);
  • Integrate goal-based calibration, where policy targets (e.g., 80% adoption) are incorporated as additional constraints in model fitting, thereby enabling scenario analyses that align historical trends with future objectives.
Building on the extensive literature that acknowledges the complexities of DER adoption, this work contributes a clear, side-by-side comparison of six methods—four logistic-based (M1.1–M1.4) and two Bass-based (M2.1–M2.2)—applied consistently to the same empirical datasets. Another key novelty is the inclusion of policy–goal data points in the solver routine, an approach that remains underexplored in diffusion modeling despite its practical utility [6,9]. Additionally, an integrated flow diagram is presented that visually summarizes the decision process for selecting the appropriate diffusion forecasting method. This diagram delineates key decision nodes based on the presence of policy targets, the strength of social contagion, and the extent of available historical data, thereby providing practitioners and policymakers with an intuitive guide for method selection. By employing a spreadsheet-based solver, the framework also caters to policymakers and utility planners who may not have access to specialized optimization software [3].
Following this introduction, Section 2 provides a comprehensive literature review, examining existing technology adoption theories and identifying gaps. Section 3 outlines the proposed methodological framework, detailing the logistic and Bass diffusion models alongside the four logistic-based and two Bass-based methods. It furthermore describes the specific approach to parameter estimation and curve fitting, illustrating implementation details. Section 4 applies these methods to Danish datasets on EVs, HPs, and PVs, presenting empirical adoption curves and parameter estimates. Section 5 discusses the findings in the context of prior work, emphasizing model performance variations, and furthermore, discusses limitations and future research potential. Finally, Section 6 concludes by highlighting the key outcomes, research limitations, and avenues for future investigation.

2. Literature Review

This section provides an integrated review of the literature on DER adoption and the broader theoretical frameworks that inform technology diffusion modeling. It begins with foundational theories of technology adoption and highlights how different modeling approaches, particularly the Bass diffusion model and the logistic growth model, have been applied in empirical studies of EVs, HPs, and PVs. It then synthesizes insights on socioeconomic, behavioral, and policy drivers of adoption, ultimately identifying gaps that this paper addresses.

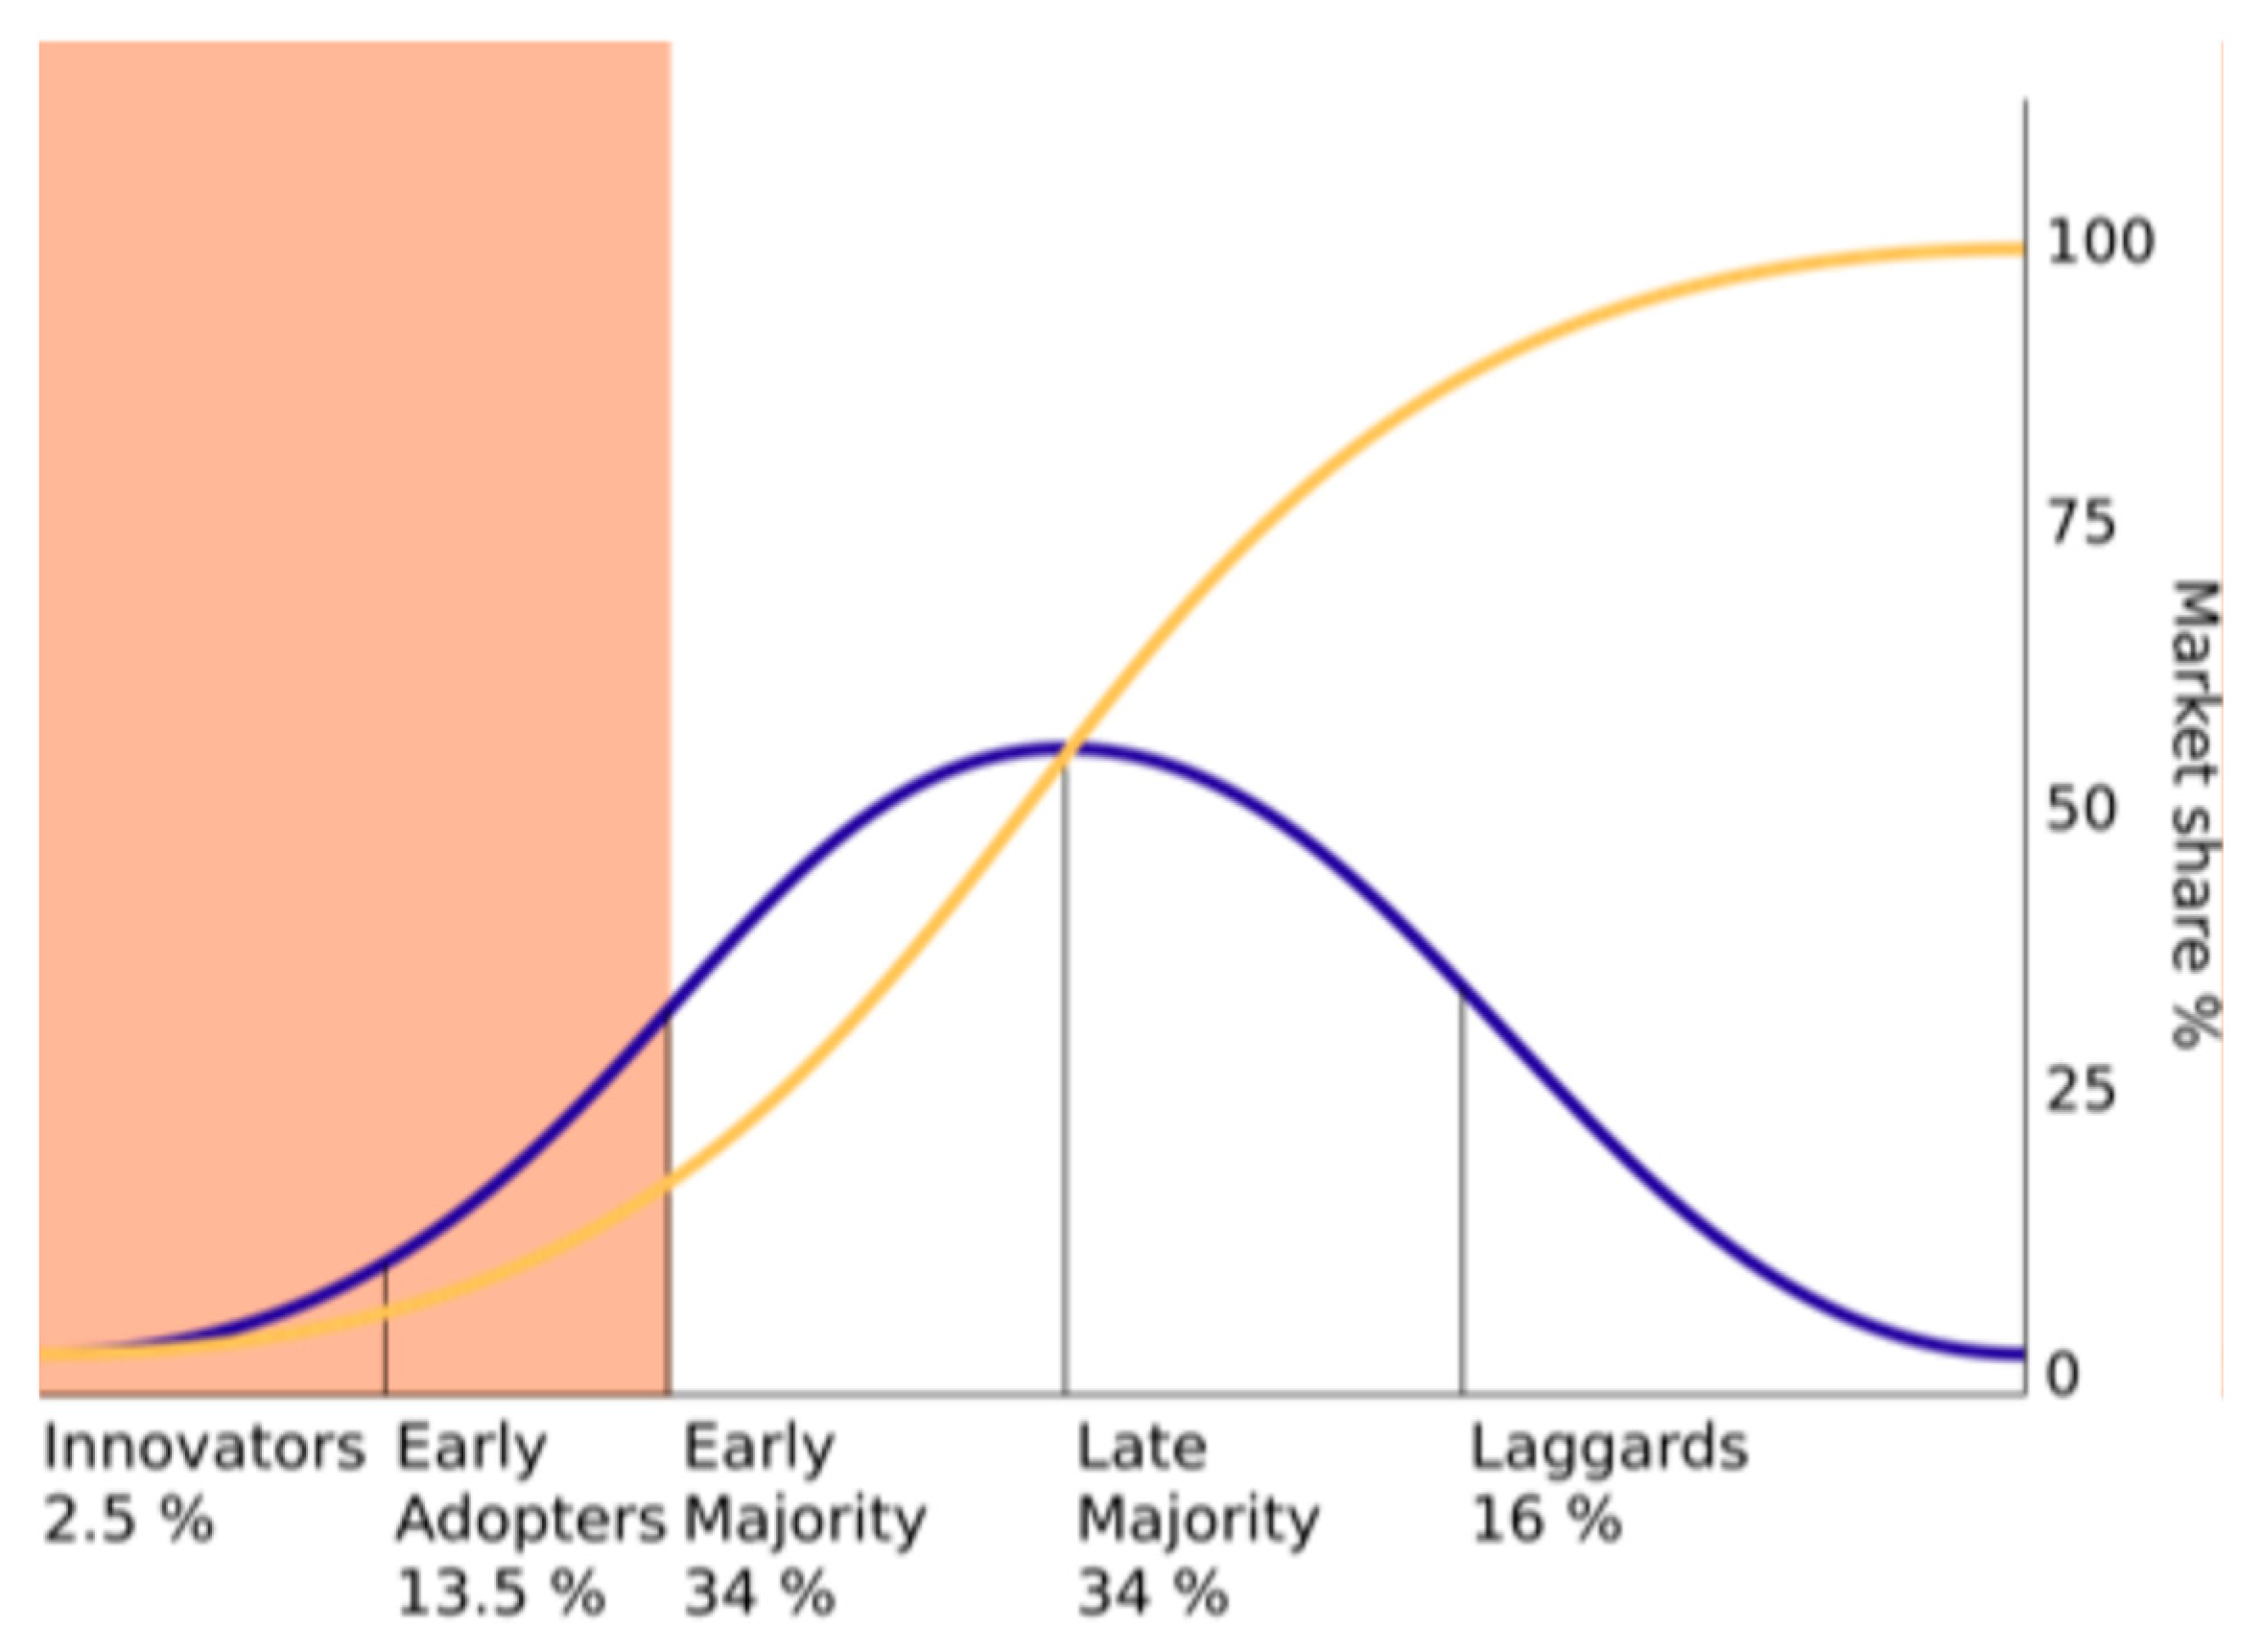
2.1. Theories of Technology Adoption and Diffusion

Several foundational theories elucidate how and why new technologies diffuse among consumers, organizations, and broader social systems. Among these, Rogers’ Diffusion of Innovations (DOI) framework has been especially influential, characterizing adopters as innovators, early adopters, early majority, late majority, or laggards and emphasizing factors such as relative advantage, compatibility, complexity, trialability, and observability in shaping adoption decisions [10]. The DOI framework has underpinned numerous energy-focused studies, illuminating how social networks, communication channels, and decision processes lead to S-shaped adoption trajectories for renewable technologies [11].
Closely related to DOI is the Technology Acceptance Model (TAM), originally developed to explain users’ acceptance of information systems. The TAM posits that perceived usefulness and perceived ease of use are the chief determinants of an individual’s behavioral intention to adopt a new technology [12]. Several studies on electric vehicles, photovoltaics, and heat pumps adapt TAM constructs to capture how perceived costs, government incentives, and social norms influence adoption intentions [7,13]. More recent extensions include incorporating constructs such as trust, compatibility, or ecological awareness into the TAM to examine consumer acceptance of blockchain applications or smart home systems in the energy domain [14].
Beyond individual-level factors, socio-technical transition theories highlight the co-evolution of markets, technologies, user practices, and policy regimes. These theories argue that adoption depends on more than end-users’ motivations, pointing to broader institutional, infrastructural, and sociopolitical changes [6]. In particular, the Multi-Level Perspective (MLP) conceptualizes transitions occurring at three levels: niche innovations, socio-technical regimes, and the overarching landscape [15]. Although such transitions may span decades, early adopters play an outsized role by providing demonstration effects and legitimizing nascent technologies [10,16].
For mathematics-based diffusion patterns forecasting, epidemiological or S-shaped models such as the logistic growth and Bass diffusion models are often employed [9]. The logistic growth model, drawing on population growth analogies, suggests adoption accelerates exponentially at first and then slows as the market saturates [17,18]. The Bass diffusion model divides adopters into categories, such as “innovators” who adopt independently of peers and “imitators” who are influenced by existing adopters [19], thereby capturing word-of-mouth effects and the classic bell-shaped adoption rate. Both models are extensively applied in energy research, including forecasts of electric vehicle uptake [4,5], residential PV diffusion [1,20], and heat pump adoption [3,21].
Furthermore, newer agent-based models (ABMs) and System Dynamics approaches allow for heterogeneity among adopters, social influence through network structures, and feedback loops with policy and market interactions [22,23]. These methods often incorporate bounded rationality, evolving behavioral norms, and policy triggers, offering a richer representation of real-world complexity than traditional aggregate models [3,9]. Together, these theoretical frameworks and modeling approaches have guided decades of empirical and policy-relevant research, forming the backbone for understanding and forecasting DER adoption pathways.

2.2. DER Adoption

DER adoption has become a cornerstone in strategies aimed at reducing carbon emissions, mitigating climate change, and enhancing energy security. Research has demonstrated that various DER technologies, especially EVs, HPs, and PV systems, are influenced by a complex interplay of economic incentives, consumer perception, and policy interventions [8,21].

2.2.1. Electric Vehicles

EV adoption has drawn considerable attention as a key strategy to decarbonize transport [7]. Recent work shows that consumer behaviors, including subjective norms, range anxiety, and cost expectations, profoundly shape EV uptake [24]. Policy supports such as subsidies, carbon taxes, and cap-and-trade systems have proven instrumental in accelerating EV diffusion [25]. Several papers also highlight geographically varying adoption rates due to differences in infrastructure availability, incentives, and consumer awareness [8]. For instance, local air quality concerns in large cities spur faster EV uptake [26], while rural or less urbanized regions remain hesitant due to limited charging infrastructure [13].

2.2.2. Heat Pumps

HP adoption has increased during recent years, particularly in regions with colder climates, when considering the number of units per capita [27]. However, some potential adopters show hesitancy in acquiring HPs, often due to high upfront costs and unfamiliarity with new heating technologies [9]. References [28,29] illustrate that the complexity of comparing HPs with traditional heating sources (e.g., gas or oil) leads many households to defer upgrading until incentives or local norms change. Others show that local demonstration projects, peer effects, and stable policy environments can stimulate higher uptake [30]. Despite uncertain cost-effectiveness in early adoption stages, forward-thinking policies and consistent public outreach increase HP penetration [31].

2.2.3. Photovoltaics

PV adoption has similarly grown but continues to depend on reliable feed-in tariffs, tax credits, and cost-competitive equipment [20]. In markets where policymakers reduce or remove subsidies, PV growth can stagnate [9]. These trends are compounded by the role of peer effects [16] and local demonstration projects [17], which can reduce risk perceptions and trigger S-curve diffusion [9]. Studies such as [20,32] model willingness to pay for rooftop PVs, finding large heterogeneity among household segments and underscoring the importance of customizing incentives to local conditions.
Although many governments set explicit long-term goals for EVs, heat pumps, or PVs, [1,3] suggest that sustained policy signals are necessary for continuous growth. Fragmented or short-lived incentives often produce boom–bust cycles, complicating forecasting efforts [20]. Tools like policy optimization [33] and system dynamics [22] are increasingly used to test hypothetical policy instruments and simulate the spatial and temporal clustering of adoption.

2.3. Technology Diffusion Methods

Researchers have developed technology diffusion with diverse methods, from econometric regressions on large datasets [11,26] to agent-based models [6,9], structural equation modeling [13,34], and system dynamics [22,23]. Table 1 below consolidates key studies by technology focus, geographic scope, and methodological approach. The table reveals a significant variety of methods applied for modeling and analyzing DER adoption, along with numerous factors and tendencies that affect the adoption.
Based on Table 1, Table 2 distills the most prevalent modeling approaches, particularly Bass diffusion and logistic growth, and their main advantages or limitations, as described in the literature. Multiple of these revolve around S-shaped or similar adoption curves; however, the limitations reveal that there is not one single approach that fits all situations, and that the suitable choice of model or combination of models must pay heed to the nature of the modeled system and the factors and aspects that are expected to affect the adoption

2.3.1. Bass Diffusion Model

The Bass diffusion model is a widely used framework for forecasting how innovation, ranging from consumer products to renewable energy technologies, spread through a market or population over time [2,6]. It was first introduced by Frank Bass, who posited that potential adopters can be grouped into two types: “innovators”, who adopt independently of others, and “imitators”, who are influenced by the number of previous adopters [5,19]. The model is often expressed as depicted in Equation (1):
P t = 1 e p + q t 1 + q p e p + q t ,
Here, p (the coefficient of innovation) reflects the rate at which individuals adopt purely due to external factors (e.g., marketing, policy signals, or personal motivation), and q (the coefficient of imitation) captures the extent to which adoption is driven by existing adopters (e.g., word-of-mouth or demonstration effects).
One major advantage of the Bass model is that it explicitly addresses interaction effects among adopters. By splitting adoption drivers into innovation and imitation, it captures the real-world observation that individuals often adopt new technologies after observing peers’ experiences [19]. This framework can be extended into more complex versions such as the Generalized Bass model (incorporating marketing variables) and Norton–Bass model (accounting for successive technology generations) [5]. Additionally, the Bass model can be well-suited to technologies where “word-of-mouth” and social contagion strongly influence purchasing decisions, as is often the case with consumer-facing DERs [6].
A key limitation is the assumption that p and q are constant throughout the diffusion process. Real-world technology markets can exhibit changing consumer preferences, shifting policy regimes, or competition from alternative technologies that alter adoption dynamics over time [21]. Moreover, if only limited historical data exist, parameter estimation for the Bass model can be challenging, and different initial guesses for p and q may yield multiple local optima during the fitting process [9,19]. Finally, the model’s traditional form typically starts from zero adoption, which can lead to misalignment when real systems already have some baseline level of adopters [13].

2.3.2. Logistic Growth Model

Originally employed in population biology, the logistic growth model has found widespread application in technology adoption forecasting [17]. It assumes that the growth rate is proportional to both the current level of adoption and the remaining potential adopters, producing the classic S-shaped curve presented in Equation (2).
P t = K 1 + K P 0 P 0 e r t
Here, P(t) represents the share of adopters at time t, P0 is the observed share of adopters at t = 0, K is the carrying capacity (set to 1.0 with the assumption that all customers in the population may eventually adopt a single DER unit), and r is the growth rate. The parameters P0 and K are usually straightforward to determine from initial data and domain knowledge [21], while r must be estimated. Figure 1 illustrates the classic S-shaped adoption curve, highlighting the early, intermediate, and late adoption stages [3,4].
The logistic growth model is relatively simple and robust, making it a go-to choice for forecasting when data are sparse or when researchers lack granular information about social dynamics and marketing influences [17]. Its S-shaped trajectory closely resembles many observed adoption patterns: slow growth in early years, rapid expansion in mid-stage adoption, and eventual leveling off near market saturation [9]. Because the model only requires a few parameters, it is computationally efficient and can be fit with basic regression or simple solver tools [7].
Logistic growth does not explicitly incorporate the distinct effects of “innovators” and “imitators”, nor does it account for network influences like peer-to-peer communication [21]. As a result, it may oversimplify adoption processes in contexts where social interactions are critical or where multiple product generations are introduced before saturation [20]. In addition, if a market’s maximum saturation level (the parameter K) changes over time due to evolving policies or technologies, the model can lose predictive power [35]. Similarly, the single growth rate r might not reflect real-world changes in consumer sentiment or regulation that accelerate or decelerate adoption during different periods [5].

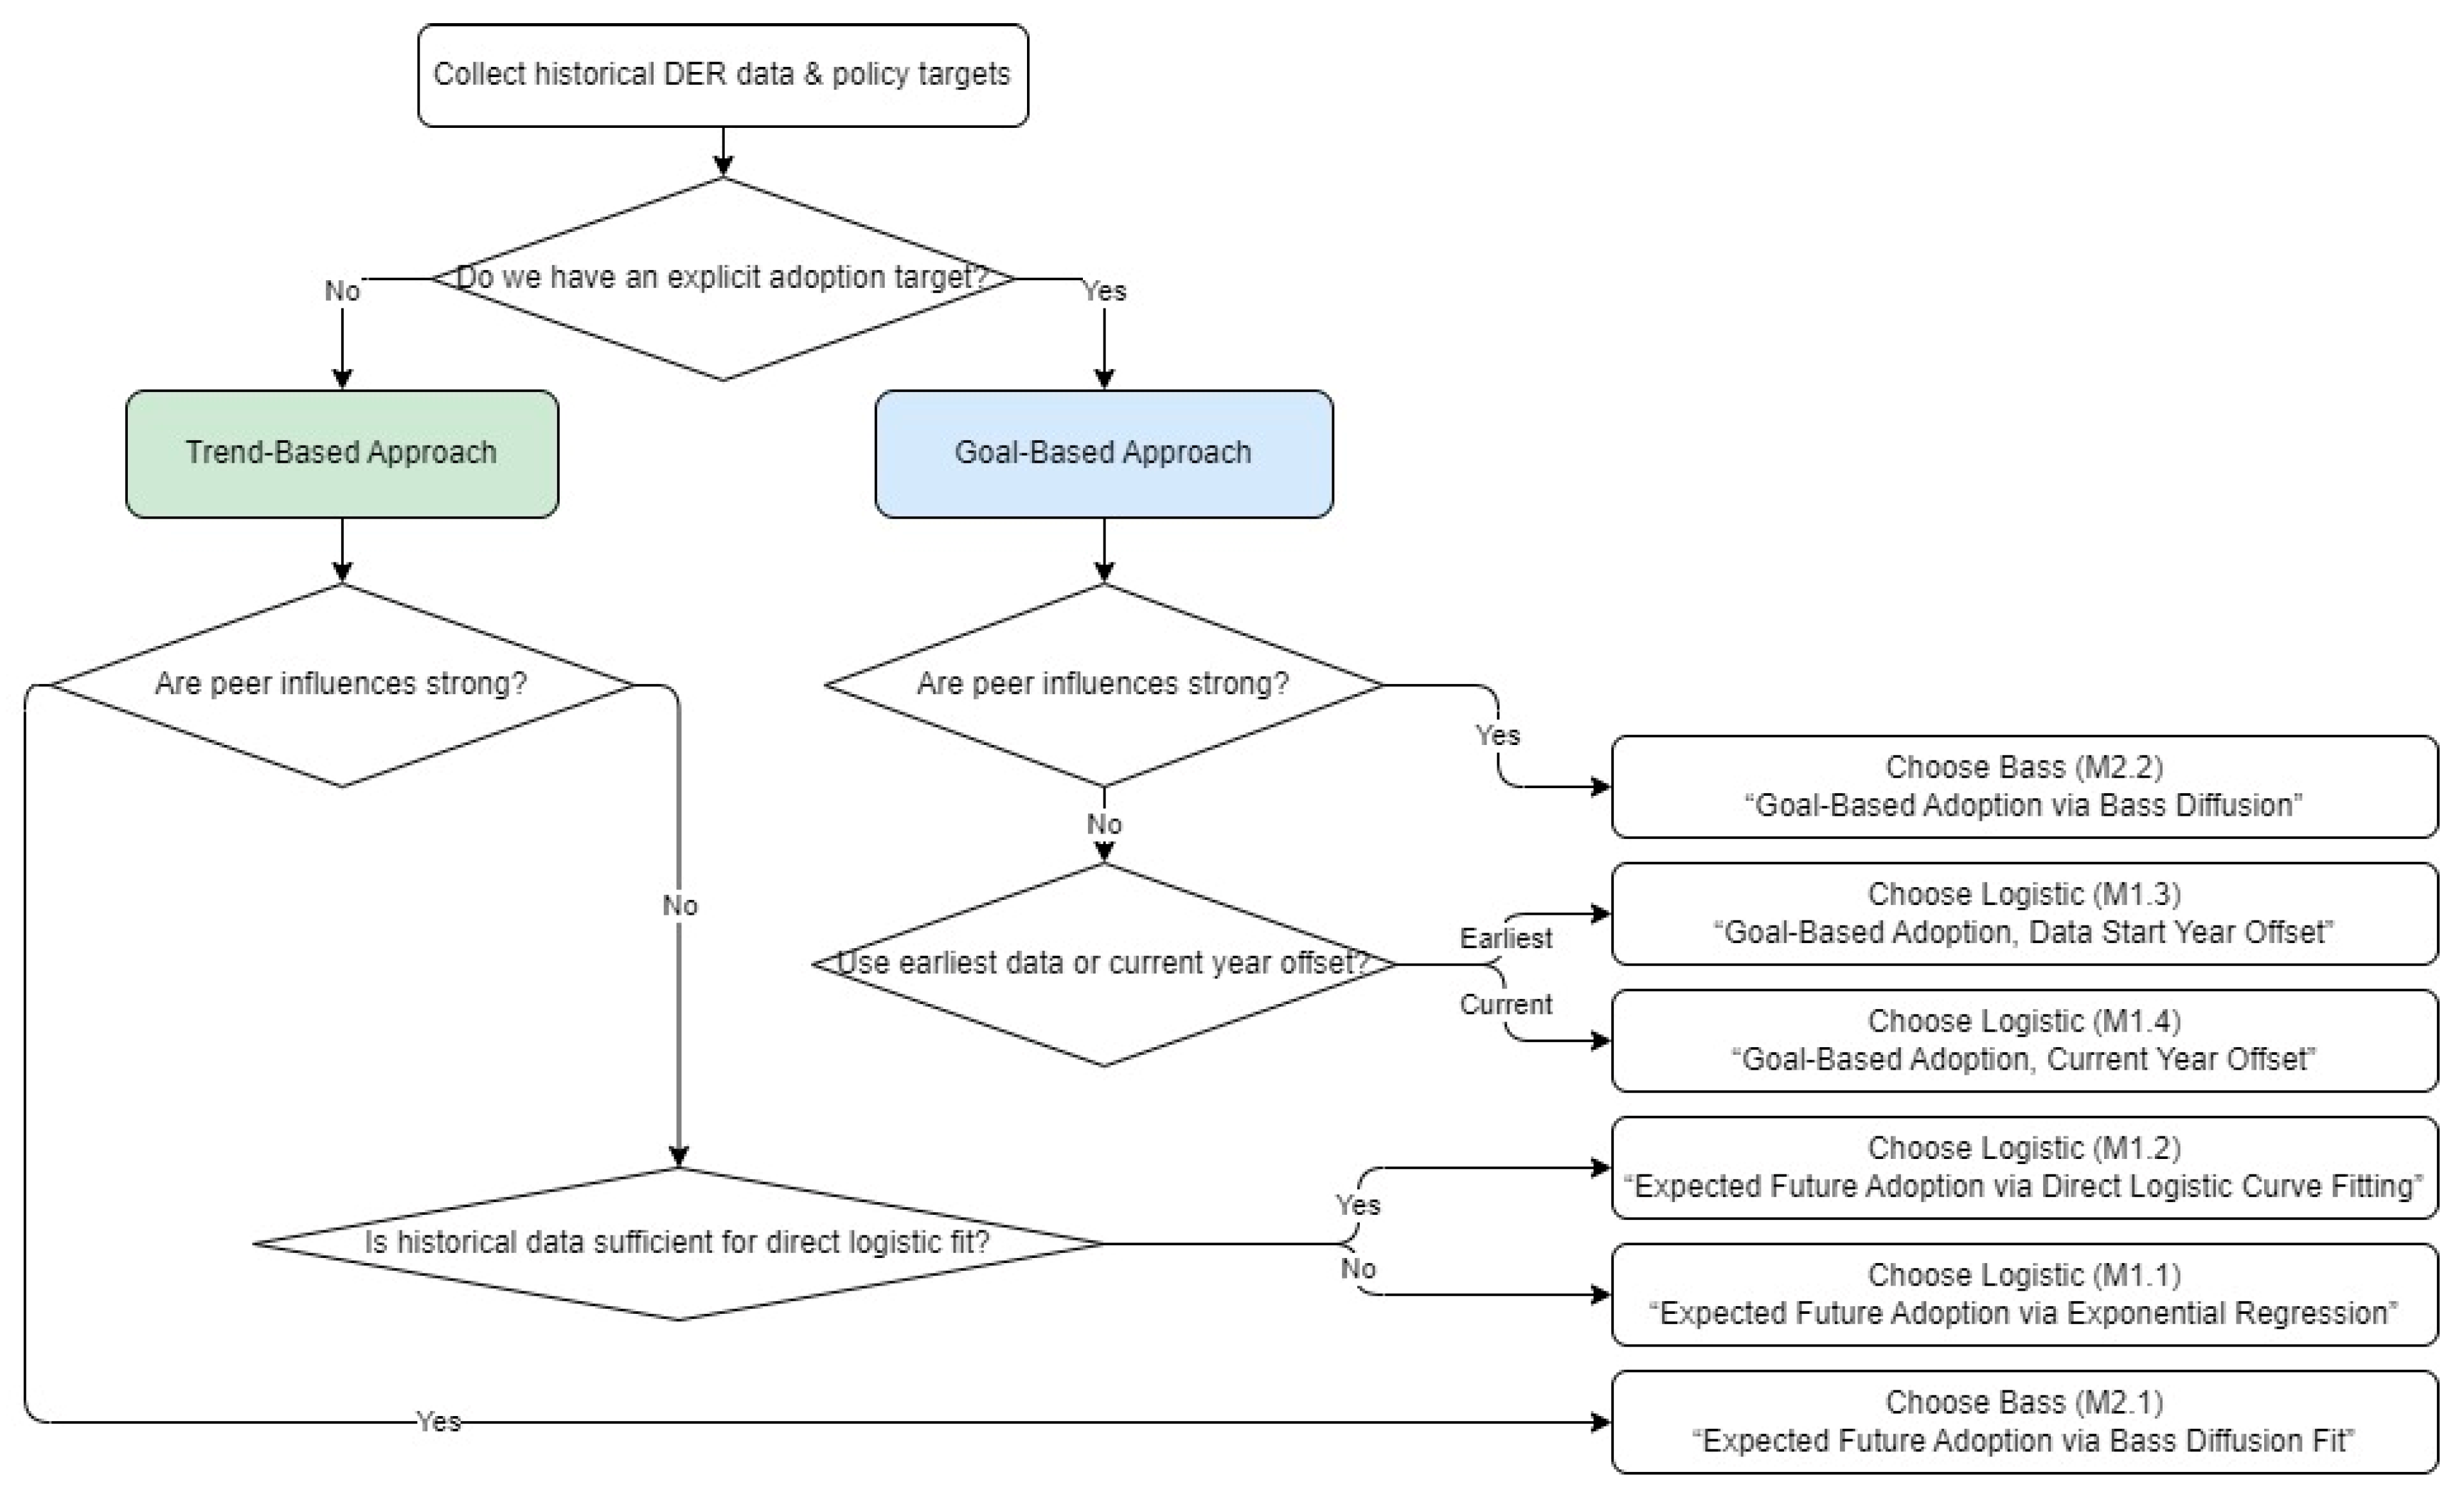
3. Model Selection and Curve-Fitting Framework for DER Adoption

This section outlines a structured framework for estimating DER adoption trajectories. Table 3 summarizes each method, its parameter estimation technique, and future adoption targets. The six methods integrate two major diffusion paradigms (logistic growth and Bass diffusion) with either trend-based or goal-based parameter estimation, allowing analysts to balance historical fidelity against policy-driven scenarios [3,6]. This multi-method perspective aligns with previous research on DER diffusion, where no single model universally outperforms others under all data and policy conditions [1,9,19,21]. The selection from M1.1–M1.4 or M2.1–M2.2 depends on the availability of reliable historical data, the extent of peer influences, and the specificity of future targets.

3.1. Logistic Growth Model Approaches

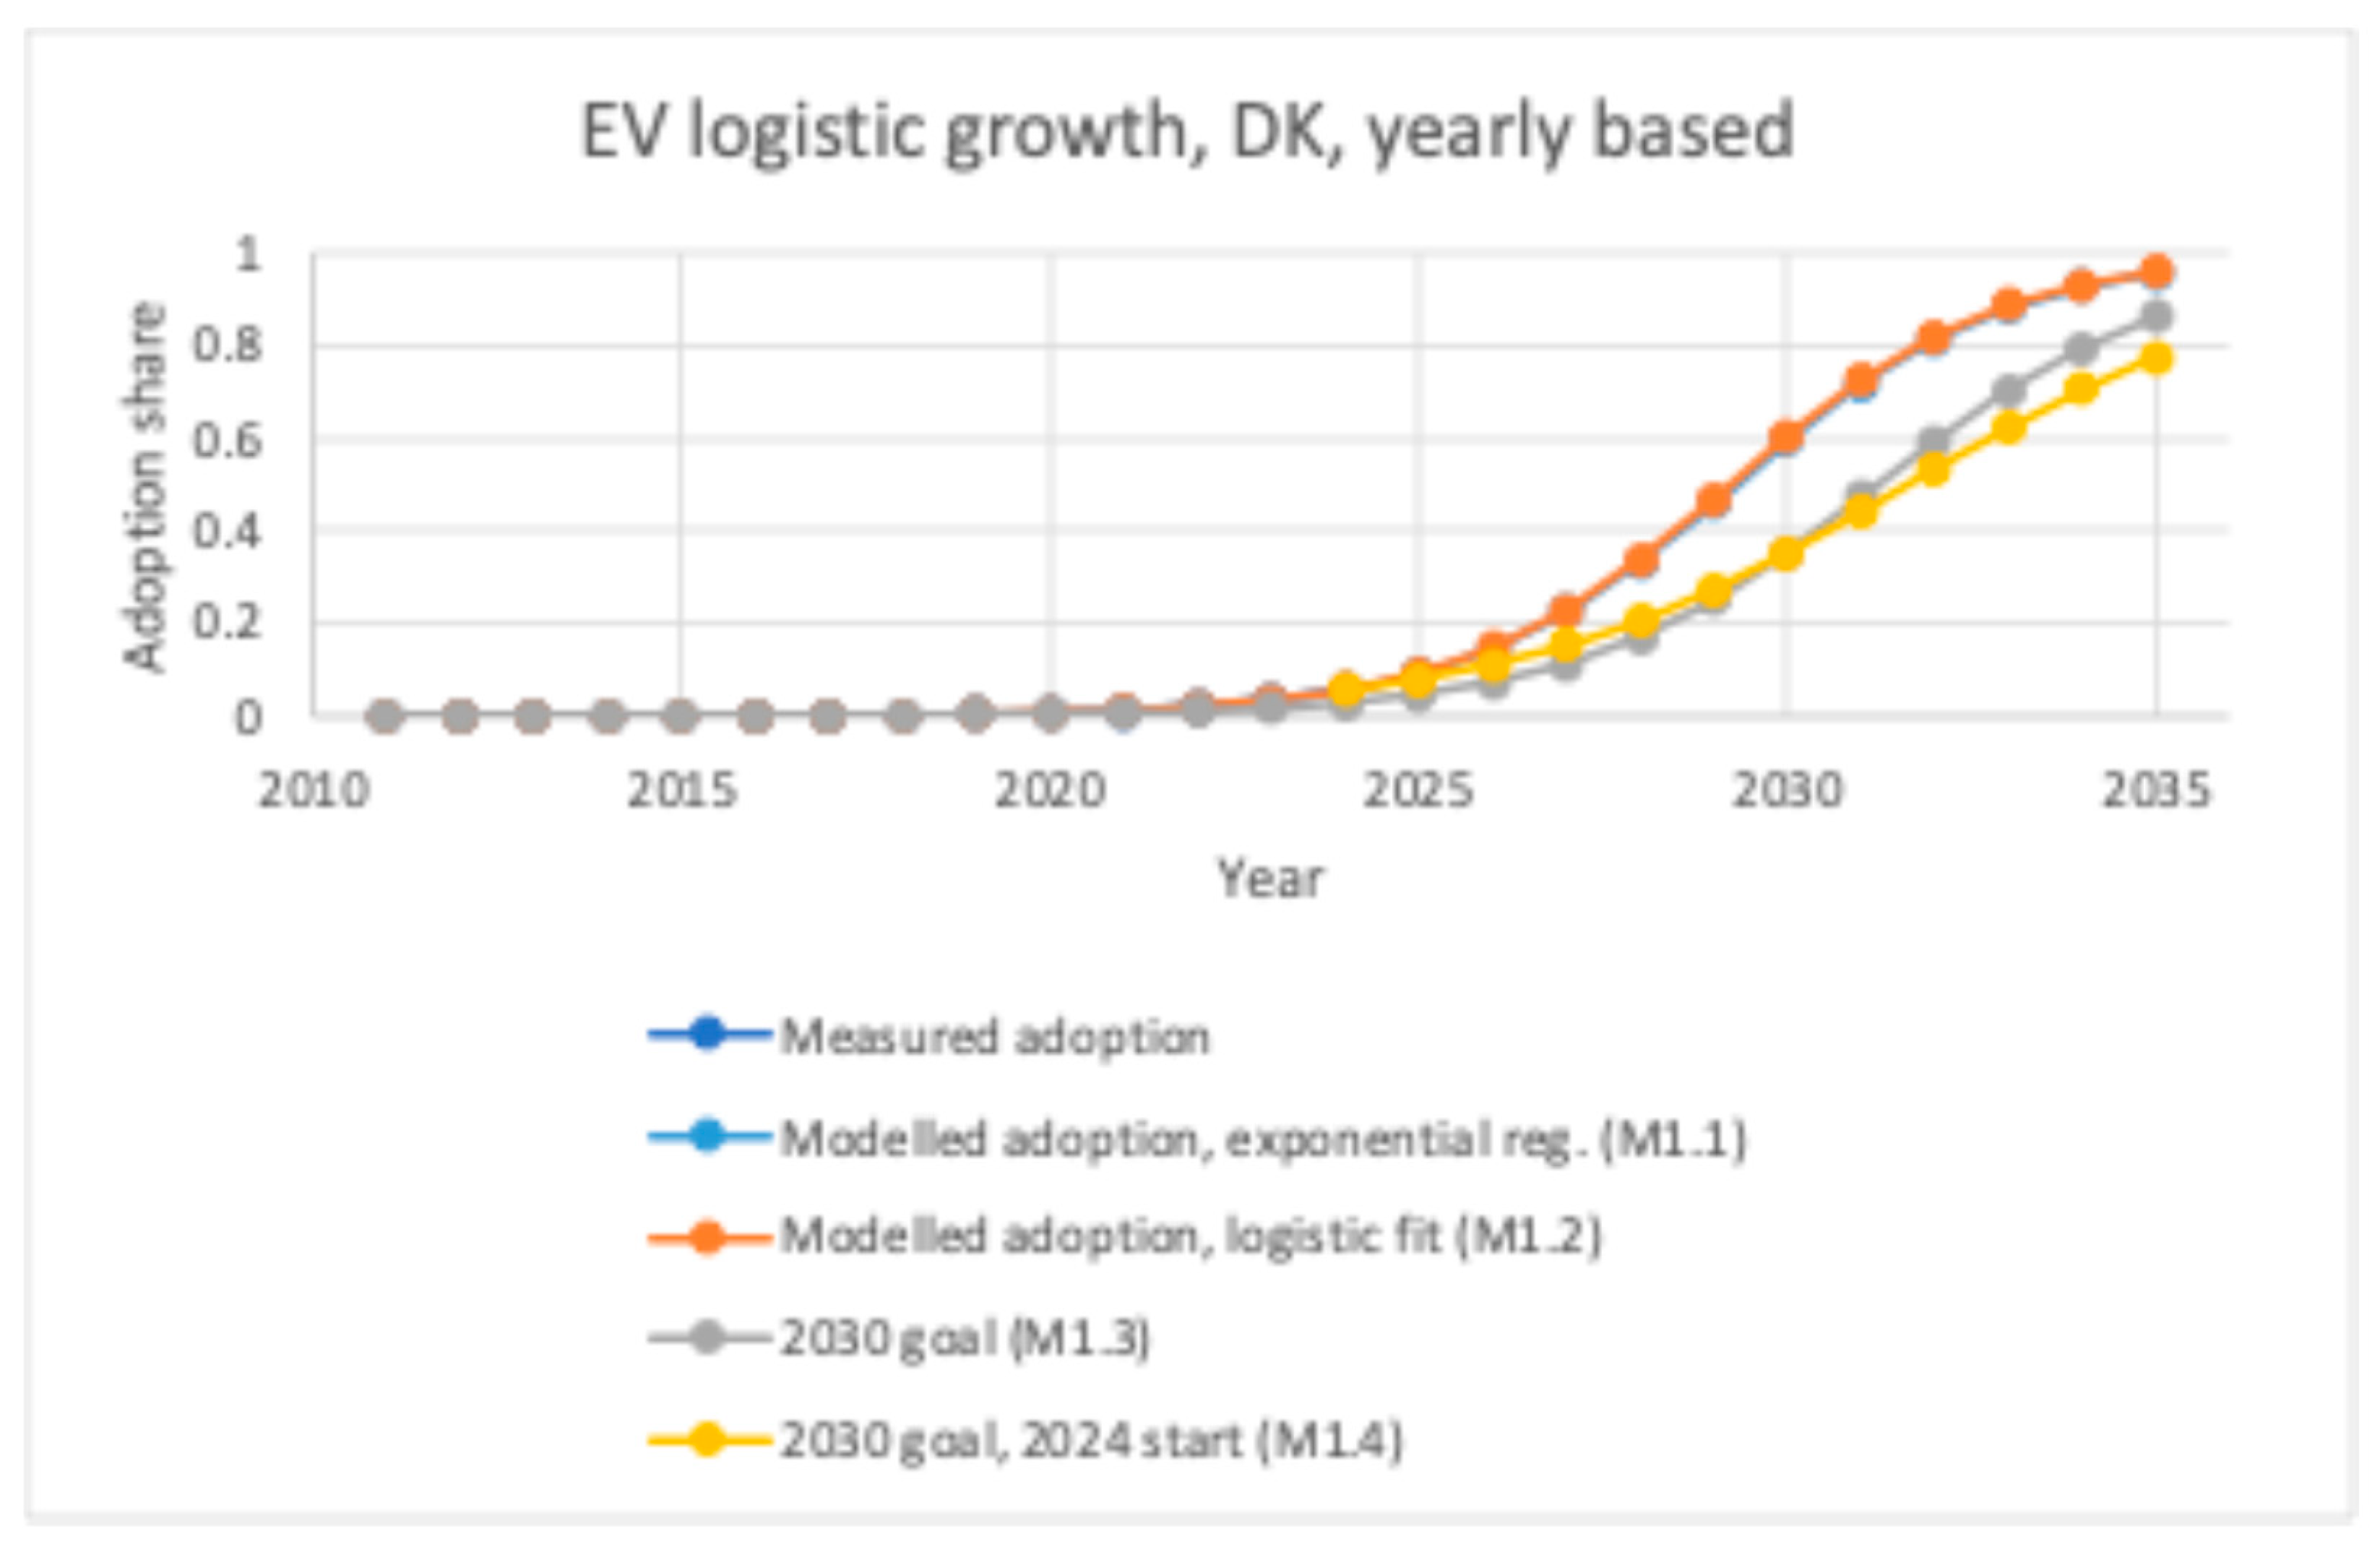
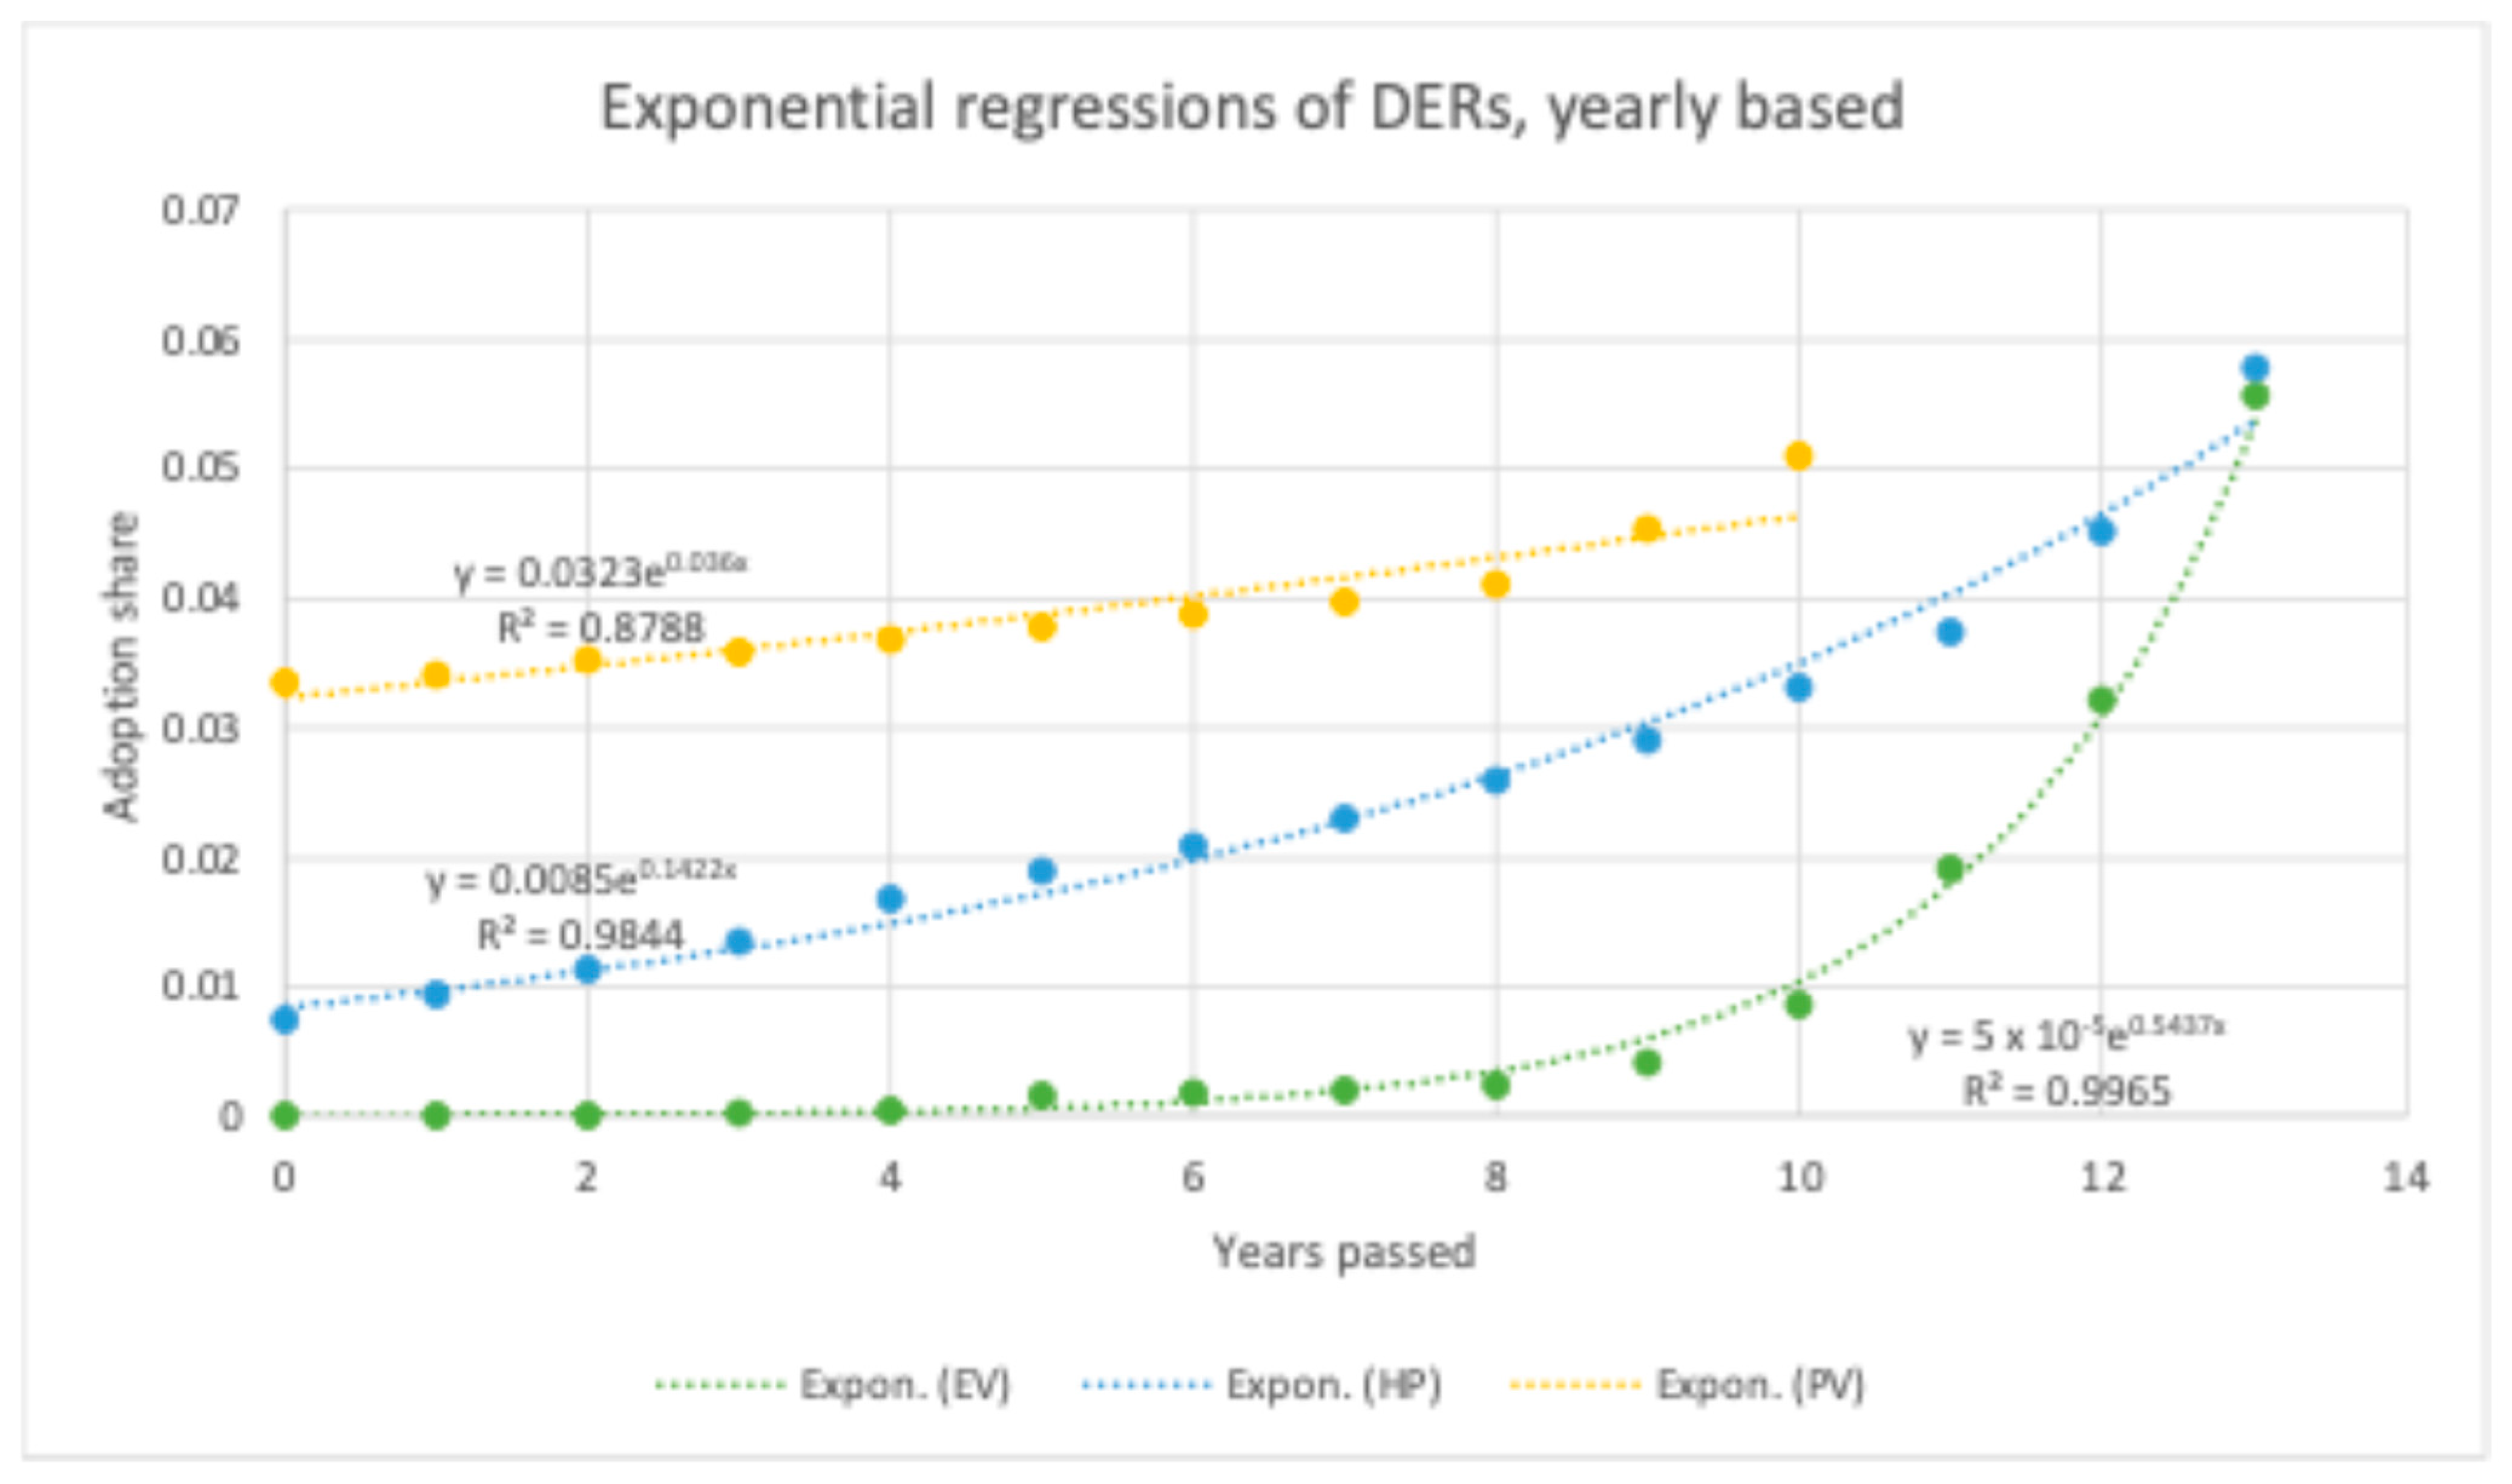
3.1.1. M1.1: Expected Future Adoption via Exponential Regression

In the early adoption stages, empirical data often show near-exponential growth [4]. Method M1.1 uses a simple exponential regression on historical data to obtain an approximate r. This r is then applied in the logistic function. While straightforward, this approach is best suited for limited datasets that capture only the “early adopter” phase and can be vulnerable to outliers, which may distort the exponential trend [1].

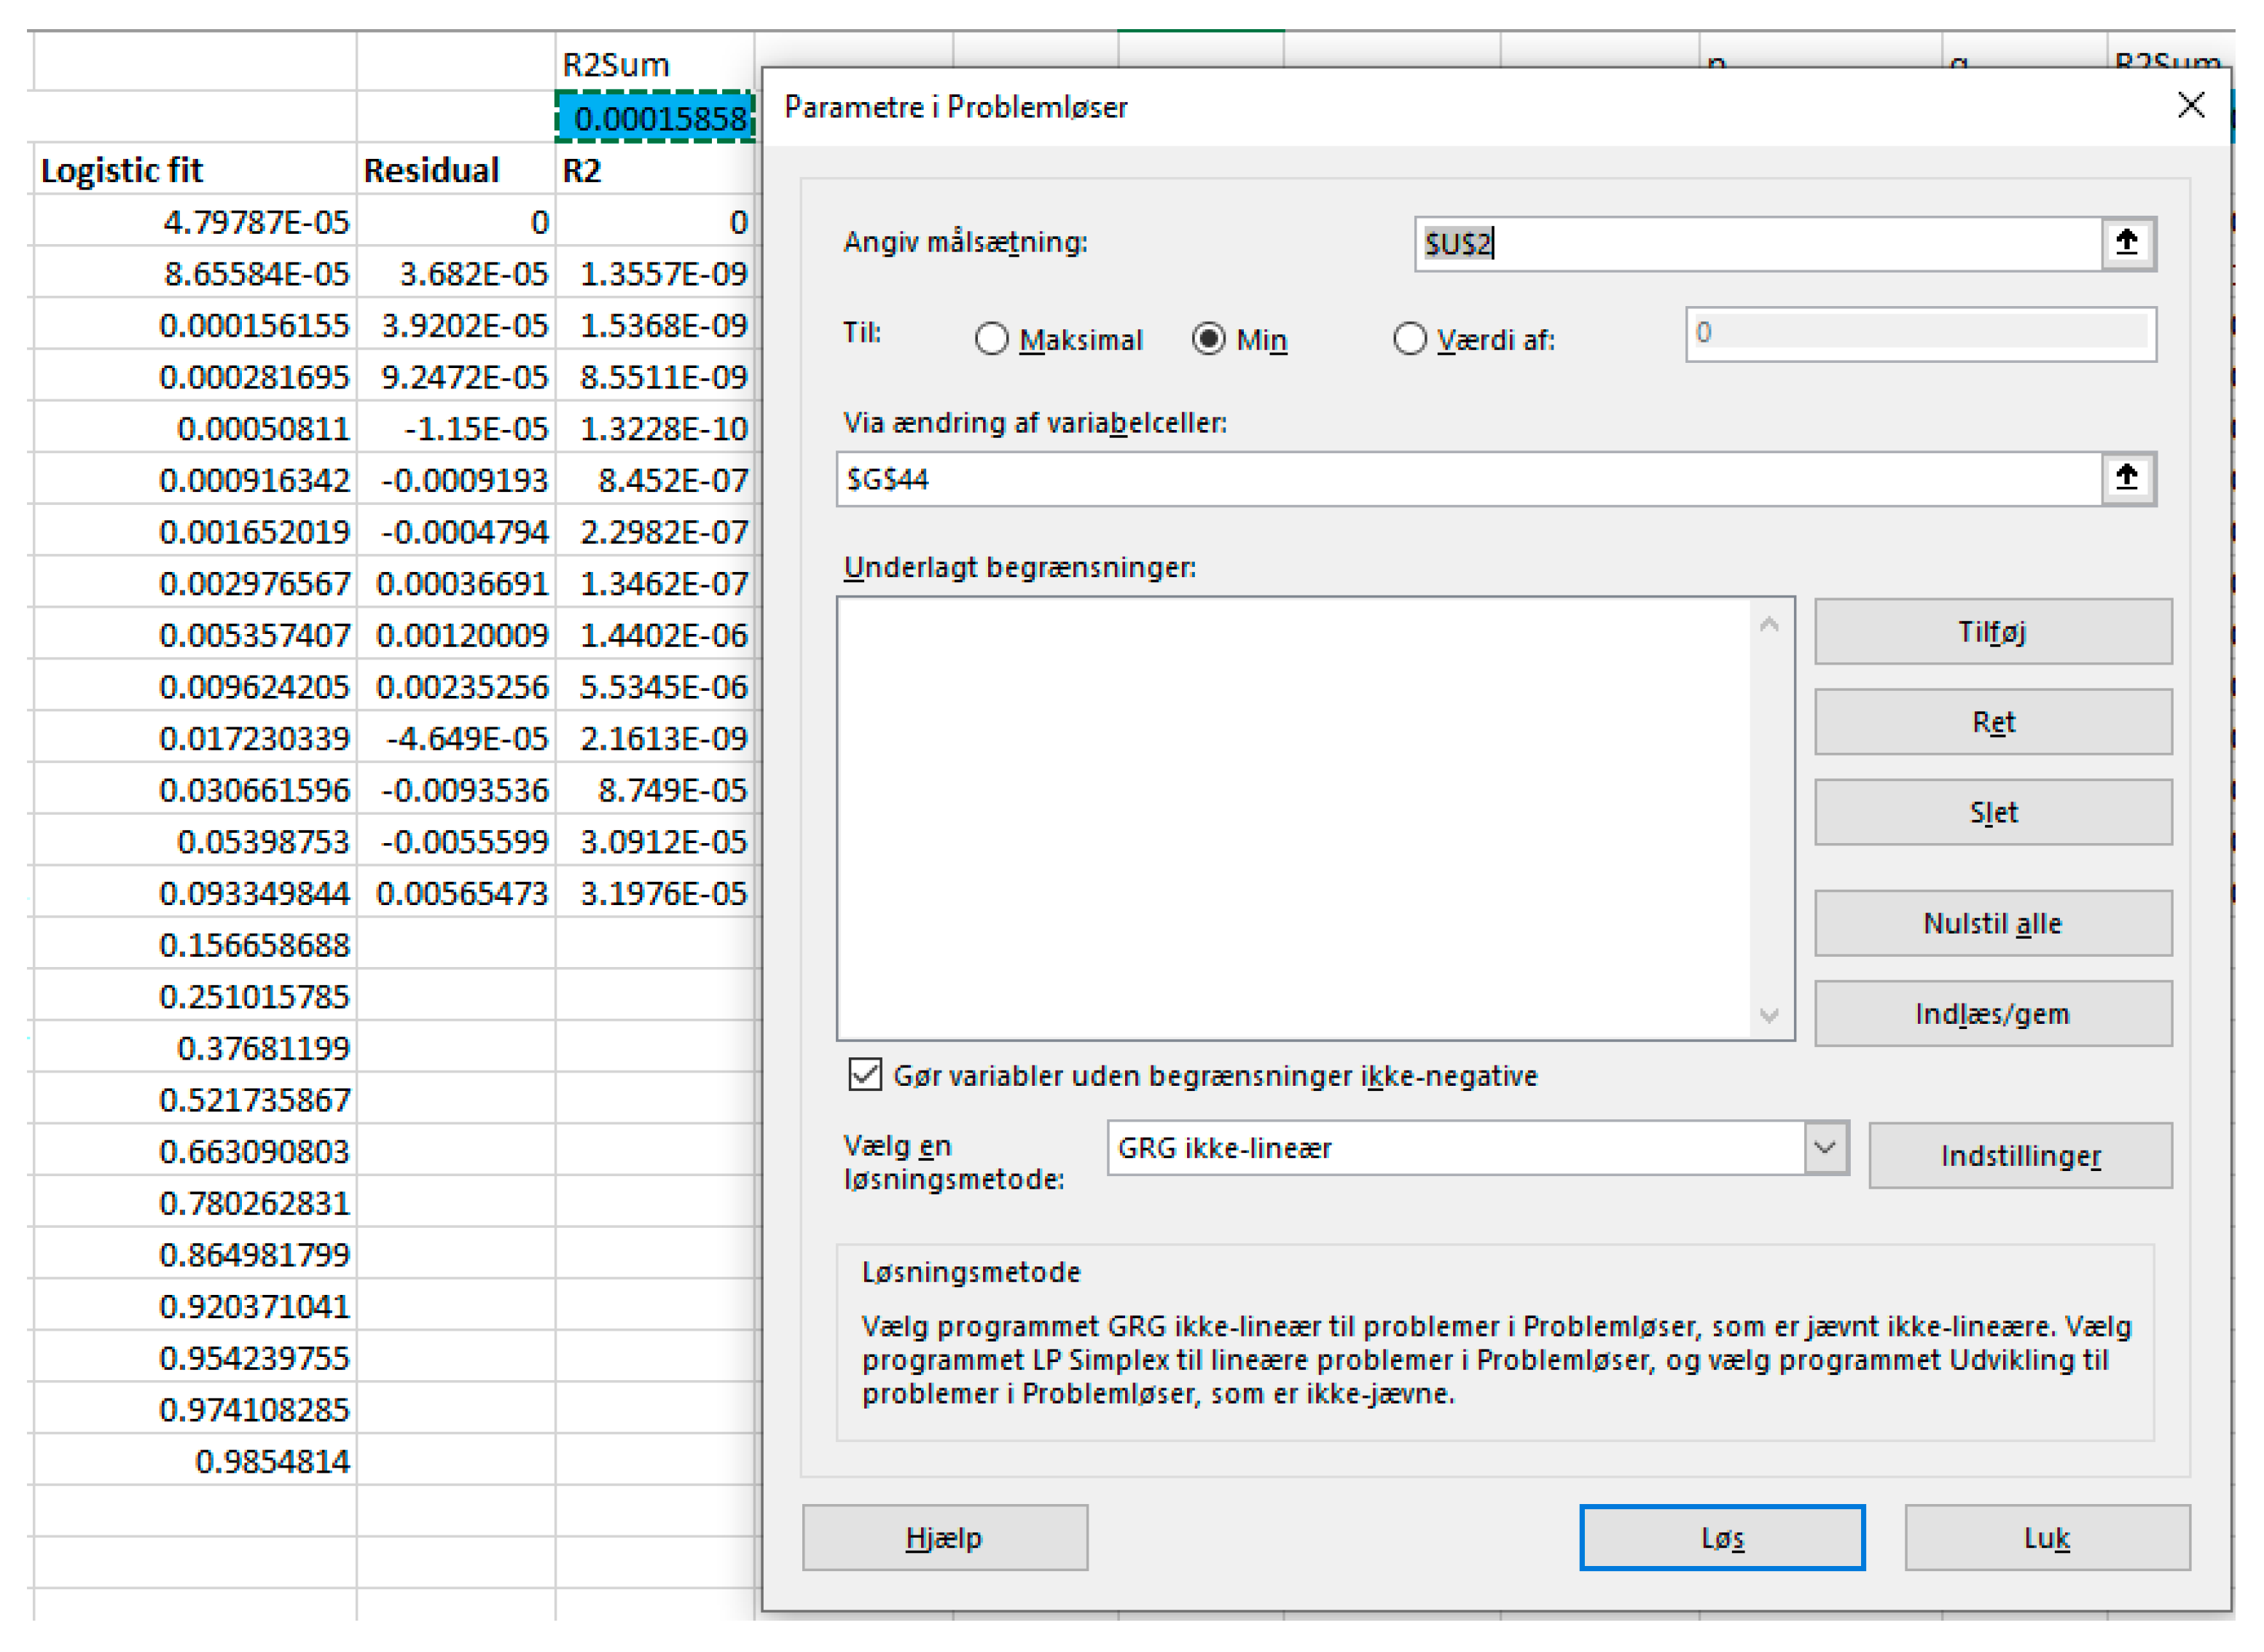
3.1.2. M1.2: Expected Future Adoption via Logistic Fit

Method M1.2 directly fits the logistic growth curve to historical adoption data by minimizing the sum of squared residuals:
E = t = 0 N P t P t . o b s e r v e d 2
An iterative solver (e.g., GRG Non-Linear in Microsoft Excel) searches for the r that best replicates observed data. This can yield higher accuracy than M1.1 if the historical series spans multiple adoption stages [5]. Convergence on a global minimum is not always guaranteed, however, and may depend on initial parameter guesses. An example of a solver-based approach to fit a logistic growth curve to measured adoption data is shown in Figure 2.

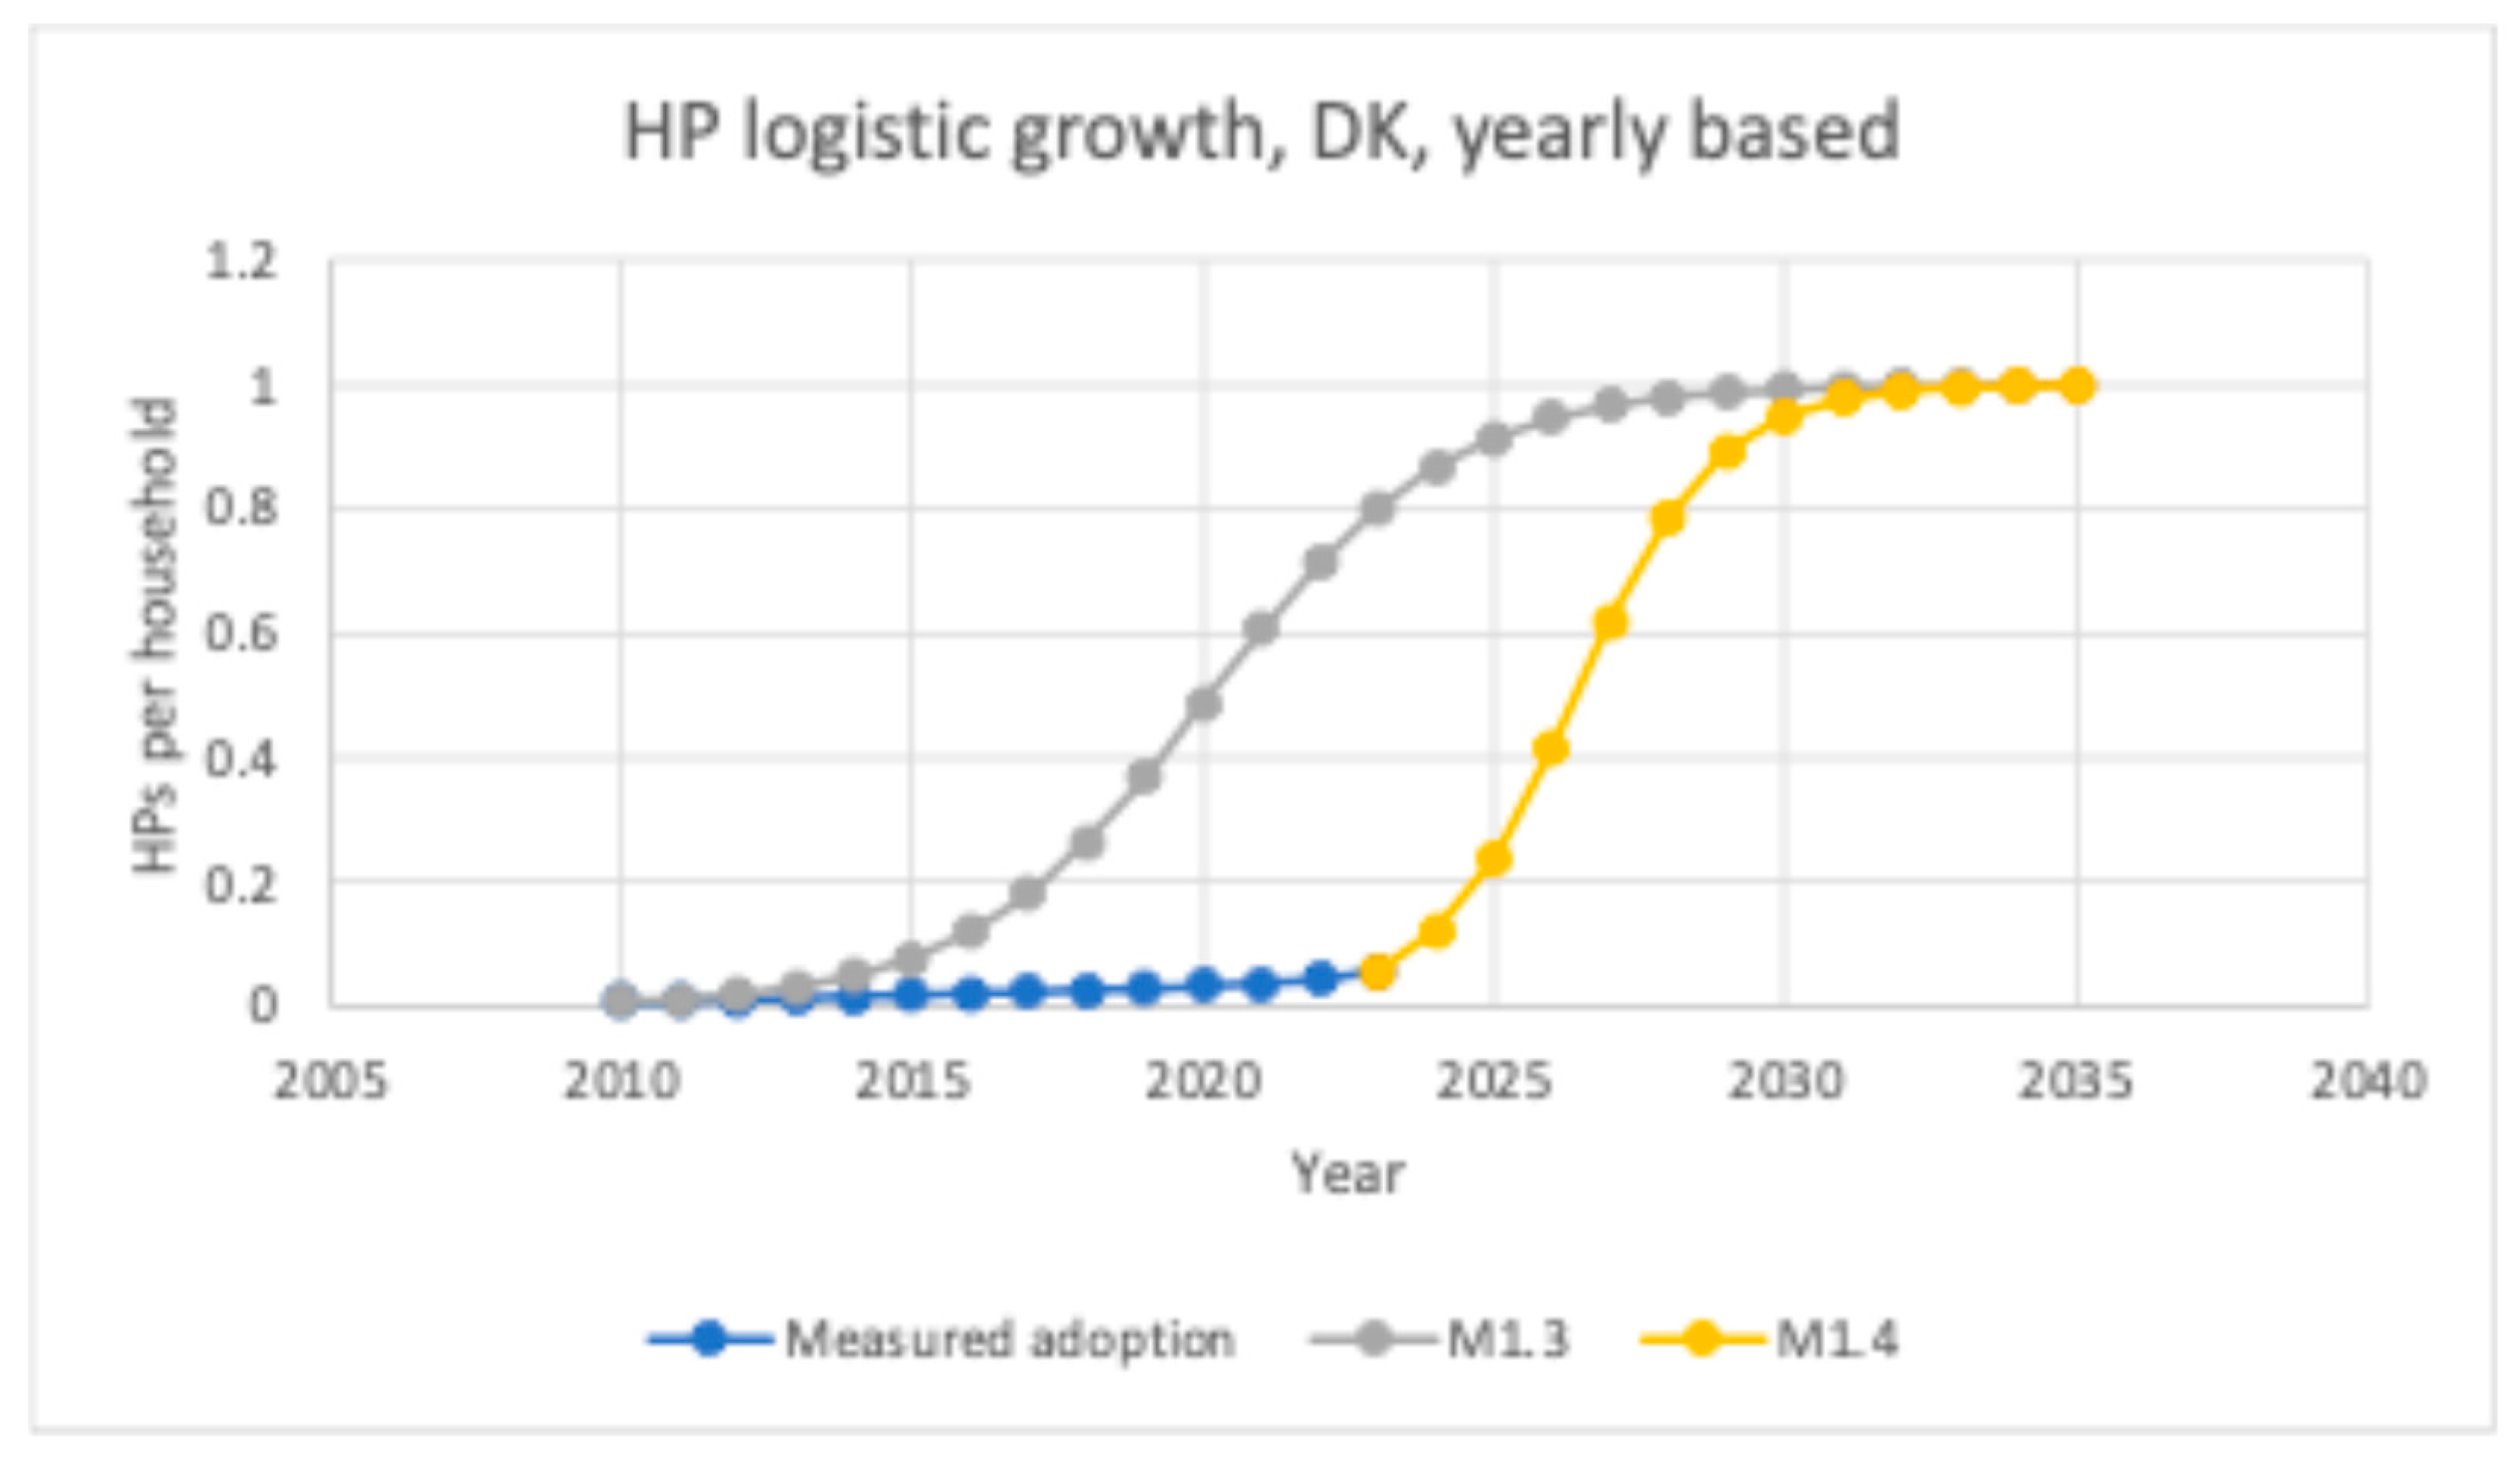
3.1.3. M1.3: Goal-Based Adoption (Data Start Year Offset)

Method M1.3 addresses scenarios where a specific adoption target is mandated by a certain year (e.g., 80% by 2030). The solver adjusts r so that P (target year) meets this policy goal. It effectively backcasts the entire adoption curve to match the specified endpoint [9]. While insightful for “what-if” analyses, it reflects the adoption rate that should have applied since the very first data point, which can diverge from realistic trajectories if the historical adoption was slower [6].

3.1.4. M1.4: Goal-Based Adoption (Current Year Offset)

Method M1.4 is similar to M1.3 but begins at the most recent measurement year. The logistic model “resets”, requiring faster growth from the present to achieve the same target by the specified year. This approach can underestimate actual inertia if the adoption process is already past its early stages, though it is useful for estimating how aggressively adoption must ramp up to meet ambitious goals [5]. Figure 3 depicts typical outcomes for M1.3 and M1.4, using heat pumps as an example.

3.2. Bass Diffusion Model Approaches

3.2.1. M2.1: Expected Future Adoption via Bass Diffusion Fit

Method M2.1 uses the same solver-based approach as M1.2 but fits the Bass function to observed data. Because both p and q must be optimized simultaneously, the solution space is larger and can contain multiple local minima [2]. Nonetheless, Bass modeling can outperform logistic approaches in contexts where peer effects strongly drive adoption [5,19].

3.2.2. M2.2: Goal-Based Adoption via Bass Diffusion Fit

Method M2.2 adapts the Bass model to enforce a future adoption goal. An artificial data point corresponding to the target share at the target year is added, and the solver seeks (p, q) minimizing residuals across both past measurements and the future target [38]. Alternatively, the future target can be weighed more heavily if it represents a strict policy objective. This technique can reveal how much greater the imitation or innovation rate must be to meet ambitious government mandates [19]. While powerful, the final fit may not exactly match the target if numerous historical data points dominate the objective function [4].

4. Empirical Application: Distributed Energy Resource Adoption in Denmark

This section illustrates how the proposed modeling methods can be applied in practice by examining three key DERs in Denmark: EVs, HPs, and rooftop PVs. Each subsection details firstly the data sources and basic assumptions, secondly the policy or market goals for future adoption, and thirdly the resulting parameter estimates and adoption curves under both logistic growth and Bass diffusion models. All numerical calculations were conducted in a spreadsheet environment for accessibility, although the methods could be implemented in other software tools.
All adoption curves presented here express the share of households that have adopted a given technology. To achieve a time series of adoption shares, the total number of adopters in a given year is divided by the estimated number of households in Denmark for that same year. Although the household count changes slightly over time, the variation is small enough to include without loss of generality. This study assumes each household can adopt at most one unit of each DER (one EV, one heat pump, one PV system). For policy-driven projections, the same modeling structure from Section 3 is applied, but with technology-specific data.

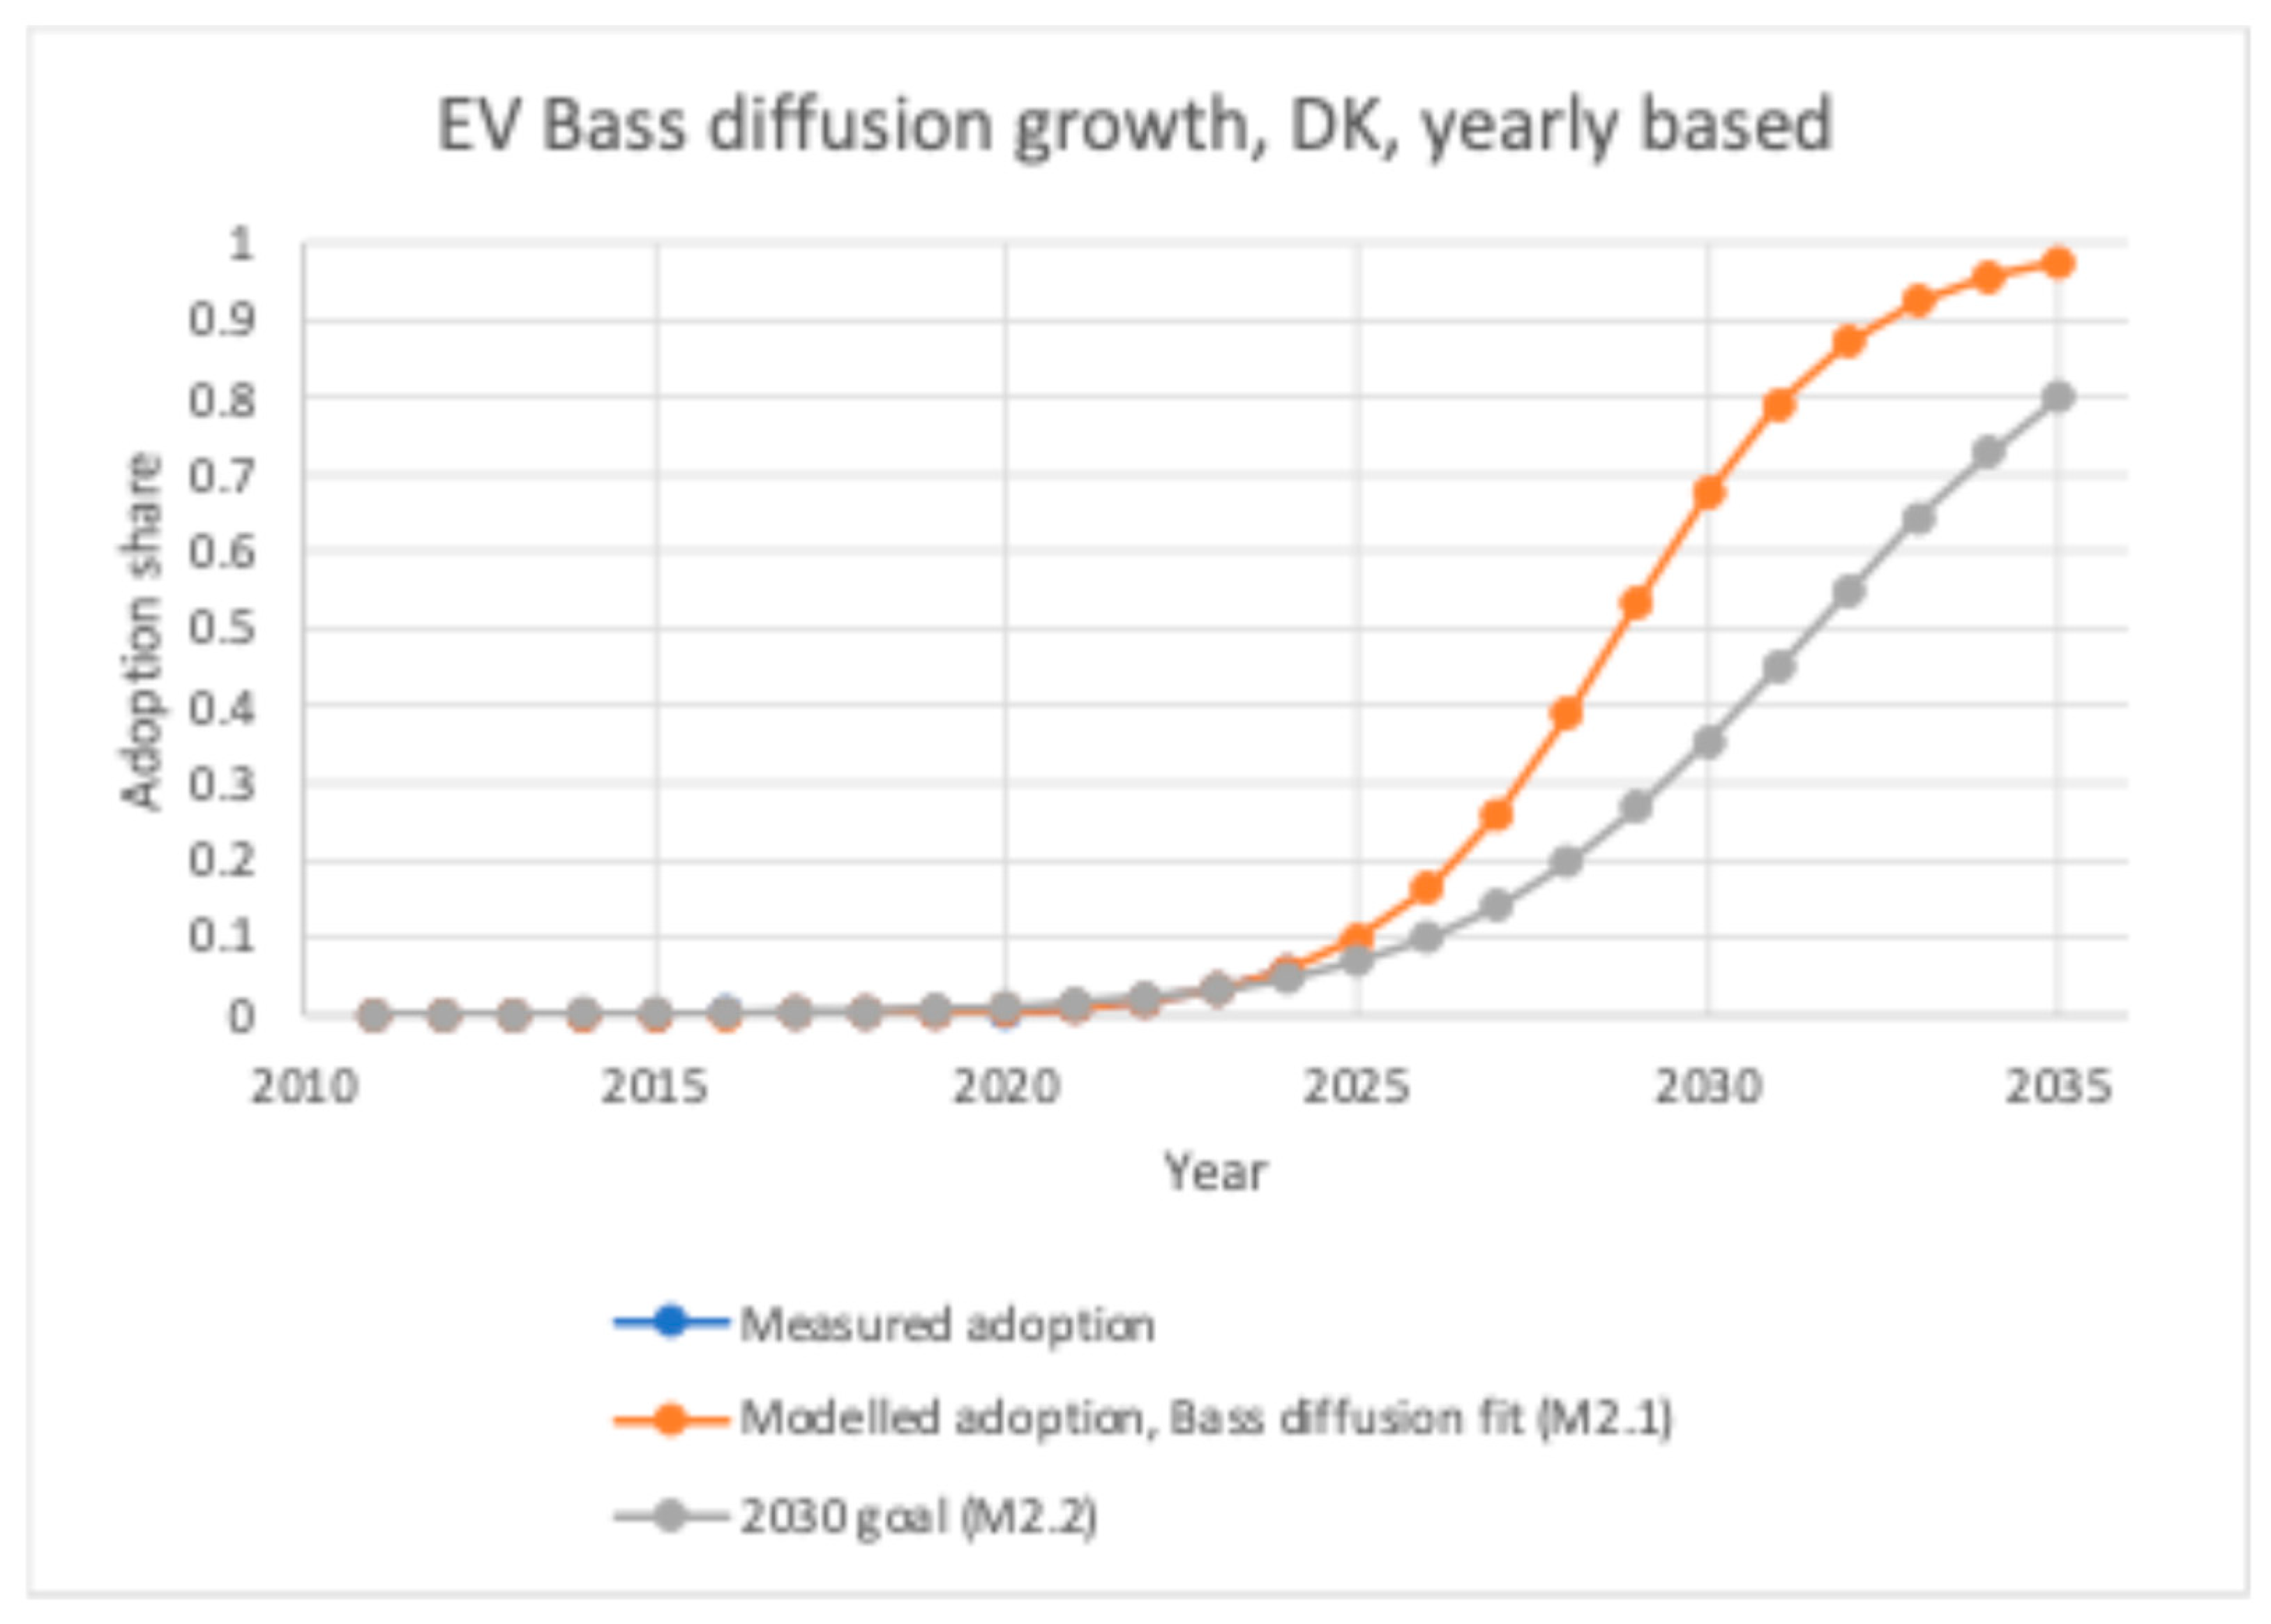
4.1. Electric Vehicle Adoption

Data for EV adoption in Denmark were obtained from Statistics Denmark [39]. This dataset reports the Danish car fleet on a monthly basis, disaggregated by vehicle propulsion (gasoline, diesel, hybrid, pure electric). For this case, only pure EVs were considered. Additional municipality-level data for Middelfart from 2018 to 2023 were also examined, but the main results focus on the national level for the years 2010–2024.
A national political target envisions one million pure electric vehicles on Danish roads by 2030 [40]. The official goal does not distinguish between private and commercial ownership, but the present analysis assumes every EV counted toward the goal belongs to a household. Based on the 2024 household count, the required EV adoption share is approximately 35.3% by 2030.
Table 4 shows the estimated logistic growth (M1.1–M1.4) and Bass diffusion (M2.1–M2.2) parameters for EV adoption, while Figure 4 and Figure 5 depict the resulting adoption curves. The parameter estimates suggest that under pure trend extrapolation (e.g., M1.1 or M2.1), Denmark’s EV adoption is on track to surpass 35% penetration before 2030, reflecting recent high growth rates. Goal-based fits (M1.3, M2.2) align the 2030 share explicitly with the 35.3% threshold, although they vary in how strongly they weight historical data versus meeting the policy target.

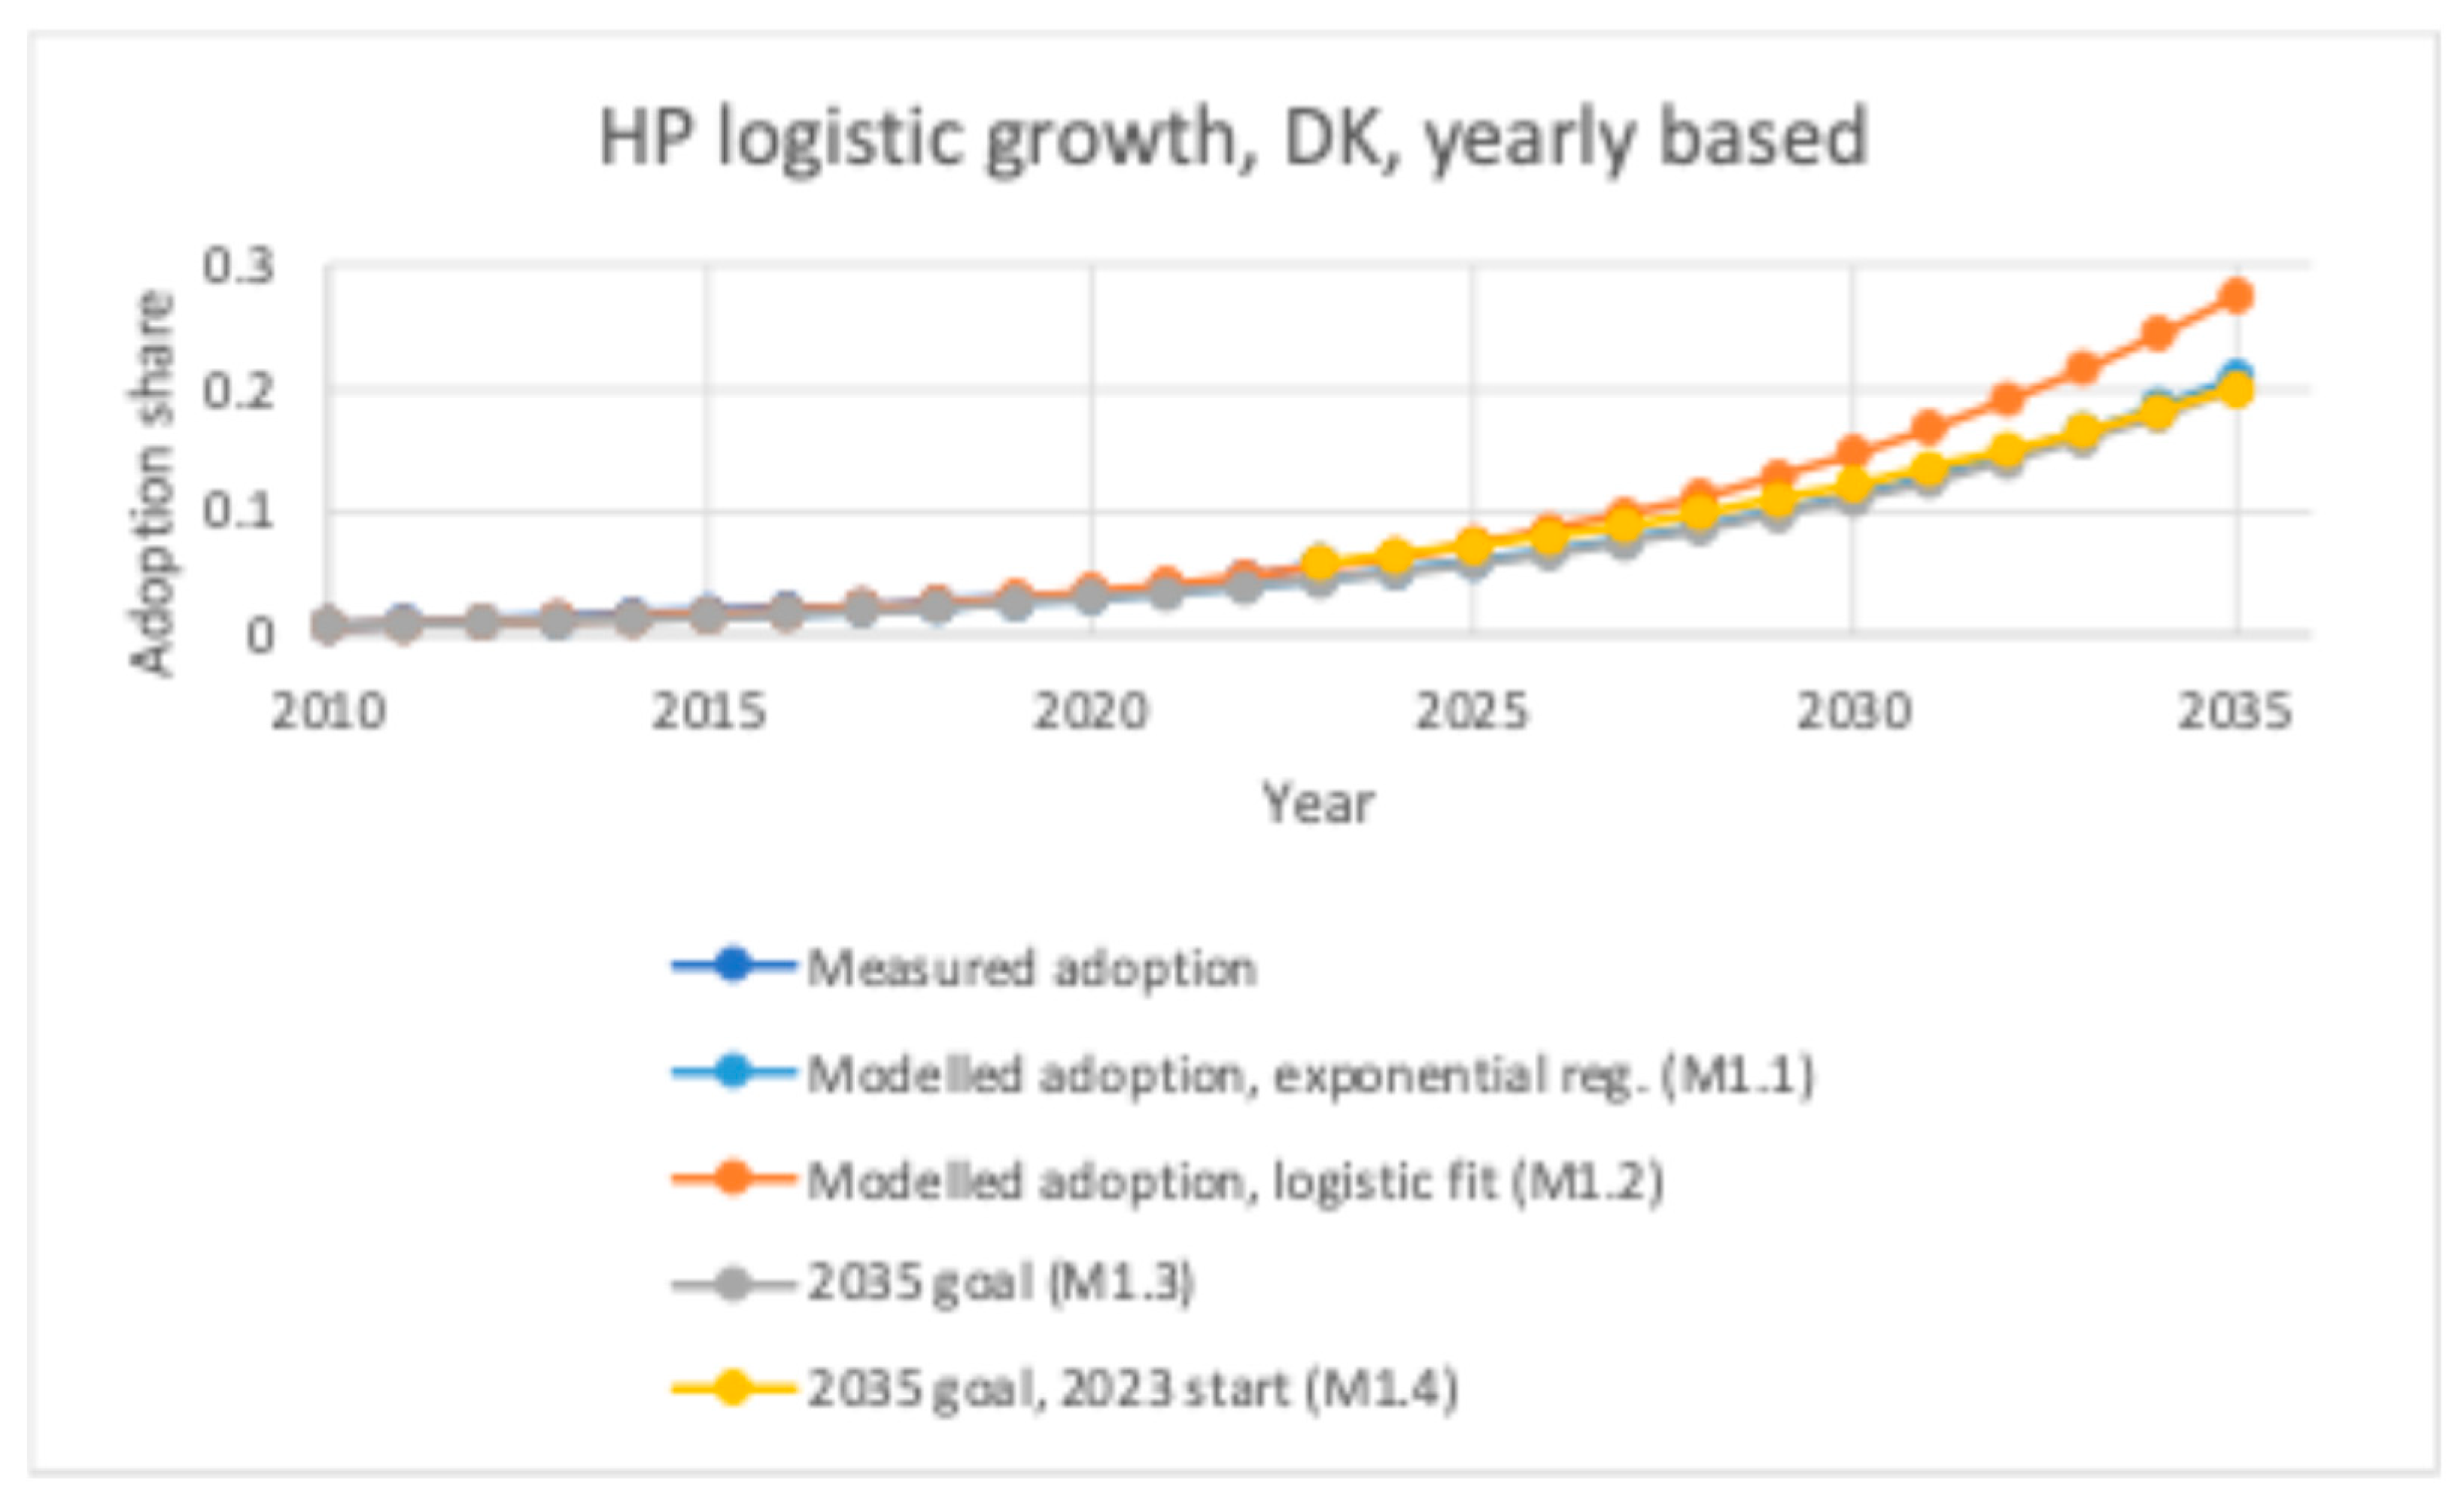
4.2. Heat Pump Adoption

Annual data on residential heat pump (HP) installations in Denmark from 2010 to 2023 were extracted from Statistics Denmark [39]. The building types include one-family houses, terraced/multi-family houses, and apartment buildings. For this analysis, each household is assumed responsible for exactly one HP unit in the dataset, though in reality multi-family dwellings may share heat pump systems.
A report [41] projects 14% of Danish residential buildings employing HPs by 2030 and 20% by 2035. However, this figure differs from official Statistics Denmark data indicating that only 3.3% of households have HPs. Discrepancies may be due to how multi-unit buildings are counted. Although this calls the reported targets into question, the present analysis proceeds with the nominal 14% (2030) and 20% (2035) goals for demonstration.
Table 5 summarizes the estimated model parameters. Figure 6 and Figure 7 illustrate the logistic growth and Bass diffusion fits. The M1.2 method yields a higher estimated logistic growth rate (r = 0.48378) than M1.1, possibly because more mid-stage data are included. The difference between the official 3.3% adoption and the 8% in [41] indicates that actual market behavior might diverge substantially from government forecasts.

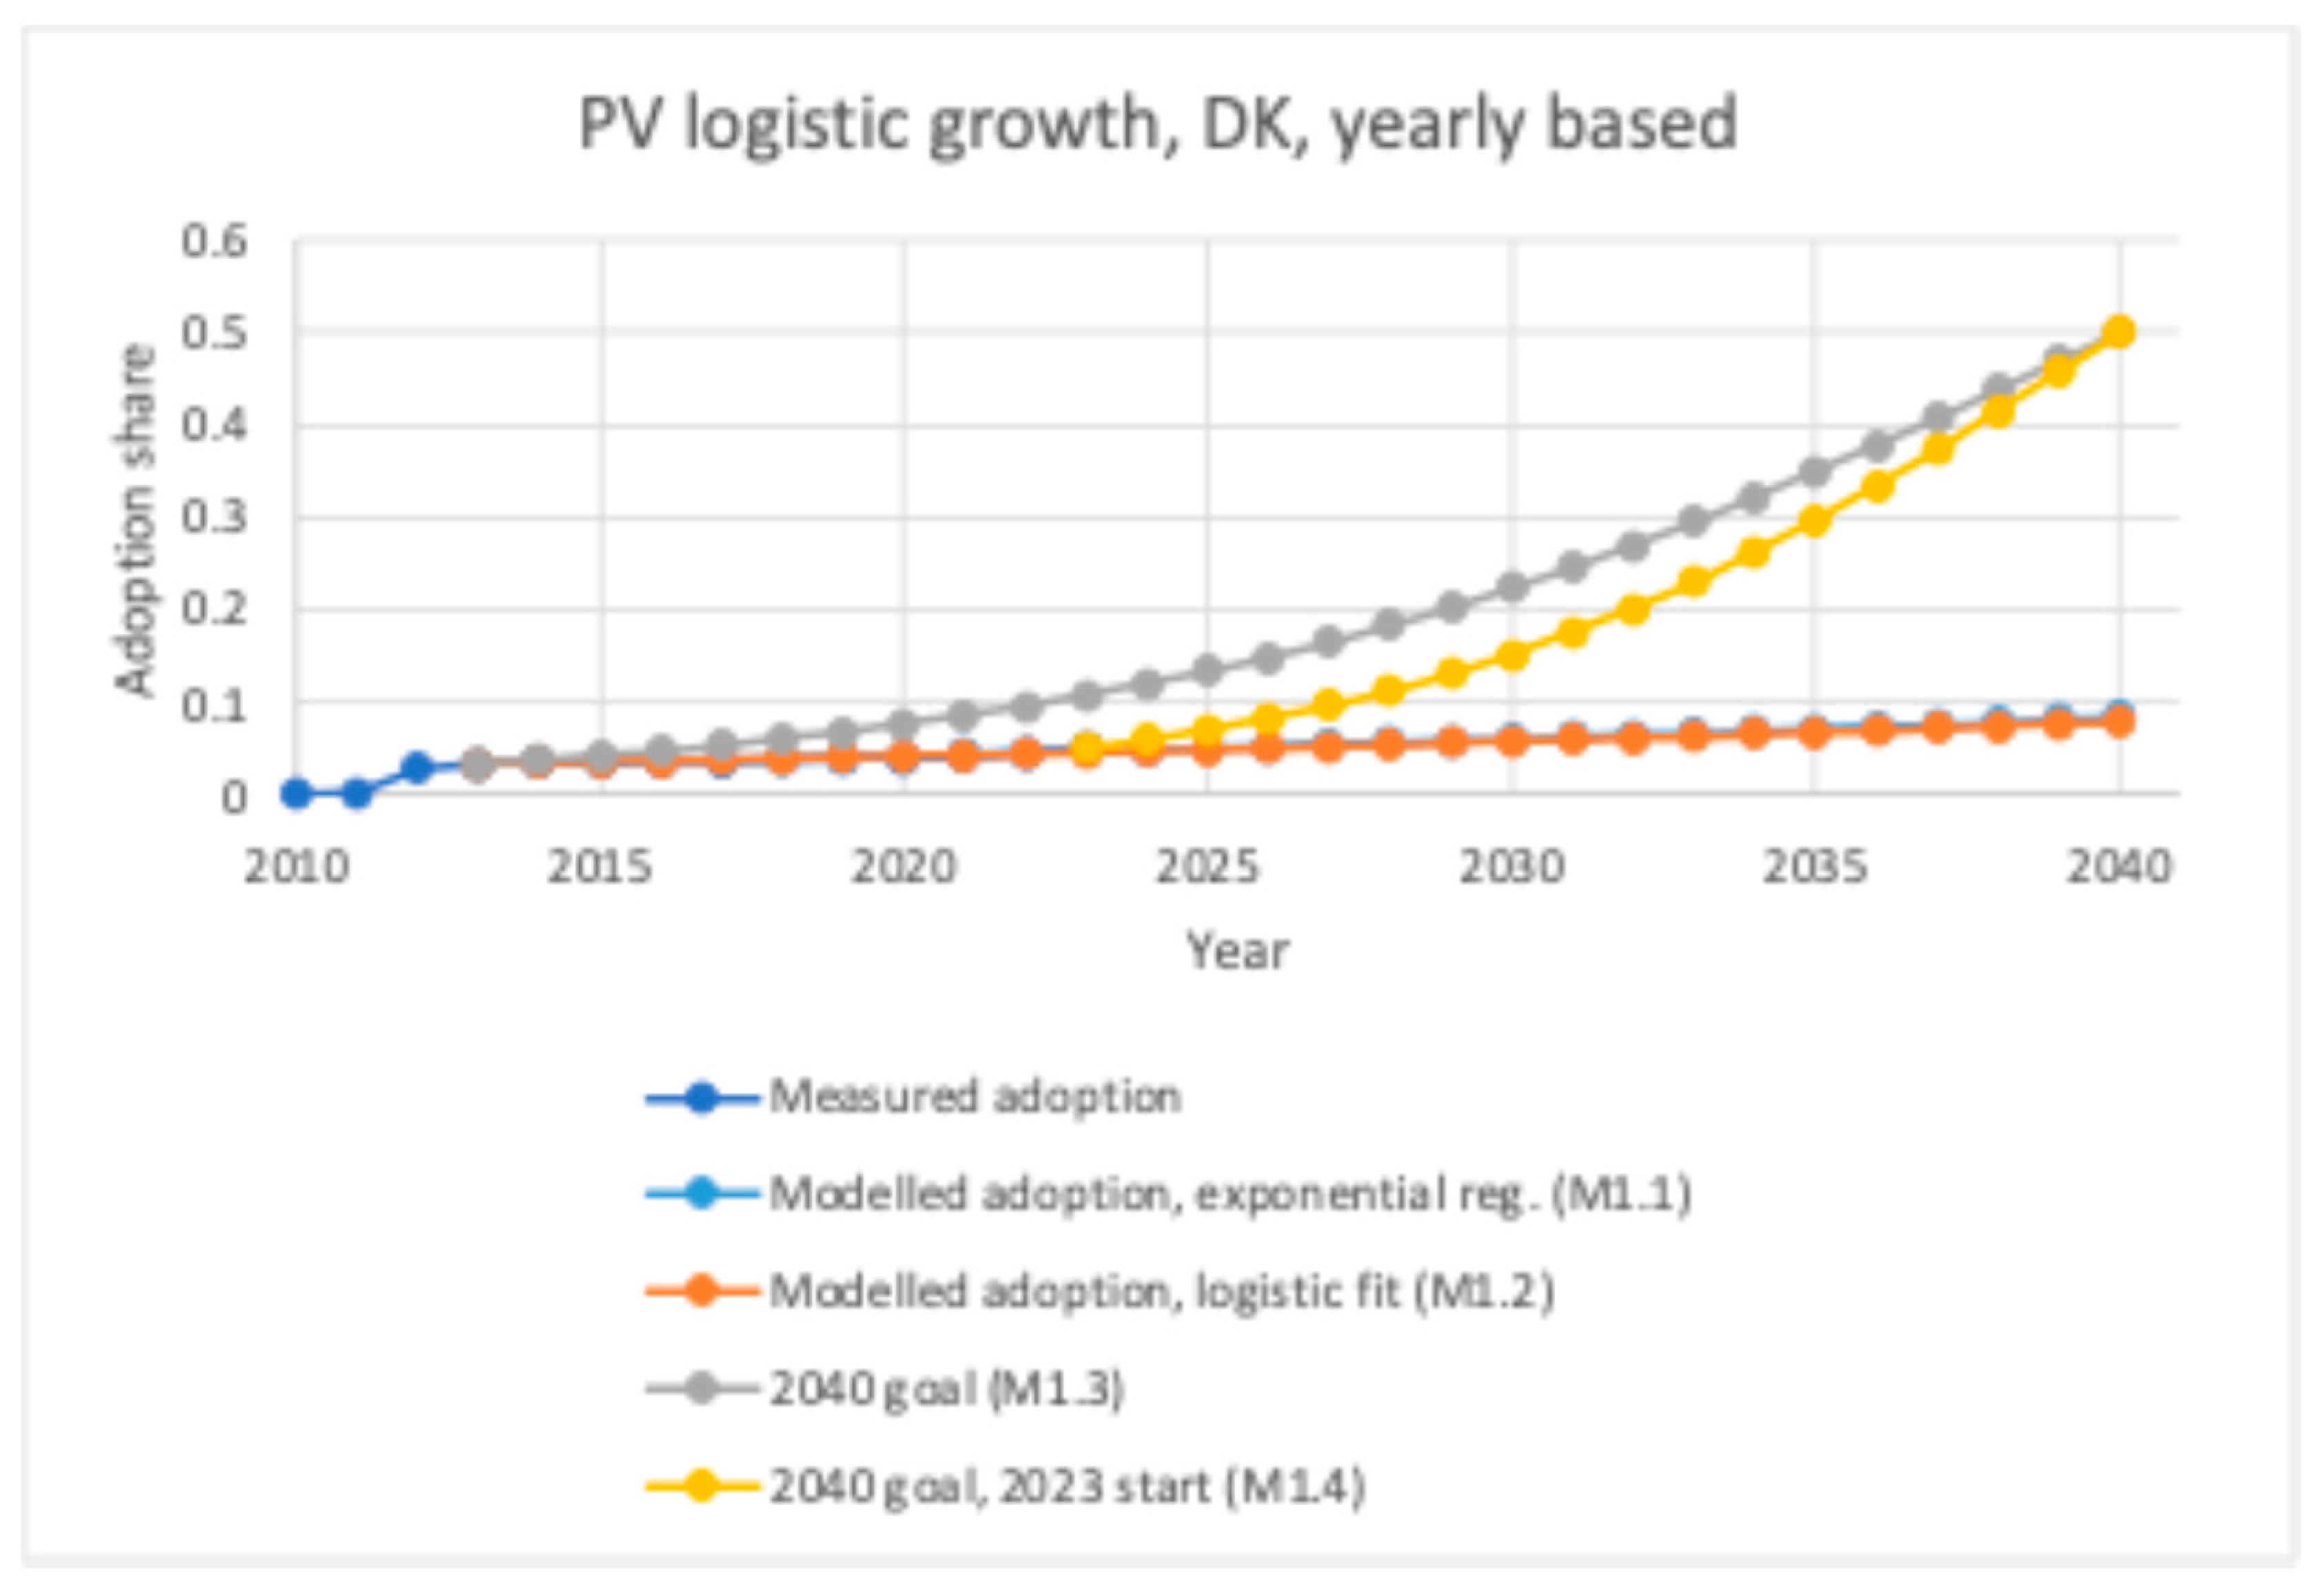
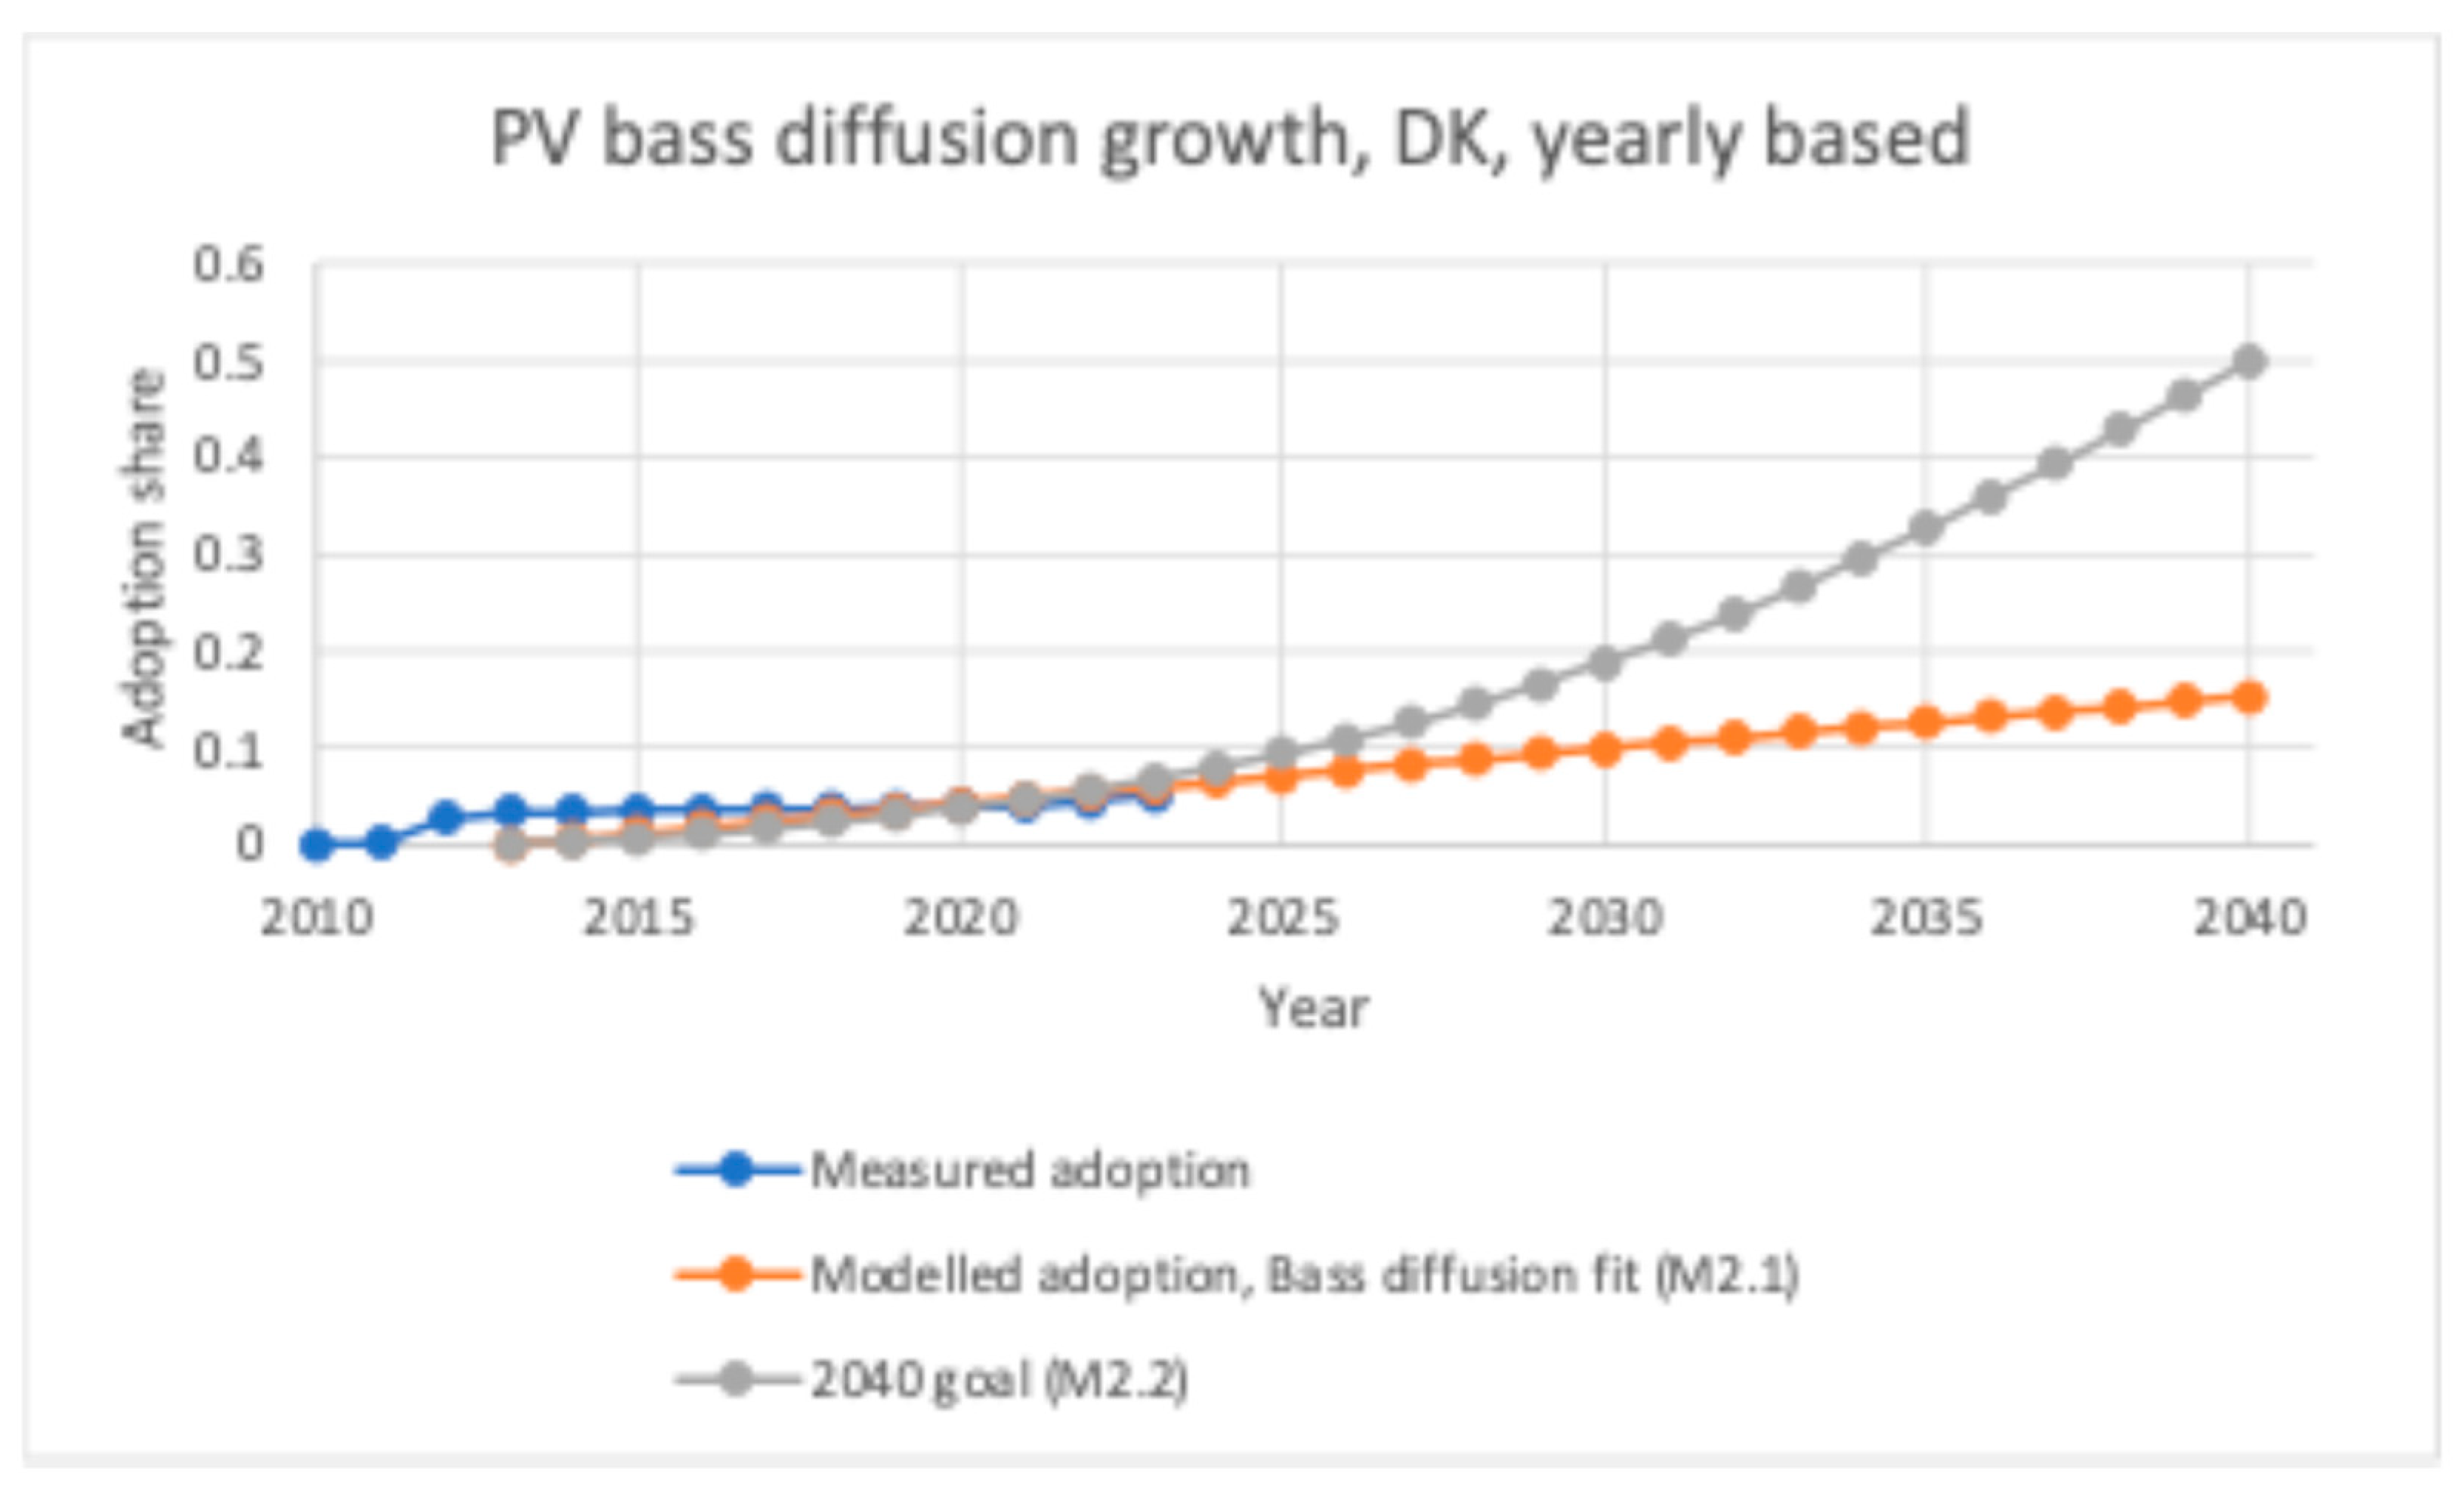
4.3. Photovoltaic Adoption

Residential rooftop PV data were retrieved from the Danish Energy Agency for 2010–2023 [42]. Only small-scale systems (≤10 kWp) are considered. Prior to 2013, highly favorable subsidies for feeding solar power back into the grid induced a sharp, temporary spike in installations. Consequently, the modeling in this case study focuses on data from 2013 onward to avoid conflating early subsidy spikes with long-term trends.
While Danish policy currently emphasizes large-scale PV capacity growth, explicit adoption targets for small-scale residential PV are less formal. However, Energinet [43] previously suggested a scenario where one in two households might install PV by 2040. As an illustrative case, this study sets 50% adoption as the 2040 goal.
Table 6 presents model parameters for the logistic growth and Bass diffusion methods. Figure 8 and Figure 9 show the respective adoption curves. Both models encounter some difficulty fitting the linear-like trend observed in post-2013 data, reflected in a low r or negligible q value. The presence of a significant policy shift (removal of generous feed-in tariffs) around 2012 likely flattened subsequent adoption [1,10].

5. Discussion

5.1. Evaluation of Results

The results obtained in the Danish case study reflect several patterns of DER adoption commonly reported in the literature. First, the improved fit of Bass diffusion models (M2.1) for EV adoption aligns with research emphasizing social contagion effects in early-stage or policy-driven markets [2,4]. In contrast, for PVs that exhibit a flatter, quasi-linear trend post-subsidy, logistic-based approaches (M1.2) can yield comparable or better fits [3,5]. This dichotomy supports prior findings that market dynamics—particularly peer imitation or the absence thereof—are crucial determinants of model choice [6,21].
The observed near-zero imitation parameter (q = 0) for PVs in M2.1 underscores how abrupt policy changes, such as removing generous feed-in tariffs in 2012, can fundamentally alter technology diffusion [1]. The solver’s inability to find a positive q suggests that household decisions since 2013 may be driven less by word-of-mouth and more by cost-benefit evaluations in a less incentivized environment. Other studies indicate that once subsidies diminish, the adoption curve can transition into a longer plateau phase, reducing the significance of peer effects [5,9]. These observations correspond with the present linear or near-linear PV trend and confirm that the Bass model may over- or underestimate adoption when major exogenous changes undermine continuity in the data.
HP adoption presented another interesting case, where M1.2 produced a notably faster curve than M1.1, presumably reflecting that the measured HP market had progressed beyond the early stages of diffusion. In many regions, heat pumps have matured through incremental policy and consumer acceptance, leading to faster mid-stage uptake [3,4]. However, the outcome also highlights that different regression methods can generate diverging parameter estimates, emphasizing the need for multi-model validation, especially for technologies that have advanced beyond the initial exponential growth window.
Table 7 compares residuals for the principal regression or fit methods (M1.1, M1.2, M2.1, M2.2). In general, the Bass model (M2.1) delivered the smallest summed residual for EV data, corroborating existing research that underscores the role of social influence in EV purchasing decisions [2,4]. For PV and HP data, logistic fit (M1.2) typically performed better, yielding lower error values except where strong social contagion effects were hypothesized. The residual patterns are consistent with the distinct market environments for each technology: EVs currently benefit from extensive policy visibility and peer adoption in Denmark, whereas heat pumps and PVs exhibit more heterogeneous or cost-based adoption motivations [5,21].
Figure 10 provides an illustrative comparison of the exponential regression fit (M1.1) across the three DER categories. The steeper slope and higher coefficient of determination for EV data suggest a robust exponential pattern, whereas PV data exhibit a flatter trend. These differences underscore how each technology’s adoption curve is shaped by policy phases, cost changes, and user perceptions, aligning with the broader diffusion literature [4,6].
A key contribution of this study is its integrated framework for goal-based and trend-based diffusion modeling, using both logistic and Bass approaches. Unlike many studies that focus on a single method or single technology [2,3,4], this work explicitly compares four logistic and two Bass methods within a consistent dataset, revealing context-dependent strengths for each. The paper also operationalizes these models with straightforward spreadsheet-based solvers, thereby lowering barriers for practitioners who lack specialized software. This pragmatic orientation supports policymakers and utility planners looking to test “what-if” scenarios (e.g., 80% adoption by 2030) without advanced programming [3,5].
Figure 11 shows an integrated decision flowchart for selecting between the six forecasting methods (M1.1–M1.4, M2.1, M2.2). This diagram systematically guides users through key questions, such as whether a policy target exists, whether peer influences are strong, and how comprehensive the historical data are, to identify the most suitable approach. By combining both trend-based and goal-based modeling under logistic and Bass frameworks, this flowchart underscores how model choice should align with market context (social contagion or cost-driven) and data availability (early-stage vs. multi-stage adoption). Adopting such a structured approach can help practitioners and policymakers efficiently match each DER scenario to the forecasting technique that best balances historical fidelity and future objectives.
Furthermore, the study introduces a structured mechanism for incorporating future political or market goals into parameter estimation, extending the prior literature that generally calibrates diffusion models only on historical data [6,9]. By adding target adoption levels as synthetic data points in the optimization (especially in M2.2), stakeholders can assess how strongly historical trends must accelerate to meet ambitious policy objectives. This feature is particularly relevant as countries intensify decarbonization targets and rely on large-scale adoption of EVs, heat pumps, and PVs to reduce carbon emissions [1,4,21].
Though the results illustrate the applicability and relative advantages of logistic vs. Bass diffusion for DERs, further research may refine several aspects. Incorporating explicit generational turnover (e.g., Norton–Bass models) or employing additional functional forms (Gompertz, Weibull) could enhance accuracy when consumer behavior is influenced by multiple product iterations or heterogenous market niches [5,20]. Another avenue is to improve solver robustness, perhaps using a specialized optimization package like CPLEX or a Bayesian framework to reduce sensitivity to initial parameter guesses [3,44]. Finally, more granular data, disaggregated by demographics, income, or geographic clustering, would allow agent-based or hybrid models to capture localized peer influences and network effects, further improving the precision of adoption forecasting [6,9].
Additionally, the integrated flow diagram introduced in the Discussion (Figure 11) provides a concise roadmap for selecting from among the six methods (M1.1–M1.4, M2.1, M2.2). By systematically guiding users through the presence or absence of policy targets, peer influence, and data coverage, it enables policymakers and practitioners to quickly identify the most suitable approach for their specific DER context.

5.2. Limitations and Future Perspectives

Although the framework accommodates a variety of data conditions, several constraints remain. First, the models assume each household can adopt only one unit of each DER, which may not hold in every context (e.g., multiple electric vehicles per household). Second, the Bass model starts at zero adoption by design; while the study demonstrates potential improvements through parameter adjustments, further refinements could better incorporate nonzero initial adoption shares. Third, the solver-based optimization in a spreadsheet environment is prone to local minima, especially for the Bass model with two parameters, p and q. This issue will require the use of other solvers to compare with the current models and ensure that global minima are reached. Fourth, exogenous policy changes or economic shocks may abruptly alter adoption patterns, potentially limiting the predictive power of purely retrospective fits [4,9].
Addressing these limitations will require deeper exploration of generational models (e.g., Norton–Bass) when multiple product iterations exist, as well as extending the Gompertz or Weibull functions to capture asymmetrical growth patterns [5,20]. More granular demographic or spatial data could support agent-based or network-based approaches, enabling explicit modeling of peer influences and localized learning effects [6,9]. Furthermore, enhanced solver techniques, such as using global optimization algorithms or Bayesian inference, can reduce sensitivities to initial parameter guesses and enrich the robustness of goal-based scenarios. As nations accelerate energy transitions, such methodological refinements will become increasingly vital for policymakers, utilities, and researchers seeking to forecast and guide DER adoption with high confidence.
A limitation to the methods presented in this paper is the sensitivity to disruption caused by energy policy changes, newly introduced or withdrawn subsidy schemes, technological breakthroughs, crises, etc. This relates not only to future events occurring, rendering the adoption curves unfitting, but also past events that cause bias on the adoption curves presented in this paper, and which might need further analysis for determining their impact and adjusting the adoption curves accordingly. This is a topic for further study that might encompass multiple methodologies for risk analysis under multiple scenarios and conditions. This also encompasses the need for a deeper analysis of the expected future adoption goals, particularly as these might be sensitive to political aims that might change with time. On this note, it might also be necessary to consider the impact that projections, such as the ones presented here, might have on policymaking.
Apart from addressing the above limitations and issues, further developing the applied methodology, another future perspective for the research presented in this paper is the applicability in countries and regions other than Denmark. In this regard, two potential challenges have been identified.
First, access to historical DER adoption data is crucial for the successful application of the models, as is the reliability of the data. The statistical data gathered for the models might be flawed, unintentionally or intentionally, a potential issue that is prevalent if the employed modeling methods are used within various geographical locations and extensions throughout the world. If only a few reliable data points are available, the credibility of the model adoption curves will be correspondingly low, and if no data are available at all, alternative methods must be employed to predict future adoption of DERs. It should be noted that, while the sources of the data used for this study, Statistics Denmark and the Danish Energy Agency, are considered to have conducted a thorough and trustworthy effort in collecting data on the three adopted DERs, there might still be unregistered units or units that have mistakenly been registered, which have impacted the results presented in this study.
Second, the markets and other mechanisms that affect DER adoption among residential consumers might be significantly different in other regions compared to Denmark, due to social, environmental, economic, political, or geographical reasons. In such cases, the exponential, logistic fit, and Bass diffusion fits presented in this paper might not properly describe the adoption of DERs, and alternative functions or models might be more suitable. This is a significant topic for further study.
As a final note, particularly based on the above two challenges, the generalizability of the employed methodologies to other regions, and possibly additional technologies, will be the first priority of further developing upon the methodologies and findings presented in this paper. This also encompasses refining and further investigating the approach established in Figure 11, particularly extending with additional paths leading to additional methodologies that must instead be employed under conditions or for purposes where the currently presented methods are insufficient.

6. Conclusions

This paper develops and tests a flexible framework for modeling DER adoption under differing data conditions and policy objectives. By applying six methods based on the logistic growth model (M1.1–M1.4) and the Bass diffusion model (M2.1–M2.2) to Danish data on EVs, HPs, and rooftop PVs, it demonstrates how model choice and parameter-estimation techniques significantly influence the shape and timing of projected adoption curves.
The case study shows that for EVs, Bass diffusion often provides a better fit, suggesting meaningful social contagion (imitation) effects. By contrast, for PVs in the post-subsidy environment, logistic-growth-based methods yield comparable or superior predictive performance, reflecting a flatter adoption trajectory with weaker peer-to-peer influence. Heat pumps emerge as an intermediate case in which method performance depends heavily on the availability of mid-stage adoption data; certain logistic fits capture the observed acceleration in adoption more accurately than exponential regressions alone. Overall, each model’s relative performance aligns with known market characteristics for each DER technology in Denmark.
This work advances the diffusion-of-innovation literature in several important ways. First, it provides a side-by-side comparison of four logistic-growth-based and two Bass-diffusion-based approaches using the same dataset, highlighting how different parameter-estimation strategies can lead to divergent adoption curves. Second, it extends beyond pure trend fitting by demonstrating how explicit policy or market goals can be incorporated into model calibration. Introducing target adoption shares as additional “data points” allows stakeholders to estimate how fast adoption must accelerate to achieve ambitious decarbonization milestones. Third, the paper demonstrates a straightforward spreadsheet-oriented workflow, making advanced diffusion analysis more accessible to decision makers without requiring specialized programming tools. This pragmatic approach broadens the applicability of diffusion models in real-world energy planning.
From a policy perspective, the results underscore that different DER technologies can exhibit significantly different growth patterns, even within the same regulatory environment. For instance, EVs may depend more on social and network effects, whereas PV adoption appears driven primarily by policy instruments and cost–benefit considerations once major subsidies are removed. Incorporating goal-based methods (M1.3, M1.4, M2.2) can help policymakers assess whether current adoption trends are sufficient to meet stated targets, and if not, how quickly diffusion parameters must shift. Utilities and energy planners can similarly exploit these models to anticipate infrastructure needs (e.g., charging stations for EVs) and manage grid impacts from heat pumps or rooftop solar penetration.
Finally, the presented research is subject to some limitations and has potential for further research, particularly regarding the use of alternative adoption modeling methods and algorithms, and the generalization and use of the proposed methods on other geographical case studies, particularly regarding the availability of reliable historical adoption data and potentially different market and adoption behavior structures.

Author Contributions

Conceptualization, Z.G.M. and B.N.J.; data curation, M.V.; formal analysis, M.V.; funding acquisition, Z.G.M. and B.N.J.; investigation, M.V.; methodology, Z.G.M. and M.V.; project administration, Z.G.M. and B.N.J.; resources, B.N.J.; software, M.V.; supervision, Z.G.M. and B.N.J.; validation, M.V.; writing—original draft, Z.G.M.; writing—review and editing, Z.G.M. and B.N.J. All authors have read and agreed to the published version of the manuscript.

Funding

This paper is part of the project “Digital Energy Hub” funded by the Danish Industry Foundation, part of the project titled “Automated Data and Machine Learning Pipeline for Cost-Effective Energy Demand Forecasting in Sector Coupling” (jr. Nr. RF-23-0039; Erhvervsfyrtårn Syd Fase 2), the European Regional Development Fund, and the Danish Participation in IEA ES Task 43 “Storage for renewables and flexibility through standardized use of building mass”, funded by EUDP (case number: 134232-510227).

Institutional Review Board Statement

Not applicable.

Informed Consent Statement

Not applicable.

Data Availability Statement

The data presented in this study are available from public domain sources, including Statistics Denmark, the Danish Energy Agency, and Energinet. These data were derived from publicly accessible resources available at https://www.statistikbanken.dk (accessed on 6 May 2024) (Statistics Denmark), https://ens.dk/en/ (accessed on 6 May 2024) (Danish Energy Agency), and https://energinet.dk (accessed on 6 May 2024) (Energinet). Further processed data and code used in the analysis can be made available upon request from the corresponding author.

Conflicts of Interest

The authors declare no conflicts of interest.

Abbreviations

The following abbreviations are used in this manuscript:
DERsDistributed Energy Resources
EVsElectric Vehicles
HPsHeat Pumps
PVsPhotovoltaics
DOIDiffusion of Innovations
TAMTechnology Acceptance Model
MLPMulti-Level Perspective
ABMAgent-based model
RETRenewable Energy Technology
LDESLong-Duration Energy Storage
NEVNew Energy Vehicle
SEMStructural Equation Modeling
WTPWillingness To Pay
SHTSmart Home Technology
LRTLoss-Reduction Technology
GISGeographic Information System
GRGGeneralized Reduced Gradient
kWpKilowatt peak (solar power rating)

References

  1. Liu, W.; Guo, C.; Gui, X.; Li, D.; Chen, X. Exploring preferences for household energy technology adoption from a spatiotemporal perspective: Evidence from demographics, the economy, and the environment. Energy 2025, 319, 134957. [Google Scholar] [CrossRef]
  2. Baumgartner, N.; Sloot, D.; Guenther, A.; Hahnel, U.J.J. Development and test of a dual-pathway model of personal and community factors driving new energy technology adoption—The case of V2G in three European countries. Ecol. Econ. 2025, 230, 108514. [Google Scholar] [CrossRef]
  3. Galster, H.S.; van der Wal, A.J.; Batenburg, A.E.; Koning, V.; Faaij, A.P.C. A comprehensive review of integrating behavioral drivers of technology adoption and energy service use in energy system models. Renew. Sustain. Energy Rev. 2025, 214, 115520. [Google Scholar] [CrossRef]
  4. Zhang, Y.; Hu, S.; Chen, L. Analysis of Rapid Demand Variation in Electric Vehicle Industry based on Innovation Diffusion Theory: Internet technology adoption and firm energy efficiency: Evidence from China. Technol. Forecast. Soc. Change 2024, 201, 123214. [Google Scholar] [CrossRef]
  5. Feng, X.; Li, Y.; Huang, B. Research on manufacturer’s investment strategy and green credit policy for new energy vehicles based on consumers’ preferences and technology adoption. Technol. Forecast. Soc. Change 2023, 191, 122476. [Google Scholar] [CrossRef]
  6. Selanniemi, A.; Hellstrom, M.; Bjorklund-Sankiaho, M. Socio-technical energy transitions: Modelling innovation diffusion through markets with heterogeneous boundedly rational agents: Long-duration energy storage technology adoption: Insights from U.S. energy industry experts. Energy Rep. 2025, 13, 378–396. [Google Scholar] [CrossRef]
  7. Sun, W.; Zhang, Z. Assessment of North Delhi People’s Electric Vehicle Purchase Intent through Consumer Behavior and Technology Adoption Theory: Game Analysis of Electric Vehicle Innovation Diffusion Based on Complex Network. Complex Syst. Complex. Sci. 2024, 21, 45–51. [Google Scholar] [CrossRef]
  8. Antonopoulos, C.A.; Fuentes, T.L.; McCord, K.H.; Rackley, A.L.S.; Biswas, S. Regional assessment of household energy decision-making and technology adoption in the United States. Energy Policy 2024, 185, 113940. [Google Scholar] [CrossRef]
  9. Geels, F.W. Demand-side emission reduction through behavior change or technology adoption? Empirical evidence from UK heating, mobility, and electricity use. One Earth 2023, 6, 337–340. [Google Scholar] [CrossRef]
  10. Chanda, H.; Mohareb, E.; Peters, M.; Harty, C. Community-led solar energy technology adoption in rural Zambia: The role of observational learning and neighbor influence. Energy Res. Soc. Sci. 2025, 122, 103972. [Google Scholar] [CrossRef]
  11. Chekol, F.; Giera, M.; Alemu, B.; Dessie, M.; Alemayehu, Y.; Ewuinetu, Y. Rural Households’ Behaviour towards Modern Energy Technology Adoption Choices in East Gojjam Zone of Ethiopia: A Multivariate Probit Regression Analysis. Cogent Eng. 2023, 10, 2178107. [Google Scholar] [CrossRef]
  12. Vimal, K.E.K.; Kandasamy, J.; Vezhavendhan, R.; Bose, B.; Menon, A.K.; Sivakumar, K. Digital technology adoption model for electric vehicle battery recycling supply chain—An influential relationship mapping. Oper. Manag. Res. 2024, 17, 1469–1508. [Google Scholar] [CrossRef]
  13. Hansen, A.R.; Trotta, G.; Gram-Hanssen, K. Smart home technology adoption in Denmark: Diffusion, social differences, and energy consumption. Energy Effic. 2024, 17, 16. [Google Scholar] [CrossRef]
  14. Ullah, N.; Alnumay, W.S.; Al-Rahmi, W.M.; Alzahrani, A.I.; Al-Samarraie, H. Modeling cost saving and innovativeness for blockchain technology adoption by energy management. Energies 2020, 13, 4783. [Google Scholar] [CrossRef]
  15. Esposito, L.; Brahmi, M.; Joshi, M. The importance of innovation diffusion in the renewable energy sector. In Exploring Business Ecosystems and Innovation Capacity Building in Global Economics; IGI Global: Hershey, PA, USA, 2023; pp. 283–302. [Google Scholar]
  16. He, P.; Lovo, S.; Veronesi, M. Social networks and renewable energy technology adoption: Empirical evidence from biogas adoption in China. Energy Econ. 2022, 106, 105789. [Google Scholar] [CrossRef]
  17. Jabeen, G.; Wang, D.; Ahmad, M.; Isik, C.; Pinzon, S.; Rehman, A.; Ongan, S. Transitioning to sustainable energy: Multidimensional factors guiding solar power technology adoption. Energy 2024, 312, 133468. [Google Scholar] [CrossRef]
  18. Saraji, M.K.; Aliasgari, E.; Streimikiene, D. Assessment of the challenges to renewable energy technologies adoption in rural areas: A Fermatean CRITIC-VIKOR approach. Technol. Forecast. Soc. Change 2023, 189, 122399. [Google Scholar] [CrossRef]
  19. Sun, W.; Zhang, Z. Promoting electric vehicle cell innovation diffusion considering patent licensing strategy: A combination of evolutionary game and optimization algorithm approach. World Electr. Veh. J. 2021, 12, 95. [Google Scholar] [CrossRef]
  20. Qamar, S.; Ahmad, M.; Oryani, B.; Zhang, Q. Solar energy technology adoption and diffusion by micro, small, and medium enterprises: Sustainable energy for climate change mitigation. Environ. Sci. Pollut. Res. 2022, 29, 49385–49403. [Google Scholar] [CrossRef]
  21. Bilgili, F.; Onderol, S.; Kuskaya, S.; Alnour, M.; Hoque, M.E.; Balsalobre-Lorente, D. Renewable energy and technology adoption: Mitigating CO2 emissions through implementation strategies. Nat. Resour. Forum 2024, 49, 1478–1535. [Google Scholar] [CrossRef]
  22. Dhirasasna, N.; Sahin, O. A system dynamics model for renewable energy technology adoption of the hotel sector. Renew. Energy 2021, 163, 1994–2007. [Google Scholar] [CrossRef]
  23. Dhirasasna, N.; Becken, S.; Sahin, O. A systems approach to examining the drivers and barriers of renewable energy technology adoption in the hotel sector in Queensland, Australia. J. Hosp. Tour. Manag. 2020, 42, 153–172. [Google Scholar] [CrossRef]
  24. van Dijk, J.; Delacretaz, N.; Lanz, B. Technology Adoption and Early Network Infrastructure Provision in the Market for Electric Vehicles. Environ. Resour. Econ. 2022, 83, 631–679. [Google Scholar] [CrossRef] [PubMed]
  25. Feng, Z.; Luo, N.; Shalpegin, T.; Cui, H. The influence of carbon emission reduction instruments on blockchain technology adoption in recycling batteries of the new energy vehicles. Int. J. Prod. Res. 2024, 62, 891–908. [Google Scholar] [CrossRef]
  26. Roberts, S.; Roland, T.; Amarasekara, A.S. Factors affecting renewable energy technology adoption policies of 50 states and district of Columbia in the USA. Clean Technol. Environ. Policy 2023, 25, 211–219. [Google Scholar] [CrossRef]
  27. Barnes, J.; Silvonen, T.; Taylor, M. ‘No Courage at the Heart of Government’: What Are the Most Important Changes Needed to Accelerate Heat Pump Deployment in the UK? SSRN: Rochester, NY, USA, 2023. [Google Scholar]
  28. Mulugeta, S.; Leta, A. Determinants of Renewable Energy Technologies Adoption and Energy Source Choice of Households in Boset District, Ethiopia. Sarhad J. Agric. 2022, 38, 422–429. [Google Scholar] [CrossRef]
  29. Jacobson, M.G. Chapter 15—Water–energy–food nexus approaches to facilitate smallholder agricultural technology adoption in Africa. In Water-Energy-Food Nexus Narratives and Resource Securities; Mabhaudhi, T., Senzanje, A., Modi, A., Jewitt, G., Massawe, F., Eds.; Elsevier: Amsterdam, The Netherlands, 2022; pp. 279–297. [Google Scholar]
  30. Nelson, H.; Chen, C.-F.; Li, J. Equity in Renewable Energy Technology Adoption in China: A Review of the Social-Psychological and Demographic Barriers. Curr. Sustain./Renew. Energy Rep. 2021, 8, 91–100. [Google Scholar] [CrossRef]
  31. Bhatt, B.; Singh, A. Stakeholders’ role in distribution loss reduction technology adoption in the Indian electricity sector: An actor-oriented approach. Energy Policy 2020, 137, 111064. [Google Scholar] [CrossRef]
  32. Ke, J.; Khanna, N.; Zhou, N. Indirect estimation of willingness to pay for energy technology adoption. Appl. Energy 2022, 312, 118701. [Google Scholar] [CrossRef]
  33. Heymann, F.; Duenas, P.; Soares, F.J.; Miranda, V.; Rüdisüli, M. Simulating spatiotemporal energy technology adoption patterns under different policy designs. In Proceedings of the 2021 IEEE Madrid PowerTech, Madrid, Spain, 28 June–2 July 2021; pp. 1–6. [Google Scholar]
  34. Fatima, N.; Li, Y.; Li, X.; Abbas, W.; Jabeen, G.; Zahra, T.; Isik, C.; Ahmed, N.; Ahmad, M.; Yasir, A. Households’ Perception and Environmentally Friendly Technology Adoption: Implications for Energy Efficiency. Front. Energy Res. 2022, 10, 830286. [Google Scholar] [CrossRef]
  35. Mishra, R.; Raut, R.D.; Kumar, M.; Naik, B.K.R.; Luthra, S. Renewable energy technology adoption in building a sustainable circular supply chain and managing renewable energy-related risk. Ann. Oper. Res. 2023. [Google Scholar] [CrossRef]
  36. Wang, L.; Morabito, M.; Payne, C.T.; Robinson, G. Identifying institutional barriers and policy implications for sustainable energy technology adoption among large organizations in California. Energy Policy 2020, 146, 111768. [Google Scholar] [CrossRef]
  37. Liang, J.; Liu, P.; Qiu, Y.; Wang, Y.D.; Xing, B. Indonesia State Electricity Company’s Self-Service Technology Adoption: New PLN Mobile: Time-of-Use Electricity Pricing and Residential Low-carbon Energy Technology Adoption. Energy J. 2020, 41, 1–38. [Google Scholar] [CrossRef]
  38. Cairns, I.; Hannon, M.; Braunholtz-Speight, T.; McLachlan, C.; Mander, S.; Hardy, J.; Sharmina, M.; Manderson, E. Financing grassroots innovation diffusion pathways: The case of UK community energy. Environ. Innov. Soc. Transit. 2023, 46, 100679. [Google Scholar] [CrossRef]
  39. Denmark, S. Statistikbanken. Available online: https://www.statistikbanken.dk (accessed on 24 February 2025).
  40. Ministry of Transport. “A Greener Transport System in Denmark”, Frederiksholms Kanal 27 DK-1220 København K. Available online: https://www.trm.dk/media/0eudwtac/a-greener-transport-system-netversion-1.pdf (accessed on 27 February 2025).
  41. Hohmeyer, O.; Møller-K, A. Final Report of the Electricity Grid and Potentials for Energy Flexibility in Southeastern Denmark and Northern Germany; Gate21: Sarajevo, Bosnia and Herzegovina, 2023; Available online: https://gate21.dk/wp-content/uploads/2023/10/DG-STORE-Final-Report-DK.pdf (accessed on 3 March 2025).
  42. Danish Energy Agency. Energistatistik 2023; Danish Energy Agency: Copenhagen, Denmark, 2023; Available online: https://ens.dk/media/6308/download (accessed on 3 March 2025).
  43. Energinet. Long-Term Development Needs in the Power Grid; Energinet: Fredericia, Denmark, 2025; Available online: https://en.energinet.dk/media/mvyg5kxn/long-term-development-needs-in-the-danish-power-grid.pdf (accessed on 4 February 2025).
  44. Steffen, B.; Karplus, V.; Schmidt, T.S. State ownership and technology adoption: The case of electric utilities and renewable energy. Res. Policy 2022, 51, 104534. [Google Scholar] [CrossRef]
Figure 1. Adoption rate (blue curve) and cumulative adoption (gold curve) illustrating early (exponential), middle (linear-like), and late (logarithmic-like) stages [4].
Sustainability 17 05283 g001
Figure 2. Example of a solver-based approach to fit a logistic growth curve to measured adoption data.
Sustainability 17 05283 g002
Figure 3. Example adoption curves for M1.3 and M1.4 assuming 100% heat pump adoption by 2035. The gray curve assumes the target was in place since the earliest data (M1.3), while the yellow curve offsets from the most recent data (M1.4).
Sustainability 17 05283 g003
Figure 4. Logistic growth model results (M1.1–M1.4) for Danish EV share. The blue line representing “Measured adoption” and the light blue line for “Modelled adoption, exponential reg. (M1.1)” are mostly overlapped or covered by the orange “Modelled adoption, logistic fit (M1.2)” line due to similar values, especially in the early and mid-years. Their close proximity visually masks the blue curves in the plotted range.
Sustainability 17 05283 g004
Figure 5. Bass diffusion model results (M2.1–M2.2) for Danish EV share. The blue line representing measured adoption is obscured by the orange Bass diffusion fit (M2.1), due to a close match between the modeled and actual data over the entire time period.
Sustainability 17 05283 g005
Figure 6. Logistic growth model results for HP adoption in Denmark.
Sustainability 17 05283 g006
Figure 7. Bass diffusion model results for HP adoption in Denmark.
Sustainability 17 05283 g007
Figure 8. Logistic growth model results for PV adoption in Denmark.
Sustainability 17 05283 g008
Figure 9. Bass diffusion model results for PV adoption in Denmark.
Sustainability 17 05283 g009
Figure 10. Comparison of exponential regression results for M1.1 across EV, HP, and PV. Note the differing slopes over comparable time spans.
Sustainability 17 05283 g010
Figure 11. Integrated flow diagram for selecting a diffusion forecasting method (M1.1–M1.4, M2.1, M2.2) based on policy targets, peer influence, and data coverage.
Sustainability 17 05283 g011
Table 1. Selected references on DER adoption.
Ref.DER AspectMethodKey Results/Insights
[1]Household heating/cooling technology adoptionEconometric analysis, GIS-based spatial studyIdentifies strong spatial disparities in heating/cooling technology adoption, with air conditioning dominating; highlights cost/environmental drivers.
[2]Renewable energy technology diffusion (RET)Network analysis, threshold modelingShows that both personal norms and community influences shape technology adoption; underscores social network effects in driving RET diffusion.
[3]Behavioral realism in Energy System ModelsStructured literature review, expert interviewsEmphasizes that current energy system models underrepresent non-economic drivers; recommends stronger empirical grounding for behavioral factors.
[6]Long-duration energy storage (LDES) adoptionAgent-based modeling (ABM), interviewsDemonstrates that LDES uptake depends on integrated policy, social acceptance, and market considerations; interviews reveal critical investor concerns.
[4]Electric vehicle (EV) market growth (S-curve)Historical trend analysisHighlights government policies as key impetus for early EV adoption; indicates that cost reductions and incentives accelerate the S-shaped diffusion.
[7]EV purchase intentionSurvey-based, structural modelingFinds that EV adoption is strongly influenced by subjective norms, range anxiety, and cost expectations; concludes EVs remain in early diffusion stage.
[13]Smart home technology (SHT) uptakeSurvey data, regression analysisReveals that SHT adoption is more common among younger households; links adoption to mixed energy outcomes (e.g., some higher energy use).
[5]New energy vehicle (NEV) investment strategyMathematical tri-level modeling, scenariosShows that green credit can significantly incentivize NEV manufacturers’ R&D investment; indicates interplay between financial tools and innovation.
[35]Renewables adoption in logistics and supply chainsSurvey (451 experts), structural equation modeling (SEM)Identifies core constructs influencing renewable energy technology adoption for a sustainable and circular supply chain; highlights managerial implications.
[9]Demand-side emission reductionsPolicy analysisArgues that technology adoption has contributed more to emission cuts than behavior change; calls for integrated socio-technical strategies.
[24]EV charging infrastructure and adoptionEconometric modeling, synthetic controlDemonstrates early charging infrastructure is crucial for EV uptake; documents non-linear stock effects and range anxiety as pivotal adoption barriers.
[32]Willingness to pay (WTP) for energy technologyOptimization-based methodological approachProposes an indirect method to estimate WTP using constrained optimization; valuable for incomplete or aggregated data in energy markets.
[33]Spatiotemporal patterns of DER uptakeSimulation, policy scenario analysisFinds that DER adoption tends to cluster in both space and time; policy incentives can alter the geographic concentration of adoption.
[36]Institutional barriers to sustainable technologySurvey, interviewsShows that large organizations often prioritize lowest first cost over life-cycle benefits, impeding technology adoption; proposes organizational reforms.
[31]Loss-reduction technology (LRT) in electricity distributionActor-oriented/stakeholder analysisConcludes that slow LRT diffusion is linked to weak consumer engagement and fragmented utility-level governance; suggests enhanced stakeholder coordination.
Table 2. Comparison of main modeling approaches in DER adoption literature.
ModelKey ReferencesAdvantagesLimitations
Bass Diffusion[2,5,6,19,20]Accounts for imitation and innovation effects; well-known S-curve patternsAssumes homogenous population or constant p/q across subgroups
Logistic Growth[1,3,9,17,33]Simple S-curve, often robust with limited dataIgnores network effects and word-of-mouth influences
Gompertz[3,18,21]Captures asymmetric S-curve, good for certain biological or social processesMay overfit with short data series or misrepresent early-stage growth
Agent-Based Models[6,9,22,23]Rich representation of heterogeneous agents and interactionsData-intensive, complex calibration, often scenario-based
Econometric/SEM[1,13,24,34,37]Good for cross-sectional or panel data analysis of adoptionOften limited in capturing feedback effects or dynamic processes
Table 3. Employed methods for establishing adoption curves for DER technologies.
MethodIDModelParameter EstimationFuture Goal?
Expected future adoption, exponential regressionM1.1Logistic growthExponential regressionNo
Expected future adoption, logistic fitM1.2Data fit (optimization)No
Goal-based adoption, data start year offsetM1.3Goal-based optimizationYes
Goal-based adoption, current year offsetM1.4Yes
Expected future adoption, bass diffusion fitM2.1Bass diffusionData fit (optimization)No
Goal-based adoption, bass diffusion fitM2.2Yes
Table 4. Estimated parameters for logistic and Bass models (yearly data) tracking pure EV adoption in Denmark.
MethodStart YearKey ParametersGoal YearAdoption Goal
P0r
M1.120114.7979 × 10−50.54372N/AN/A
M1.220114.7979 × 10−50.54599N/AN/A
M1.320114.7979 × 10−50.49147203035.3%
M1.420240.0557290.37053203035.3%
M2.120111.5830 × 10−50.59279N/AN/A
M2.220111.1238 × 10−40.39830203035.3%
Note: N/A: Not applicable to this modelling scenario.
Table 5. Heat pump adoption model parameters (annual data).
MethodStart YearKey ParametersGoal YearAdoption Goal
P0r
M1.120100.00747410.14217N/AN/A
M1.220100.00747410.48378N/AN/A
M1.320100.00747410.13999203520%
M1.420230.0578040.11703203520%
M2.120100.00301490.042528N/AN/A
M2.220100.00229560.0977932030, 203514%, 20%
Note: N/A: Not applicable to this modelling scenario.
Table 6. Rooftop PV adoption model parameters (annual data).
MethodStart YearKey ParametersGoal YearAdoption Goal
P0r
M1.120130.0334350.036014N/AN/A
M1.220130.0334350.033544N/AN/A
M1.320130.0334350.12463204050%
M1.420230.0509000.17211204050%
M2.120130.00615660N/AN/A
M2.220130.00336840.13489204050%
Note: N/A: Not applicable to this modelling scenario.
Table 7. Calculated residuals for the investigated DER types and applied methods. M2.2 yields generally higher residuals due to including goal data points in addition to past measurements.
M1.1
Expected Future Adoption via Exponential Regression
M1.2
Expected Future Adoption via Logistic Fit
M2.1
Expected Future Adoption via Bass Diffusion Fit
M2.2
Goal-Based Adoption via Bass Diffusion Fit
Electric Vehicle1.9430 × 10−51.6195 × 10−58.4579 × 10−61.6823 × 10⁻⁴
Heat Pump2.6373 × 10−45.1593 × 10−52.5367 × 10−45.0361 × 10⁻⁴
PV4.5165 × 10−54.1117 × 10−53.1616 × 10−34.4467 × 10⁻³
Disclaimer/Publisher’s Note: The statements, opinions and data contained in all publications are solely those of the individual author(s) and contributor(s) and not of MDPI and/or the editor(s). MDPI and/or the editor(s) disclaim responsibility for any injury to people or property resulting from any ideas, methods, instructions or products referred to in the content.

