Article

Optimization Simulation of Land Use in Jiangsu Province Under Multiple Scenarios Based on the PLUS-InVEST Model

1
School of Geomatics Science and Technology, Nanjing Tech University, Nanjing 211816, China
2
Observation Research Station of Land Ecology and Land Use in the Yangtze River Delta, Ministry of Natural Resources, Nanjing 210000, China
3
College of Electrical Engineering and Control Science, Nanjing Tech University, Nanjing 211816, China
4
Department of Automation, Shanghai Jiao Tong University, Shanghai 200240, China
5
School of Civil Engineering, Nanjing Tech University, Nanjing 211816, China
*
Author to whom correspondence should be addressed.
Sustainability 2025, 17(12), 5251; https://doi.org/10.3390/su17125251
Submission received: 14 May 2025 / Revised: 31 May 2025 / Accepted: 2 June 2025 / Published: 6 June 2025

Abstract

With the severe challenges resulting from global climate change, the role of land use/land cover (LU/LC) optimization in mitigating carbon emissions and promoting carbon cycle balance has gained increasing attention. This study takes Jiangsu Province as a case study, analyzing the changes in LU/LC from 1995 to 2020 and their impacts on carbon emissions and carbon storage. For Jiangsu Province’s five development scenarios in 2030 (business-as-usual, carbon emission, carbon storage, and carbon neutrality scenarios), objective functions and constraints were constructed. The PLUS model was employed to simulate land use for 2030, predicting carbon storage, economic benefits, and ecological benefits under each scenario and evaluating the impact of each scenario on achieving carbon peaking and carbon neutrality goals. The findings indicate that (1) from 1995 to 2020 there were great changes in land use types in Jiangsu Province, with an overall downward trend in carbon storage. (2) The simulated land use quantity structure and spatial patterns for 2030 under different scenarios exhibited significant differences. Compared with the Business-as-Usual Scenario, the other four optimized scenarios achieved a better balance between economic and ecological values. (3) The Integrated Scenario realized optimal synergy between farmland protection, ecological expansion, and economic output, representing the best compromise under multiple objectives.

1. Introduction

In the context of accelerating urbanization, intensive human activities have significantly increased the consumption of resources and the use of energy, leading to substantial emissions of greenhouse gases, particularly carbon dioxide. This has ended up being one of the key drivers of worldwide climate alteration and biological degradation [1]. In September 2020, President Xi Jinping made a serious commitment at the 75th session of the Joined Together Countries Common Gathering that China would endeavor to crest its carbon emanations some time near 2030 and accomplish carbon nonpartisanship some time near 2060 [2]. The “dual carbon” strategy not only demonstrates China’s political determination to tackle global climate change but also imposes stricter demands on the carbon sequestration functions of ecosystems. Earthly environments, as vital sinks for barometrical carbon, play a vital part in lessening climatic CO2 concentrations, moderating worldwide warming, and upgrading environment strength [3]. Land use and land cover (LULC) changes, as one of the most important human components influencing the spatiotemporal designs of carbon capacity, can essentially change the distribution and cycling of carbon inside biological systems, subsequently significantly affecting regional carbon adjustments [4]. Hence, efficiently evaluating the spatiotemporal advancement of carbon capacity in LULC changes and building land use optimization pathways that coordinate carbon capacity upgrades with territorial multi-objective facilitated advancement are of extraordinary significance for accomplishing territorial biological security and carbon nonpartisanship procedures [5].
Under the “dual carbon” strategy, LULC optimization based on carbon neutrality goals has become one of the important hotspots in global sustainable development research [6,7,8]. Numerous studies have shown that scientifically optimizing LULC patterns is an important pathway and key means to achieving the vision of carbon neutrality [9]. Current LULC optimization research mainly focuses on three core issues: first, identifying the natural and human drivers of LULC changes; second, optimizing spatial patterns; and third, enhancing the sustainability of land use systems. To address these scientific questions, researchers have proposed diverse modeling and technological approaches. First, in terms of quantitative structural optimization, linear programming, nonlinear programming, and multi-objective programming have been widely used to determine the rational proportions and total allocations of different land use types. Second, for spatial distribution optimization, spatially explicit simulation models such as the CLUE model (Conversion of Land Use and its Effects), Cellular Automata (CA), and Multi-Agent Systems (MAS) have been developed to simulate the dynamic evolution and spatial expansion mechanisms of LULC [10,11,12]. Third, in solving complex high-dimensional optimization problems, intelligent optimization algorithms have played a key role, including the Genetic Algorithm (GA), Simulated Annealing (SA), Particle Swarm Optimization (PSO), and Non-dominated Sorting Genetic Algorithm (NSGA-II), which are widely used to handle the multi-objective, nonlinear, and diverse solution set problems in land use optimization [13,14,15,16]. In the expansion of these methods, researchers have progressively centered on the coupling impacts of common and human variables, creating comprehensive optimization demonstration frameworks driven by different scales, levels, and variables to more completely reflect the complexity of land use frameworks and territorial heterogeneity [17]. On this basis, cross-model synergy has become an important trend in research, that is, by constructing an integrated model framework that combines quantitative structural optimization with spatial pattern simulation, achieving nested multi-models and synergistic algorithm optimization, thereby effectively improving the spatial accuracy of land use simulation and the decision-making support capacity of scenario prediction [18].
In existing LULC optimization studies, most have modeled and analyzed carbon emission control or carbon storage enhancement as a single target variable. However, the majority of these studies have focused on regulating carbon emissions, and studies seldom focus on the spatial optimization mechanisms and regulatory potential of carbon storage [19,20,21,22]. Jiangsu Territory, as one of China’s major financial areas and a region of high-intensity advancement, has continuously had high levels of vitality utilization and carbon outflows. Currently, the “14th Five-Year Plan” and the 2020–2035 territorial space planning have been fully implemented, especially the implementation of the “three zones and three lines”, which have imposed rigid constraints on the reconstruction of land use spatial patterns and also provided institutional boundaries for LULC optimization oriented towards carbon storage enhancement. Despite this, LULC optimization research based on the territorial space control framework and aimed at enhancing ecosystem carbon storage is still relatively weak and has not yet formed a comprehensive optimization method system that can balance the enhancement of ecological value with practical spatial constraints [22]. Based on this, this research takes Jiangsu as the area of study, centers on the 2030 carbon crest hub, and constructs a multi-objective optimization model for LULC aimed at enhancing regional carbon storage. The model takes ecosystem carbon storage as the sole target variable, comprehensively introduces factors such as the spatial expansion of ecological land use, farmland protection, and urban development boundaries, and constructs LULC optimization scenarios under the constraints of the “three zones and three lines” to systematically assess the impact mechanisms and optimization potential of different land use patterns on carbon storage capacity. On this premise, this study recognizes the ideal combination of land use types and spatial formats with the most noteworthy carbon sequestration capacity in 2030. The results of this research are anticipated to supply specialized support for Jiangsu Area to attain its carbon crest objectives from the point of view of biological space control and give a reference for LULC optimization methods in other districts with solid asset and environmental imperatives and high carbon sequestration potential.

2. Materials and Methods
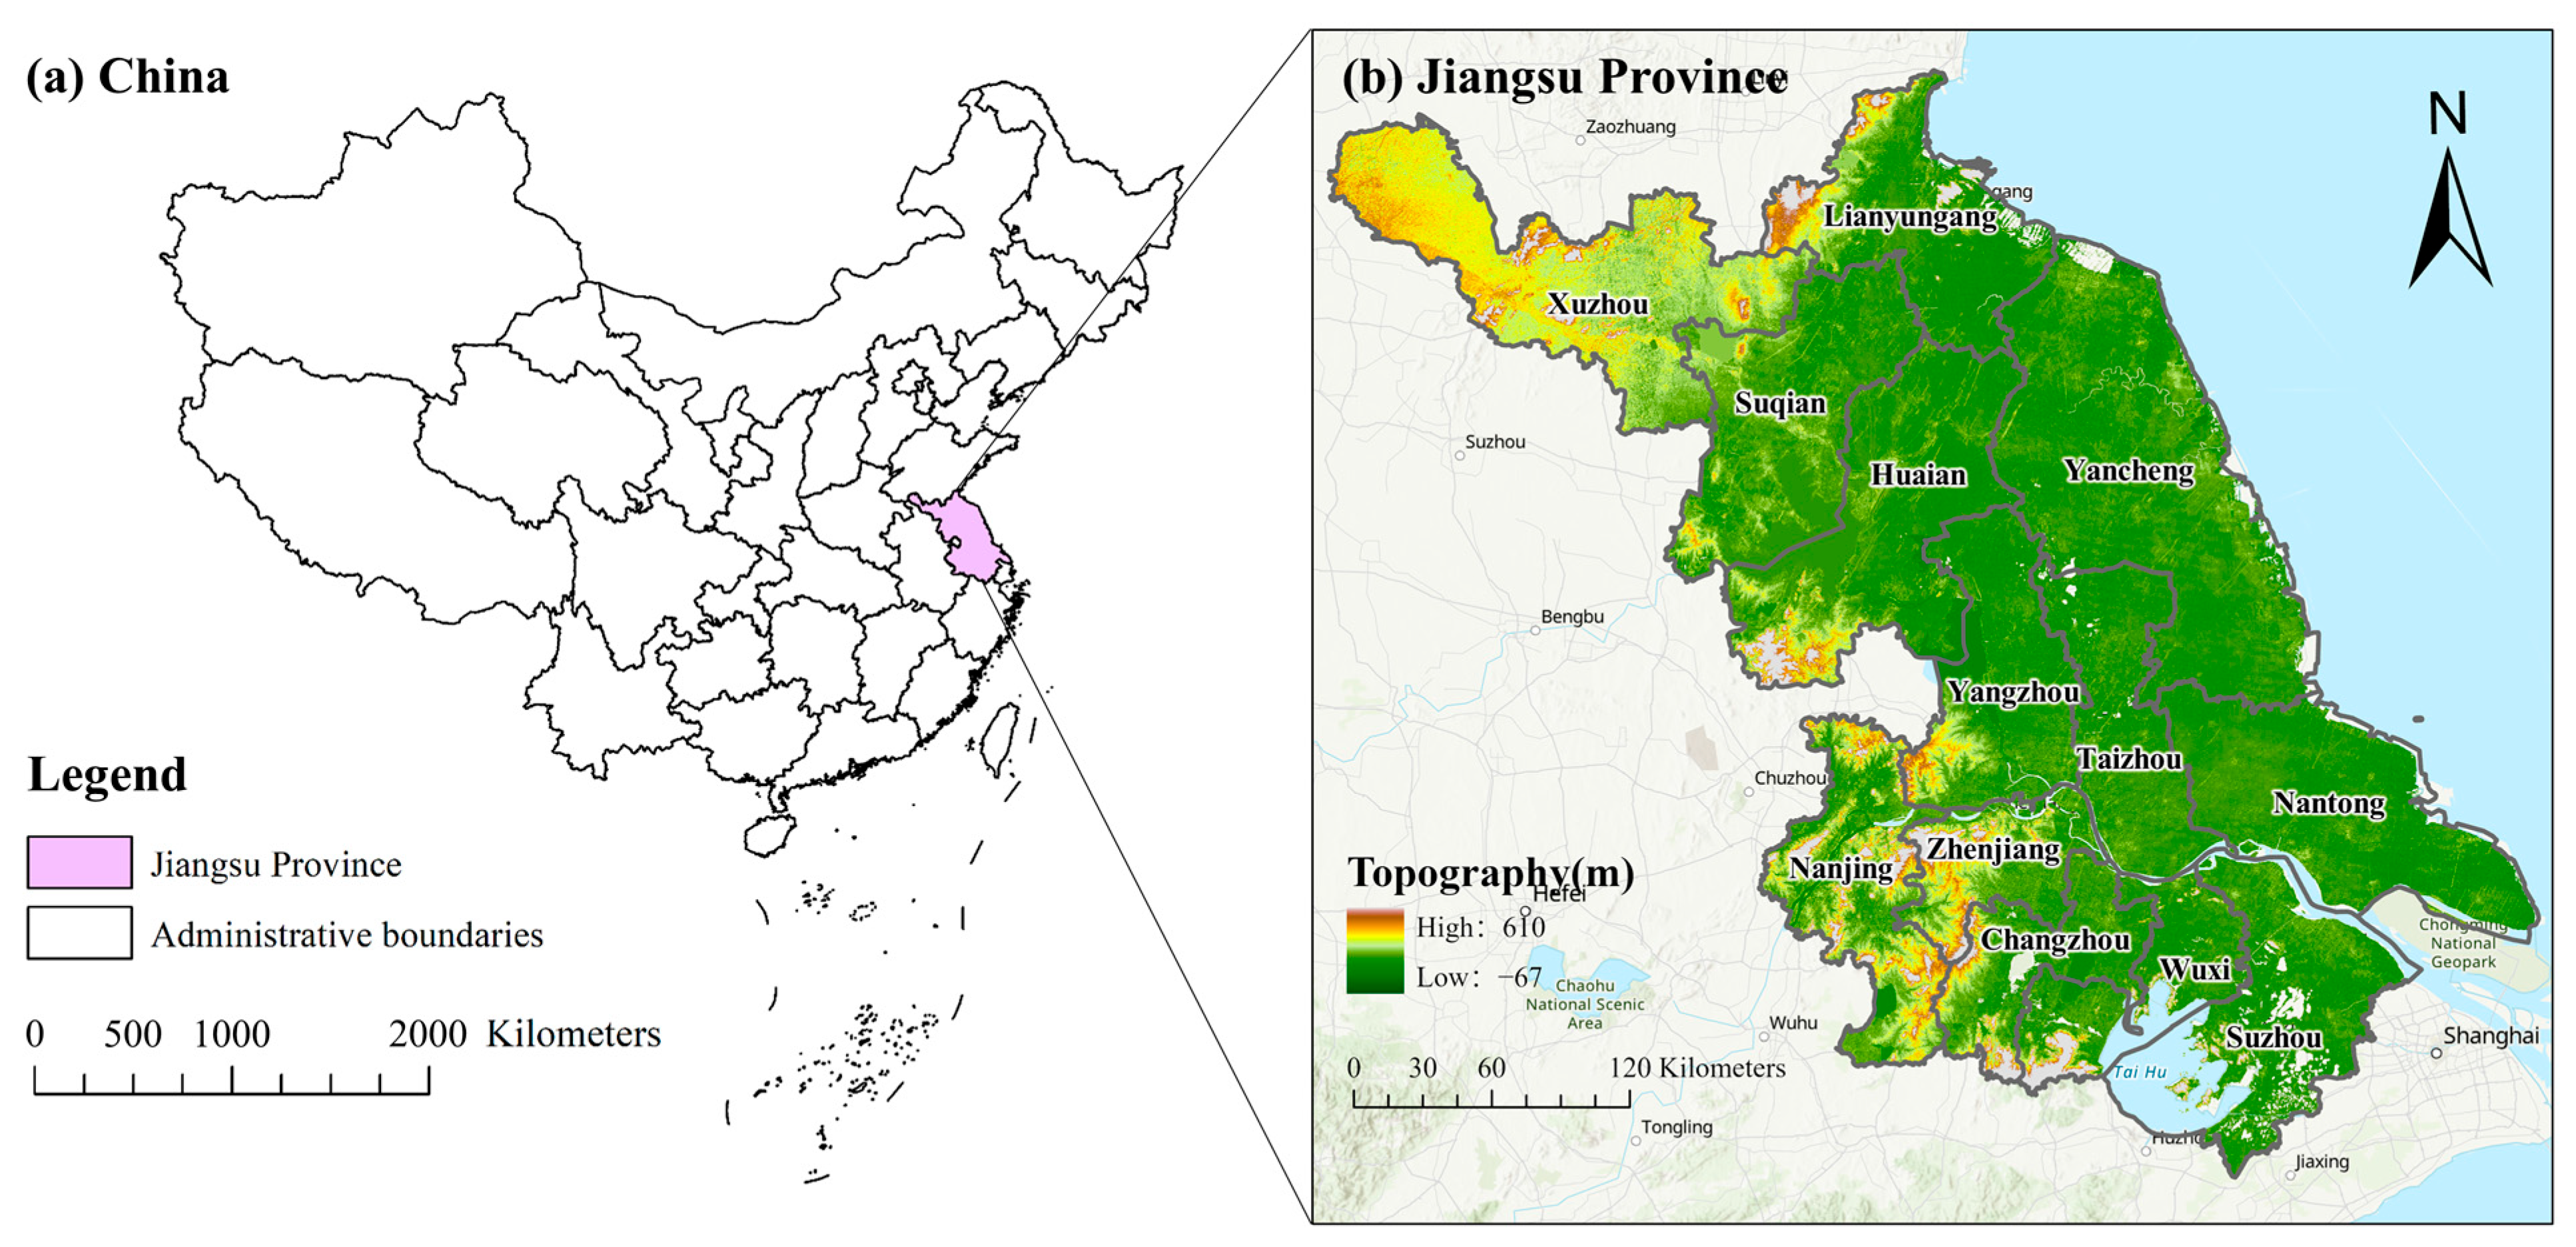
2.1. Study Area

Jiangsu Province is located in the mid-latitude region of China’s eastern coastal area between 116°22′ E and 121°55′ E and 30°46′ N and 35°07′ N, the study area is shown in Figure 1. It is a typical East Asian monsoon climate zone, characterized by a mild and humid climate with distinct monsoon features [3]. The area regulates 13 prefecture-level cities, covering up to a range of approximately 107,200 square kilometers. The landscape is level and open, with a huge zone of waterways, giving a strong biological establishment and noteworthy potential for development and asset utilization [4]. As a vital portion of China’s coastal financial belt and the center component of the Yangtze Stream Delta urban agglomeration, Jiangsu Area incorporates a significant financial yield within the nation, with a high level of industrialization. Its mechanical structure is ruled by fabrication and other industries, with a solid reliance on fossil fuel power for vitality, resulting in high resource utilization and driving carbon emanations across the nation, in this way significantly contributing to carbon emissions [23]. Recently, driven by fast urbanization, the development of transportation infrastructure, and mechanical development, the land use design in Jiangsu Territory has experienced extreme changes, with a lessening in environmental emissions and challenges to the carbon sequestration capacity of the environment. Meanwhile, as one of the first pilot provinces for carbon peaking in China, Jiangsu has clearly put forward key tasks such as “strengthening dual control of energy, optimizing spatial layout, and improving ecological quality” during the 14th Five-Year Plan period, committing to achieving the carbon peaking goal before 2030. Therefore, under the national “dual carbon” strategy, conducting land use optimization research oriented towards enhancing carbon storage not only helps to strengthen the regional ecosystem’s carbon sequestration capacity but also provides spatial support and a scientific basis for achieving the carbon peaking path under high-quality development.

2.2. Data

This research employed a 1:100,000 scale land use dataset for Jiangsu Province spanning the years 1995 to 2020. The data were acquired from the Yangtze River Delta Scientific Data Center, part of the National Earth System Science Data Sharing Platform under the National Science and Technology Infrastructure (http://geodata.nnu.edu.cn, accessed on 1 March 2025), with access recorded on 1 January 2025. Featuring a spatial resolution of 30 m, the dataset reported an overall classification accuracy of 95%, conforming to the cartographic accuracy requirements for a 1:100,000 mapping scale [24]. The files were provided in ESRI Shapefile format and projected using the Krasovsky_1940_Albers coordinate system. Originally comprising 6 major and 25 minor land use classes, the dataset was reclassified into six aggregated categories for this study: cropland, woodland, grassland, aquatic areas, built-up land, and barren land [25].
Land use dynamics are inalienably affected by a combination of natural conditions, financial advancements, and spatial settings. In order to simulate the prospective transformation of land use, a suite of driving variables was integrated into the analysis, encompassing topographic attributes (elevation, slope, and aspect), climatic indicators (annual mean precipitation and temperature), socio-economic parameters (GDP and population density), and administrative zoning [26]. Elevation data were sourced from the ASTER Global Digital Elevation Model (https://www.jspacesystems.or.jp/ersdac/GDEM/E/, accessed on 1 March 2025), and derivative layers for slope and aspect were generated using ArcGIS 10.8 software at a 30 m resolution. Climatic data were compiled on the basis of administrative divisions, while GDP and population density metrics, each at a spatial granularity of 1 km × 1 km, were obtained from the same Earth System Science data platform.
The carbon density data utilized in this study originated from the National Ecological Science Data Center’s national carbon density dataset. To estimate carbon densities relevant to Jiangsu Province, average values were extracted from regions exhibiting comparable latitudinal and longitudinal characteristics. These values were then refined through a calibration approach to generate carbon density estimates for each of the six specified land use categories within the study area [27,28].

2.3. Method

2.3.1. InVEST Model

The carbon sequestration component of InVEST (Coordinates Valuation of Eco-system Administrations and Trade-offs) model gives the ability to measure environmental carbon stocks based on particular land use classifications and comparing carbon thickness parameters [8]. Inside this system, environment carbon capacity is categorized into four vital carbon supplies: carbon stored in aboveground vegetation biomass ( C i a b o v e ), carbon stored in belowground biomass carbon ( C i b e l o w ), soil organic carbon ( C i s o i l ), and dead organic carbon ( C i d e a d ) [29]. The model calculates total carbon storage using the following general expression:
C t o t a l = i = 1 6 C i a b o v e + C i b e l o w + C i s o i l + C i d e a d × A i
where C t o t a l denotes the overall carbon storage capacity or carbon sequestration function of the ecosystem. The terms C i a b o v e , C i b e l o w , C i s o i l , and C i d e a d refer to the carbon thickness values related to the aboveground biomass, belowground biomass, soil natural matter, and dead natural fabric for the i-th category of land use, respectively. A i indicates the spatial extent (area) corresponding to each land use type i. Given identical climatic conditions, the carbon densities for similar land cover types are generally consistent. The carbon density values applied in this research were sourced from the China Terrestrial Ecosystem Carbon Density Dataset and subsequently modified to reflect the specific environmental attributes and ecological context of Jiangsu Province.

2.3.2. Carbon Density Adjustment

Carbon thickness is emphatically impacted by variables such as climate conditions, soil properties, and land use designs. Past studies have demonstrated that ranges arranged inside the same climatic zone regularly show comparable carbon thickness levels, which can be refined through redress components consolidating climatic factors like normal yearly temperature and precipitation [30]. In this study, the carbon thickness inputs were determined from the Information Center for Biological and Natural Sciences, Chinese Institute of Sciences. Agent normal values were extricated from areas sharing comparable latitudinal and longitudinal characteristics within the Jiangsu Area and were hence adjusted utilizing significant alteration methods [31]. The redress coefficients for precipitation and temperature utilized in altering carbon thickness are calculated utilizing the following conditions:
K B P = C B P C B P
K B T = C B T C B T
K B = K B P + K B T = C B P C B P + C B T C B T
K S = C S P C S P
where outline is the highest yearly precipitation (mm); MAT represents the highest yearly temperature (°C); CBP and CBT are the carbon thicknesses (Mg·hm−2) balanced based on precipitation and temperature, respectively; and CSP is the soil carbon thickness (Mg·ha−1) based on precipitation. C′ and C″ are the carbon thicknesses of earthbound environments in the Jiangsu Area and at the national scale, respectively. The normal yearly temperature and precipitation values for both Jiangsu Territory and the aggregate of China (in the period from 1995 to 2020) were connected to the afore-mentioned alteration conditions. Particularly, Jiangsu Territory show a highest temperature of 16.2 °C and a normal yearly precipitation of 1283.4 mm, whereas the national midpoints for China amid the same time period were 9.83 °C and 643.5 mm, respectively. The proportions between the territorial and national climate points were calculated and utilized as scaling components for carbon thickness alteration. The resulting calibrated carbon thickness values for Jiangsu Area are displayed in Table 1.

2.3.3. Multi-Scenario Land Use Simulation and Prediction

To meet the future planning needs of Jiangsu Province, this study refers to key policy documents such as the “Jiangsu Province Land Use General Plan (2006–2020)”, the “14th Five-Year Plan for National Economic and Social Development and the Long-Range Objectives for 2035 in Jiangsu Province”, and the “Jiangsu Province New-Type Urbanization Plan (2021–2035)”. With the target year of 2030, five different development scenarios were constructed to explore potential pathways for land use changes from multiple perspectives and provide scientific decision-making support for policymakers. The specific scenarios are as follows:
(1) 
Natural Development Scenario (ND)
This situation accepts that the trend of land use changes will proceed via the natural development of Jiangsu Province from 1995 to 2020. It quantifies the evolution of various land areas in the natural development process without policy intervention. This scenario provides a reference for future land use based on historical trends.
(2) 
Economic Development Scenario (ED)
Aiming to maximize economic benefits, this scenario focuses on promoting urban–rural integration, strengthening urban infrastructure construction, increasing urbanization rates, and building new types of cities. Economic development is prioritized to investigate the ideal financial benefits of land use in Jiangsu Area by 2030 beneath existing limitations. This approach assesses the economic potential of land use in Jiangsu Province, providing an important reference for enhancing land use economic benefits and promoting land economic development.
(3) 
Ecological Protection Scenario (EP)
With the goal of maximizing ecological benefits, this scenario prioritizes the protection of ecological land. It focuses on maintaining and enhancing the functions of ecological land, striving for harmonious coordination between land use and ecological environment construction. It explores the optimal ecological benefits of land use in Jiangsu Province by 2030, providing a reference for future land use policy formulation guided by ecological protection.
(4) 
High Carbon Storage Development Scenario (HCD)
This scenario aims to maximize carbon storage by optimizing land use. It enhances the carbon sequestration function of ecosystems, mitigates climate change, and further constructs a land use structure oriented towards low carbon, achieving the “carbon neutrality” goal more quickly [32].
(5) 
Sustainable Development Scenario (SD)
This scenario coordinates the adjusted advancement of the economy, environment, and carbon capacity, seeking financial development while also centering on improving environmental capacities. By coordinating development across various fields, it achieves long-term sustainable development to meet future economic needs while protecting the natural environment. Under this scenario, the overall optimal solution for economic, ecological, and carbon storage benefits is sought, exploring the optimal land use solution for Jiangsu Province by 2035 to fulfill the vision of building a beautiful Jiangsu [30].
This study employs a multi-objective optimization model (MOP) to address the multi-objective land use and land cover (LULC) optimization challenges in different scenarios. The MOP model is a mathematical programming model that can solve optimization problems with multiple objective functions within given constraints. Guided by principles encompassing economic growth, ecological conservation, and low-carbon development, the model incorporates constraint conditions related to overall land availability, socio-economic progress, and environmental protection thresholds. The objective functions are determined via the regional gross domestic product, ecosystem service value, carbon storage, and total carbon emissions, which represent climate mitigation goals [33]. The mathematical expressions of the objective functions are detailed as follows:
f ( x ) = M a x G D P ( x ) = M a x i = 1 6 A i X i
f ( x ) = M a x E S V ( x ) = M a x i = 1 6 B i X i
f ( x ) = M a x C ( x ) = M a x i = 1 6 C i X i
where A i is the ecological value coefficient for the i-th land use change, B i is the economic value coefficient for the i-th land use change, C i is the carbon density coefficient for the i-th land use change, and X i is the total area of the six kinds of land use categories.
Based on the given formulas, the method will establish a low-carbon land use structure optimization model. The optimization employs 2020 as the base year and 2030 as the target year, giving a premise and bolster for national spatial arrangement, biological environment security and rebuilding, and low-carbon improvement. The constraints are set as follows:
(1) Total Land Area Constraint: All of the land use areas of the considered region are settled. Subsequently, the entirety of the regions of all the land use changes must break even with the overall zone of the considered region:
X t o t a l = X c r o p l a n d + X f o r e s t + X g r a s s l a n d + X w a t e r + X b u i l t u p + X u n u s e d
(2) Economic and Social Development Indicator Constraints: Considering the requirements of economic and social development, the zones of cropland, built-up area, and unused area are chosen as imperative indicators.
According to national and Jiangsu Territory arrangements, taking after the Jiangsu Territory national spatial arrangement, different city national spatial plans, and the “14th Five-Year” objectives for national financial and social advancement, by 2030, the cropland zone in Jiangsu Area ought to not be less than 59.77 million mu, of which the zone of lasting fundamental farmland ought to not be less than 53.44 million mu to guarantee a nonstop change in grain-generation capacity [34]. In this manner, the cropland imperative condition is
X c r o p l a n d 59.77   million mu
With the improvement of the economy and society and the change in urbanization rates, urban ranges are ceaselessly growing. To enhance the level of urban land use, increase land development intensity, and control the disorderly expansion of urban areas, the area of built-up land needs to be constrained. According to the “Jiangsu Province Urban System Plan (2015–2030)”, by 2030, the expansion of multiple of urban development boundaries should be less than 1.3. Therefore, the built-up land constraint condition is
X b u i l t u p 1.3 × current built up area
As the development and utilization of other lands continue, their areas are gradually decreasing. Idle land, stockpiled soil areas, and bare land generated by infrastructure construction are gradually restored to their original land types. Therefore, the area of unused land in 2030 should be lower than the current area:
X u n u s e d current unused area
Ecological Environment Protection Indicator Constraints help optimize production, living, and ecological spaces, improve environmental quality, increase carbon storage, enhance carbon absorption, prevent excessive urban sprawl, and construct a multi-level ecological network system. The regions of forestland, prairie, and water bodies are chosen to build constraint markers.
Forestland has the strongest carbon absorption capacity among all land use types. The “Jiangsu Province National Greening Plan (2023–2030)” clearly states the need to focus on the “four repositories” of forest, water, grain, and carbon; the “five major relationships”, including the relationship between high-quality development and high-level protection of forestry, natural recovery, and artificial restoration; and the “dual carbon” commitment and autonomous action. By 2030, the urban vegetation coverage rate should be stable at more than 24.1%. Therefore, the forestland and grassland area constraint conditions are
X f o r e s t + X g r a s s l a n d X b u i l t u p × 24.1 %
Water bodies, as one of the most important ecosystems in Jiangsu Province, have a certain carbon absorption capacity. The area of water bodies should not be less than the current area in 2020. Therefore, the water body area constraint condition is
X w a t e r current water body area

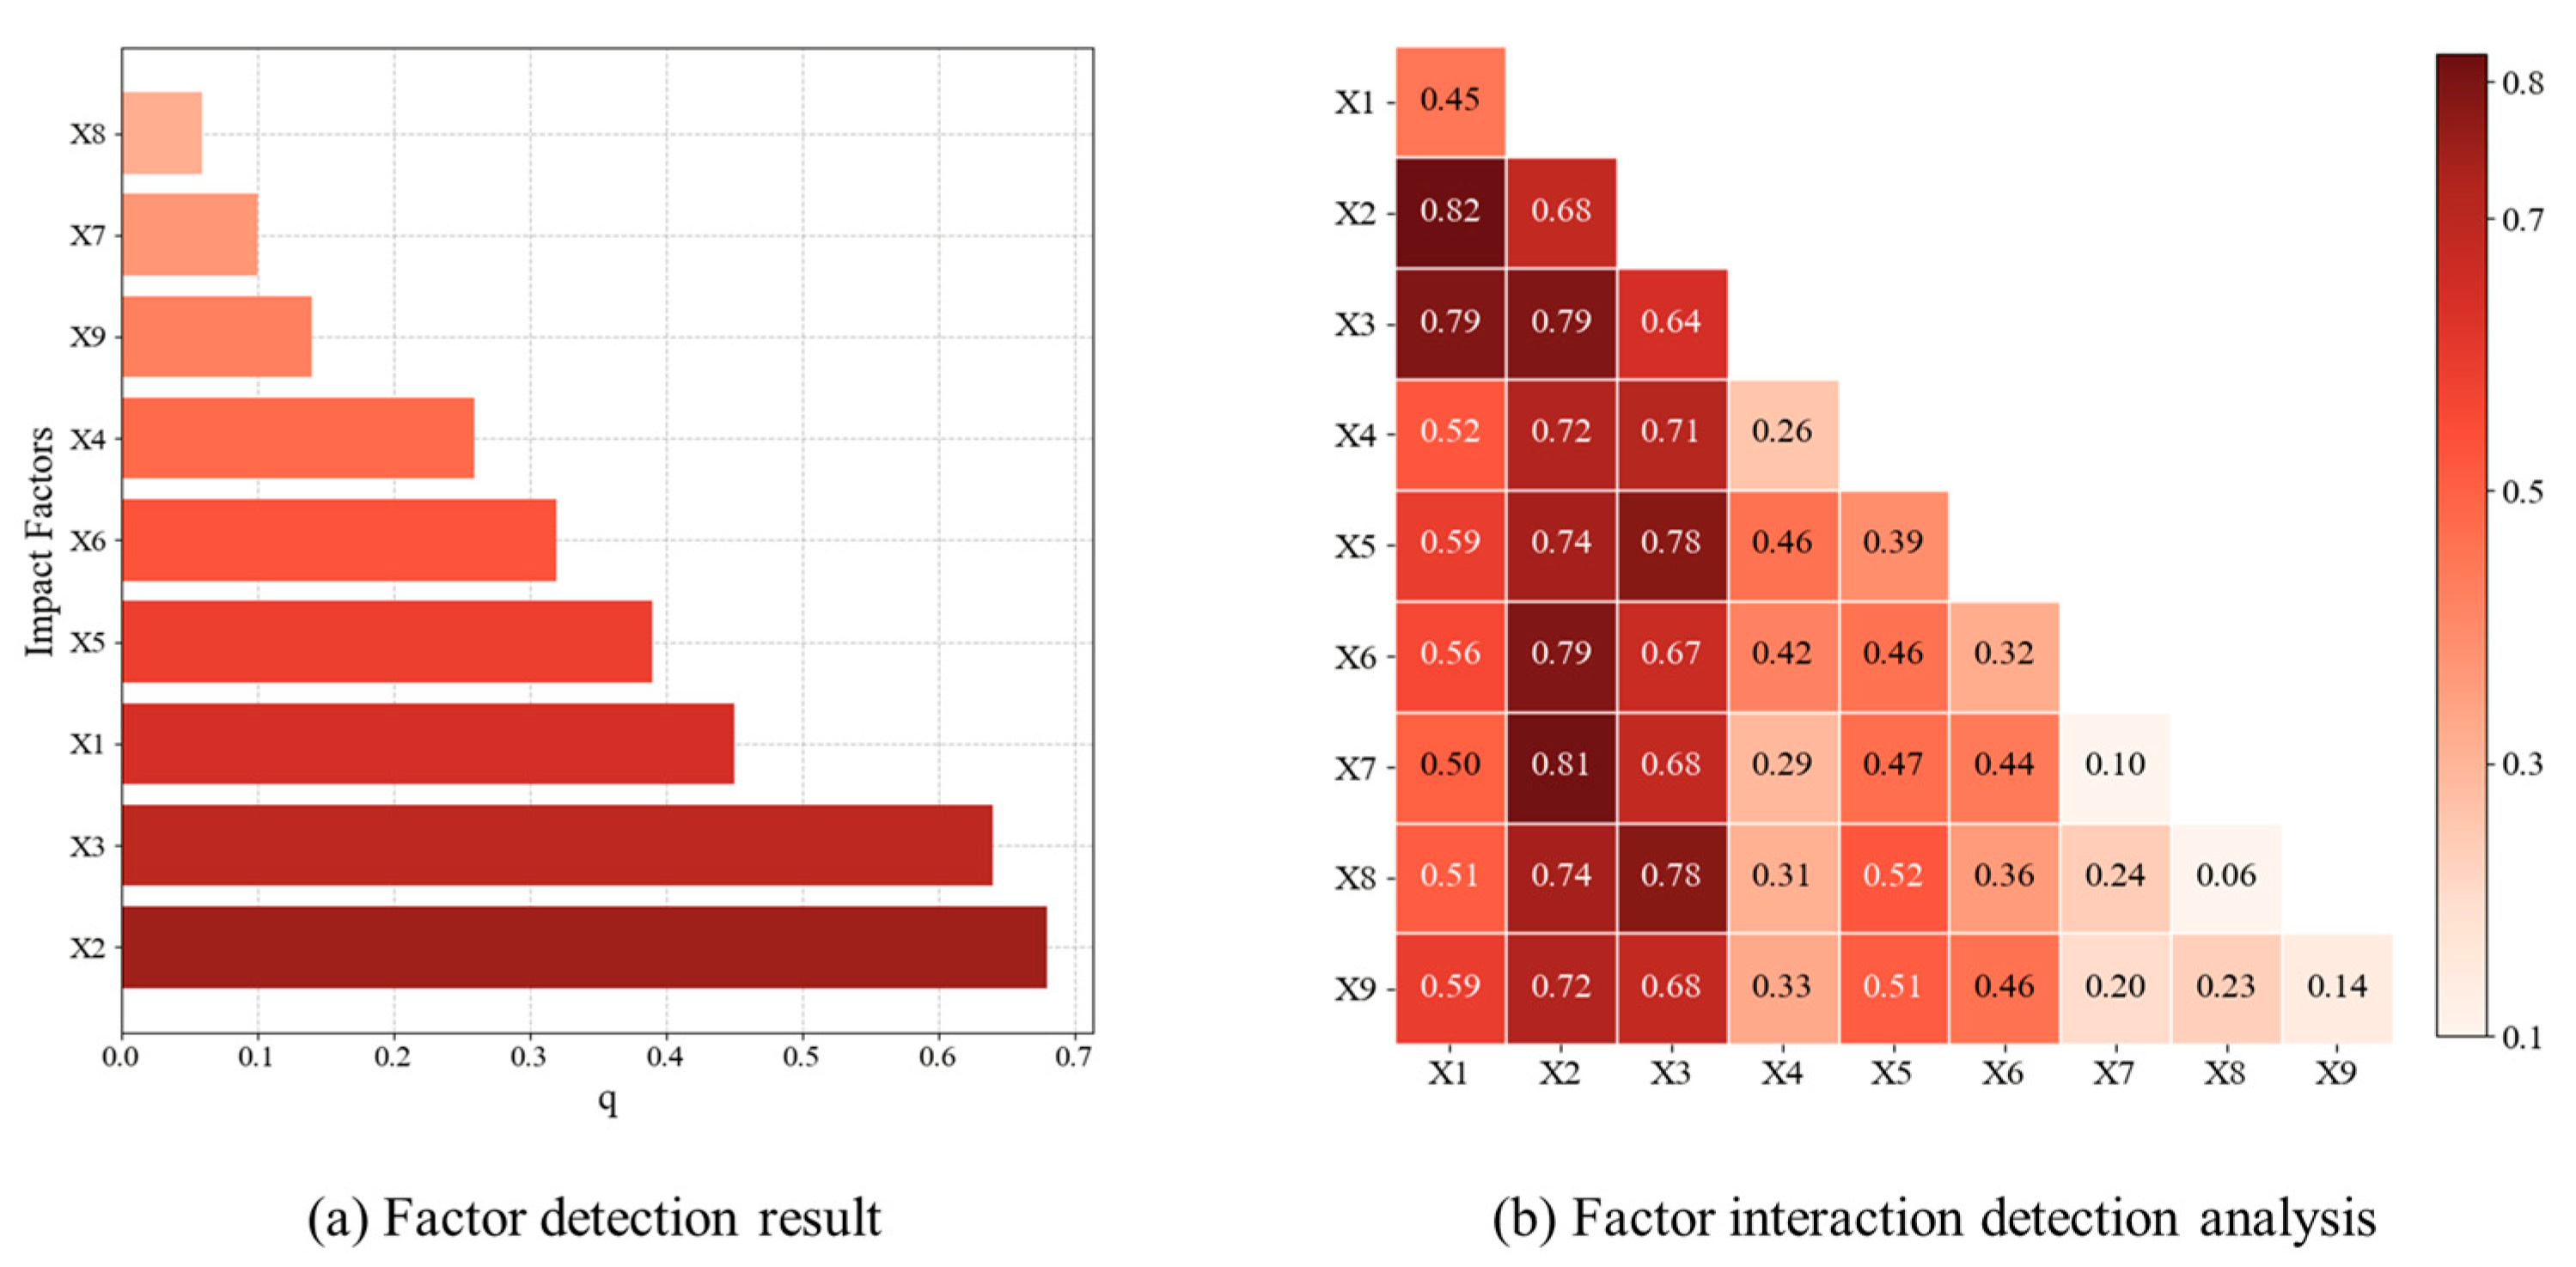
2.3.4. Geodetector to Analyze the Driving Variables

The Geodetector model is a broadly recognized spatial factual instrument utilized to identify spatial heterogeneity and reveal the driving instruments behind observed spatial designs. It is especially useful for analyzing influencing factors and their contributions in disciplines such as ecology, urban studies, and environmental research [35]. This method offers two key strengths: firstly, its capacity to process both quantitative and qualitative variables, making it adaptable to diverse types of datasets, and secondly, its ability to evaluate the interaction effects between different explanatory variables on a target outcome, which is essential for understanding how multiple factors jointly shape spatial distributions. The core of Geodetector lies in the calculation and comparison of q-values for individual explanatory variables and their pairwise combinations. The q-value is the degree of informative control of a figure or a combination of variables on a subordinate variable [36]. By comparing these q-values, Geodetector can determine whether two factors interact and the nature of their interaction, such as whether the interaction is strong or weak or linear or nonlinear.
The calculation of the q-value for a single factor X is as follows:
q = 1 h = 1 L N h σ h 2 N σ 2 = 1 S S W S S T
where h = 1, …, L denotes the layers or segments into which the variable Y or the computed variable X can be partitioned or categorized. Nh and N represent the sample sizes within stratum h and across the entire considered area, respectively, σ h 2 and σ 2 refer to the variances of Y in stratum h and in the overall domain, respectively, and SSW (Within Sum of Squares) and SST (Total Sum of Squares) speak to the sum of within-stratum changes and the whole change over the complete studied region, respectively.
The Geodetector method helps us understand if the combined influence of two factors (x1 and x2) on a result makes the explanation stronger or weaker. The way these two factors interact can be divided into five different types, as shown in Table 2.

3. Results

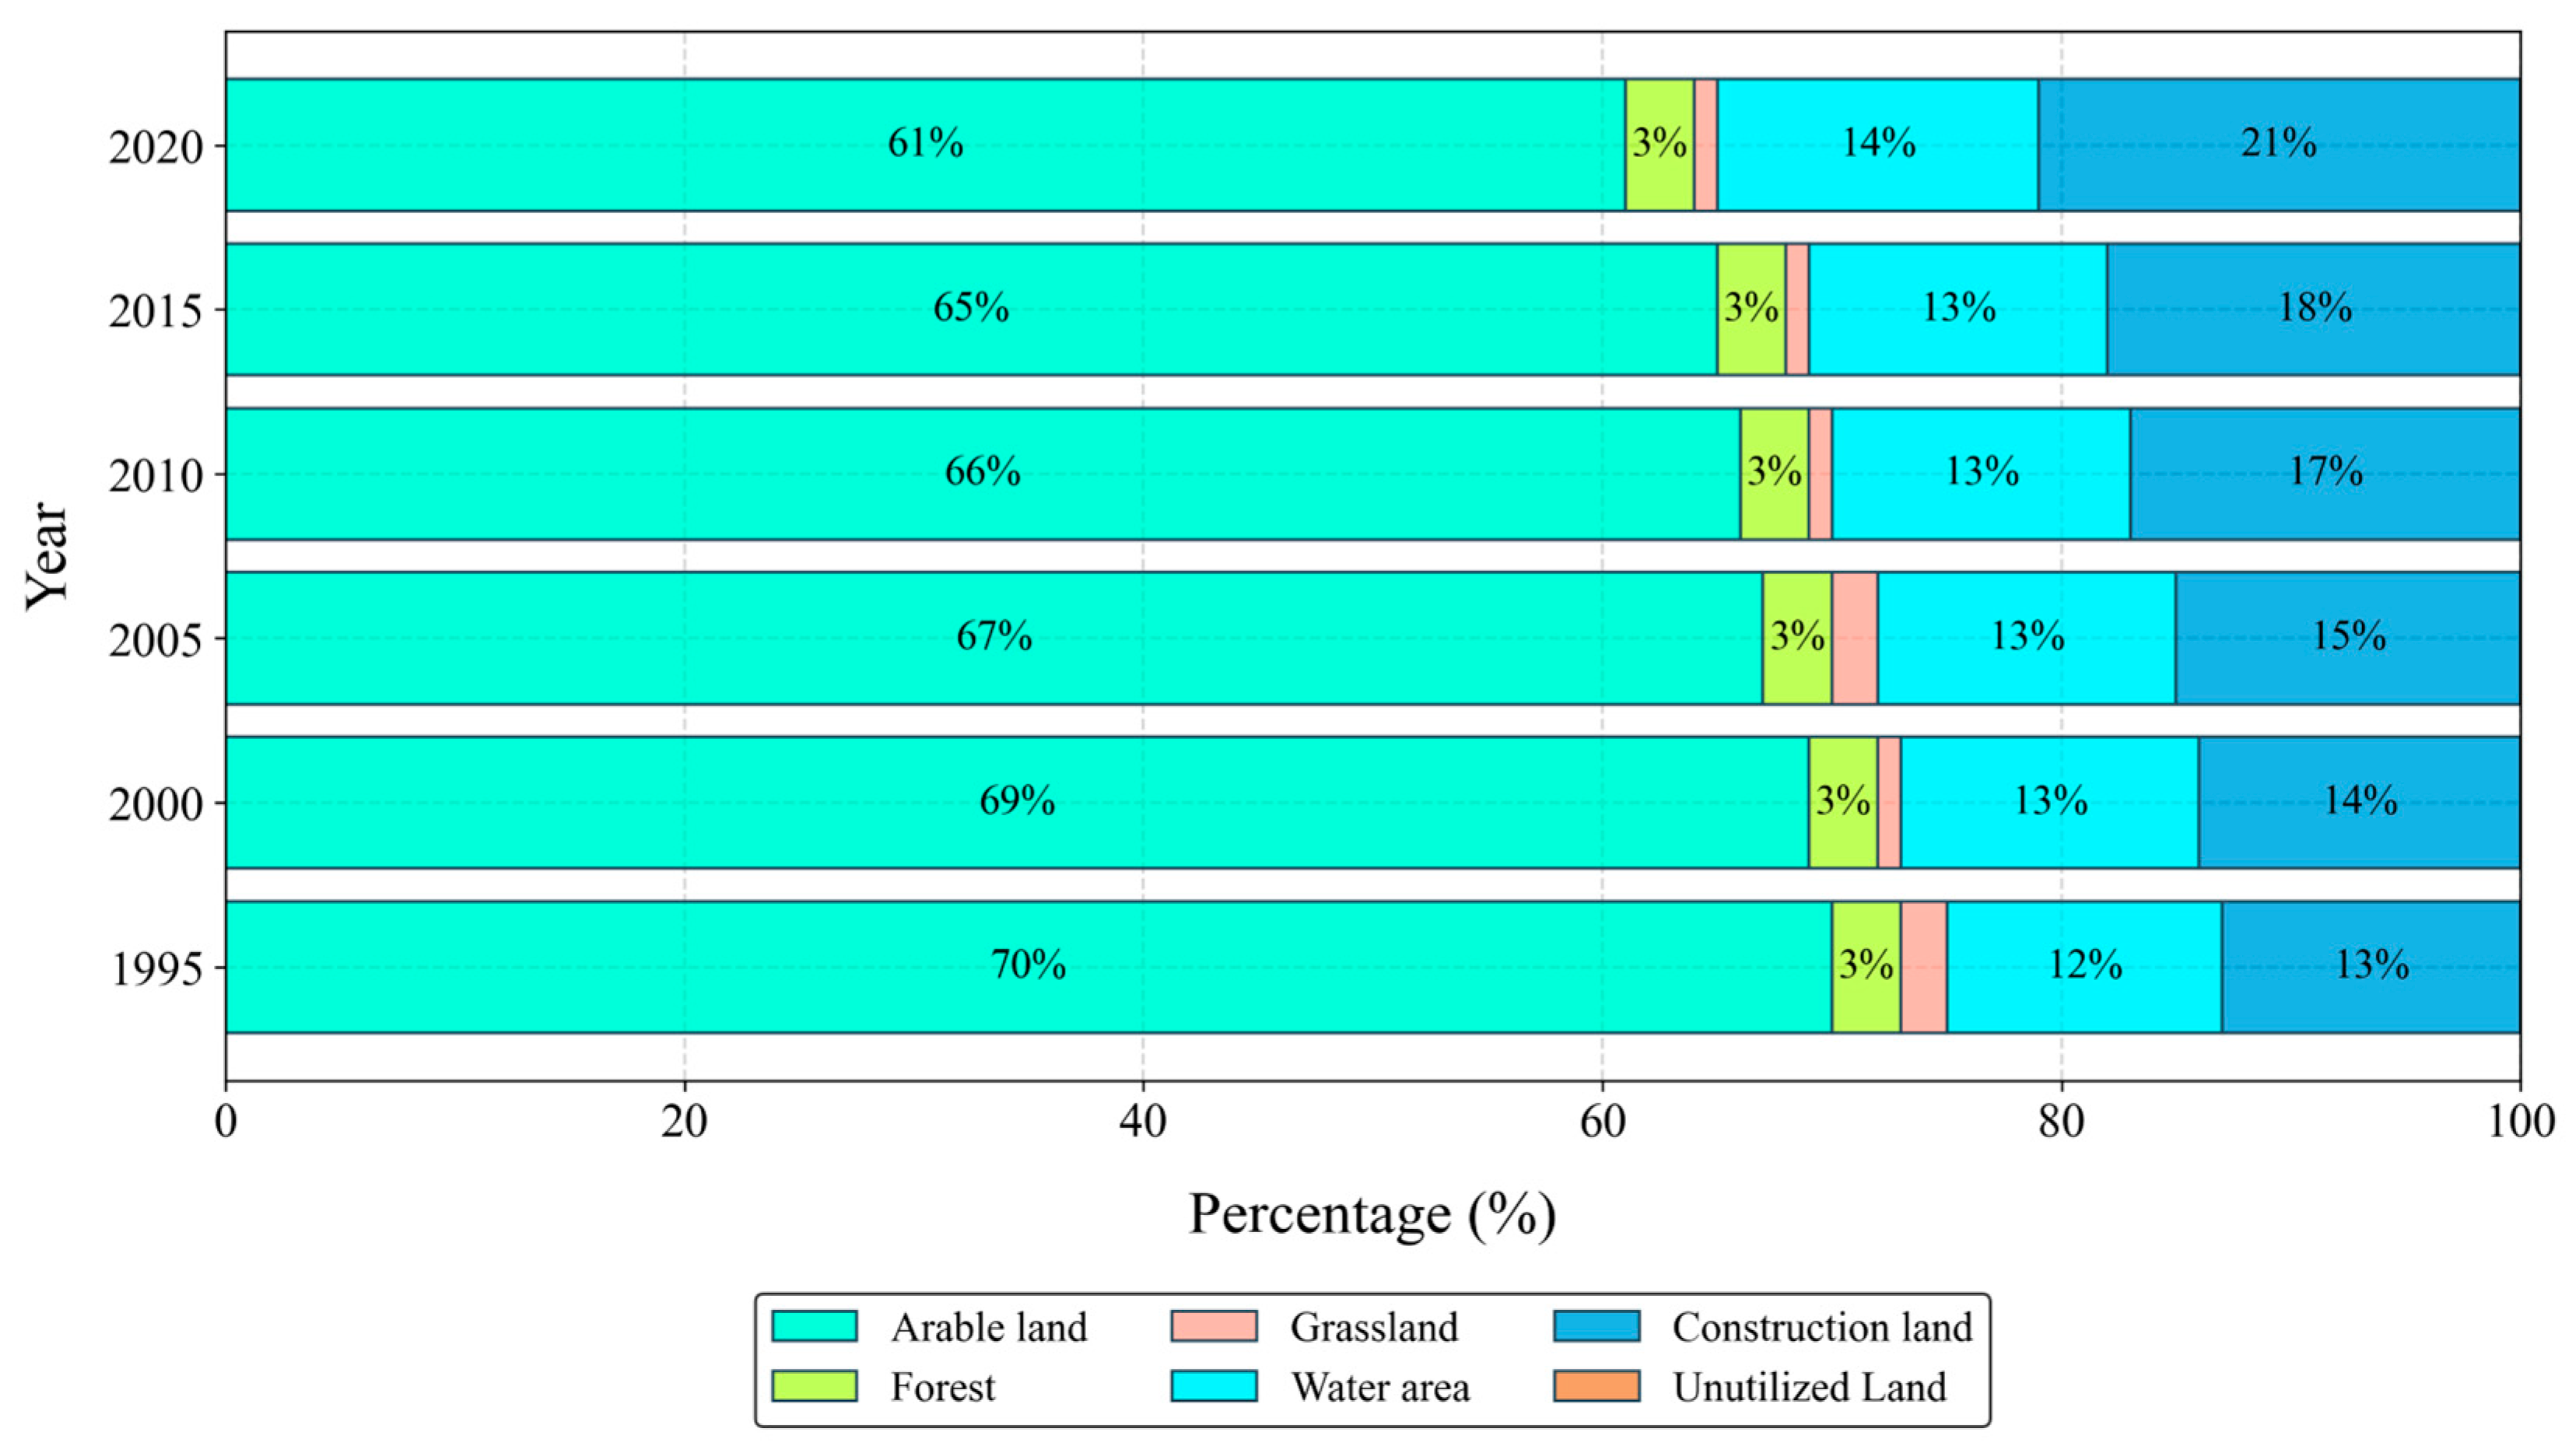
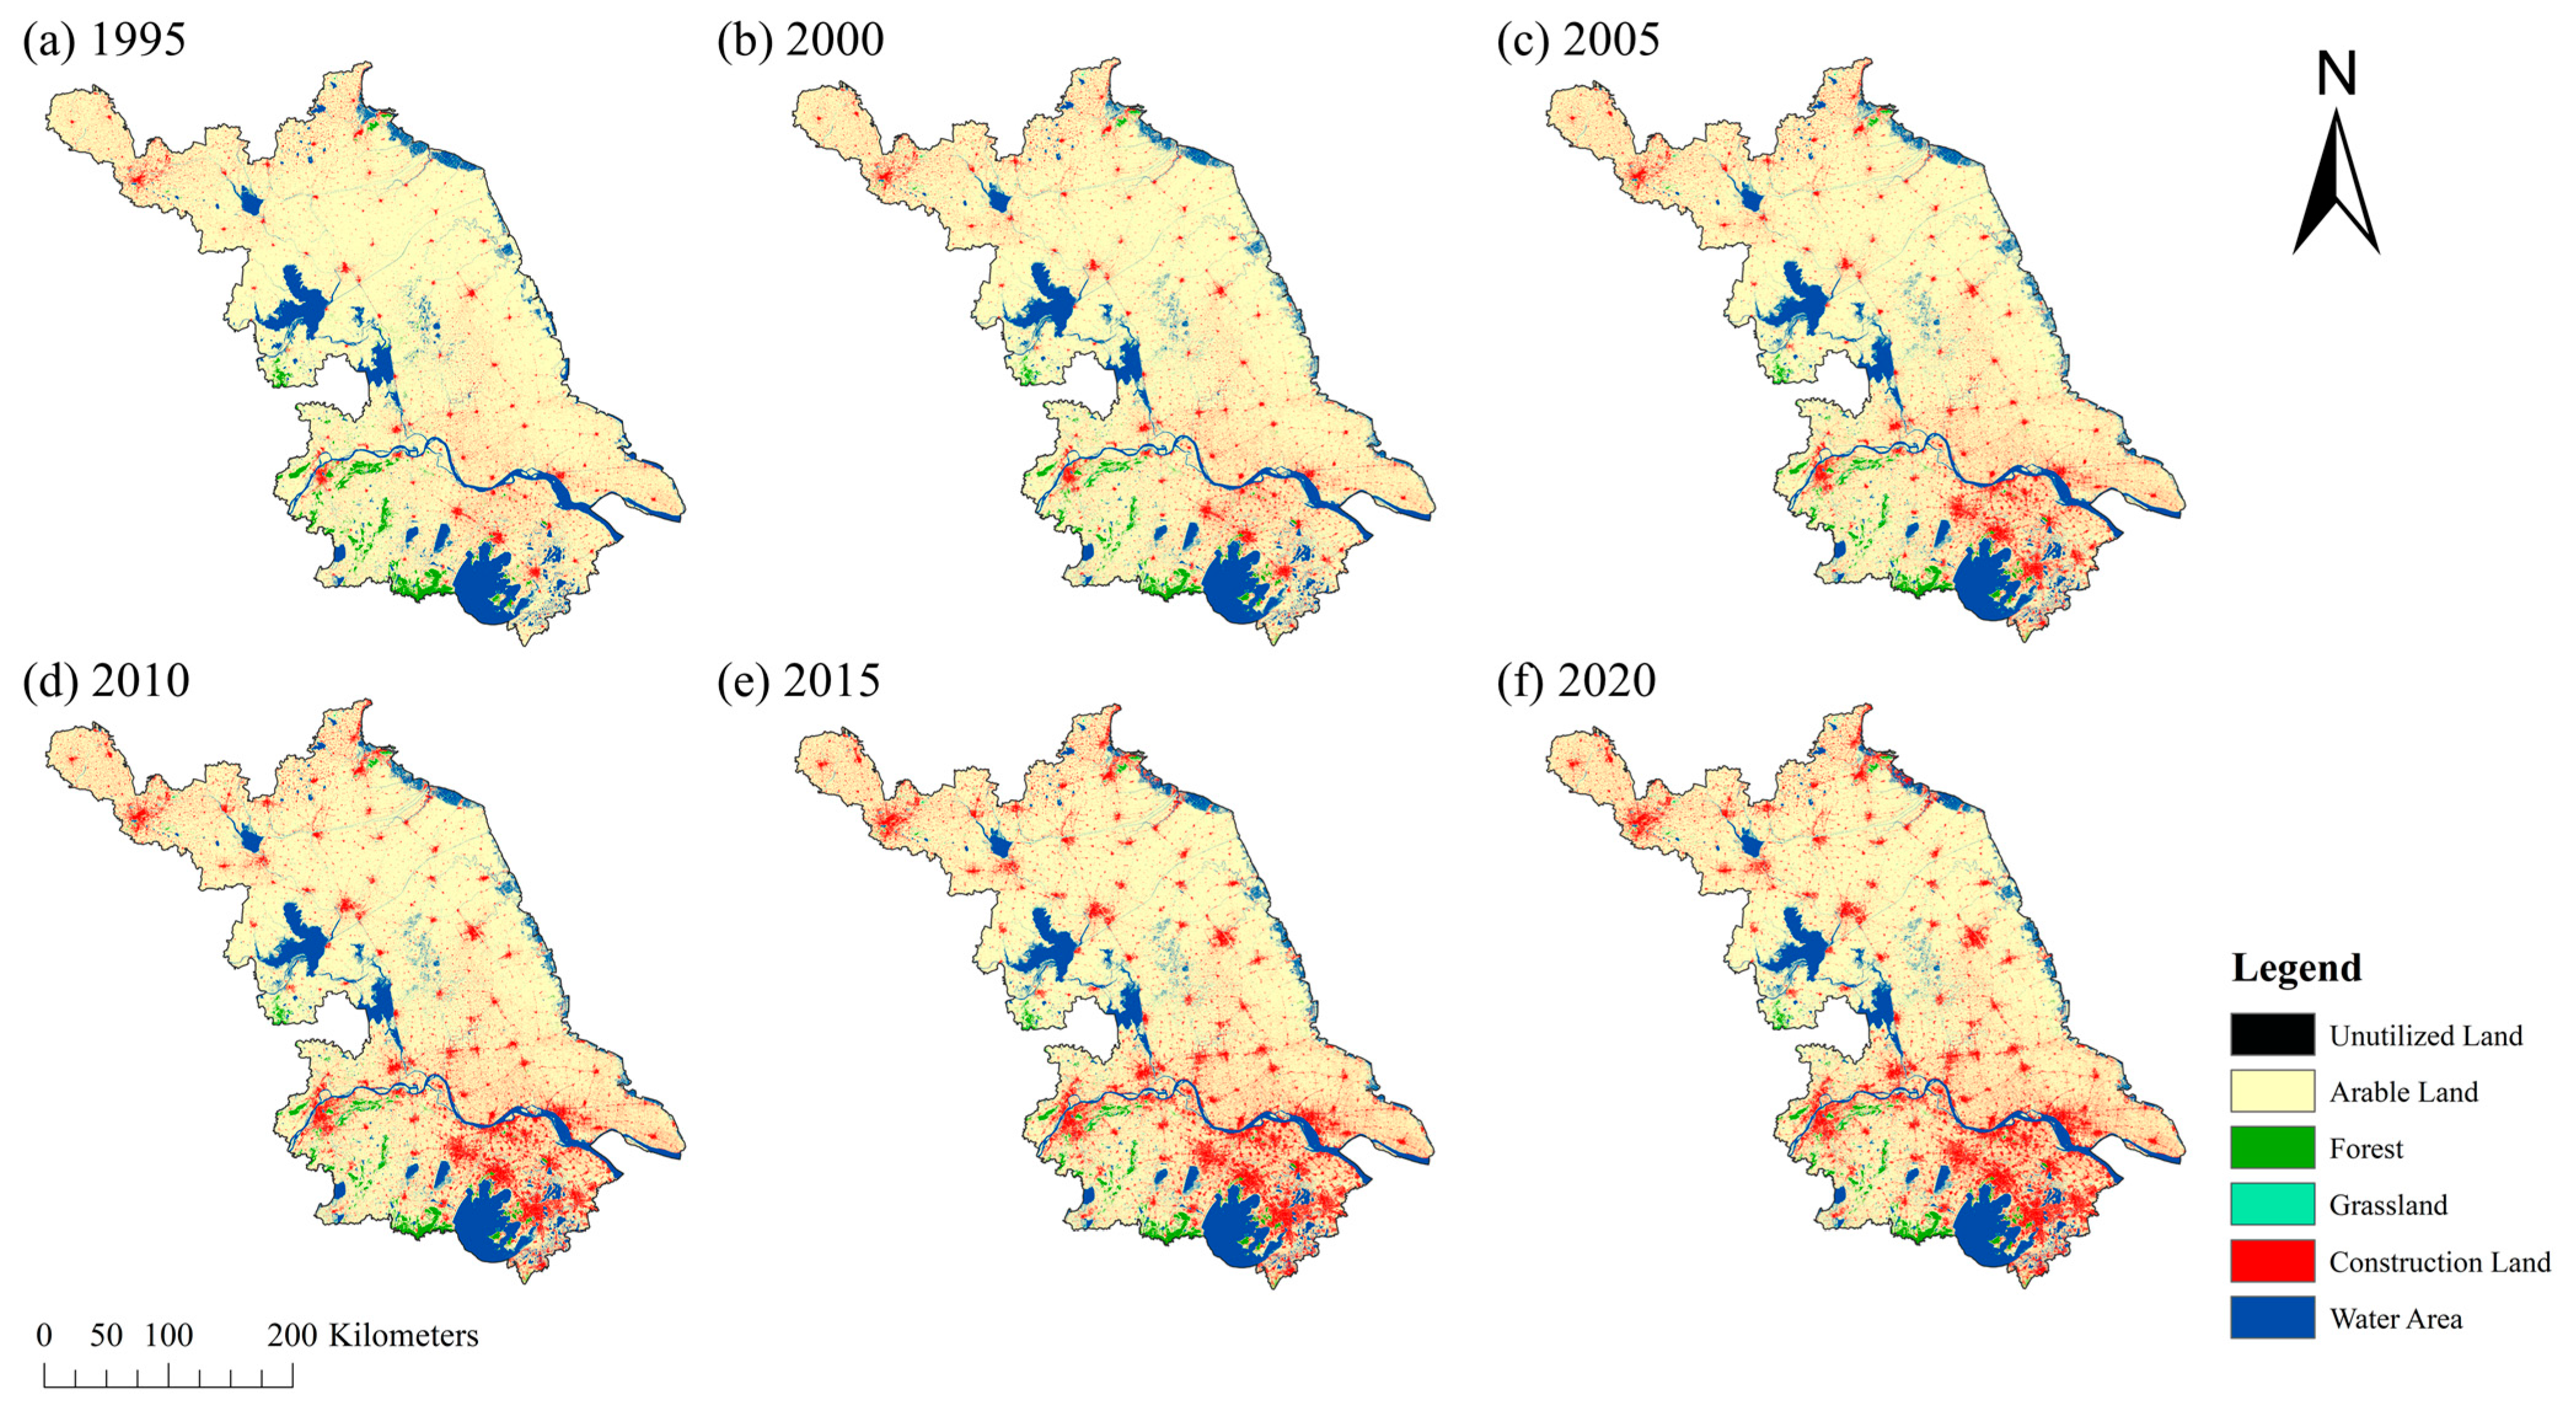
3.1. Spatiotemporal Evolution Patterns of Land Use from 1995 to 2020

From 1995 to 2020, Jiangsu Province experienced a significant transformation in its land use pattern, which was primarily driven by urbanization (Figure 2 and Figure 3). During this period, the area of cropland decreased continuously from 71,854 square kilometers to 62,912 square kilometers, a total reduction of 8942 square kilometers. This decline in cropland area reflects the continuous encroachment on agricultural land due to urban expansion and the development of non-agricultural land uses. Meanwhile, the scale of built-up areas extended significantly, expanding from 13,671 square kilometers to 21,510 square kilometers, with a growth rate of 57.3%. This significant increment in built-up areas shows a marked rise in the need for spatial assets amid Jiangsu Province’s fast industrialization and urbanization. The sizes of forest- and grassland both decreased The forested area decreased from 3501 square kilometers to 3066 square kilometers, and the grassland area decreased from 1102 square kilometers to 732 square kilometers. These changes suggest that ecological land spaces were to some extent compressed (Table 3). The area of water bodies increased slightly amidst fluctuations, while the proportion of unused land remained small, with limited changes in magnitude. Overall, the land use structure in Jiangsu Province exhibited a trend of the concentration of cropland and ecological spaces moving towards built-up land.

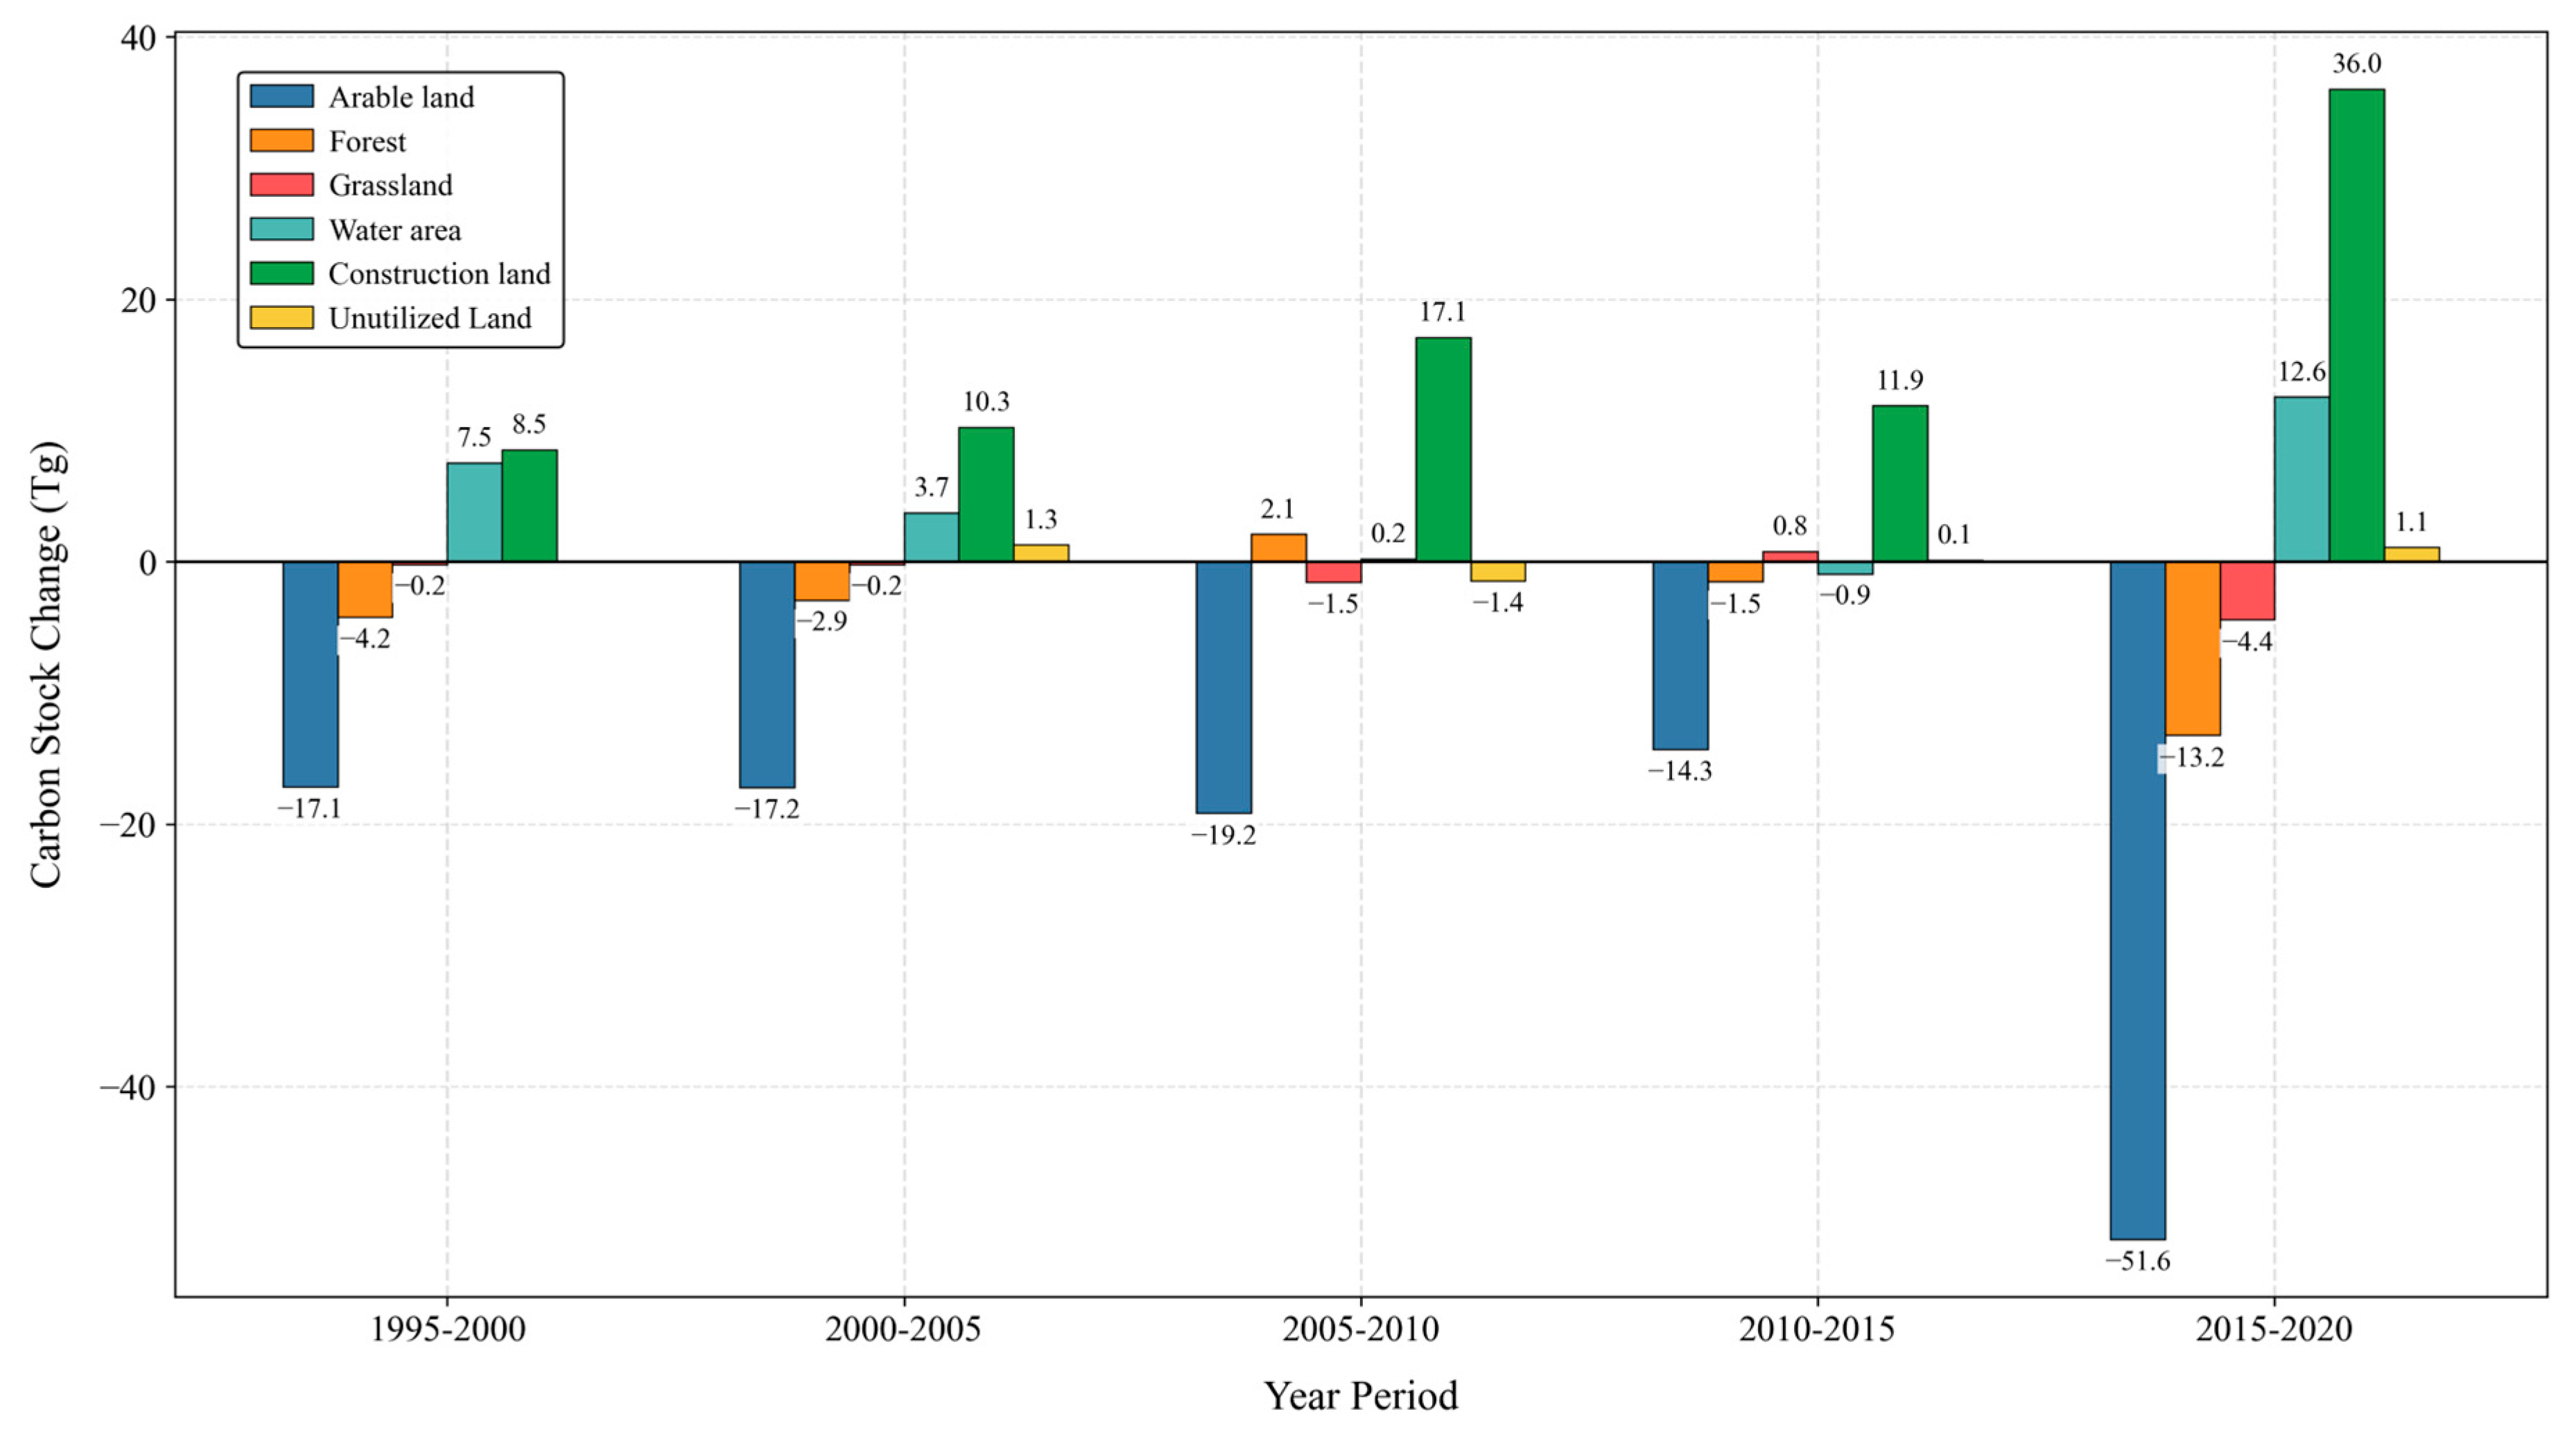
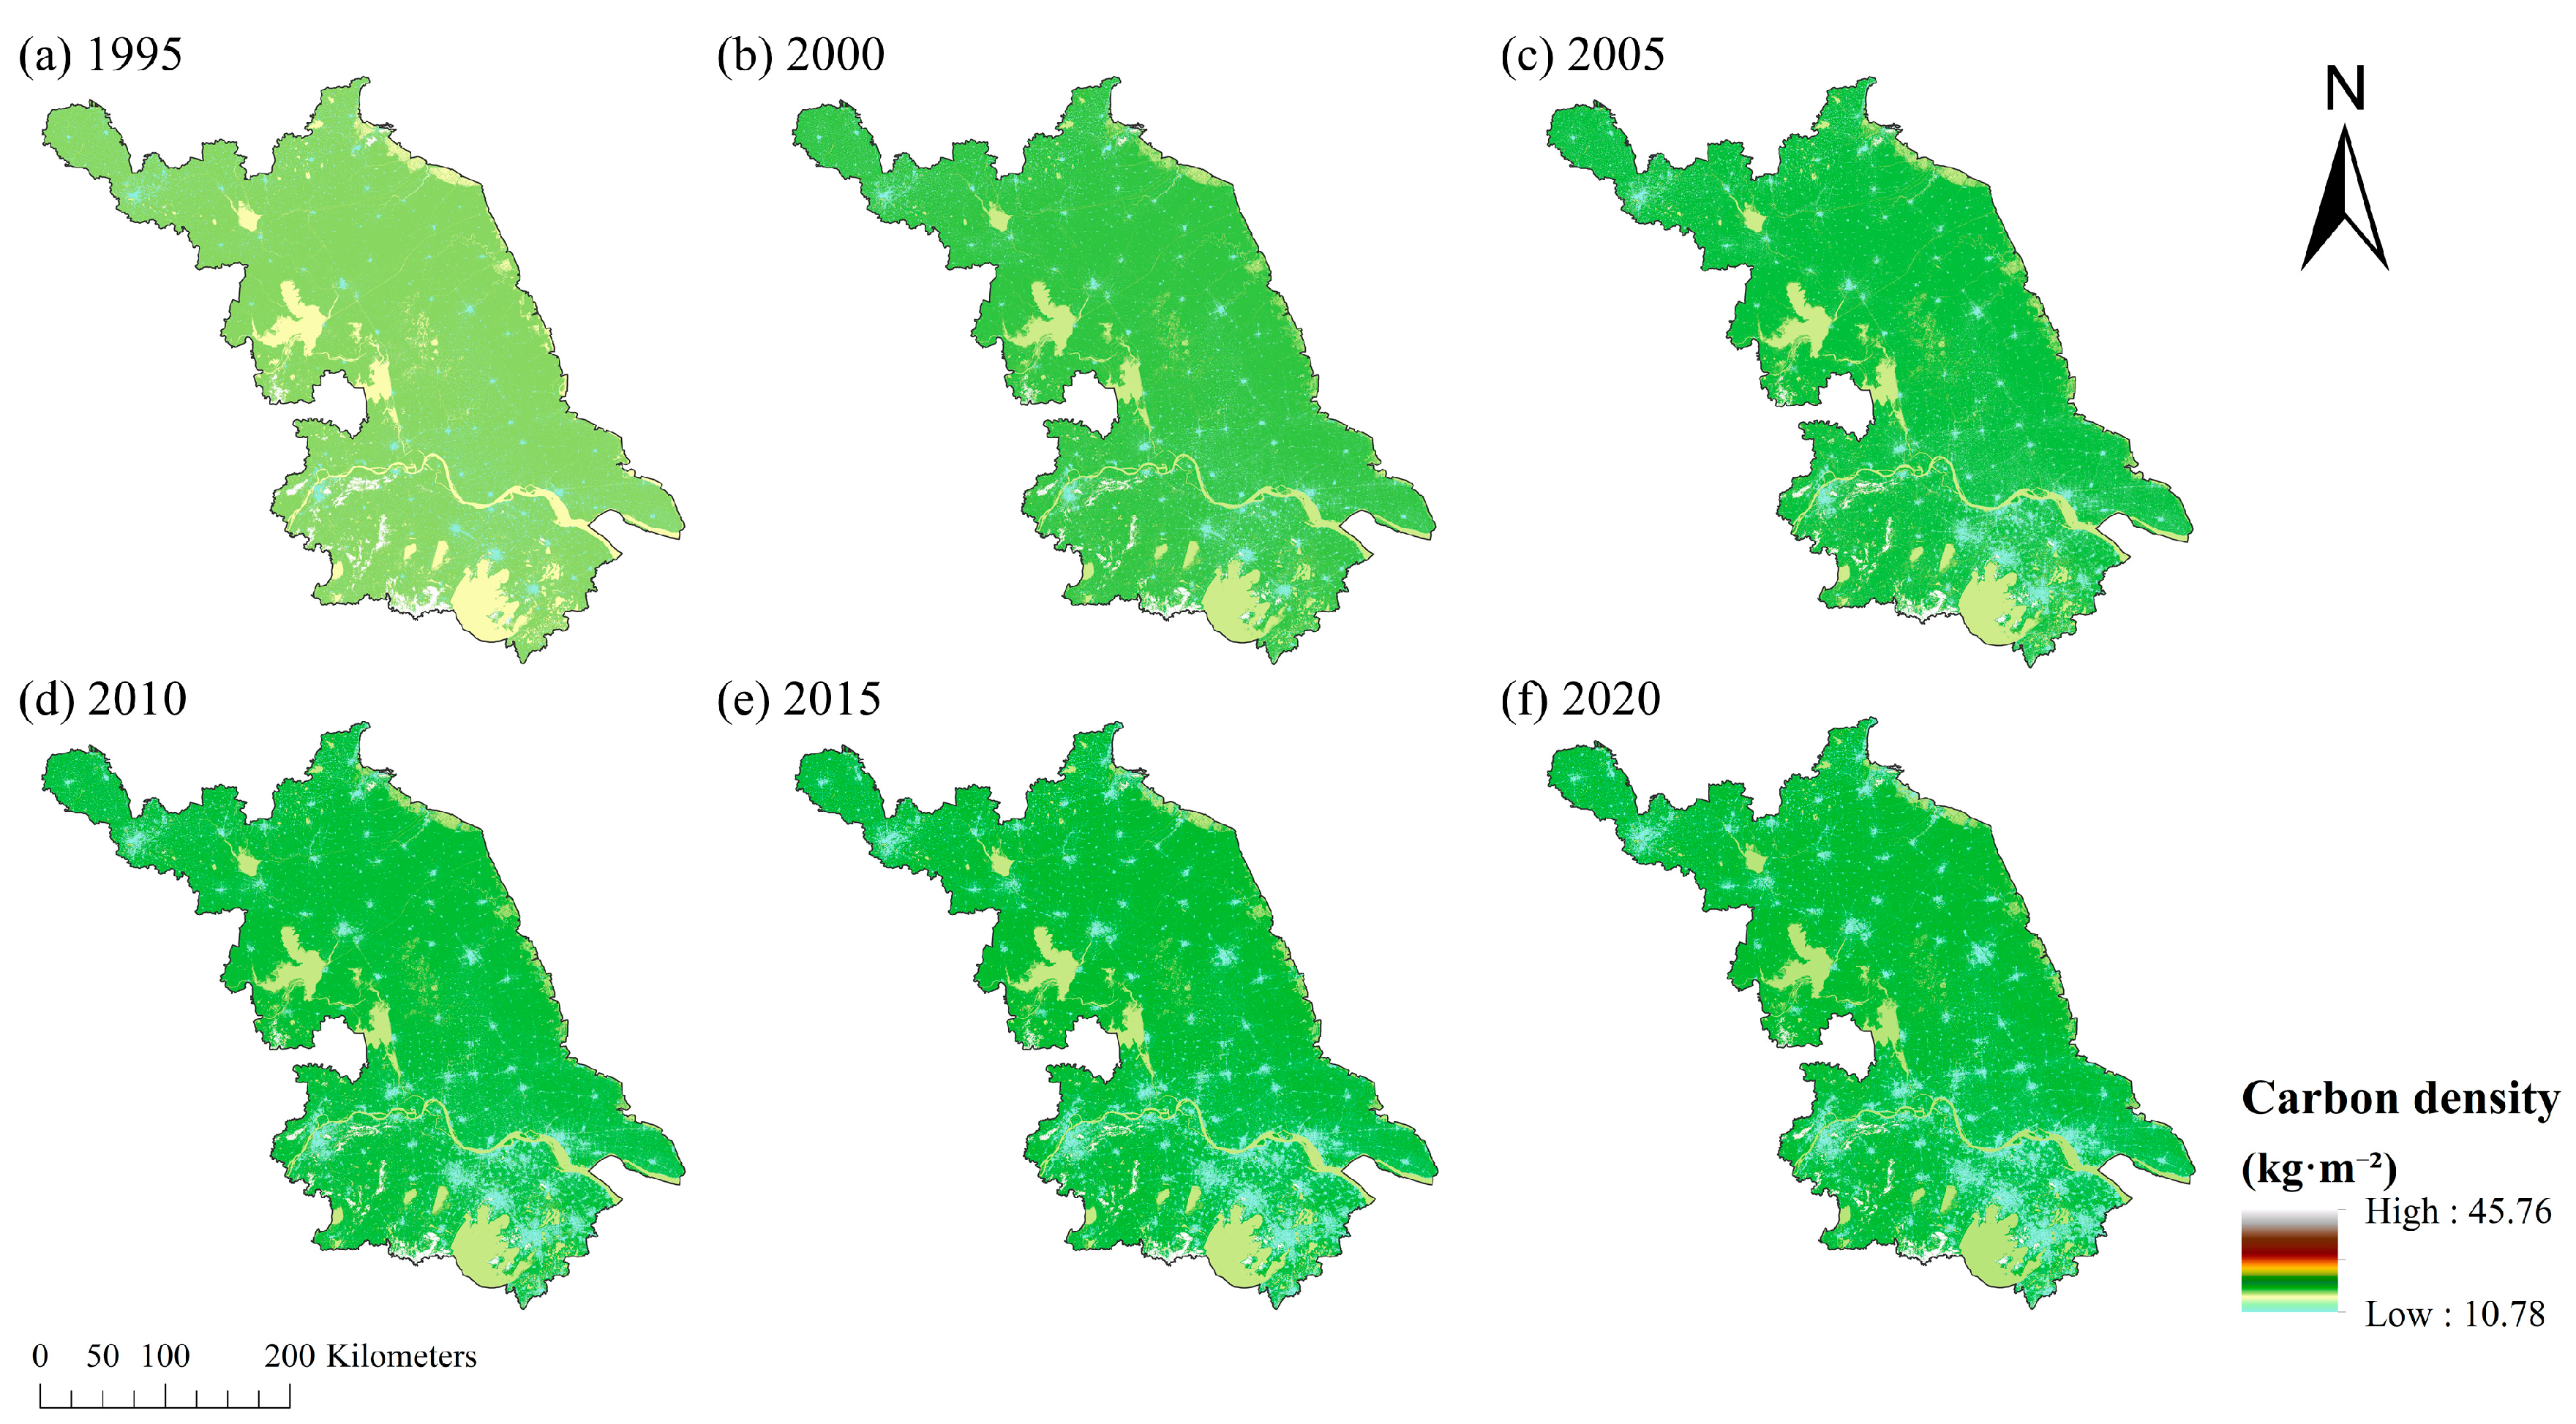
3.2. Spatiotemporal Changes in Carbon Stocks in Jiangsu from 1995 to 2020

From 1995 to 2020, the carbon capacity in numerous land use types in Jiangsu Province experienced critical changes (Table 4). Generally, the Jiangsu area experienced a nonstop decrease in carbon capacity, with an aggregate diminishment of 36.686 Tg. This perspective emphasizes how changes in land use can greatly impact the ability of ecosystems in the area to store carbon.
Among the different land use types, farmland lost the most carbon storage, with a total decrease of 119.417 Tg, accounting for the vast majority of the total decrease (Figure 4). This decline was primarily concentrated in two periods, 1995–2005 and 2015–2020, during which the carbon storage in cropland decreased by 34.337 Tg and 51.619 Tg, respectively. This means that the ongoing loss of farmland is the main reason why the ability to store carbon is decreasing. The forest land has been storing less carbon, showing a total decrease of 19.768 Tg. Although there was a temporary increase of 2.105 Tg in carbon storage between 2005 and 2010, this was not sufficient to reverse the overall declining trend, suggesting that the quality and connectivity of forest resources may not have been effectively improved. Grassland experienced a relatively smaller decrease in carbon storage, with a cumulative reduction of 5.586 Tg. However, the decline was more pronounced during the 2005–2010 period (−1.537 Tg), indicating a weakening of its carbon sequestration function.
In contrast, water area and built-up land saw significant increases in carbon storage, with increases of 23.14 Tg and 83.842 Tg, respectively. The rise in developed land was especially clear between 2015 and 2020. (+36.03 Tg), primarily due to the expansion of urban areas. The carbon storage in unused land changed little, with an overall increase of only 1.103 Tg.
Overall, the advancement of land use structure in Jiangsu Territory has reached a net diminishment in carbon capacity, primarily due to the decay within the carbon sequestration capacity of cropland and forestland. In spite of the fact that built-up areas and water bodies compensated for some of the carbon sequestration setbacks to a certain degree, their carbon thicknesses, which were, for the most part, lower compared to normal environmental areas, made it difficult to completely balance the carbon capacity setbacks caused by the debasement of environmental areas. This underscores the significance of reinforcing the assurance of environmental areas and enhancing carbon capacity potential within the setting of the “dual carbon” objectives.
The way carbon density was spread out and changed in Jiangsu Province from 1995 to 2020 is shown visually (Figure 5). Overall, carbon density exhibited significant regional disparities in space and displayed stage-wise changes over time, reflecting the combined impacts of land use changes, ecological restoration projects, and human activities. In 1995, high carbon density areas were mainly found in the hilly forest regions of southern Jiangsu and the areas along the river with higher forest cover, while the plains of northern Jiangsu and the coastal regions showed relatively lower carbon storage capacity. Between 2000 and 2005, the overall spatial pattern of carbon density distribution remained relatively stable, with slight increases in some forested areas, which were associated with policies such as reforestation and ecological construction implemented at that time. From 2005 to 2015, high carbon density areas in some local regions were enhanced, especially in the transitional zones between cities and the countryside and in areas with uneven forests and grasslands, indicating an improvement in vegetation cover and the carbon sequestration function of ecosystems. However, high carbon density areas were still mainly concentrated in original forest areas and regions with low human disturbance, with no fundamental change in spatial distribution. By 2020, the amount of carbon in the air in some areas of central and southern Jiangsu had decreased significantly. This change was strongly linked to the quick growth of buildings and developed land in those places. The shrinking of areas with a lot of carbon, like farms and forests, shows that these high-carbon places are quickly changing into low-carbon areas where buildings are. This change affects how much carbon these ecosystems can store.
Overall, the evolution of carbon density in Jiangsu Province from 1995 to 2020 showed a characteristic pattern of “initial improvement followed by decline”, with its spatial pattern being significantly influenced by urbanization and land use changes. This result shows the balance between economic growth and saving carbon in the environment. It indicates that Jiangsu Province should improve its ability to store carbon by planning land use better and protecting the environment to manage land resources sustainably while meeting the “dual carbon” goals.

3.3. Spatial Autocorrelation Analysis

To quantitatively recognize the overwhelming components affecting territorial spatial differentiation and to uncover the interaction components among these components, this study utilized the Geodetector strategy to conduct Figure Finder and Interaction Finder examinations (Figure 6). Based on the genuine conditions of the considered zone and the accessibility of information, a driving calculation file framework for the spatiotemporal separation of carbon capacity was built from three measurements: normal, social, and openness. The variables included are X1 (populace), X2 (GDP), X3 (nighttime light), X4 (rise), X5 (slant), X6 (angle), X7 (remove to water bodies), X8 (remove to streets), and X9 (distance to railroads).
The findings reveal that socio-economic variables exhibit stronger interpretative capacity. In particular, the q-statistic associated with GDP (X2) reaches 0.68, the highest among all considered indicators, suggesting that economic development serves as the principal influencing factor in shaping the spatial pattern of the research object. The q-value for the nighttime light index (X3) is 0.64, showing a strong consistency with GDP, reflecting the spatial coupling relationship between human activity intensity and economic activity levels. The q-value for population density (X1) is 0.45, also exhibiting strong explanatory power, further emphasizing the role of population agglomeration in shaping regional spatial patterns. In contrast, the q-values for natural geographical factors are generally lower. The q-values for slope (X5) and aspect (X6) are 0.39 and 0.32, respectively, and although they are not as high as the economic variables, they still show a certain degree of influence, indicating that topographical conditions have a structural constraining effect on spatial differentiation. The q-value for elevation (X4) is 0.26, with a relatively limited individual contribution. The accessibility variables (X7: distance to water bodies, X8: distance to roads, and X9: distance to railways) all have q-values below 0.15, indicating that their explanatory power for spatial heterogeneity is weak when considered individually, and their role in interaction terms needs further investigation.
The interaction detection results further reveal the widespread existence of nonlinear enhancement interaction mechanisms among the factors. The interaction q-values for nearly all sets of components are higher than the most extreme q-value of the person variables, showing that spatial separation is not driven by a single factor but is the result of the combined impact of numerous variables. For example, the interaction q-value for GDP and aspect (X2∩X6) is 0.82, significantly higher than the individual q-values of 0.68 and 0.32, indicating that the impact of economic development on spatial patterns varies and is enhanced under different topographical conditions. The interaction q-value for nighttime light and slope (X3∩X5) is 0.74, also significantly higher than the individual q-values, indicating a synergistic regulatory effect between human activities and natural topography. In addition, the interaction q-values for multiple variables combined with population density (X1) also show an enhancement trend, reflecting the multiple regulatory effects of population as a fundamental social factor on spatial differentiation.
In summary, the formation of regional spatial patterns is not dominated by a single factor but is a complex process driven by multiple sources and nonlinear interactions. Socio-economic factors dominate spatial heterogeneity, while natural geographical and spatial location factors further enhance spatial differentiation through synergistic effects. The above conclusions provide a theoretical basis and empirical support for the selection of driving variables in subsequent scenario simulations.

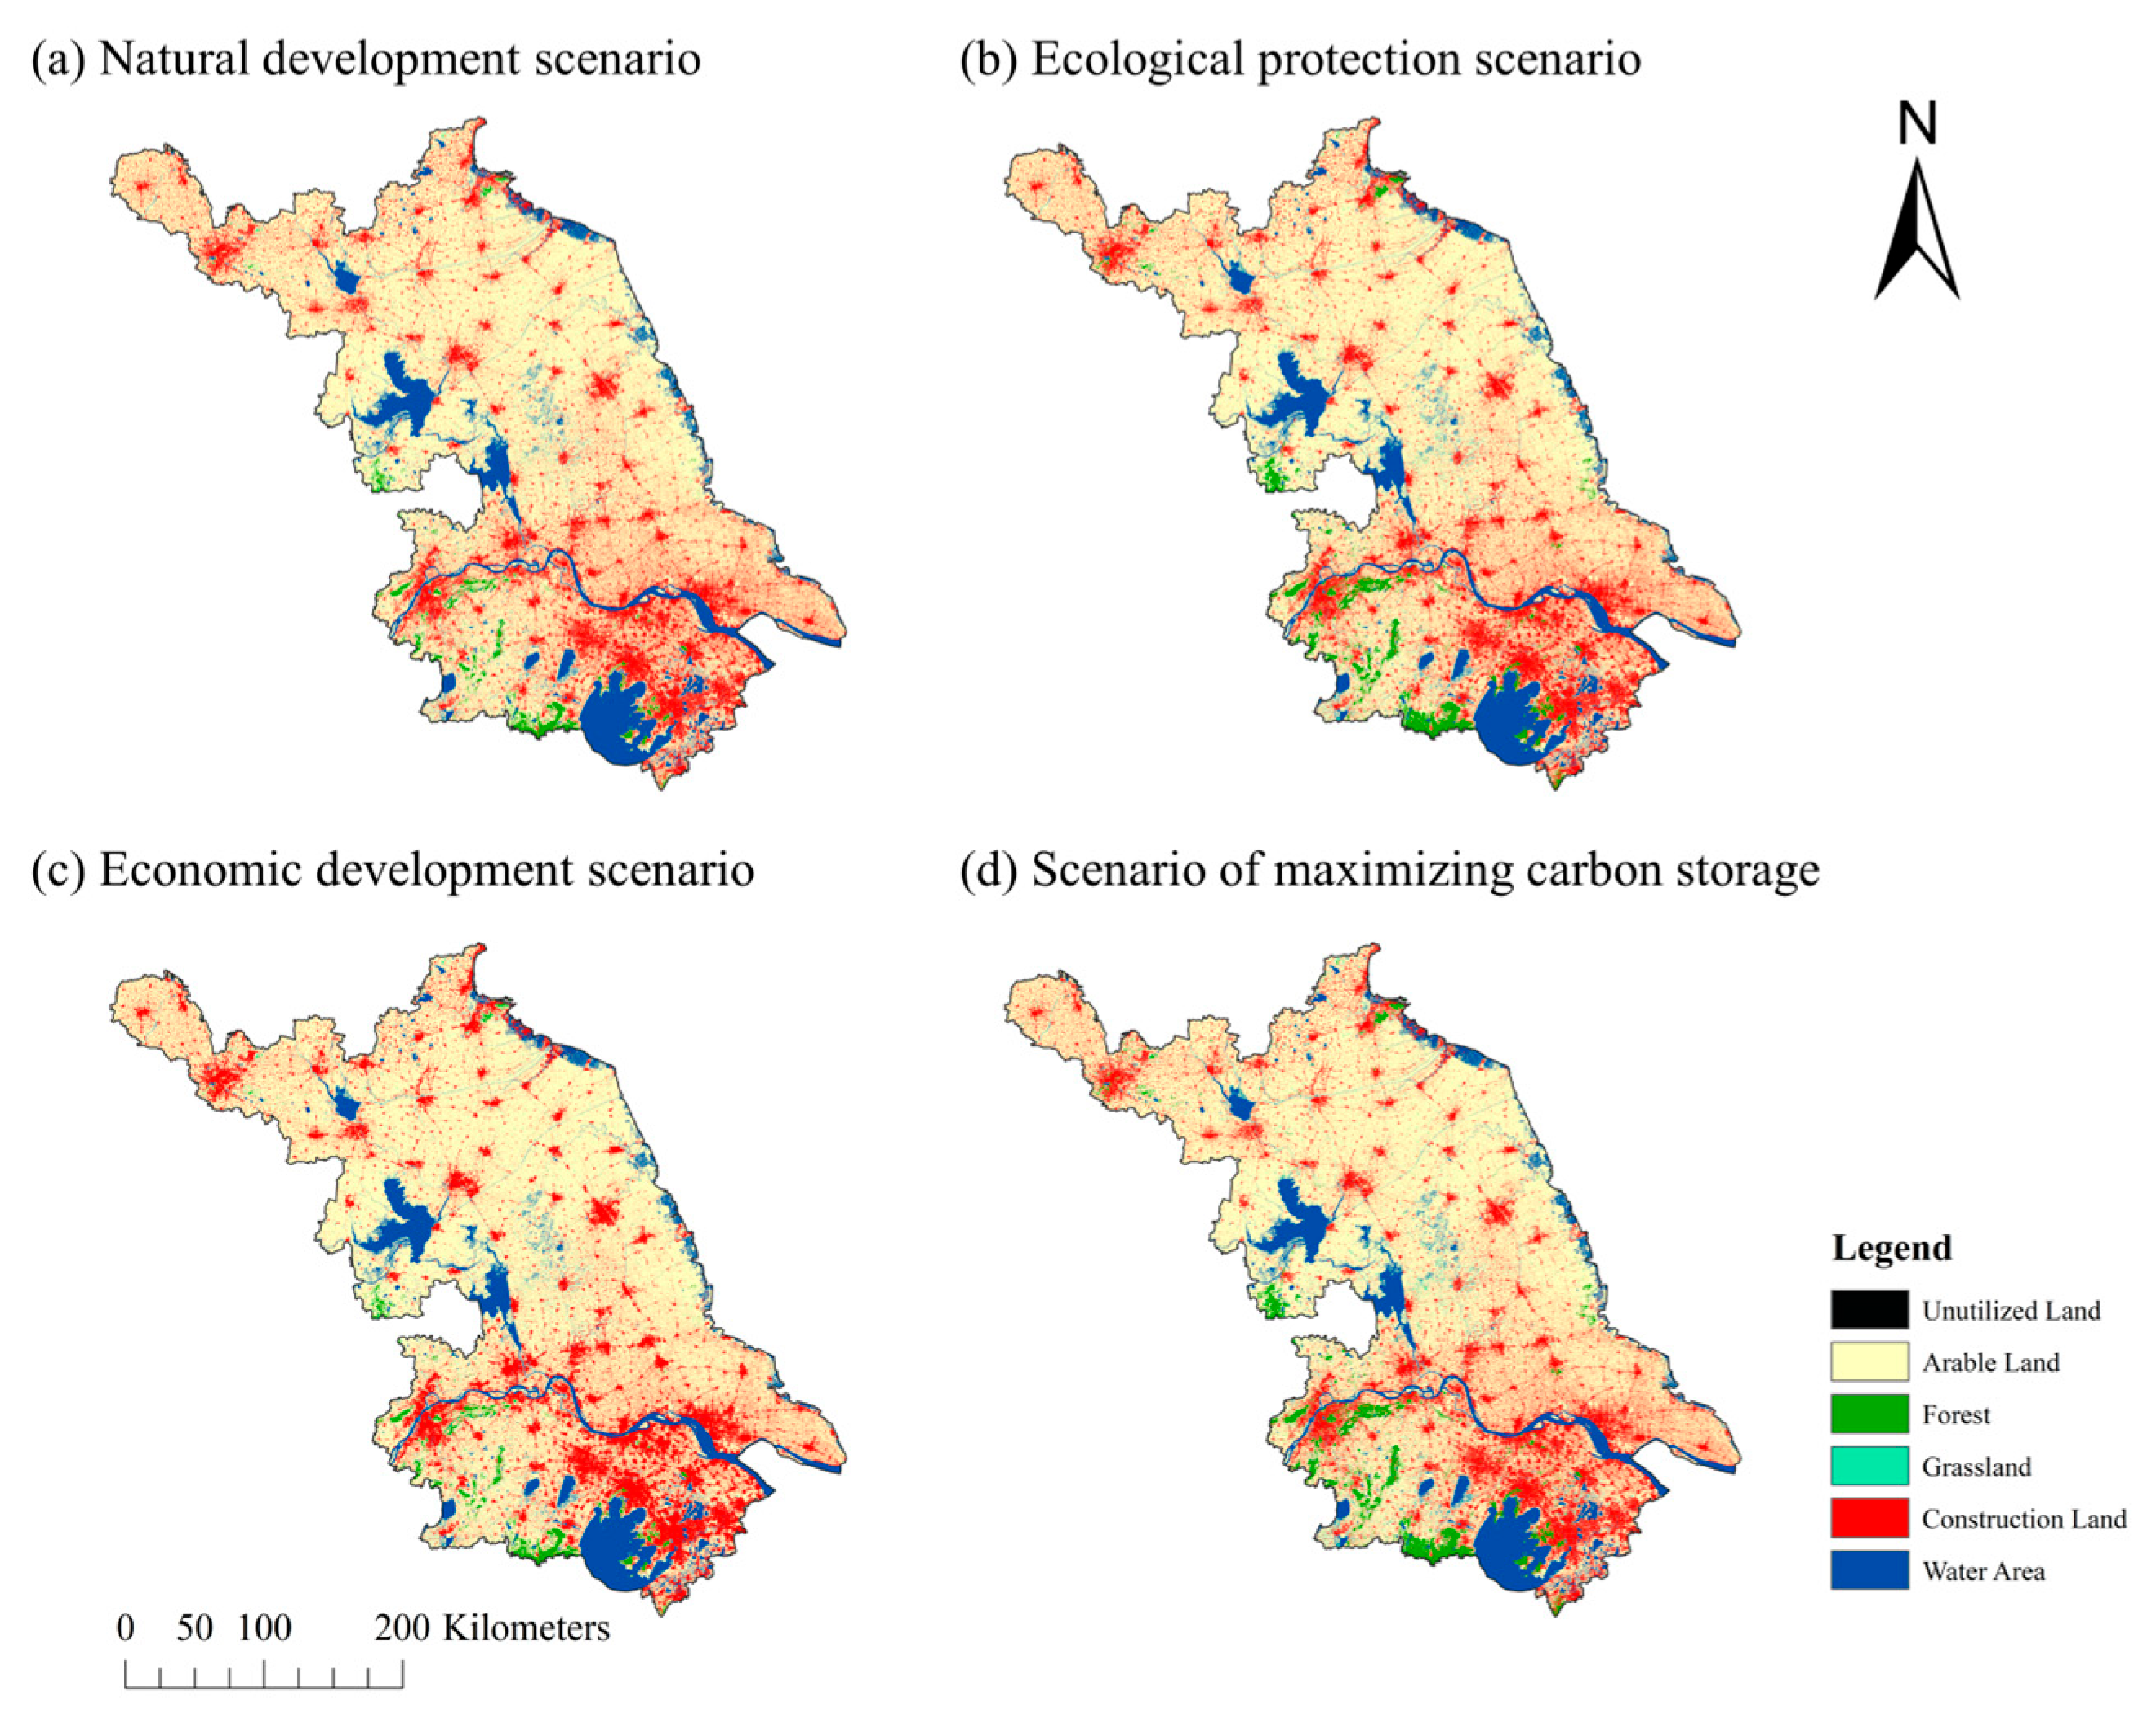
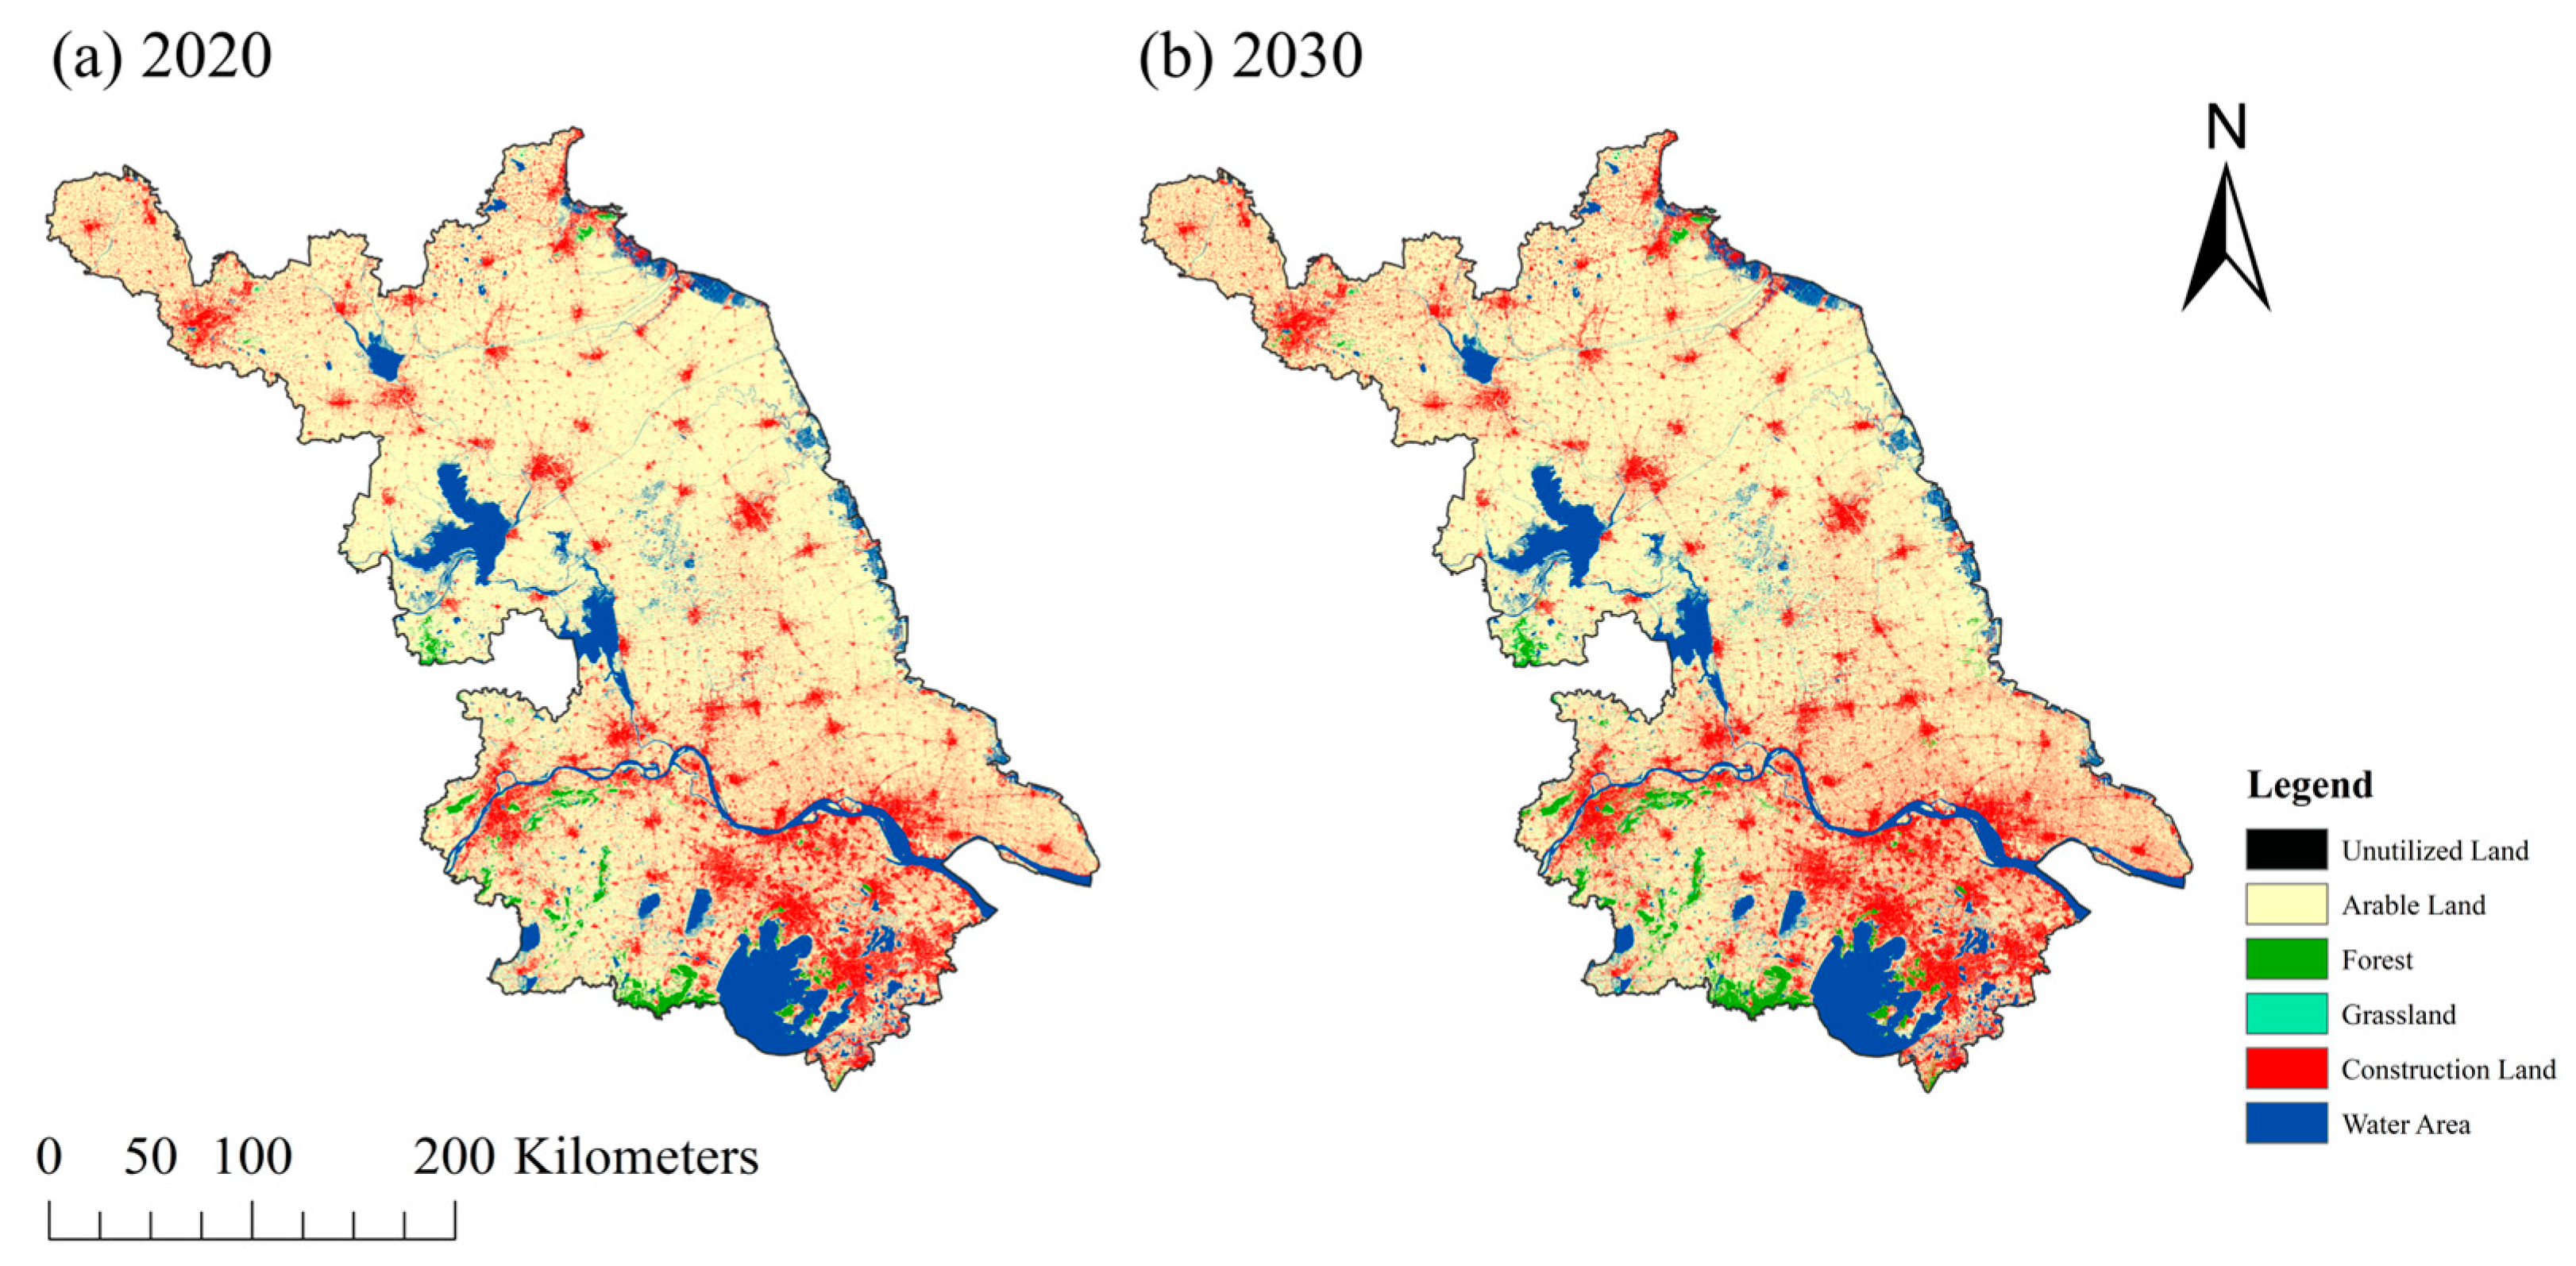
3.4. Land Use and Cover Changes in 2030 Under Different Development Scenarios

Based on different urban development scenarios, various constraints were set to predict the land use situation in 2030 (Table 5). This study calculated the development trend of each land use type based on the historical changes from 2010 to 2020 (Figure 7), which represents the number of patch changes (NOPCs) per pixel. Under the Natural Development Scenario, historical evolution trends continued, with the cropland area remaining relatively high (60,573 km2). However, the proportion of ecological land was low, and the built-up land expanded to 23,571 km2, indicating that without mandatory regulations, ecological space is easily squeezed out. The Ecological Protection Scenario increased forestland (5287 km2) and grassland while reducing built-up land (20,336 km2), thereby strengthening ecological land allocation. This reflects the policy effect of “ecology first, rigid constraints.” The Economic Development Scenario prioritized maximizing built-up land (26,927 km2), with ecological and cropland areas at the lowest or second-lowest levels, showing the significant occupation of ecosystem space by high-intensity development. The Carbon Storage Maximization Scenario expanded forestland (6615 km2), grassland, and water bodies to build an ecological space structure aimed at enhancing carbon sinks. Built-up land was strictly limited (21,943 km2), reflecting a spatial strategy for optimizing ecosystems’ carbon storage function. The 2030 land use simulations under different scenarios are shown in Figure 8. The Integrated Scenario achieved a relatively coordinated allocation among the different land use types, with cropland, built-up land, and forestland at 56,840 km2, 23,285 km2, and 6467 km2, respectively. It balanced ecological protection, cropland security, and moderate development, showing strong practical feasibility.

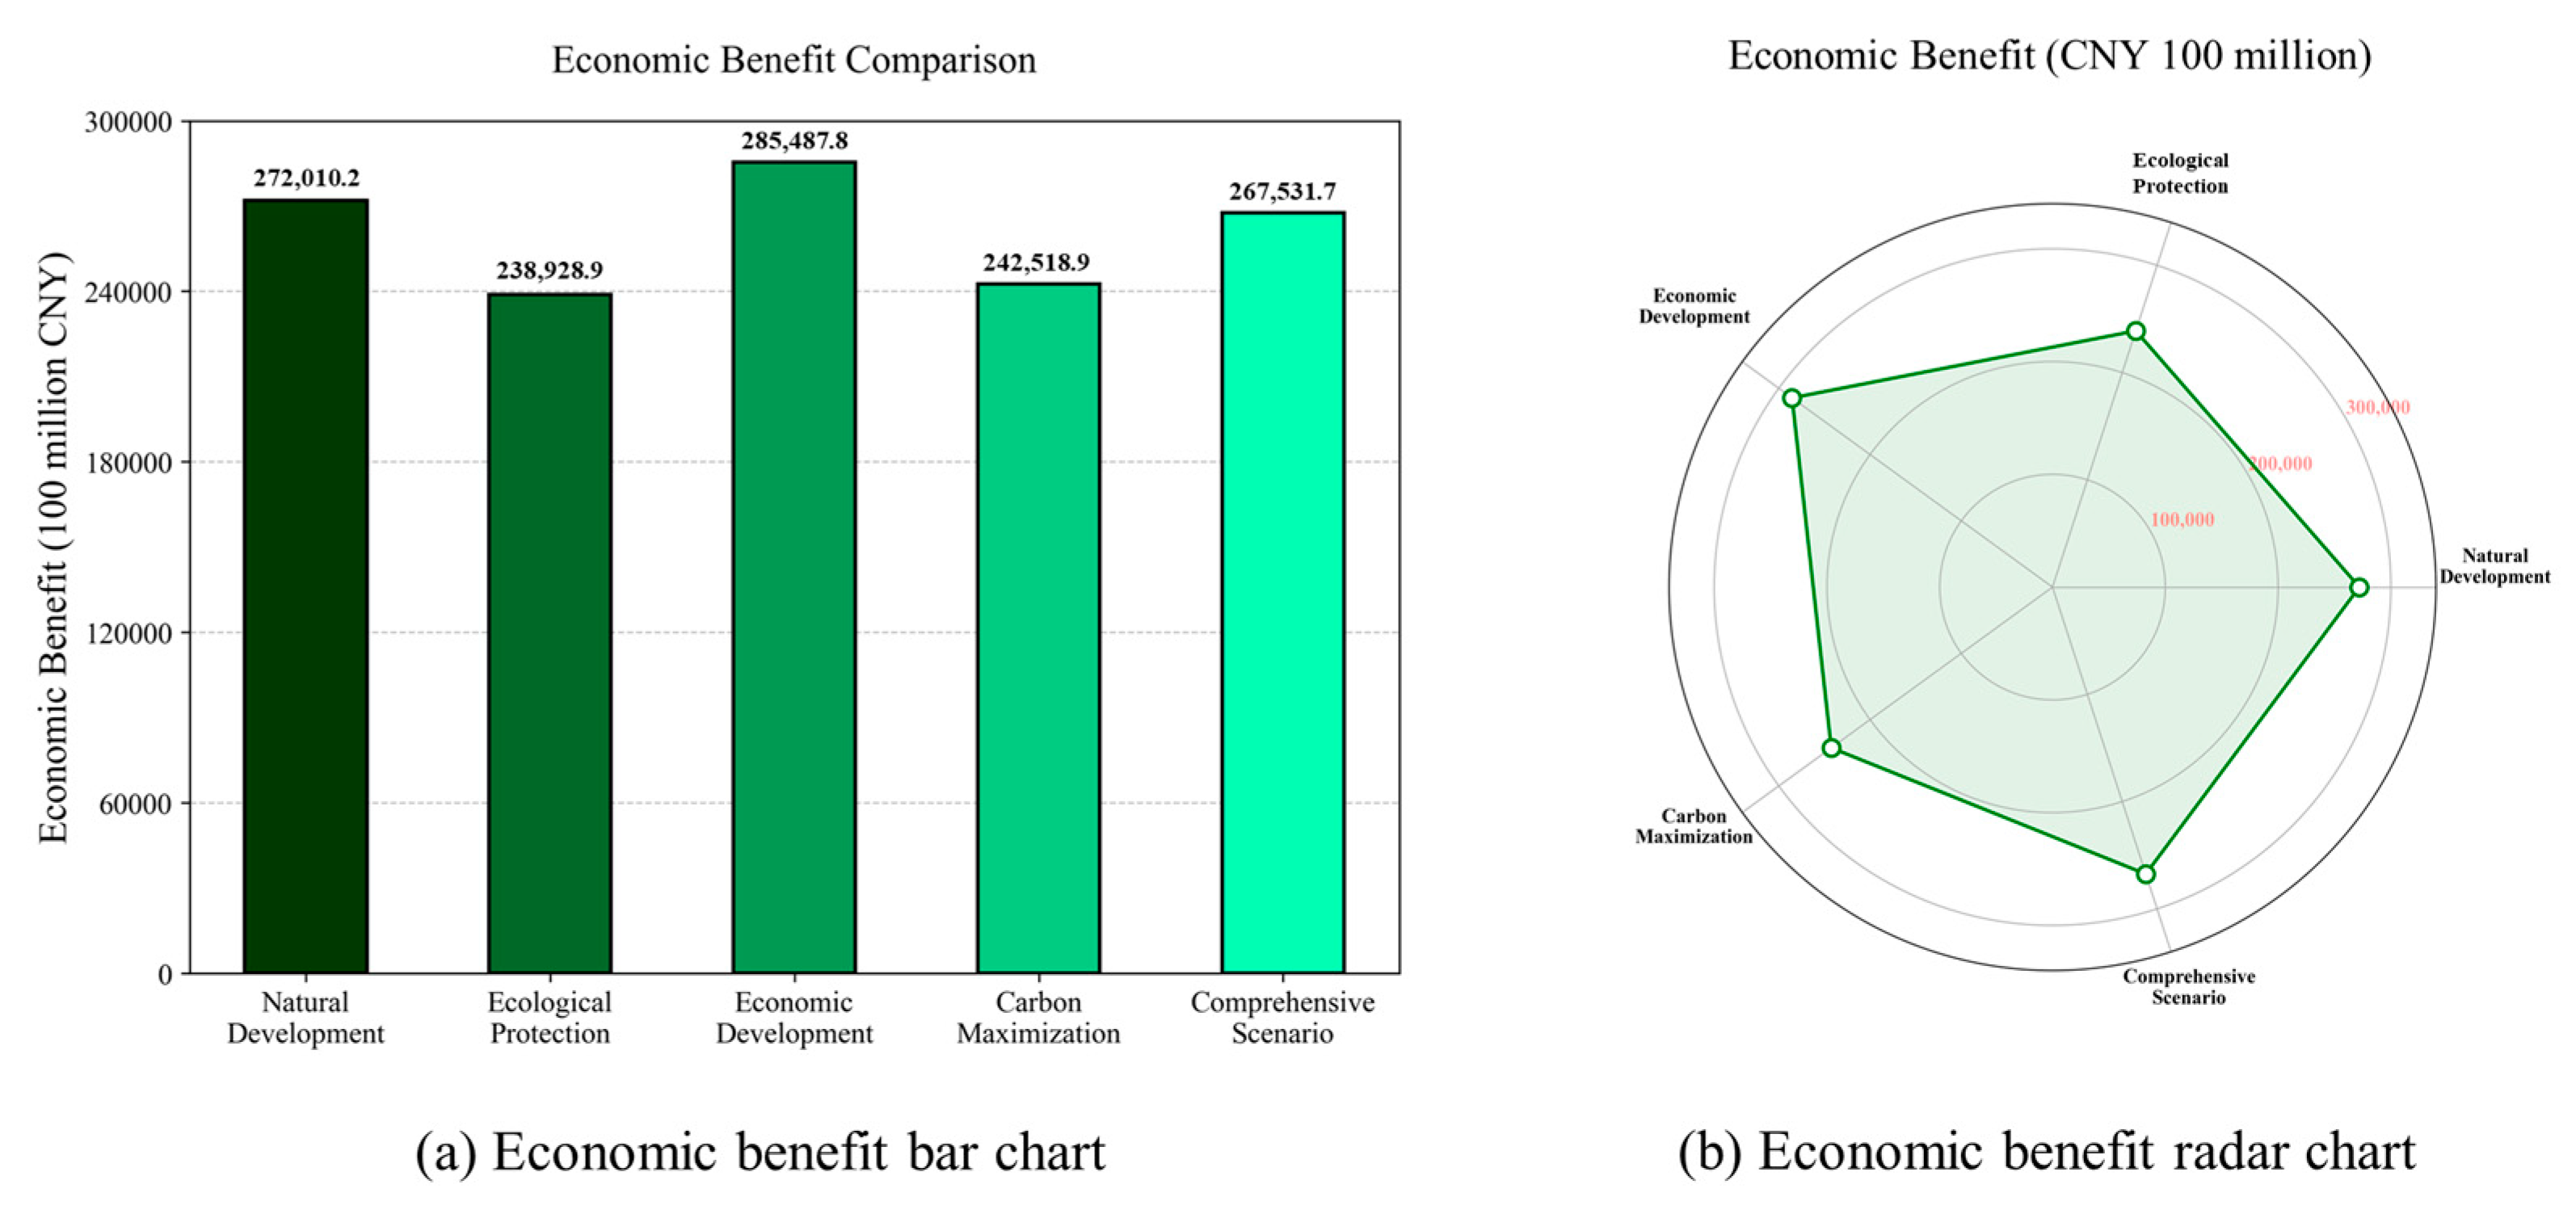
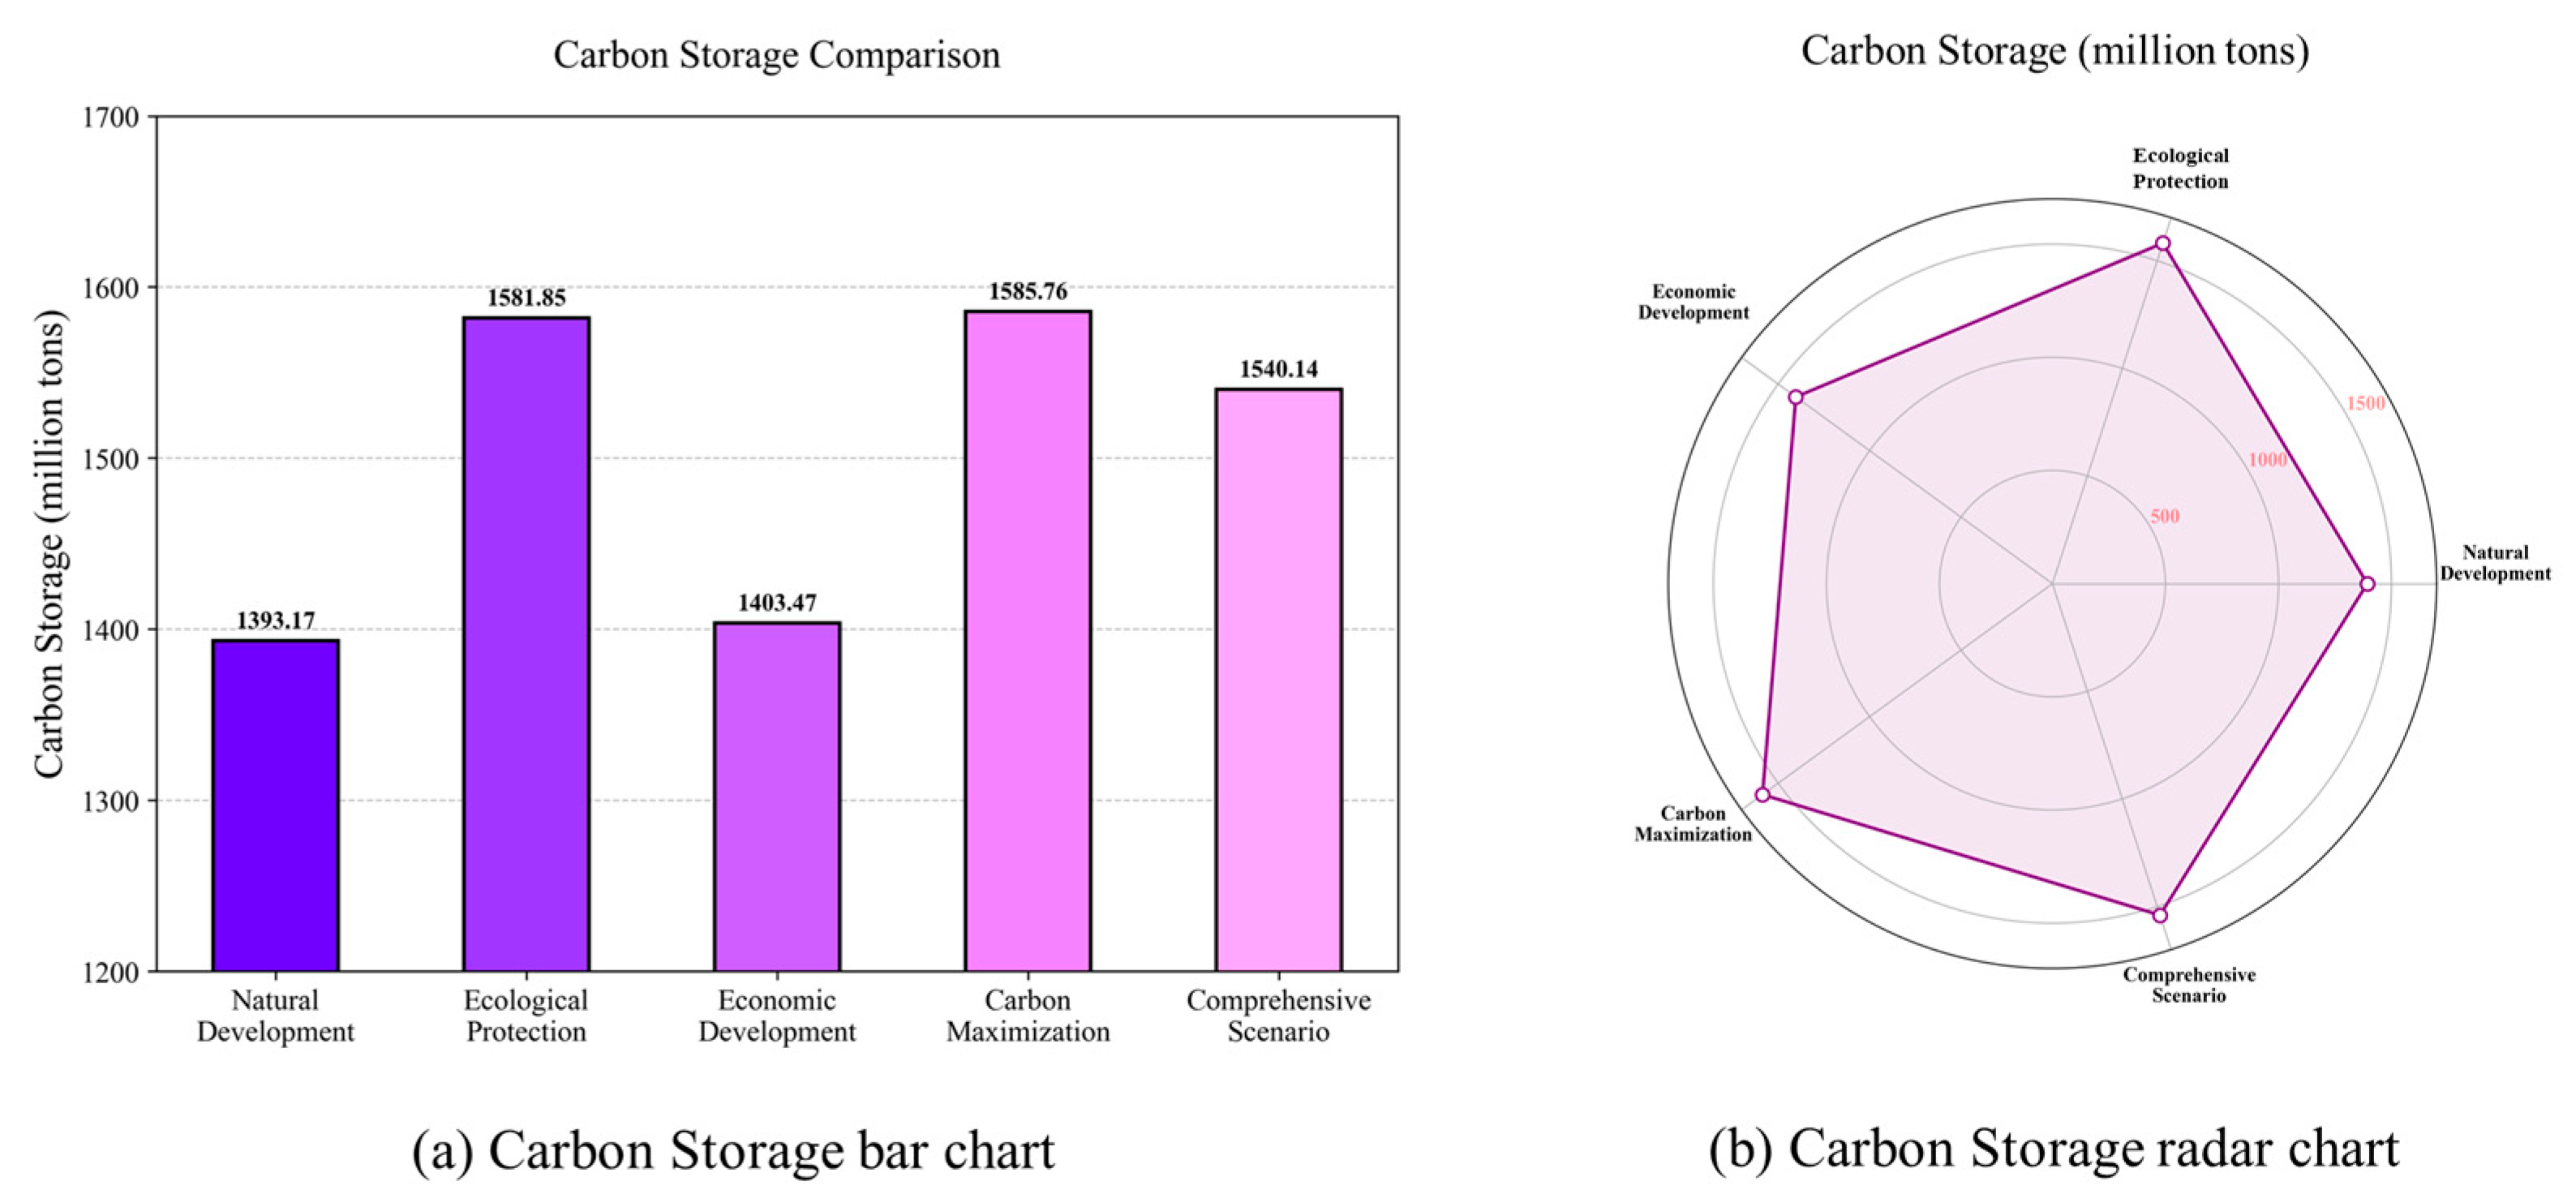
3.5. Benefits Under Different Development Scenarios in 2030

An analysis was conducted on the benefits and carbon storage in Jiangsu Province under different development scenarios for the year 2030 (Table 6). The results demonstrate that the Environmental Assurance Situation and the Carbon Capacity Maximization Situation performed the best in terms of environmental benefits and carbon capacity. Specifically, the Carbon Storage Maximization Scenario achieved a carbon storage of 1585.761 Tg and ecological benefits of CNY 148.064 billion, which are the highest and second-highest values among all the scenarios, respectively. This demonstrates that optimizing the allocation of ecological land can significantly enhance the capacity of ecosystem services and carbon sequestration. Under the Ecological Protection Scenario, the carbon storage reached 1581.846 Tg, with ecological benefits amounting to CNY 157.624 billion, the highest ecological benefit among all scenarios. This reflects the significant gains in ecosystem services brought about by the expansion of ecological space.
In contrast, the Economic Development Scenario topped the list with an economic benefit of CNY 2854.878 billion. However, its ecological benefits (CNY 68.164 billion) and carbon storage (1403.468 Tg) were at relatively low levels. This suggests that while high-intensity development models may contribute to short-term economic growth, they come at the cost of sacrificing ecosystem services and carbon storage capabilities. The Natural Development Scenario, which continues historical trends, showed mid-to-low levels in all three indicators, indicating that without proactive intervention, the land system struggles to balance multiple development goals.
The Integrated Scenario performed well across all three types of indicators, with ecological benefits of CNY 119.952 billion, economic benefits reaching CNY 2675.317 billion, and carbon storage at 1540.144 Tg, values that are close to the optimal range. This scenario reflects a balanced synergy between ecological protection and economic development, representing a relatively optimal solution under multi-objective coordination.
In summary, there are significant differences in the performance of multiple objectives across the different scenarios, leading to varying trends in the land use system in response to different policy orientations and development paths (Figure 9, Figure 10 and Figure 11). The Carbon Storage Maximization and Ecological Protection Scenarios contribute to enhancing carbon sequestration capabilities and ecosystem service functions, while the Economic Development Scenario emphasizes economic output, potentially at the expense of ecological degradation. The Integrated Scenario offers a feasible balanced solution, providing decision-making references and path guidance for Jiangsu Province to achieve eco-economic optimization under the “dual carbon” goals.

3.6. Land Use and Low-Carbon Optimization

Land use and low-carbon optimization ought to not come at the cost of financial and social improvement; instead, it ought to consider the natural solidarity of financial and social improvement, biological environment assurance, and low-carbon objectives. Based on the genuine circumstance of land use in Jiangsu Territory and in combination with the national spatial arrangement of different cities and provinces within the considered region, this study utilized land use information from 1995 to 2020 and the necessary areas of land use types to achieve low-carbon scenarios. Significant parameters and driving components were set, and a model was utilized to mimic the low-carbon spatial layout of land use within the studied zone under the requirements for 2030, as shown within the figures.
Figure 12 displays the land use spatial patterns of Jiangsu Province in 2020 and under the Integrated Scenario for 2030, along with a detailed comparison of the selected areas. The simulation results from the PLUS model indicate that, while continuing the existing trend of land development, the Integrated Scenario effectively coordinates the goals of ecological protection and urban development, achieving a harmonious optimization of land use structure and spatial layout. In terms of overall pattern changes, under the Integrated Scenario for 2030, although built-up land still experiences moderate expansion, mainly concentrated around the core urban agglomerations in southern and central Jiangsu, the scope of expansion is more rational compared to the period from 1995 to 2020 and is superior to the disorderly sprawl seen under natural evolution scenarios.
Regarding ecological land, the dispersion of forestland, prairie land, and water bodies has been re-established and improved compared to 2020, particularly in the plains and hilly areas of the middle and lower reaches. Ecological land exhibits characteristics of spatial continuity and functional integration. The detailed maps further reveal that in the Nanjing Metropolitan Area, the Suzhou–Wuxi–Changzhou urban agglomeration, and some rivers and lakes in dense areas in northern Jiangsu, the integrity and continuity of ecological patches have been significantly strengthened, which is conducive to enhancing the stability of the regional ecological network and carbon storage capacity. As for cropland, although there is some reduction at the urban fringes, the Integrated Scenario, through rational control of the total amount of built-up land and optimization of non-built-up land allocation, has basically maintained the red line of cropland and the structural stability of cropland area across the province, reflecting an effective response to food security and land protection policies.
Overall, the land use pattern under the Integrated Scenario for 2030 has achieved an optimized upgrade of spatial structure compared to 2020. It has not only curbed the expansion of built-up land but also enhanced the systematic and functional nature of ecological land. The land use structure under this scenario better meets the coordinated development needs of ecological, economic, and carbon storage goals. It gives a commonsense and educational reference for land use area administration and high-quality advancement in Jiangsu Territory beneath the “dual carbon” setting.

4. Discussion

Jiangsu Province, as an economically advanced and densely populated coastal province in China, holds significant strategic importance in achieving the national “dual carbon” goals (carbon crest by 2030 and carbon neutrality by 2060). To explore effective pathways for land use planning in this context, this study utilized the PLUS-InVEST model to re-create land use changes under five scenarios: common improvement, financial advancement, biological assurance, high carbon capacity, and coordinate improvements [37]. The impacts of these scenarios on carbon storage, ecological benefits, and economic benefits were systematically assessed. The results provide valuable insights into how land use planning can support regional policy objectives, address potential implementation challenges, and optimize land use for sustainable development.
Land use planning in Jiangsu Province is shaped by a set of spatial strategies that define areas for urban, agricultural, and ecological purposes. These policies establish boundaries and impose regulations, including those for ecological conservation, designated permanent farmland, and restrictions on urban expansion. These policies establish multi-objective targets for 2030, including maintaining a certain scale of cropland, protecting the ecological functions of water bodies, and reducing the area of unused land. Additionally, regional policies emphasize enhancing carbon sequestration capacity through afforestation and urban greening, aligning with national commitments for ecological restoration and climate mitigation [38]. These goals provide a structured foundation for optimizing land use and balancing economic growth, ecological protection, and carbon management, creating favorable conditions for the implementation of the various scenarios simulated in this study.
The scenarios presented in this study uncover critical contrasts within the impacts of diverse land use designs on carbon capacity and biological system administrations. The Integrated Scenario performs best in balancing ecological, economic, and carbon storage goals. The Ecological Protection and High Carbon Storage Scenarios achieved carbon storage of 1581.846 Tg and 1585.761 Tg, respectively, far exceeding the 1403.468 Tg in the Economic Development Scenario. This indicates that expanding forest and grassland areas can significantly enhance carbon sequestration capacity. These results are highly consistent with regional afforestation goals, validating the key role of ecological space protection in enhancing carbon storage. The Integrated Scenario, through optimized ecological land allocation, not only meets cropland protection requirements but also significantly enhances ecological benefits (CNY 1576.24 billion, far exceeding the CNY 681.64 billion in the Economic Development Scenario) while maintaining economic vitality. In contrast, the Economic Development Scenario, despite achieving the highest economic output (CNY 285,487.8 billion), sees a significant reduction in ecological space and a decline in carbon storage and ecological benefits, contradicting policy requirements to control urban sprawl. The Integrated Scenario, by restricting urban land expansion, aligns with regional constraints on urban development boundaries, providing a feasible path for sustainable urbanization. Moreover, all scenarios consider the baseline for cropland protection, with the Integrated and Ecological Protection Scenarios further safeguarding food security through optimized agricultural space allocation, consistent with policy principles prioritizing agricultural space protection.
Despite the alignment of research results with policy goals, several challenges exist in actual implementation. The Ecological Protection and High Carbon Storage scenarios significantly enhance carbon storage by converting some cropland to forestland, which may exert pressure on food production. As an important agricultural province, Jiangsu needs to balance ecological restoration with food security to avoid risks to regional stability. The Economic Development Scenario illustrates that the pursuit of short-term economic gains may sacrifice long-term ecological benefits, highlighting the necessity for policy intervention. For example, promoting agroforestry and urban greening through fiscal incentives or ecological compensation mechanisms can enhance carbon sequestration capacity without reducing cropland area [39,40]. Additionally, regional disparities within Jiangsu pose a significant challenge. This study shows that southern Jiangsu has a high degree of urbanization and faces significant urban expansion pressure, while northern Jiangsu has richer ecological space suitable for large-scale ecological restoration. Policies need to be tailored to local conditions: southern Jiangsu can enhance carbon storage through urban green spaces and vertical greening, while northern Jiangsu should prioritize restoring wetlands and forests to maximize the regional carbon sequestration potential [41].
The innovation of this study lies in constructing a three-dimensional assessment framework that covers ecological benefits, economic output, and carbon storage and evaluating the comprehensive effects of different development paths through multi-scenario simulation. Compared with traditional studies focusing solely on carbon storage or ecological protection, this study provides a more comprehensive decision-making support tool. The Integrated Scenario indicates that strategic optimization of land use structure can enable Jiangsu to achieve carbon peaking before 2030 while enhancing ecosystem services and economic resilience. From a policy perspective, the study results provide insights into the following aspects: further implementation of ecological protection constraints; prioritizing the restoration of land use types with high carbon sequestration potential such as forests and wetlands; adopting multi-objective optimization models to integrate economic, ecological, and social goals and avoid the limitations of single development paths; and promoting innovative land use patterns such as agroforestry and urban greening to achieve multiple benefits within limited land resources. These recommendations are consistent with the implementation direction of regional spatial planning and provide a scientific basis for policy implementation [42,43].
Future research can further expand in several directions to enhance application value in the following ways: first, exploring the dynamic interaction between land use changes and climate change by incorporating climate prediction models to assess long-term sustainability, and second, by integrating demographic dynamics, technological progress, and other socio-economic factors to construct a more comprehensive land use optimization framework. Additionally, regional coordination is another direction, such as through the Yangtze River Delta integration strategy, to coordinate land use policies between Jiangsu Province and neighboring provinces, promoting regional carbon reduction and ecological protection. These studies will further refine the land use optimization pathways proposed in this study, providing more solid theoretical and practical support for achieving the “dual carbon” goals.
In summary, this study validates the effectiveness of Jiangsu Province’s spatial planning framework through the PLUS-InVEST model, providing a scientific tool for future land use planning. The Integrated Scenario demonstrates that strategic land use optimization can achieve synergy between economic growth and ecological protection, in line with regional policy goals. Through policy innovation and regional coordination, Jiangsu can address the challenges of land use trade-offs and make significant contributions to achieving carbon peaking and long-term ecological–economic balance.

5. Conclusions

This study centers on Jiangsu Territory and is guided by the overarching targets of carbon peaking and carbon neutrality. It develops five distinct scenarios for the province’s progression toward 2030: natural growth, environmental conservation, economic expansion, maximized carbon sequestration, and integrated development scenarios. Corresponding objective functions and constraint systems were established for each scenario. Using land use and cover change data from 1995 to 2020, a multi-objective optimization model was developed to examine land use elements in Jiangsu Province. This model joins the advancing relationship between carbon sequestration and land use changes, empowering the modeling and assessment of Jiangsu’s carbon capacity goals inside the system of the “dual carbon” procedure. Additionally, the model was utilized to determine land use results for 2030 under different formative scenarios, measure the commitments of each situation to the accomplishment of carbon-peak and carbon-neutral targets, and evaluate their biological and financial impacts. These results give profitable experiences for future land use optimization in Jiangsu. The key discoveries from this study are as follows.
From 1995 to 2020, the land use pattern in Jiangsu Province underwent significant transformations, marked by notable reductions in cropland and ecological land areas, while built-up land expanded rapidly. This trend reflects the impact of urbanization and industrialization in reshaping the structure of the land use system. Changes in the land use structure led to an overall decline in carbon storage capacity, primarily due to the degradation of carbon sequestration functions in cropland and forestland. These findings suggest that the reduction in ecological space has exerted a substantial negative influence on the carbon storage system.
The scenario simulation results indicate that there are significant differences in land use structure and associated ecosystem services under different development pathways in 2030. The Business-as-Usual Scenario continues the current trend, resulting in weak ecological functions. The Economic Development Scenario, while maximizing economic benefits, significantly reduces ecological land, resulting in lower carbon storage and ecological value. The ecological protection and maximum carbon storage scenarios effectively enhance the carbon sequestration capacity and ecosystem service levels by expanding the scale of forestland, water bodies, and grassland. However, their economic benefits are relatively low. The Integrated Scenario achieves a relatively balanced trade-off between ecological protection and economic growth and is the most feasible multi-objective coordinated optimization solution.
The comprehensive analysis of multiple scenario-based simulations reveals that effectively steering the restructuring of land use patterns and expanding the share of ecological land are crucial strategies for improving carbon storage potential in Jiangsu Province and realizing the carbon peak target. Enhancing the configuration of ecological spaces contributes not only to the reinforcement of carbon sequestration capabilities but also promotes synergies with the establishment of ecological security networks and the fulfillment of sustainability objectives.

Author Contributions

Conceptualization, G.S.; Methodology, Z.T. and G.S.; Software, Z.T., J.L. and D.Y.; Validation, D.Y. and Y.Z.; Formal analysis, Y.W.; Investigation, Z.T., C.C. and D.Y.; Writing—original draft, J.L.; Writing—review & editing, G.S., C.C. and Y.Z.; Visualization, Y.Z.; Supervision, C.C. All authors have read and agreed to the published version of the manuscript.

Funding

This research was funded by the research project of the Observation Research Station of Land Ecology and Land Use in the Yangtze River Delta, Ministry of Natural Resources (No. 2023YRDLELU05) and the 2024 Philosophy and Social Science Research in Colleges and Universities Program in Jiangsu Province (No. 2024SJYB0167).

Institutional Review Board Statement

Not applicable.

Informed Consent Statement

Not applicable.

Data Availability Statement

The data presented in this study are available on request from the corresponding author.

Acknowledgments

The authors acknowledge the data support from the “National Earth System Science Data Center, National Science & Technology Infrastructure of China (http://www.geodata.cn)”. The authors acknowledge policy consulting support from the Institute for Emergency Governance and Policy in Nanjing Tech University. Zhuang Tian is an undergraduate student at the School of Geomatics Science and Technology, Nanjing Tech University. Ge Shi, the corresponding author of this paper, served as Zhuang Tian’s academic supervisor during this research.

Conflicts of Interest

The authors declare no conflicts of interest.

References

  1. Rafique, K.; Abbas, S.; Abbas, H.; Ullah, K. Assaying ramifications of climate change over productivity growth in developing countries. Gondwana Res. 2024, 130, 278–290. [Google Scholar] [CrossRef]
  2. Xi, J. Statement by H.E. Xi Jinping President of the People’s Republic of China at the General Debate of the 75th Session of the United Nations General Assembly. 2020. Available online: https://www.mfa.gov.cn/eng/xw/zyjh/202405/t20240530_11341451.html (accessed on 1 March 2025).
  3. Li, G.; Sun, L.; Ji, S.; Li, X.; Cong, J.; Han, D.; Wang, G.; Gao, C. Low-severity fire promote carbon emissions in permafrost peatlands of the Great Khingan Mountains, Northeast China. Catena 2025, 252, 108870. [Google Scholar] [CrossRef]
  4. Yang, S.; Wen, L.; Zhang, A. The spatiotemporal response of land-use carbon emissions to climate change. Ecol. Indic. 2025, 170, 112893. [Google Scholar] [CrossRef]
  5. Xia, B.; Xiao, J. Carbon emission reduction pathways benefitting from concrete component reuse: A macroscopic perspective. J. Clean. Prod. 2024, 478, 143924. [Google Scholar] [CrossRef]
  6. Chen, Y.; Zhang, C. Characteristics of Spatial–Temporal Evolution of Carbon Emissions from Land Use and Analysis of Influencing Factors in Hubao-Eyu Urban Agglomerations, China. Sustainability 2024, 16, 7565. [Google Scholar] [CrossRef]
  7. Liu, C.; Hu, S.; Wu, S.; Song, J.; Li, H. County-level land use carbon emissions in China: Spatiotemporal patterns and impact factors. Sustain. Cities Soc. 2024, 105, 105304. [Google Scholar] [CrossRef]
  8. Zhao, L.; Zhang, C.; Wang, Q.; Yang, C.; Suo, X.; Zhang, Q. Climate extremes and land use carbon emissions: Insight from the perspective of sustainable land use in the eastern coast of China. J. Clean. Prod. 2024, 452, 142219. [Google Scholar] [CrossRef]
  9. Wei, W.; Li, Y.; Ma, L.; Xie, B.; Hao, R.; Chen, D.; Yang, S. Carbon emission change based on land use in Gansu Province. Environ. Monit. Assess. 2024, 196, 311. [Google Scholar] [CrossRef]
  10. Bacani, V.M.; da Silva, B.H.M.; Sato, A.A.d.S.A.; Sampaio, B.D.S.; da Cunha, E.R.; Vick, E.P.; de Oliveira, V.F.R.; Decco, H.F. Carbon storage and sequestration in a eucalyptus productive zone in the Brazilian Cerrado, using the Ca-Markov/Random Forest and InVEST models. J. Clean. Prod. 2024, 444, 141291. [Google Scholar] [CrossRef]
  11. Crawford, A.F.; Maidment, D.W.; Thebaud, N.; Masurel, Q.; Evans, N.J. A revised stratigraphic model for the~ 1910–1835 Ma Tanami Group, the Northern Territory, Australia: Implications for exploration targeting. Precamb. Res. 2024, 411, 107510. [Google Scholar] [CrossRef]
  12. Prasertsoong, N.; Puttanapong, N. Predicting Urban Land Expansion and Local Economic Growth by Integrating CLUE-S and Economic Model: An Application to Ban Chang District, Thailand. J. Geovisual. Spatial Anal. 2025, 9, 7. [Google Scholar] [CrossRef]
  13. He, P.; Li, X.; Deng, S.; Tu, Y.; Shen, W. Carbon emissions prediction method of industrial parks based on NSGA-II multi objective genetic algorithm. Int. J. Energy Technol. Policy 2024, 19, 286–301. [Google Scholar] [CrossRef]
  14. Karthick, B. Modelling a sustainable supply chain with variable production and ambiguous carbon emission factor using a genetic algorithm. Model. Earth Syst. Environ. 2024, 10, 1941–1958. [Google Scholar] [CrossRef]
  15. Kumar, N.; Bhunia, S.; Dey, P. Data envelopment analysis and multi-objective genetic algorithm based optimization of energy consumption and greenhouse gas emissions in rice-wheat system. Energy 2024, 313, 133680. [Google Scholar] [CrossRef]
  16. Windarto, C.; Lim, O. The operating parameter optimization of spark duration effect on the performance and emission characteristics of direct-injection propane by genetic algorithm. Energy 2024, 311, 133365. [Google Scholar] [CrossRef]
  17. Boiger, T.; Mair-Bauernfeind, C.; Asada, R.; Stern, T. Optimizing the utilization of harvested wood products for maximum greenhouse gas emission reduction in a bioeconomy: A multi-objective optimization approach. J. Environ. Manag. 2025, 373, 123424. [Google Scholar] [CrossRef]
  18. Shi, G.; Wang, Y.; Zhang, J.; Xu, J.; Chen, Y.; Chen, W.; Liu, J. Spatiotemporal Pattern Analysis and Prediction of Carbon Storage Based on Land Use and Cover Change: A Case Study of Jiangsu Coastal Cities in China. Land 2024, 13, 1728. [Google Scholar] [CrossRef]
  19. Li, Y.; Peng, Y.-L.; Cheng, W.-Y.; Peng, H.-N. Spatial-temporal evolution and multi-scenario prediction of carbon emissions from land use in the adjacent areas of nature reserves. Ecol. Indic. 2025, 170, 113047. [Google Scholar] [CrossRef]
  20. Qiao, Y.; Zhang, J.; Huo, T.; Du, Q.; Cai, W. Shaping China’s carbon peak roadmaps: A dynamic model for provincial residential buildings. Sustain. Prod. Consum. 2025, 55, 389–406. [Google Scholar] [CrossRef]
  21. Taweesan, A.; Lalitaporn, P.; Sooktawee, S.; Kanabkaew, T. Mitigating air quality and climate impact: A comprehensive analysis of paddy field burning emissions and green mechanisms for sustainable agriculture. Environ. Sustain. Indic. 2025, 26, 100662. [Google Scholar] [CrossRef]
  22. Muduli, A.; Chattopadhyay, P.B. Implications of multi-decadal land use changes on groundwater regime in tropical coastal regions. Groundw. Sustain. Dev. 2025, 29, 101419. [Google Scholar] [CrossRef]
  23. Zhang, X.; Zhou, J.; Li, M. Analysis on spatial and temporal changes of regional habitat quality based on the spatial pattern reconstruction of land use. Acta Geogr. Sin. 2020, 75, 160–178. [Google Scholar]
  24. Xu, Y.; Liu, Y.; Wei, M.; Lu, J. Land Cover Classification of the Yangtze River Delta Using MODIS Data. Acta Geogr. Sin. 2007, 62, 640–648. [Google Scholar]
  25. Peng, B.; An, X.; Chen, F.; Pu, L. A Study on Sustainable Land Use in the Yangtze River Delta. J. Nat. Resour. 2001, 16, 305–312. [Google Scholar]
  26. Qi, L.; Luan, Z.; Wei, M.; Yan, D.; Li, J.; Yao, X.; Liu, Y.; Xie, S.; Sheng, Y. Spatial and temporal variations of ecosystem service values in Jiangsu Province based on land-use change. J. Nanjing For. Univ. 2023, 47, 200–208. [Google Scholar]
  27. Hou, R.; Xia, C.; Chen, J.; Zhang, Q.; Li, H.; Huang, J.; Huang, X.; Deng, J.; Han, X.; An, T. Carbon storage and carbon sink of forest land and other biomass in the Yangtze River Economic Belt. Acta Ecol. Sin. 2022, 42, 9483–9498. [Google Scholar]
  28. Li, K.; Cao, J.; Adamowski, J.F.; Biswas, A.; Zhou, J.; Liu, Y.; Zhang, Y.; Liu, C.; Dong, X.; Qin, Y. Assessing the effects of ecological engineering on spatiotemporal dynamics of carbon storage from 2000 to 2016 in the Loess Plateau area using the InVEST model: A case study in Huining County, China. Environ. Dev. 2021, 39, 100641. [Google Scholar] [CrossRef]
  29. Shi, J.; Shi, P.J.; Wang, Z.Y.; Cheng, F.Y. Spatial-temporal evolution and prediction of carbon storage in Jiuquan City ecosystem based on PLUS-InVEST model. Environ. Sci. 2024, 45, 300–313. [Google Scholar]
  30. Liu, Z.; Zhou, Q.; Zhou, J.; Ma, Q.; Kuang, W.; Daryanto, S.; Wang, L.; Jing, W.; Bo, L.; Zhu, J.; et al. Scale effect of climate factors on soil organic carbon stock in natural grasslands of northern China. Ecological Indicators. 2023, 146, 109757. [Google Scholar] [CrossRef]
  31. Wang, D.D.; Shi, X.Z.; Wang, H.J.; Yu, D.S.; Sun, W.X.; Ren, H.Y.; Zhao, Y.C.; Weindorf, D.C. Scale effect of climate on soil organic carbon in the Uplands of Northeast China. J. Soils Sediments 2010, 10, 1007–1017. [Google Scholar] [CrossRef]
  32. Chen, X.; Li, Y.; Wang, H.; Zhang, Y.; Liu, Z. Multi-Scenario Land Use/Cover Change and Its Impact on Carbon Storage Based on the Coupled GMOP-PLUS-InVEST Model in the Hexi Corridor, China. Sustainability 2024, 16, 1402. [Google Scholar]
  33. Liu, Y.; Wang, J.; Zhang, Y.; Li, X.; Wang, Y.; Wang, S. The Response of Carbon Storage to Multi-Objective Land Use/Cover Spatial Optimization and Vulnerability Assessment. Sustainability 2024, 16, 2235. [Google Scholar]
  34. The State Council of the People’s Republic of China. Approval of the National Territorial Spatial Plan for Wuxi City, Jiangsu Province. Available online: https://english.www.gov.cn/policies/latestreleases/202501/16/con_WS6788eb26c6d0868f4e8eedd4.html (accessed on 1 May 2025).
  35. Wang, J.-F.; Li, X.-H.; Christakos, G.; Liao, Y.-L.; Zhang, T.; Gu, X.; Zheng, X.-Y. Geographical detectors-based health risk assessment and its application in the neural tube defects study of the Heshun Region, China. Int. J. Geogr. Inf. Sci. 2010, 24, 107–127. [Google Scholar] [CrossRef]
  36. Wang, J.-F.; Zhang, T.-L.; Fu, B.-J. A measure of spatial stratified heterogeneity. Ecol. Indic. 2016, 67, 250–256. [Google Scholar] [CrossRef]
  37. Luo, S.Q.; Hu, X.M.; Sun, Y.; Yan, C.; Zhang, X. Multi-scenario land use change and its impact on carbon storage based on coupled Plus-Invest model. Chin. J. Eco-Agric. 2023, 31, 300–314. [Google Scholar]
  38. Jiangsu Provincial People’s Government News Center. Jiangsu Completes Afforestation of 15,560 Hectares in 2023. Jiangsu Provincial People’s Government. 27 April 2024. Available online: https://en.jiangsu.gov.cn/art/2024/4/27/art_54122_11229863.html (accessed on 1 March 2025).
  39. Zhu, M.; Zhu, D.; Huang, M.; Gong, D.; Li, S.; Xia, Y.; Lin, H.; Altan, O. Assessing the Impact of Climate Change on the Landscape Stability in the Mediterranean World Heritage Site Based on Multi-Sourced Remote Sensing Data: A Case Study of the Causses and Cévennes, France. Remote Sens. 2025, 17, 203. [Google Scholar] [CrossRef]
  40. Gong, D.; Huang, M.; Ge, Y.; Zhu, D.; Chen, J.; Chen, Y.; Zhang, L.; Hu, B.; Lai, S.; Lin, H. Revolutionizing ecological security pattern with multi-source data and deep learning: An adaptive generation approach. Ecol. Indic. 2025, 173, 113315. [Google Scholar] [CrossRef]
  41. Zhang, Y.; Li, X.; Wang, Y.; Liu, Y. Unbalanced development characteristics and driving mechanisms of regional urban spatial form: A case study of Jiangsu Province, China. Sustainability 2021, 13, 3121. [Google Scholar] [CrossRef]
  42. Wu, X.W.; Guo, F.C. Analysis and prediction of carbon storage changes in Jiangsu Province based on the Invest model and Flus model. Chin. J. Eco-Agric. 2024, 32, 230–239. [Google Scholar]
  43. Deng, Y.L.; Huang, M.; Gong, D.H.; Ge, Y.; Lin, H.; Zhu, D.Y.; Chen, Y.; Altan, O. Carbon balance dynamic evolution and simulation coupling economic development and ecological protection: A case study of Jiangxi Province at county scale from 2000 to 2030. Int. J. Digit. Earth 2025, 18, 2448572. [Google Scholar] [CrossRef]
Figure 1. Study area of Jiangsu.
Sustainability 17 05251 g001
Figure 2. Land use proportion in Jiangsu Province from 1995 to 2020.
Sustainability 17 05251 g002
Figure 3. Land use and cover change of Jiangsu from 1995 to 2020: (a) 1995; (b) 2000; (c) 2005; (d) 2010; (e) 2015; (f) 2020.
Sustainability 17 05251 g003
Figure 4. Statistics on changes in carbon storage of various types of land in Jiangsu Province from 1995 to 2020.
Sustainability 17 05251 g004
Figure 5. Changes in carbon storage of various land use types in Jiangsu Province from 1995 to 2020.
Sustainability 17 05251 g005
Figure 6. Geographic detector factor detection map.
Sustainability 17 05251 g006
Figure 7. Development trends of various land use types.
Sustainability 17 05251 g007
Figure 8. Land use simulation for each scenario in 2030.
Sustainability 17 05251 g008
Figure 9. Ecological benefit comparison.
Sustainability 17 05251 g009
Figure 10. Economic benefit comparison.
Sustainability 17 05251 g010
Figure 11. Carbon storage comparison.
Sustainability 17 05251 g011
Figure 12. Optimal simulation of low-carbon spatial layout of land use in 2030.
Sustainability 17 05251 g012
Table 1. Carbon density of different land use types in Jiangsu/kg·m−2.
Organic Carbon DensityArable LandForest LandWater AreaGrasslandConstruction LandUnused Land
aboveground0.543.980.230.810.180.11
underground0.250.860.180.280.060.21
soil12.2922.5312.4510.9610.5211.28
dead0.3818.390.013.170.020.01
Table 2. Basis for judging interaction factors.
Judgement BasisInteraction Types
q(x1x2) < min [q(x1), q(x2)]Nonlinear weakening
min(q(x1), q(x2)) < q(x1x2) < max [q(x1), q(x2)]Single-factor nonlinear weakening
q(x1x2) > max [q(x1), q(x2)]Dual-factor enhancement
q(x1x2) = q(x1) + q(x2)Independence
q(x1x2) > q(x1) + q(x2)Nonlinear enhancement
Table 3. Change in land use and cover change and carbon storage from 1995 to 2020 (km2).
YearCroplandForestGrasslandWater Construction AreaUnused AreaTotal
199571,8543501110212,48213,67156102,666
200070,5713409108713,07314,46957102,666
200569,2833344107413,36615,428171102,666
201067,848339097213,38217,02846102,666
201566,7773357102413,31018,14058102,666
202062,912306673214,29421,510152102,666
Table 4. Changes in carbon storage of various land uses in Jiangsu Province from 1995 to 2020.
1995–20002000–20052005–20102010–20152015–2020Total
Cropland−17.135−17.202−19.167−14.295−51.619−119.417
Forest −4.21−2.9292.105−1.51−13.225−19.768
Grassland−0.213−0.213−1.5370.791−4.414−5.586
Water 7.5423.7450.206−0.92712.57423.14
Construction area8.53810.26317.10811.90136.03383.842
Unused area0.0121.312−1.440.1281.0911.103
Total −5.466−5.024−2.725−3.911−19.555−36.686
Table 5. Land use situation in various scenarios (km2).
Development ScenariosCroplandForestGrasslandWaterConstruction AreaUnused Area
Natural development60,573288561614,89723,571124
Ecological protection59,6326287120415,20720,3360
Economic development57,912327791713,63326,9270
Carbon storage maximization57,5946615154114,87721,94396
Integrated56,8406467140814,66623,2850
Table 6. Benefits and carbon stocks of various scenarios.
Development ScenariosEcological Benefits (CNY Billion)Economic Benefits (CNY Billion)Carbon Storage (Million Tons)
Natural development877.5272,010.21393.168
Ecological protection1576.24238,928.91581.846
Economic development681.64285,487.81403.468
Carbon storage maximization1480.64242,518.91585.761
Integrated1199.52267,531.71540.144
Disclaimer/Publisher’s Note: The statements, opinions and data contained in all publications are solely those of the individual author(s) and contributor(s) and not of MDPI and/or the editor(s). MDPI and/or the editor(s) disclaim responsibility for any injury to people or property resulting from any ideas, methods, instructions or products referred to in the content.

