
Analysis of the Coupling Trend Between the Urban Agglomeration Development and Land Surface Heat Island Effect: A Case Study of Guanzhong Plain Urban Agglomeration, China

 , ,
, ,
Abstract

1. Introduction
2. Methodology
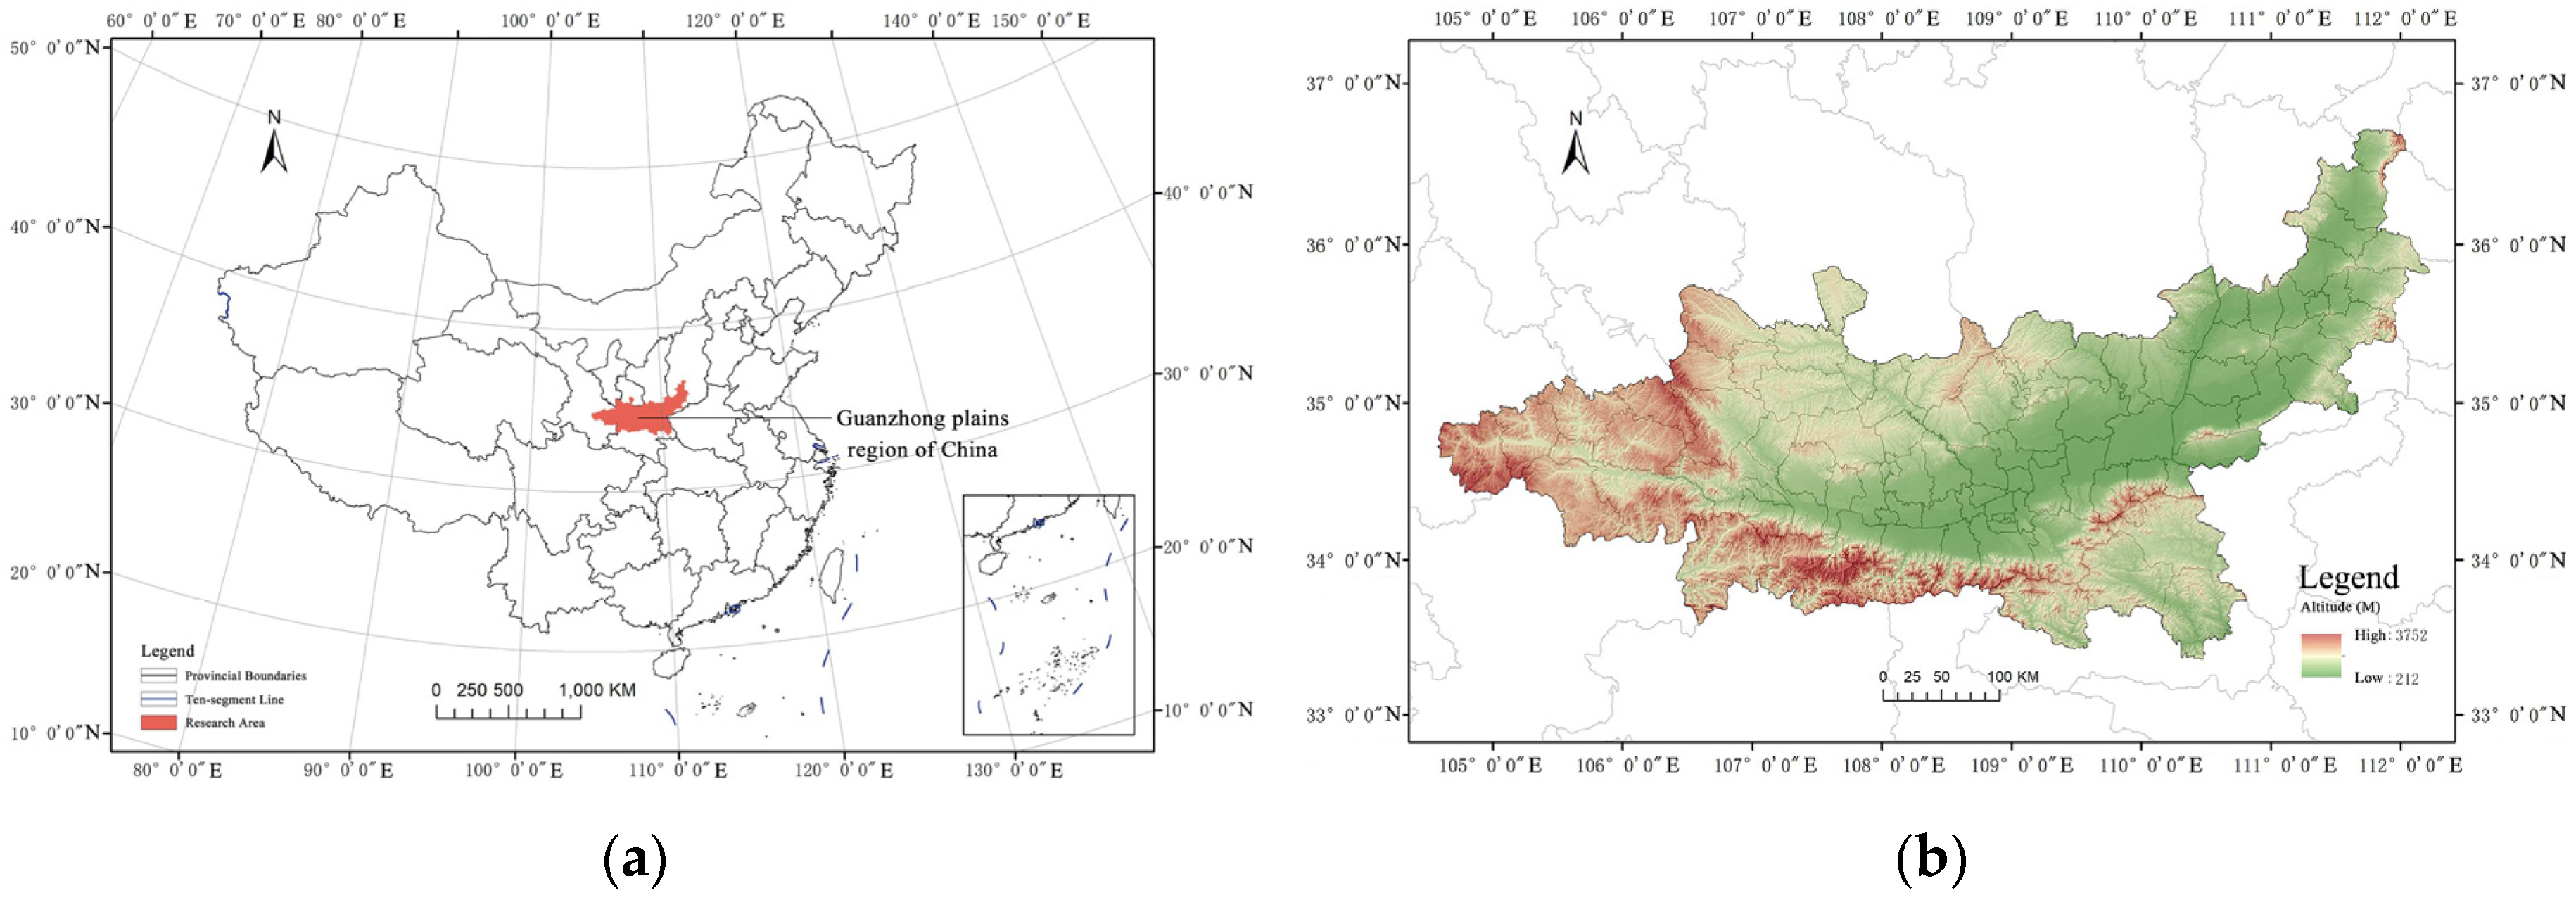
2.1. Study Area
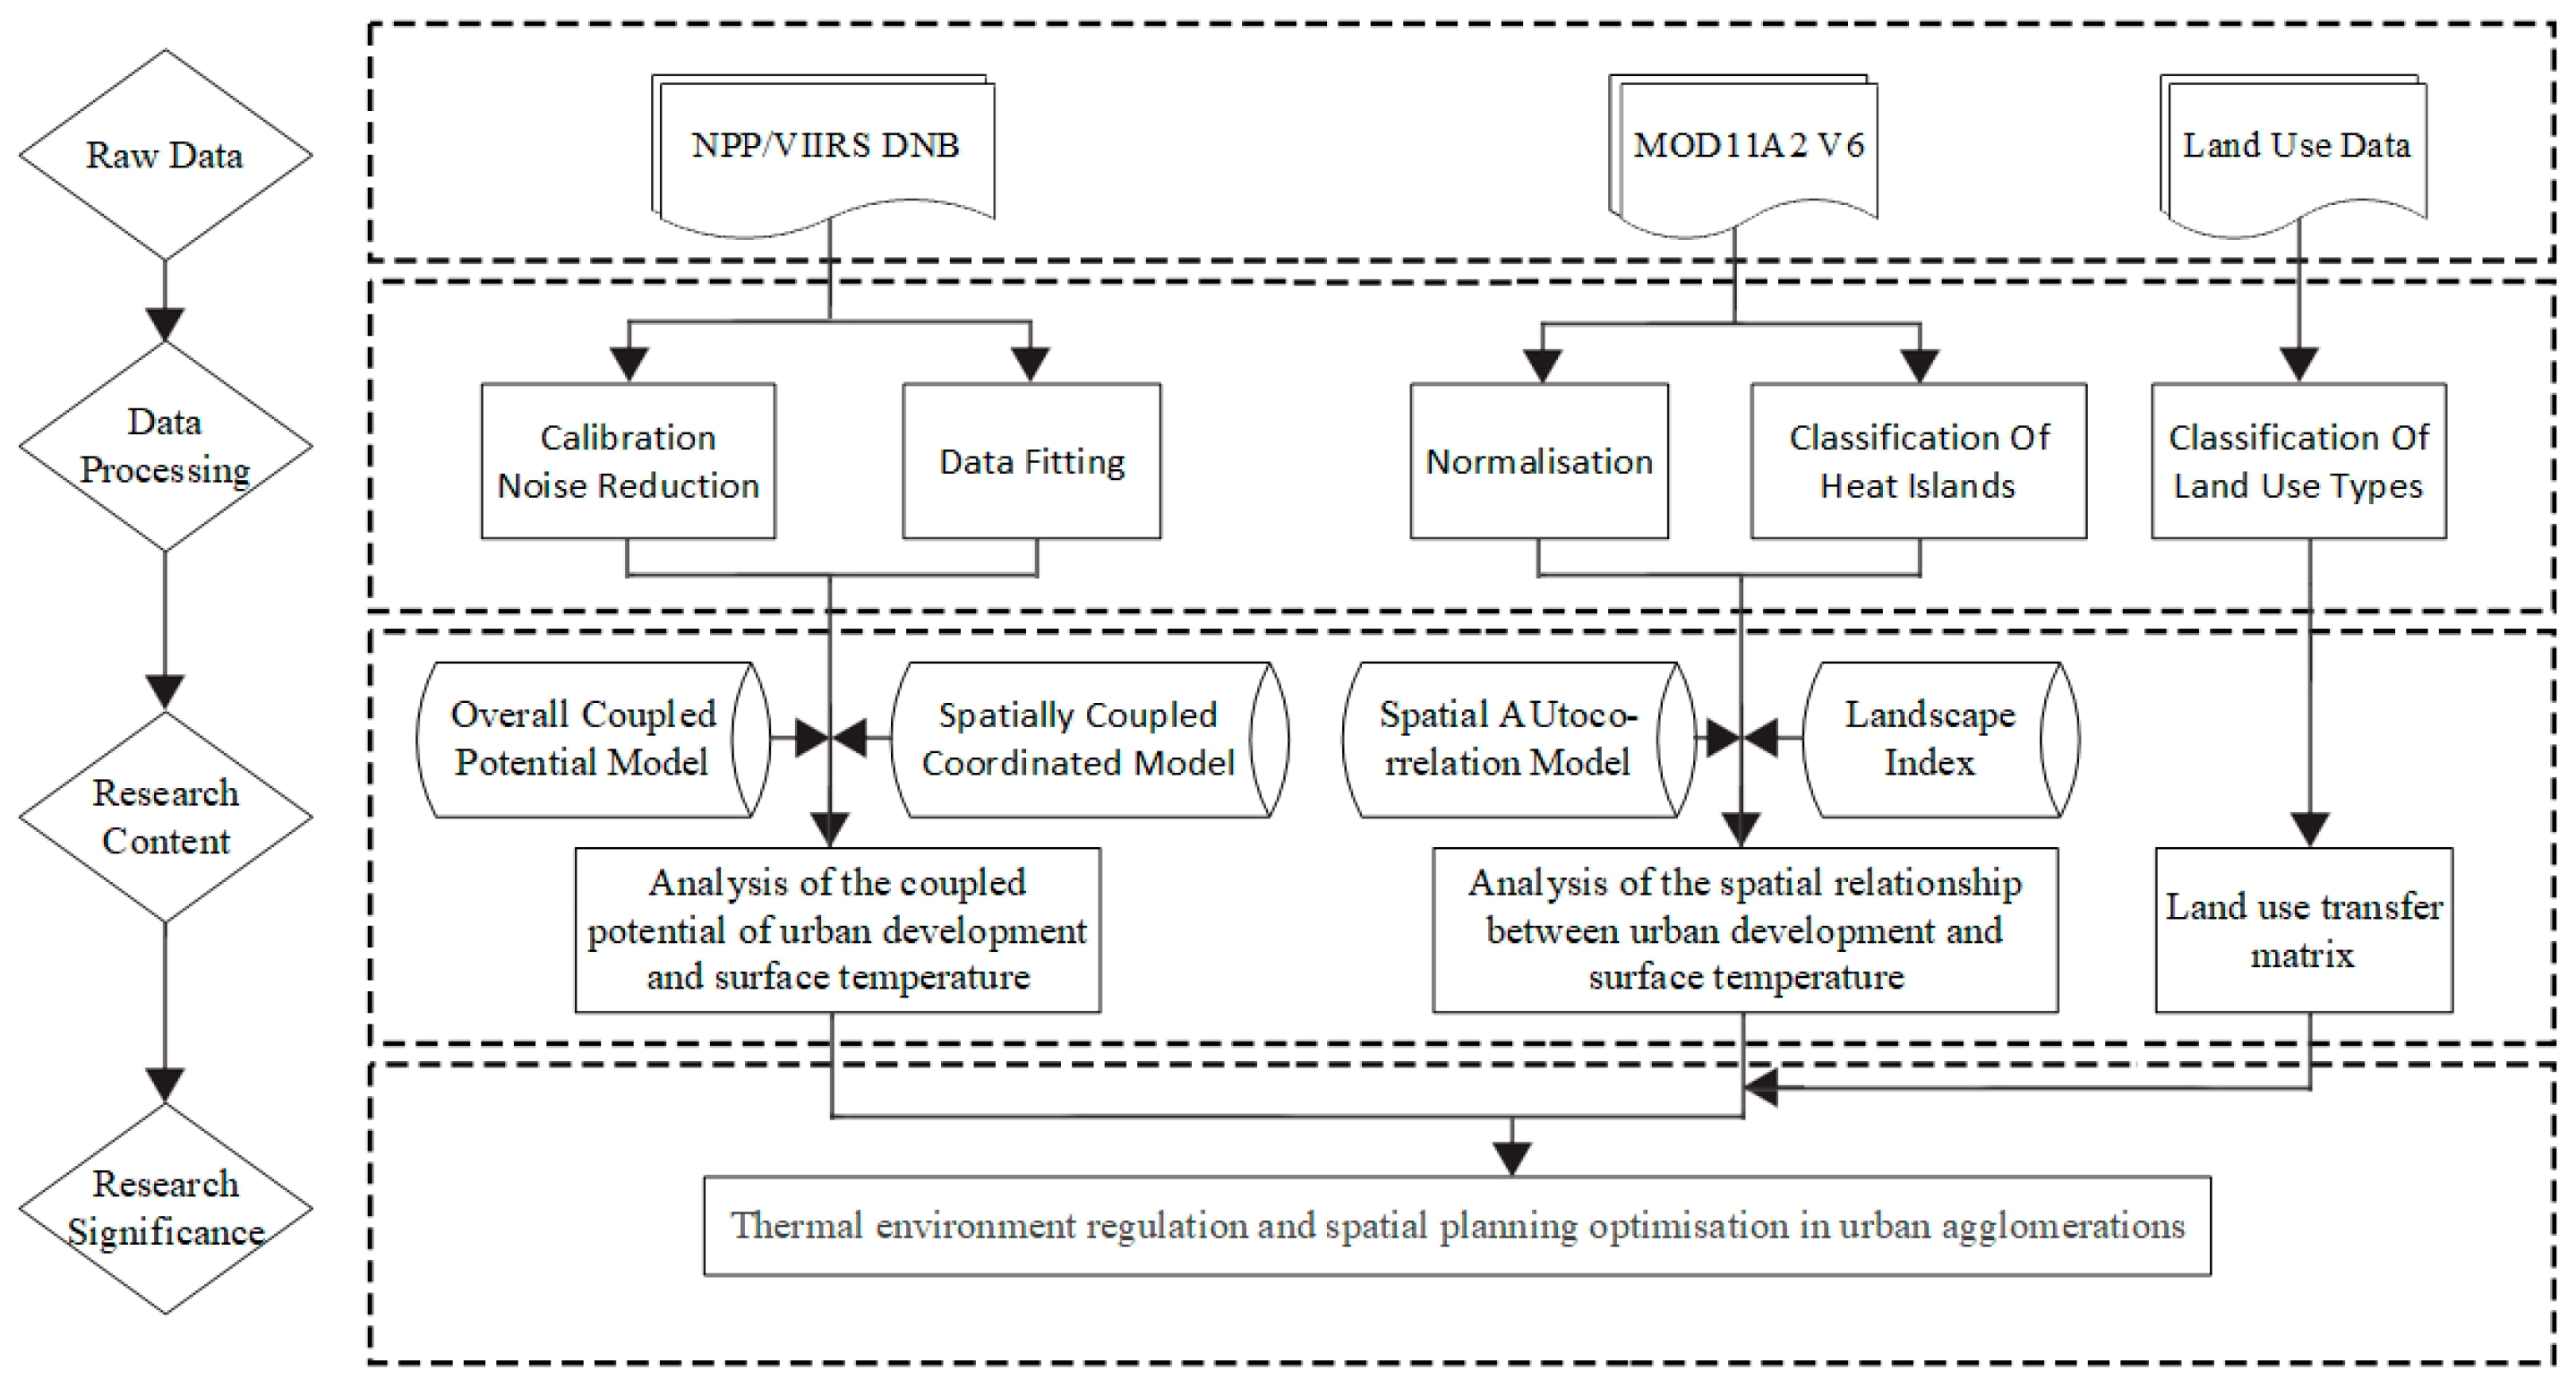
2.2. Data Sources and Processing
2.3. Methods
2.3.1. Overall Coupled Potential Model
2.3.2. Spatially Coupled Coordination Models
2.3.3. Bivariate Spatial Autocorrelation Analysis
2.3.4. Landscape Pattern Index
3. Results
3.1. Spatial and Temporal Patterns of UD and LST Evolution
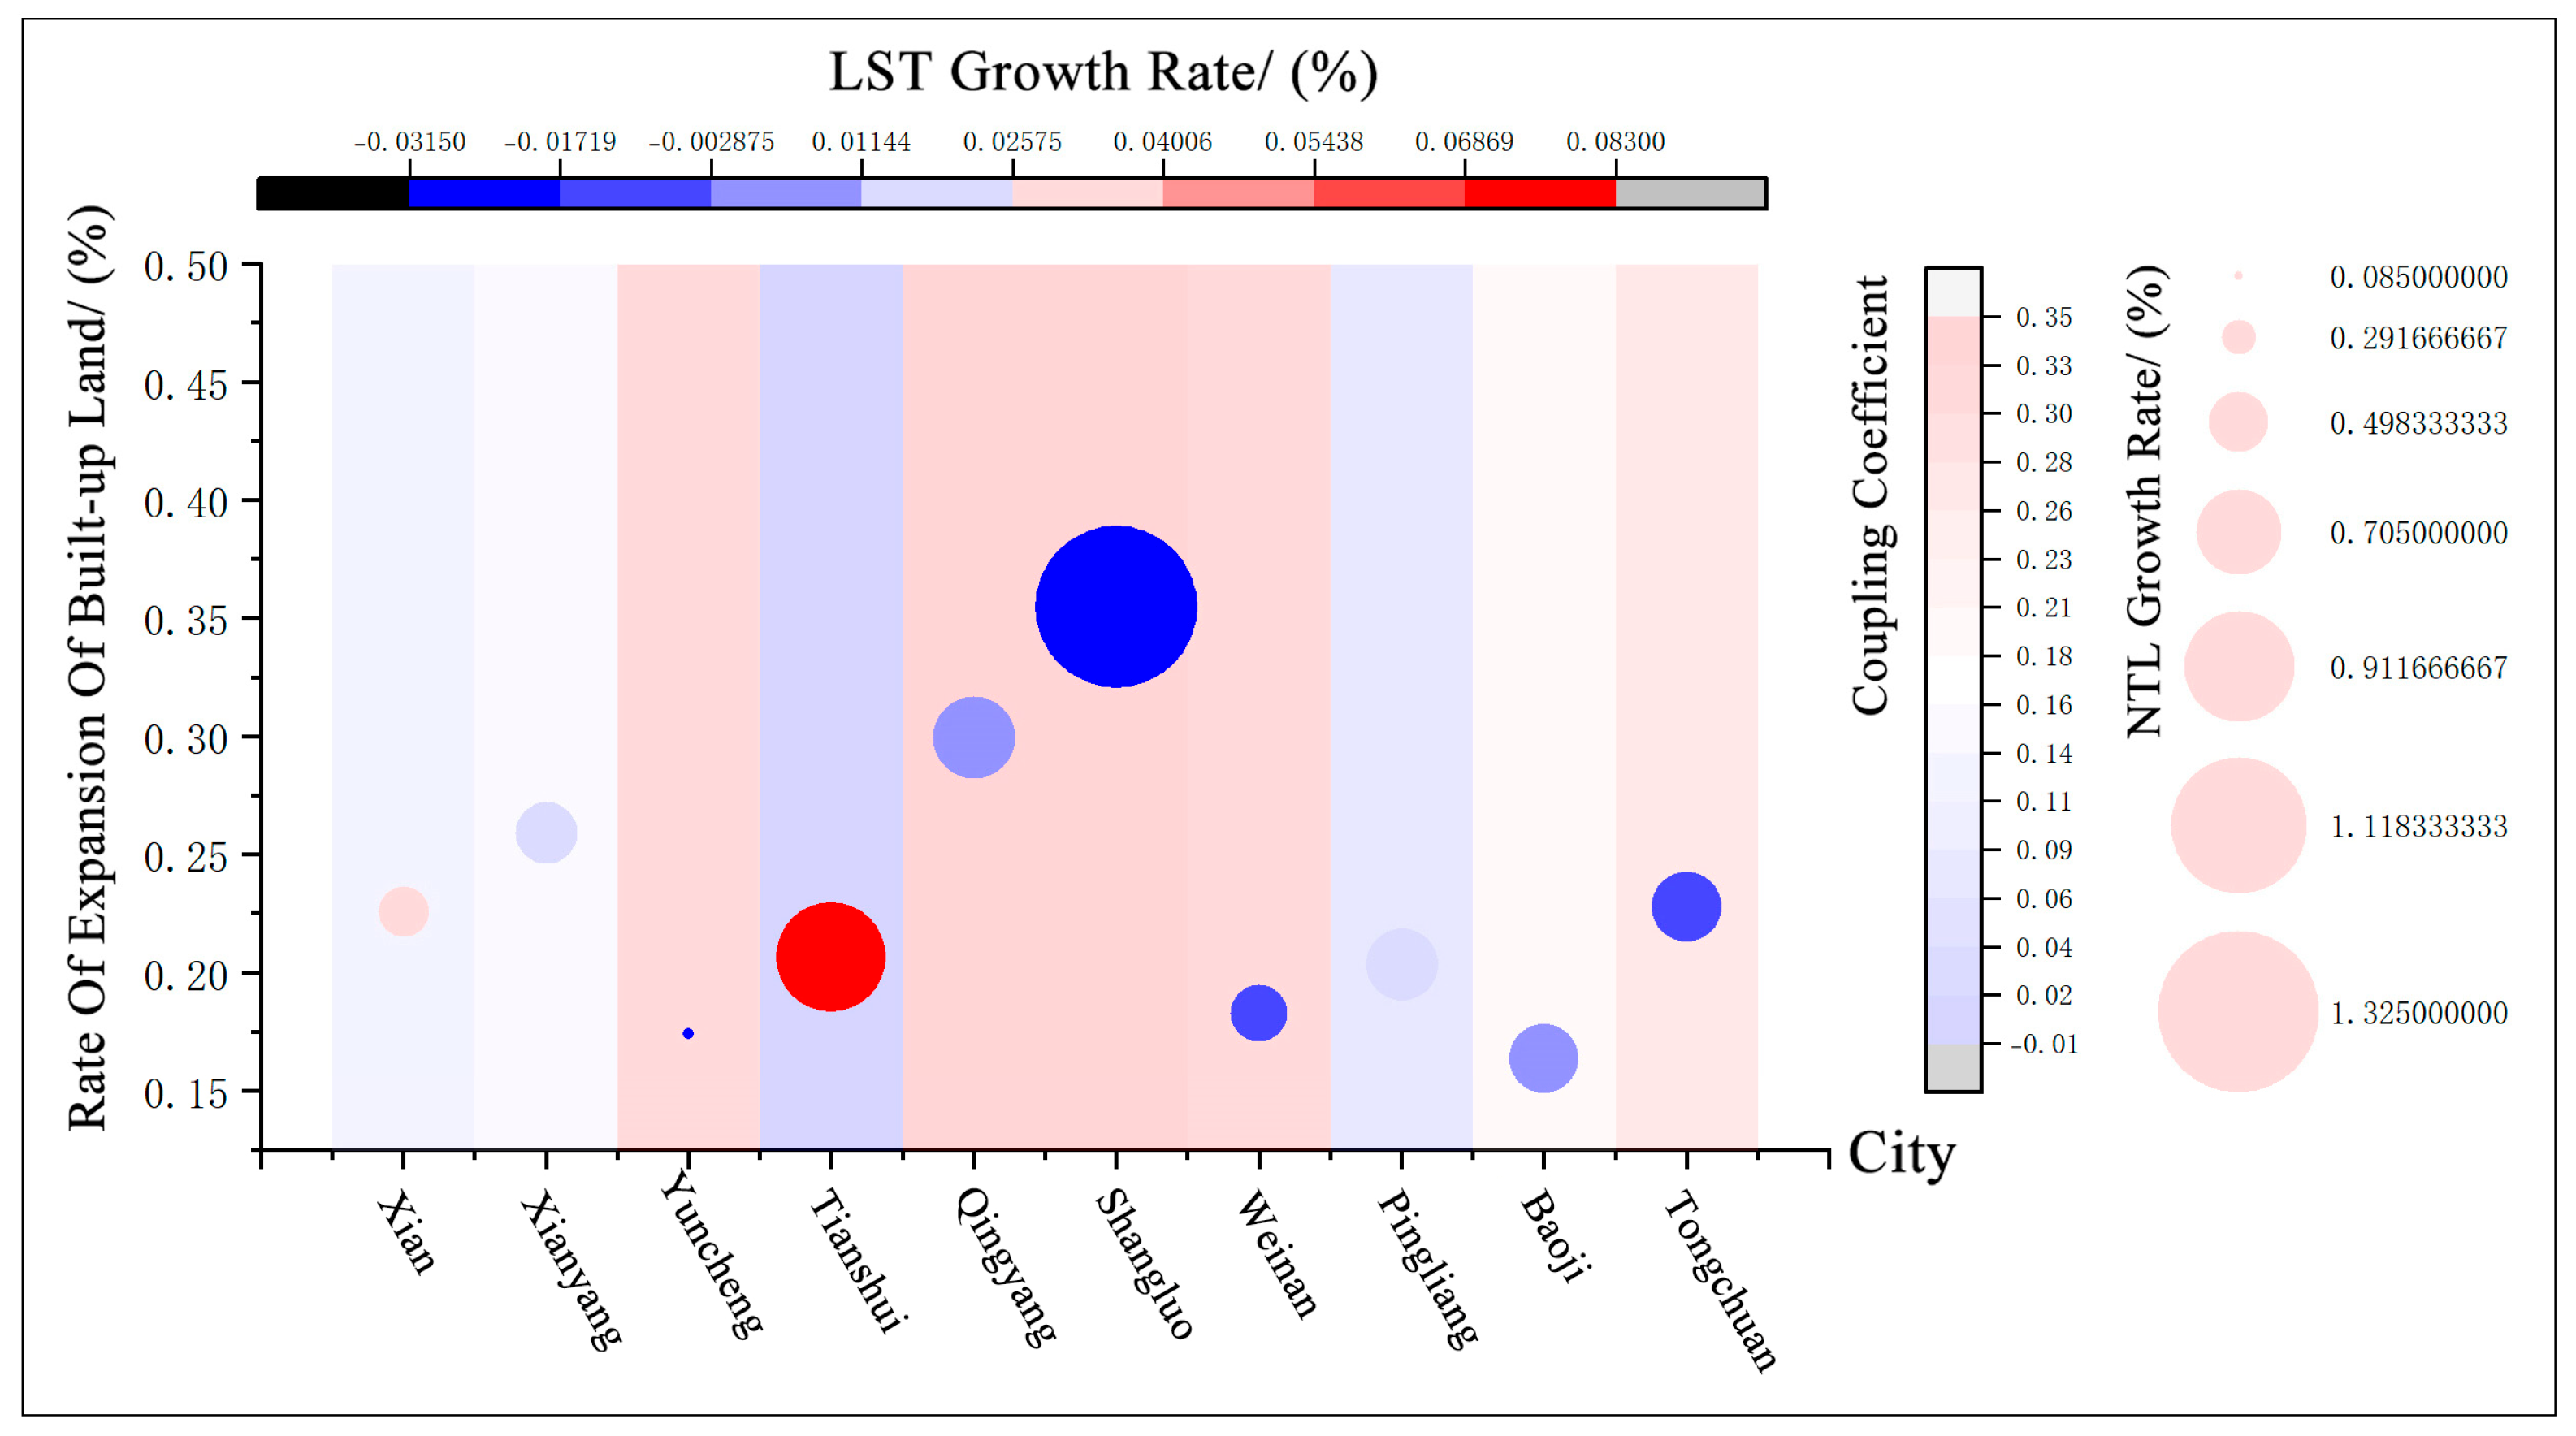
3.2. Spatial-Temporal Coupling Trend Between UD and LST
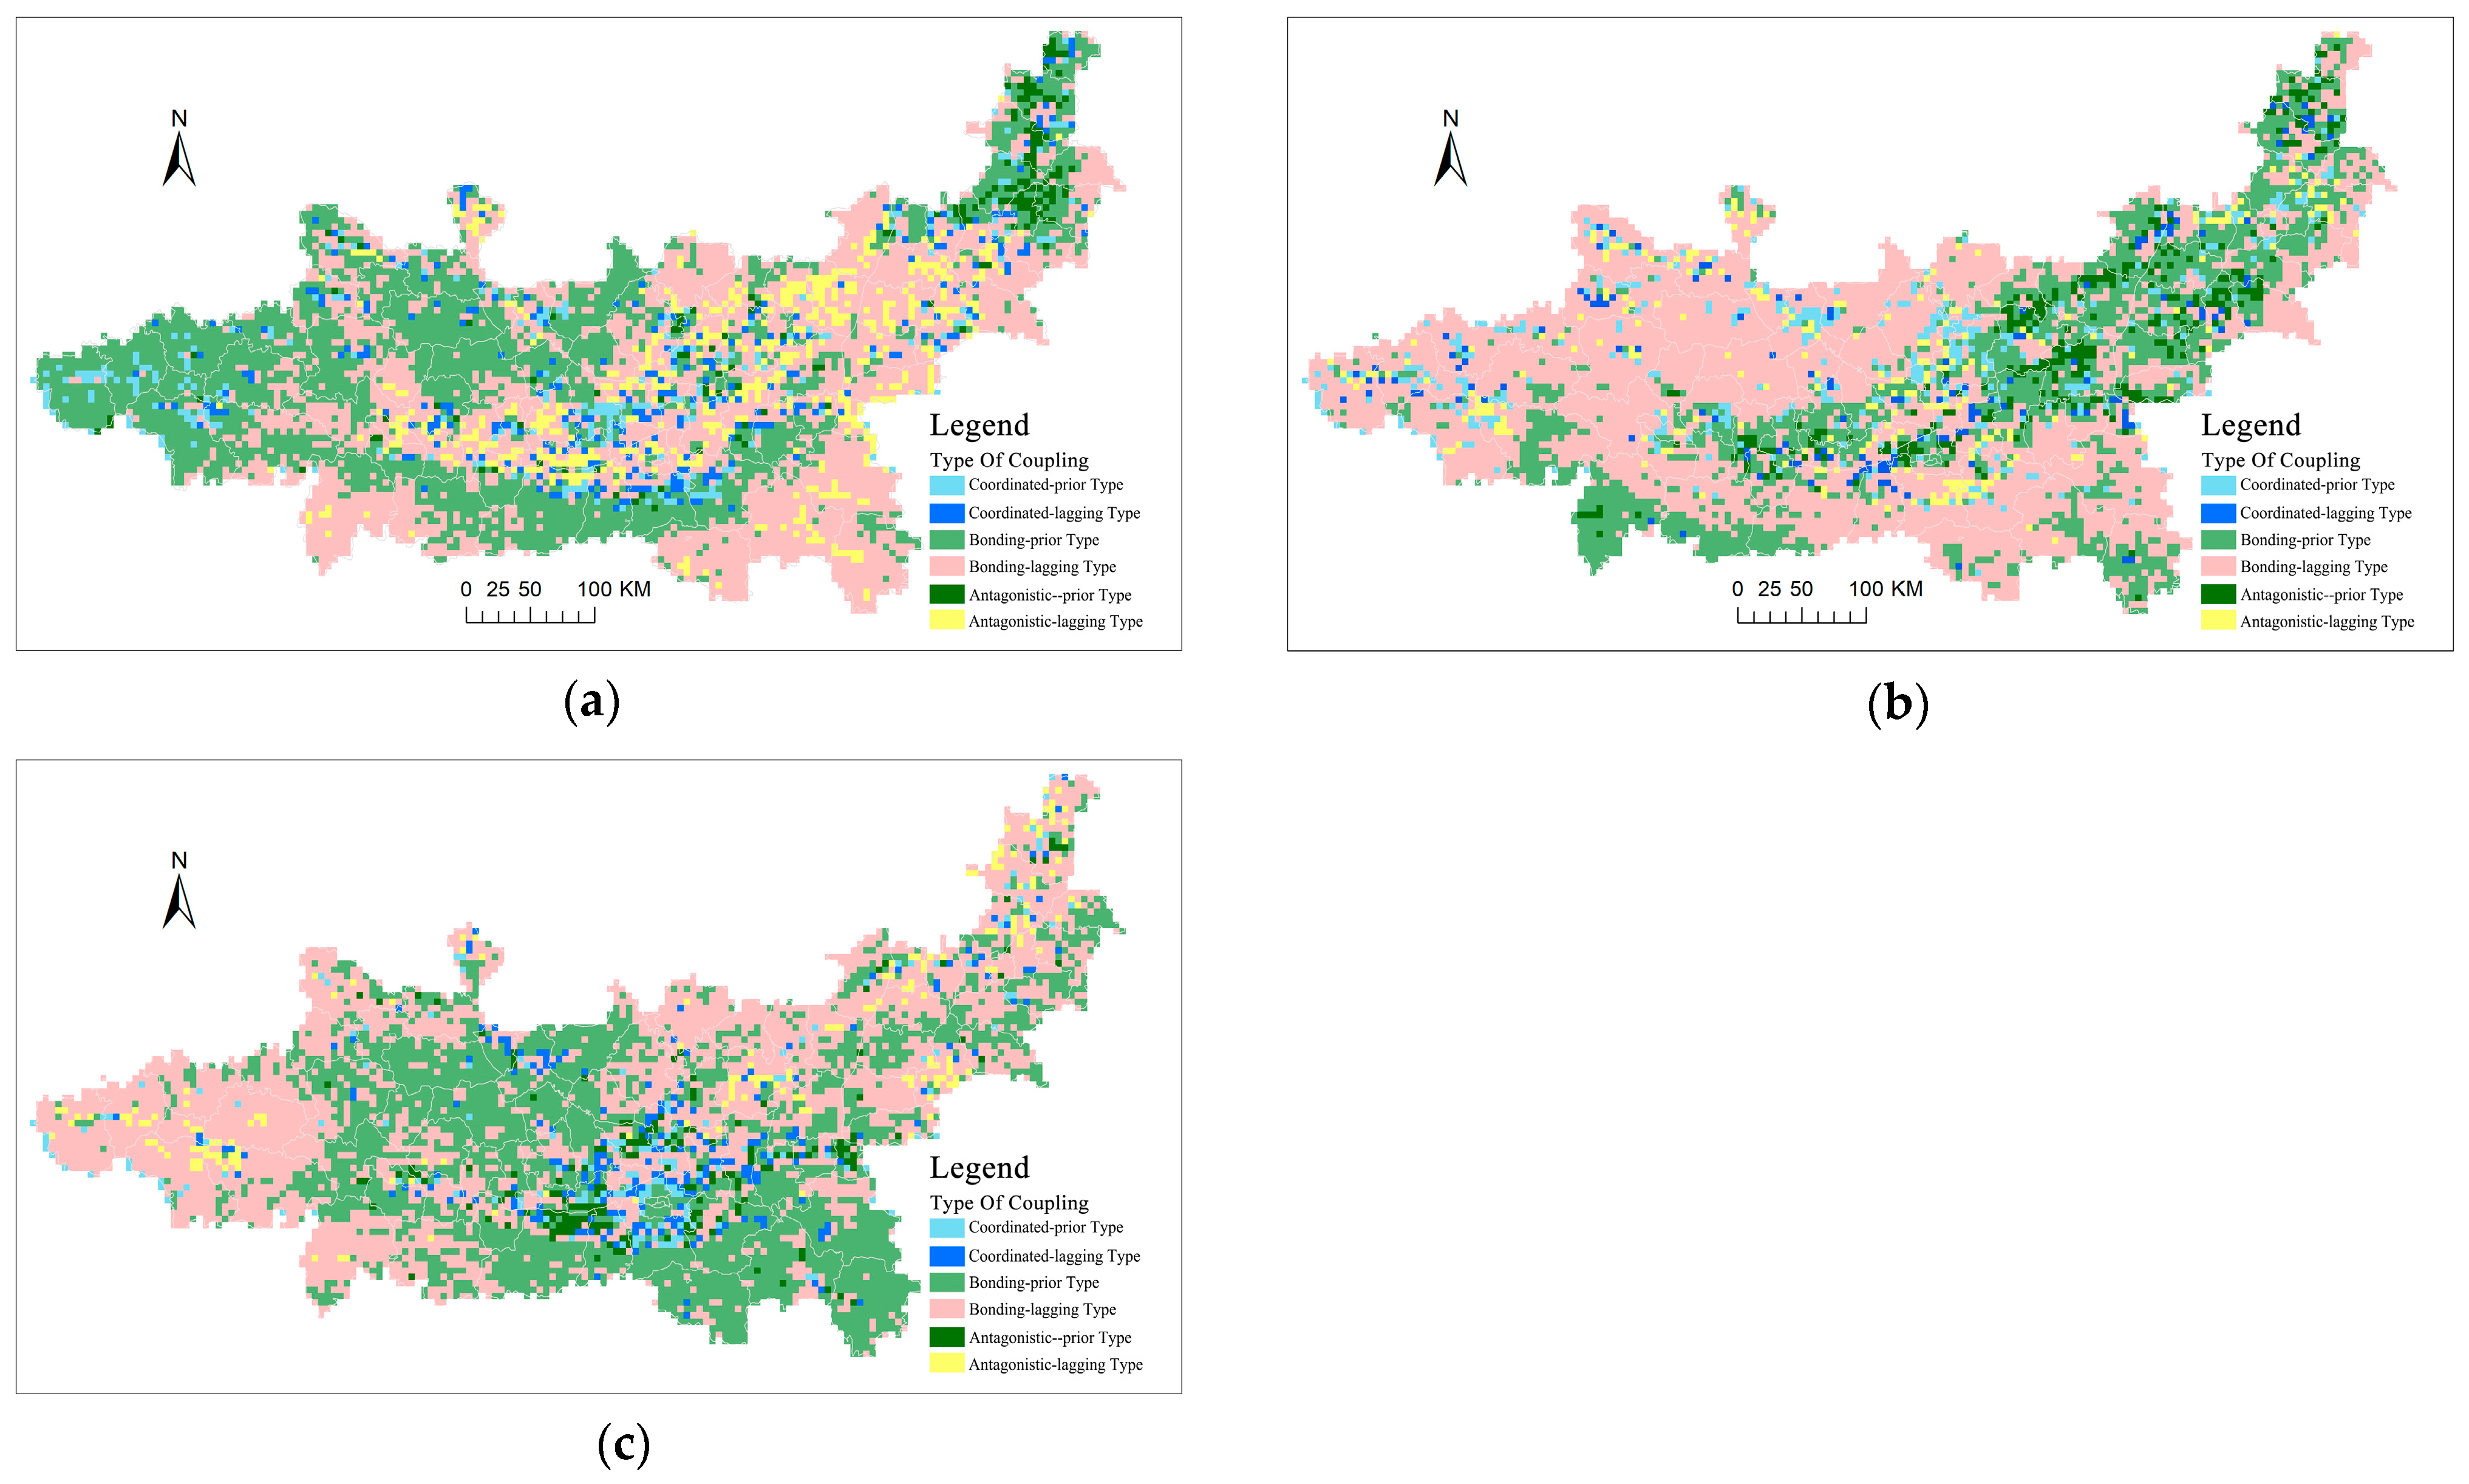
3.3. Spatial Coupling Dynamics Between UD and LST
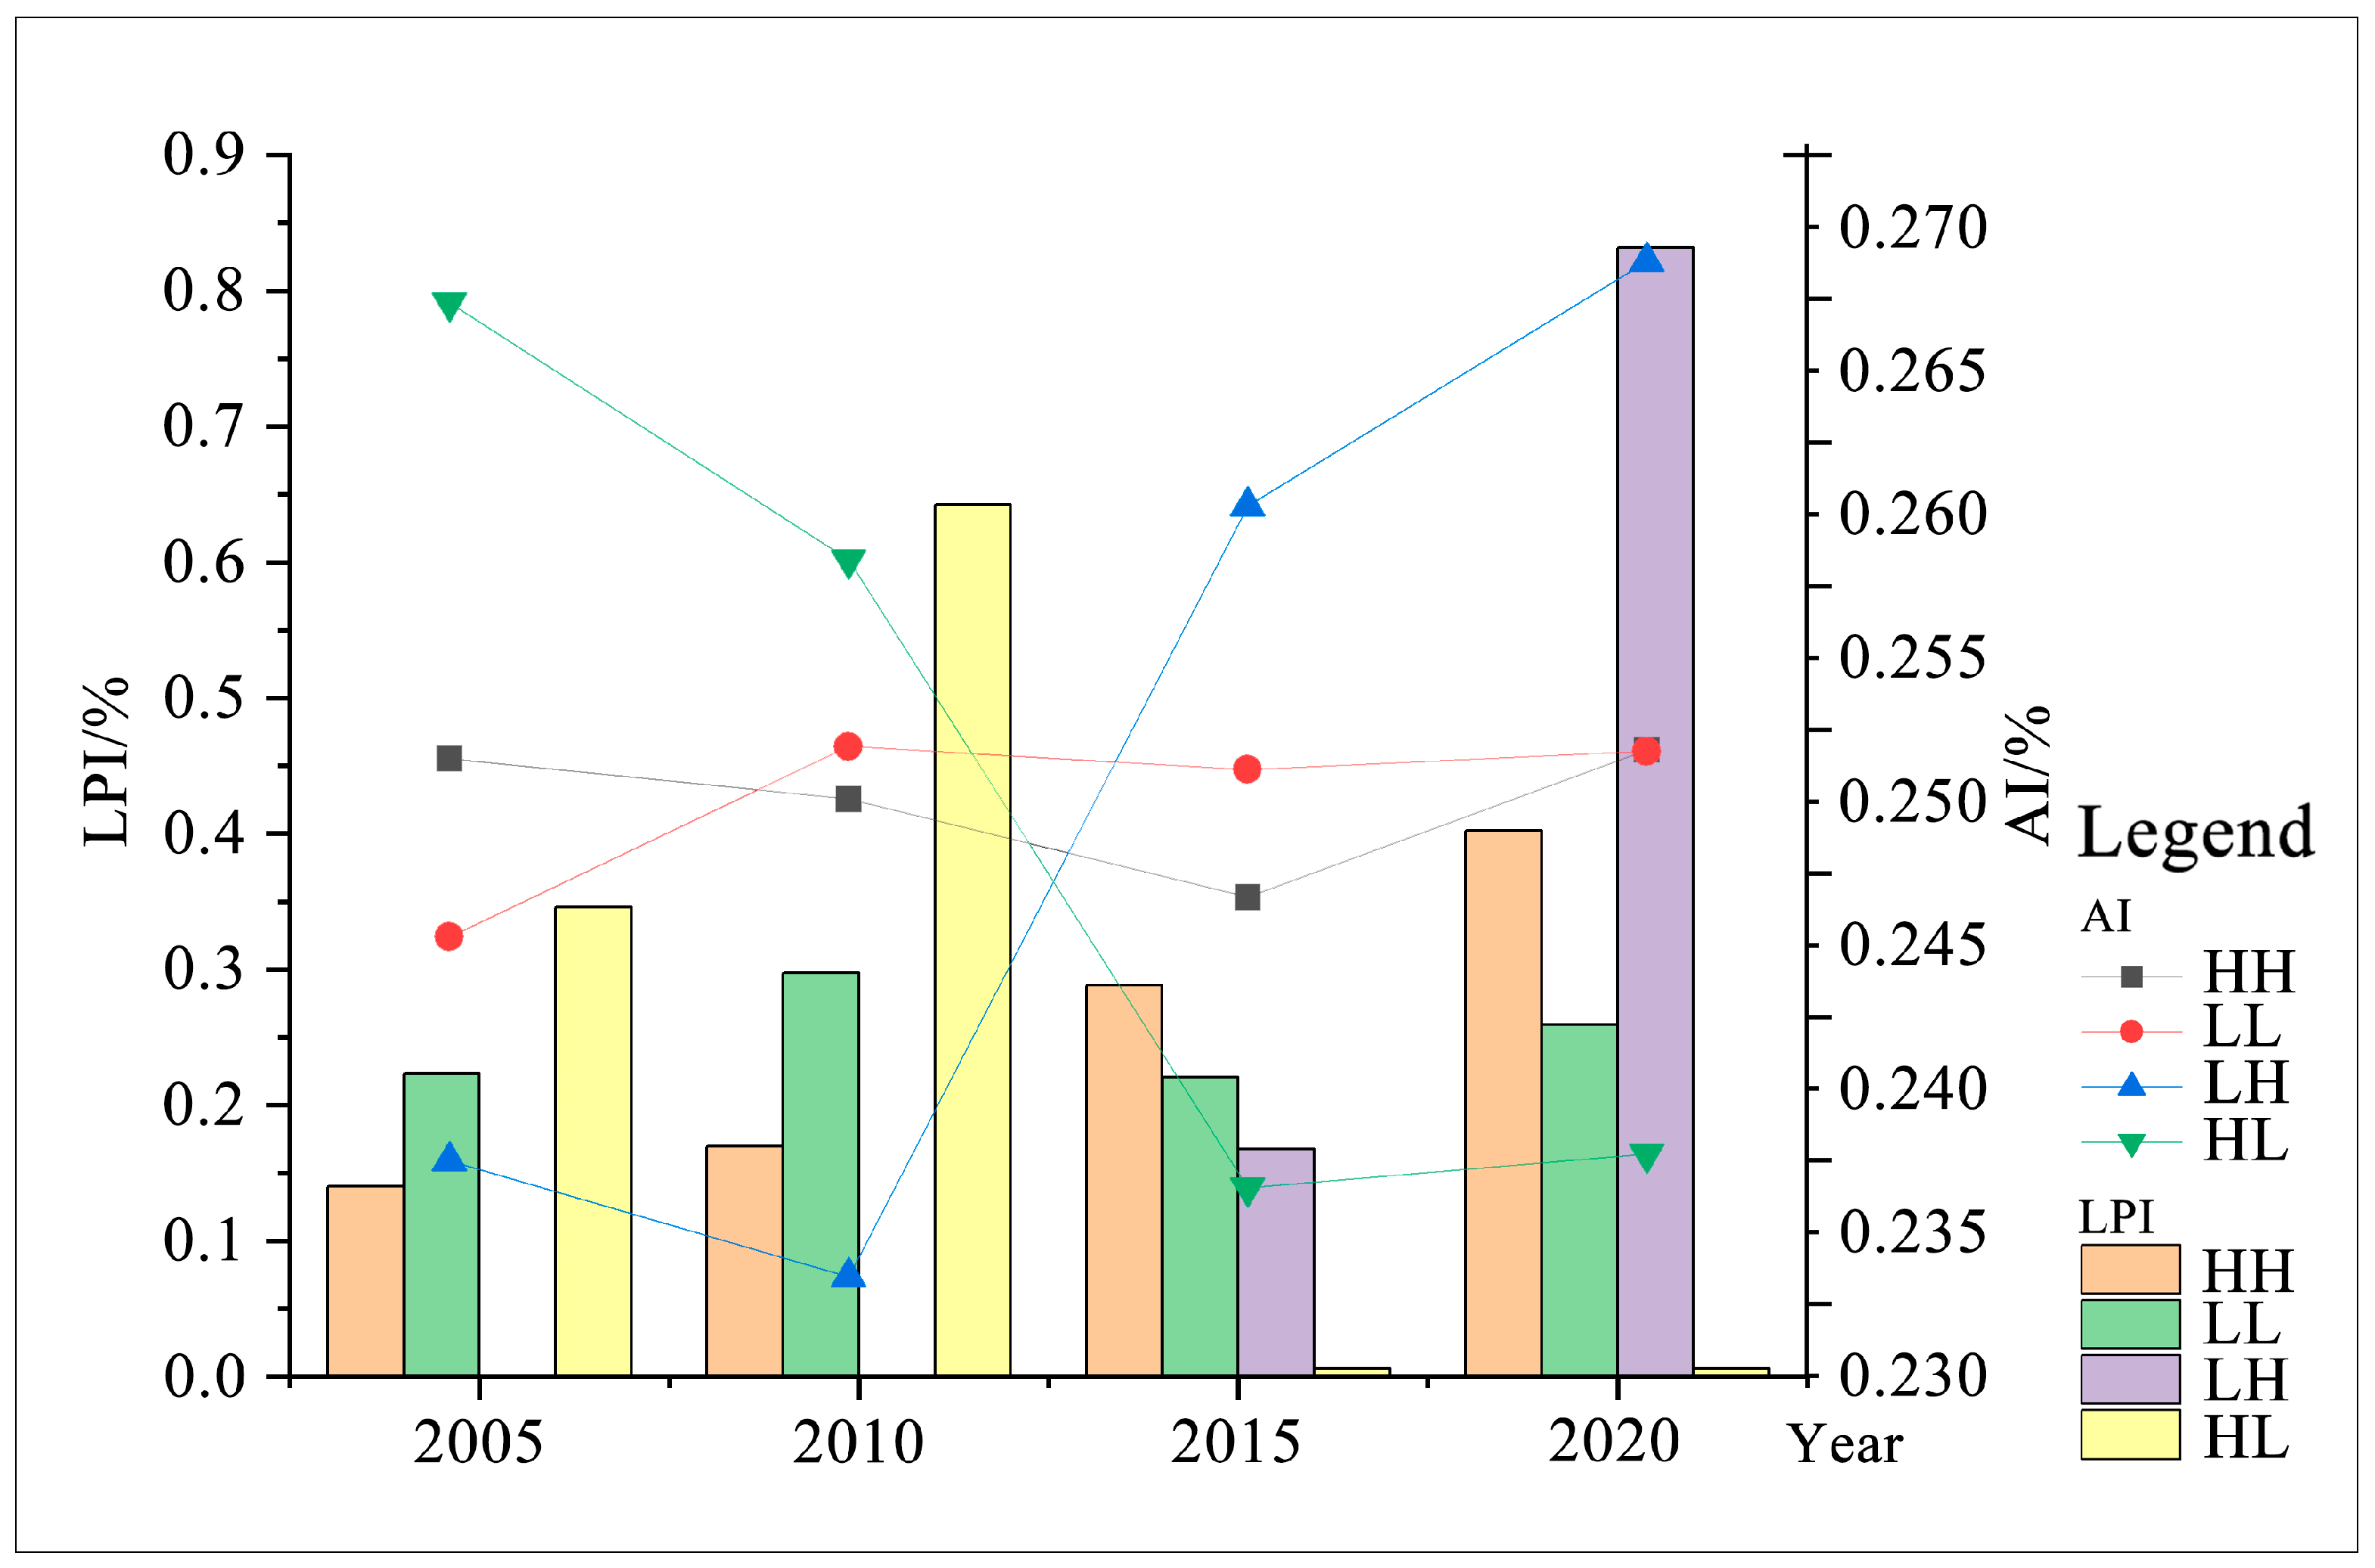
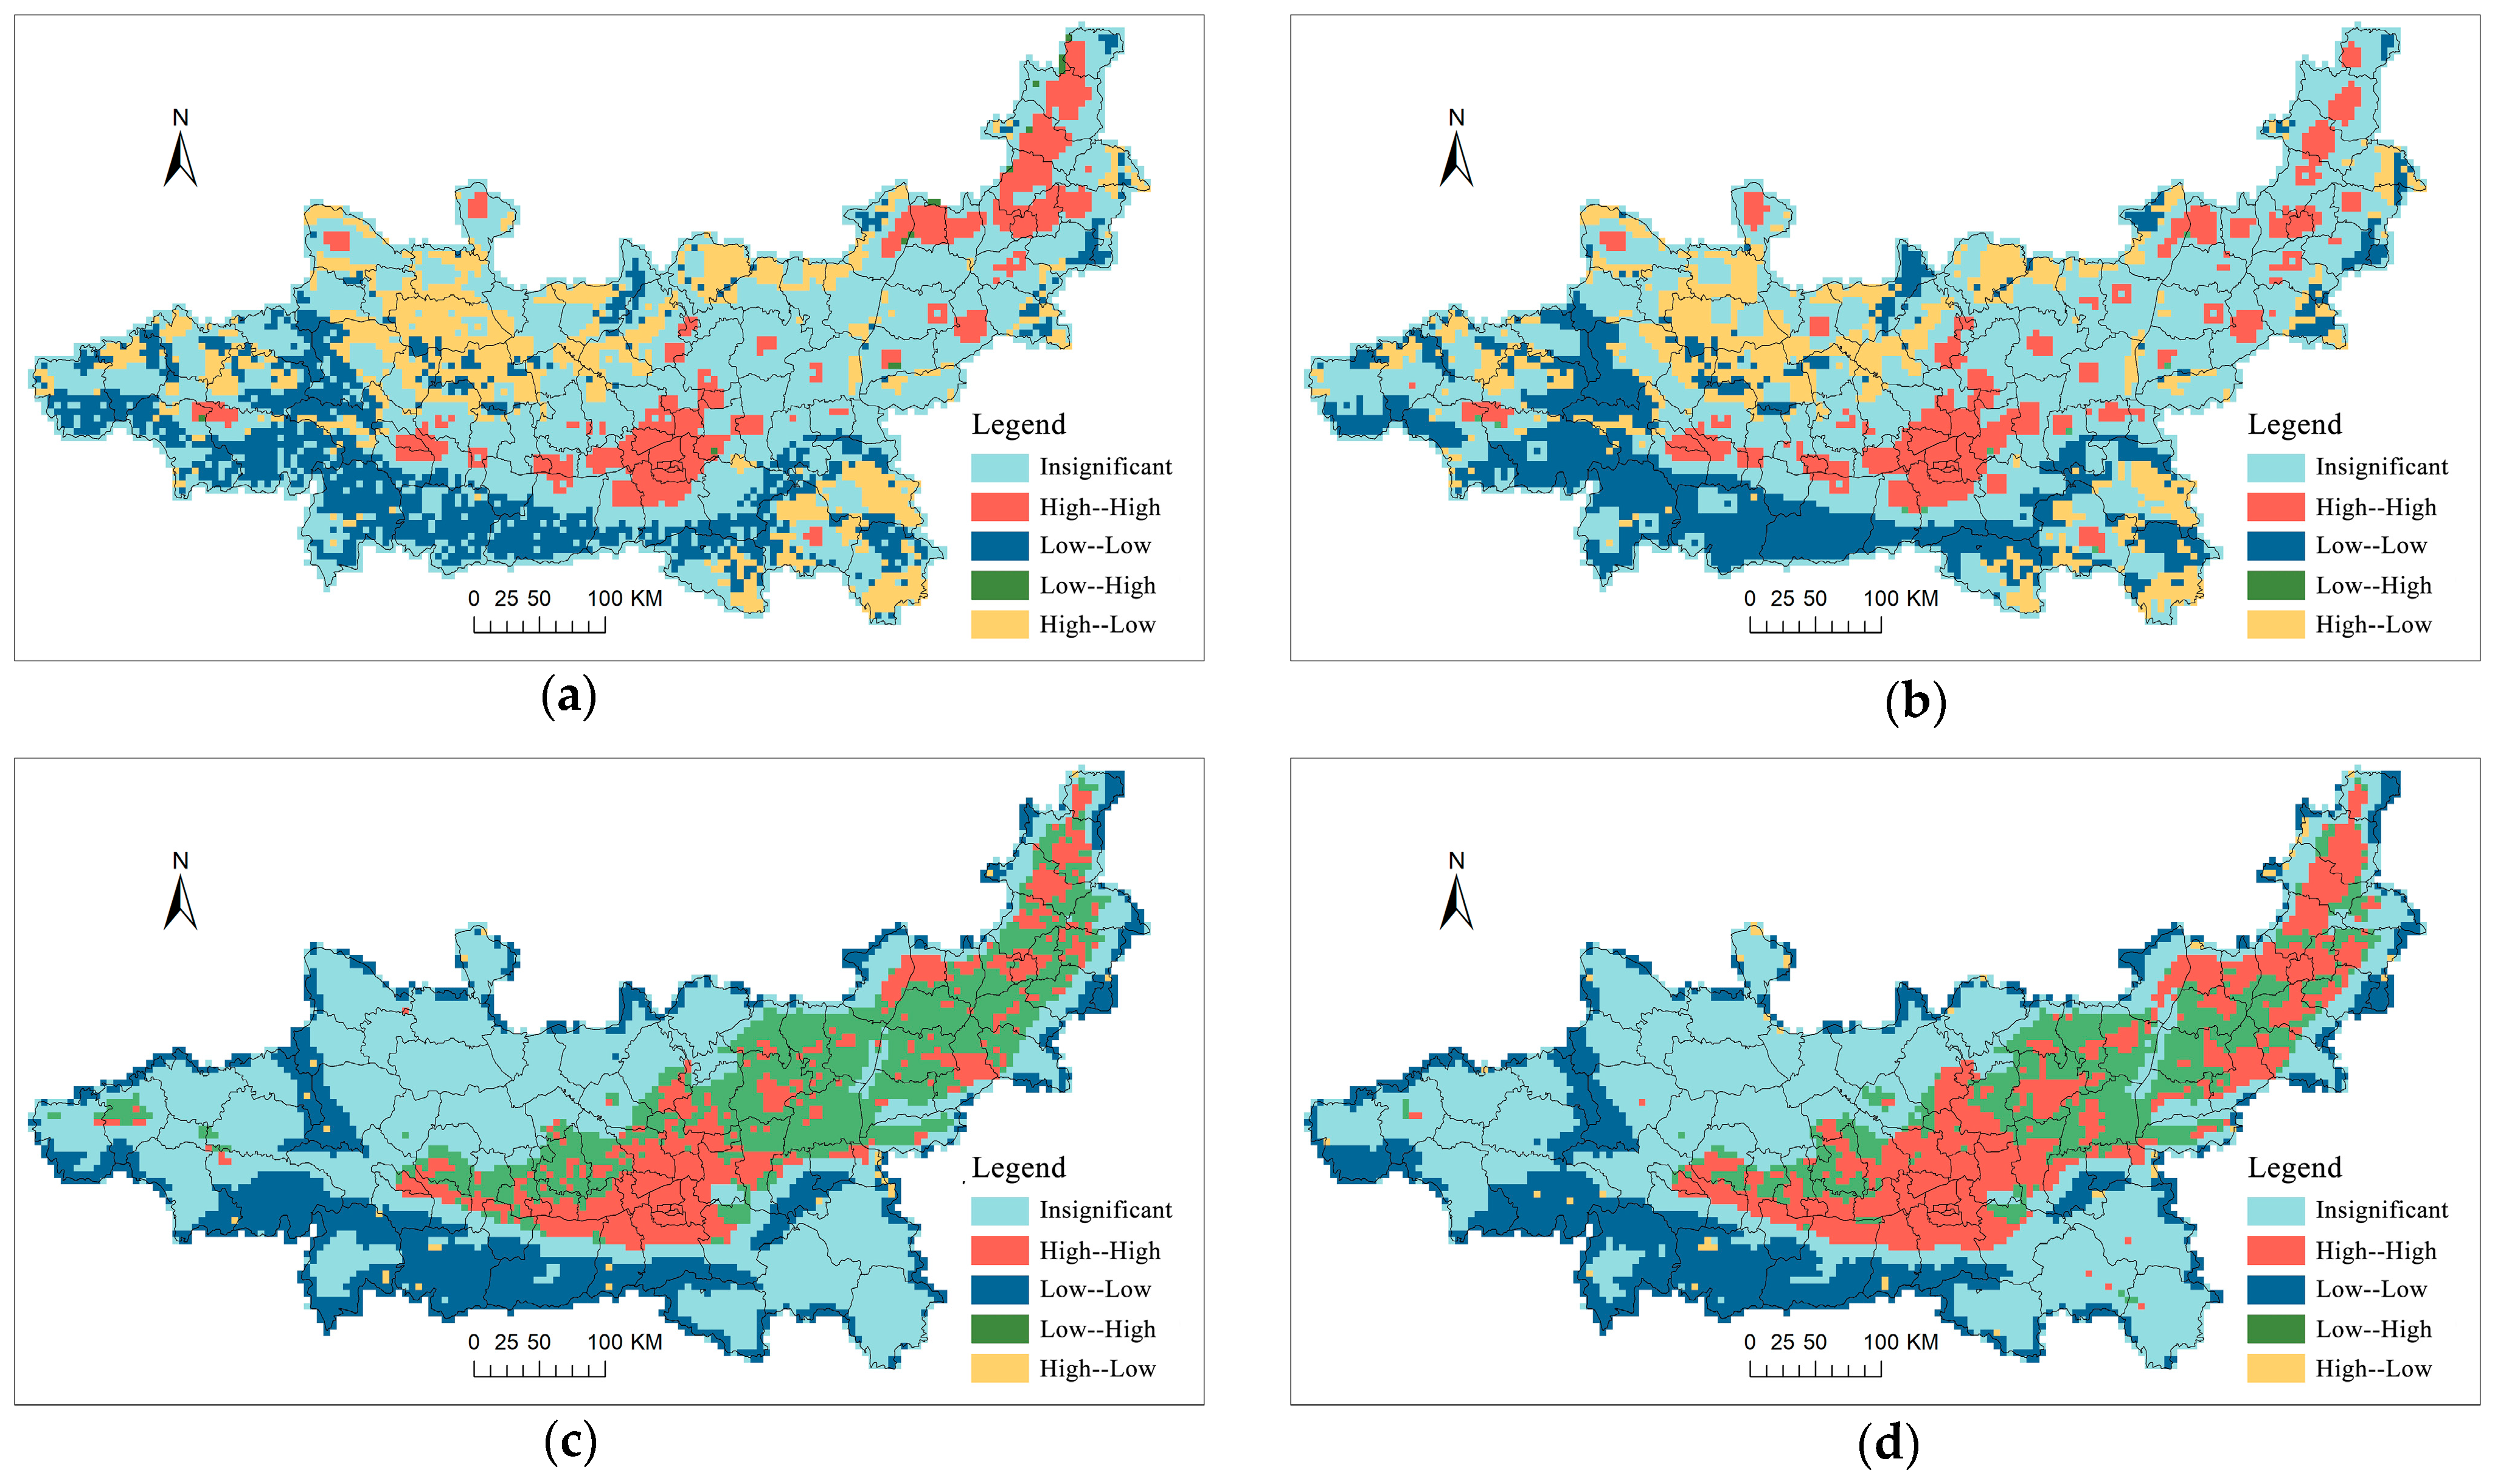
3.4. Spatial Autocorrelation Between UD and LST
- (1)
- Global spatial autocorrelation between UD and LST in GZPUA
- (2)
- Local Spatial autocorrelation between UD and LST in GZPUA
4. Discussion
- (1)
- It is important to emphasize the differences in regional status quo and formulate development plans according to local conditions. Preventive spatial planning should be implemented for lagging urban areas where LST lags behind NTL development, which are usually in the transition period of urban expansion. Its sustainable development suggestions are to delineate thermal environment sensitive areas, prioritize the layout of low-heat industries, regulate the development intensity in real time, and reserve resilient land to block the spread of heat islands in the future [55]. For the over-advanced urban areas where LST is ahead of NTL development, they usually show significant heat island effect but a relatively lagging urbanization level. In the short term, temporary cooling islands can be implanted or structures can be removed to clear emergency air ducts for emergency cooling. From the perspective of sustainable development, it is necessary to carry out urban spatial reconstruction, identify spatial heat sources, and repair industrial legacy areas, bare ground heat sources, transportation hubs, and other legacy problems that are caused by to geographic features or historical development [56,57].
- (2)
- It is important to rationalize land use planning and mitigate the heat island effect according to urban policies. For the high value of the heat island area (mainly for construction land and arable land agglomeration area), an integrated “control–repair–optimization” strategy should be taken; this involves the strict control of high-intensity development of the regional expansion of the development zone, through the delineation of the ecological red line to curb the spread of the city [58]. At the same time, we recommend that a body of water is built as a cold core, with a green corridor as the skeleton of the ecological network system; this would enhance the connectivity of the landscape in order to isolate the heat source agglomeration. This approach focuses on implementing measures such as ecological restoration of bare land and decentralized transformation of construction land, giving full play to the synergistic effect of vegetation transpiration and temperature difference regulation of water bodies. This would help in realizing the systematic improvement of the urban thermal environment [59], promoting the sustainable development of the city.
- (3)
- We recommend the construction of a full-scale governance system to promote healthy and sustainable urban development. A full-scale governance system taking a “macro-pattern regulation–meso-pattern optimization–micro-technology intervention” approach should be implemented. At the macro level, three blue–green composite corridors should be built along the Wei River, Jing River, and Ba River, and four ventilation corridors should be built based on the northern slope of the Qinling Mountains, the Feng River, the Chan River, and the Haliyang Lake, so as to construct a “three horizontal and four vertical” ecological cooling skeleton. At the meso level, the city form should be regulated, high-rise buildings should adopt a staggered layout of “high north and low south” to ensure the penetration of the southeast monsoon, and the north–south road should adopt the “narrow and dense network” to promote a composite cross-section in roads [60,61]. At the micro level, the local thermal environment can be improved through measures such as building skin improvement, sub-surface renewal, and pocket greening [62].
5. Conclusions
- (1)
- The spatial distribution of NTL and LST in the GZPUA exhibits a clear coupling relationship with the natural environment, such as vegetation and elevation. In the northwest and south are the Qinling Mountains, which have higher elevations, lush vegetation, and a lower surface temperature. The central basin area is not conducive to effective heat dissipation, resulting in relatively elevated surface temperatures.
- (2)
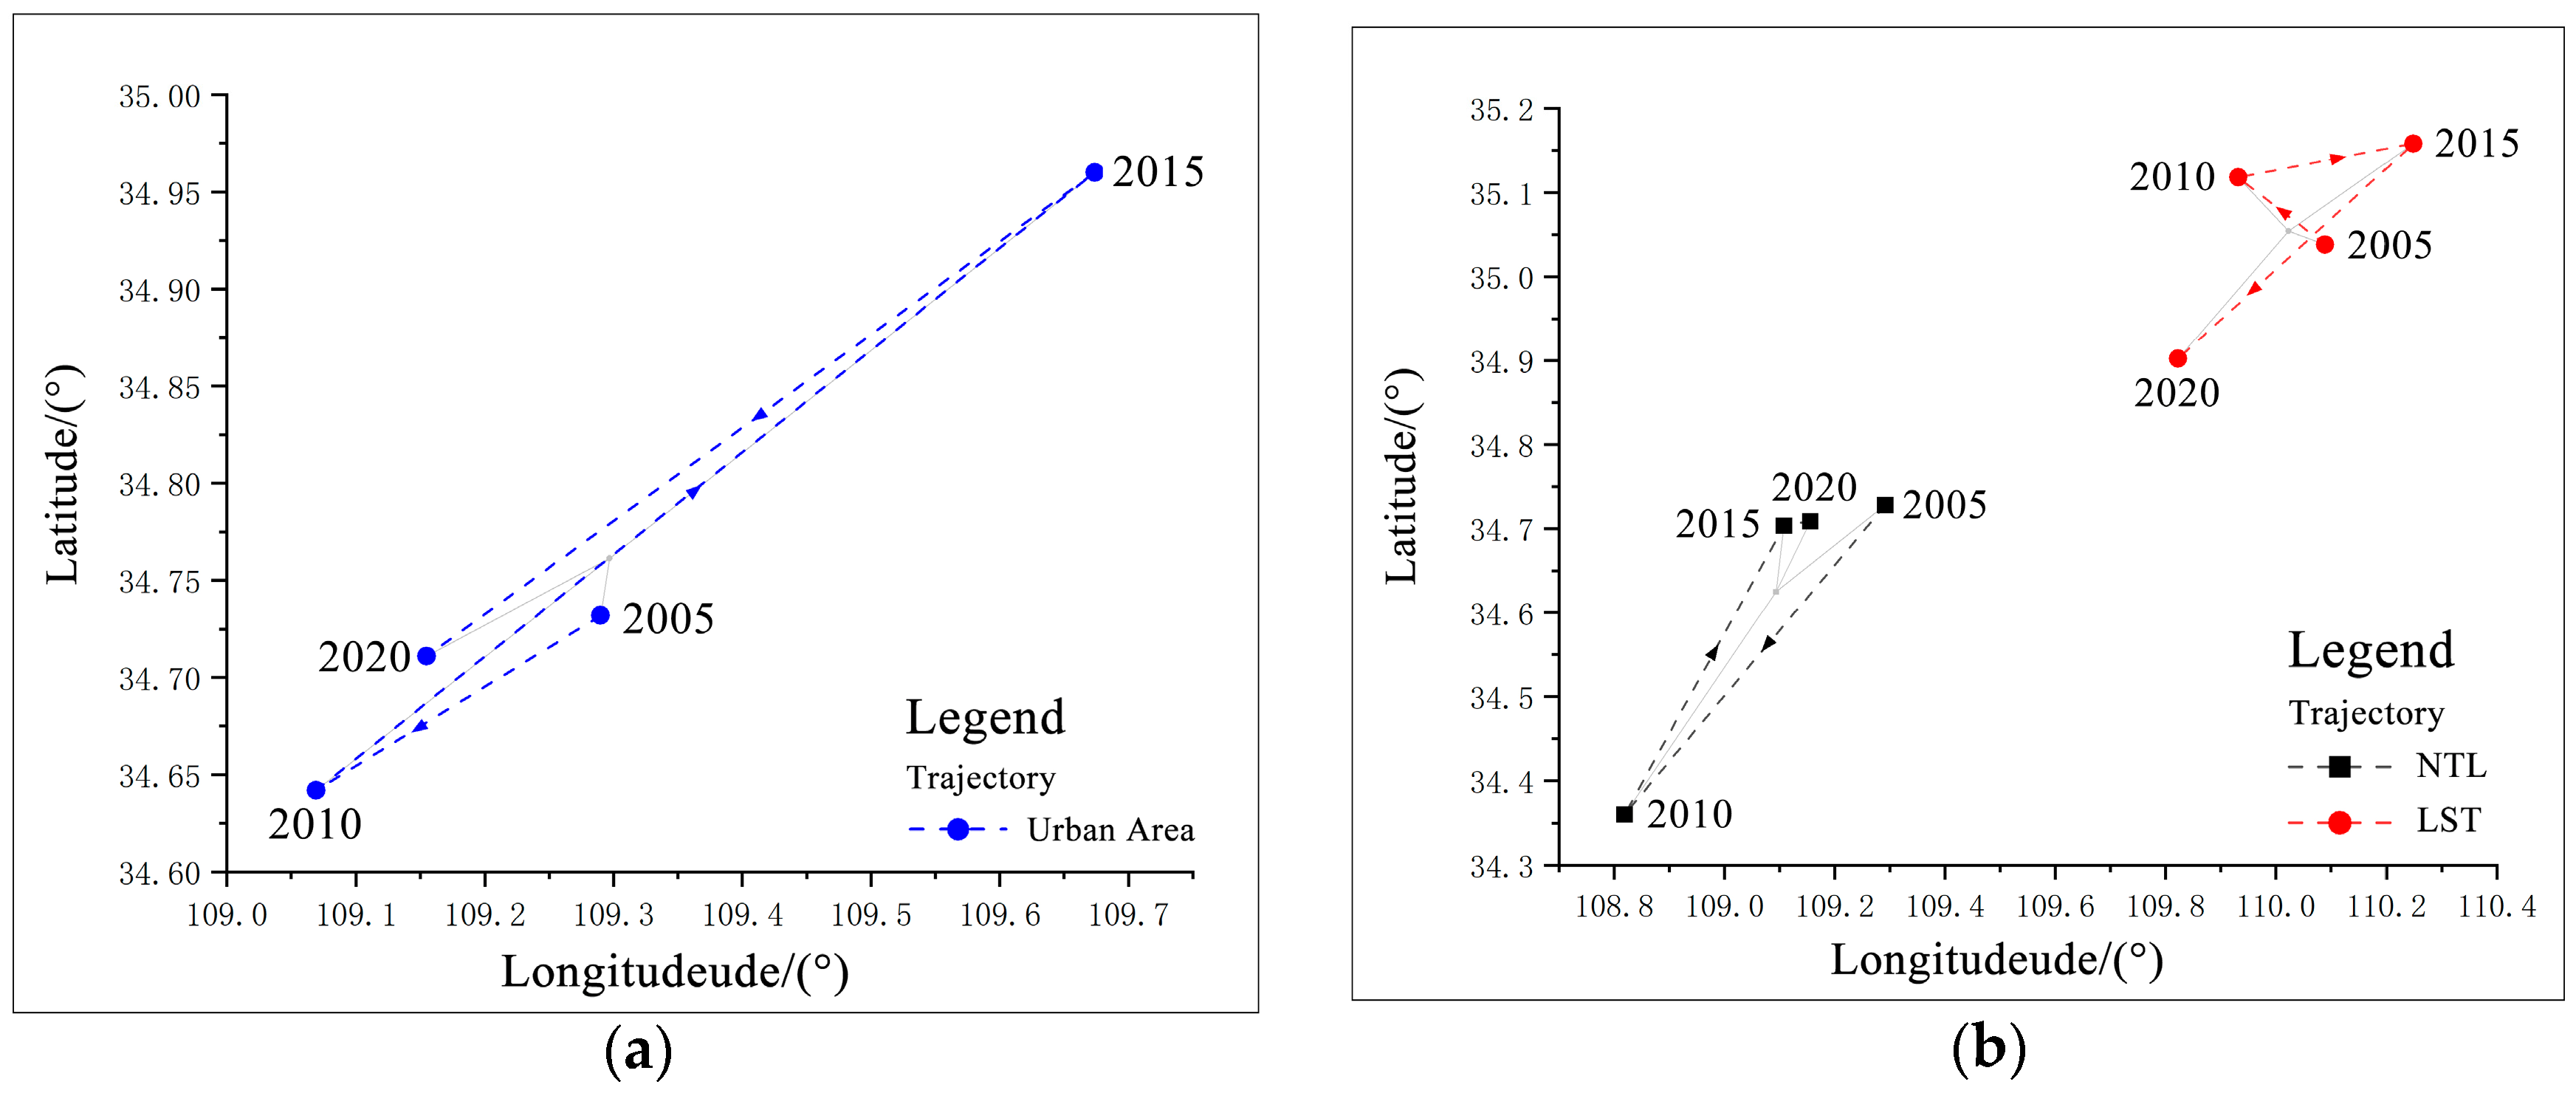
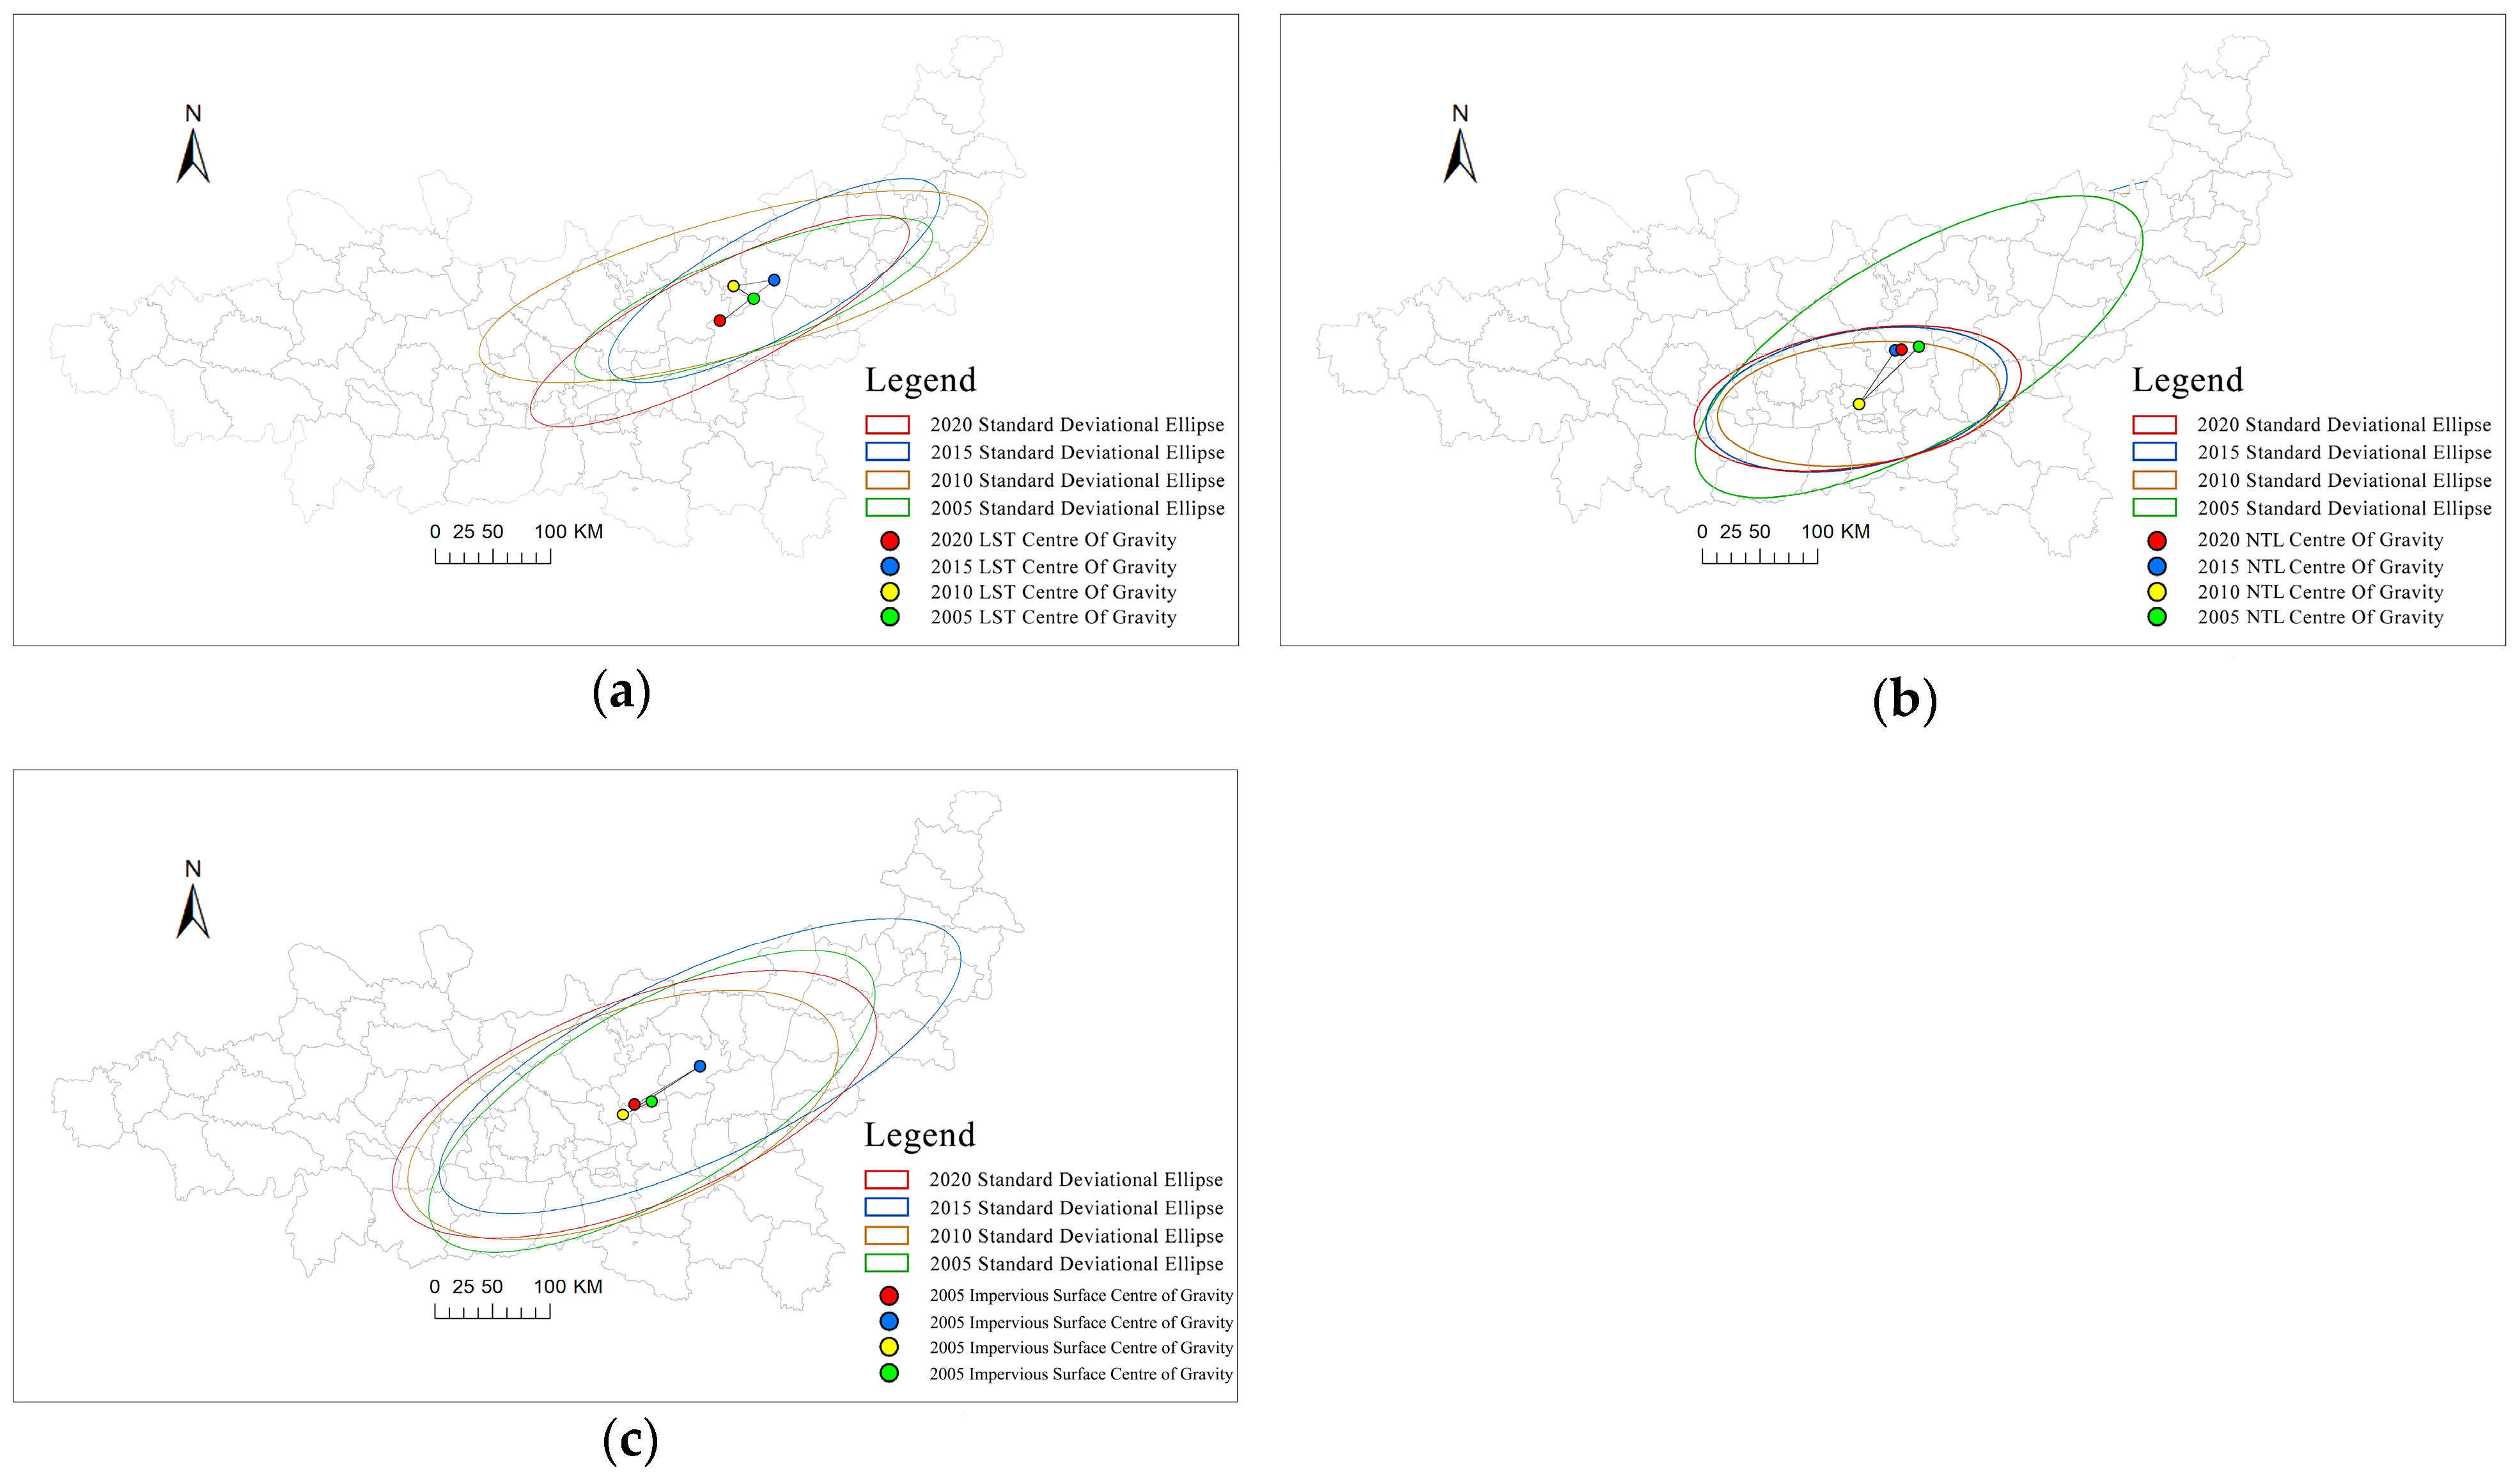
- During the research period, there was a noticeable increase in the correlation between NTL and LST in the built-up areas of different cities in the GZPUA. The spatial centers of gravity of LST, NTL, and built-up land produce highly overlapping trajectories toward the southwest, and urban development produces the same dynamic trend.
- (3)
- The coupling type between NTL and LST in GZPUA is influenced by the geographic factors dominated by the Qinling Mountains in the early stage of the study, gradually breaking through in the later stage. The level of coupling coordination is manifested as a base of bonding type in the non-built-up area; the coordinated type appears in the built-up area of the city in a contiguous form, and the antagonistic type becomes a point-like disjointed state.
- (4)
- The correlation coefficient and bivariate Moran’s I between NTL and LST in the GZPUA are both positive and significant, indicating a significant positive correlation between the two variables. Therefore, the UD in the GZPUA will increase LST in the area and surrounding areas, and NTL will gradually strengthen its positive effects on LST. With a clear trend of continuous coverage, the HH concentration of NTL and LST gradually increases.
Author Contributions
Funding
Institutional Review Board Statement
Informed Consent Statement
Data Availability Statement
Conflicts of Interest
Abbreviations
| UAD | urban agglomeration development |
| LST | land surface temperature |
| GZPUA | Guanzhong Plain Urban Agglomeration |
| NTL | nighttime light |
| UHI | urban heat island |
| IPCC | Intergovernmental Panel on Climate Change |
| UD | urban development |
| PD | population density |
| MODIS | Moderate-Resolution Imaging Spectroradiometer |
| RESDCCAS | Resource and Environmental Science and Data Center of the Chinese Academy of Sciences |
| OCPM | overall coupled potential model |
| SCCM | spatial coupled coordination model |
| SDE | standard deviational ellipse |
| BSA | bivariate spatial autocorrelation |
| LPI | largest patch index |
| AI | Aggregation Index |
| H-H | high–high |
| L-L | low–low |
| H-L | high–low |
| L-H | low–high |
References
- Cai, W.; Zhang, C.; Suen, H.P.; Ai, S.; Bai, Y.; Bao, J.; Chen, B.; Cheng, L.; Cui, X.; Dai, H.; et al. The 2020 China report of the Lancet Countdown on health and climate change. Lancet Public Health 2021, 6, E64–E81. [Google Scholar] [CrossRef] [PubMed]
- Karinou, F.; Agathangelidis, I.; Cartalis, C. Assessing the Combined Impact of Land Surface Temperature and Droughts to Heatwaves over Europe Between 2003 and 2023. Remote Sens. 2025, 17, 1655. [Google Scholar] [CrossRef]
- Xu, L.; Wang, J.; Zhou, W. Impact of urban agglomeration development on spatial pattern evolution of regional heat islands. Acta Ecol. Sin. 2024, 44, 11035–11048. [Google Scholar]
- Hoegh-Guldberg, O.; Jacob, D.; Taylor, M.; Guillén Bolaños, T.; Bindi, M.; Brown, S.; Camilloni, I.A.; Diedhiou, A.; Djalante, R.; Ebi, K.; et al. The human imperative of stabilizing global climate change at 1.5°C. Science 2019, 365, 6974. [Google Scholar] [CrossRef]
- Li, R.; Cui, W. Temporal-spatial evolution and influencing factors of ecological security in the city cluster of Yangtze River Delta. Res. Soil Water Conserv. 2025, 32, 377–386. [Google Scholar]
- Cai, D.; Fraedrich, K.; Guan, Y.; Guo, S.; Zhang, C. Urbanization and the thermal environment of Chinese and US-American cities. Sci. Total Environ. 2017, 589, 200–211. [Google Scholar] [CrossRef]
- Tian, H.; Liu, L.; Zhang, Z.; Chen, H.; Zhang, X.; Wang, T.; Kang, Z. Spatiotemporal differentiation and attribution of land surface temperature in China in 2001-2020. J. Geogr. Sci. 2024, 34, 375–396. [Google Scholar] [CrossRef]
- Noreena; Moazzam, U.F.M.; Jamil, M.; Arshad, S. Dynamics of land cover/land use with heat islands phenomenon and its ecological evaluation using remote sensing data (1992–2022). Environment, 2025; in press. [Google Scholar]
- Pedzisai, K.; Onisimo, M.; John, O.; Timothy, D. Effect of landscape pattern and spatial configuration of vegetation patches on urban warming and cooling in Harare metropolitan city, Zimbabwe. GIScience Remote Sens. 2021, 58, 261–280. [Google Scholar]
- Wang, Y.; Ren, Y. Cooling Efficiency of Urban Green Spaces Across Functional Zones: Mitigating Heat Island Effects Through Spatial Configuration. Sustainability 2025, 17, 2275. [Google Scholar] [CrossRef]
- Qiao, K.; Zhu, W.; Hu, D.; Hao, M.; Chen, S.; Cao, S. Examining the distribution and dynamics of impervious surface in different functional zones of Beijing. Acta Geogr. Sin. 2017, 72, 2018–2031. [Google Scholar]
- Cao, S.; Hu, D.; Zhao, W.; Chen, S.; Cheng, Q. Spatial structure comparison of urban agglomerations between China and USA in a perspective of impervious surface coverage: A case study of Beijing-Tianjin-Hebei and Boswash. Acta Geogr. Sin. 2017, 72, 1017–1031. [Google Scholar]
- Chen, H.; Liu, L.; Zhang, Z.; Liu, Y.; Tian, H.; Kang, Z.; Wang, T.; Zhang, X. Spatiotemporal correlation between human activity intensity and surface temperature on the north slope of Tianshan Mountains. Acta Geogr. Sin. 2022, 77, 1244–1259. [Google Scholar]
- Qiao, Z.; He, T.; Lu, Y.; Sun, Z.; Xu, X.; Yang, J. Quantifying the contribution of land use change based on the effects of global climate change and human activities on urban thermal environment in the Beijing-Tianjin-Hebei urban agglomeration. Geogr. Res. 2022, 41, 1932–1947. [Google Scholar]
- Okumus, D.E.; Akay, M. Quantitative assessment of non-stationary relationship between multi-scale urban morphology and urban heat. Build. Environ. 2025, 272, 112669. [Google Scholar] [CrossRef]
- Ikuemonisan, E.F.; Ogunjo, T.S.; Popogbe, O.O.; Tariq, A. Urban Heatwave Dynamics in Lagos State: Evidence from the Analysis of Land Surface Temperature Trends and Land Cover Changes (2000–2022). Earth Syst. Environ. 2025; in press. [Google Scholar] [CrossRef]
- Akter, T.; Gazi, Y.M.; Mia, B.M. Assessment of Land Cover Dynamics, Land Surface Temperature, and Heat Island Growth in Northwestern Bangladesh Using Satellite Imagery. Environ. Process. 2021, 8, 661–690. [Google Scholar] [CrossRef]
- Liu, H.; Shen, G.; Huang, Q. Evolution of urban heat island effect and its relationship with land use change in wuhan city in recent 10 years. Resour. Environ. Yangtze Basin 2017, 26, 1466–1475. [Google Scholar]
- Yang, H.; Wang, X.; Zhang, S.; Li, X. Change characteristics of urban heat island effect and its response to urban expansion in Gansu Province. Remote Sens. Technol. Appl. 2025, 40, 110–121. [Google Scholar]
- Zhang, Z.; Paschalis, A.; Mijic, A.; Meili, N.; Manoli, G.; van Reeuwijk, M.; Fatichi, S. A mechanistic assessment of urban heat island intensities and drivers across climates. Urban Climate 2022, 44, 101215. [Google Scholar] [CrossRef]
- Alzamili, E.H.M.; Mahammood, V.; Rao, J.P. Assessment of urban heat island based on remote sensing and geo-spatial approach in Al-Kut Region, Iraq. J. Earth Syst. Sci. 2025, 134, 103. [Google Scholar] [CrossRef]
- Shen, Z.; Zeng, J. Spatial Relationship of Heat Island Intensity to Correlated Land Surface Factors in Xiamen City. Sci. Geogr. Sin. 2020, 40, 842–852. [Google Scholar]
- Yang, Z.; Chen, Y.; Wu, Z.; Zheng, Z.; Li, J. Spatial pattern of urban heat island and multivariate modeling of impact factors in the Guangdong-Hong Kong- Macao Greater Bay area. Resour. Sci. 2019, 41, 1154–1166. [Google Scholar]
- Peng, B.; Shi, Y.; Wang, H.; Wang, Y. The impacting mechanism and laws of function of urban heat islands effect: A case study of Shanghai. Acta Geogr. Sin. 2013, 68, 1461–1471. [Google Scholar]
- Chen, W.; Zhang, Y.; Peng, C.; Gao, W. Evaluation of Urbanization Dynamics and its Impacts on Surface Heat Islands: A Case Study of Beijing, China. Remote Sens. 2017, 9, 453. [Google Scholar] [CrossRef]
- Xu, H.; Shi, T.; Wang, M.; Lin, Z. Land cover changes in the Xiong’ an New Area and a prediction of ecological response to forthcoming regional planning. Acta Ecol. Sin. 2017, 37, 6289–6301. [Google Scholar]
- Xu, H.; Li, C.; Wang, H.; Liu, M.; Hu, Y. Impact of land use change on the spatiotemporal evolution of the regional thermal environment in the Beijing-Tianjin-Hebei urban agglomeration. China Environ. Sci. 2023, 43, 1340–1348. [Google Scholar]
- Liu, C.; Li, Y. Spatio-Temporal Features of Urban Heat Island and Its Relationship with Land Use/Cover in Mountainous City: A Case Study in Chongqing. Sustainability 2018, 10, 1943. [Google Scholar] [CrossRef]
- Xia, S.; Chen, H.; Zhang, J.; Liu, Y. Spatial autocorrelation analysis of ecological land dynamic evolution and thermal environment: A case study of Shanxi central urban agglomeration. China Environ. Sci. 2024, 44, 1032–1040. [Google Scholar]
- Jiang, S.; Peng, J.; Dong, J. Conceptual connotation and quantitative characterization of surface urban heat island effect. Acta Geogr. Sin. 2022, 77, 2249–2265. [Google Scholar]
- Clinton, N.; Gong, P. MODIS detected surface urban heat islands and sinks: Global locations and controls. Remote Sens. Environ. 2013, 134, 294–304. [Google Scholar] [CrossRef]
- Yang, C.; He, W.; Zhu, M.; Jia, Z.; Xu, Z.; Yang, W. Evaluation of urban heat island over Hefei based on meteorological observations and MODIS data. China Environ. Sci. 2023, 43, 243–250. [Google Scholar] [CrossRef]
- Yang, C.; Zhan, Q.; Gao, S.; Liu, H. How Do the Multi-Temporal Centroid Trajectories of Urban Heat Island Correspond to Impervious Surface Changes: A Case Study in Wuhan, China. Int. J. Environ. Res. Public Health 2019, 16, 3865. [Google Scholar] [CrossRef] [PubMed]
- Arunab, S.K.; Mathew, A. Impact of planned urban development on urban heat island effect: Resilient cities for a sustainable future. Environ. Sci. Pollut. Res. 2025; in press. [Google Scholar] [CrossRef] [PubMed]
- Mokhtari, Z.; Bergantino, A.S.; Intini, M.; Elia, M.; Buongiorno, A.; Giannico, V.; Sanesi, G.; Lafortezza, R. Nighttime light extent and intensity explain the dynamics of human activity in coastal zones. Sci. Rep. 2025, 15, 1663. [Google Scholar] [CrossRef]
- Koimtzidis, M.; Falalakis, G.; Stathopoulos, S.; Kopsidas, O.; Kourtidis, K.; Gemitzi, A. Assessing development patterns and carrying capacity using nighttime light analysis: A case study in Greece. Remote Sens. Appl. Soc. Environ. 2025, 37, 101462. [Google Scholar] [CrossRef]
- Jhamb, P.; Ferreira, S.; Stephens, P.; Sundaram, M.; Wilson, J. Shedding light on development: Leveraging the new nightlights data to measure economic progress. PLoS ONE 2025, 20, e0318482. [Google Scholar] [CrossRef]
- McAvoy, G.; Vadrevu, P.K. Nighttime Lights and Population Variations in Cities of South/Southeast Asia: Distance-Decay Effect and Implications. Remote Sens. 2024, 16, 4458. [Google Scholar] [CrossRef]
- National Development and Reform Commission. Available online: https://www.ndrc.gov.cn/xxgk/zcfb/ghwb/201802/W020190905497950286587.pdf (accessed on 16 May 2025).
- Zhao, R.; Wang, H.; Dong, Y. Impact of climate change on grain yield and its trend across Guanzhong region. Chin. J. Eco-Agric. 2020, 28, 467479. [Google Scholar]
- Xu, D.; Huang, Z.; Huang, R. The spatial effects of haze on tourism flows of Chinese cities: Empirical research based on the spatial panel econometric model. Acta Geogr. Sin. 2019, 74, 814–830. [Google Scholar]
- Zhang, X.; Kasimu, A.; Liang, H. Coordination Analysis of Temporal and Spatial Variation of Land Surface Temperature and Urban Development in Shihezi Oasis. J. Ecol. Rural Environ. 2023, 39, 324–334. [Google Scholar]
- Yu, Z.; Wang, Y.; Ding, N.; Yang, X. Assessing the Contributions of Urban Green Space Indices and Spatial Structure in Mitigating Urban Thermal Environment. Remote Sens. 2023, 15, 2414. [Google Scholar]
- Iftakhar, N.; Islam, F.; Izhar Hussain, M.; Ahmad, M.N.; Lee, J.; Ur Rehman, N.; Qaysi, S.; Alarifi, N.; Youssef, Y.M. Revealing Land-Use Dynamics on Thermal Environment of Riverine Cities Under Climate Variability Using Remote Sensing and Geospatial Techniques. ISPRS Int. J. Geo-Inf. 2024, 14, 13. [Google Scholar] [CrossRef]
- Paris, G.R.; Rienow, A. Shedding light on local development: Unveiling spatial dynamics from infrastructure implementation through nighttime lights in the Nacala corridor, Mozambique. Remote Sens. Appl. Soc. Environ. 2025, 37, 101388. [Google Scholar] [CrossRef]
- Castillo, D.P.F.M.; Fujimi, T.; Tatano, H. Estimating medium-term regional monthly economic activity reductions during the COVID-19 pandemic using nighttime light data. Int. J. Appl. Earth Obs. Geoinf. 2024, 135, 104223. [Google Scholar] [CrossRef]
- Zhang, J.; Liang, Y.; Wang, J.; Zhang, J. Temporal and spatial characteristics of urban heat island effect and its influencing factors in Beijing from 1981 to 2020. Trans. Atmos. Sci. 2024, 47, 581–591. [Google Scholar]
- Hu, L.; Xie, Y.; Cui, S.; Zhou, P.; Li, Y.; Sun, S. The characteristics and driving forces of summer urban heat island in Guanzhong Plain urban agglomeration. China Environ. Sci. 2021, 41, 3842–3852. [Google Scholar]
- Yang, Z.; Chen, Y.; Wu, Z.; Zheng, Z. The Coupling Between Construction Land Expansion and Urban Heat Island Expansion in Guangdong-Hong Kong-Macao Greater Bay. J. Geo-Inf. Sci. 2018, 20, 1592–1603. [Google Scholar]
- Zhang, M.; Chang, Z.; He, X.; Wei, Y.; Liu, D. Coupling Trend and Spatial Relationship Between Urban Development and Land Surface Temperature. Remote Sens. Inf. 2024, 39, 129–138. [Google Scholar]
- Hu, Y.; Tao, F.; Zhou, T.; Yan, J.; Liu, R. Urban Heat Island Assessment Method Integrated by Multi-source Remote Sensing Data. Remote Sens. Inf. 2021, 36, 61–68. [Google Scholar]
- Yang, J.; Li, Z.; Yin, F.; Liu, J.; He, L. Spatio-temporal Correlation Between Human Activity Intensity and Remote Sensing Ecological Index in the Guanzhong Plain Urban Agglomeration. Environ. Sci. 2025, in press. [CrossRef]
- Ji, W.; Huang, X.; Bao, W.; Ma, Y. Spatiotemporal correlation characteristics and driving forces of human activity intensity and surface temperature in the Guanzhong area. Arid Land Geogr. 2024, 47, 967–979. [Google Scholar]
- Shen, Z.; Zeng, J. Spatial relationship of urban development to land surface temperature in three cities of southern Fujian. Acta Geogr. Sin. 2021, 76, 566–583. [Google Scholar]
- Chhachhiya, D.; Kumar, A.; Pipralia, S. Scoping review to understand planning approach for urban development in ecologically sensitive Hilly areas. Discov. Cities 2025, 2, 24. [Google Scholar] [CrossRef]
- Shamaee, H.S.; Yousefi, H.; Zahedi, R. Environmental Sustainability Assessment of Urban Development Indicators. J. Inst. Eng. (India) Ser. A, 2025; in press. [Google Scholar]
- Neste, V.L.S.; D’Amours, M.A.; Poulin, É.; Madénian, H. Blinders of extreme heat adaptation: Uneven urban development and the reproduction of vulnerabilities. Local Environ. 2025, 30, 288–306. [Google Scholar] [CrossRef]
- Amini, H.; Jabari, S.; McGrath, H. Assessing Future Changes in Mean Radiant Temperature: Considering Climate Change and Urban Development Impacts in Fredericton, New Brunswick, Canada, by 2050. GeoHazards 2025, 6, 10. [Google Scholar] [CrossRef]
- Tirthankar, B.; Arijit, D.; Ketan, D.; Paulo, P. Urban expansion induced loss of natural vegetation cover and ecosystem service values: A scenario-based study in the siliguri municipal corporation (Gateway of North-East India). Land Use Policy 2023, 132, 106838. [Google Scholar]
- Krasniqi, V.; Rapuca, A. Impact Assessment of Urban Development Patterns on Land Surface Temperature and Urban Heat Islands Using Remote Sensing Techniques—A Case Study of Prishtina, Kosov. J. Ecol. Eng. 2024, 25, 91–100. [Google Scholar] [CrossRef]
- Valderrama, C.; Diaz, L.; Ceron, A. Trends of the ecological footprint and urban development: A systematic and bibliometric review. Ecol. Front. 2024, 4, 865–873. [Google Scholar] [CrossRef]
- Zhang, Y.; Chu, S.; Ye, K.; Li, Y.; Lu, J. Experimental study on improvement effect of natural ventilation, cold roofand external shading on indoor thermal environment. Heat. Vent. Air Cond. 2024, 54, 106–111. [Google Scholar]


| Condition | Type | Meaning |
|---|---|---|
| 0.9 ˂ O ≤ 1, UR ˂ TR | Coordinated-prior type | TR ahead of UR development |
| 0.9 ˂ O ≤ 1, UR > TR | Coordinated-lagging type | UR ahead of TR development |
| 0.5 ˂ O ≤ 0.9, UR ˂ TR | Bonding-prior type | TR ahead of UR development |
| 0.5 ˂ O ≤ 0.9, UR > TR | Bonding-lagging type | UR ahead of TR development |
| 0 ≤ O ≤ 0.5, UR ˂ TR | Antagonistic-prior type | TR ahead of UR development |
| 0 ≤ O ≤ 0.5, UR > TR | Antagonistic-lagging type | UR ahead of TR development |
| Year | Moran’s I | Z-Value |
|---|---|---|
| 2005 | 0.289 | 62.9797 *** |
| 2010 | 0.294 | 62.1902 *** |
| 2015 | 0.274 | 57.3977 *** |
| 2020 | 0.335 | 70.4616 *** |
Disclaimer/Publisher’s Note: The statements, opinions and data contained in all publications are solely those of the individual author(s) and contributor(s) and not of MDPI and/or the editor(s). MDPI and/or the editor(s) disclaim responsibility for any injury to people or property resulting from any ideas, methods, instructions or products referred to in the content. |
© 2025 by the authors. Licensee MDPI, Basel, Switzerland. This article is an open access article distributed under the terms and conditions of the Creative Commons Attribution (CC BY) license (https://creativecommons.org/licenses/by/4.0/).
Share and Cite
Feng, X.; Li, F.; Somenahalli, S.; Zhao, Y.; Li, M.; Zhou, Z.; Li, F. Analysis of the Coupling Trend Between the Urban Agglomeration Development and Land Surface Heat Island Effect: A Case Study of Guanzhong Plain Urban Agglomeration, China. Sustainability 2025, 17, 5239. https://doi.org/10.3390/su17125239
Feng X, Li F, Somenahalli S, Zhao Y, Li M, Zhou Z, Li F. Analysis of the Coupling Trend Between the Urban Agglomeration Development and Land Surface Heat Island Effect: A Case Study of Guanzhong Plain Urban Agglomeration, China. Sustainability. 2025; 17(12):5239. https://doi.org/10.3390/su17125239
Chicago/Turabian StyleFeng, Xiaogang, Fei Li, Sekhar Somenahalli, Yang Zhao, Meng Li, Zaihui Zhou, and Fengxia Li. 2025. "Analysis of the Coupling Trend Between the Urban Agglomeration Development and Land Surface Heat Island Effect: A Case Study of Guanzhong Plain Urban Agglomeration, China" Sustainability 17, no. 12: 5239. https://doi.org/10.3390/su17125239
APA StyleFeng, X., Li, F., Somenahalli, S., Zhao, Y., Li, M., Zhou, Z., & Li, F. (2025). Analysis of the Coupling Trend Between the Urban Agglomeration Development and Land Surface Heat Island Effect: A Case Study of Guanzhong Plain Urban Agglomeration, China. Sustainability, 17(12), 5239. https://doi.org/10.3390/su17125239