Article

Evolution and Spatial Correlation Network Analysis of the Coupling Coordination Degree of Urban Intelligent Industry and Green Industry in the Yellow River Basin

1
College of Economics, Shandong Normal University, Jinan 250358, China
2
College of Economics and Management, Shandong Huayu University of Technology, Dezhou 253034, China
*
Author to whom correspondence should be addressed.
Sustainability 2025, 17(12), 5237; https://doi.org/10.3390/su17125237
Submission received: 24 April 2025 / Revised: 3 June 2025 / Accepted: 4 June 2025 / Published: 6 June 2025

Abstract

:
This paper uses a coupling model and social network analysis to analyze the evolution and spatial correlation network characteristics of the coupling coordination level between urban intelligent industry and green industry in the Yellow River Basin from 2011 to 2021. At the same time, QAP analysis is used to explore the influence mechanism of the spatial correlation network. The results indicate the following: (1) The coupling coordination level between urban intelligent industry and green industry in the Yellow River Basin continues to improve, but no city has reached the level of extreme coordination; (2) The spatial correlation network of coupling coordination between urban intelligent industry and green industry in the Yellow River Basin has been basically formed, but the spatial synergy needs to be improved; (3) The central cities play an important role as “intermediary” in the spatial correlation network, the role of “bridge” in eastern coastal cities and western fringe cities is not obvious, and the radiation and driving effects of provincial capital cities and developed cities are not obvious; and (4) The differences in geographical distance, scientific and technological innovation, and financial services inhibit the communication and cooperation among cities, and the differences in informatization level can promote the optimization of spatial correlation network.

1. Introduction

China has identified high-quality development as the primary task of building a modern socialist country in an all-around way, highlighting the fact that the quality of development has a more important strategic position than the speed of development. The industrial sector plays a leading role in the national economy, but it is also the sector that consumes the most energy and emits the most pollutants, and the green development of industry is a necessary way to realize high-quality economic development. “Made in China 2025” and “Industry 4.0” have become the focus of attention of the fourth industrial revolution. Intelligent industry attaches importance to the application of information technology, intelligent equipment, and other new quality productivity. It is an important way for China to transform from a large industrial country to an industrial power, and it is the rightful meaning of the high-quality development of the economy. Intelligent industry can improve the energy use efficiency of the industrial sector and reduce the number of pollutants discharged [1], promoting the development of green industry, but at the same time, the energy consumption of data centers is an important issue that needs to be considered by the intelligent industry; while green industry can optimize the urban ecological environment, which in turn improves the structure of human capital and improves the efficiency of innovation [2], promoting the development of intelligent industry, however, stringent environmental standards have adverse effects on the development of urban intelligent industries. It can be seen that there is a close mutual promotion and mutual constraint relationship between urban intelligent industry and urban green industry.
With the proposal and implementation of a high-quality development strategy, many scholars have studied intelligent industry and green industry. Intelligent industry realizes the application of technologies such as the Internet, the Internet of Things, big data, and cloud computing in the industrial sector, and the design of the service system that integrates information technology and intelligent equipment with each other meets the needs of the intelligent development of industry [3]. For a long time, China’s industrial economy has been characterized by high input, low output, high energy consumption, and high pollution. The green development level of industry lags behind that of agriculture and the service industry, so it should accelerate the construction of green production and consumption methods, and promote the development of green transformation of industry with technological progress [4]. Some scholars have conducted evaluation studies on intelligent industry and green industry: Wang W (2022) constructed an index system to evaluate the intelligent manufacturing level of chair manufacturing enterprises [5]; Li W (2023) analyzed the problems existing in China’s intelligent manufacturing [6]; Chen W (2017) established a comprehensive evaluation system from the dimensions of green industry performance, including economic growth, social stability, and environmental friendliness, and conducted evaluation research on 18 provinces with a high degree of industrialization in China [7]; Wang Y (2021) evaluated the development performance of green industry by establishing an indicator system from the four dimensions of economy, society, environment, and innovation [8], but the evaluation objects were mostly limited to the provincial level, and the evaluation indicators such as the coverage rate of graded highways and the sales revenue of new products were not related to the urban intelligent industry, the green industry were not highly relevant, and the systematicness, comprehensiveness, and effectiveness of the evaluation index system need to be further improved. Although some scholars have explored the relationship between intelligent industry and green industry, most of the research still stays in the unidirectional role, such as the impact of industrial robotics and artificial intelligence technology on green industry [9,10], and the impact of green finance and environmental regulation on intelligent industry [11,12]. Some scholars have conducted research on the spatial correlation network of urban economy, finding that the spatial correlation network of innovation efficiency and tourism economy has gradually formed within the region [13,14]. However, there are fewer studies on the coupling mechanism and coupling level of intelligent industry and green industry, and even fewer scholars pay attention to the spatial correlation network of urban intelligent industry and green industry coupling coordination.
Ecological fragility is the biggest problem facing the Yellow River Basin, and General Secretary Xi Jinping has repeatedly emphasized the need to promote the ecological protection and high-quality development of the Yellow River Basin, so there is an urgent need to promote the coupling and interaction between urban intelligent industry and green industry in the Yellow River Basin, but at present the level of coupling between the two is still insufficient. In view of this, based on existing research, this article supplements and improves the evaluation index system of urban intelligent industry and green industry, and analyzes the evolution of the coordination level between urban intelligent industry and green industry in the Yellow River Basin, as well as the characteristics of its spatial correlation network. At the same time, this article also explores the influencing factors of the spatial correlation network, providing a reference for the high-quality development of the Yellow River Basin economy.

2. Concepts of Urban Intelligent Industry and Urban Green Industry

2.1. Concepts of Urban Intelligent Industry

The combination of communication technology, cloud computing, and synthetic control has promoted the development of the industrial Internet, provided solutions for optimizing resource management and dynamic scheduling, effectively solved the complex resource allocation problem in the industrial production process, and realized the efficient management of resources [1]. The Internet and e-commerce inject impetus into commercial activities, realize the transformation of traditional factories to electronic factories and local factories to global factories, and gradually realize the monitoring of workshops, production prediction, and operation arrangement, prompting enterprises to share information and establish closer partnerships [15]. Cloud computing technology has changed the traditional industrial development model, realized the integration of product innovation and business strategy, built and formed an intelligent factory collaboration network, and enabled users to enjoy high-quality product lifecycle services [16]. Compared with the traditional industrial development model, the intelligent industry pays more attention to the research and application of intelligent technologies and intelligent equipment, thereby achieving the optimal allocation of resources and the continuous improvement of production efficiency. Therefore, the paper proposes the concept of urban intelligent industry, a city industrial economic development model that strengthens talent cultivation and technological innovation within the urban area, applies intelligent technologies such as big data and artificial intelligence, as well as intelligent devices like industrial robots to industrial production and operation processes, and aims to optimize resource allocation and enhance production efficiency through a comprehensive improvement in the city’s industrial technology level.

2.2. Concepts of Urban Green Industry

Green industry improves the use efficiency of raw materials, energy, and water, reduces the amount of waste discharged, and emphasizes resource efficiency, environmental friendliness, and sustainable development in the production and consumption process, which helps to enhance the international competitiveness of industrial enterprises [17]. The layout of industrial clusters in various regional forms, such as parks and urban areas, can effectively improve the allocation and use efficiency of waste resources, give full play to the spillover effect, correlation effect, and agglomeration effect, and realize the continuous improvement of the development level of urban green industry. It can be found that urban green industry pays more attention to green production and green consumption in terms of structure, emphasizes environmental protection and pollution control, continuously improves the use ratio of clean energy and the use efficiency of waste, and finally achieves the effect of energy saving, emission reduction and ecological environment improvement. Therefore, the definition of urban green industry is to optimize the policies and environment of urban green economic development by applying green concepts and technologies to the entire process of industrial economic development. This process emphasizes energy conservation and emission reduction in the production process, as well as plans for a circular economy within the city. At the same time, it strengthens the recycling, distribution, and utilization of waste, which can significantly improve resource utilization efficiency and reduce pollutant emissions.

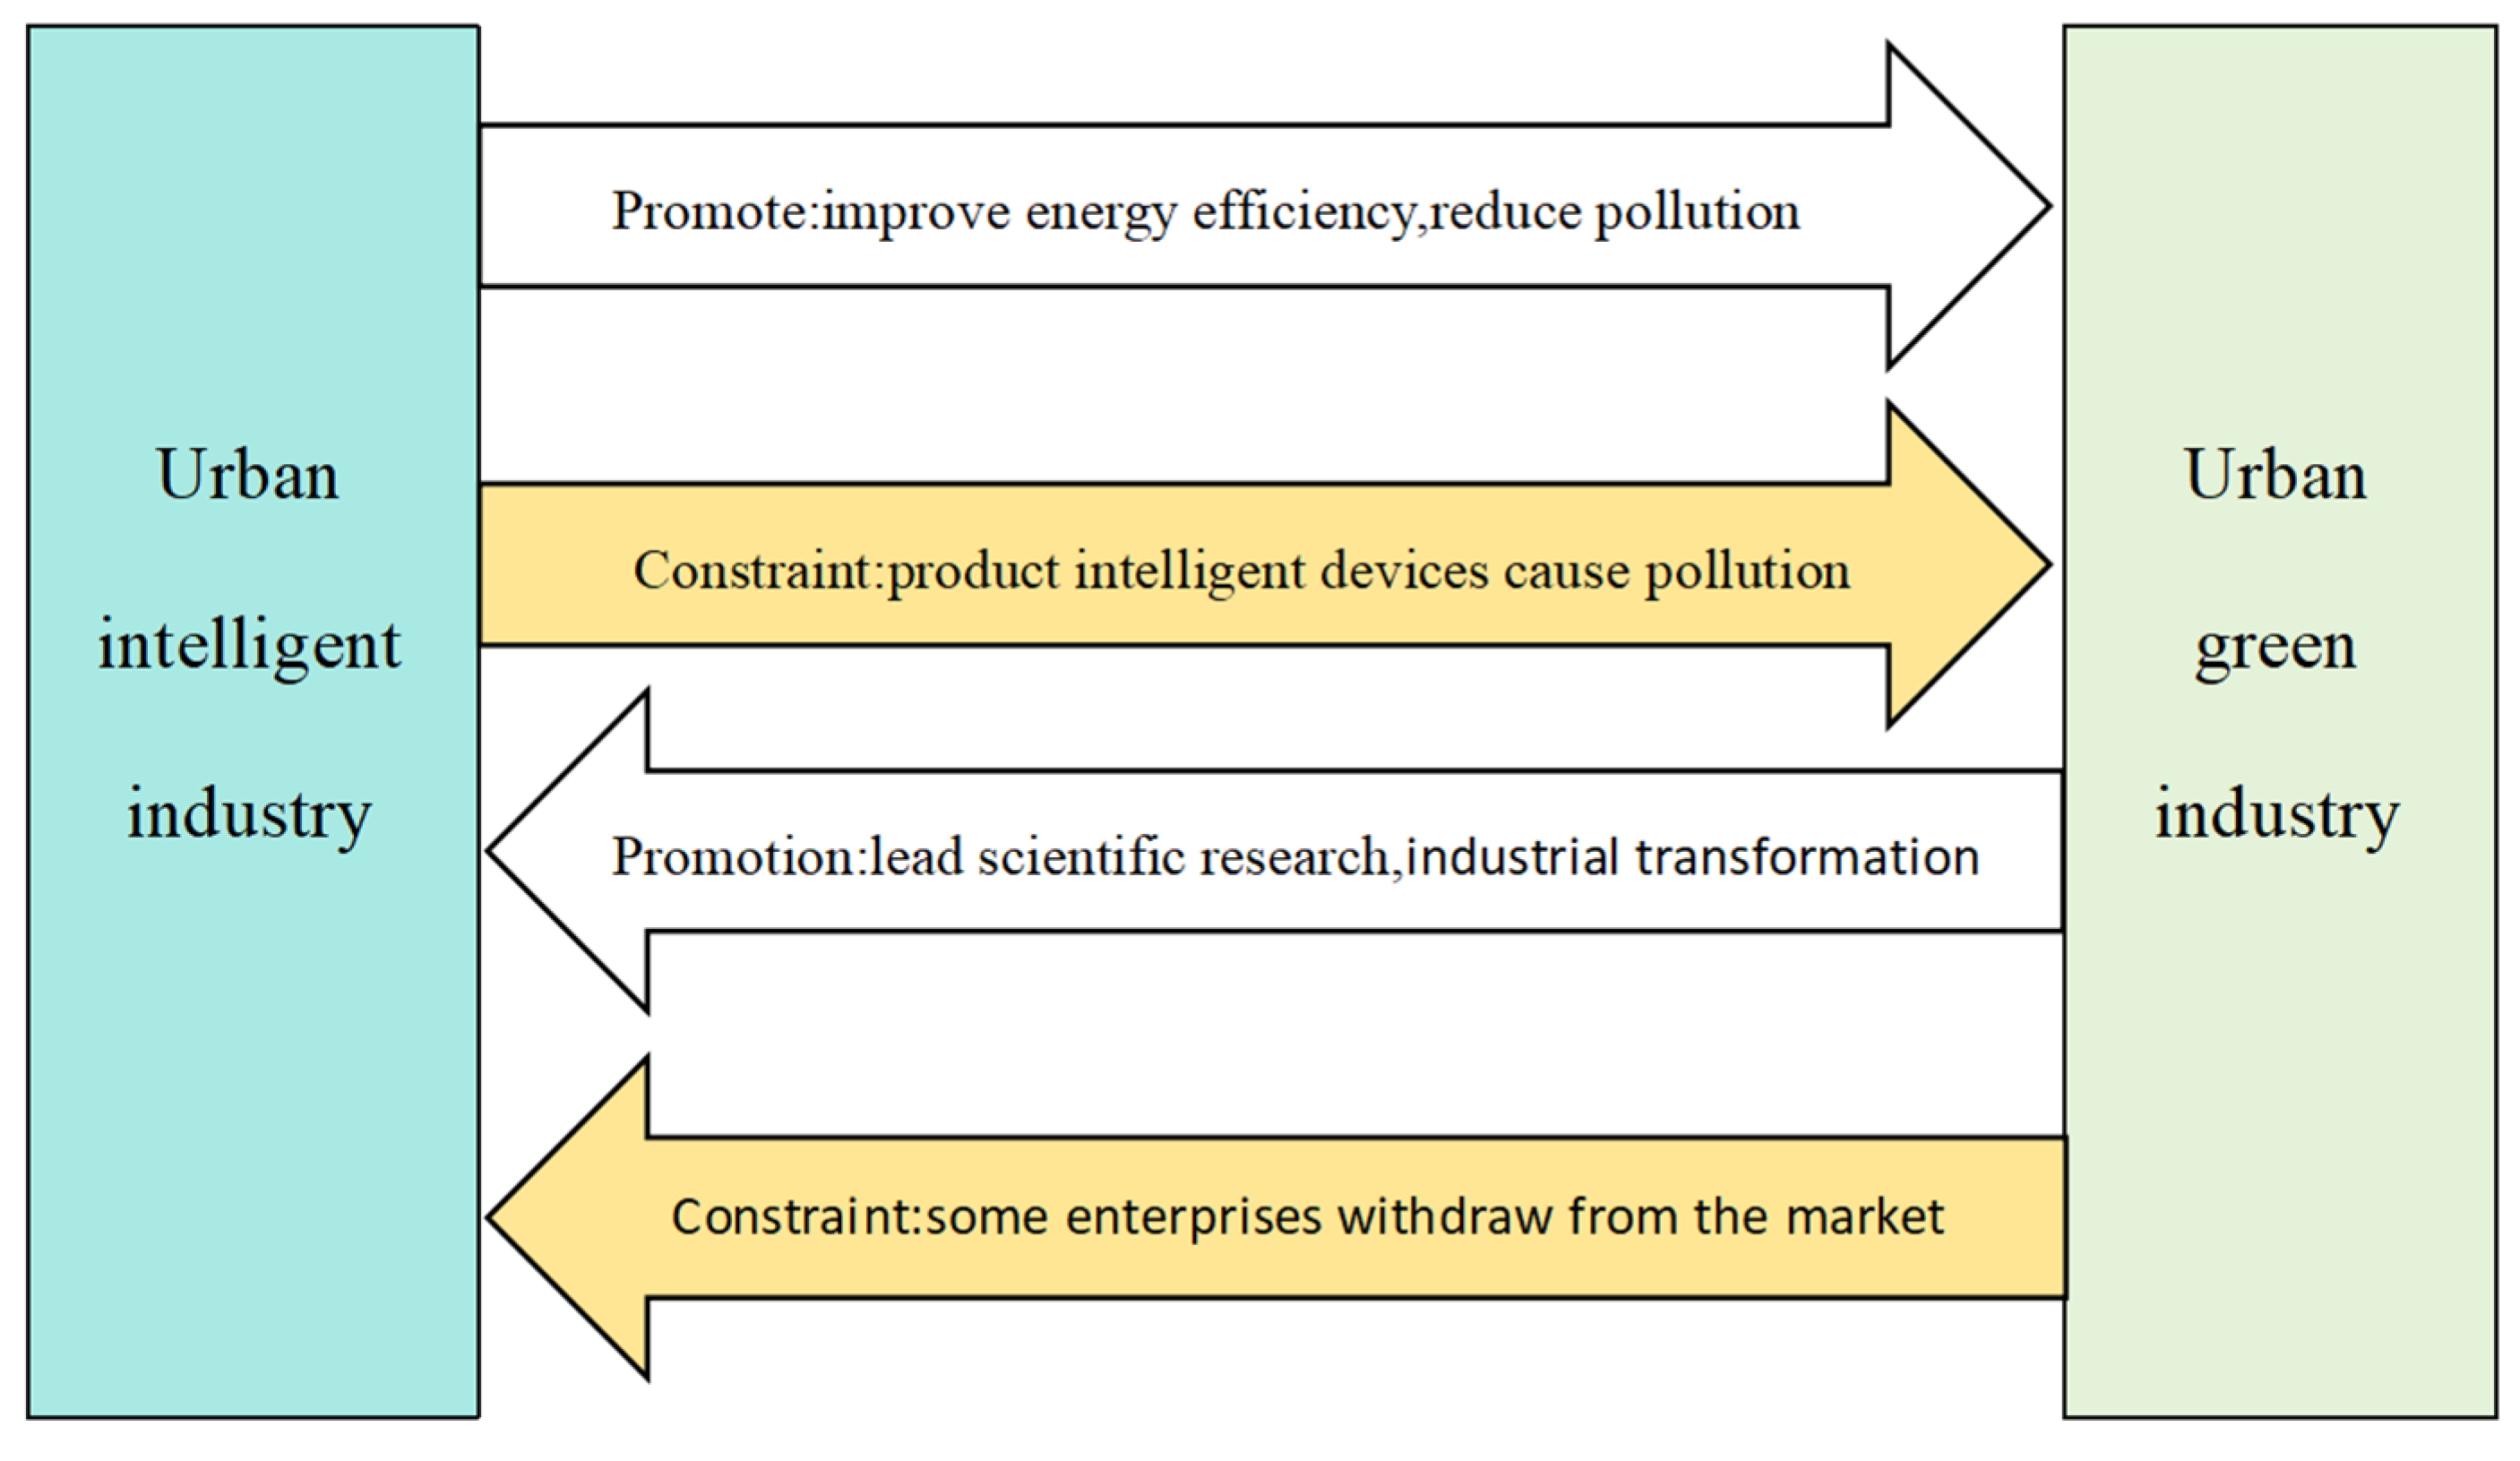
3. Coupling Mechanism of Urban Intelligent Industry and Urban Green Industry

3.1. The Role of Urban Intelligent Industry on the Development of Green Industry

Intelligent industry can exert the effect of cost reduction and technology promotion, and has a positive effect on green innovation and green development [18]. It can realize the efficient allocation of resources and the monitoring of pollutant data in industrial production, thus achieving the effect of resource saving and environmental protection [19]. Intelligent industry can exert the scale economy effect, technology spillover effect, and competition demonstration effect, significantly improve the carbon productivity of the region and neighboring regions, and promote the formation of the spatial pattern of coordinated development of green industry [20]. The application of industrial robots and artificial intelligence technology is a prominent feature of intelligent industry. The application of industrial robots improves the proportion of highly skilled talents and wage income, improves the green innovation ability by optimizing the labor structure, improves the energy efficiency and management efficiency of industrial enterprises, and thus improves the environmental performance and green development level of enterprises [21]. Artificial intelligence technology can promote technological innovation and optimize industrial structure, so as to promote the development of an urban green economy. The effect of artificial intelligence technology is more powerful in areas with a high marketization degree, abundant human capital, and intensive capital [22]. The application of artificial intelligence technology can increase investment in environmental protection equipment and replace the low-skilled labor force, thus promoting the development of regional green industry, which is more obvious in areas with high pollution emission intensity [23]. However, at the same time, the energy consumption of data centers is an important issue that the intelligent industry needs to consider. Geographical location, especially climate factors, will have a great impact on the energy consumption of data centers. The layout of intelligent industry, especially the location of data centers, should take climate and other factors into consideration, otherwise, it will have a negative effect on green industry [24]. It can be seen that urban intelligent industry can have both positive and negative effects on the development of urban green industry, but its effect will be affected by geographical location, capital investment, technical level, and other factors (Figure 1).

3.2. The Role of Urban Green Industry on the Development of Intelligent Industry

Green industry can optimize the ecological environment and improve the human capital structure, help to improve the research and application level of intelligent technology, and achieve the improvement of intelligent manufacturing benefits. Green industry optimizes the economic, social, and ecological environment of the region, attracts the flow of enterprises, technology, talents, and capital to the city, and plays a positive role in the development of intelligent industry. On the contrary, if the development level of green industry lags behind, it will lead to urban environmental pollution and air quality deterioration, and eventually lead to human capital loss and hinder the development of intelligent industry [2]. Green industrial enterprises have the opportunity to obtain more green transfer payments and green financial support [11]. Green financial policies, such as green credit and green securities, provide investment funds for intelligent equipment and scientific research for the development of intelligent industries. The innovation activities and innovation output of enterprises are increasing, and more advanced production technologies and equipment are used in enterprise production and business activities to promote the development of the intelligent industry. The practical need24s of green industry development and the cost pressure of pollution control force enterprises to improve the level of intelligence continuously. In the context of the green economy, some local governments have formulated strict environmental protection systems. Industrial enterprises have to consider the issue of energy conservation and emission reduction, and try their best to reduce pollution control costs and production costs. Due to the limitations of industrial scale, it is difficult for small and medium-sized enterprises to undergo intelligent transformation. Some enterprises begin to transform to the service industry instead of improving the intelligence level, which is not conducive to the development of the intelligent industry [24]. It can be found that urban green industry has both positive and negative effects on intelligent industry; its effects are affected by industrial scale, human capital level, green finance policy, and other factors.

4. Research Design

4.1. Evaluating the Index System

Great changes have taken place in the structure and function of urban intelligent industry and green industry. The establishment of an evaluation index system from the structure and function dimensions can evaluate the high-quality development level of the industry comprehensively and systematically. As both green industry and intelligent industry include indicators of economic benefits, social benefits, and ecological benefits, and the coupling of urban intelligent industry and green industry is mostly reflected in the structural level, in order to avoid the duplication and intersection of indicators, the paper creates an evaluation index system from the structural dimension, and includes dimensions such as facility guarantee, investment structure, industrial structure, technological structure, and spatial structure. Based on the study of relevant literature and an in-depth analysis of the coupling mechanism between urban intelligent industry and green industry, the article seeks evaluation indicators from multiple perspectives. It not only focuses on the development indicators of a single field, but also reflects the correlation between urban intelligent industry and green industry, and thereby grasps the coupling development situation of the two. The article considers indicators in emerging fields such as green finance, industrial robots, and industrial Internet, incorporates indicators such as the proportion of environmental protection investment and the intelligent industrial structure to enhance the pertinence of the indicator system, includes indicators such as the proportion of environmental protection expenditure and the proportion of R&D expenditure to reflect the development trend of the industry and the intensity of government support. The index system is comprehensive, relevant, innovative, reasonable, and dynamic, which is the marginal contribution of the article to the construction of the evaluation index system. The specific indicator system and indicator attributes are shown in Table 1. Among them, the proportion of pollution-intensive industrial enterprises is a negative indicator, implying that the increase in the proportion of pollution-intensive industrial enterprises has a negative impact on the development of urban green industry, while the increase in other indicator values has a positive impact on the development of urban intelligent industry or green industry.

4.2. Data Sources

The raw data of each index are obtained from the China Urban Statistical Yearbook, each city’s statistical yearbook, China Industrial Statistical Yearbook, and China Financial Yearbook. The density of industrial robot installation was calculated referring to the method of Jianlong W [25], and the green finance index was calculated drawing on the method of Xuehui Y [12]. Referring to China Energy Saving and Environmental Protection Clean Industry Statistical Classification (2021), 19 industries such as paper and paper products industry are classified as pollution-intensive industries, 18 industries such as instrument and meter manufacturing industry are classified as clean industries, while general equipment manufacturing and special equipment manufacturing industries are classified as intelligent equipment manufacturing industries. The Yellow River flows through nine provincial administrative regions, namely Qinghai, Sichuan, Gansu, Ningxia, Inner Mongolia, Shanxi, Shaanxi, Henan, and Shandong. Sichuan Province has been included in the Yangtze River Economic Belt. Considering the rationality of the research scope of the Yellow River Basin and the availability of data, the statistical data of 78 cities in the Yellow River Basin from 2011 to 2021 were finally selected for the study, including 48 direct current cities along the Yellow River and 30 important affiliated cities. The part of the missing data is made up by interpolation, and at the same time, the Yellow River basin is divided into upper, middle, and lower reaches for differentiation analysis.

4.3. Research Method

4.3.1. Comprehensive Evaluation Method

The entropy weight method determines the weights based on information entropy, that is, the uncertainty of information, avoiding the influence of human factors in subjective weighting. Since the indicators have different sizes and units, the first step is to use the extreme difference method to carry out dimensionless standardization of the indicators, and apply the entropy value method to determine the weights of the indicators in order to ensure that they are objective [26]. The multi-objective linear weighting method is adopted to calculate the comprehensive development index of urban intelligent and green industries, with the formula as follows:
u i   = a = 1 n W a X i a
where u i   is the evaluation score of the development level of the city’s green industry or intelligent industry, W a is the weight of each indicator, and X i a is the value of each indicator after standardization.

4.3.2. Coupling Model

The coupling model can analyze the interaction relationship between two or more systems, highlight the complex relationships between the systems, and thereby reveal the coordinated development status among the systems. The coupling model is used to calculate the coupling coordination degree of intelligent industry and green industry in cities in the Yellow River Basin, and react to the coupling and coordinated development level of intelligent industry and green industry in cities. The formulas are:
C i = 2 u 1 × u 2 / ( u 1 + u 2 )
T i = α u 1   + β u 2
D i = C i × T i
where C i is the coupling degree of the city’s intelligent industry and green industry,   u 1 represents the evaluation score of the city’s intelligent industry, u 2 represents the evaluation score of the city’s green industry, and T i represents the comprehensive coordination index of urban intelligent industry and green industry, due to the equal importance of the intelligent industry and the green industry, α = β = 1/2. D i is the coupling coordination degree between the city’s intelligent industry and the green industry, which takes the value of 0 to 1. The higher the value, the higher the degree of coordination. Drawing on related research [27], the type of coupling coordination between urban intelligent industry and green industry in the Yellow River Basin is classified into five categories, which are extreme coordination (0.8 < D ≤ 1), high coordination (0.6 < D ≤ 0.8), medium coordination (0.4 < D ≤ 0.6), low coordination (0.2 < D ≤ 0.4), and extreme dysfunctional (0 < D ≤ 0.2).

4.3.3. Modified Gravitational Modeling

In this paper, the modified gravity model is used to describe the spatial correlation matrix of the coupling coordination of urban intelligent industry and green industry in the Yellow River Basin. The formulas are:
G i j = k i j M i M j D i j 2
k i j = M i M i + M j
G i j indicates the association strength between cities, k i j indicates the gravitational coefficient between cities, M i and M j represent the coupling coordination degree of the intelligent industry and the green industry of city i and city j respectively, D i j is the geographic distance between cities, and the mean value of each row in the matrix is the threshold for binarization of the matrix. If q is greater than the threshold value, the value is 1, otherwise, the value is 0, and is obtained from the urban spatial correlation matrix of the Yellow River Basin [28].

4.3.4. Social Network Analysis

The social network analysis method can analyze complex social relations and association networks effectively. The paper analyzes the spatial correlation network characteristics of coupling coordination degree from the aspects of overall network characteristics, individual network characteristics, and block models [29]. The overall network characteristics are analyzed using four indicators—network density, network correlation degree, network hierarchy degree, and network efficiency—to grasp the status of the correlated network as a whole. The individual network characteristics are analyzed using degree centrality, proximity centrality, and intermediate centrality, so as to understand the roles played by different cities in the correlated network. Block model analysis divides the entire network into different sections to present the functions and relationship transfer paths of each section.

4.3.5. QAP Regression Analysis

QAP regression analysis avoids the problems of endogeneity and multicollinearity that exist in traditional regression analysis and can effectively identify the influencing factors of the urban spatial correlation network. From the five perspectives of geographical location, government support, industrial scale, public participation, and development environment, six factors such as city geographic distance, government expenditure on science and technology, industrialization level, technological innovation, informatization level, and financial service level were selected, standardized, and converted into relationship matrix for testing [30,31,32]. The formula is:
N i j = f ( D i s , E x p , I n d , I n n , I n f , G f i )
where D i s is the difference matrix of urban distance, which is calculated by urban geographical distance. The factor flow between cities with closer geographical distance is more frequent, so the geographical distance difference will hinder the optimization of the urban spatial correlation network. E x p is the difference matrix of science expenditure, calculated by the proportion of science expenditure to fiscal expenditure, and science expenditure provides financial support for science and technology activities in cities, so as to promote technology exchanges between cities. I n d represents the industrialization level difference matrix, calculated by the proportion of industrial added value to the regional GDP. I n n is the technological innovation difference matrix, calculated by the number of invention patents per 10,000 people. Cities with the same level of technological innovation are often able to carry out exchanges and cooperation more effectively, but at the same time, the difference in technological level also promotes technological services and transfers between cities. I n f is the difference matrix of the informatization level, calculated by the Internet penetration rate. The Internet provides a guarantee for the coupling development of urban intelligent industry and green industry, so the difference in informatization level has an impact on the urban spatial correlation network. G f i is the difference matrix of financial service level, calculated by the mean of the green finance index and digital inclusive finance index. Financial services provide financial support for the development of the green industry, and also contribute to the development of intelligent technology and intelligent equipment transformation.

5. Evolution of the Coupling Coordination Degree of Urban Intelligent Industry and Green Industry in the Yellow River Basin

The coupling coordination level of urban intelligent industry and green industry in the Yellow River Basin increased from 0.4208 in 2011 to 0.5431 in 2021. As can be seen in Figure 2, the coupling coordination degree of the upper, middle, and lower reaches of the Yellow River improved to different degrees. From 2011 to 2021, the coupling coordination degree of cities in the upper reaches of the Yellow River increased by 43.1% from 0.3535 to 0.5058. The coupling coordination degree of cities in the middle reaches of the Yellow River increased by 28.2% from 0.4012 to 0.5144. The coupling coordination degree of cities in the lower reaches of the Yellow River increased by 22.2% from 0.4816 to 0.5884. The coupling coordination degree of cities in the lower reaches of the Yellow River is always at a high level, but the coupling coordination degree of cities in the upper reaches of the Yellow River has a faster growth rate. According to the change trend of coupling coordination degree in the whole Yellow River Basin and the upper, middle, and lower reaches of the Yellow River Basin, the rising speed of coupling coordination degree accelerated after 2015, which is mainly due to the proposal and implementation of the “Made in China 2025” strategy, and promoted the coupling development of the city’s intelligent industry and green industry. In addition, the difference in the coupling degree between the upper-middle reaches of the Yellow River and the lower reaches of the Yellow River shows a significant reduction after 2019, which is mainly due to the fact that the degree of coordinated development of the Yellow River Basin has been further enhanced after General Secretary Xi Jinping made the major deployment to promote the high-quality development of the Yellow River Basin.
In terms of the type of coupling coordination, in 2011, three cities, Xi’an, Jinan, and Qingdao, were in the stage of highly coordinated development, Wuhai was in the stage of extreme dysfunction, and other cities were at the medium coordinated development stage and the low coordinated development stage. In 2021, 21 cities, including Xi’an, Lanzhou, and Jiayuguan, were in the highly coordinated development stage, 4 cities, such as Guyuan, were in the low coordinated development stage, other cities were at the medium coordinated stage, and some cities had realized a jump in the coupling coordination level. The number of cities in the highly coordinated stage increased from 3 in 2011 to 21 in 2021, and the coupling development level of Xi’an was always at the highest level, rising from 0.6305 in 2011 to 0.7684 in 2021. Influenced by the level of industrial development, the coupling coordination level of the central cities was significantly higher than that of the peripheral cities. No city in the Yellow River Basin has yet reached the stage of extreme coordination.

6. Spatial Network Characteristics of Coupling Coordination of Urban Intelligent Industry and Green Industry in the Yellow River Basin

There is a complex network relationship between the coupling coordination development of urban intelligent industry and green industry in the Yellow River Basin, and the coupling coordination level of intelligent industry and green industry in each city will be influenced by other cities. This kind of influence not only occurs in adjacent cities but also in non-adjacent cities, thus forming complex spatial network correlations.

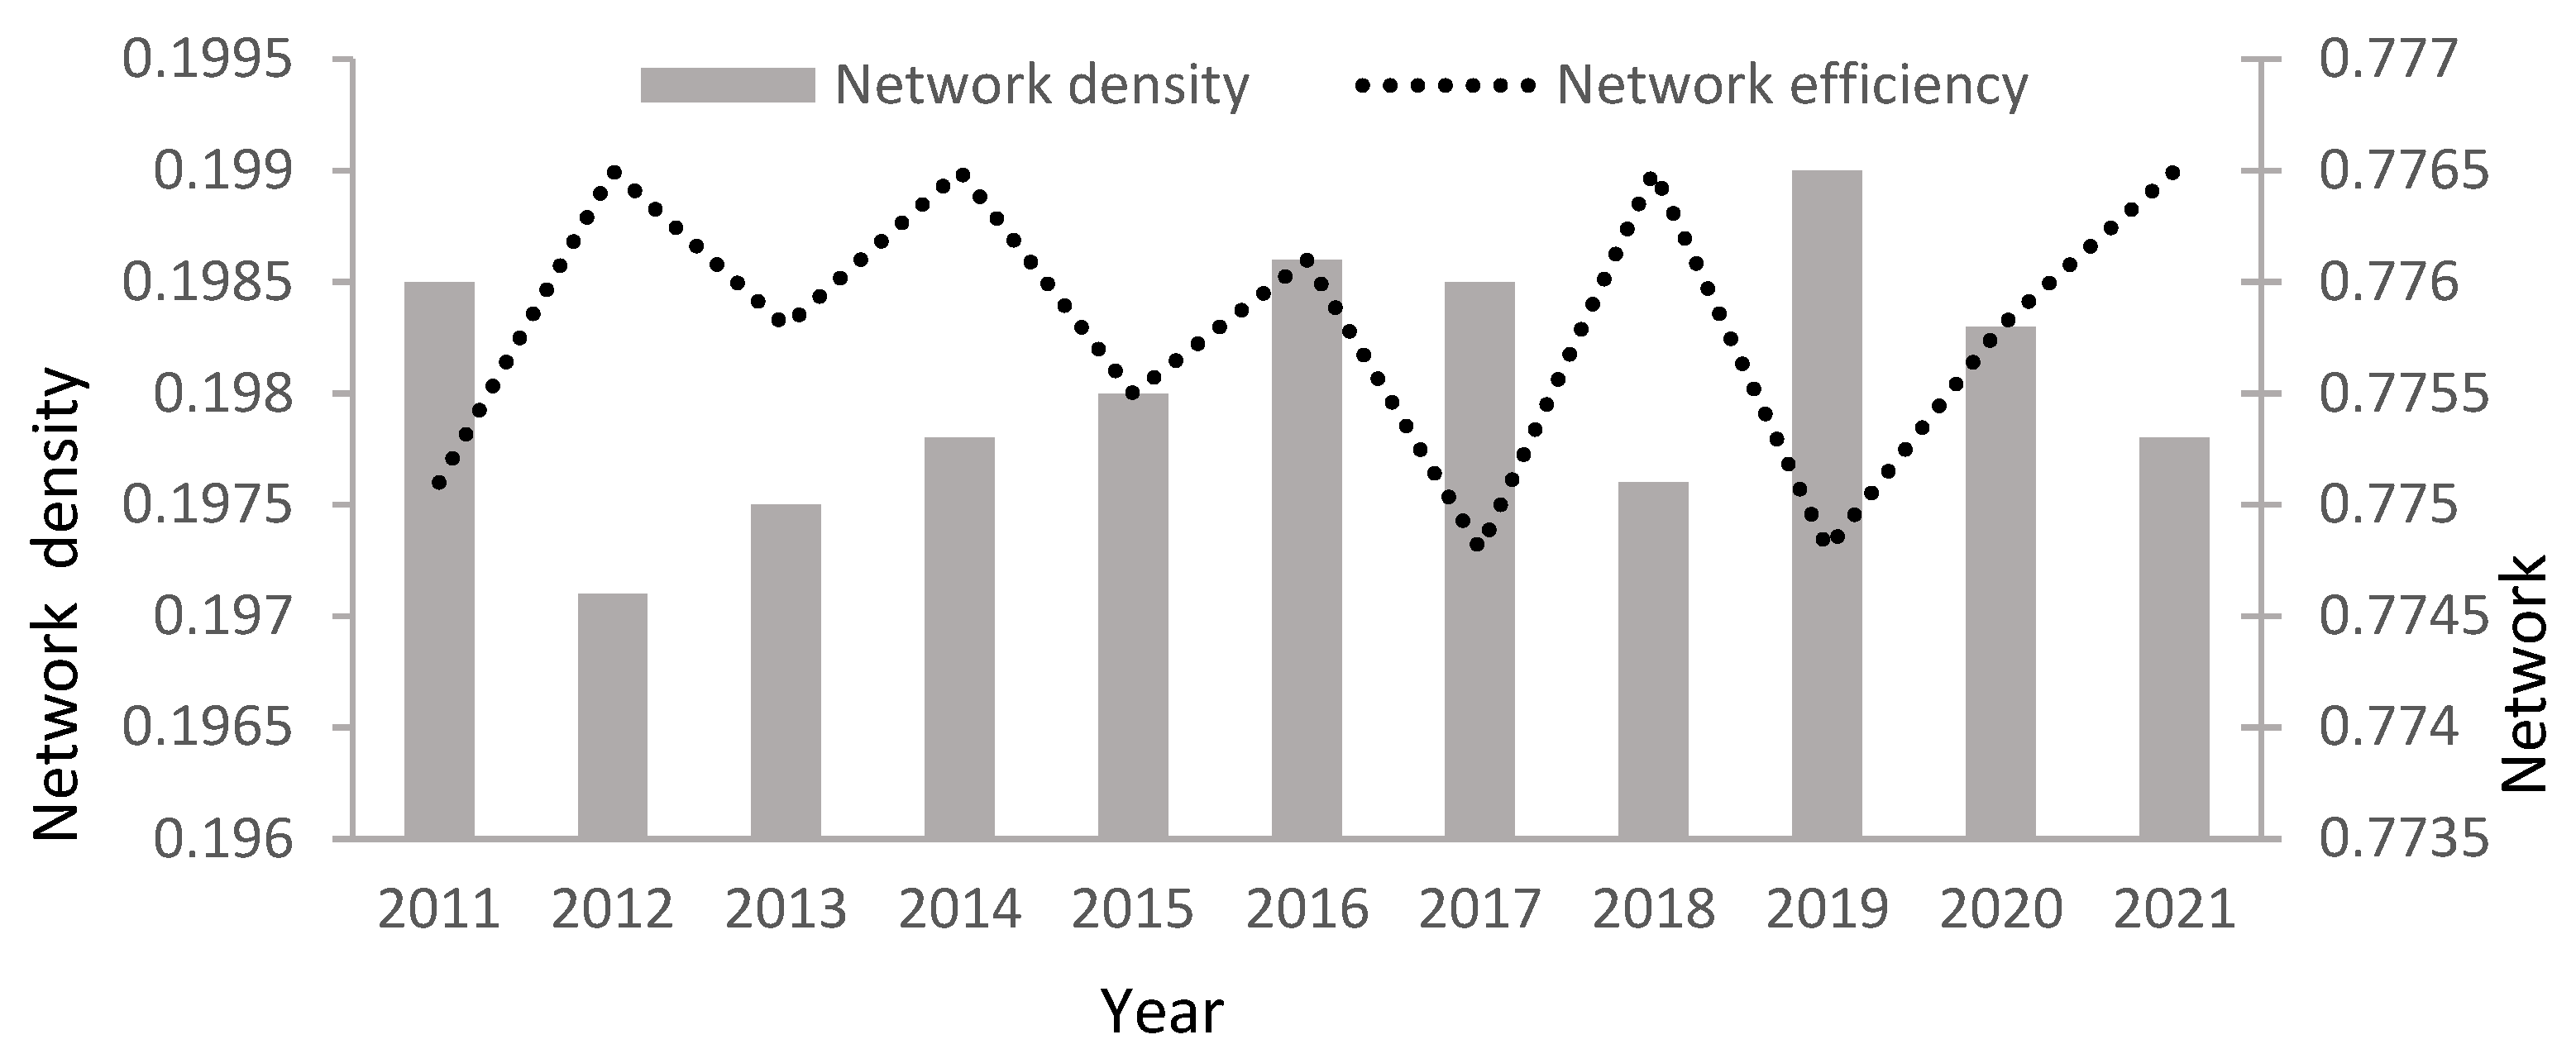
6.1. Overall Network Features

Ucinet 6.0 software was used to calculate the spatial correlation network density, network correlation degree, and network rank of the coupling coordination degree of urban intelligent industry and green industry in the Yellow River Basin, so as to reflect the overall network characteristics of the coupling coordination. From the change trend of spatial correlation network density and network efficiency (Figure 3), it can be seen that the network density has a slight fluctuation and decline from 2011 to 2021, with an average value of 0.1981, indicating that the degree of communication and cooperation between cities needs to be improved. Cities should continue to strengthen their ties to build a closer network of cooperation. The mean value of the network efficiency was 0.7758 and showed a slightly fluctuating upward trend, indicating that the spatial correlation efficiency of the coupling coordination degree was relatively stable and did not show a large degree of improvement. In addition, the network correlation degree is always 1, and the network level is always 0, indicating that there are certain connection channels among different cities, and the network connectivity is always strong.

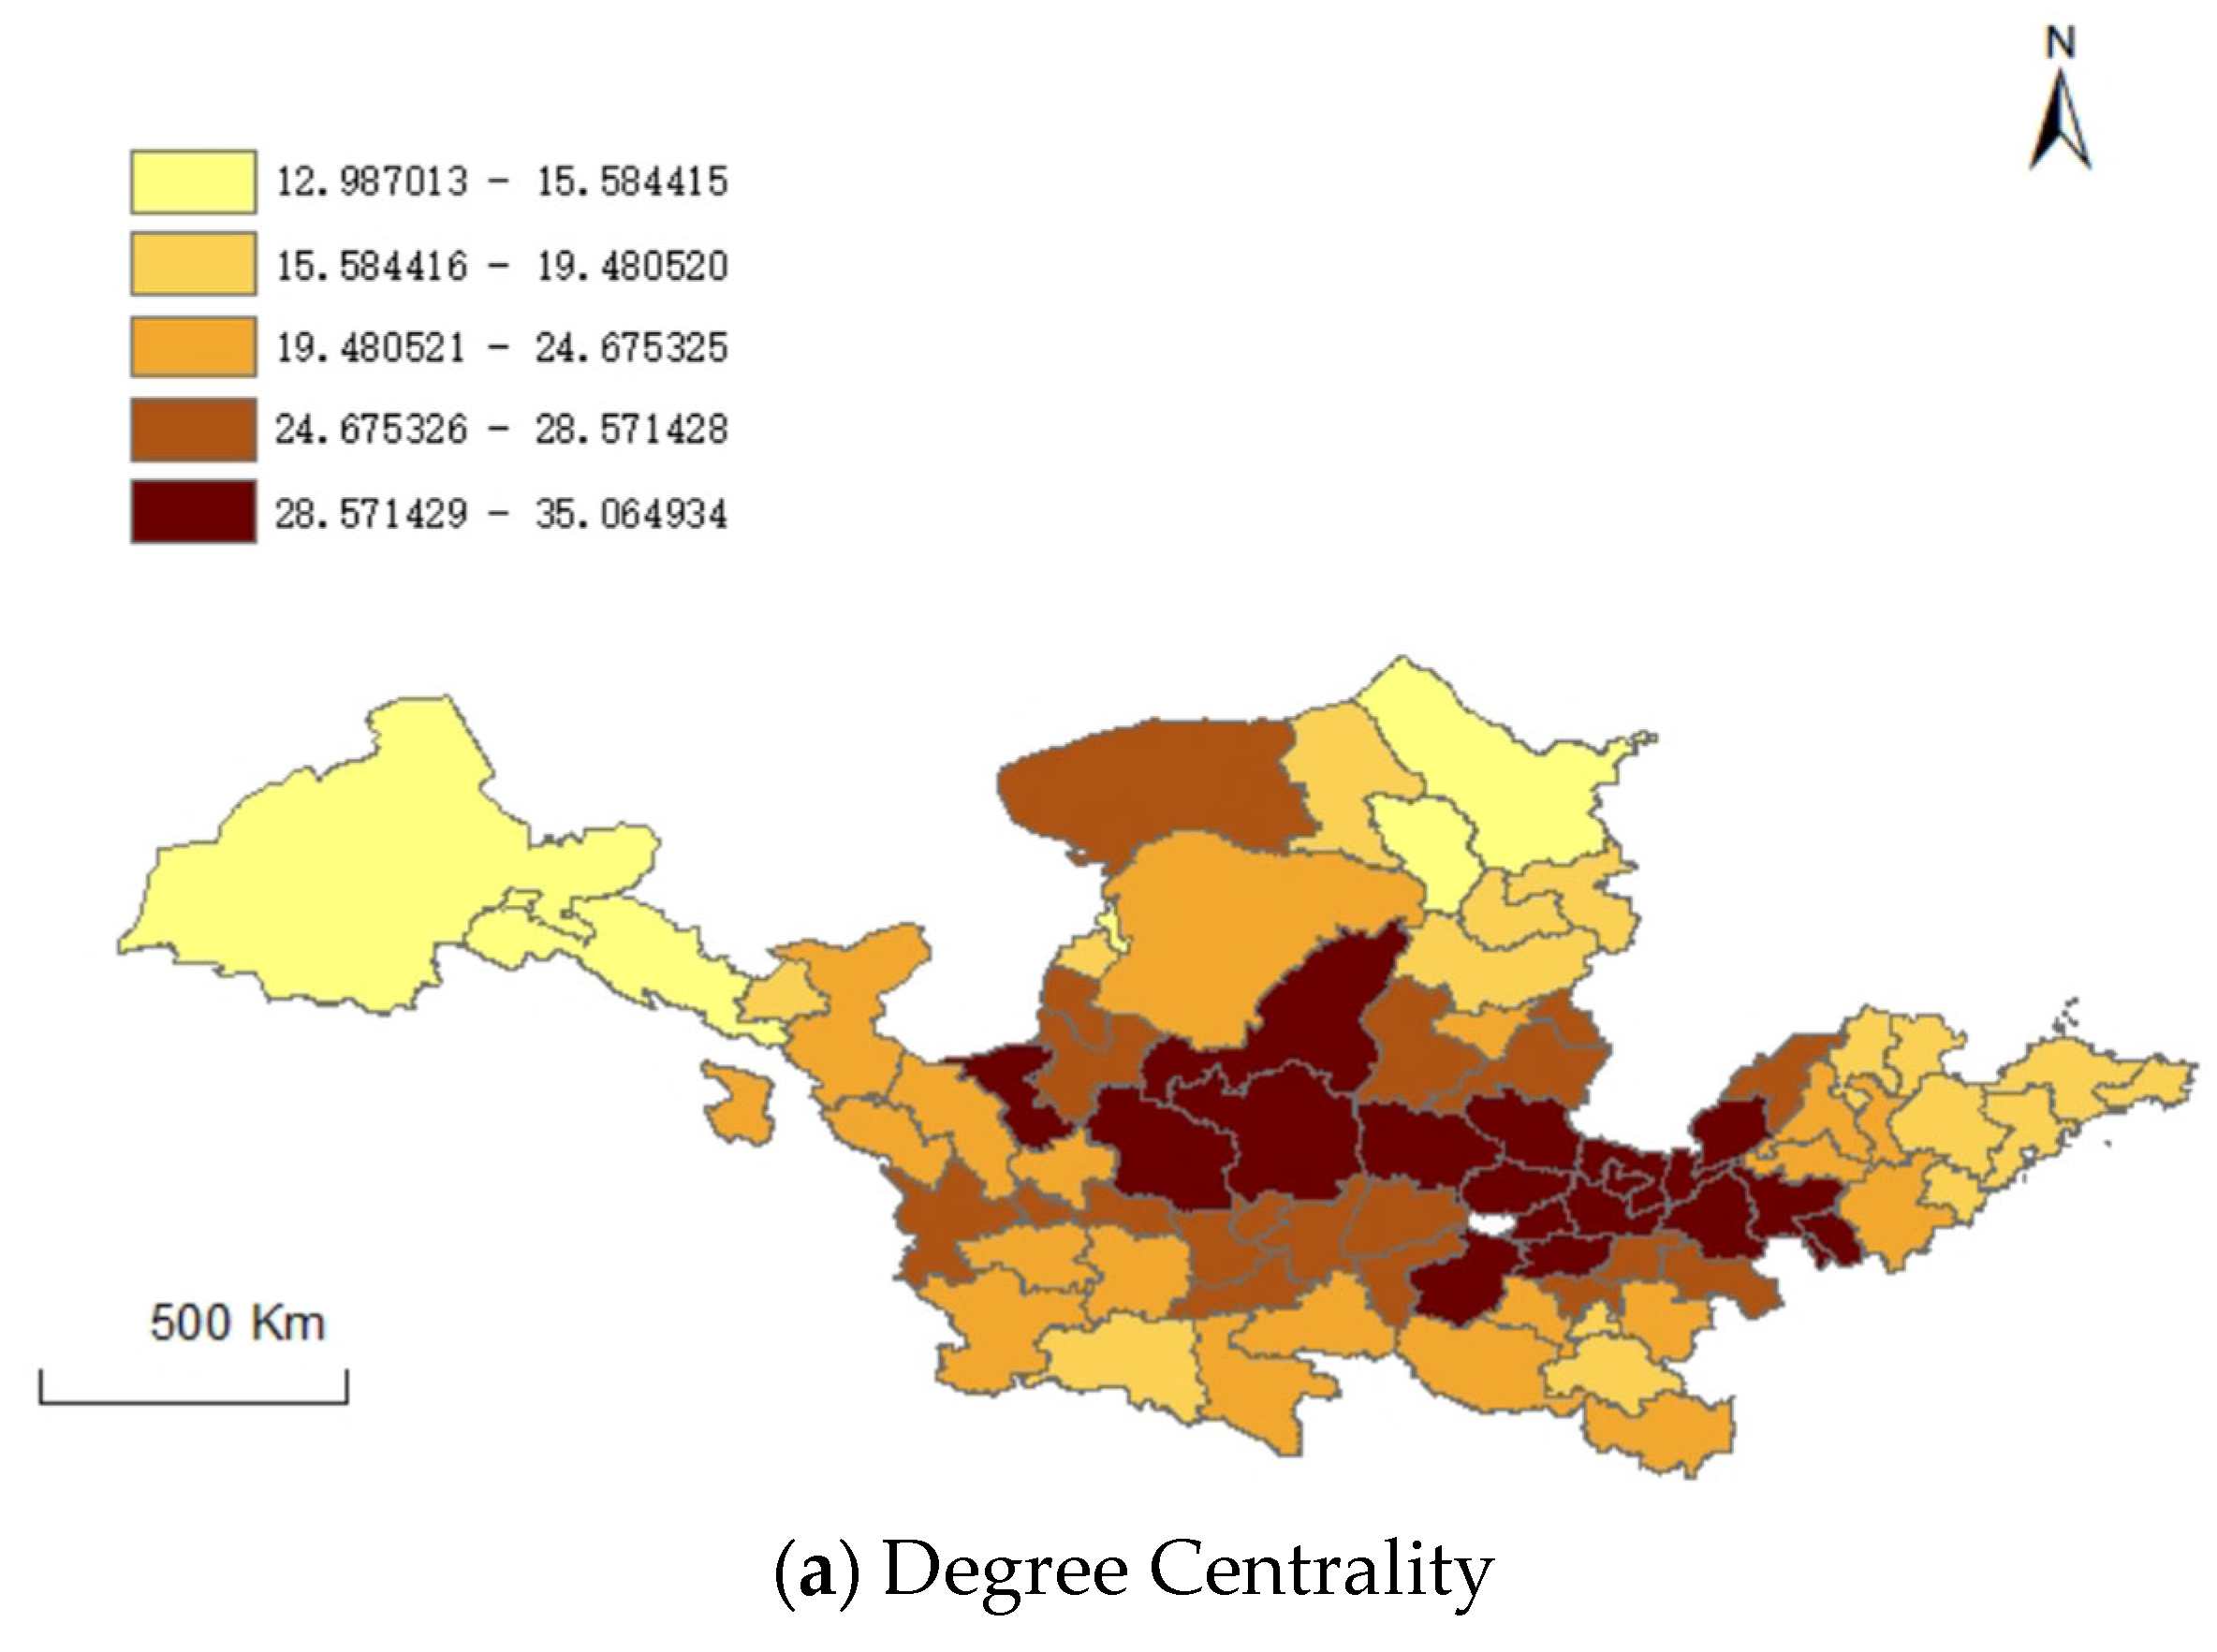
6.2. Individual Network Characteristics

Through the analysis of the overall network characteristics, it can be found that a spatial correlation network has formed among cities in the Yellow River Basin. In order to further explore the individual characteristics of each city in the spatial correlation network, Ucinet software is further used to calculate the degree centrality, proximity centrality, and intermediate centrality of each city in 2021 and visualize them (Figure 4). It is found that cities in the middle reaches of the Yellow River tend to have a higher degree of centrality, intermediate centrality, or proximity centrality.
The average of degree centrality is 24.3423, and the number of cities above the average reaches more than half, among which Yulin, Xinxiang, Yan’an, and Jiaozuo have a high degree centrality. Most of these cities are located in the center of the Yellow River Basin. With convenient traffic conditions and a strong economic foundation, they can exert positive externalities and attract the inflow of advanced production factors, playing an important role in the construction of the spatial correlation network in the Yellow River basin. Cities such as Jiayuguan, Jiuquan, and Wuhai have a low degree of centrality. Most of these cities are at the edge of the Yellow River Basin, their traffic conditions and economic level are relatively backward, and the degree of connection with other cities in the Yellow River basin is weak. Although developed cities such as Xi’an, Qingdao have a high coupling coordination level, their degree centrality is at a middle level, and their role in the urban spatial correlation network needs to be strengthened. In addition, the point entry degree and point exit degree of each city did not change significantly during the study period and had a strong consistency. The point entry degree and point exit degree of Yulin, Linfen, and other cities were always high, which further indicates that geographical location has a greater influence on the radiation effect of cities.
The mean of intermediary centrality is 1.7557, and the number of cities above the mean is about 44.87%, among which Yulin, Liaocheng, and Dezhou have a high intermediary centrality, and can often control more resources and elements by virtue of their location advantages, playing a strong role of “intermediary” and “control” in the spatial network. Because Jiayuguan, Qingdao, and other cities are located at the edge of the Yellow River basin, they have a low degree of intermediate centrality and are difficult to play the role of “bridge” in the spatial network. The degree of intermediary centrality of provincial capitals such as Yinchuan and Jinan is at the middle level, indicating that the distribution of intermediary cities is relatively concentrated and poorly balanced; the spatial structure of the urban network in the Yellow River basin needs to be further optimized.
The average of proximity centrality is 43.6590, and about 51.28% of the cities are higher than this level, which are closely related to other cities and play an important central role in the urban spatial correlation network. Among them, Yulin, Changzhi, and other cities have the highest degree of proximity to the center, indicating that they are more able to realize the free flow of factors by virtue of their location advantage, and are the central actors in the process of urban exchanges and cooperation. Although the cities of Qingdao, Yantai, and Weihai have a high level of coupling coordination, they cannot play an advantageous role in the spatial network because they are located in the periphery of the Yellow River basin.

6.3. Block Model Features

Block model analysis can further characterize the interaction between cities in the Yellow River Basin in the spatial correlation network, so the paper continues to use the CONCOR iterative convergence method to analyze the clustering features of the spatial network. Since this method requires a sample size of less than 50, this paper only studies cities with a large industrial scale as typical cities. Based on the data of 2021, 39 cities with more than the median number of industrial enterprises above the designated scale are selected as research objects. Through the clustering algorithm, nodes with equivalent structures are grouped into the same module, and the correlation network of a typical city is divided into four sections, thereby forming different plates. The cities included in each plate and the interaction between the plates are shown in Figure 5. The cities in Plate I are located in the middle reaches of the Yellow River, those in Plate II are in the non-coastal areas of the lower reaches, and they are not adjacent to coastal cities, those in Plate III are in the coastal areas of the lower reaches, and those in Plate IV are adjacent to coastal cities.
Through the analysis of the interaction of the plates in the spatial correlation network (Table 2), it can be found that the number of spatial relations of the four major plates is 340, including 250 intra-plate relations and 90 inter-plate relations. There are more intra-plate connections than inter-plate connections, indicating that the level of interaction between plates is weak. Specifically, the number of internal relationships of Plate I is 45, and the number of spillover relationships (22) is much more than the number of receiving relationships (4), showing the characteristics of a “net spillover” plate. The number of internal relationships of Plate II is 122, and the number of receiving relationships (29) is significantly higher than that of spillover relationships (14), and internal relationships occupy a large proportion, showing the characteristics of a “net benefit” plate. There are 56 internal relations, 26 overflow relations, and 20 receiving relations in Plate III, showing the characteristics of a “two-way overflow” plate. The number of internal relationships of Plate IV is 27, and the number of receiving relationships (37) is higher than the number of overflow relationships (28). There are connections between Plate IV and the other three plates, playing the role of “bridge” in the spatial correlation network, showing the characteristics of the “broker” plate.
The density matrix of the four plates is calculated. The spatial network density (0.2294) of 39 typical cities is taken as the threshold value, and the density greater than the threshold is assigned to 1, the density less than the threshold is assigned to 0, and the image matrix of each plate is obtained (Table 3). Specifically, in addition to receiving internal relations, Plate I mainly generates overflow to Plate II. Plate II not only generates overflow to Plate I and Plate IV, but also receives overflow from Plate I and Plate IV. There is a close relationship between Plate III and Plate IV; Plate III receives the overflow from Plate IV while producing overflow to Plate IV. Plate IV spills over to Plate II and Plate III, and receives overflow from the other three plates at the same time, which is not only the main body of the overflow relationship, but also gains more benefits in the spatial correlation network.

7. The Influence Mechanism of the Coupling Coordination Spatial Correlation Network Between Urban Intelligent Industry and Green Industry in the Yellow River Basin

With the help of Ucinet software, 5000 random permutations of 2021 data were carried out, and the results of QAP correlation analysis and regression analysis were calculated (Table 4). It can be found that the correlation coefficients of the six impact factors are all negative and pass the significance test of 5%, and the five impact factors of geographical distance difference, science expenditure difference, innovation level difference, informatization level difference, and green finance difference pass the significance test of 1%, indicating that the six impact factors are closely related to the urban spatial correlation network in the Yellow River Basin.
According to the results of QAP regression analysis, it can be found that the regression coefficient of geographical distance difference is significantly negative, indicating that the flow of information and factors between neighboring cities is more convenient, and the longer the geographical distance, the more unfavorable the communication and cooperation between cities, and thus hinder the formation of urban spatial correlation network. The regression coefficient of the difference of science expenditure is significantly negative, indicating that the government’s science expenditure provides conditions for urban technology progress and technology exchange; the smaller the difference, the more conducive to the formation of urban spatial correlation network. The regression coefficient of financial environment difference is significantly negative, indicating that financial institutions provide financial support for the coupling and coordinated development of urban green industry and intelligent industry; a large financial environment difference is not conducive to the formation of the urban spatial correlation network. The regression coefficient of the difference in informatization level is significantly positive, indicating that the difference in informatization level strengthens the complementarity of cities’ advantages and promotes the formation of urban spatial correlation network, which is because the differences in informatization level can promote industrial division, regional cooperation, resource flow and technology diffusion, and thus form a closer cooperative relationship between cities. The difference between the innovation level and industrialization level is not conducive to the formation of an urban spatial correlation network, but this effect is not significant.

8. Discussion

8.1. Coupling Coordination Degree and Regional Disparities

The continuous improvement of the coupling coordination degree between urban intelligent industry and green industry in the Yellow River Basin, as observed in this study, underscores the positive impact of new quality productivity advancements and regional policy implementations. However, the presence of significant path dependence and regional heterogeneity poses both challenges and opportunities for further development. The higher level of coupling coordination in the lower reaches of the Yellow River compared to the middle and upper reaches is an interesting finding. This disparity may be attributed to several factors. The lower-reach cities often have better access to resources, including capital, technology, and talent, which can facilitate the integration of intelligent and green industries [25].
Additionally, they may have a more developed industrial base, providing a solid foundation for the synergy between these two sectors. The narrowing of the difference between the lower reaches and the middle and upper reaches is a positive sign. It suggests that the policies and measures aimed at promoting the coupling coordination of intelligent and green industries are starting to take effect in the less-developed regions. However, more targeted efforts are still needed to accelerate this process and ensure a more balanced development across the entire basin. So, for cities in the upper and middle reaches, improving the penetration of robots and artificial intelligence in the industrial sector is crucial for enhancing resource allocation efficiency and productivity. The development of industrial energy-saving technology and environmental protection equipment, as well as the deployment of the vein and recycling industries, will contribute to the sustainable development of the coupling between intelligent industry and green industry.

8.2. The Characteristics and Influencing Factors of Spatially Correlated Networks

The formation of the spatial correlation network is a crucial step towards regional industrial integration. However, the network still has much room for improvement. The high degree of centrality, proximity, and intermediary centrality of cities in the central part of the basin, influenced by location factors, highlights the geographical advantages of these cities. They serve as important hubs in the spatial correlation network, facilitating the flow of resources and information. On the other hand, the low degree of intermediary centrality of eastern coastal cities and western fringe cities indicates that these regions may be relatively isolated in the network. The need to further strengthen the role of provincial capital cities in the urban spatial correlation network is evident. Provincial capital cities usually have abundant resources and strong innovation capabilities. By enhancing their connectivity and cooperation with other cities, they can play a more active role in driving the development of the entire basin.
The agglomeration effect has led to a distinct pattern in the number of internal and external relations among the four plates. Plate I, as the “net spillover” plate, plays a vital role in providing resources for the coupling coordination of external plates. This suggests that Plate I has certain competitive advantages in terms of technology, capital, or industrial scale, which enable it to support the development of other regions. Plate II’s “net benefit” characteristic indicates that it is able to obtain more benefits from the spatial correlation network. This may be due to its favorable industrial environment, market demand, or policy support. However, it is also important to ensure that the benefits are shared more equitably among the plates to promote sustainable and balanced development. Plate III’s “two-way overflow” characteristics, with both internal relationships and close connections with Plate IV, show its potential as a bridge between different parts of the network. Plate IV, acting as a “broker” in the spatial correlation network, further emphasizes the importance of inter-plate cooperation. The interactions between these plates should be further strengthened to enhance the overall efficiency and effectiveness of the spatial correlation network [27].
The impact of various factors on the coupling coordination spatial correlation network is complex. Geographical distance, science expenditure, and financial environment differences are found to be unfavorable for communication and cooperation among cities. Geographical distance can increase transportation costs and reduce the frequency of face-to-face interactions, hindering the exchange of resources and information. This is consistent with Cheng H’s research conclusion [28]. Science expenditure differences may lead to disparities in technological innovation capabilities, making it difficult for cities with lower science expenditure to keep up with the development pace. Financial environment differences can affect the availability of funds for industrial development and cooperation projects. In contrast, differences in the informatization level can promote the formation of spatial correlation networks. A higher informatization level enables cities to communicate and collaborate more efficiently, breaking down geographical barriers to some extent. However, the lack of a significant impact of innovation level and industrialization level differences on spatial correlation networks is somewhat surprising. This may be due to the fact that the current study only captures a certain aspect of innovation and industrialization, or there may be other underlying factors at play that need to be further explored.
Coastal cities breaking through boundary constraints and providing technical support to other cities in the basin can leverage their industrial advantages to promote regional industrial upgrading. Provincial capital cities playing a more active role in exporting advanced technologies and equipment, and establishing closer cooperative relations, will help to narrow the development gap between different regions. Clarifying the division of functions among plates and strengthening exchanges can expand the “small cycle” within plates to the “big cycle” between plates, achieving high-quality coordinated development of urban industries. The provision of more fiscal funds and financial policy support for ecological technology, digital infrastructure, and intelligent transformation activities is essential for reducing industrial technology differences among cities. Establishing cross-regional coordination institutions and communication mechanisms, clarifying industrial division of labor, and building a platform for exchanging industrial technology and production factors will facilitate the integration of the basin’s industrial development. Leveraging the differences in information technology and industrialization levels to build a network system for high-quality and differentiated development of urban industries will promote the construction of a “big network” on the basis of a “small network”, enhancing the overall competitiveness of the Yellow River Basin’s industrial sector.

8.3. Limitations and Prospects for Future Work

The paper studies the coupling coordination level and spatial correlation network characteristics of urban intelligent industry and green industry in the Yellow River Basin, making certain contributions to promoting regional coordinated development, optimizing resource allocation, improving environmental quality, and enhancing economic sustainability. However, the article still has some limitations. Firstly, the coupling mechanism at the micro level has not been analyzed, and the degree of interaction between the two has not been verified; Secondly, limited by the availability of data, the evaluation index system is still not perfect. Thirdly, the research scope is limited to the Yellow River Basin and has not yet been compared with other regions. Therefore, in future research, it is necessary to improve the evaluation index system for urban intelligent industry and green industry. The coupling relationship between the two should also be analyzed from a micro perspective, and the research scope should be expanded to form more objective conclusions.

9. Conclusions

This study has undertaken a comprehensive analysis of the coupling coordination level and spatial correlation network characteristics between urban intelligent industry and green industry in the Yellow River Basin from 2011 to 2021. By employing a coupling model, social network analysis, and QAP analysis, we have gained valuable insights into the evolution, current state, structure, and dynamics of the spatial correlation network.
(1)
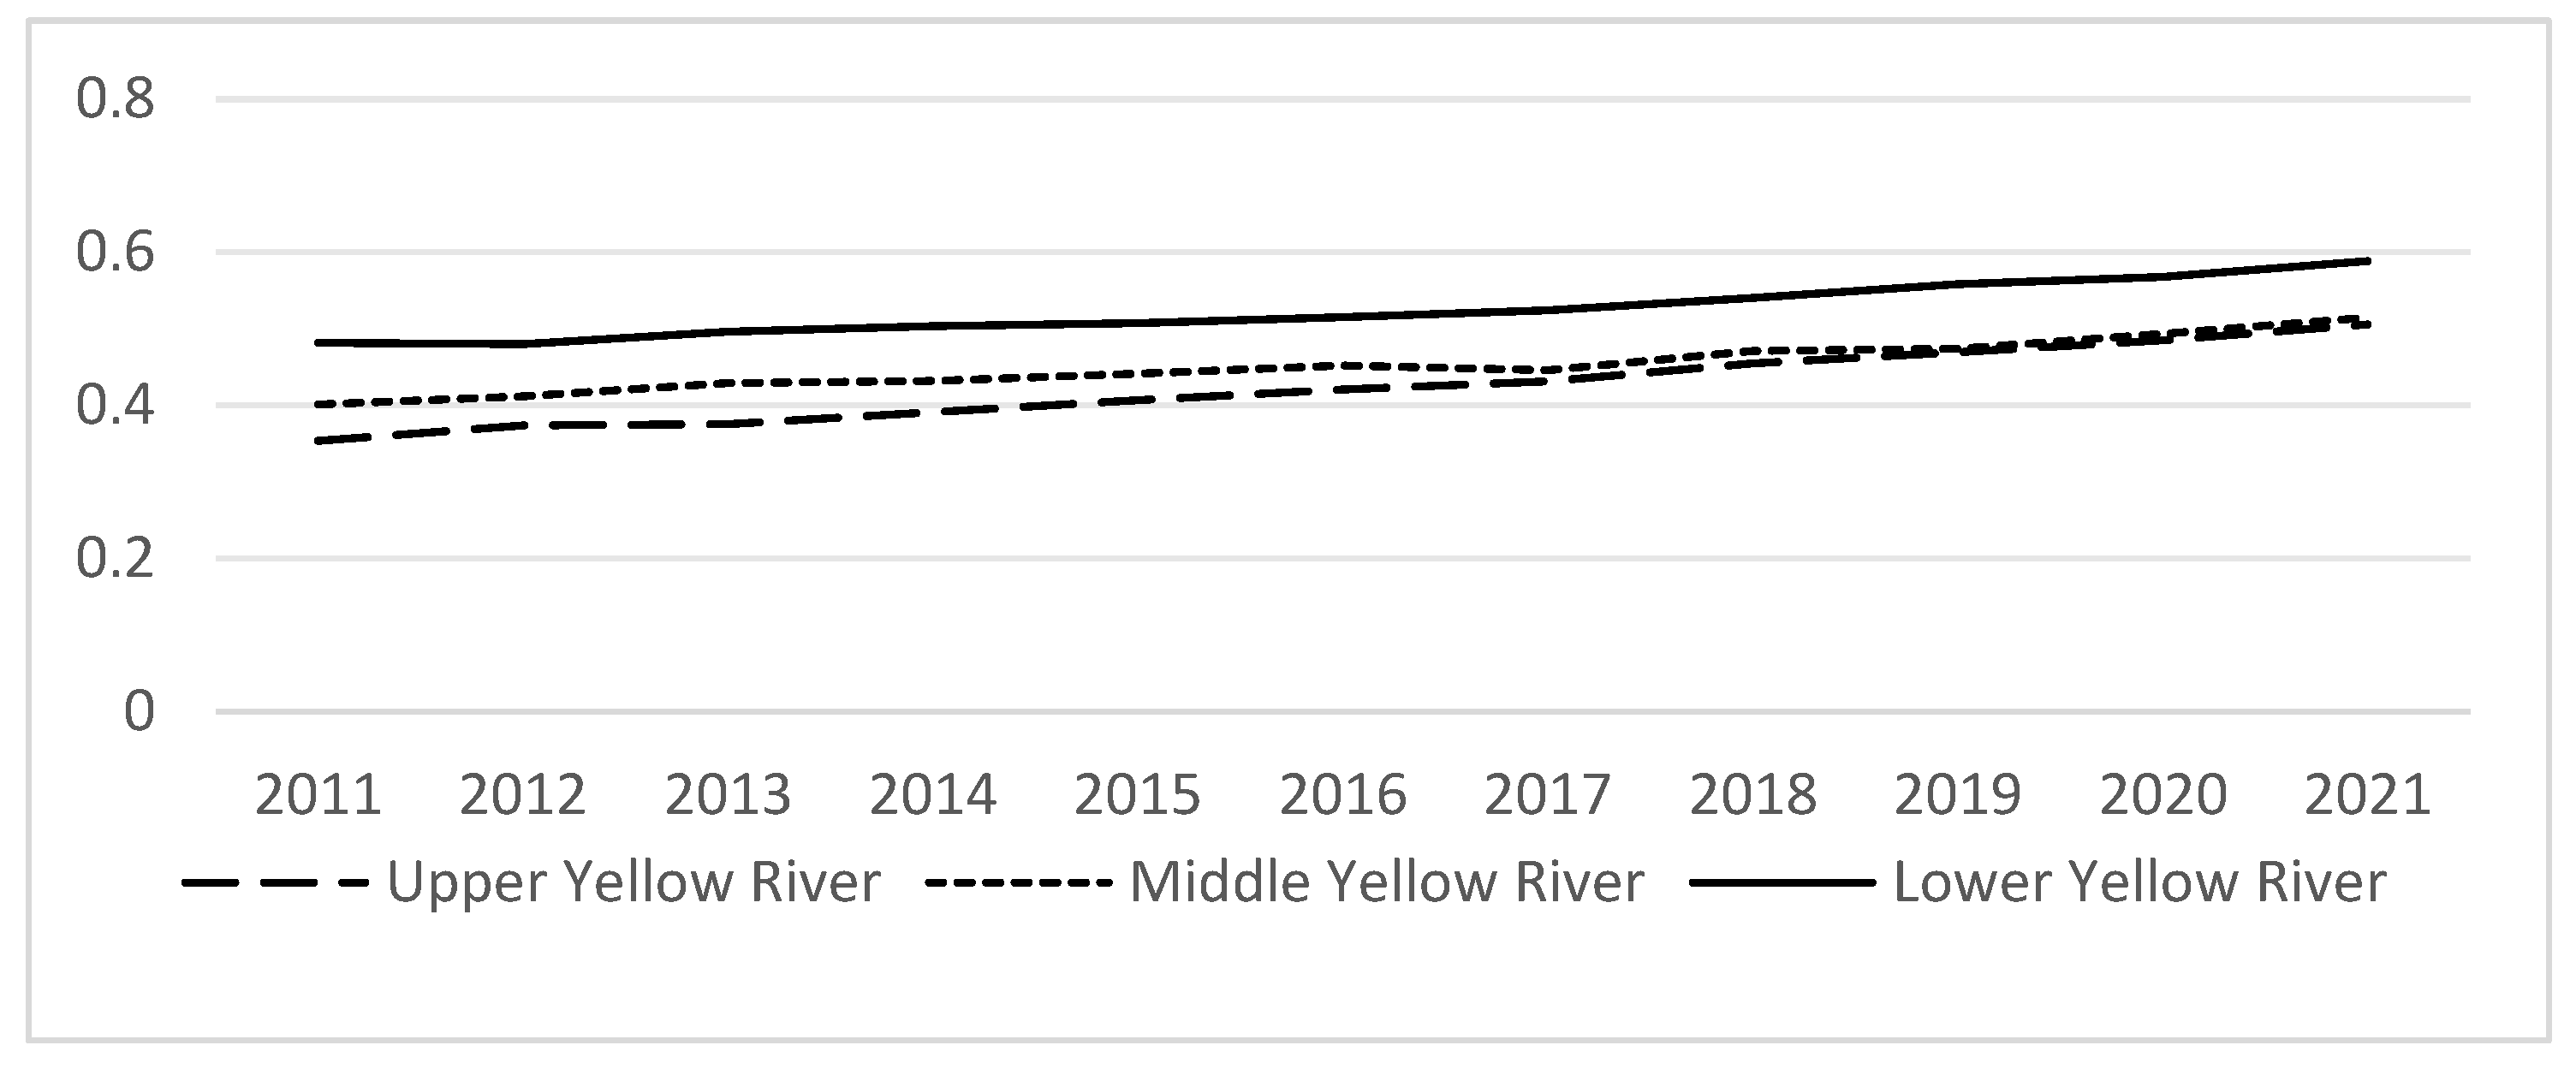
The coupling coordination level between urban intelligent and green industries in the Yellow River Basin has demonstrated a continuous upward trend, indicating the positive progress in the integration and synergy of these two vital sectors. However, it is noteworthy that no city within the basin has yet achieved the extreme coordination level, suggesting that there is still significant room for improvement and further development. The regional disparities observed, with the lower reaches of the Yellow River exhibiting a higher coupling coordination degree compared to the middle and upper reaches, highlight the challenges posed by path dependence and regional heterogeneity. Despite the narrowing of these disparities over time, more targeted efforts are required to ensure a more balanced and sustainable development across the entire basin.
(2)
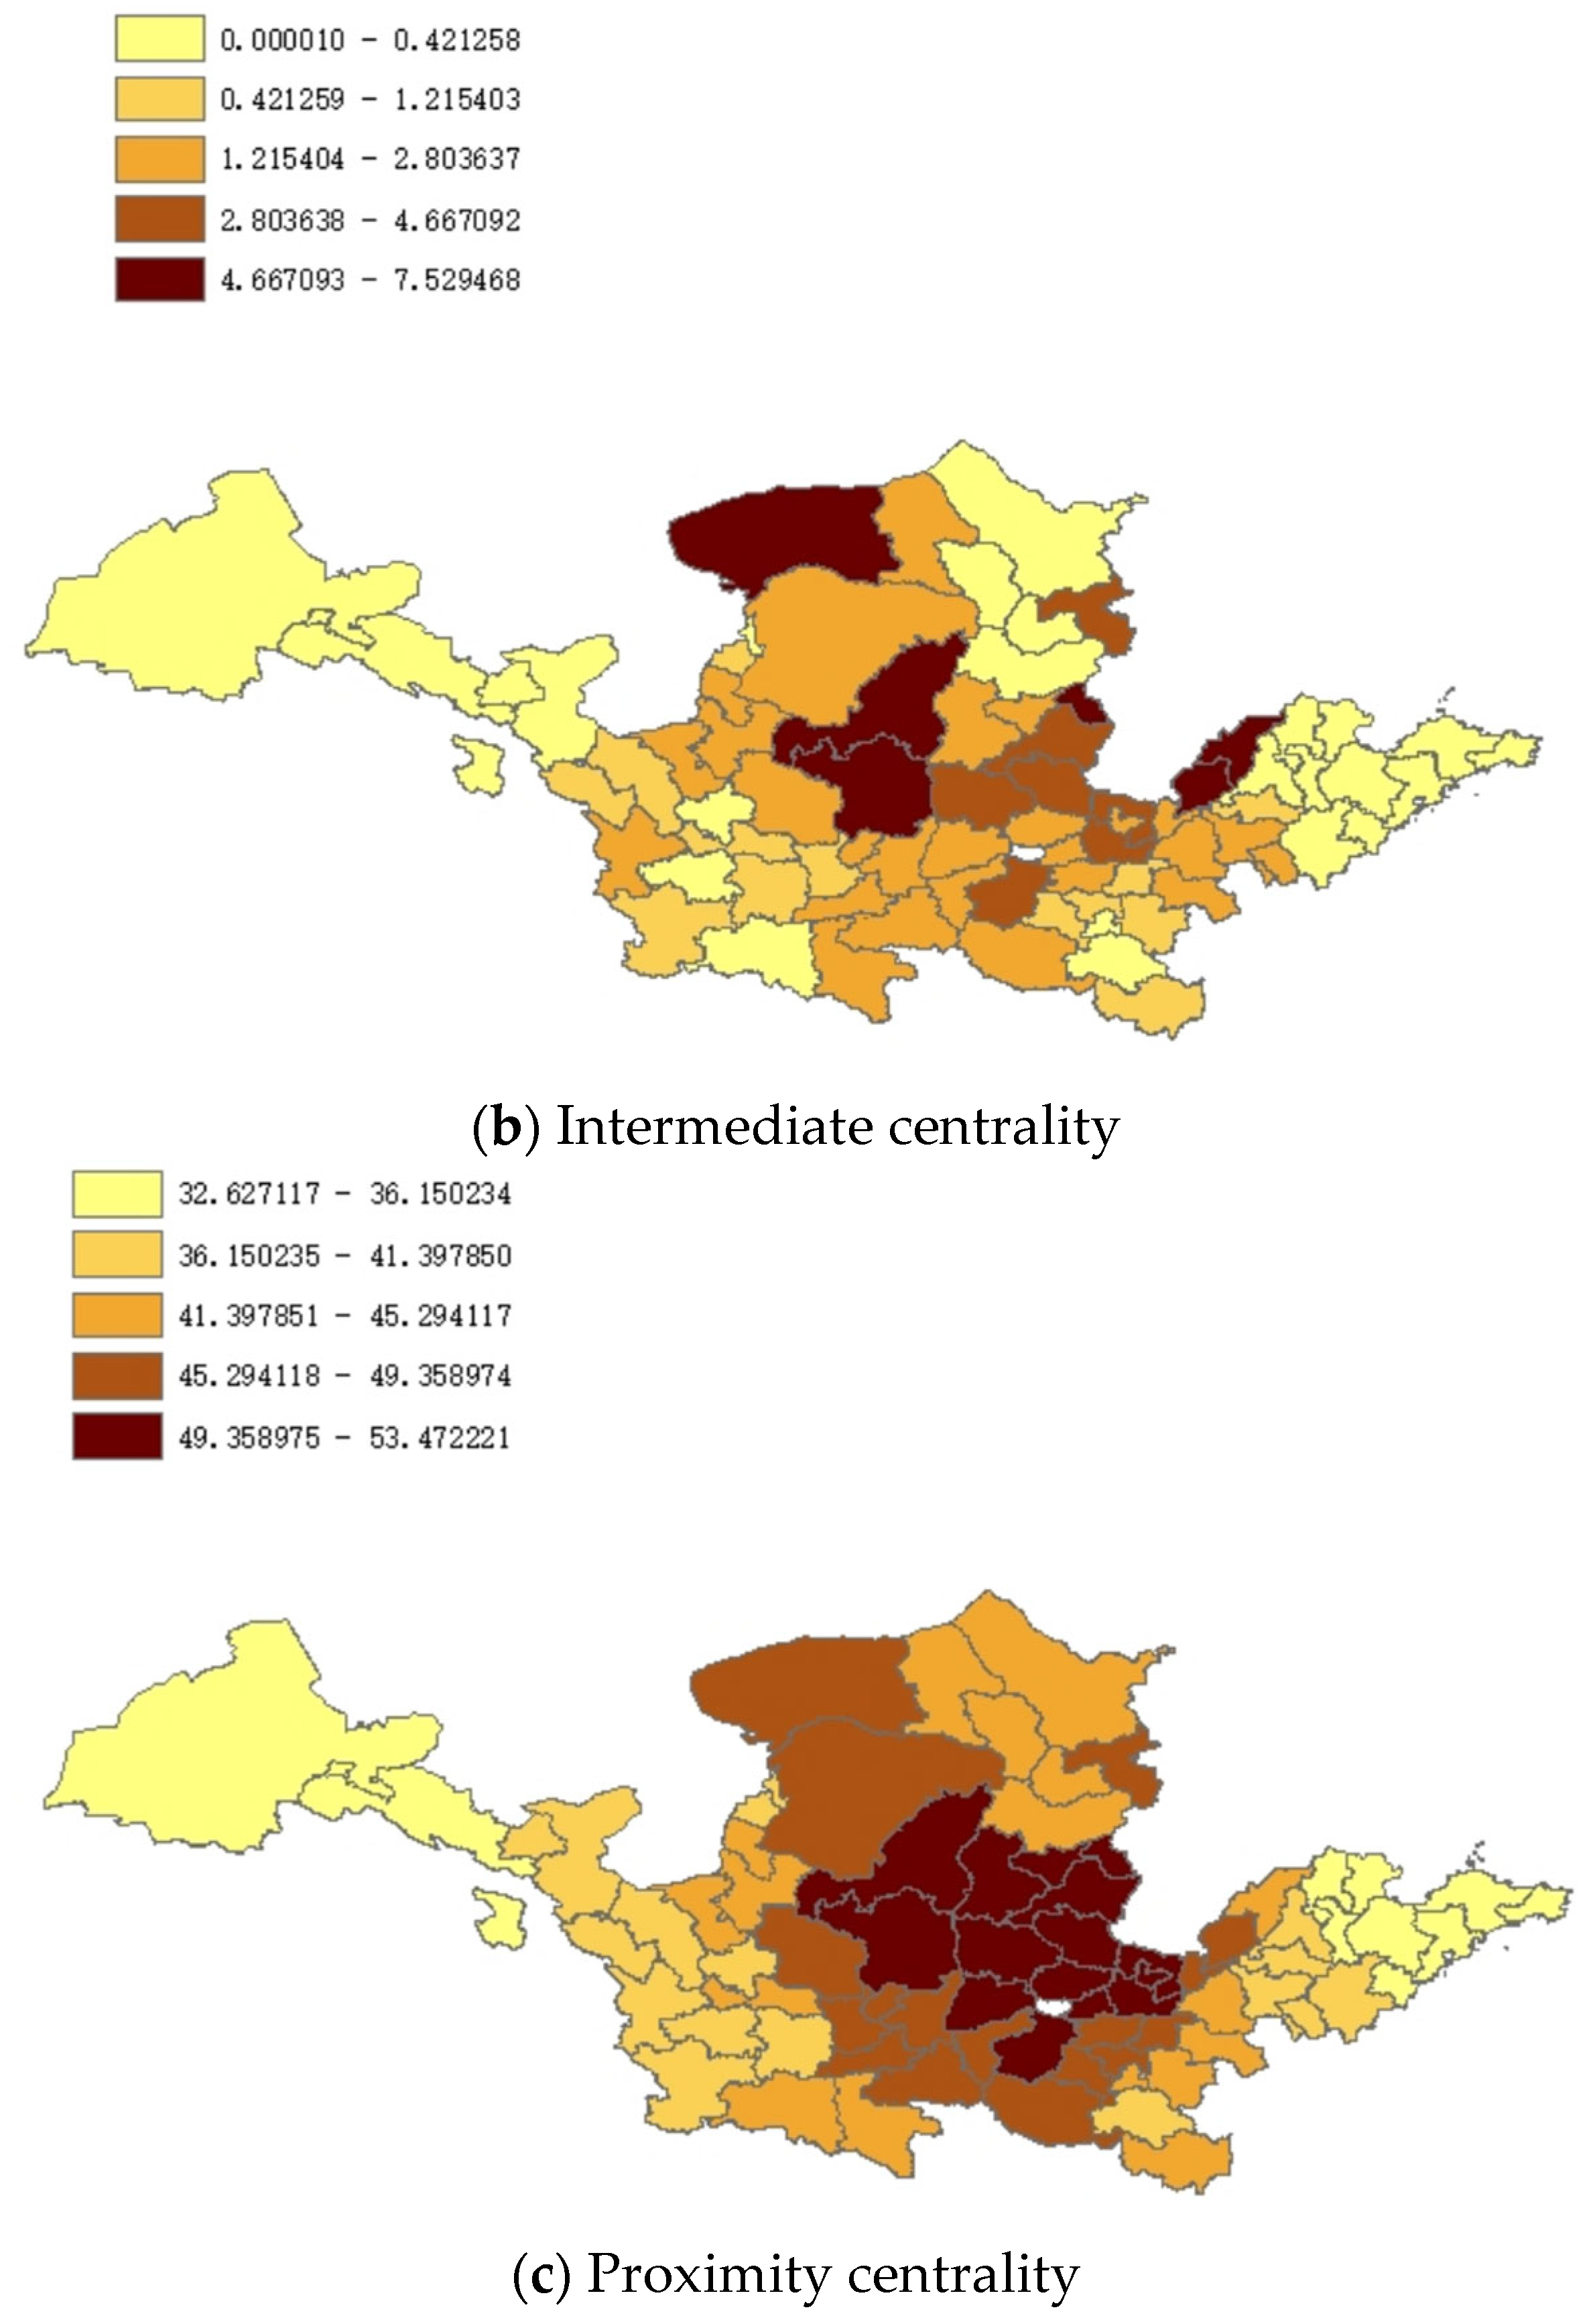
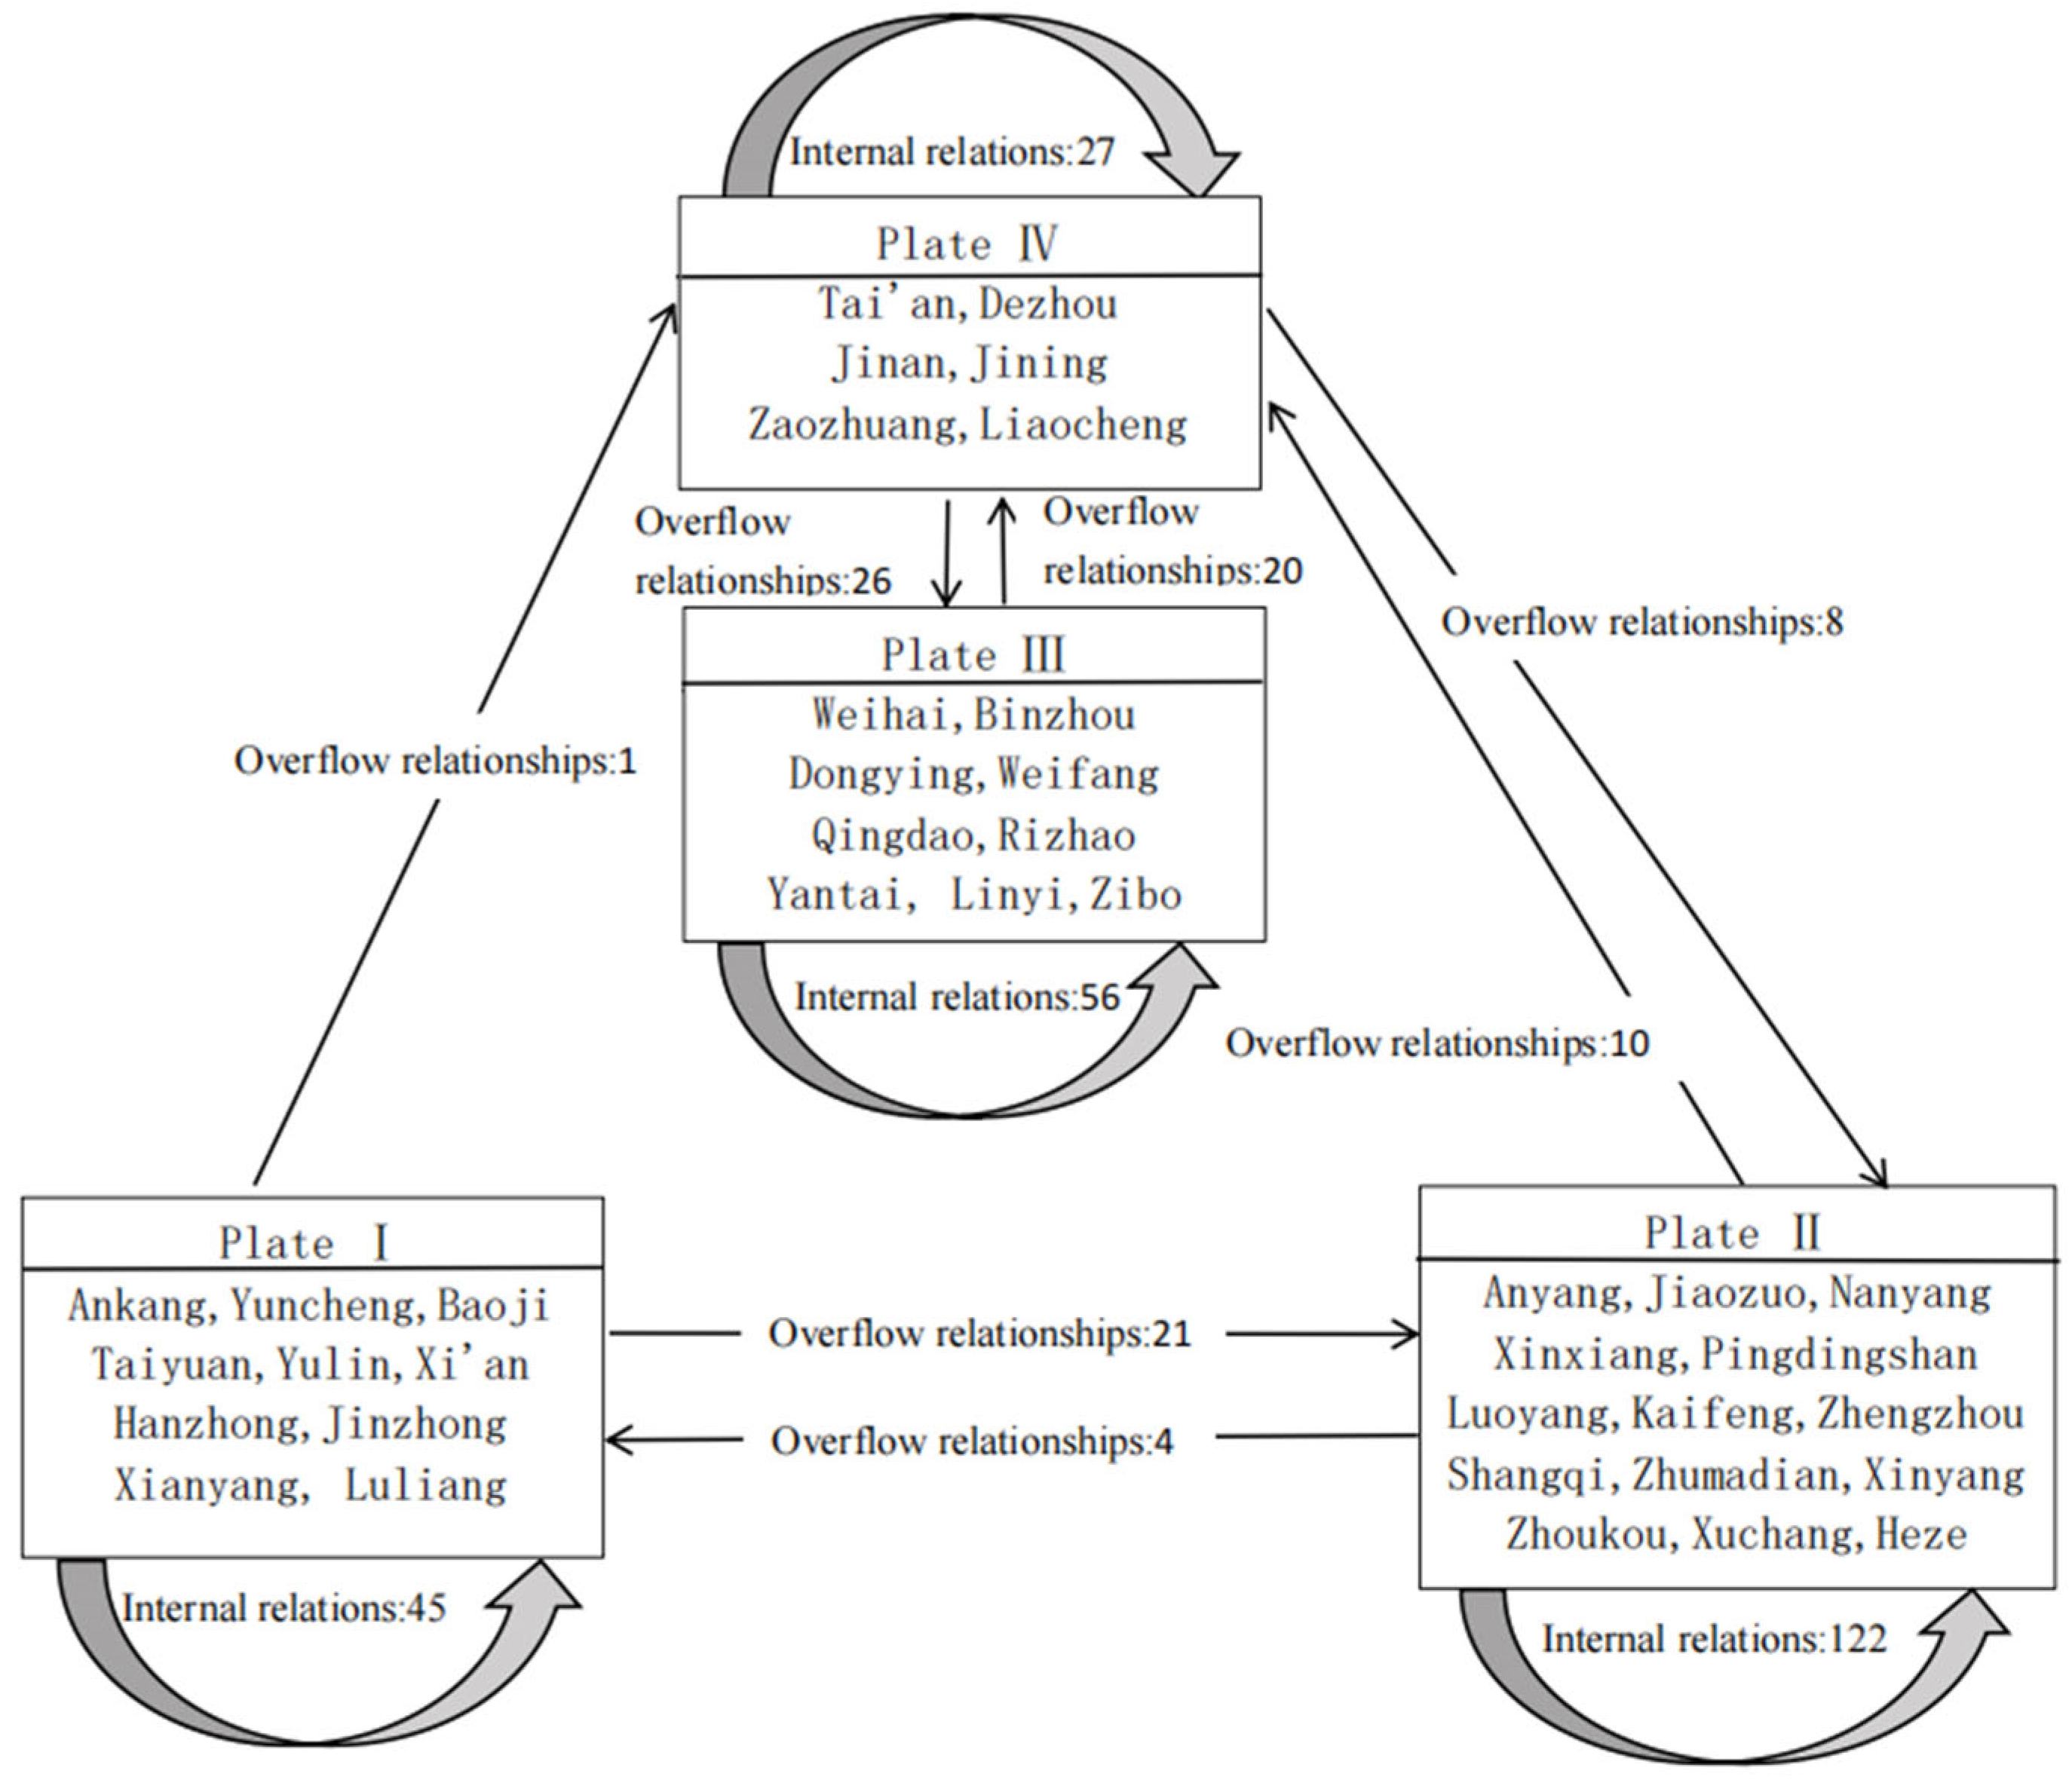
The spatial correlation network of coupling coordination between urban intelligent and green industries has largely taken shape, but it still requires enhancement in terms of spatial synergy. Central cities within the basin have emerged as important “intermediaries” in this network, facilitating the flow of resources and information. However, the roles of “bridge” in eastern coastal cities and western fringe cities are not as prominent, and the radiation and driving effects of provincial capital cities and developed cities need to be strengthened. The agglomeration effect has led to distinct patterns in the number of internal and external relations among different plates within the basin, with Plate I acting as a “net spillover” plate and Plate II as a “net benefit” plate. These findings underscore the importance of inter-plate cooperation and the need to further strengthen the connectivity and collaboration among different regions within the basin.
(3)
The influencing factors of the spatial correlation network are complex and multifaceted. Differences in geographical distance, scientific expenditure, and financial services have been found to inhibit communication and cooperation among cities, while differences in informatization level can promote the optimization of the spatial correlation network. These findings provide valuable insights for policymakers and practitioners in terms of designing targeted policies and measures to enhance the coupling coordination and spatial correlation network between urban intelligent industry and green industry.

Author Contributions

Conceptualization, X.C. and F.C.; methodology, F.C.; software, X.C.; validation, X.C. and F.C.; formal analysis, X.C.; investigation, X.C.; resources, X.C.; data curation, X.C.; writing—original draft preparation, X.C.; writing—review and editing, X.C.; visualization, F.C.; supervision, F.C.; project administration, F.C.; funding acquisition, F.C. All authors have read and agreed to the published version of the manuscript.

Funding

This research was funded by Shandong Province Social Science Planning Research Key Project (23BJJJ09).

Institutional Review Board Statement

Not applicable.

Informed Consent Statement

Not applicable.

Data Availability Statement

The raw data supporting the conclusions of this article will be made available by the authors on request.

Conflicts of Interest

The authors declare no conflicts of interest.

References

  1. Liu, M.; Ma, J.; Lin, L.; Ge, M.; Wang, Q.; Liu, C. Intelligent assembly system for mechanical products and key technology based on internet of things. J. Intell. Manuf. 2017, 28, 271–299. [Google Scholar] [CrossRef]
  2. Heblich, S.; Trew, A.; Zylberberg, Y. East-Side Story: Historical Pollution and Persistent Neighborhood Sorting. J. Political Econ. 2021, 129, 1508–1552. [Google Scholar] [CrossRef]
  3. Tao, F.; Qi, Q.; Wang, L.; Nee, A.Y.C. Digital twins and cyber–physical systems toward intelligent manufacturing and industry 4.0:Correlation and comparison. Engineering 2019, 5, 653–661. [Google Scholar] [CrossRef]
  4. Chen, H.; Shi, Y.; Xu, M.; Xu, Z.; Zou, W. China’s industrial green development and its influencing factors under the background of carbon neutrality. Environ. Sci. Pollut. Res. 2022, 30, 81929–81949. [Google Scholar] [CrossRef]
  5. Wang, W.; Wang, J.; Chen, C.; Su, S.; Chu, C.; Chen, G. A Capability Maturity Model for Intelligent Manufacturing in Chair Industry Enterprises. Processes 2022, 10, 1180. [Google Scholar] [CrossRef]
  6. Li, W.; Wang, X.; Li, L.; Zhong, X. The Current Development Status and Problems Analysis of Intelligent Manufacturing in China. Manuf. Serv. Oper. Manag. 2023, 4, 51–57. [Google Scholar]
  7. Chen, W.; Chen, J.; Xu, D.; Liu, J.; Niu, N. Assessment of the practices and contributions of China’s green industry to the socio-economic development. J. Clean. Prod. 2017, 153, 648–656. [Google Scholar] [CrossRef]
  8. Wang, Y.; Hu, H.; Dai, W.; Burns, K. Evaluation of industrial green development and industrial green competitiveness: Evidence from Chinese urban agglomerations. Ecol. Indic. 2021, 124, 107371. [Google Scholar] [CrossRef]
  9. Zhang, H. Intelligent Collaboration and Control of Robots in Assembly Production Lines. Int. J. Front. Eng. Technol. 2024, 6, 148–153. [Google Scholar]
  10. Kedong, Y.; Fangfang, C.; Chong, H. How does artificial intelligence development affect green technology innovation in China? Evidence from dynamic panel data analysis. Environ. Sci. Pollut. Res. Int. 2022, 30, 28066–28090. [Google Scholar]
  11. Wu, S.; Liao, J.; Huang, Z.; Wen, J. Research on the Impact of Green Finance on Regional Low-carbon Transition in the Context of High-quality Development—Based on Provincial Panel Data. Front. Econ. Manag. 2024, 5, 169–178. [Google Scholar]
  12. Yang, X.; Wei, M.; Li, Y.; Jiang, Y. Research on the policy effect and mechanism of green finance to reduce environmental pollution: Micro evidence from 285 cities in China. Environ. Sci. Pollut. Res. Int. 2023, 30, 70854–70870. [Google Scholar] [CrossRef] [PubMed]
  13. Wen, B.; Liu, F. The evolution and configuration mechanism of spatial correlation network in China’s innovation ecosystem. Environ. Technol. Innov. 2025, 38, 104157. [Google Scholar] [CrossRef]
  14. Li, Y.; Hao, S.; Liu, Y.; Chen, B.; Zou, T. Research on the spatial correlation network and its driving factors for synergistic development of pollution reduction, carbon reduction, greening, and growth in China’s tourism industry. J. Environ. Manag. 2025, 377, 124579. [Google Scholar] [CrossRef]
  15. Wan, J.; Chen, B.; Imran, M.; Tao, F.; Li, D.; Liu, C.; Ahmad, S. Toward dynamic resources management for IoT-based manufacturing. IEEE Commun. Mag. 2018, 56, 52–59. [Google Scholar] [CrossRef]
  16. Li, W.; Kara, S. Methodology for monitoring manufacturing environment by using wireless sensor networks (WSN) and the internet of things (IoT). Procedia CIRP 2017, 61, 323–328. [Google Scholar] [CrossRef]
  17. Abdul-Hamid, A.Q.; Ali, M.H.; Tseng, M.L.; Lan, S.; Kumar, M. Impeding challenges on industry 4. 0 in circular economy: Palm oil industry in Malaysia. Comput. Oper. Res. 2020, 123, 105052. [Google Scholar] [CrossRef]
  18. Lin, B.; Teng, Y. The effect of industrial synergy and division on energy intensity: From the perspective of industrial chain. Energy 2023, 283, 128487. [Google Scholar] [CrossRef]
  19. Chen, D.; Heyer, S.; Ibbotson, S.; Salonitis, K.; Steingrímsson, J.G.; Thiede, S. Direct digital manufacturing: Definition, evolution, and sustainability implications. J. Clean. Prod. 2015, 107, 615–625. [Google Scholar] [CrossRef]
  20. Aiting, X.; Wenpu, W.; Yuhan, Z. Does intelligent city pilot policy reduce CO2 emissions from industrial firms? Insights from China. J. Innov. Knowl. 2023, 8, 100367. [Google Scholar]
  21. Dai, H.; Yang, R.; Cao, R.; Yin, L. Does the application of industrial robots promote export green transformation? Evidence from Chinese manufacturing enterprises. Int. Rev. Econ. Financ. 2024, 96, 103538. [Google Scholar] [CrossRef]
  22. Lei, C.; Farhad, T.; Muhammad, M. Role of artificial intelligence on green economic development: Joint determinates of natural resources and green total factor productivity. Resour. Policy 2023, 82, 103508. [Google Scholar]
  23. Turek, D.; Radgen, P. Optimized data center site selection—Mesoclimatic effects on data center energy consumption and costs. Energy Effic. 2021, 14, 33. [Google Scholar] [CrossRef]
  24. Tu, Y.; Lu, L.; Wang, S. Environmental regulations, GHRM and green innovation of manufacturing enterprises: Evidence from China. Front. Environ. Sci. 2024, 12, 1308224. [Google Scholar] [CrossRef]
  25. Wang, J.; Wang, W.; Liu, Y.; Wu, H. Can industrial robots reduce carbon emissions? Based on the perspective of energy rebound effect and labor factor flow in China. Technol. Soc. 2023, 72, 102208. [Google Scholar] [CrossRef]
  26. Wang, R.; Zhang, Y.; Cai, W. A preliminary study on the evaluation index system of low carbon city development level. Front. Soc. Sci. Technol. 2023, 5, 60–64. [Google Scholar]
  27. Zhang, M.; Chen, X.; Yang, G. Coupling coordination degree and influencing factors of green science and technology innovation efficiency and digital economy level: Evidence from provincial panel data in China. Front. Environ. Sci. 2023, 11, 1104078. [Google Scholar]
  28. Han, X.; Zhang, X.; Lei, H. Analysis of the spatial association network structure of water-intensive utilization efficiency and its driving factors in the Yellow River Basin. Ecol. Indic. 2024, 158, 111400. [Google Scholar] [CrossRef]
  29. Liu, S.; Yuan, J. Spatial correlation network structure of energy-environment efficiency and its driving factors: A case study of the Yangtze River Delta Urban Agglomeration. Sci. Rep. 2023, 13, 20790. [Google Scholar] [CrossRef]
  30. Cheng, H.; Wu, B.; Jiang, X. Study on the spatial network structure of energy carbon emission efficiency and its driving factors in Chinese cities. Appl. Energy 2024, 371, 123689. [Google Scholar] [CrossRef]
  31. Wang, H.; Ge, Q. Spatial association network of economic resilience and its influencing factors: Evidence from 31 Chinese provinces. Humanit. Soc. Sci. Commun. 2023, 10, 290. [Google Scholar] [CrossRef] [PubMed]
  32. Dong, J.; Li, C. Structure characteristics and influencing factors of China’s carbon emission spatial correlation network: A study based on the dimension of urban agglomerations. Sci. Total Environ. 2022, 853, 158613. [Google Scholar] [CrossRef] [PubMed]
Figure 1. Schematic diagram of the coupling effect between urban intelligent industry and green industry.
Sustainability 17 05237 g001
Figure 2. The changing trend of coupling coordination in different regions.
Sustainability 17 05237 g002
Figure 3. Urban network density and network efficiency in the Yellow River Basin.
Sustainability 17 05237 g003
Figure 4. Maps of degree centrality, intermediate centrality, and proximity centrality distribution.
Sustainability 17 05237 g004aSustainability 17 05237 g004b
Figure 5. The division and interaction of the four plates of the urban spatial correlation network in the Yellow River Basin.
Sustainability 17 05237 g005
Table 1. Evaluation index system for intelligent and green industrial development in cities.
Goal LevelIndicator LevelEvaluation Indicators
Urban Intelligent IndustryFacility GuaranteeInternet penetration rate
Input StructureShare of R&D personnel in industrial employees
The proportion of R&D expenditure to industrial added value
Percentage of employees in Internet-related industries
Industrial StructureProportion of Intelligent Equipment Manufacturing Enterprises
Proportion of Artificial Intelligence Enterprises
Technological StructureInstallation density of industrial robots
Spatial StructureLocation entropy of the intelligent equipment processing industry
Urban Green IndustryFacility GuaranteeGreen Finance Index
Input StructurePercentage of Non-Fossil Energy
Percentage of investment in environmental protection projects
Share of Environmental Protection Expenditures in Fiscal Expenditures
Share of investment in pollution control in regional output value
Industrial StructureShare of number of enterprises in waste resource utilization industry
Share of number of pollution-intensive industrial enterprises (Negative indicator)
Technological StructureAverage number of green patents of industrial enterprises
Spatial StructureEntropy of clean industrial location
Table 2. Interaction of the four plates of the urban spatial correlation network.
PlateNumber of Receiving RelationshipsNumber of CitiesNumber of Spillover RelationshipsNumber of Accepted RelationshipsProportion of Expected Internal RelationsProportion of Actual Internal Relations
Plate IPlate IIPlate IIIPlate IV
I4521011022423.6867.16
II412201014142934.2189.71
III0056269262021.0568.29
IV0820276283713.1649.09
Table 3. Density matrix and image matrix of the four plates.
PlateDensity MatrixImage Matrix
Plate IPlate IIPlate IIIPlate IVPlate IPlate IIPlate IIIPlate IV
I0.5000.1500.0000.0171000
II0.0290.6700.0000.1190100
III0.0000.0000.7780.4810011
IV0.0000.0950.3700.9000011
Table 4. Results of QAP correlation analysis and regression analysis.
VariableQAP Correlation AnalysisQAP Regression Analysis
Correlation CoefficientSignificanceNon-Standardized Regression CoefficientNormalized Regression CoefficientSignificance
D i s −0.5580.000−1.371−0.5630.000
E x p −0.1590.000−0.148−0.0890.000
I n d −0.0420.016−0.021−0.0100.335
I n n −0.0860.001−0.026−0.0110.334
I n f −0.1090.0000.1910.0960.000
G f i −0.2260.000−0.229−0.1490.000
Disclaimer/Publisher’s Note: The statements, opinions and data contained in all publications are solely those of the individual author(s) and contributor(s) and not of MDPI and/or the editor(s). MDPI and/or the editor(s) disclaim responsibility for any injury to people or property resulting from any ideas, methods, instructions or products referred to in the content.

