Abstract
Flood events have become more frequent as a result of seasonal changes, global warming, and changes in sea level. In terms of basin management, it is necessary to know the hydrodynamics of the basin in order to produce faster solutions in emergency action plans. The Filyos River is one of the two most important floodplains in the western Black Sea basin and has so far only been analyzed to a limited extent using modern hydrological and hydraulic models. In order to analyze the flood dynamics and determine the flood risks in the Filyos River. In this context, flood hydrographs, rainfall depths, peak flows, and excess water volumes were calculated for different return periods (2, 5, 10, 20, 50, and 100 years) using HEC-RAS, HEC-HMS, and Hyfran Plus software. The analyses showed that the rainfall depth and peak flow rate increased significantly as the return period increased. It was also observed that although the volume of precipitation increased, the amount of water converted into surface runoff remained limited due to infiltration and other losses. The results of the study contribute to the identification of high flood-risk areas in the Filyos River basin, the improvement of flood prevention infrastructure, and the development of sustainable water management policies. Analyses using modeling tools such as HEC-RAS and HEC-HMS provide a scientific basis to help local governments and decision makers strengthen flood prevention strategies, update risk maps, and make emergency response plans more effective while making flood scenarios more reliable.
Keywords:
flood analysis; HEC-RAS; HEC-HMS; hyfran plus; filyos river; flood management; climate change 1. Introduction
Throughout history, rivers have played an important role in meeting our basic needs. Vital for drinking water supply, irrigation, and hydroelectric power generation, rivers are also natural phenomena at risk of flooding. Especially in recent years, flood events have become more frequent and severe due to seasonal changes, global warming, and sea level rise [1,2,3,4]. In particular, excessive and continuous rainfall exceeds the carrying capacity of rivers, causing water levels to exceed typical riverbeds and overflow into the floodplain and surrounding areas [5,6]. In addition, factors such as sudden snowmelt, increased soil saturation, and excessive groundwater accumulation are also important factors that increase flood risk [7]. These events not only threaten human life and property but also put productive agricultural lands along river banks at risk, leading to serious economic and environmental losses [8,9].
According to the 2022 Flood Risk Management Report, the lack of effective planning practices and uncontrolled development in high-risk areas are behind the inadequate prevention of flood impacts [10]. Climate change, which causes the occurrence of severe and frequent flood events, plays an important role in the flood management strategies of local governments [11,12,13,14].
In order to protect sustainable water resources, potential flood hazards need to be assessed and managed. For this reason, methods such as hydraulic modeling and flood risk maps are used. Recently, HEC-RAS and Geographic Information System (GIS) based software have been used frequently, which play an important role in the creation of flood risk maps. The role of this software is to simulate river flow and enable the mapping of floods on a local basis. It also contributes to learning the impact of possible climate change scenarios in the basins [15,16,17,18]. Since they work as a whole with the Digital Elevation Model (DEM), they allow visualization of the results. This provides important information to decision makers [19,20,21,22,23,24].
Hyfran Plus, one of the numerical simulation models, has proven to be an effective model for assessing the probability of occurrence of extreme hydraulic events [25]. Hyfran Plus enables the assessment of flood risks by performing flood frequency analysis according to different return periods. This constitutes an important reference point both in urban planning processes and engineering. In this respect, Hyfran Plus, together with software such as HEC-RAS and HEC-GeoRAS, provides important support in flood management and risk mitigation processes. Accelerating reconstruction after flood disasters is made possible primarily through rapid recording and spatial analysis of damage data using GIS technologies. In addition, precise hydraulic models allow targeted prioritization of affected infrastructure as well as efficient planning and allocation of resources. Pre-modeled automated assessments and scenarios help to significantly speed up decision-making processes during and after a crisis [26,27].
The aim of this study is to reveal the gaps in existing flood management strategies by addressing the flood risk analysis of the Filyos Sub-Basin from an up-to-date and holistic perspective. Although the region has frequently experienced flood disasters in the past, previous studies have generally been conducted with limited data sets, and detailed hydrological modeling and flood analyses based on different return periods have been insufficient.
Integrated software for the assessment of flood dynamics in the basin (HEC-RAS, HEC-HMS, and Hyfran Plus) takes this work one step further. HEC-RAS provides spatial mapping while HEC-HMS provides an estimate of the basin’s response to rainfall events. Hyfran Plus complements this software by estimating flood magnitudes for different return periods. Despite these limitations, the combination of these software provides a robust approach to flood risk assessment [28,29,30].
There are many studies in the literature on the assessment of flood dynamics [31,32,33,34,35,36,37,38,39,40,41,42]. For example, Gul et al. integrated HEC-HMS and HEC-RAS software to study the feasibility of a dam planned to be built in the Bostanlı basin in Turkey [31]. Again, HEC-HMS and HEC-RAS models were combined in a GIS to simulate floods in the Khoshke Rudan River in the Fars province of Iran [32]. Yamani et al. assessed the susceptibility of floodplains in arid areas of Ghardaia city using HEC-HMS and HEC-RAS [33]. Namara et al. produced flood maps for the Upper Awash River Basin in Ethiopia using HEC-RAS and HEC-HMS models [34].
The integrated use of these two models enables the simultaneous modeling of rainfall-runoff conversion processes at the basin scale and the hydraulic simulation of flood flow along the channel. In this regard, HEC-HMS and HEC-RAS provide a modeling framework suitable for producing detailed and decision-support-oriented results in flood analyses. The present study utilizes these capabilities to numerically examine the spatial and temporal dimensions of flood formation in the Filyos River basin.
Most studies conducted on the Filyos Basin in the literature have been carried out with local assessments and limited model parameters; scenario analyses based on recurrence intervals have been largely neglected. This study aims to fill this gap by spatially modeling potential floods for various flood periods (2, 5, 10, 20, 50, and 100 years) and evaluating region-specific flood risks, infrastructure needs, and management strategies based on these model results. Additionally, it aims to contribute to the development of a comprehensive flood management approach at the regional scale.
2. Materials and Methods
2.1. Description of the Study Area
The Filyos Sub-Basin is one of the most important sub-basins of the western Black Sea basin, with great economic and environmental importance. This study aims to assess the flood risks that may occur in the downstream basin of the Filyos River, the largest river of the Filyos Sub-Basin. The river has a 13,300 km2 drainage area and is located between 40°29′–41°36′ north and 31°11′–33°42′ east. The river passes through mostly forested areas and agricultural lands. The region has a Black Sea climate with maximum rainfall in fall and winter. The average annual temperature ranges between 7 and 23 °C. The river is known to carry an annual average of 2.9 km3 of water and 4.2 million tons of sediment. The highest average discharge was realized in April with 219 m3/s, and the lowest discharge was realized in September with 18 m3/s (Figure 1).
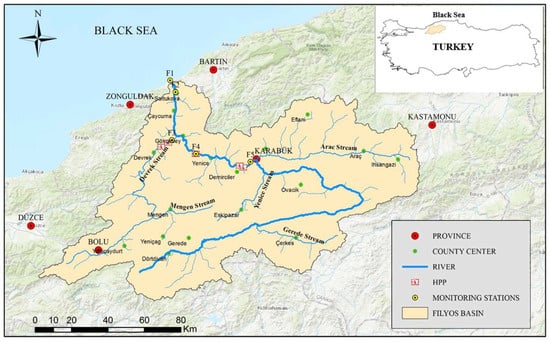
Figure 1.
Location of the study area [37].
In regions where natural and artificial interventions increase the risk of flooding, flood risk management, namely hydrological and hydraulic analyses, has become critical, especially for sustainable cities. Regulation structures made in river beds disrupt the natural balance. In the study, 84 years of data, including annual maximum precipitation and temperature between 1940 and 2023, were obtained from the General Directorate of State Meteorological Services (MGM). In addition, basin characteristic features and flow data (2004–2023) obtained from the State Hydraulic Works were included in the study. All data constituted an input for the HEC-RAS software, and hydraulic modeling was initiated. The flow chart of the study is given in Figure 2.
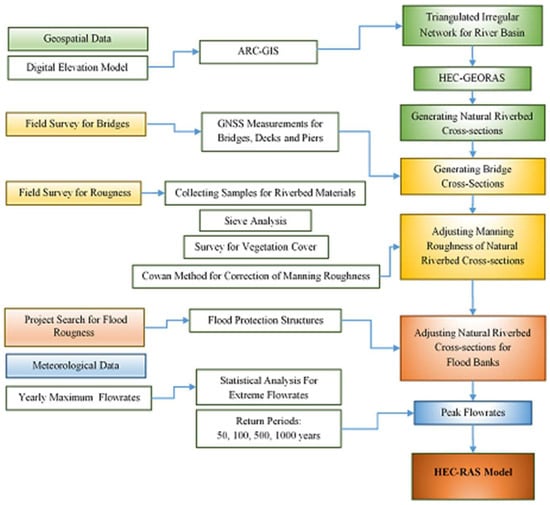
Figure 2.
The flow chart of the study.
2.2. Method
In the study, conducted on the Filyos River, the flood risk of the river was analyzed using hydrological and hydrodynamic modeling software such as HEC-RAS, HEC-HMS, and Hyfran Plus. This software was integrated specifically to simulate river flow, assess flood impacts in the local context, and consider possible climate change scenarios.
Hyfran Plus is a comprehensive software for flood frequency analysis and hydrological risk assessment. The software estimates the severity and frequency of hydrological events using probability distributions such as Gumbel, Log-Normal, Pearson Type III, and Weibull. It helps identify potential flood hazards by facilitating the modeling and seasonal data analysis phases. In addition, its visualization capability allows results to be presented effectively. For this reason, the software is recognized as a reliable software for the design of flood protection structures and the sustainability of water resources.
HEC-HMS (Hydrologic Engineering Center-Hydrologic Modeling System) [24], developed by the U.S. Army Corps of Engineers to be used for many hydrologic simulations, can be applied for analyses such as urban flooding, flood frequency, and flood warning system planning.
HEC-RAS (River Analysis System), developed by the US Army Corps of Engineers, provides the capability to model flooding in natural rivers and open channels by performing one- and two-dimensional flow calculations. The software is also used to describe the geometric characteristics of riverbeds, calculate water surface profiles under steady and unsteady flow conditions, and generate flood risk maps. Boundary conditions are selected based on field observations and literature recommendations [41].
In order to perform a statistical analysis of extreme flood events in the Filyos River basin, a frequency analysis was conducted using the Gumbel distribution. As seen in Figure 3, the relationship between annual maximum rainfall values for the period 1940–2023 and the return period was evaluated, resulting in a high coefficient of determination (R2 = 0.949), indicating a strong fit between the model and observed data. The last three points in the graph correspond to return periods of approximately 85–95 years and rainfall amounts of 140–155 mm, representing high-magnitude historical events such as those recorded in 1954 (147 mm), 1989 (144 mm), and 1972 (153 mm).
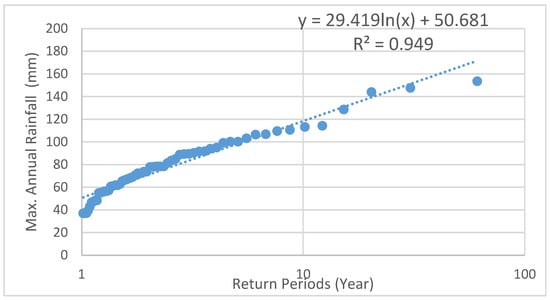
Figure 3.
Comparison of observed (blue dots) and simulated (dashed line) hydrographs for model validation.
During the flood on 9 July 2023, a heavy rainfall of 236 mm was recorded in the region. Based on the regression equation derived from the model (y = 29.419ln(x) + 50.681), this rainfall corresponds to a return period of approximately 540 years. Linear extrapolation further suggests that this event would result in a peak flow of about 90 m3/s. Therefore, the 2023 flood clearly exceeds the 1% annual exceedance probability (i.e., 100-year return period), confirming its status as an extremely rare and significant hydrological event.
3. Results and Discussion
Precipitation analysis is crucial for estimating future flood probabilities in a watershed and effectively determining flood risk. Rainfall data is used as an important input in hydrological modeling and plays a critical role in the development of flood management plans. Analyses to assess the flood risks of the Filyos River basin include the calculation of critical parameters such as rainfall depths, peak flows, and excess water volumes for different return periods (2, 5, 10, 20, 50, and 100 years). The annual maximum precipitation data presented in Table 1 include values recorded between 1940 and 2023. These data were subjected to statistical analysis using Hyfran Plus software, and rainfall depths were determined for different rotation periods (Table 2). Based on these data, flood scenarios corresponding to different recurrence periods were analyzed along the riverbed using the HEC-RAS model. The significant increase in rainfall depth observed with increasing recurrence period directly affects the flood spread areas. This situation is clearly demonstrated in the modeling results. Indeed, the cross-section profiles created using the discharge values obtained under 50-, 100-, and 500-year return periods in Figure 4 comparatively show the hydraulic effects of increasing recurrence intervals on the floodplain.

Table 1.
Maximum annual rainfall data for the study area (1940–2023).
Table 2.
Precipitation depths (mm) according to return periods.
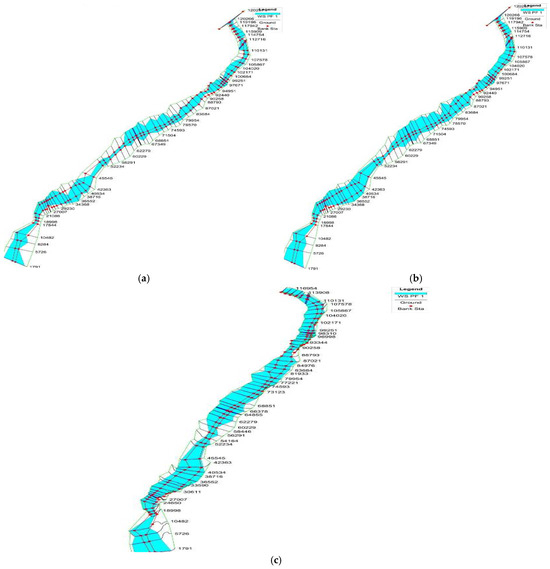
Figure 4.
Cross-sectional profiles of the Filyos River corresponding to flood discharges for (a) 50-year, (b) 100-year, and (c) 500-year return periods.
Furthermore, Figure 5 visually presents the total drainage area and channel drainage area values for each section, along with the flood propagation areas. These modeling results are consistent with the flooding of the airport and many surrounding areas during the flood disaster that affected the region in 2023, which had a recurrence interval of approximately 540 years (Figure 6).
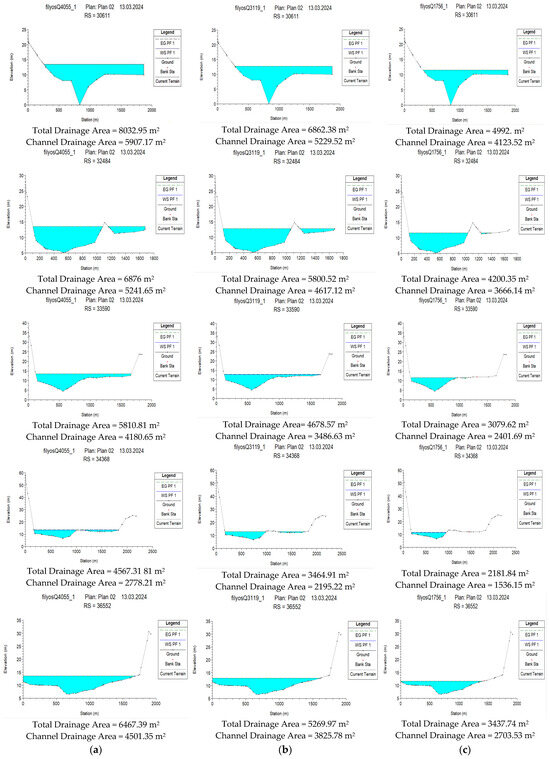
Figure 5.
Flood inundation potential at the cross-sections of Çaycuma Airport corresponding to (a) 500-year, (b) 100-year, and (c) 50-year return periods.
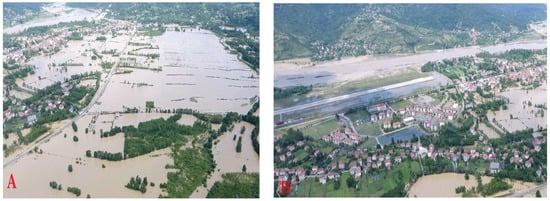
Figure 6.
Flood extent during the 2023 event (approximately 540-year recurrence interval) at (A) Çaycuma Airport and (B) its surrounding areas.
The long-term statistical distribution of precipitation data in the study area is presented in Table 3. The average precipitation value was 81.73 mm, while the maximum precipitation was recorded as 431.5 mm. The standard deviation (46.95 mm) and coefficient of variation (0.574) indicate that the variability in rainfall amounts is high. This variability should be taken into account, especially to increase the sensitivity of flood models and to predict future scenarios more accurately.
Table 3.
Maximum Annual Rainfall summary for the study area.
IDF curves were generated from annual rainfall data. The IDF (intensity, duration, and frequency) curves shown in Figure 7 include the probabilities of occurrence of rainfall events and the maximum 24 h rainfall depths critical for flood management. The red line represents data modeled according to a normal distribution, while the blue lines show the 95% confidence interval. Comparing the observations (+signs) with the model fit, it is seen that the data conform to the normal distribution. This finding plays an important role in assessing the uncertainty level of the confidence interval width in flood frequency analysis. In this context, by choosing the curve whose rain points were closest to the storm curve, the normal approach was chosen as one of the ideal probability distributions for rain depth (Figure 7).
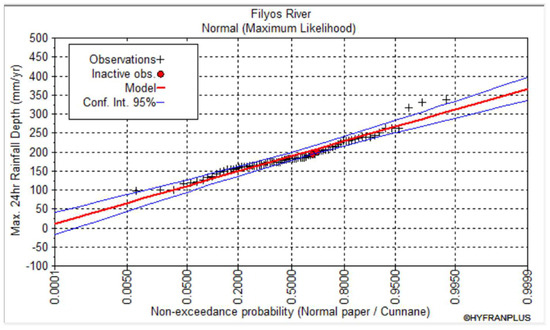
Figure 7.
Study area curve values (intensity, duration, frequency) (Hyfran Plus).
This analysis is of great importance in determining the most appropriate rainfall values that can be used in flood planning and hydraulic structure designs. Especially in flood frequency analysis, the width of the confidence interval helps to evaluate the level of uncertainty in flood forecasts.
Bell ratios are used in hydrological models to estimate short-term rainfall intensities from longer-term totals, simulate runoff, and assess flood potential. In this context, Table 4 shows the Bell ratios for different return periods, and Table 4 shows the rainfall values calculated using Bell ratios for different return periods. Equation (1) was used in the calculation of Table 4. The results obtained show that short-term heavy rainfall is more effective in flood formation.
Here,
I: Rainfall intensity (mm/h);
XT: 1.14 (Hyfran XT);
B: Bell Rate;
T: Duration (min).
Table 4.
Percentage of precipitation values for different return periods (Bell ratios).
Table 4.
Percentage of precipitation values for different return periods (Bell ratios).
| Time (min) | 10 | 20 | 30 | 60 | 120 | 180 | 360 | 720 | 1440 |
|---|---|---|---|---|---|---|---|---|---|
| Bell Average | 0.2 | 0.279 | 0.343 | 0.435 | 0.565 | 0.626 | 0.75 | 0.877 | 1 |
Table 5 shows the rainfall intensities (mm/hour) at different time intervals (10, 20, 30, 60, 120, 180, 360, 720, and 1440 min) for specific return periods. Rainfall intensity increases as the duration of precipitation shortens. This shows that short-duration but very heavy rainfall increases the risk of flash flooding. As the return period increases, the intensity of precipitation occurring in a given time period also increases. This is an indication that if extreme weather events occur more frequently, floods can have a greater impact on a larger scale.
Table 5.
Relationship between precipitation intensity and duration for different return periods.
Figure 8 shows the IDF (Intensity–Duration–Frequency) curves. These curves graphically present the rainfall intensities that may occur depending on the duration of rainfall in certain return periods. The intensity of short-duration precipitation is higher. While the intensity of precipitation is very high in periods of 10–30 min, the intensity decreases as the duration of precipitation increases. Long return periods (50–100 years) produce higher rainfall intensities.
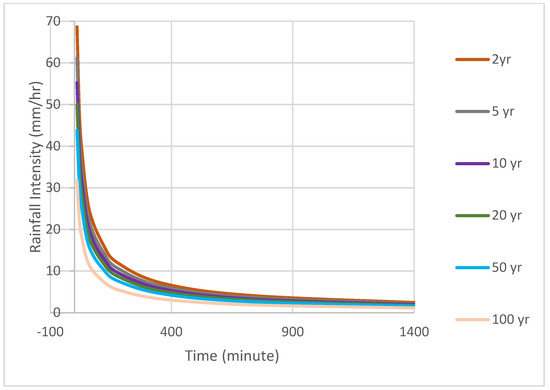
Figure 8.
IDF (Intensity-Duration-Frequency) curves for the study area.
Table 6 shows the rainfall depths (mm) at specific time periods (10, 20, 30, 60, 120, 180, 360, 720, and 1440 min) for different return periods (2, 5, 10, 20, 50, and 100 years). These values were determined using Equation (2).
Here,
D: Depth of precipitation (mm);
I: Rainfall intensity (mm/h);
T: Duration (min).
Table 6.
Rainfall depths for various return periods in the study area.
Table 6.
Rainfall depths for various return periods in the study area.
| Return Period | Time (Min) | ||||||||
|---|---|---|---|---|---|---|---|---|---|
| 10 | 20 | 30 | 60 | 120 | 180 | 360 | 720 | 1440 | |
| 2 yr | 14.0 | 19.5 | 24.0 | 30.5 | 39.6 | 43.83 | 52.5 | 61.4 | 70.1 |
| 5 yr | 16.0 | 22.3 | 27.4 | 34.8 | 45.2 | 50.07 | 60.0 | 70.2 | 79.9 |
| 10 yr | 18.0 | 25.1 | 30.9 | 39.2 | 50.9 | 56.34 | 67.5 | 79.0 | 90.0 |
| 20 yr | 20.0 | 27.9 | 34.3 | 43.5 | 56.5 | 62.61 | 75.0 | 87.7 | 100.1 |
| 50 yr | 22.0 | 30.7 | 37.7 | 47.9 | 62.2 | 68.85 | 82.5 | 96.5 | 109.9 |
| 100 yr | 24.0 | 33.5 | 41.2 | 52.2 | 67.8 | 75.12 | 90.0 | 105.2 | 120.0 |
When the table is analyzed, it is seen that rainfall depths increase significantly as the return period increases. For example, while the 10 min rainfall depth is 16.0 mm in the 5-year return period, it reaches 22.0 mm in the 50-year return period. Similarly, while the rainfall depth of 1440 min (24 h) is 79.9 mm in the 5-year return period, it increases to 109.9 mm in the 50-year return period.
Figure 9 presents the relationship between rainfall depth, duration, and frequency graphically. The graph clearly shows that as the duration of precipitation increases, the depth of precipitation also increases. However, while a sharper increase is observed in short-term precipitation, the increase in the amount of precipitation becomes more balanced as the duration increases. It is understood that, especially in long return periods (50 and 100 years), short-term but intense rainfall can greatly increase the flood risk.
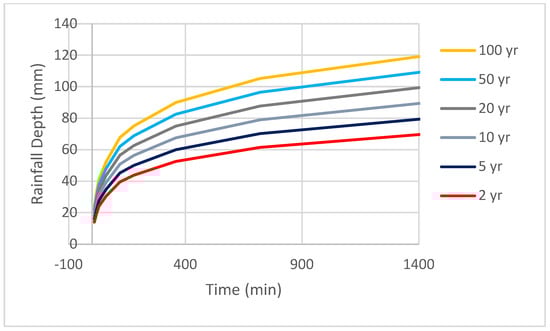
Figure 9.
Curves (depth-duration-frequency) of the study area for different return periods.
In order to calculate the flood characteristics of the Filyos River drainage basin, it is necessary to determine the basic hydrological characteristics of the basin (lag time, soil group, and concentration time). These parameters are critical data for understanding the rate of movement of water within the basin and its impact on flood occurrence. The parameters were calculated using the SCS technique to be used in the HEC-HMS software for the return periods we determined (Table 7).
Table 7.
Hydrological characteristics of the Filyos Sub-basin.
Table 8 presents the flood characteristics of the river for different return periods and shows that as the return period increases, the rainfall volume and peak flow values increase significantly. For example, while the rainfall volume was 71.7 mm for the 2-year return period, it increased to 213.2 mm for the 100-year return period. Similarly, while the peak flow rate is 26.49 m3/s for the 2-year return period, it reaches 78.77 m3/s for the 100-year return period. Approximately 88% of the precipitation falling in the basin infiltrates into the soil, and 12% becomes surface runoff.
Table 8.
Flood characteristics of the Filyos River basin.
The data presented in Table 8 shows that the volume of rainfall and peak flow increase significantly as the return period increases. This increase is one of the most important factors directly increasing flood risk. However, the fact that the Excess Volume shows a more limited increase compared to the rainfall volume indicates that the occurrence of flooding accelerates after the basin reaches a certain saturation point. Figure 8 and Figure 9 show this more clearly. Figure 6 presents the change in peak flow depending on the return periods, while Figure 7 graphically reveals the relationship between rainfall volume and excess water volume.
In this context, since the risk of flooding increases rapidly after the water retention capacity of the basin reaches a certain level, measures to reduce surface runoff should be taken in flood management strategies. In particular, it is recommended to strengthen stormwater management systems, protect natural water-absorbing areas, and increase flood control infrastructures.
The findings of the study are in line with previous research on flood dynamics in similar river basins. For example, Moriasi et al. reviewed different studies using basin models [41]. Santhi et al. and Van Liew et al. stated that R2 values higher than 0.6 are acceptable [42,43]. Mesta et al. (2019) found that the rainfall-runoff relationship in the Yenicegörüce basin, which includes the Inanlı, Lüleburgaz, and Hayrabolu sub-basins, can be estimated with an R2 value of 0.76 for the validation period [30]. These values show that the hydrological model works with a very good performance. Similarly, Dhanapala et al. found that short-duration but intense rainfall significantly increased flood risks in the Nilwala River Basin in Sri Lanka [20]. Samarasinghe et al. highlighted the impact of land use changes and climate variability on flood characteristics in the Kelani River Basin [17]. These studies highlight the importance of integrating hydrological modeling with climate change scenarios to better predict flood risks.
Figure 10 and Figure 11 show the variation in peak flow (Qpeak) and rainfall volume (P) depending on the return period. It shows that as the return period increases, the peak flow rate also increases. While the peak flow rate is approximately 26.49 m3/s in the 2-year return period, it reaches 78.77 m3/s in the 100-year return period. However, it is also observed that the rainfall volume increases as the return period increases.
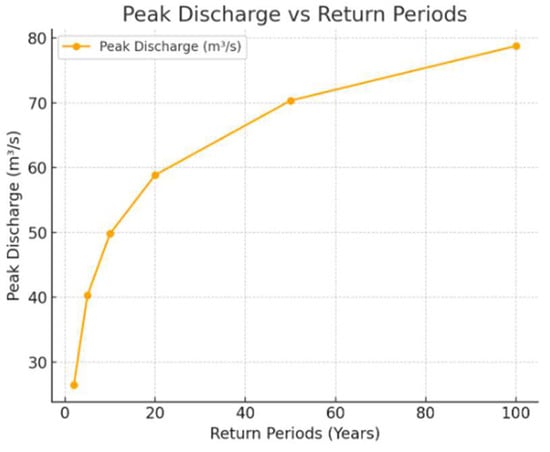
Figure 10.
Change in peak flow rate (Qpeak) according to return periods.
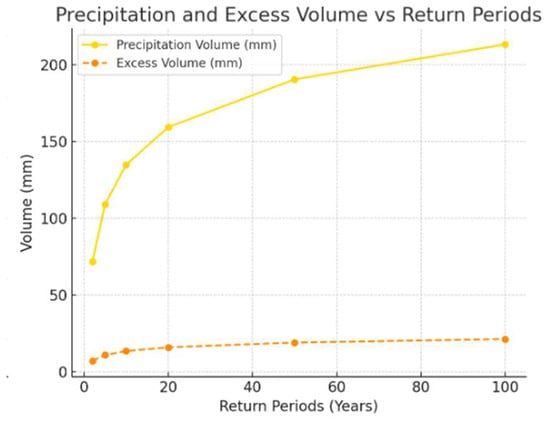
Figure 11.
Volume of precipitation (P) and volume of Excess Water (Qexcess) by return periods.
The graph in Figure 12 shows the relationship between Lost Volume and Excess Volume. It is seen that the loss volume increases faster with the increase in the rotation period. While the loss volume was 64.53 mm in the 2-year return period, this value increased to 191.88 mm in the 100-year return period. However, it is seen that the excess water volume remains constant.
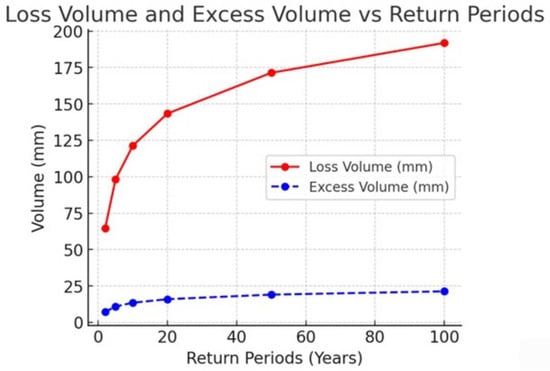
Figure 12.
Loss volume and excess volume by return periods.
Hydrographs are important for analyzing the variation in flooding over time and the time it takes to reach the peak flow. Figure 13 shows the variation in flood hydrographs for each return period in the Filyos River. Among the return periods analyzed, it is seen that the hydrograph in the 100-year return period both reaches a higher peak flow and the water level remains high for a longer period of time.
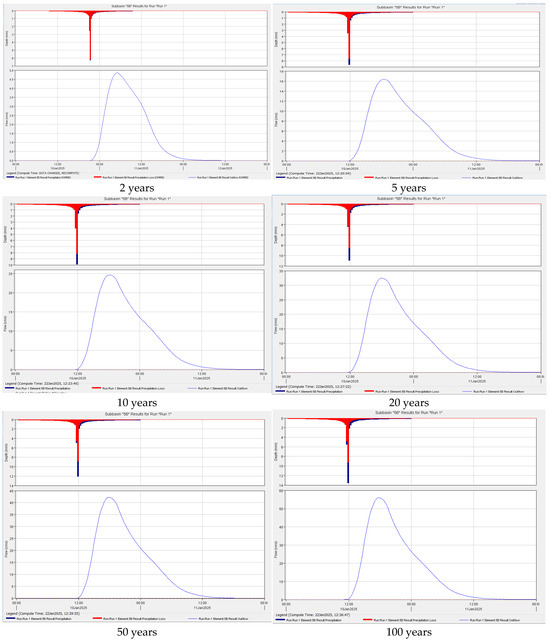
Figure 13.
Flood hydrograph of the Filyos River basin for return periods.
It is inevitable that the effects of climate change will have negative impacts on both rainfall patterns and floods [19]. The obtained data show that the increase in rainfall depth and peak flow rates for long return periods in the Filyos River basin due to climate change may further increase flood risks in the future. This situation emphasizes the need to incorporate climate change scenarios into flood forecasting systems and the need for adaptive strategies.
The flood event that occurred in the Filyos Basin on 9 July 2023 was a highly exceptional hydrological event, characterized by a rainfall depth of 236 mm. This value exceeds the 100-year recurrence period and corresponds to a return period of approximately 540 years according to the regression model (y = 29.419ln(x) + 50.681). The observed flood dynamics are consistent with the results of the present study, confirming the reliability of the integrated software tools (HEC-RAS, HEC-HMS, and Hyfran Plus) in predicting such extreme events. These findings indicate that the 2023 flood was among the most severe events recorded in the historical data of the basin.
4. Conclusions
This study aims to analyze the flood dynamics of the Filyos River for different return periods, determine flood risks, and contribute to flood management strategies. With the integrated operation of HEC-RAS, HEC-HMS, and Hyfran Plus software, flood formation mechanisms in the basin were analyzed in detail, and future floods were simulated. The findings of the study are summarized below:
Flood risk increases significantly as the return period increases. The rainfall volume increases from 71.7 mm for a two-year return period to 213.2 mm for a 100-year return period. Similarly, the peak flow rate increases from 26.49 m3/s for the 2-year return period to 78.77 m3/s for the 100-year return period.
The Filyos River basin has a hydrological structure prone to flash floods. According to the modeling results, approximately 88% of the precipitation falling in the basin percolates into the soil, while 12% turns into surface runoff. However, in cases of excessive rainfall, this balance is disrupted and flood formation accelerates.
The flood event that occurred on 9 July 2023 largely overlaps with the scenarios predicted by the model. In this flood, main roads, the airport, and agricultural areas along the Filyos River were severely damaged, and the inadequacy of infrastructure systems increased the impact of the flood.
Flood hydrographs show that the water level remains high for a long time during large return periods, and the post-flood drainage process is prolonged. This prolongs the post-flood recovery period of the basin and necessitates large-scale flood management measures.
In line with these findings, the following recommendations are presented to reduce the flood risk of the basin and provide safer flood management:
- Development of flood early warning systems: An early warning network with automatic sensors and meteorological monitoring systems should be established in the Filyos River basin, which has a high risk of flash flooding. Thus, the risk of flooding in sudden precipitation can be detected in advance, and rapid intervention can be provided.
- Strengthen drainage and infrastructure systems: Existing stormwater drainage systems should be expanded and permeable surfaces increased. In addition, flood channels in urbanized areas should be strengthened to protect the natural flow paths of water.
- Protecting natural floodplains and reviewing land use planning: Narrowing the river bed is one of the main factors that increases the flood impact. In areas with high flood risk, green areas should be increased, and construction should be limited.
- Update hydraulic modeling studies: Changes in precipitation regime caused by climate change affect flood dynamics. Existing flood forecasting models should be revised at regular intervals, supported by up-to-date data.
- Preparation of basin-based flood management plans: DSİ, municipalities, and other relevant institutions should develop a common flood management strategy and create region-specific action plans. In this context, measures should be taken for the renewal of flood evacuation infrastructure and water diversion in high-risk areas.
- Organization of community awareness activities and disaster preparedness training programs: Information on what to do during and after floods should be provided to people living in flood-prone areas. Disaster awareness should be increased through training programs organized by schools, local administrations, and non-governmental organizations.
This study provides a comprehensive understanding of flood dynamics in the Filyos River basin by addressing flood analysis with an integrated approach using both hydrological and hydraulic modeling techniques. With the integrated use of HEC-RAS, HEC-HMS, and Hyfran Plus software, it was determined with high accuracy how flood risks change depending on return periods. The modeling results were compared with real flood events, and it was shown that prolonged high water levels during large return periods complicate post-flood recovery processes. The study provides a scientific basis for decision makers by offering feasible policy recommendations for flood management. Supporting flood risk analysis with higher resolution data, using 2D and 3D flood propagation models, and updating flood forecasts according to different climate scenarios are recommended for future studies. These findings contribute to the development of comprehensive strategies to reduce the impact of floods in the Filyos River basin.
Funding
This research received no external funding.
Institutional Review Board Statement
Not applicable.
Informed Consent Statement
Not applicable.
Data Availability Statement
The original contributions presented in this study are included in the article. Further inquiries can be directed to the corresponding author.
Conflicts of Interest
The authors declare no conflict of interest.
References
- Venegas-Cordero, N.; Kundzewicz, Z.W.; Jamro, S.; Piniewski, M. Detection of trends in observed river floods in Poland. J. Hydrol. Reg. Stud. 2022, 41, 101098. [Google Scholar] [CrossRef]
- Cui, P.; Peng, J.; Shi, P.; Tang, H.; Ouyang, C.; Zou, Q.; Liu, L.; Li, C.; Lei, Y. Scientific Challenges of Research on Natural Hazards and Disaster Risk. Geogr. Sustain. 2021, 2, 216–223. [Google Scholar] [CrossRef]
- Das, S.; Pardeshi, S.D. Comparative Analysis of Lineaments Extracted from Cartosat, SRTM and ASTER DEM: A Study Based on Four Watersheds in Konkan Region, India. Spat. Inf. Res. 2018, 26, 47–57. [Google Scholar] [CrossRef]
- Ahmad, D.; Afzal, M. Flood Hazards and Livelihood Vulnerability of Flood-Prone Farm-Dependent Bait Households in Punjab, Pakistan. Environ. Sci. Pollut. Res. 2022, 29, 11553–11573. [Google Scholar] [CrossRef]
- Jones, E.R.; Bierkens, M.F.P.; Wanders, N.; Sutanudjaja, E.H.; Van Beek, L.P.H.; Van Vliet, M.T.H. DynQual v1.0: A high-resolution global surface water quality model. Geosci. Model Dev. 2023, 16, 4481–4500. [Google Scholar] [CrossRef]
- Ertan, A.; Özelkan, E.; Karaman, M. Determination of Flood Areas in Geographic Information Systems Platform Using Analytical Hierarchy Process: A Case Study in Çanakkale—Karamenderes Basin. J. Res. Atmos. Sci. 2021, 3, 1–9. [Google Scholar] [CrossRef]
- Ministry of Environment, Urbanization and Climate Change. Available online: https://csb.gov.tr/en (accessed on 23 May 2025).
- Mosavi, A.; Öztürk, P.; Chau, K. Flood Prediction Using Machine Learning Models: Literature Review. Water 2018, 10, 1536. [Google Scholar] [CrossRef]
- Tehrany, M.S.; Lee, M.J.; Pradhan, B.; Jebur, M.N.; Lee, S. Flood Susceptibility Mapping Using Integrated Bivariate and Multivariate Statistical Models. Environ. Earth Sci. 2014, 72, 4001–4015. [Google Scholar] [CrossRef]
- Turkish Court of Accounts. Available online: https://www.sayistay.gov.tr/?lang=en (accessed on 23 May 2025).
- Kazezyılmaz-Alhan, C.M.; Yalçın; Javanshour, K.; Aytekin, M.; Gülbaz, S. A Hydrological Model for Ayamama Watershed in Istanbul, Turkey, Using HEC-HMS. Water Pract. Technol. 2021, 16, 154–161. [Google Scholar] [CrossRef]
- Tsakiris, G. Flood Risk Assessment: Concepts, Modelling, Applications. Nat. Hazards Earth Syst. Sci. 2014, 14, 1361–1369. [Google Scholar] [CrossRef]
- Abdessamed, D.; Abderrazak, B. Coupling HEC-RAS and HEC-HMS in Rainfall–Runoff Modeling and Evaluating Floodplain Inundation Maps in Arid Environments: Case Study of Ain Sefra City, Ksour Mountain. SW of Algeria. Environ. Earth Sci. 2019, 78, 586. [Google Scholar] [CrossRef]
- Wang, X.; Liu, C. Flash Floods: Forecasting, Monitoring and Mitigation Strategies. Water 2023, 15, 1700. [Google Scholar] [CrossRef]
- Beden, N.; Ulke Keskin, A. Estimation of the Local Financial Costs of Flood Damage with Different Methodologies in Unye (Ordu), Turkey. Nat. Hazards 2021, 108, 2835–2854. [Google Scholar] [CrossRef]
- Jayanti, M.; Hadihardadja, I.K.; Dwi Ariesyady, H.; Messakh, J.J. Climate change impacts on hydrology regime and water resources sustainability in cimanuk watershed, West Java, Indonesia. Int. J. Geomate 2020, 19, 90–97. [Google Scholar] [CrossRef]
- Samarasinghe, J.T.; Makumbura, R.K.; Wickramarachchi, C.; Sirisena, J.; Gunathilake, M.B.; Muttil, N.; Teo, F.Y.; Rathnayake, U. The Assessment of Climate Change Impacts and Land-use Changes on Flood Characteristics: The Case Study of the Kelani River Basin, Sri Lanka. Hydrology 2022, 9, 177. [Google Scholar] [CrossRef]
- Iliadis, C.; Galiatsatou, P.; Glenis, V.; Prinos, P.; Kilsby, C. Urban Flood Modelling under Extreme Rainfall Conditions for Building-Level Flood Exposure Analysis. Hydrology 2023, 10, 172. [Google Scholar] [CrossRef]
- Huo, L.; Sha, J.; Wang, B.; Li, G.; Ma, Q.; Ding, Y. Revelation and Projection of Historic and Future Precipitation Characteristics in the Haihe River Basin, China. Water 2023, 15, 3245. [Google Scholar] [CrossRef]
- Dhanapala, L.; Gunarathna, M.H.J.P.; Kumari, M.K.N.; Ranagalage, M.; Sakai, K.; Meegastenna, T.J. Towards Coupling of 1D and 2D Models for Flood Simulation—A Case Study of Nilwala River Basin, Sri Lanka. Hydrology 2022, 9, 17. [Google Scholar] [CrossRef]
- Azhar, H.; Mohammed, S.; Mohammed, L.A. Simulation of Floods in Delhi Segment of River Yamuna Using HEC-RAS. Am. J. Water Resour. 2018, 6, 162–168. [Google Scholar]
- Hamdan, A.N.A.; Almuktar, S.; Scholz, M. Rainfall-Runoff Modeling Using the HEC-HMS Model for the Al-Adhaim River Catchment, Northern Iraq. Hydrology 2021, 8, 58. [Google Scholar] [CrossRef]
- Ameera, M.A. Hydraulic Model Development using HEC-RAS and Determination of Manning Roughness Value for Shatt Al-Rumaith. Muthanna. J. Eng. Technol. 2016, 4, 9–13. [Google Scholar]
- Feldmann, D.; Laux, P.; Heckl, A.; Schindler, M.; Kunstmann, H. Determining near surface roughness based on artificial precipitation experiments on natural hillslopes for the application in hydrodynamic flash flood modelling. In Proceedings of the 2, EGU General Assembly, Vienna, Austria, 23–28 April 2023. [Google Scholar] [CrossRef]
- Dawood, A.H.; Mawlood, D.K.; Al-Ansari, N. Flood Modeling on Koya Catchment Area Using Hyfran, Web Map Service, and HEC-RAS Software. Aro-Sci. J. Koya Univ. 2021, 9, 107–111. [Google Scholar] [CrossRef]
- Abubakr, T. Evaluation of The Best Fit Distribution for Maximum Daily Rainfall Series in Wadi Arbaat, Eastern Sudan. In Proceedings of the International Conference on Water, Energy and Environment (ICWEE/7), Sharjah, United Arab Emirates, 22–24 November 2022; Volume 7. [Google Scholar]
- El Adlouni, S.; Bobée, B. Hydrological Frequency Analysis Using HYFRAN-PLUS Software. User’s Guide Available with the Software DEMO. 2015. Available online: http://www.wrpllc.com/books/HyfranPlus/indexhyfranplus3.html (accessed on 1 October 2024).
- Verma, A.K.; Jha, M.K.; Mahana, R.K. Evaluation of HEC-HMS and WEPP for simulating watershed runoff using remote sensing and geographical information system. Paddy Water Environ. 2010, 8, 131–144. [Google Scholar] [CrossRef]
- Khan, Z.; Alim, M.A.; Rahman, M.M.; Rahman, A. A continental scale evaluation of rainwater harvestingin Australia. Resour. Conserve Recycl. 2021, 167, 105378. [Google Scholar] [CrossRef]
- Mesta, B.; Kargı, P.G.; Tezyapar, İ.; Ayvaz, M.T.; Göktas, R.K.; Kentel, E.; Tezel, U. Determination of rainfall-runoff relationship in Yenicegoruce Basin with HEC-HMS hydrologic model. Pamukkale Univ. J. Eng. Sci. 2019, 25, 949–955. [Google Scholar] [CrossRef]
- Gül, G.O.; Harmancıoğlu, N.; Gül, A. A Combined Hydrologic and Hydraulic Modeling Approach for Testing Efficiency of Structural Flood Control Measures. Nat. Hazards 2010, 54, 245–260. [Google Scholar] [CrossRef]
- Hashemyan, F.; Khaleghi, M.; Kamyar, M. Combination of HEC-HMS and HEC-RAS Models in GIS in Order to Simulate Flood (Case Study: Khoshke Rudan River in Fars Province, Iran). Res. J. Recent Sci. 2015, 4, 122–127. Available online: https://www.isca.in (accessed on 20 April 2025).
- Yamani, K.; Hazzab, A.; Sekkoum, M.; Slimane, T. Mapping of Vulnerability of Flooded Area in Arid Region. Case Study: Area of Ghardaïa-Algeria. Model. Earth Syst. Environ. 2016, 2, 147. [Google Scholar] [CrossRef]
- Namara, W.G.; Damisse, T.A.; Tufa, F.G. Application of HEC-RAS and HEC-GeoRAS Model for Flood Inundation Mapping, the Case of Awash Bello Flood Plain, Upper Awash River Basin, Oromiya Regional State, Ethiopia. Model. Earth Syst. Environ. 2022, 8, 1449–1460. [Google Scholar] [CrossRef]
- Sañudo, E.; Cea, L.; Puertas, J. Modelling pluvial flooding in urban areas coupling the models iber and SWMM. Water 2020, 12, 2647. [Google Scholar] [CrossRef]
- Sanz-Ramos, M.; Bladé, E.; González-Escalona, F.; Olivares, G.; Aragón-Hernández, J.L. Interpreting the manning roughness coefficient in overland flow simulations with coupled hydrological-hydraulic distributed models. Water 2021, 13, 3433. [Google Scholar] [CrossRef]
- Aksoy, B.; Öztürk, M.; Özölçer, İ.H. Effect of Bed Material on Roughness and Hydraulic Potential in Filyos River. Water 2024, 16, 2934. [Google Scholar] [CrossRef]
- Anand, J.; Gosain, A.K.; Khosa, R. Hydrological and hydrodynamic modelling for flood management: A case study of the Yamuna River Basin in Delhi. J. Hydrol. Reg. Stud. 2024, 56, 101960. [Google Scholar] [CrossRef]
- Hicks, F.E. Hydraulic Flood Routing with Minimal Channel Data: Peace River, Canada. Can. J. Civ. Eng. 1996, 23, 524–535. [Google Scholar] [CrossRef]
- Slim, M. Frequency analysis of extreme rainfall over the Japanese archipelago by leveraging gauge-adjusted radar and satellite estimates. J. Hydrol. 2024, 637, 131425. [Google Scholar] [CrossRef]
- Moriasi, D.N.; Wilson, B.N.; Douglas-Mankin, K.R.; Arnold, J.G.; Gowda, P.H. Hydrologic And Water Quality Models: Use, Calibration, And Validation. Trans. ASABE 2012, 55, 1241–1247. [Google Scholar] [CrossRef]
- Santhi, C.; Arnold, J.G.; Williams, J.R.; Dugas, W.A.; Srinivasan, R.; Hauck, L.M. Validation Of The Swat Model On A Large Rwer Basin With Point And Nonpoint Sources. J. Am. Water Resour. Assoc. 2007, 37, 1169–1188. [Google Scholar] [CrossRef]
- Van Liew, M.W.; Arnold, J.G.; Garbrecht, J.D. Hydrologic Simulation On Agricultural Watersheds: Choosing Between Two Models. Am. Soc. Agric. Biol. Eng. St. Joseph 2003, 46, 1539–1551. [Google Scholar] [CrossRef]
Disclaimer/Publisher’s Note: The statements, opinions and data contained in all publications are solely those of the individual author(s) and contributor(s) and not of MDPI and/or the editor(s). MDPI and/or the editor(s) disclaim responsibility for any injury to people or property resulting from any ideas, methods, instructions or products referred to in the content. |
© 2025 by the author. Licensee MDPI, Basel, Switzerland. This article is an open access article distributed under the terms and conditions of the Creative Commons Attribution (CC BY) license (https://creativecommons.org/licenses/by/4.0/).