Abstract
This study examined a proposed system integrating waste power plants, a utility grid, and battery technologies to optimize energy operations for the On-nut community in Bangkok. The system was modeled through experimental, mathematical, and schematic approaches to identify the most efficient energy generation and cost management strategies utilizing lithium, flow, and zinc bromide batteries. This was achieved by employing industrial smart grid analysis, closed-loop algorithms, and feedback control systems to manage energy flow econometrics through switching operations, thereby maximizing electric cost efficiency and network service from the integrated system architectures (grid/lithium/biogas, grid/flow/biogas, and grid/zinc bromide/biogas systems). The proposed configuration of the biogas generator/grid/lithium-ion storage network demonstrated the highest technical efficiency in energy purchases, totaling 239,764 kWh, with energy sales to the grid amounting to 1,959,426 kWh and the lowest net energy purchase from the grid at 1,719,661 kWh. Conversely, the biogas generator/grid/zinc bromide storage configuration achieved the most economical network, reflected in an overall current cost of USD 8,647,863.00, an operating cost of USD 143,974.00, an investment return rate of 17.00%, an internal return rate of 20.30%, and a payback period of 4.83 years. The biogas generator/grid/zinc bromide network exhibited the highest performance ratio at 80.55%, surpassing the flow battery at 79.65% and lithium-ion at 78.89% in terms of energetic configurations.
1. Introduction
The provision of electric energy to remote and isolated regions is crucial for enhancing livelihoods and fostering economic growth, thereby facilitating development in these areas. A rural electricity study in India was presented by Rajbongshi et al. [1], which was observed to reduce energy costs when connected to the grid system. When there is a capacity shortage from the hybridized energy network or peak energy (hourly) demand, the grid system can supply the deficit power through grid purchases. The electric energy cost reduced to USD 0.0640/kWh from USD 0.1450/kWh according to the authors’ report study. An examination of various architectures of hybrid energy networks in the Harbin housing estate, situated in a cold climate in China, reveals that global solar insolation influences the valuation of electric energy flow. Additionally, the current fractional values of the fossil fuel generator (diesel) within the solar–diesel hybrid energy system are also impacted. The utilization of fossil fuel power plants and the expansion of grid systems represent conventional methods for generating and supplying electricity to remote and isolated regions. However, these approaches are increasingly viewed as less viable alternatives due to the global depletion of fossil fuel resources and the challenges associated with transporting these fuels to distant areas, which also contributes to environmental pollution. Additionally, extending grid services to isolated communities may prove to be economically unfeasible due to the substantial capital investment required [2]. The implementation of clean energy facilities has garnered significant interest due to the advantage of reduced emissions on a global scale. However, the inherent instability and unpredictability of renewable sources, such as solar PVe (photovoltaic) and wind turbine systems, along with their respective resources (solar insolation and wind velocity), have raised concerns regarding the oversizing of components to ensure the reliability of energy systems, consequently leading to increased costs in power systems. To address these challenges, integrating renewable energy sources that combine various alternative resources with energy storage or a backup fossil fuel power plant can enhance cost estimation and reliability of generation sources for remote or isolated villages that have limited or no access to the grid. The distance from the energy source to the load has an economically feasible impact on a modeled system comprising diesel plants, batteries, and solar generators, which has demonstrated greater power reliability and economic feasibility compared to traditional fossil fuel (diesel) generators, studied by Odou et al. [3]. An examination and review of integrated renewable energy sources in both off-grid islands and grid integration was conducted, focusing on their various architectures, optimization methods, and planning strategies [4]. In developing nations, numerous alternative energy sources for electrification in isolated or remote regions have been established, employing integrated island or off-grid systems [5]. A comprehensive off-grid biogas generator and solar PVe system was developed to provide a dependable electricity supply for both residential areas and agricultural activities in a small village in Pakistan [6]. Previous research has primarily concentrated on a singular energy system within a specific location, lacking comprehensive discussion and analysis of the potential capacity and flexible hybrid alternative energy systems proposed for various scenarios. This is particularly relevant to external infrastructural conditions that may differ when interfaced with the grid system.
A grid integration system combining biogas generators, solar PVe plants, and fossil power plants (diesel) was successfully implemented in a village in Iran through technical analysis and optimization design. Kasaeian et al. [7] investigated differences in sensitivity to uneven economic conditions, focusing on essential economic indicators like inflation and discount rates, within the enhanced framework of the energy system. The researchers in [8] introduced a cohesive electro-mechanical–bioprocess system that enhances sludge utilization while ensuring minimal environmental repercussions. This method achieves an impressive recovery rate of organics, with approximately 91.4% net organic carbon, which is efficiently transformed into a unicellular protein with over 63.0% net organic carbon through a sequential process. A thorough life cycle and technological/economic assessment validates the significant environmental and financial advantages of this method. Importantly, it leads to a 99.5% reduction in carbon (IV) oxide emissions and a 99.3% reduction in energy consumption compared to the traditional anaerobic breakdown process. Merabet et al. [9] conducted a comprehensive review highlighting their key finding regarding the viable generation of hydrogen gas as a sustainable energy transition derived from various wastewater treatment technologies, including electrochemical, biological, and advanced oxidation methods. The core objective of their review is to mitigate the carbon intensity associated with emissions from fossil energy sources. Quan Lee et al. [10] reported an electrical reformation of waste generated from sugarcane bagasse to produce essential compounds and sustainable hydrogen gas. The electrical reformation process is powered by a solar PVe generator by introducing a secure and low carbon intensity pathway to produce sustainable green hydrogen gas and chemicals derived from raw biomass materials. Nguyen et al. [11] and associates conducted a study on the generation of sustainable green hydrogen gas through pyrolysis and gasification technologies, focusing on the efficiency, technical challenges, and mechanisms associated with these processes. They highlighted the transformation of biomass waste into green hydrogen gas, achieving a production efficiency ranging from 40.0% to 60.0% with a high heating value. Their study also offers an overview of optimized conditions to maximize the yield of green hydrogen gas and the volumetric composition percentages of various types of biomass waste. The growth in the production of municipal solid waste (which includes non-liquid waste from households, individuals, hospitals, schools, and similar sources) and non-municipal solid waste (comprising significant waste categories from industrial, mining, and agricultural activities) is linked to the increase in the global population. The accumulation of waste materials, especially food waste, is primarily due to densely populated regions that draw in tourists [12]. The agricultural sector faces significant challenges due to the large quantities of biodegradable materials and agricultural waste, rendering them unsuitable for human consumption and livestock byproducts. The estimated annual global waste production is between 7.0 × 10⁹ and 9.0 × 10⁹ tons, exceeding the 2.0 × 10⁹ tons of municipal solid waste produced each year [13,14]. With expected production projected to attain a value of 3.40 × 10⁹ tons/year by 2050. Close to 33.3% of food production for consumption by humans was discarded with an estimated value of 1.30 × 10⁹ tons yearly [15]. In contemporary societies, the challenge of waste management has garnered significant attention, focusing on minimizing the accumulation of waste in landfills, enhancing waste segregation as an evolving practice in developed nations, and facilitating more cost-effective and accessible recycling processes. Most biological wastes are compostable and can undergo a natural decomposition and burning process. The byproduct of treating industrial wastewater and municipal wastes is waste sludge generation, which requires disposal. Irrespective of reducing wastes effectively and wastes ending up in landfills, conventional processing methods can have several adverse effects on the human environment, including the effects of greenhouse emissions and soil, groundwater, and air contamination. The waste-to-energy conversion (formation of gases) technique is one of the atmospheric-friendly management processes of wastes by which wastes from biodegradable substances are processed into gas (biogas) by an anaerobic breakdown (digestion) reaction. The biogas power plants utilize biomass resources efficiently, reduce CO2 emissions, make energy that is friendly to the environment, and impact the environment in an economically favorable way. In general, accepting biogas power plants from residential areas is welcoming; however, the harmful effect due to generally accepting the biogas system arises from odors, which are not pleasant within the biogas power plants’ vicinity, the hazardous nature of the odor, noise pollution, food production causing competition, and traffic [16]. Generally, raw biomass materials for biomass gasifier plants can be categorized into six components, namely, animal wastes, field/garden wastes, organic industrial wastes, municipal solidified wastes, food wastes, and sludge. Bioenergy can be beneficial to the environment if feedstocks are sustainable and there is no competition with the production of food and biodiversity’s negative impacts [17]. Capturing carbon/utilization/storage can reduce emissions of carbon dioxide (CO2) from the generation of fuel and hydrogen gas with low carbon.
Baruah et al. [18] analyzed the economics and technical operation feasibility of a modeled autonomous hydrokinetic/photovoltaic/battery/biogas/wind generator by applying HOMER PRO smart grid simulation/optimization tools to determine the production energy for Sikkim, an eastern district of India with the lowest levelized energy valuation of USD 0.095/kWh, overall current cost of USD 5 million, and annual gas emissions of 995,709 kg/year. Zhou et al. [19] focused on designing a battery/diesel generator/biogas plant/wind turbine stand-alone smart grid network with a discussion on issues of dispatch, operation, and energy management features. The controllable biogas plant and wind turbine were localized to monitor fluctuations from load over a lengthy timescale to reduce the production of power from the diesel generator and the maximum demand shifting request of the storage system (battery banks). Singh and Basak [20] proposed a concept and evaluated a small-scale rice straw-referenced microgrid system economically and technically that utilized excess rice straw from a village (900 acres of cultivated land and 250 houses) for electric production. The proposed system can process 1128 tons of excess rice straw annually and feed the community’s energy demand. The rice straw was processed by a gasification technology, which was incorporated with a utility grid/battery/solar PVe system. The levelized electricity cost of the designed microgrid (biogas/battery/utility grid/solar PVe) system was USD 0.089/kWh. Ribo-perez et al. [21] applied HOMER power software to build biogas generator modules, including economic and technical operation parameters for simulation. In fueling energy generation through synthetic gas production from a downdraft biogasification plant, rural communities of Zambia and Honduras were used as case studies to demonstrate the procedure’s viability. Odoi-Yorke et al. [22] utilized a proposed battery/biogas plant/solar PVe system to energize remote communities of Ghana and discovered that their proposed system generated USD 0.256/kWh of levelized electric costs, which was more than the household residents of Ghana’s levelized electric costs by 64.0%. They (the authors of [22]) also noticed that their proposed system was more efficient in performance than the battery/diesel plant/solar PVe and independent diesel generator systems, considering emissions and costs as factors. Tostado-Veliz et al. [23] developed an innovative unified diesel generator/biogas plant/solar PVe optimal system in off-grid operation for isolated regions with biomass waste potential. They observed that the cost of the implementation of the unified microgrid system was reduced by 90.0% through the biogasifier system. They also noticed an 83.0% reduction in the net carbon (IV) oxide emissions in comparison to the conventional sources (diesel plants) applied as a reference or baseline system, which generated a 33.0% increase in the net project valuation, as the biomass price increased from USD 0/kg to USD 0.4/kg within the feasible econometric sensitivity performance.
Loboichenko et al. [24] reviewed the issue of the structure of potential biogas microgrids (energy production networks) in detail. They noticed that the production potential of the biogas microgrid networks generated a daily energy of 5.0 MWh/day. The biogas plant contributed an overall energy capacity ranging from 1.0% to 67.0% to the microgrid network. Santos et al. [25] presented a hybrid thermal generator/bio-digester/grid/battery microgrid network that produces biogas fuel from the bio-digester to fuel the thermal generators for electric production to be consumed by the load. The biogas fuel was upgraded to generate bio-methane. The designed microgrid model by the authors generated low operating costs of BRL 1170.99 and BRL 345.69 during weekdays and weekends with a limited biogas fuel production of 490 kWh, insufficient for electro-mechanical energy demand. Amorim et al. [26] proposed an integrated cardinal non-linear programming algorithm to integrate a unified distribution of microgrid generation (biogas generator/wind power/solar photovoltaic panel network) to manage the unstable renewable sources with local regulation compliance in Brazil. The application of cluster technology and efficient time-sensitive model analysis to the proposed microgrid network against load variation reduced its overall energy cost by 45.0%. The authors also discovered that an organized systematic model could fulfill 100% of the energy and heated water demand through all scenarios when crucial roles are played by customized incentives to reduce energy costs and promote energy sustainability. Jabbary et al. [27] investigated the utilization of optimal local biogas fuel production in multiple-energy generation sources of a photocell/micro-turbine/biomass plant/wind turbine/gas network feed/grid/battery cell network by adopting GAMS energy analysis software. The operating costs of the microgrid system were reduced significantly to 46.0% with a value of USD 2800/day. The energy transfer or power flow between the micro-hubs’ local network was also reduced significantly, by 39.40%. The micro-hubs’ local energy supply cost for the off-grid operation was reduced by USD 1400/day (34.0%) compared to its normal operation mode. Kumari et al. [28] addressed the unstable frequency operation of a microgrid system comprising a solar PVe cell/biogas plant/grid/Li-ion battery network. The unstable inertia of the microgrid network was caused by the low generating capacity of the biogas plant. The adoption of the permanent magnetization of a synchronous machine (PMSMA) with a bidirectional AC/DC/AC power converter was used to connect the biogas generator to the microgrid network. The PMSMA machine and bidirectional AC/DC/AC power converter maintained a stable frequency between the biogas plant and microgrid system, which was verified through the output result of the OPAL/RT simulator system. Sengupta et al. [29] considered a modeled biogas plant/wind plant/solar PVe cell/grid microgrid system that utilizes a physics-referenced model to determine the power generation capacity of the solar PVe system in a soiled state. The output result of the solar PVe recorded an estimated error of ±6.50% from its energy value and an estimated error of ±6.00% between the power estimated and power measurement value of 10.0 kWp. The soiled state of the solar PVe system generated a power of 5.10 kW, and the wind turbine generated a power value of 90.0 W by importing 74.0 W from the grid system, causing a drop in the solar PVe generation to 3.80 kW and requiring an imported power of 2.10 kW from the grid system and increasing the cost of operation from 22.0 Rs to 24.0 Rs for a clean soiled state. Miah et al. [30] developed a unified system of a solar PVe cell/biogas generator/battery microgrid network with five topmost feasible architectural operations to mollify diesel fuel consumption for 0.620 acres of agricultural land with an overall pump capacity of 8.0 kW for a canvas system. The microgrid network generated a daily energy value of 11.520 kWh/day for the main energy consumption and a peak capacity of 10.290 kW. Minimizing the over-consumption of diesel fuel from BDT 45.0/liter to BDT 65.0/liter. The microgrid system generated an annual energy of 7760 kWh beyond the annual main energy demand of 4205 kWh. Ali et al. [31] developed an optimal microgrid network of a solar PVe cell/biogas generator/grid system/wind turbine system for a five-story residential apartment in Bangladesh (Rajshahi) using a HOMER software simulation. The configuration of the biogas generator/solar PVe/grid generated a renewable fraction of 59.40%, an energy cost reduction of USD 0.0306/kWh, a reduction in carbon (IV) oxide gas emissions of 46.0%, an annual cost of operation (USD 1187.00), and net current valuation of USD 46,813.00. The configuration generated an annual energy of 3040 kWh/year from the biogas generator and an annual energy of 31,168 kWh/year from the solar PVe cell, with a grid sale and grid purchase record of 13,411 kWh/year and 21,951 kWh/year. Annual energy savings of 2730.44 kWh/year were achieved through a strategy of demand response, causing a reduction in the conventional grid reliance, attaining high reliability, enhanced accuracy of the estimated power generation, and a non-supply (negligible) energy of 4.310 × 10⁻¹⁴ kWh, with a power supply waste probability of 1.060 × 10⁻¹⁸. Miracle et al. [32] modeled an optimal wind turbine/biogas generator microgrid system through the application of an optimal particle orientation cat swarm method and MATLAB Simulink to generate the lowest net current value and a feasible high penetration of power production from the biogas plant. The adopted method by the authors attained a biogas energy cost of USD 0.0267, wind energy cost of USD 0.4016, optimal particle swarm value of USD 0.3798, and optimal cat swarm value of USD 0.0397. The optimal particle orientation cat swarm method attained a minimum energy cost of USD 0.00018 with the wind energy, and the optimal particle swarm and optimal cat swarm achieved cost values of USD 0.0022, USD 0.0018, and USD 0.0005, respectively. Orellana-Lafuente et al. [33] conducted a technological–econometric estimation of biogas fuel production from the treatment of an anaerobic wastewater plant system in Bolivia (Cochabamba). A mean value of 7859.07 Nm3/day of biogas fuel was produced with a base output power of 300 kW, generated as the topmost power savings, annually, showing that biogas fuel production from the treatment of anaerobic wastewater plant system is a feasible, clean, and non-seasonal energy source (in conclusion). Fu et al. [34] proposed an optimal synergistic approach for an agricultural microgrid network and greenhouse operation. The agricultural microgrid is a system of micro-organism/solar PVe cell/biogas generator/grid/gas boiler networks in China (Qingdao city). The authors confirmed the optimal synergistic approach across the environmental, energy, and agricultural sectors as being effective in boosting the econometric efficiency and low emissions from the agricultural microgrid operation, facilitating an operating cost reduction of CNY 966.0 and a carbon emission reduction of 2874.0 kg for the microgrid network with a greenhouse footprint (coverage area) of 3500.0 m2 during a typical winter.
R. Jean et al. [35] addressed the energy demand of 334 inhabitants of Manoka island community, Douala city, Cameroon, with a daily mean power of 1082.900 kWh/day and a daily maximum power demand of 183.990 kW/day. They assessed the feasible implementation of an off-grid integrated solar PVe cell/fuel cell/wind turbine/biogas generator/batteries/electrolyzer microgrid network to satisfy the demand of the community. By using the HOMER power program software, the research activity of the authors for the proposed 25-year lifespan network generated a low electric cost unit (USD 0.1981) and net current valuation (USD 2,209,741.00). The microgrid network yielded a profit of USD 57,387.00 from a cost-effective connection of 201 batteries with an internal return rate (9.09%), investment return rate (6.19%), and payback time (8.76 years). Jongudomkarn et al. [36] designed a diesel plant/solar PVe cell/biogas generator/wind turbine/heat pump microgrid network and proposed a control-referenced approach loop system that can adapt to the biogas generator–heat pump to produce constructive inertia to regulate the frequency of the microgrid network, by studying the charging state of the heat energy reserve. The control-referenced approach loop system will optimize the parameters of the constructive inertia to boost the performance of microgrid-controlledlled frequency through optimal discharging or charging of the energy reserve system within its normal operation boundaries. Reddy et al. [37] modeled a bio-diesel generator/solar PVe/fuel cell/wind turbine/biogas generator/flywheel/battery microgrid network with MATLAB-Simulink sim-scape reference software and proposed a proportionate/intrinsic/derivative control system for the network to stabilize the oscillating frequency produced by the microgrid system when the load varies and the output powers of the wind turbine and solar PVe systems fluctuate. Hoang et al. [38] modeled and developed a control system for the components of a solar PVe/biogas generator/Li-ion battery microgrid system by applying data manufacturing. They (the authors) incorporated a high-degree control system to sustain the AC and DC buses during the operation of the microgrid system. The biogas generator and lithium-ion storage maintained the voltage degree of the DC bus, while the peak power indicator tracking controller maximized the output power flow of the solar PVe generation. Verma et al. [39] addressed a crucial demand for a vigorous procedure in restoring the load of an energetic distribution network, by focusing on the application of a biogas generator as a reviving energy source. The researchers recovered a net load capacity of 1.5 MW through the biogas generator application to restore the energy demand operation in the energetic distribution network by formulating the conversion of lindist flow to a hybrid integer linear program model and applying Gurobi-solver software (Gurobi optimizer v12.0.2). Mondal and Sil [40] detected and analyzed a fault from the short-circuit state of a modeled grid/biogas generator/solar PVe/battery microgrid system. The authors of [40] discovered that the fault that arose from the three-lines-to-earth (short-circuit) formation of the microgrid network made the voltage bus = 0 with a very high current. Harmonics were injected into the microgrid network after the fault was cleared with the absence of noise in the waveform arrangement of the current flowing in the network. Singh et al. [41] adopted a vigorous control strategic application for an isolated DC (biogas generator/biomass feedstock/solar PVe) microgrid system that was modeled through MATLAB Simulink sim-scape software. The chosen control strategy for the biogas generator and biomass feedstock system was an observer-referenced sliding mode control system, capable of regulating or synchronizing the voltage of the DC microgrid bus despite fluctuations in load disturbances.
The aforementioned studies conducted by various researchers suggest that the implementation of island and grid hybrid generator systems is more advantageous than that of fossil fuel power plants. In terms of cost efficiency, the initial investment for hybrid alternative energy sources is higher than that of fossil fuel plants. However, the volatility of fossil fuel prices adversely affects fossil fuel generators, while having minimal impact on hybrid renewable generators. Consequently, this leads to a decrease in operating costs.
1.1. Problem Statement
This ongoing experiment focuses on the current energy system technology and the suggested energy network design for the inaugural waste power plant system in the On-nut community, which includes the following aspects: flexible operation of the microgrid network under variable load (energy demand), conversion of biomass feedstock (fuel energy) into electricity, generation of biomass gasifier fractions and their integration into the utility grid network, as well as the performance ratio and economic reliability of the utility grid in conjunction with biogas generators and battery networks.
1.2. Innovation of Experimental Research (Proposal)
The integrated power system, which includes biogas generators, a grid network, and batteries, was developed through an experimental design by the On-nut power plant management sector. It employs a multi-control algorithm within the microgrid system to create viable architectures for the integrated energy system, facilitating optimization and simulation through a sophisticated smart grid analysis network to generate the corresponding energy waveform sensitivity. The aims and objectives of the hybrid energy network are as follows:
- To explore and improve the management strategies for variable power generation within existing microgrid technologies (including utility grids and biogas generators) by integrating lithium-ion, flow, and zinc bromide battery technologies with a closed-loop control system, thereby enhancing the flexibility of current power systems.
- To assess the optimization of the suggested power generation network (biogas generators/grid/batteries) in terms of the most economically feasible and cost-efficient operation of the biogas generators/grid/Li-ion battery, biogas generators/grid/FB battery, and biogas generator/grid/zinc bromide battery during power flow and energy production services for the On-nut community.
- To determine the performance ratio of the current energy system (biogas generator/utility grid) and the proposed energy system’s architecture (biogas generator/grid/Li-ion+ battery, biogas generators/grid/FB battery, and biogas generator/grid/zinc bromide battery), respectively.
The subsequent sections of this experimental research include the methodology outlined in Section 2. Section 3 details the establishment of experimental, mathematical, schematic, and simulation models. Section 4 presents a formal conclusion of the experimental and simulation analyses, accompanied by a critical appraisal.
2. Materials and Methodology
2.1. On-Nut Community Waste Composition
The data composition from On-nut community wastes that were channeled to the wastes’ disposal central (On-nut) environment office in Bangkok is illustrated in Figure 1.
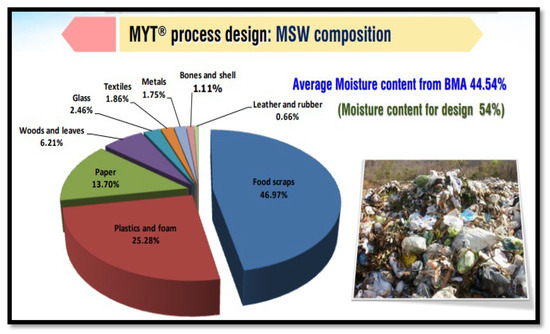
Figure 1.
Solidified hazardous wastes and division of managing night soil at On-Nut community.
Food scraps constituted the largest portion of municipal solid wastes, accounting for 46.97%, with a water content of 72.0% in Figure 1. Plastics and foam followed as the second largest category, at 25.28%, with a water content of 37.0%. Paper ranked third, comprising 13.70% and having a water content of 47.0%. The remaining heterogeneous waste included wood and leaves, at 6.21% (water content: 45.0%), glass at 2.46% (water content: 10.0%), textiles at 1.86% (water content: 55.0%), metals at 1.75% (water content: 5.0%), and bones and shells at 1.11% (water content: 10.0%), all with lower percentages. The overall humidity of the community’s heterogeneous waste is 54.0%, with an average water content of 44.54% for design purposes.
2.2. Current Waste-to-Power Conversion Technology of On-Nut Community
The waste management system was designed to produce 800 tons of biomass energy every day at the central disposal unit of the On-nut waste community management with a therapy system and maximum yielding technology (MYT) for treating wastewater. The maximum yielding technology is a management innovation that was produced in Germany and is appropriate for mixed wastes, and it was put forward with respect to Bangkok’s waste application for managing the community’s waste system and its properties at the disposable center as a proposal. Focusing on the community’s waste at night to produce fuel from garbage responds to utilizing waste as a renewable energy source. Fuel can be derived from refuse (plastics, papers, etc.) and energy production from biogas by putting organic wastes through anaerobic breakdown processes. The generating capacity of the biogas plants at the On-nut community is 4.064 MW, with a sale capacity of 3.045 MW with respect to the utility grid.
The maximum yielding technology (MYT) and waste management system of the On-nut community was designed by adopting four main systems classified into a three-step waste management system and pollution control system, namely,
- The pre-treatment system (sorting system at the preliminary stage) comprises waste reception and mechanical pre-treatment. This entails waste collection and separation of wastes in large quantities (120 mm) that can be converted into fuel derived from refuse. The fuel derived from refuse (R.D.F 1) and metal wastes in small quantities (less than 120 mm) will undergo therapy importation; see Figure 2 and Figure 3.
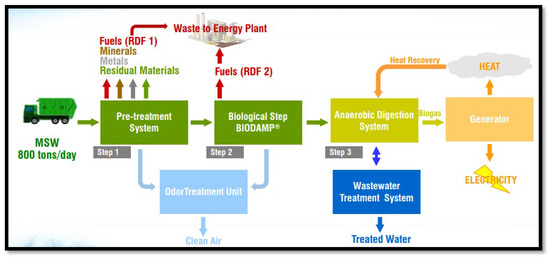 Figure 2. Waste-to-power conversion technology from On-Nut community; generating capacity: 4.046 MW; capacity sales to grid: ≤3.045 MW; biomass resources: 800 tons/day.
 Figure 3. Waste management process for anaerobic breakdown reaction of biogas production.
 - An anaerobic breakdown system will produce biogas fuel (no air degradation/wastewater treatment) from the concentrated solid wastes (R.D.F 2), and water will be channeled toward it (anaerobic breakdown system). The wastewater produced from the process of air fermentation comprises the first wastewater sent back to fill up the bio-damp (fermentation tank), while the second part of the wastewater will be sent to the wastewater treatment system therapy; see Figure 2 and Figure 3.
2.3. Proposed Waste-to-Power Conversion Technology
The systematic design of the newly proposed hybridized energy system was enhanced from the current technology shown in Figure 4 to a proposed technology represented in Figure 5 which includes the subsequent design strategy:
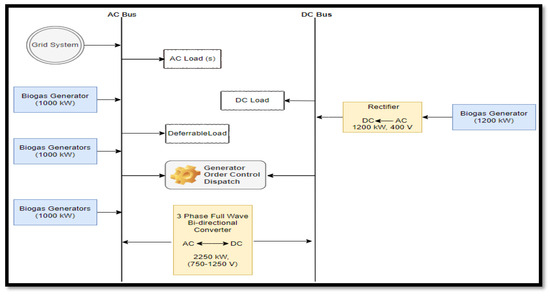
Figure 4.
Current schematic operation: grid system/biogas generators.
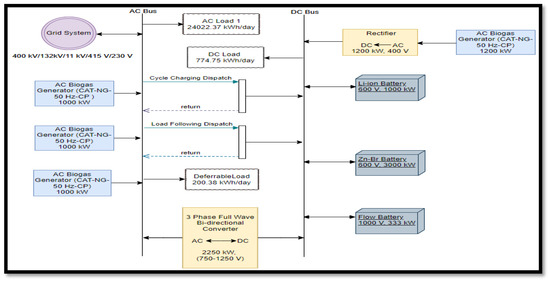
Figure 5.
Proposed schematic operations: grid system/biogas generator/batteries.
The integration of a hybridized storage system (lithium-ion, flow, and zinc bromide batteries) to the utility grid and biogas generators.
- Adopting a multi-purpose control system (cycle charging-monitoring and load-following controllers) with functional interface controllers for the biogas generators, utility grid system, and batteries to serve the energy demand effectively.
- The grid-forming, grid-following, and utility-scale battery-dedicated power and energy converter model with industrial microgrid (HOMER Pro x64 v3.14.7524.23887) energy analysis was applied to investigate the performance analysis, reliability measures, and econometric assessment of the first (On-nut) community’s waste biogas power plant system in Thailand with respect to the current and proposed system configurations (utility grid/biogas generators and utility grid/biogas generator/batteries).
2.4. Proposed Energy Management Algorithm
The flow chart of the hybridized energy network is shown in Figure 6. It consists of biomass fuel resources, a biogas generator, and a utility grid and the battery potential, technological–econometric, and load estimate potential values of the microgrid operation as the input data to be measured. The power system architectures are grid/biogas generators/Li-ion battery, grid/biogas generators/Zn-Brm battery, and grid/biogas generators/FB battery.
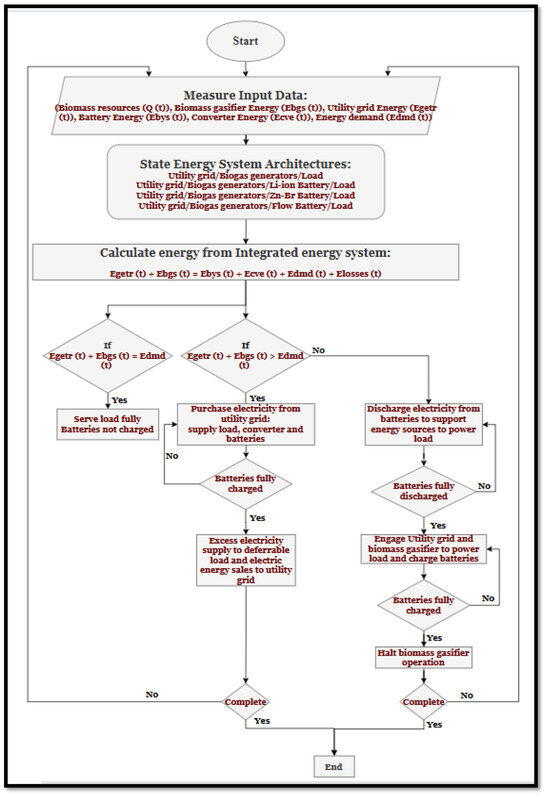
Figure 6.
Proposed energy control and power stability strategy.
The energy balance equation is expressed below.
where Egetr(t) = Energy generated from the utility grid (kWh);
Egetr(t) + Ebgs(t) = Ebys(t) + Elosses(t) + Ecve(t) + Edmd(t)
Ebgs(t) = Energy generated from the biogas generator (kWh);
Ebys(t) = Energy generated from the batteries’ potential (kWh);
Elosses(t) = Energy loss from the entire network (kWh);
Ecve(t) = Energy production from power converter (kWh);
Edmd(t) = Energy demand (kWh).
2.5. Hybrid Network Components
The hybridized energy system comprises a network of closed-loop controllers, AC energy generators (utility grid and biogas plants), a power conversion system, and a DC hybrid storage system (lithium-ion, flow battery, and zinc bromide batteries), respectively. The power network optimization in terms of sizing and architecture depends upon the modeled hybridized power generators.
2.5.1. Grid Network Modeling
The energy grid network illustrated in Figure 4 delivers electrical power from various generation sources, including natural gas, coal, hydropower, solar energy, and wind, which converts mechanical energy from turbines into electricity. This network primarily encompasses electric power generation, transmission, and distribution to consumer units. When the alternating current (AC) loads and storage units are fully satisfied by the hybrid power sources’ potential capacity, any surplus electricity is returned to the grid system, generating grid sales at a price of USD 0.150 per kilowatt-hour (kWh) and a net excess valuation from the grid of USD 0.100 per kWh. This involves a calculated annual net purchase from net metering during the experimental and simulation phases. Furthermore, a contractual agreement exists between the management of the biogas generators in the On-nut community and the utility grid management, permitting the latter to purchase excess energy produced by the community’s biogas generation project.
This arrangement is expected to lower the unit cost of electricity and reduce gaseous carbon (emissions) intensity. Additionally, the contract allows the grid management to supply electricity to the community to meet energy demands and enhance power production reliability during periods of low generation from the biogas project. The following equation models the relationship between the electricity cost from the utility grid and the price indication or communication signal:
where = Biogas network purchasing power production from the grid network during a specified time, tme (kW);
= Biogas network selling excess power production to the grid network during a specified time, tme (kW);
= Application period of utility grid pricing communication (USD/kWh).
The greenhouse emissions’ cost, Uec (USD), from the utility grid generators producing thermal energy is given by the expression below.
, , and represent the radiation co-efficient (emission constant) of the grid power alternators [42].
The closed-loop algorithm illustrates the proposed control operation of the microgrid network and its strategy for power stability, as depicted in Figure 6. The input data measurements include the utility grid, battery technologies, bidirectional power converters, community load variations representing energy demand, and the treatment of sustainable biomass feedstock as a fuel source for the efficient operation of biogas generators. The load-following and cycle charging controllers facilitate the dynamic operation of the microgrid system, which comprises biogas generators, the utility grid, and battery technologies, in various flexible modes (utility grid/biogas generator/Li-ion, utility grid/biogas generator/Zn-Br, and utility grid/biogas generator/flow battery network). The calculated energy flow within the microgrid network establishes a power balance between the total energy produced by the biogas/utility grid sources and the total energy consumed by the battery technologies, bidirectional converters, load capacity, and losses. When the capacity of the generating sources (biogas generators and utility grid) matches the demand capacity, the batteries will not charge, as the load is fully met without any surplus energy production from the generators. Conversely, if the generators’ capacity exceeds the demand potential, and there is a delayed response from the biogas generator, electricity will be procured from the conventional grid to ensure the batteries reach full charge. Should the batteries become fully charged, any excess electricity will be directed toward the storage demand (deferrable load), with energy sales recorded back to the conventional grid. In instances where the conventional grid experiences fluctuations and the biogas generators operate below the demand potential, while the batteries are fully charged, the batteries will provide backup support to the generators in meeting the load capacity. When the batteries are completely discharged, the cycle charging will activate the conventional grid and biogas generators to supply power to the demand and recharge the battery system. When the batteries are fully charged by the capacity generators (grid and biogas) during operation, the biogas generators will be temporarily disabled to allow the conventional grid to supply the load. The strategically designed feedback controllers consist of cycle charging and load-following units, which manage and optimize energy flow decisions in real-time within the microgrid environment. The load-following unit employs both the conventional grid and biogas generators to produce sufficient power to meet demand without directing energy back to the batteries. Conversely, the cycle charging unit leverages the biogas generators and grid to operate at peak efficiency to satisfy demand; any surplus power generated after fulfilling the load will be directed to the batteries, and the surplus electricity will be resold to the conventional grid, providing a financial benefit to the community.
2.5.2. Greenhouse Effect Modeling
The carbon intensity (greenhouse gases) emitted from the hybrid energy network operation involving the grid integration is of much concern with respect to the human environment. The investigation of the emission and absorption of radiation within the range of heat infra-red energy is a priority when analyzing the hybrid energy network due to an increment in the capacity of the global warming rate. The production of clean energy is the appropriate choice for sustainable technology in power systems using the integration of renewable energy system support to minimize or reduce emissions from the world’s sector relating to energy production. Ozone (O3), natural gas (CH4), nitrogen (I) oxide (N2O), carbon (IV) oxide (CO2), and water (H2O) vapor form the main (primary) greenhouse gases of the atmospheric environment of the earth’s surface. The batteries and biogas generators from the hybrid energy generation network produce low radiant energy (harmless emission), while the fossil fuel energy from the grid system forms greenhouse gases, thereby causing a greenhouse effect on the atmosphere, which is very harmful to human health and is mathematically expressed below.
AEghg = Annual energy generated from the renewable energy grid network connection producing emissions of greenhouse gases (kWh);
(CO2 + SO2 + NOX) = Factor of emissions from carbon (IV) oxide, sulfur(IV) oxide, and nitrogen oxide;
Pu-network = Output power generation from the hybrid energy network (kW);
T = Period of energy generation and emission from the hybrid energy sources (hours);
Inhabitants of the On-nut community purchase electric energy from the utility grid and biogas generators to maintain daily living. The emission factors from carbon compounds are needed in calculating the benefits from the On-nut environment when the microgrid network utilizes sustainable biogas generators to produce electric energy, thereby reducing emissions from carbon compounds produced by the utility grid with respect to the environment. The emission factor of the microgrid network is estimated below.
GHe = emission from greenhouse gases (kg); El = electric energy consumed (kWh); Gf = emission factor from greenhouse gases at On-nut community (gkWh−1) [43,44].
2.5.3. Econometrics Index
The assessment of the econometric indices for the microgrid system includes the overall net current cost (NPCO), the levelized energy cost (LECE), the initial capital cost, the operational expenses of the microgrid network, and the emissions released into the atmosphere as a result of electricity generation by the integrated microgrid network. The internal return rate (IRRA) and the investment return (ROIV) were determined through the operation of the microgrid, utilizing the industrial HOMER PRO energy analysis with the converter’s grid-forming/grid-following model. The NPCO represents the equilibrium between the initially estimated cash investment and the overall cash flow generated by the microgrid network, discounted at the base capital cost. The invested cost encompasses the initial capital allocated to the microgrid components, the expenses related to operating, maintaining, and replacing these components as well as purchasing energy from the conventional utility grid to prevent capacity shortages. The NPCO serves as a measure of the economic viability of the microgrid system. A positive NPCO indicates potential losses over the lifespan of the microgrid system, while a negative NPCO suggests profitability. The NPCO is calculated using Equation (6).
Cyr,TC = yearly overall cost of the microgrid system (USD/year); CREm,Lsyt = factor of recovery from capital; m = interest rate (%); Lsyt = lifespan of the microgrid network (years).
The generated cost is estimated after balancing (leveling) the generated power in the operational cycle and the operational cycle cost gives the LECE estimated from Equation (7).
Cv = overall annual cost (USD/year); Ev = overall electric energy consumed annually (kWh/year); m = interest rate (%) on a discount rate basis.
The IRRA gives the rate of discount during the lifespan of the energy system at which the value of the net present flow equals 0, as estimated in Equation (8).
NPFtm = overall flow of cash annually (USD/year); Pi = principal value (USD); D = value of end cash (USD).
The investment return (RI) is the returned value after investing in the project, which means the financial return on investing in the microgrid network. The estimated equation is given below.
RIV = investment return (USD); INV = overall investment income (USD); EXP = overall investment expenses (USD) [44].
2.5.4. Biogas Power Generator
The feedstock resources comprise woods/leaves, glass, textiles, metals, bones/shells, leather/rubber, paper, plastics/foam, and food scraps that will be used as a fuel supply source for the community to power the biogas generators and produce electricity. The generated output electricity from the biomass plant can be represented by Equation (10).
Elecbiog = Output electricity flow from the biogas generator (kWh/year);
Abgl = Annual available biogas fuel in kg·year −1;
Calvbio = Heating value of the biogas fuel = 20.0 MJ per kg;
= Annual operation period of biogas generator in h/year;
= Efficiency of the biogas generator during energy conversion in %;
= Period of operating the biogas generator annually (hours) [43,44,45,46].
2.5.5. Hybrid Batteries
The electricity generated and the energy consumption from the operation of the power system depend on the quantities of hybrid storage and their current state of charge at a specific time. The storage system is charged when the surplus electricity produced by the microgrid exceeds both the demand and the sales capacity. The amount of electricity stored in the batteries at a given time is described by Equation (11). The reliability of the microgrid can be enhanced by utilizing a backup energy source, such as batteries and dispatchable biogas plants, to support the utility grid during periods of congestion and outages caused by capacity shortages from power sources. The implementation of a hybrid reserve system, which includes lithium-ion, flow, and zinc bromide batteries, along with biogas plants, will ensure a consistent power flow operation.
Egn(tr) = Egn(tr − 1) + (1 − ƾ) + [(Ene(t) –(Eqe(t) ÷ ɳcve)]× ɳgn
Egn(tr) = Egn(tr − 1) + (1 − ƾ) − [(Eqe(t) ÷ ɳcve) − Ene(t)]
Egn(tr) = Quantity of current energy flux in the batteries measured in kWh;
Egn(tr − 1) = Quantity of preceding energy flux in the batteries measured in kWh;
ƾ = Rate of auto emission from the batteries;
ɳcve = Regulating efficiency of the power converter (%);
ɳgn = Regulating efficiency of the batteries during charging and discharging modes (%);
Eqe(t) = Energy demand (kWh);
Ene(t) = Overall electricity production from the microgrid system (kWh).
Ene(t) = Elecbiog(t) + Elecgrid(t)
Elecgrid(t) = Output electricity from the utility grid (kWh).
The boundaries relating the minimum and maximum charging states of the batteries are given by Equation (14).
where CHGmin and CHGmax represent the minimum charging state (%) and maximum charging state (100%) estimations. The minimum charging state of the batteries can be stated using the equation below.
where Dcrg represents the discharging depth of the batteries (%).
CHGmin ≤ CHG(t) ≤ CHGmax
CHGmin = 1 − Dcrg
The operational cost and capital investment of the batteries are increased by the batteries’ settings. Hence, the lifespan of the batteries can be estimated from Equation (16).
where Sbyt = lifespan of the batteries (years); Mbyt = battery pack with a definite quantity of batteries; Rsng = throughput lifespan of each battery in the pack (years); Ryr,bytP = yearly throughput of the battery pack (total cyclic energy of the battery pack annually) in years; QMAXIM,lyf = maximum lifespan of the batteries irrespective of their cyclic throughput (years) [43,44,45,46].
2.5.6. Electronic Energy Flux Conversion System
The electrical flow generated by the output electronic conversion system is represented by the equation provided below.
PWc = Vmg× (Ibiog + Iug + Ign)
Vmg = Microgrid’s nominal voltage multiplier on the storage system (batteries) in volts.
Iug, Ibiog, and Ign are the resultant rectified currents from the biogas generators, utility grids, and batteries, respectively. The regulating electronic conversion efficiency system relates the output flux to the input flux power ratios generated. When energy is converted between the DC and AC buses by the full-wave power electronics converter, losses occur, which affects the microgrid system’s performance, resulting in efficiency loss.
PWi(t)× ɳcve = PWop(t)
PWi(t) = Input Power flowing into the electronic conversion system (kW);
ɳcve = Conversion efficiency of the electronic system (%);
PWop(t) = Output power flowing from the electronic conversion system (kW).
The production of efficiency when energy is converted between the DC and AC buses by the electronic (3-phase) power conversion system is estimated below.
where PWug(t), PWbiog(t), and PWgn(t) represent the output power flowing from the utility grid, biogas generator, and storage system (batteries), respectively [43,44,45,46].
3. Experimental Analysis and Simulation
3.1. Mechanical Processing System of On-Nut Biomass Wastes
The breakdown of bags and organic waste, totaling 800.00 tons per day, is referred to as the pre-treatment (mechanical) processing system. Waste materials are directed through the hopper feeder’s plate, where some water is filtered out and sent to the filtrate pre-treatment processor. The solidified waste is then transported via a conveyor belt to a designated manual sorting area, where large interfering substances are separated. The manually sorted waste is subsequently processed through a drum screen along with the disintegrated bags. After passing through the drum screen, materials larger than 120.0 mm, weighing 322.890 tons per day, are conveyed and disposed of, while larger interfering substances are also removed. Materials smaller than 120.0 mm, totaling 444.580 tons per day, are extracted and sent to the biological–hydrolysis processing system. Metals that are magnetically separated are recycled, as illustrated in the graphical representation of the mechanical–biological waste treatment process below (Figure 7).
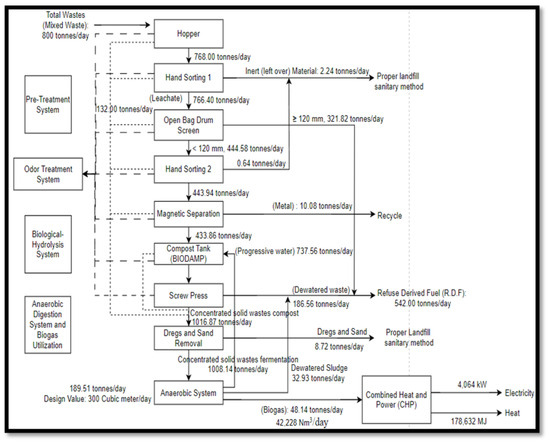
Figure 7.
Modeled mechanical/biological waste treatment unit estimation.
The biological–hydrolysis processing system comprises a preparation tank for fermentation and a machine for compression (screw press: 1016.870 tons/day) to obtain the solidified wastes (known as fuel derived from refuse: R.D.F 2) and concentrated solidified waste leachate high bowl for transportation to the anaerobic breakdown tank, thereby producing a biogas fuel supply (48.14 tons/day; 42,228.000 m3/day) for the biogas plants to produce electric energy, heat (178,632.000 MJ), and power (4064.000 kW) for the distributed extension of electricity; see Figure 7.
Input waste quantity before treatment = 800 tons/day;
Output waste quantity after treatment = 189.51 tons/day;
Percentage utilization of waste (%) = [output waste quantity after treatment/input waste quantity before treatment] × 100%;
Percentage utilization of waste (%) = 189.51/800.00 = 0.2369 × 100% = 23.69%.
From Figure 7, the concentrated wastes left after proper treatment before anaerobic digestion to produce biogas fuel was 189.51 tons/day as compared to the total waste supply (800.00 tons/day) before treatment. The percentage utilization of wastes left before conversion to biogas fuel is 23.69%.
Percentage of waste loss = (100%) − (percentage utilization of wastes left before conversion to biogas fuel);
Percentage of waste loss = 100% − 23.69% = 76.31%.
A total of 76.31% of biomass waste was lost during the treatment process; see Figure 7.
The concentrated biomass wastes left (189.51 tons/day) after treatment underwent anaerobic breakdown to generate a biogas fuel quantity of 42,228 m3/day or 48.14 tons/day; see Figure 7.
Quantity of biogas fuel production from anaerobic breakdown = 48.14 tons/day;
Percentage composition of biogas fuel production = [quantity of biogas fuel production from anaerobic breakdown/output wastes quantity after treatment] × 100%;
Percentage composition of biogas fuel production = [48.14/189.51] × 100% = 0.2540 × 100% = 25.40%.
Therefore, the percentage composition of biogas fuel production from the concentrated biomass wastes after treatment was 25.40%.
3.1.1. Wastes Treatment Result
The capacity potential of the single-line pre-treatment processing system theoretically is 50.00 tons per hour. The production products obtained after the treatment process are undersized materials, oversized materials, leachate, metal, wastes, large interference substances, etc. The composition and properties of each product (material) are tabulated in Table 1, and their specific composition may change with respect to the waste composition.

Table 1.
Treatment output.
3.1.2. Electric Energy Generation from Biogas Fuel
The biogas fuel production from the anaerobic breakdown system produced 42,228.000 m3 of biogas fuel and 92,902.640 kWh of electric energy per day, which in equivalence, amounted to a power generation of 4064.000 kW capacity (operated for 22.86 h); see Table 2.
Table 2.
Waste-to-energy (electricity) conversion.
The fraction of metallic solidified wastes, inert solidified material, fuel-derived refuse (waste fuel and R.D.F), and biogas fuel from the waste-to-energy conversion (mass) balance system, shown in Figure 7, has been determined with the power capacity generation and is summarized in Table 3.
Table 3.
Power and mass stability of waste-to-power conversion technology.
The production of biogas fuel from the biomass waste treatment system in the On-nut community includes a buffer tank for wastewater and four anaerobic breakdown tanks, with their dimensions calculated as outlined in Table 4 and Table 5.
Table 4.
Buffer tank (wastewater container) dimension.
Table 5.
Anaerobic breakdown (reactor) estimation.
3.2. Three-Phase Biogas Energy Generators
The solid waste management initiative in the On-nut community project, located in Bangkok, includes four biogas generators designed for the production of electric energy. Each biogas generator has an input capacity of 200 tons per day of biomass resources (feedstock) as fuel. Consequently, the total feedstock for the four biogas generators reaches 800 tons per day. Three of these generators, each capable of producing 1000 kW with an operational frequency of 50 Hz, a line voltage of 400 ± 10.0% V, and an angular frequency of 1500 revolutions per minute, are connected in parallel to the grid system to facilitate the sale of electricity (3045 kW) to the grid. The remaining generator operates off-grid, with a production capacity of 1200 kW, also at a frequency of 50 Hz, a line voltage of 400 ± 10.0% V, and an angular frequency of 1500 revolutions per minute. This unit is primarily intended to support the energy needs (self-consumption of 1019 kW) and to enable the On-nut community to purchase electricity from the grid, as illustrated in Figure 8.

Figure 8.
Simulation of current microgrid model of On-Nut community.
The solid waste management sector responsible for generating electricity for the On-nut community was systematically structured with biogas generators, a grid system, and loads, each having designated capacities as outlined above. The community implemented a generator order control system to activate the biogas plants (CAT-NG 1, CAT-NG 2, and CAT-NG 3) in their predetermined operational sequence. This approach aims to minimize electricity costs from the conventional utility grid, enhance electricity sales to the grid, and meet the significantly increasing energy demand. The primary goal of the fourth biogas generator (CAT-NG 4) is to support the grid-connected biogas generators in supplying energy to the load and boosting grid sales. The CAT-NG 1 biogas plant contributed a modest share (4.87%; 551,000 kWh/year) to the annual energy production, compared to the grid’s annual generation contribution (2.16%; 244,775 kWh/year), against the total annual energy demand of 11,103,188 kWh/year, with 97.87% of the energy supplied by the biogas generators (CAT-NG 1: 4.87%; 551,000 kWh/year and CAT-NG 4: 93.0%; 10,512,000 kWh/year).
The biogas generators produced greater grid sales, accounting for 17.8% or 1,979,046 kWh per year, compared to grid purchases, which constituted 2.16% or 244,775 kWh per year from the biogas grid network, following the complete isolation of the second and third biogas plants to minimize operational costs and biogas fuel expenses. The biogas generators, specifically CAT-NG 1 and CAT-NG 4, have proven their reliability in energy delivery, consistently meeting electric load demands without any risk of shortages, and achieving a renewable fraction of 92.8%, as illustrated in Figure 9.

Figure 9.
Modeled energy flow analysis of grid-connected 1000 kW/1200 kW biogas generators.
3.2.1. Ratio of Performance of Current Biogas Generators
The ratio of performance of the biogas generators relates their actual output thermal energy flow to their peak input thermal energy flow production under optimization conditions when considering their excess energy losses under thermal and conduction losses. It is also called the efficiency of the biogas generators, expressed metrically as a percentage. The higher the ratio of production of the biogas plants, the better their performance. From Table 2, the calorific value, also known as the heating value of biogas (renewable methane) production, is 20.0 MJ/m3.
The lower heating gas value = 20.0 MJ/m3; 1.0 m3 = 1.0 kg.
Hence, the heating gas value of methane (biogas) in mega joules per kilogram = 20.0 MJ/kg.
As shown in Figure 7, the biogas fuel production per day = 48.14 tons/day; 1.0 ton = 1000 kg.
Hence, the biogas fuel production in kg per day = 48.14 × 1000 kg = 48,140 kg/day.
The total lower heating gas value of methane in MJ = 20.0 MJ/kg × 48,140 kg/day = 962,800 MJ.
The peak input thermal energy flow = 962,800 MJ
The actual output thermal energy flow from the experimental model (Figure 7) = 178,632 MJ.
Therefore, the ratio of performance (efficiency) of the biogas generators = = 0.1855
Hence, the ratio of performance of the current biogas generators operating in the On-Nut community = 18.55%.
3.2.2. Fuel Properties of 1000 kW and 1200 kW Biogas Generators
The characteristics of the biogas fuel utilized by the biogas generators (1000 kW and 1200 kW) are illustrated in Figure 10, which details their intercept coefficients, slopes (the ratio of fuel consumption variation to output power variation), operational capacities, and bio-fuel flow consumption rates. The flow rate of biogas consumed by the generators is directly proportional to the power output produced by the biogas generators. This indicates that, as the power output of the biogas generators increases gradually (in a linear fashion), their fuel consumption also rises linearly in relation to the variations in their power capacities, as depicted in the graphs below. The fuel properties for the 1000 kW biogas generator indicate a minimum power output of 503 kW, an average output of 750 kW, and a maximum output of 1000 kW, corresponding to consumption flow rates of 139 m3/h, 194 m3/h, and 254 m3/h, respectively. In contrast, the consumption rate for the 1000 kW biogas generator is significantly lower than the higher consumption rates (97.633 m3/h, 162.186 m3/h, 232.019 m3/h, and 308.083 m3/h) observed in the 1200 kW biogas generator, as the power output varies from 300 kW to 1200 kW. The modeled equation that relates the specified generating capacity, intercept coefficient, and slope (the ratio of fuel consumption variation to output power variation) is derived from Equation (21).
P(t) = (d × ABIOG) + (n × Qrav)

Figure 10.
Bio-fuel table and fuel flow of 1000 kW and 1200 kW biogas generators.
P(t) = Biogas consumption (m3/h);
d = Rated biogas fuel curve interception coefficient of the generators (m3/h/kW);
ABIOG = Biogas generator producing power (kW);
n = Biogas fuel curve slope of the generators (m3/h/kW);
Qrav = Average output power of the biogas generators (kW) [47].
Where d = 0.0219 m3/h/kW and n = 0.2314 m3/h/kW for 1000 kW biogas generator, d = 0.0206 m3/h/kW, and n = 0.2337 m3/h/kW for the 1200 kW biogas generator.
Therefore,
P(t) = (0.0219 × 1000) + (0.2314 × Qrav) = 21.9 + 0.2314Qrav
P(t) = (0.0206 × 1200) + (0.2337 × Qrav) = 24.72 + 0.2337Qrav
The above expression indicates the reliance of biogas fuel consumption on the generators’ output power production.
Throughout the operation of the grid and biogas generators, it was noted that the total annual consumption of biogas fuel reached 2,522,741 m3, averaging 6912 m3 per day and 288 m3 per hour. The distribution of the biogas fuel consumption rate from January to December is illustrated in Figure 10, which includes both tabular data and waveform plots. In January, February, and December, the biogas fuel utilization for electricity generation was notably low, recorded at 300 m3/h. The peak consumption rate of biogas fuel, as shown in Figure 11, occurred between March and November, reaching 585 m3/hour due to increased energy demands and grid sale activities from the biogas plant during this timeframe. August recorded the highest average biogas fuel consumption rate at 360 m3/h, corresponding to a peak demand of 2105.5 kW, as depicted in Figure 8. Consequently, the utilization of biogas fuel in August was significantly higher compared to other months.
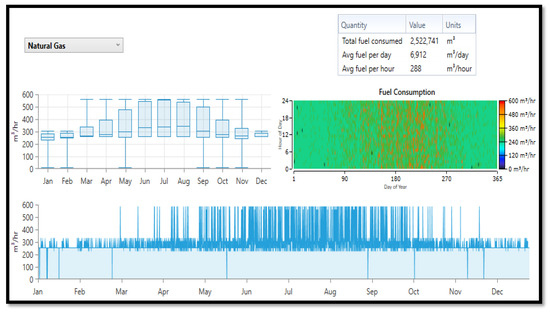
Figure 11.
Fuel summary of biogas generator/grid system operation.
3.3. Econometric Assessment from Grid–Biogas Network
Figure 12 illustrates the exchange of electricity flux between the utility grid and biogas generators. The net energy is the distinction between the electricity flux acquired from the grid, and the electricity flux sold back to it is calculated by subtracting the energy sold (in kWh) from the energy purchased (in kWh). The biogas generator and grid network system demonstrated sufficient efficiency, generating more energy sales (1,979,046 kWh) compared to the electricity purchased from the grid (244,775 kWh), which presents an economic benefit to the community.
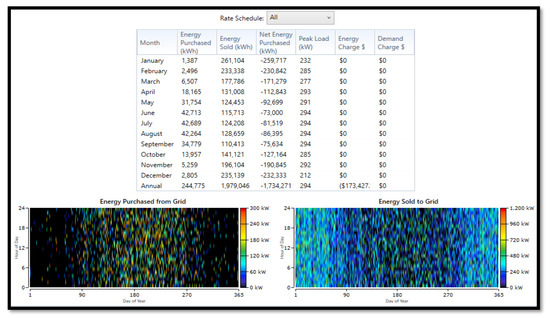
Figure 12.
Energy trade of 1000 kW/1200 kW biogas generator/utility grid network.
The negative net energy purchase value of −1,734,271 kWh between the grid system and biogas generators demonstrates the superior performance and reliability of the biogas generators, which produce more energy than the grid system. This results in reduced grid tariffs and meets the load capacity without any unmet load or capacity shortage risks. The peak demand consistently occurred during June, July, August, and September, incurring a significant energy charge of USD 173,427. The energy trade analysis depicted in Figure 12 illustrates the biogas generators’ potential capacity surpassing that of the grid supply. Notably, January, December, and February recorded the highest energy sales in descending order (261,104 kWh, 235,139 kWh, and 233,338 kWh) from the biogas plants to the grid system, highlighting the economic and technical viability as well as the operational efficiency of the biogas renewable plant, which can function independently of the grid system. The levelized electric energy cost represents the average annual cost (USD/year) of the project relative to the total electric energy consumed annually. This metric assesses and compares various configurations of energy system production to evaluate the economic operational feasibility of the community’s environment. The net annual current valuation, levelized electric energy valuation, and operating valuation of the integrated biogas generator/grid architecture, as shown in Figure 13, are USD 8,080,592.00, USD 0.05630/kWh, and USD 131,034.80/year, respectively. The operation of the 1000 kW/1200 kW biogas generator/grid system architecture is projected to achieve payback on the investment within 4.47 years, yielding an investment return of 18.7%, a levelized electric energy cost of USD 0.05630/kWh, an internal return rate of 22.1%, and an operating cost of USD 131,034.80, as illustrated in Figure 13.
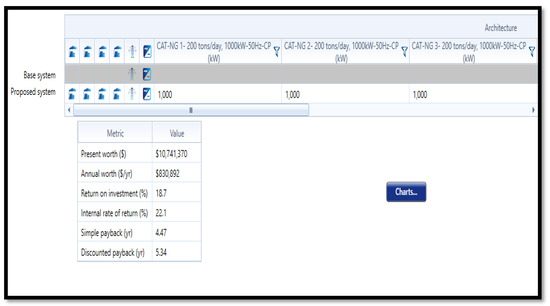
Figure 13.
Econometric efficiency of 1000 kW/1200 kW biogas generator/grid network.
3.4. Energy Flow Analysis of Proposed Grid–Biogas–Battery Energy System
The energy reserve system (ERS) plays a vital role in the functioning of power generation technologies by stabilizing the fluctuating electric output from renewable energy sources and enhancing system reliability. For the biogas generator–grid system microgrid project in the community, a hybrid electrochemical storage technology was implemented, incorporating lithium-ion (Li+), flow battery (FB), and zinc bromide (Zn-Brm) batteries, with their characteristics outlined below. The choice of a hybrid ERS is influenced by the complexities of market demand. Additionally, this study explored the application of various ERS technologies (short-, medium-, and long-term) in the current power system’s operations, considering their power generation capabilities, transmission and distribution networks, and energy requirements.
The selection criteria for battery technologies, including lithium-ion, flow, and zinc bromide, were based on their ability to support the microgrid network in maintaining power and frequency quality during short-term services, bridging power gaps, optimizing load shifting at various intervals for medium-term services, and overseeing bulk energy for long-term services in Figure 14. lithium-ion batteries were primarily focused on short-term services, with some involvement in medium-term services and minimal engagement in long-term services. In contrast, zinc bromide batteries concentrated on medium-term services while also engaging more significantly in long-term services. Flow batteries were primarily dedicated to medium-term services, with limited involvement in long-term services. This arrangement allows lithium-ion batteries to fill the less concentrated application areas of flow and zinc bromide batteries, while the latter two occupy the less concentrated application areas of lithium-ion batteries. Furthermore, the waste treatment process may delay biogas fuel production for biogas generators due to the advanced technologies required for sorting, filtering, separating, and removing impurities from biomass waste. The proposed batteries will address critical energy demands during the slow startup response of biogas generators, grid outages, or temporary drops in electricity generation from either the utility grid or biogas generators. They will facilitate a rapid response to bridge power gaps between generators and loads effectively, while also reducing charges imposed by the grid system during peak load conditions against the microgrid network.
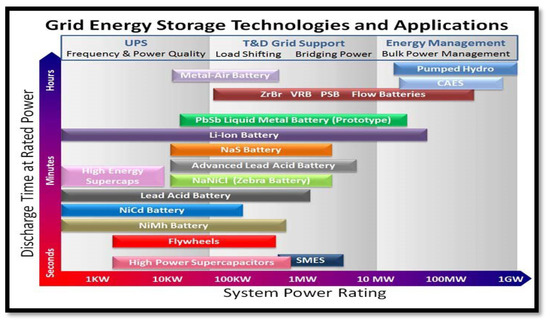
Figure 14.
Output power discharge ratings of scalable ERS application [48].
The illustration above (Figure 15) presents the proposed technological framework for the microgrid network intended for the community. The experimental setup features a parallel connection of a 1200 kW biogas generator (which employs an AC–DC energy converter) alongside various storage technologies (including Li-ion, FB, and Zn-Brm batteries) via a DC bus. These batteries serve as a storage solution for energy derived from AC power sources (three parallel-connected AC biogas generators, each with a potential of 1000 kW connected to the utility grid) and a DC power source (utilizing AC–DC conversion from the 1200 kW AC biogas generator). This configuration acts as a supplementary energy source in conjunction with the grid, facilitating a rapid response to demand during delays in biogas production, thereby enabling the biogas plant to operate effectively. The load-following/cycle charging controller functions as an interface between the energy buses (AC/DC), promoting the flexible operation modes of the microgrid network, which include biogas/grid/Li-ion, biogas/grid/Zn-Brm, and biogas/grid/flow systems. The performance of each battery configuration was evaluated based on several criteria, including efficiency (the ratio of output energy flux to input energy flux), the performance ratio, operational states (load current and charging conditions), power capacities, voltage capacities, energy capacities, autonomy working time, and cyclic stress behavior. The lithium-ion storage system achieved a peak charging level of 80.0% in January, while the months of March, May, August, and September consistently recorded a charging level of 44.0%. In contrast, February, April, June, July, October, November, and December exhibited a minimum charging level of 20.0%. Annually, the percentage frequency distribution of energy from the Li-ion battery was 97.44%, with a lower output energy of 83,519 kWh/year compared to the input energy of 89,243 kWh/year, resulting in energy losses of 9097 kWh/year from the biogas generator/grid/Li-ion configuration. The lithium-ion battery functioned independently for a duration of 3.24 h, achieving an annual cyclic energy flow of 88,037 kWh/year, with no associated energy cost (USD 0/kWh), and a columbic efficiency of 93.59% as illustrated in Figure 16. In contrast, the Zn-Brm battery maintained consistent minimum and maximum charging levels of 20.0% and 100.0% during the months of January, February, March, September, October, and November. It experienced a significant annual frequency distribution decline of 63.95% and a columbic efficiency of 90.08%. Between April and August, as well as in December, the charging levels fluctuated from 90.0% to 82.0%. Conversely, the Zn-Brm battery exhibited a shorter autonomous operational period of 0.768 h compared to the 3.24 h of the Li-ion battery, attributed to the higher energy consumption and release of the Zn-Brm battery relative to the Li-ion storage capacity. The average energy cost for the Zn-Brm battery, as shown in Figure 17, was equivalent to that of the Li-ion and flow batteries, both at USD 0/kWh as depicted in Figure 18. Furthermore, the annual output energy, input energy, energy losses, and cyclic flow energy production of the Zn-Brm battery (904,014 kWh/year, 1,003,616 kWh/year, 100,403 kWh/year, and 952,914 kWh/year) were found to surpass those of the Li-ion battery. The operational data from Figure 16, Figure 17 and Figure 18 contributed to the microgrid network’s efforts in optimizing electricity costs, facilitating decarbonization, providing voltage support, and regulating the frequency of the microgrid as the battery voltages varied.
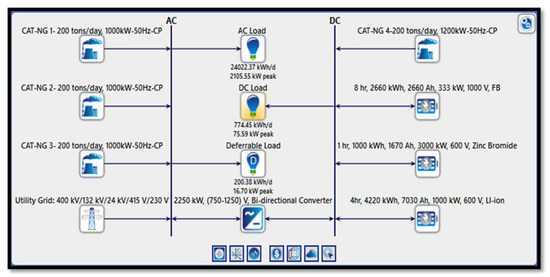
Figure 15.
Schematics of proposed microgrid model for On-Nut community.
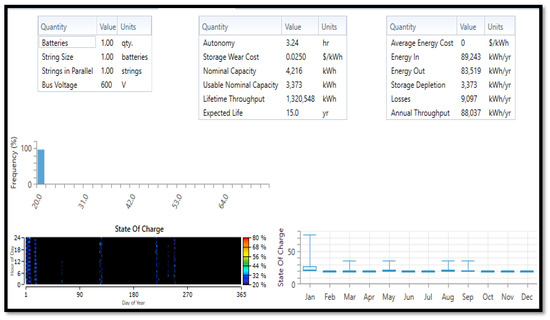
Figure 16.
Characteristics of lithium-ion battery operation with biogas generator/utility grid network.
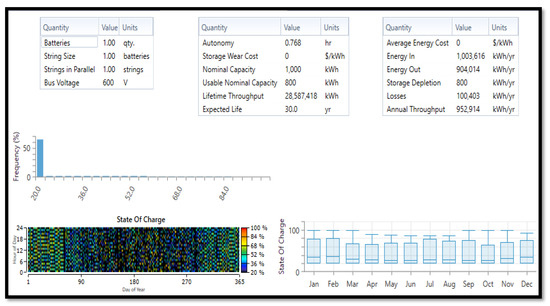
Figure 17.
Characteristics of Zn-Brm battery operation with biogas generator/utility grid network.
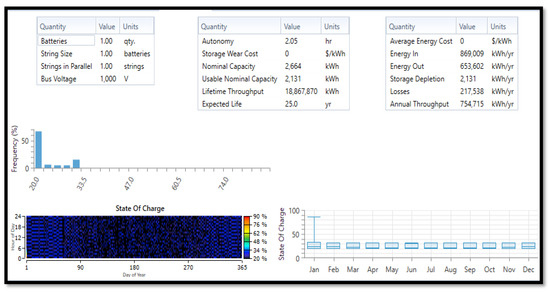
Figure 18.
Characteristics of flow battery operation with biogas generator/utility grid network.
The performance metrics of zinc bromide, flow, and lithium-ion batteries facilitate stable operations and frequency regulation with the utility grid while providing energy to the community, as illustrated in Figure 16, Figure 17 and Figure 18. This enhances the reliability and scalability of the microgrid network, as indicated by the characteristics of the storage technology shown in Figure 14. The autonomy durations for Li-ion (3.24 h), Zn-Brm (0.768 h), and FB (2.05 h) batteries reveal that Li-ion and flow batteries exhibit a lower power-to-energy flow ratio, discharging energy at a slower rate over extended periods, in contrast to the Zn-Brm battery, which discharges energy at a higher rate over shorter intervals. The reduced charging rates of Li-ion and FB are attributed to their annual input energy (89,243 kWh/year and 869,009 kWh/year) and lower stress levels (88,037 kWh/year and 754,715 kWh/year) compared to the Zn-Brm battery, which has a higher charging rate, consuming the most input energy (1,003,616 kWh/year) and experiencing the highest annual stress (952,914 kWh/year). The elevated charging and discharging rates of the Zn-Brm battery contribute to its accelerated degradation, resulting in significantly greater lifespan stress (28,587,418 kWh) compared to Li-ion’s lifespan stress (1,320,548 kWh) and FB lifespan stress (18,867,870 kWh). The performance of these batteries is crucial for assessing their capability to deliver power with a rapid response, taking into account the efficiencies of Zn-Brm (output energy/input energy = 904,014/1,003,616 × 100% = 90.08%), Li-ion (output energy/input energy = 83,519/89,243 × 100% = 93.59%), and FB (output energy/input energy = 653,602/869,009 × 100% = 75.21%), as depicted in Figure 16, Figure 17 and Figure 18. The efficiencies of these batteries further influence the demand from the biogas generator–grid network operation, as analyzed in the performance ratio of the proposed microgrid network architectures (biogas generators/utility grid/Li-ion, biogas generators/utility grid/Zn-Brm, and biogas generators/utility grid/FB) discussed in Section 3.5, Section 3.5.1, Section 3.5.2 and Section 3.5.3.
The flow battery exhibited the lowest coulombic efficiency at 75.21%, in contrast to the efficiencies of Li-ion and Zn-Brm batteries, which were 93.59% and 90.08%, respectively. The annual frequency distribution of flow battery usage was the highest at 99.94%, surpassing the 97.44% and 63.95% of Li-ion and Zn-Brm batteries. Additionally, the annual losses for the flow battery amounted to 217,538 kWh/year, significantly higher than the losses of 9097 kWh/year for Li-ion and 100,403 kWh/year for Zn-Brm batteries. The flow battery also recorded a lower annual cyclic energy flow of 754,715 kWh/year compared to the 952,914 kWh/year of the Zn-Brm battery, while the Li-ion battery had the least at 88,037 kWh/year. In terms of operational hours, Li-ion, flow, and Zn-Brm batteries operated for 3.24 h, 2.05 h, and 0.768 h, respectively, reflecting their input/output energy measures in ascending order and power management in descending order. The charging efficiency of the Zn-Brm battery was superior to that of both the Li-ion and flow batteries. Coulombic efficiency is the ratio of the charge quantity discharged from a battery to the charge quantity received during charging over a complete cycle. The nominal and usable capacities of the Li-ion battery (4216 kWh/3373 kWh/600 V) are greater than those of the flow battery (2664 kWh/2131 kWh/1000 V) and the Zn-Brm battery (1000 kWh/800 kWh/600 V), indicating that the Li-ion battery is better suited to support biogas generator utility grid energy services by charging both flow and Zn-Brm batteries, regardless of their voltage differences. Furthermore, the flow battery is also capable of charging the Zn-Brm battery. The peak charging level of the flow battery, reaching 90.0%, is observed in January, with a consistent charging variation distribution between 20.0% and 34.0% from February to December, as illustrated in Figure 18. The flow battery’s input energy totals 869,009 kWh per year, surpassing its output energy of 653,602 kWh per year. The significant losses of 217,538 kWh per year incurred during the charging process are attributed to secondary reactions, such as redox reactions or water electrolysis, which consequently diminish the flow battery’s coulombic efficiency to 75.21%. The integration of hybrid storage systems, comprising Li-ion, Zn-Brm, and flow batteries with biogas generators and the utility grid, has led to a reduction in grid sales: 17.7% (1,959,426 kWh/year) for the Li-ion architecture, 15.8% (1,717,991 kWh/year) for the Zn-Brm architecture, and 15.0% (1,615,938 kWh/year) for the flow battery architecture, as depicted in Figure 19, Figure 20 and Figure 21. Furthermore, the renewable energy proportion for each storage configuration is higher than that of the current configuration, with Li-ion at 92.9%, Zn-Brm at 94.2%, and the flow battery at 94.0%, compared to the current configuration’s 92.8%, as shown in Figure 9.

Figure 19.
Modeled energy flow analysis of proposed biogas generator/grid/Li-ion network.
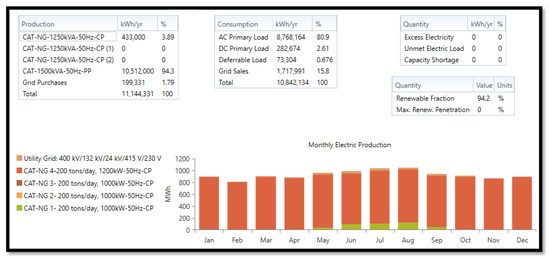
Figure 20.
Modeled energy flow analysis of proposed biogas generator/grid/Zn-Brm network.

Figure 21.
Modeled energy flow analysis of proposed biogas generator/grid/FB network.
The annual grid purchases were decreased (Li-ion: 2.12%; 239,764 kWh/year, Zn-Brm: 1.79%; 199,331 kWh/year, FB: 1.83%; 203,765 kWh/year) when compared to the energy system’s operation without storage systems, as illustrated in Figure 9. This figure demonstrates the positive impact of the storage system in enhancing the performance of biogas generators and the grid network, enabling increased energy sales and reduced energy purchases from the grid. The controller implemented for the biogas generators, utility grid, and battery system was a load-following interface control system, which allowed the utility grid and biogas generators to deliver energy efficiently to the loads at maximum capacity. Any surplus electricity generated was stored in the unified batteries and subsequently sold to the grid after addressing capacity shortages and peak demand. Additionally, a cycle charging interface control system was utilized to optimize the operation of the biogas generators within the utility grid framework, ensuring that the energy demand was met, while the surplus electric energy was stored in the batteries.
3.5. Ratio of Performance on Proposed Biogas Connection to Storage Network
Figure 22 presents a comprehensive summary of the annual biogas fuel consumption, the daily average biogas fuel consumption, and the hourly average biogas fuel consumption derived from the operational performance of the Zn-Brm microgrid energy, flow battery microgrid energy, and Li-ion microgrid energy.

Figure 22.
Fuel summaries of biogas generator/utility grid/storage configurations.
3.5.1. Considering the Biogas Generator/Li-Ion Battery Configuration
Electrical energy flow from biogas generators in kWh/year = 11,054,000 kWh/year.
Electrical energy of biogas generators in kWh/day = 11,054,000 kWh/365 = 30,284.932 kWh/day.
Electrical energy (kWh) = Mega joule (MJ) × 0.277778.
Electrical energy of biogas generators in MJ/day = = 109,025.668 MJ/day.
Lower heating gas value of methane in mega joules per kilogram = 20.0 MJ/m3, 1.0 kg = 1.0 m3.
Biogas fuel consumption per day = 6910 m3/day.
Lower heating gas value of methane in MJ = 6910 m3/day × 20.0 MJ/m3 = 138,200 MJ/day.
Total biogas fuel consumed by the generators in MJ/day = 138,200 MJ/day.
Therefore, the ratio of performance (efficiency) of the biogas generators = electrical energy generated by biogas generators/biogas fuel consumed by biogas generators = = 0.7889 = 78.89%.
3.5.2. Considering the Biogas Generator/Zn-Brm Flow Battery Configuration
Electrical energy flow from biogas generators in kWh/year = 10,945,000 kWh/year.
Electrical energy of biogas generators in kWh/day = 10,945,000 kWh/365 = 29,986.301 kWh/day.
Electrical energy (kWh) = Mega joule (MJ) × 0.277778.
Electrical energy of biogas generators in MJ/day = = 107,950.599 MJ/day.
Lower heating gas value of methane in mega joules per kilogram = 20.0 MJ/m3, 1.0 kg = 1.0 m3.
Biogas fuel consumption per day = 6701 m3/day.
Lower heating gas value of methane in MJ = 6701 m3/day × 20.0 MJ/m3 = 134,020 MJ/day.
Total biogas fuel consumed by the generators in MJ/day = 134,020 MJ/day.
Therefore, the ratio of performance (efficiency) of the biogas generators = electrical energy generated by biogas generators/biogas fuel consumed by biogas generators = = 0.8055 = 80.55%.
3.5.3. Considering the Biogas Generator/Flow Battery (FB) Configuration
Electrical energy flow from biogas generators in kWh/year = 10,952,000 kWh/year.
Electrical energy of biogas generators in kWh/day = 10,952,000 kWh/365 = 30,005.479 kWh/day.
Electrical energy (kWh) = Mega joule (MJ) × 0.277778.
Electrical energy of biogas generators in MJ/day = = 108,019.640 MJ/day.
Lower heating gas value of methane in mega joules per kilogram = 20.0 MJ/m3, 1.0 kg = 1.0 m3.
Biogas fuel consumption per day = 6781 m3/day.
Lower heating gas value of methane in MJ = 6781 m3/day × 20.0 MJ/m3 = 135,620 MJ/day.
Total biogas fuel consumed by the generators in MJ/day = 135,620 MJ/day.
Therefore, the ratio of performance (efficiency) of the biogas generators = electrical energy generated by biogas generators/biogas fuel consumed by biogas generators = = 0.7965 = 79.65%.
3.6. Econometric Assessment and Emission from Grid–Biogas Generator–Battery Network
The Zn-Brm network configuration has been identified as having greater economic value compared to the Li-ion and FB network configurations. The operational metrics of the biogas generator/grid/Zn-Brm network indicate a present worth of USD 10,174,100 and an annual worth of USD 787,011, surpassing the present worth of the biogas generator/grid/Li-ion network at USD 9,998,843 and its annual worth of USD 773,454 as well as the biogas generator/grid/FB network, which has a present worth of USD 8,566,789 and an annual worth of USD 662,679. The investment return for the Zn-Brm configuration is 17.0%, with an internal return rating of 20.3% and a payback period of 4.83 years, all of which are more favorable than the Li-ion configuration’s investment return of 16.5%, internal return rating of 20.0%, and payback period of 4.88 years, as well as the FB configuration’s investment return of 13.1%, internal return rating of 16.3%, and payback period of 5.93 years. Figure 23 presents the carbon emission features of the existing and proposed microgrid systems, detailing the intensities of carbon IV oxide (CO2), carbon monoxide (CO), sulfur IV oxide (SO2), unburned Cx Hy (hydrocarbon gas), particulate matter (P.Ma), and nitrogen oxides gas (NOxx), respectively.
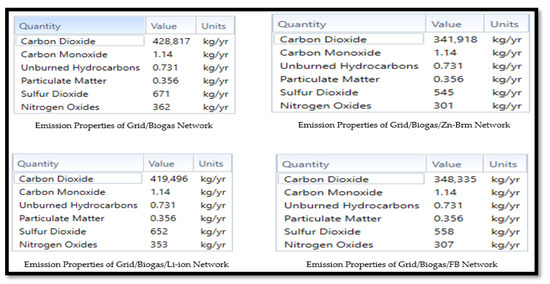
Figure 23.
Emission properties of current and proposed microgrid network.
Therefore, the biogas generator/utility grid/Zn-Brm architecture is the most economically viable system compared to the biogas generator/utility grid/Li-ion and biogas generator/utility grid/FB systems, as illustrated in Figure 24, due to the lower emissions, shorter operational period, and superior electrical properties of the Zn-Brm battery. The biogas generators contribute to providing additional clean energy to the utility grid/batteries’ network, thereby decreasing the community’s reliance on fossil fuel energy from the grid. Figure 23 effectively illustrates the reduction in carbon emissions achieved by the biogas generators/utility grid/batteries in comparison to the biogas generator/utility grid network without battery support. The proposed microgrid technology aims to lower greenhouse gas intensity by promoting sustainable energy development for the On-nut community.
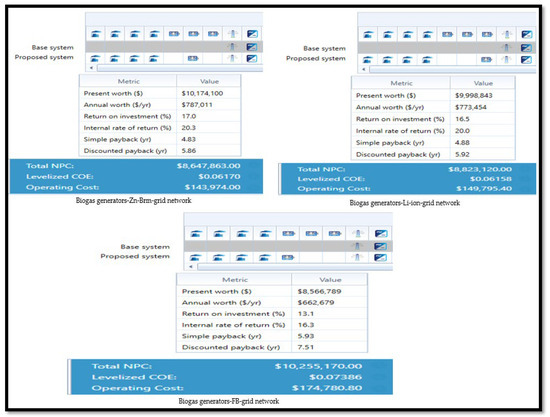
Figure 24.
Econometric efficiency of grid/biogas generator/battery network.
The operational parameters of the microgrid system, flow of input and output power from batteries, biogas generators (renewable energy facilities), and grid support enhances the technical efficiency of the microgrid network, as outlined in Table 6 and Table 7. The batteries improve the performance of the microgrid during operation, lower energy costs for consumers in the On-nut community, and ensure sustainable energy production and reliability. The existing microgrid system achieved a renewable fraction of 92.8%, which is less than the renewable fractions of the proposed microgrid network (Li-ion configuration: 92.9%; Zn-Brm configuration: 94.2%; FB configuration: 94.0%, as illustrated in Figure 9, Figure 19, Figure 20 and Figure 21). When evaluating factors such as energy purchases from the grid, net energy purchases (negative values) against the grid, and energy charges, the proposed microgrid network demonstrates greater efficiency compared to the current system. Among the proposed microgrid configurations (Li-ion, Zn-Brm, and FB), the lithium-ion design yielded the highest energy sales to the grid, the lowest net energy purchases (negative values), and the highest energy purchases from the grid compared to the other configurations. The monthly average biomass feedstock (measured in tons/day) supplied to the On-nut community, along with the carbon content percentage (%), gasification ratio (in kg/kg), and the low heating value of biogas production (in MJ/kg) are detailed in Figure 25.
Table 6.
Parameters of utility grid/biogas generator/battery configuration.
Table 7.
Utility grid/biogas generator/energy storage trade operation.
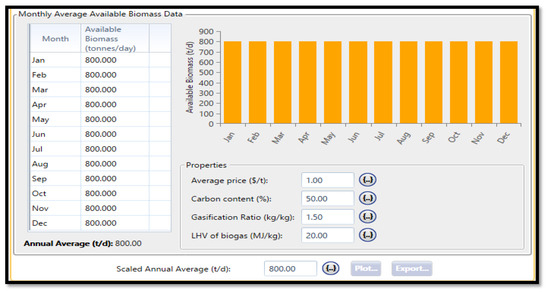
Figure 25.
Average fuel supply for biogas generators per day from On-Nut community.
The assessment of the community’s microgrid parameters, along with the financial and technical analysis of the biogas waste power plant system across various operational configurations and control strategies, is presented in Table 6, Table 7 and Table 8. The emission characteristics of both the existing and proposed microgrid networks, as illustrated in Figure 23, show identical levels of unburnt hydrocarbons at 0.731 kg/year, carbon monoxide at 1.14 kg/year, and particulate matter at 0.356 kg/year annually. The integration of unified batteries into the current power microgrid technology has led to a reduction in the potential emissions of CO2, SO2, and NOXX, which are harmful gases for the community. Among the configurations, the Zn-Brm network exhibited the lowest emission levels, with CO2 at 341,918 kg/year, SO2 at 545 kg/year, and NOXX at 301 kg/year annually. This was followed by the flow battery network, which had slightly higher emissions of carbon dioxide at 348,335 kg/year, SO2 at 558 kg/year, and NOXX at 307 kg/year, while the Li-ion network configuration recorded the highest emissions among the three, with carbon dioxide at 419,496 kg/year, SO2 at 652 kg/year, and NOXX at 353 kg/year. The implementation of unified batteries within the utility grid and biogas generators microgrid network has positively impacted the community’s environment, promoting the integration of biogas generators as a renewable energy source into the utility grid. This has led to an increased utilization of biogas generators as a sustainable energy option for the community, while simultaneously reducing the reliance on conventional generation from the grid system. The suggested microgrid setups of the Zn-Brm, flow battery (FB), and Li-ion networks have significantly decreased the emission levels in the On-nut community compared to the emissions produced by the existing technology that lacks a storage system (utility grid/biogas generators), which resulted in substantial carbon dioxide emissions of 428,817 kg/year, sulfur dioxide emissions of 671 kg/year, and nitrogen oxides emissions of 362 kg/year, respectively.
Table 8.
Financial summary of utility grid/biogas generator/energy storage operation.
The hybrid biogas generator/utility grid/storage configurations were analyzed with reference to their fuel usage summary. The total biogas fuel consumed, average biogas fuel usage per day, and average biogas fuel usage per hour from the Zn-Brm energy system (2,445,870 m3; 6701 m3/day; 279 m3/hour), FB energy system (2,475,055 m3; 6781 m3/day; 283 m3/hour), and Li-ion energy system (2,522,183 m3; 6910 m3/day; 288 m3/hour) are represented in Figure 22 in their order of fuel usage increase. The Li-ion system configuration had the highest utilized volume of biogas fuel and average biogas fuel usage compared to other storage system configurations (Zn-Brm and flow battery) as a result of a high energy demand (11,083,568 kWh/year), against the operation of the Li-ion energy system when compared with energy demand (10,842,134 kWh/year), against the operation of the Zn-Brm energy system and energy demand (10,740,080 kWh/year), and against the operation of the flow battery energy system, shown in Figure 19, Figure 20, and Figure 21, respectively.
4. Conclusions
An evaluation was conducted on the existing microgrid network, which includes biogas generators, a utility grid system, and a generator order control system, alongside the proposed microgrid network that incorporates biogas generators, a utility grid, batteries, and load-following and cycle charging control systems for energy production in the On-nut community of Bangkok. This assessment focused on various aspects such as technical efficiencies, operational and generation performances, energy cost management, and performance ratios. The current microgrid configuration achieved a performance ratio of 18.55%, incurred energy charges amounting to USD 173,427.13, and recorded the highest energy purchase at 244,775 kWh per year, with 2.16% sourced from the grid system. It also noted the lowest net energy purchase of −1,734,271 kWh, a renewable fraction of 92.80%, and the highest energy production of 11,307,775 kWh per year. In contrast, the proposed microgrid architectures utilizing lithium-ion, zinc bromide, and flow batteries yielded performance ratios of 78.89%, 80.55%, and 79.65%, respectively, with renewable fractions of 92.90%, 94.20%, and 94.0%. These proposed systems demonstrated reduced energy purchase values of 239,764 kWh per year, 199,331 kWh per year, and 203,765 kWh per year, alongside increased net energy purchase values of −1,719,661 kWh, −1,518,661 kWh, and −1,412,173 kWh from the grid.
Furthermore, the energy charges associated with the lithium-ion, zinc bromide, and flow battery architectures were lower, amounting to USD 171,966.14, USD 151,866.06, and USD 141,217.29, respectively, compared to the current energy system value outlined in Table 7. From the proposed microgrid architectural system point of view, the zinc bromide architecture generated a higher performance ratio (80.55%) than the other proposed architectures from Section 3.5. The lithium-ion architecture generated a higher level of technical efficiency in terms of energy production (11,293,764 kWh/year) than the other proposed architectures. The flow battery architecture was the most expensive energy system; see Table 8.
The analysis indicates that the proposed microgrid system demonstrates greater efficiency compared to the existing energy system, particularly regarding the renewable fraction, performance ratio, energy charge, energy purchase, and net energy purchase.
Author Contributions
The authors have provided the final manuscript version approval. O.O.A.: Conceptualization, visualization, methodology, investigation, formal analysis, writing original draft for preparation, data curation, software, validation; B.P.: Funding acquisition, project administration, resources and supervision; R.R.: Funding acquisition, writing—review and editing; S.N.: Funding acquisition, writing—review and editing; K.P.: Funding acquisition, writing—review and editing. All authors have read and agreed to the published version of the manuscript.
Funding
This experiment and innovation has no financial support and no sponsorship from any government and private institutions/individuals.
Informed Consent Statement
Not applicable.
Data Availability Statement
The authors obtained their experimental data from On-Nut Community Wastes Disposal Management Project Centre and HOMER smart grid optimizer/simulation analyzing software system (HOMER Pro x64 v3.14.7524.23887) from Rajamangala University of Technology Thanyaburi.
Acknowledgments
The authors express their in-depth gratitude for the experimental facilities and resources that were made available by the personnel officers (managing director and staff members) of On-Nut Community Solid Wastes Disposal and Wastes Management Project Centre, including the provision of HOMER smart grid optimizer/simulation analyzing system from the Rajamangala University of Technology Thanyaburi, Thailand.
Conflicts of Interest
There is no conflicts-of-interest declaration from the authors for this experiment and research analysis.
Appendix A
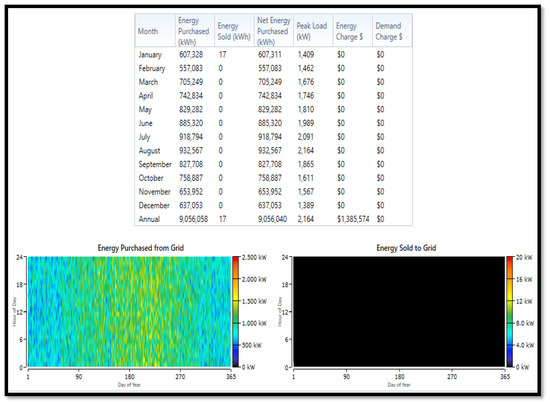
Figure A1.
Utility grid/Zn-Brm load-following energy operation.
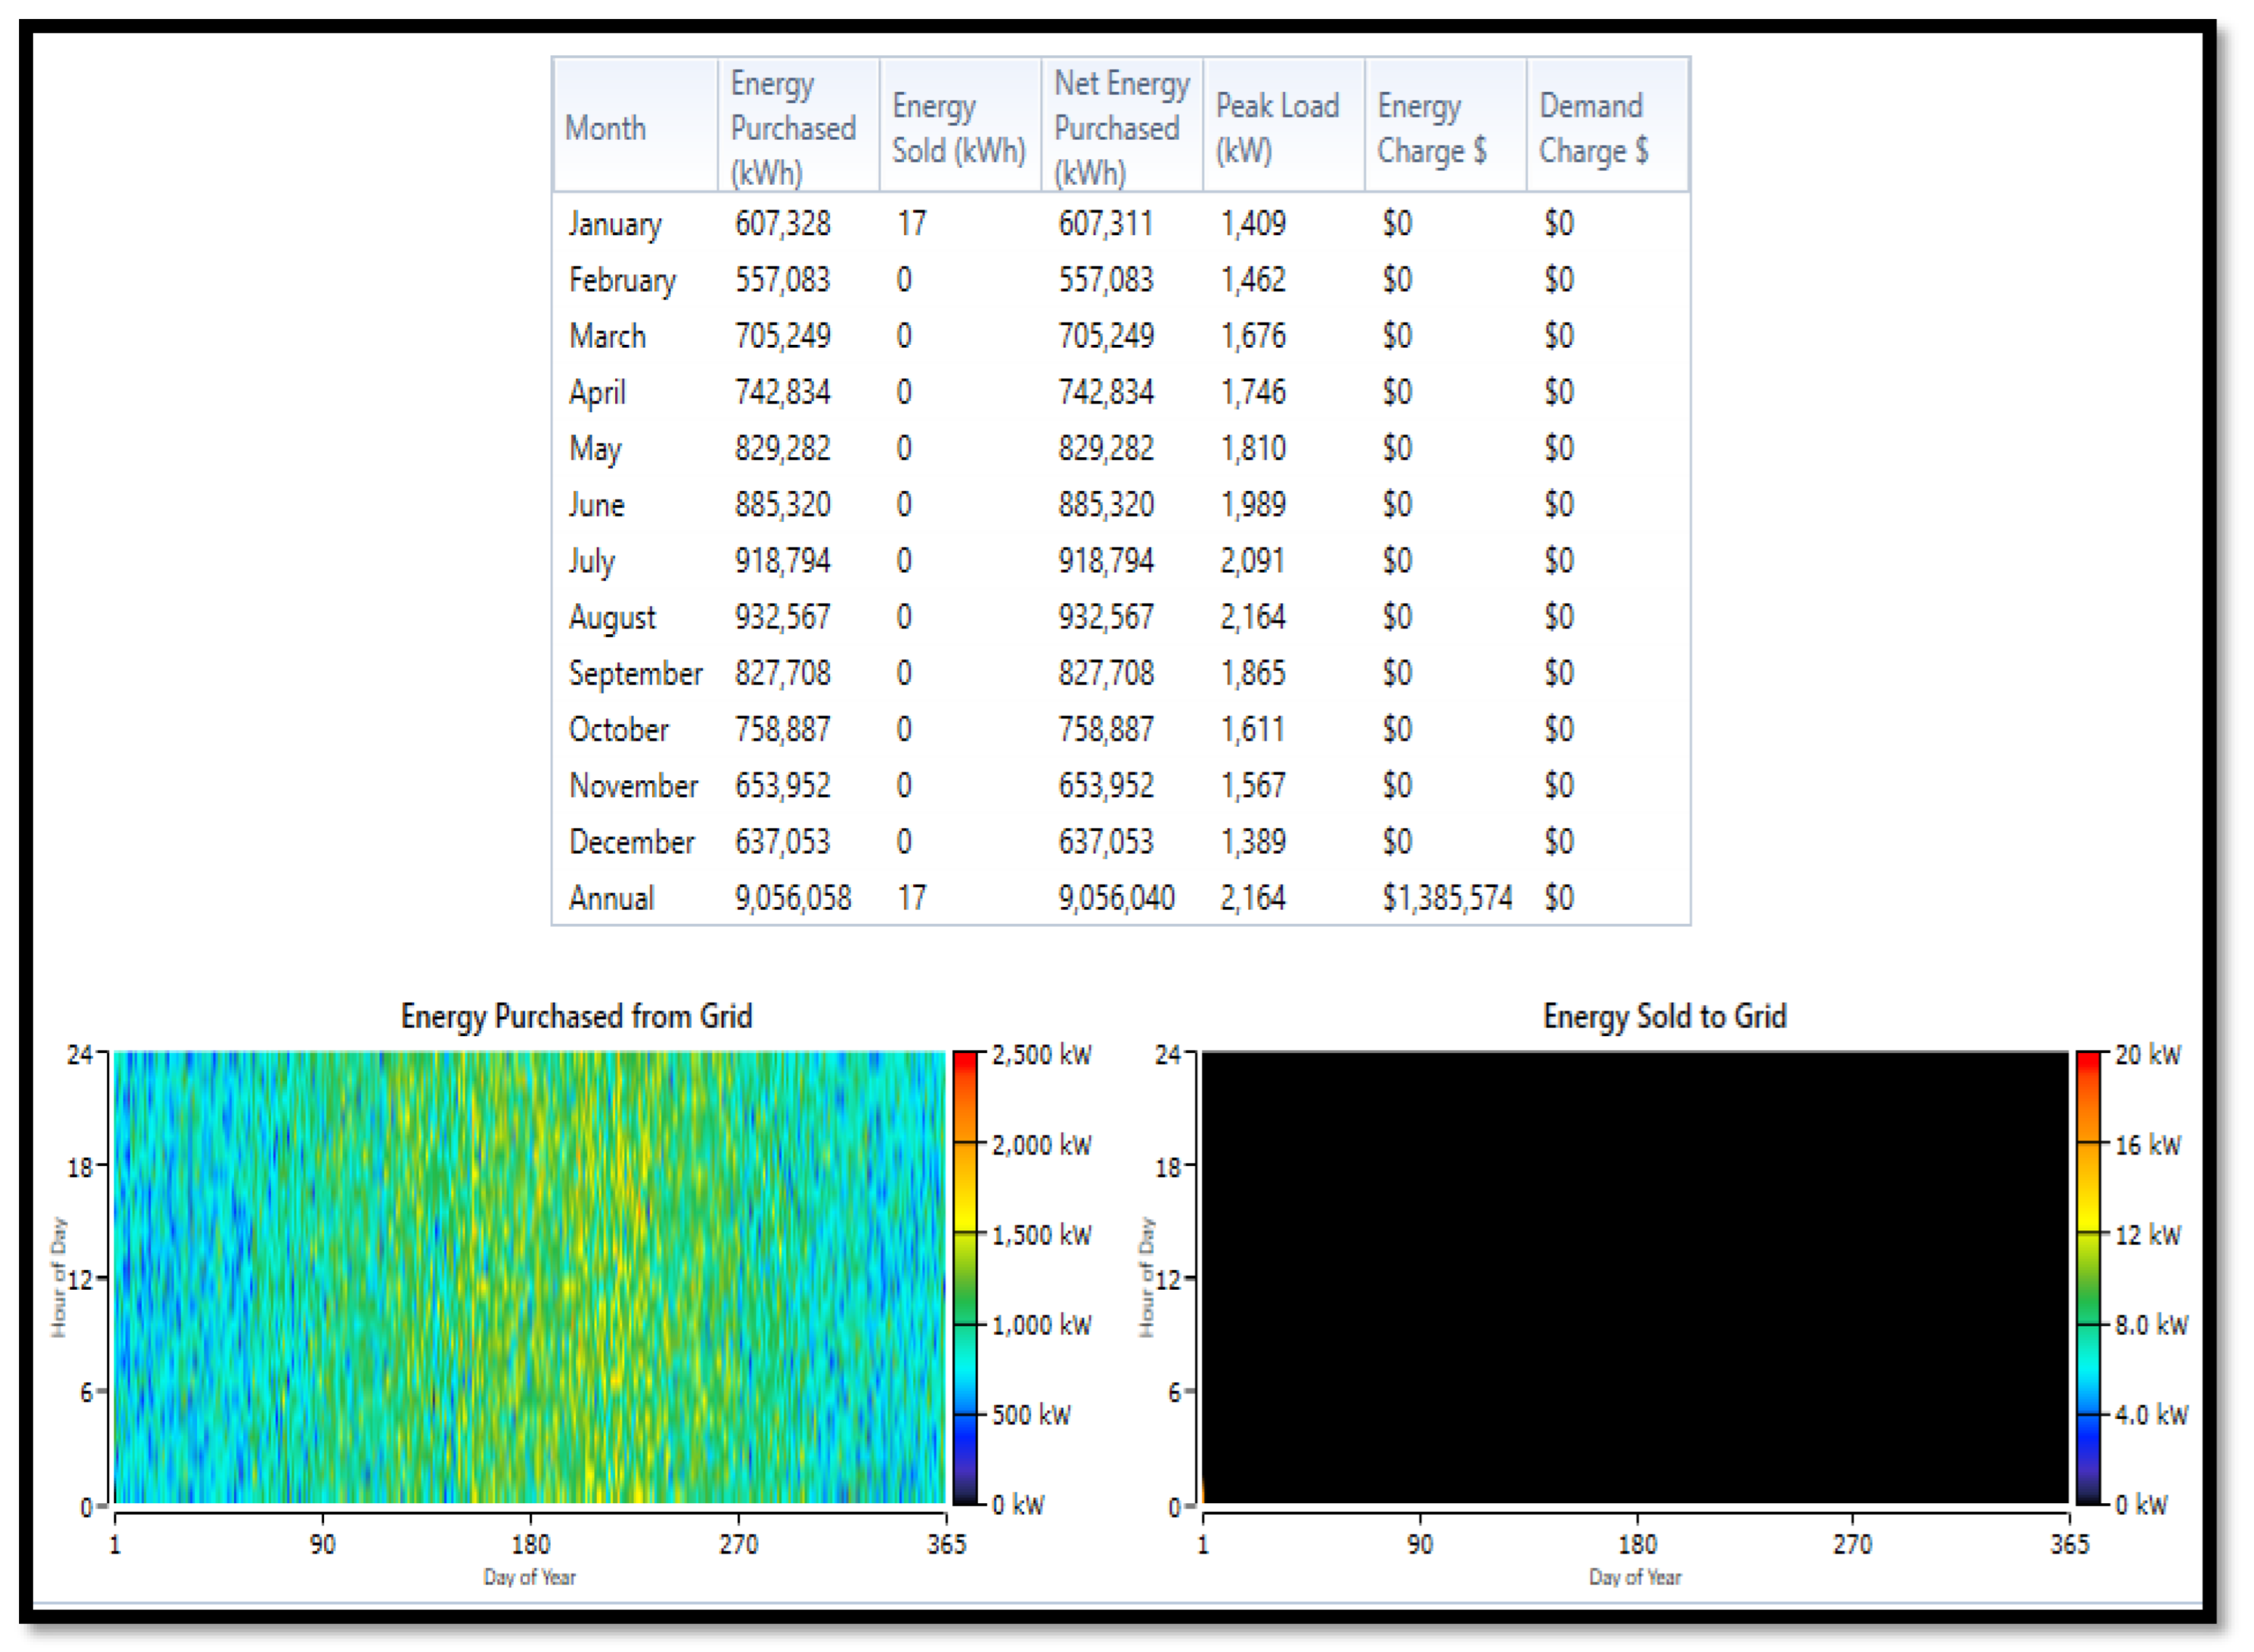
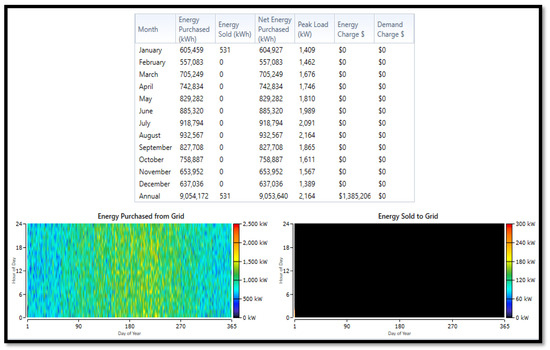
Figure A2.
Utility grid/Li-ion load-following energy operation.

The operation of the utility grid utilizing a Zn-Brm storage system resulted in a higher net current cost of USD 19,282,210.00, a levelized electrical energy cost of USD 0.1648/kWh, an operating cost of USD 1,408,330.00, and a reduced energy charge of USD 1,385,574.00/year compared to the grid operation without storage support, as indicated in Table 7. Additionally, in January, the Zn-Brm battery contributed 17 kWh of energy to the grid, which reduced the energy purchased from the grid to 9,056,040 kWh/year, exceeding the energy demand of 9,051,033 kWh/year, as shown in Figure A1, under the load-following controller strategy. In contrast, the grid/Li-ion energy operation exhibited a higher net current cost of USD 19,552,620.00, a levelized electrical energy cost of USD 0.1671/kWh, an operating cost of USD 1,421,512.00, and a lower energy charge of USD 1,385,206.00/year compared to both the utility grid and the grid/Zn-Brm energy systems. Technically, the energy production from the grid/Li-ion system amounted to 9,054,172 kWh/year under the load-following controller, which exceeded the annual energy demand of 9,051,541 kWh/year, with an energy sales production of 531 kWh/year from the Li-ion battery to the grid system in Figure A2, thereby reducing the total energy purchase from the utility grid to 9,053,640 kWh/year. This situation is not economically viable for the community environment.
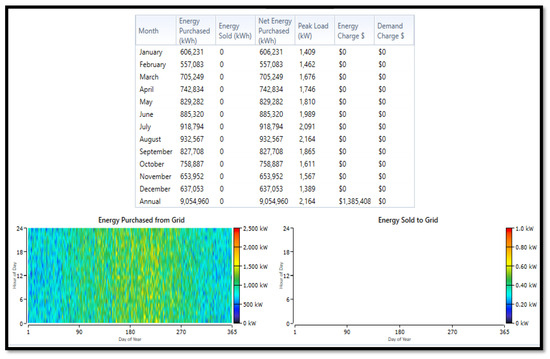
Figure A3.
Utility grid/FB load-following energy operation.
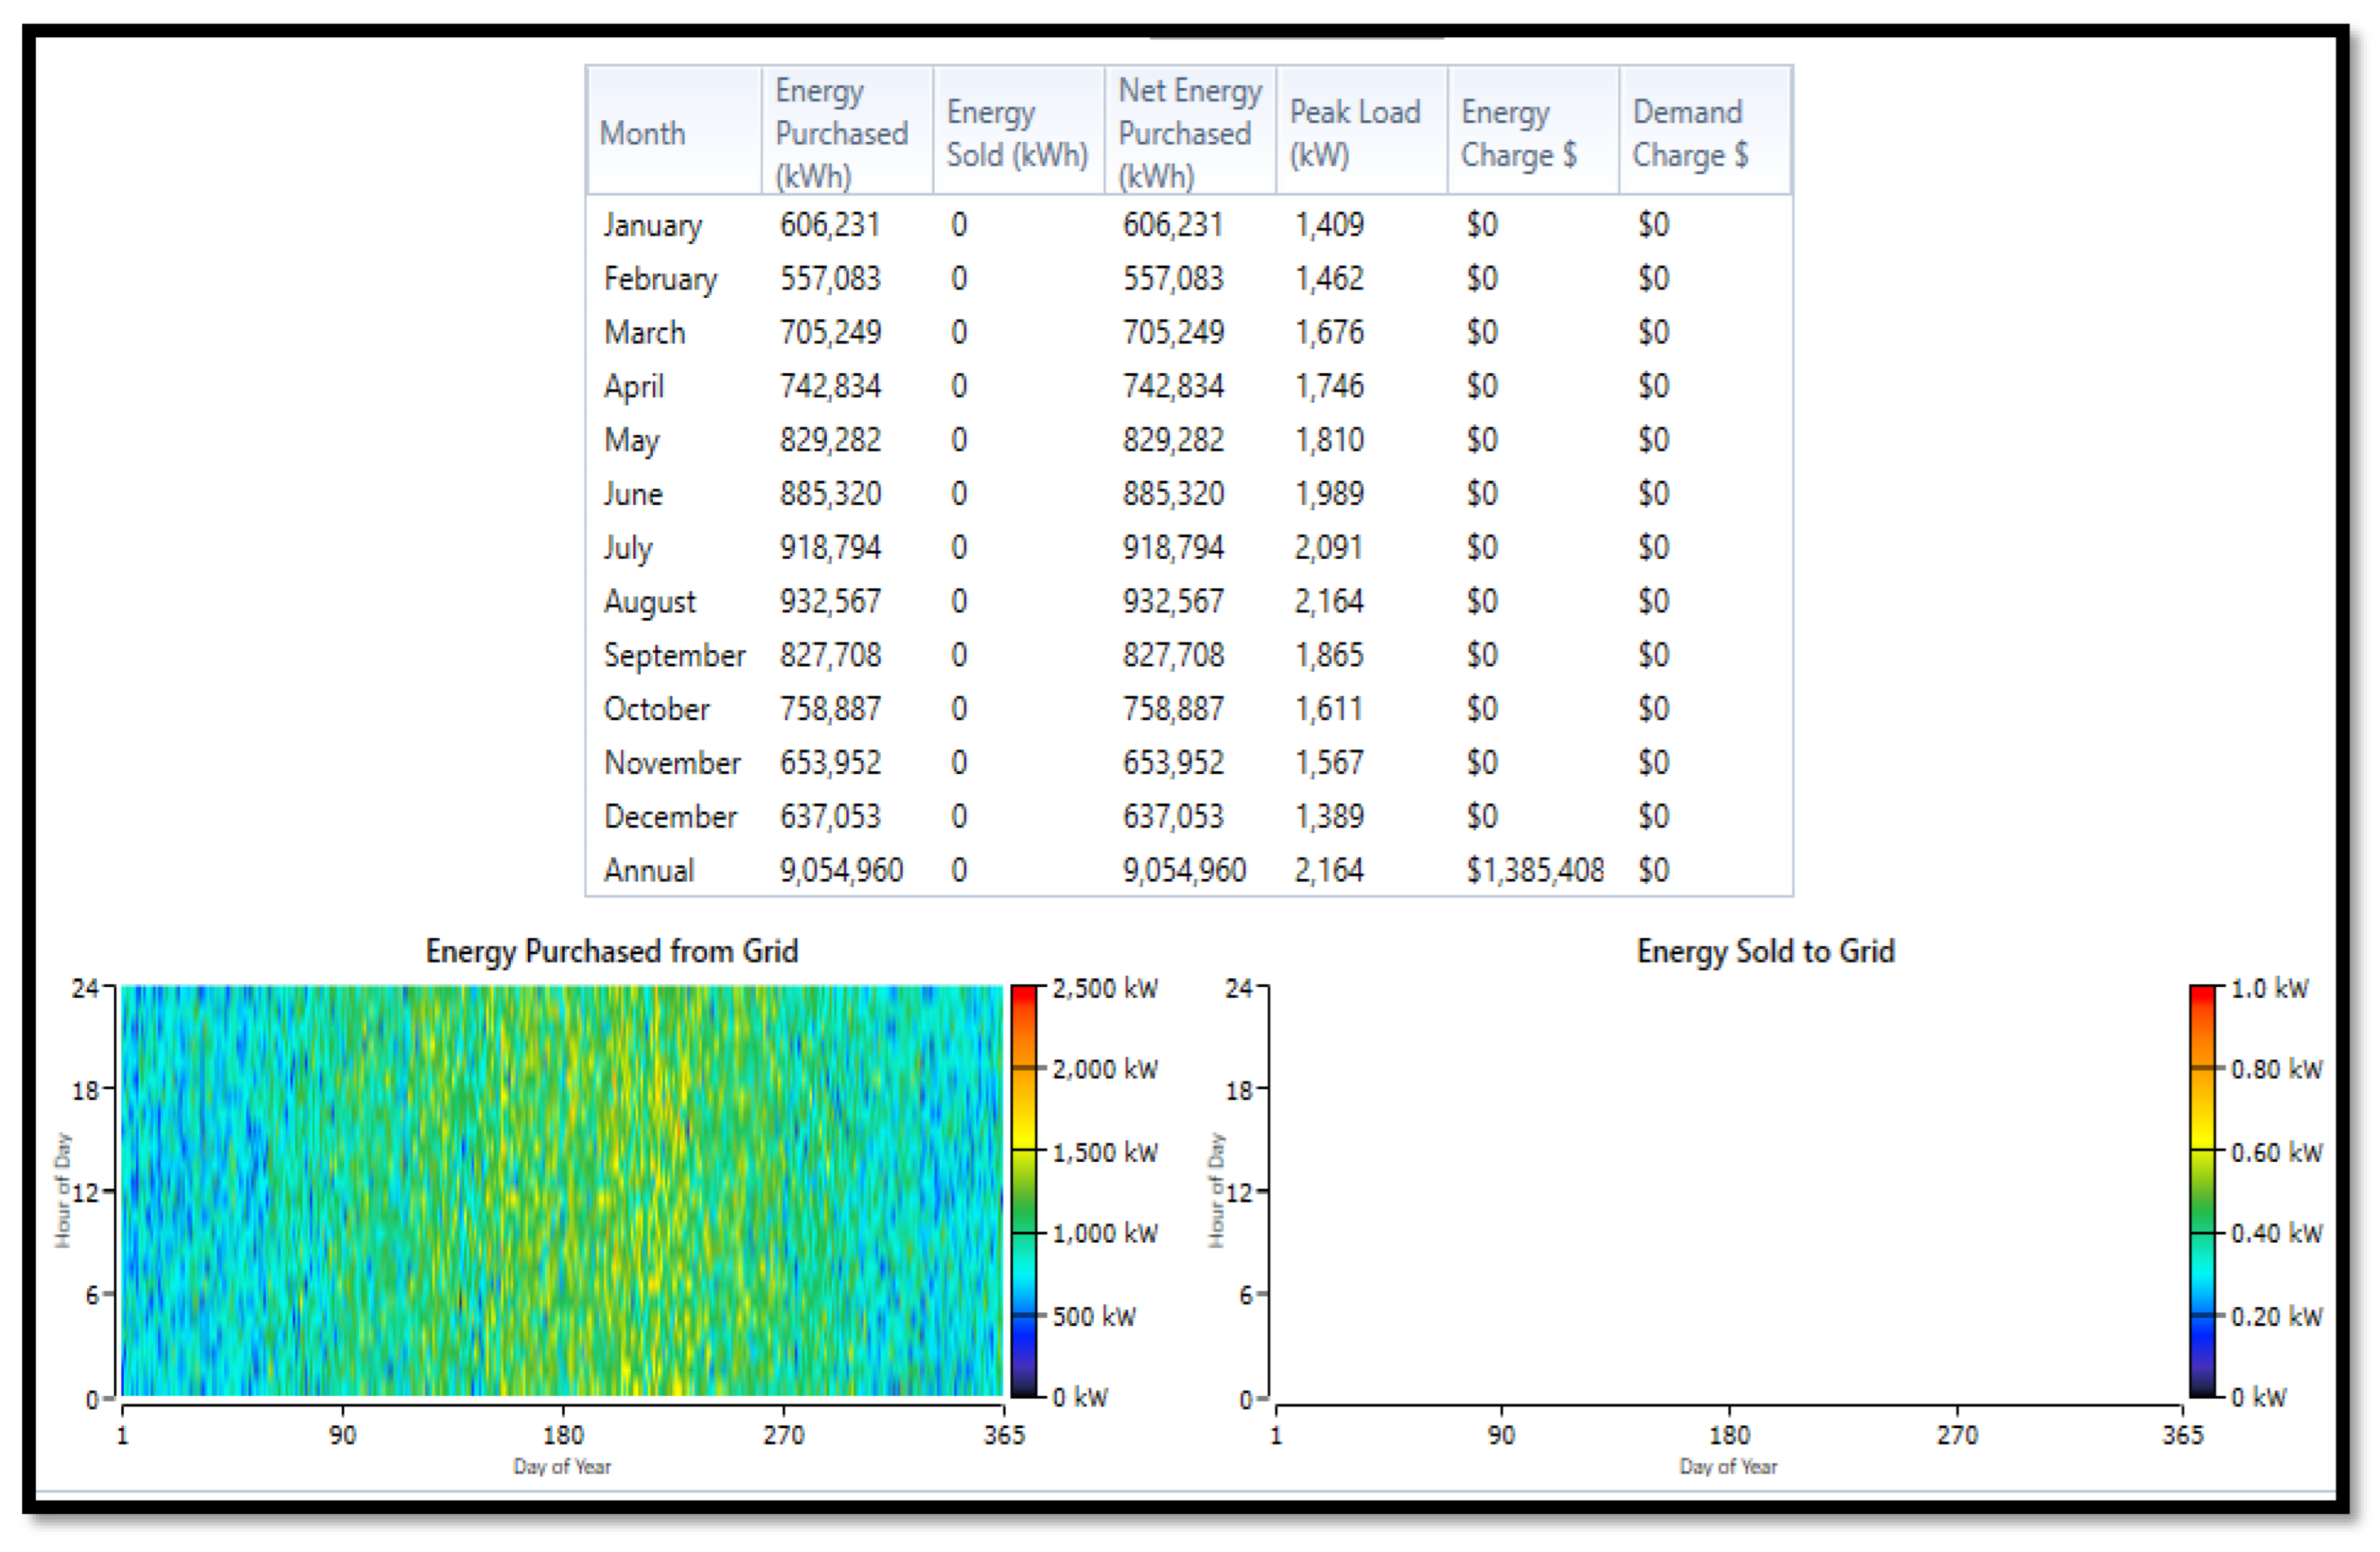
The operation of the grid/flow battery resulted in the highest net current cost of USD 20,739,450.00, a levelized electrical energy cost of USD 0.1772/kWh, an operating cost of USD 1,427,528.00, and a reduced energy charge of USD 1,385,408.00/year, all without any production from grid sales. The grid/FB system produced an energy flow of 9,054,960 kWh/year, exceeding the load of 9,051,005 kWh/year, as indicated by the load-following controller strategy illustrated in Figure A3. While the utility grid/storage energy is technically feasible for meeting the annual energy demand, it is not economically viable. Overall, both the batteries and the utility grid operation present significant economic and technical disadvantages for the community’s energy consumption. The configuration of the experiments related to the proposed study within the On-nut community environment is represented in Figure A4.
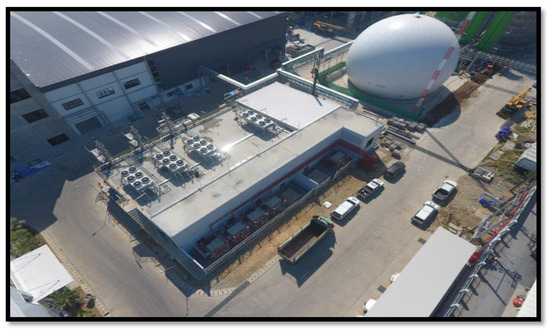
Figure A4.
The experimental segment of the suggested microgrid network within the On-nut community setting.
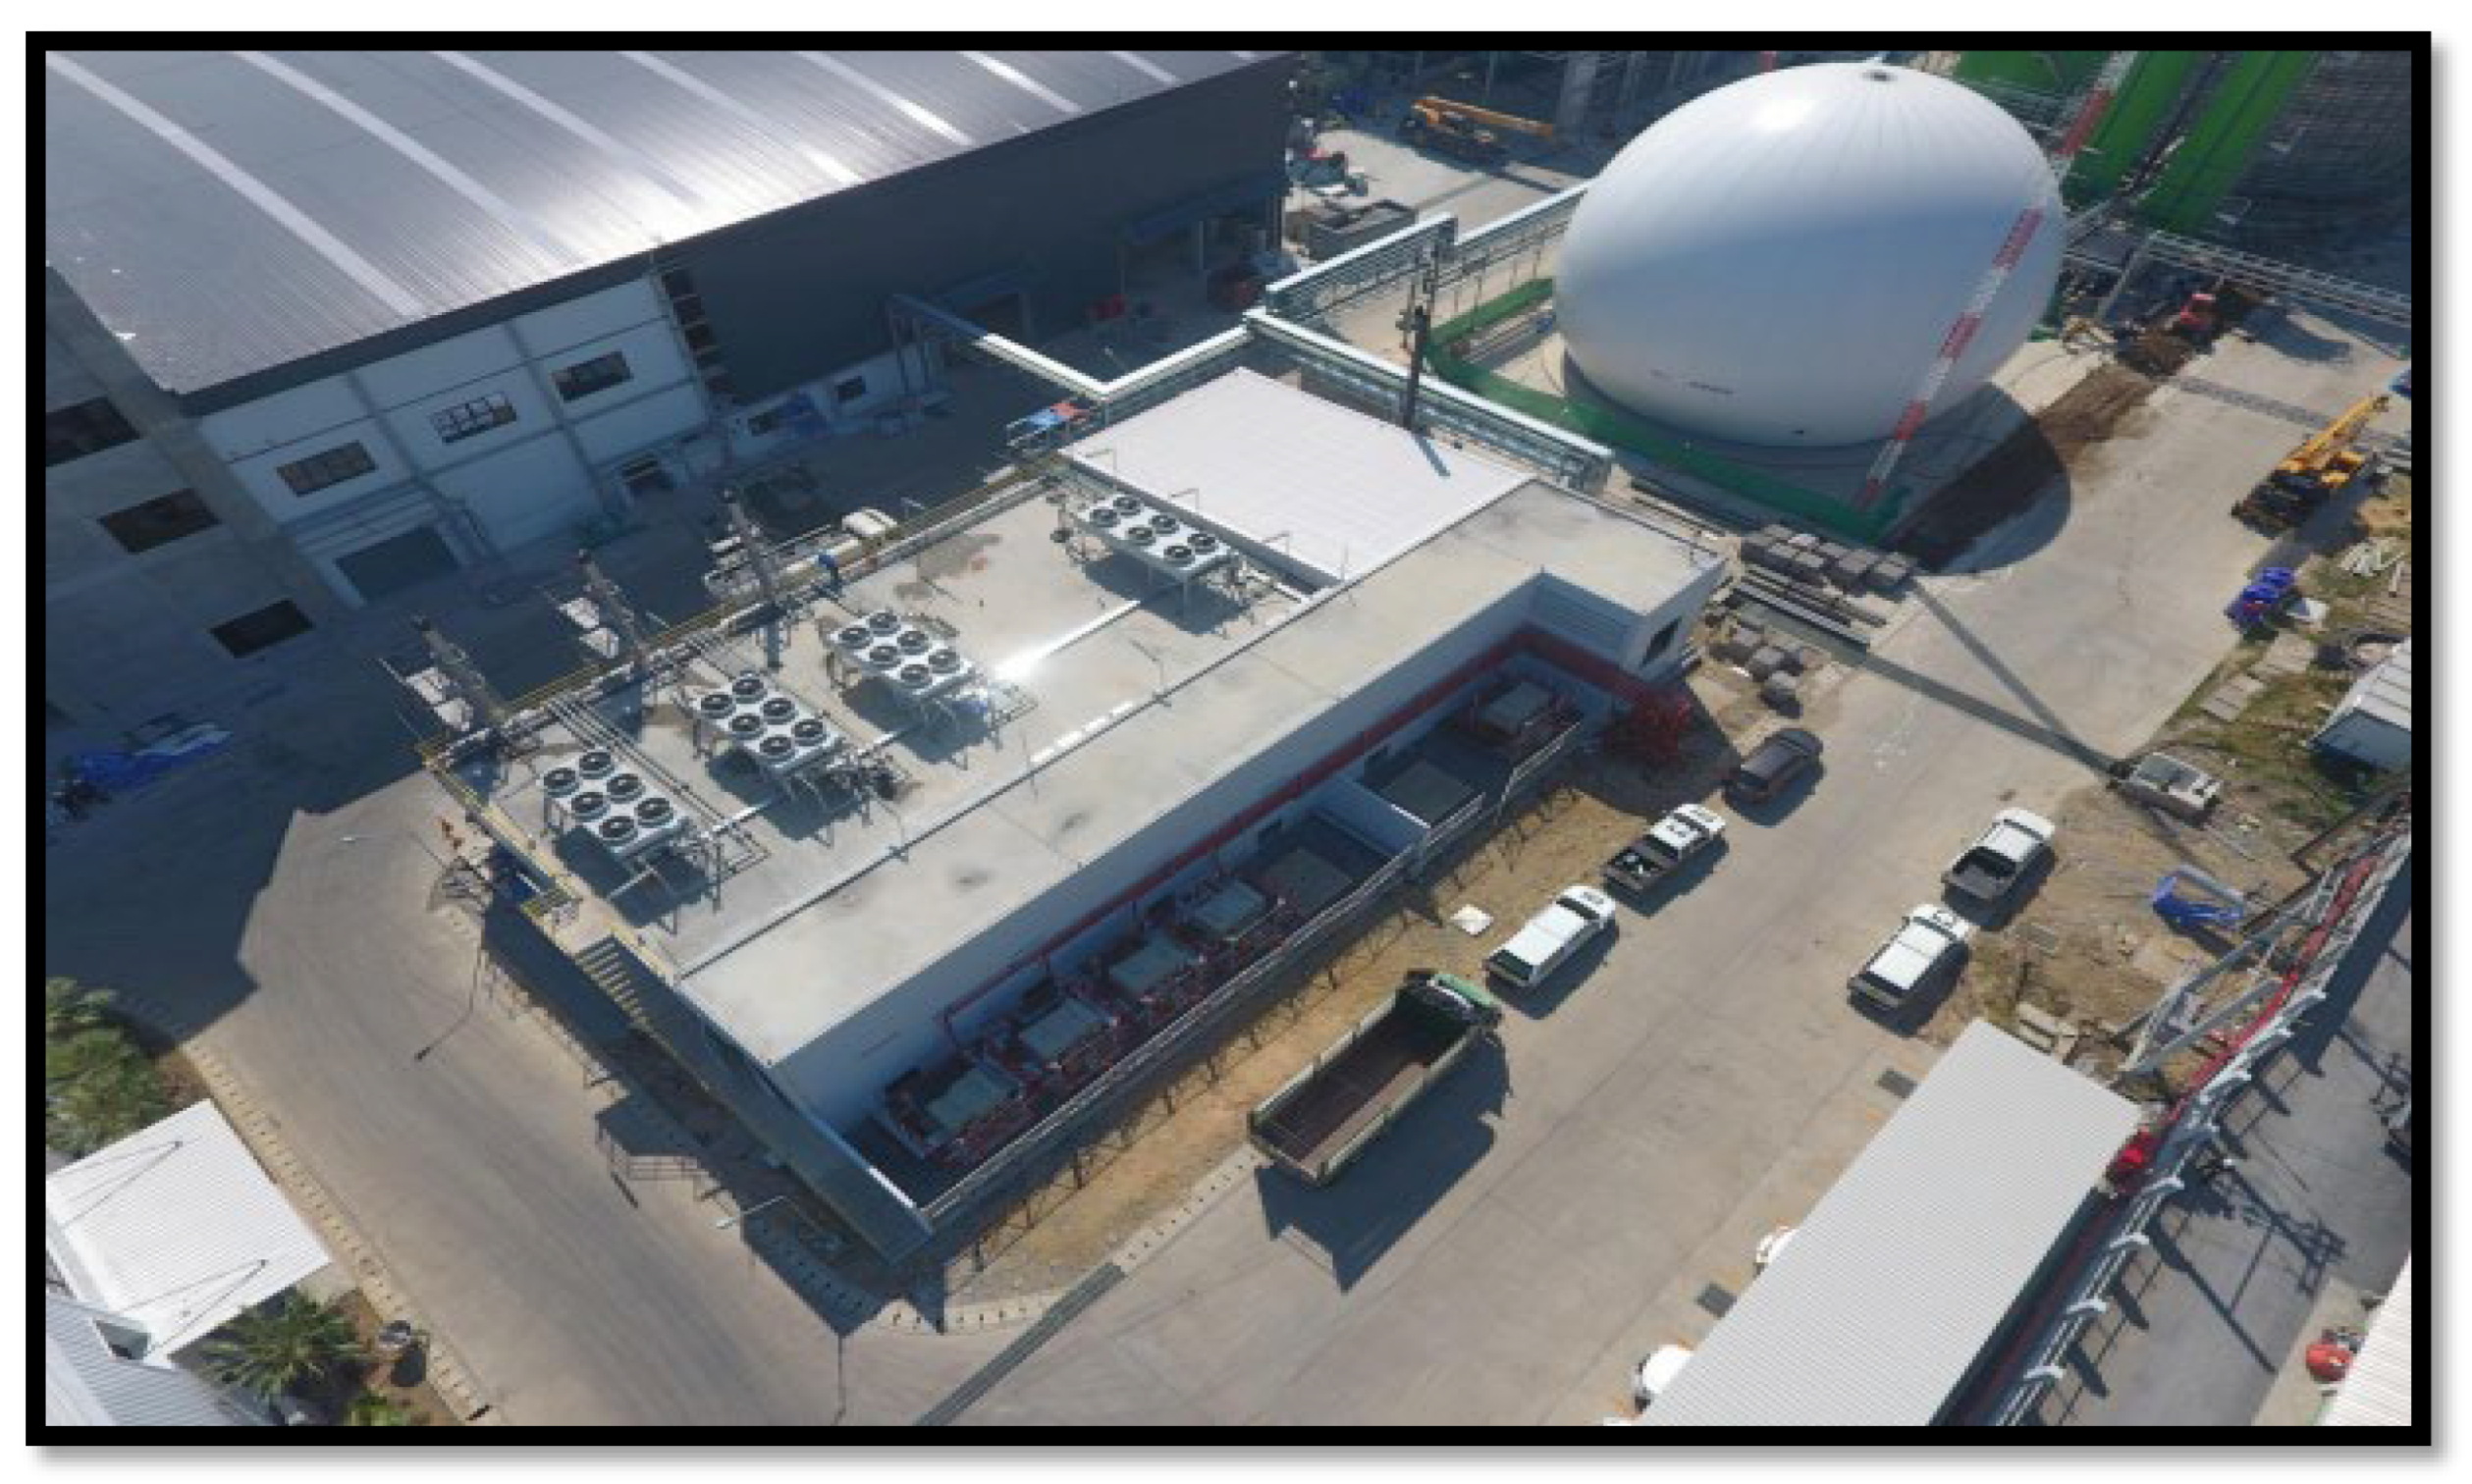
References
- Rajbongshi, R.; Borgohain, D.; Mahapatra, S. Optimization of PV-biomass-diesel and grid base hybrid energy systems for rural electrification by using HOMER. Energy 2017, 126, 461–474. [Google Scholar] [CrossRef]
- Mamaghani, A.H.; Escandon, S.A.A.; Najafi, B.; Shirazi, A.; Rinaldi, F. Techno-economic feasibility of photovoltaic, wind, diesel and hybrid electrification systems for off-grid rural electrification in Colombia. Renew. Energy 2016, 97, 293–305. [Google Scholar] [CrossRef]
- Odou, O.D.T.; Bhandari, R.; Adamou, R. Hybrid off-grid renewable power system for sustainable rural electrification in Benin. Renew. Energy 2020, 145, 1266–1279. [Google Scholar] [CrossRef]
- Shivarama Krishna, K.; Sathish Kumar, K. A review on hybrid renewable energy systems. Renew. Sustain. Energy Rev. 2015, 52, 907–916. [Google Scholar] [CrossRef]
- Li, J.; Liu, P.; Li, Z. Optimal design and techno-economic analysis of a solar-wind-biomass off-grid hybrid power system for remote rural electrification: A case study of west China. Energy 2020, 208, 118387. [Google Scholar] [CrossRef]
- Shahzad, M.K.; Zahid, A.; Rashid, T.U.; Rehan, M.A.; Ali, M.; Ahmad, M. Techno-economic feasibility analysis of a solar-biomass off grid system for the electrification of remote rural areas in Pakistan using HOMER software. Renew. Energy 2017, 106, 264–273. [Google Scholar] [CrossRef]
- Kasaeian, A.; Rahdan, P.; Rad, M.A.V.; Yan, W.-M. Optimal design and technical analysis of a grid-connected hybrid photovoltaic/diesel/biogas under different economic conditions: A case study. Energy Convers. Manag. 2019, 198, 111810. [Google Scholar] [CrossRef]
- Zhao, H.; Sun, Z.; Li, C.; Wu, D.; Lee, L.Q.; Lu, D.; Lv, Y.; Chu, X.; Li, Y.; Tu, W.; et al. Solar-driven sewage sludge electroreforming coupled with biological funnelling to cogenerate green food and hydrogen. Nat. Water 2024, 2, 1102–1115. [Google Scholar] [CrossRef]
- Merabet, N.H.; Kerboua, K.; Hoinkis, J. Hydrogen production from wastewater: A comprehensive review of conventional and solar powered technologies. Renew. Energy 2024, 226, 120412. [Google Scholar] [CrossRef]
- Lee, L.Q.; Zhao, H.; Lim, T.Y.; Junyu, G.; Ding, O.L.; Liu, W.; Li, H. Green hydrogen generation assisted by electroreforming of raw sugarcane bagasse waste. Green Chem. 2023, 25, 7707–7720. [Google Scholar] [CrossRef]
- Nguyen, V.G.; Nguyen-Thi, T.X.; Nguyen, P.Q.P.; Tran, V.D.; Ağbulut, Ü.; Nguyen, L.H.; Balasubramanian, D.; Tarelko, W.; Bandh, S.A.; Pham, N.D.K. Recent advances in hydrogen production from biomass waste with a focus on pyrolysis and gasification. Int. J. Hydrogen Energy 2023, 54, 127–160. [Google Scholar] [CrossRef]
- Kaza, S.; Yao, L.; Bhada-Tata, P.; Van Woerden, F. What a Waste 2.0: A Global Snapshot of Solid Waste Management to 2050. In What A Waste 2.0: A Global Snapshot of Solid Waste Management to 2050; The World Bank: Washington, DC, USA, 2018. [Google Scholar] [CrossRef]
- Dou, Z.; Toth, J.D. Global primary data on consumer food waste: Rate and characteristics—A review. Resour. Conserv. Recycl. 2020, 168, 105332. [Google Scholar] [CrossRef]
- Dobers, G.M. Acceptance of biogas plants taking into account space and place. Energy Policy 2019, 135, 110987. [Google Scholar] [CrossRef]
- Deng, L.; Liu, Y.; Zheng, D.; Wang, L.; Pu, X.; Song, L.; Wang, Z.; Lei, Y.; Chen, Z.; Long, Y. Application and development of biogas technology for the treatment of waste in China. Renew. Sustain. Energy Rev. 2017, 70, 845–851. [Google Scholar] [CrossRef]
- IEA. Southeast Asia Energy Outlook 2022—Analysis; IEA: Paris, France, 2022; Available online: https://www.iea.org/reports/southeast-asia-energy-outlook-2022 (accessed on 3 September 2024).
- Kolhe, M.L.; Ranaweera, K.M.I.U.; Gunawardana, A.G.B.S. Techno-economic sizing of off-grid hybrid renewable energy system for rural electrification in Sri Lanka. Sustain. Energy Technol. Assess. 2015, 11, 53–64. [Google Scholar] [CrossRef]
- Baruah, A.; Basu, M.; Amuley, D. Modeling of an autonomous hybrid renewable energy system for electrification of a township: A case study for Sikkim, India. Renew. Sustain. Energy Rev. 2021, 135, 110158. [Google Scholar] [CrossRef]
- Zhou, Z.; Wang, C.; Ge, L. Operation of Stand-Alone Microgrids Considering the Load Following of Biomass Power Plants and the Power Curtailment Control Optimization of Wind Turbines. IEEE Access 2019, 7, 186115–186125. [Google Scholar] [CrossRef]
- Singh, A.; Basak, P. Conceptualization and techno-economic evaluation of microgrid based on PV/Biomass in Indian scenario. J. Clean. Prod. 2021, 317, 128378. [Google Scholar] [CrossRef]
- Ribó-Pérez, D.; Herraiz-Cañete, Á.; Alfonso-Solar, D.; Vargas-Salgado, C.; Gómez-Navarro, T. Modelling biomass gasifiers in hybrid renewable energy microgrids; a complete procedure for enabling gasifiers simulation in HOMER. Renew. Energy 2021, 174, 501–512. [Google Scholar] [CrossRef]
- Odoi-Yorke, F.; Abaase, S.; Zebilila, M.; Atepor, L. Feasibility analysis of solar PV/biogas hybrid energy system for rural electrification in Ghana. Cogent Eng. 2022, 9, 2034376. [Google Scholar] [CrossRef]
- Tostado-Véliz, M.; Escámez, A.; Aguado, R.; Sánchez-Lozano, D.; Jurado, F.; Vera, D. Optimal sizing of hybrid PV–diesel–biomass gasification plants for electrification of off-grid communities: An efficient approach based on Benders’ decomposition. J. Clean. Prod. 2024, 458, 142360. [Google Scholar] [CrossRef]
- Loboichenko, V.; Iranzo, A.; Casado-Manzano, M.; Navas, S.J.; Pino, F.J.; Rosa, F. Study of the use of biogas as an energy vector for microgrids. Renew. Sustain. Energy Rev. 2024, 200, 114574. [Google Scholar] [CrossRef]
- Santos, M.I.; Maravilha, A.; Bessani, M.; Uturbey, W.; Batista, L. A model for optimal energy management in a microgrid using biogas. Evol. Intell. 2023, 17, 1677–1695. [Google Scholar] [CrossRef]
- Amorim, A.P.A.; Pontes, K.V.; Dorneanu, B.; Arellano-Garcia, H. Optimizing Microgrid Design and Operation: A Decision-Making Framework for Residential Distributed Energy Systems in Brazil. Process Saf. Environ. Prot. 2024, 214, 251–268. [Google Scholar] [CrossRef]
- Jabbary, A.; Noroozian, R.; Gharehpetian, G.B. Optimum utilization of hub energy micro-grids with micro-networking strategy of local biogas productions. Heliyon 2023, 9, e20995. [Google Scholar] [CrossRef]
- Kumari, N.; Sharma, A.; Tran, B.; Alahakoon, D. Stability Analysis of Grid-Connected Microgrid Integrated with Biomass Plant. In Proceedings of the 2021 IEEE Power & Energy Society General Meeting (PESGM), Washington, DC, USA, 26–29 July 2024; pp. 1–5. [Google Scholar] [CrossRef]
- Sengupta, S.; Chanda, C.K.; Saha, H. A Cost Effective Operation Scheduling of a Solar PV-Biogas-Wind-Grid Integrated Microgrid Considering PV Soiling Loss. In Proceedings of the 2024 IEEE 3rd International Conference on Control, Instrumentation, Energy & Communication (CIEC), Kolkata, India, 25–27 January 2024; pp. 147–152. [Google Scholar] [CrossRef]
- Miah, M.S.; Hossen, R.; Prothoy, I.P.; Zilan, P.M.; Mahbub, S.; Islam, S. A Smart Hybrid Renewable Energy-Based Micro System for Optimal Agriculture Irrigation Efficiency. In Proceedings of the 2024 3rd International Conference on Advancement in Electrical and Electronic Engineering (ICAEEE), Gazipur, Bangladesh, 25–27 April 2024; pp. 1–5. [Google Scholar] [CrossRef]
- Ali, M.F.; Sheikh, M.R.I.; Mamun, A.A.; Hossen, M.J. Techno-Economic, Predictive Modeling, and Demand Response Analysis of a Renewable Energy-Based Microgrid for Residential Applications. IEEE Access 2025, 13, 53748–53771. [Google Scholar] [CrossRef]
- Miracle, D.B.; Viral, R.K.; Tiwari, P.M.; Bansal, M. Techno–economic Evaluation Optimization Framework for Grid independent IRESs with Biogas and Wind power systems. In Proceedings of the 2024 15th International Conference on Computing Communication and Networking Technologies (ICCCNT), Kamand, India, 24–28 June 2024; pp. 1–6. [Google Scholar] [CrossRef]
- Orellana-Lafuente, R.J.; Paredes-Vèlez, M.A.; Morales-Udaeta, M.E.; Sempertegui-Tapia, D.F. Techno-Economic Assesment of a Distributed Generation System for Biogas from Wastewater Treatment Plants. In Proceedings of the 2021 IEEE URUCON, Montevideo, Uruguay, 18–20 November 2021; pp. 1–5. [Google Scholar] [CrossRef]
- Fu, X.; Bai, J.; Sun, H.; Zhang, Y. Optimizing Agro-Energy-Environment Synergy in Agricultural Microgrids Through Carbon Accounting. IEEE Trans. Smart Grid 2024, 15, 4819–4834. [Google Scholar] [CrossRef]
- Molu, R.J.J.; Naoussi, S.R.D.; Wira, P.; Mbasso, W.F.; Kenfack, S.T.; Das, B.K.; Ali, E.; Alshareef, M.J.; Ghoneim, S.S.M. Optimizing Technical and Economic Aspects of Off-Grid Hybrid Renewable Systems: A Case Study of Manoka Island, Cameroon. IEEE Access 2023, 11, 130909–130930. [Google Scholar] [CrossRef]
- Jongudomkarn, J.; Khunkitti, P.; Siritaratiwat, A. Adaptive Virtual Inertia Control for Combined Heat Pump and Biogas Engine Generator System: An alternative solution for Grid-level energy storage. IEEE Access 2024, 12, 188707–188722. [Google Scholar] [CrossRef]
- Reddy, G.H.; Bhattacharya, D.; Bisht, P.S.; Kulshreshtha, A.; Gunaga, S.R.; Mathur, N. Frequency Control of a Solar/Wind/Fuel Cell/Biogas/Biodiesel/Flywheel/Battery Storage based Microgrid under Dynamic Conditions. In Proceedings of the 2024 International Conference on Healthcare Innovations, Software and Engineering Technologies (HISET), Karad, India, 18–19 January 2024; pp. 350–355. [Google Scholar] [CrossRef]
- Hoang, K.D.; Amamra, S.-A.; Schofield, N. Modelling and control development for a hybrid microgrid system. IET Conf. Proc. 2024, 2024, 518–523. [Google Scholar] [CrossRef]
- Verma, S.; Sharma, A.; Bajpai, P. Load Restoration Approach in Biogas Powered Microgrid. In Proceedings of the 2024 IEEE 4th International Conference on Sustainable Energy and Future Electric Transportation (SEFET), Hyderabad, India, 31 July–3 August 2024; pp. 1–6. [Google Scholar] [CrossRef]
- Mondal, S.; Sil, A.K. Short Circuit Fault Analysis of Photovoltaic and Biomass Based Grid Connected Microgrid System. In Proceedings of the 2023 IEEE 3rd Applied Signal Processing Conference (ASPCON), Haldia, India, 24–25 November 2023; pp. 192–196. [Google Scholar] [CrossRef]
- Singh, P.N.; Ranjan, R.; Karanki, S.B. Stabilization of DC Bus Voltage of an Isolated DC Microgrid. In Proceedings of the 2023 IEEE 8th Southern Power Electronics Conference and 17th Brazilian Power Electronics Conference (SPEC/COBEP), Florianopolis, Brazil, 26–29 November 2023; pp. 1–8. [Google Scholar] [CrossRef]
- Sedhom, B.E.; El-Saadawi, M.M.; El Moursi, M.S.; Hassan, M.A.; Eladl, A.A. IoT-based optimal demand side management and control scheme for smart microgrid. Int. J. Electr. Power Energy Syst. 2021, 127, 106674. [Google Scholar] [CrossRef]
- Malik, P.; Awasthi, M.; Sinha, S. A techno-economic investigation of grid integrated hybrid renewable energy systems. Sustain. Energy Technol. Assess. 2022, 51, 101976. [Google Scholar] [CrossRef]
- Guo, M.; Liu, G.; Liao, S. Normalized techno-economic index for renewable energy system assessment. Int. J. Electr. Power Energy Syst. 2021, 133, 107262. [Google Scholar] [CrossRef]
- Mohammed, Y.S.; Adetokun, B.B.; Oghorada, O.; Oshiga, O. Techno-economic optimization of standalone hybrid power systems in context of intelligent computational multi-objective algorithms. Energy Rep. 2022, 8, 11661–11674. [Google Scholar] [CrossRef]
- Suresh, V.; Kiranmayi, R. Modelling and optimization of an off-grid hybrid renewable energy system for electrification in a rural areas. Energy Rep. 2020, 6, 594–604. [Google Scholar] [CrossRef]
- Mokhtara, C.; Negrou, B.; Settou, N.; Settou, B.; Samy, M.M. Design optimization of off-grid Hybrid Renewable Energy Systems considering the effects of building energy performance and climate change: Case study of Algeria. Energy 2021, 219, 119605. [Google Scholar] [CrossRef]
- Mojumder, M.R.H.; Antara, F.A.; Hasanuzzaman, M.; Alamri, B.; Alsharef, M. Electric Vehicle-to-Grid (V2G) Technologies: Impact on the Power Grid and Battery. Sustainability 2022, 14, 13856. [Google Scholar] [CrossRef]
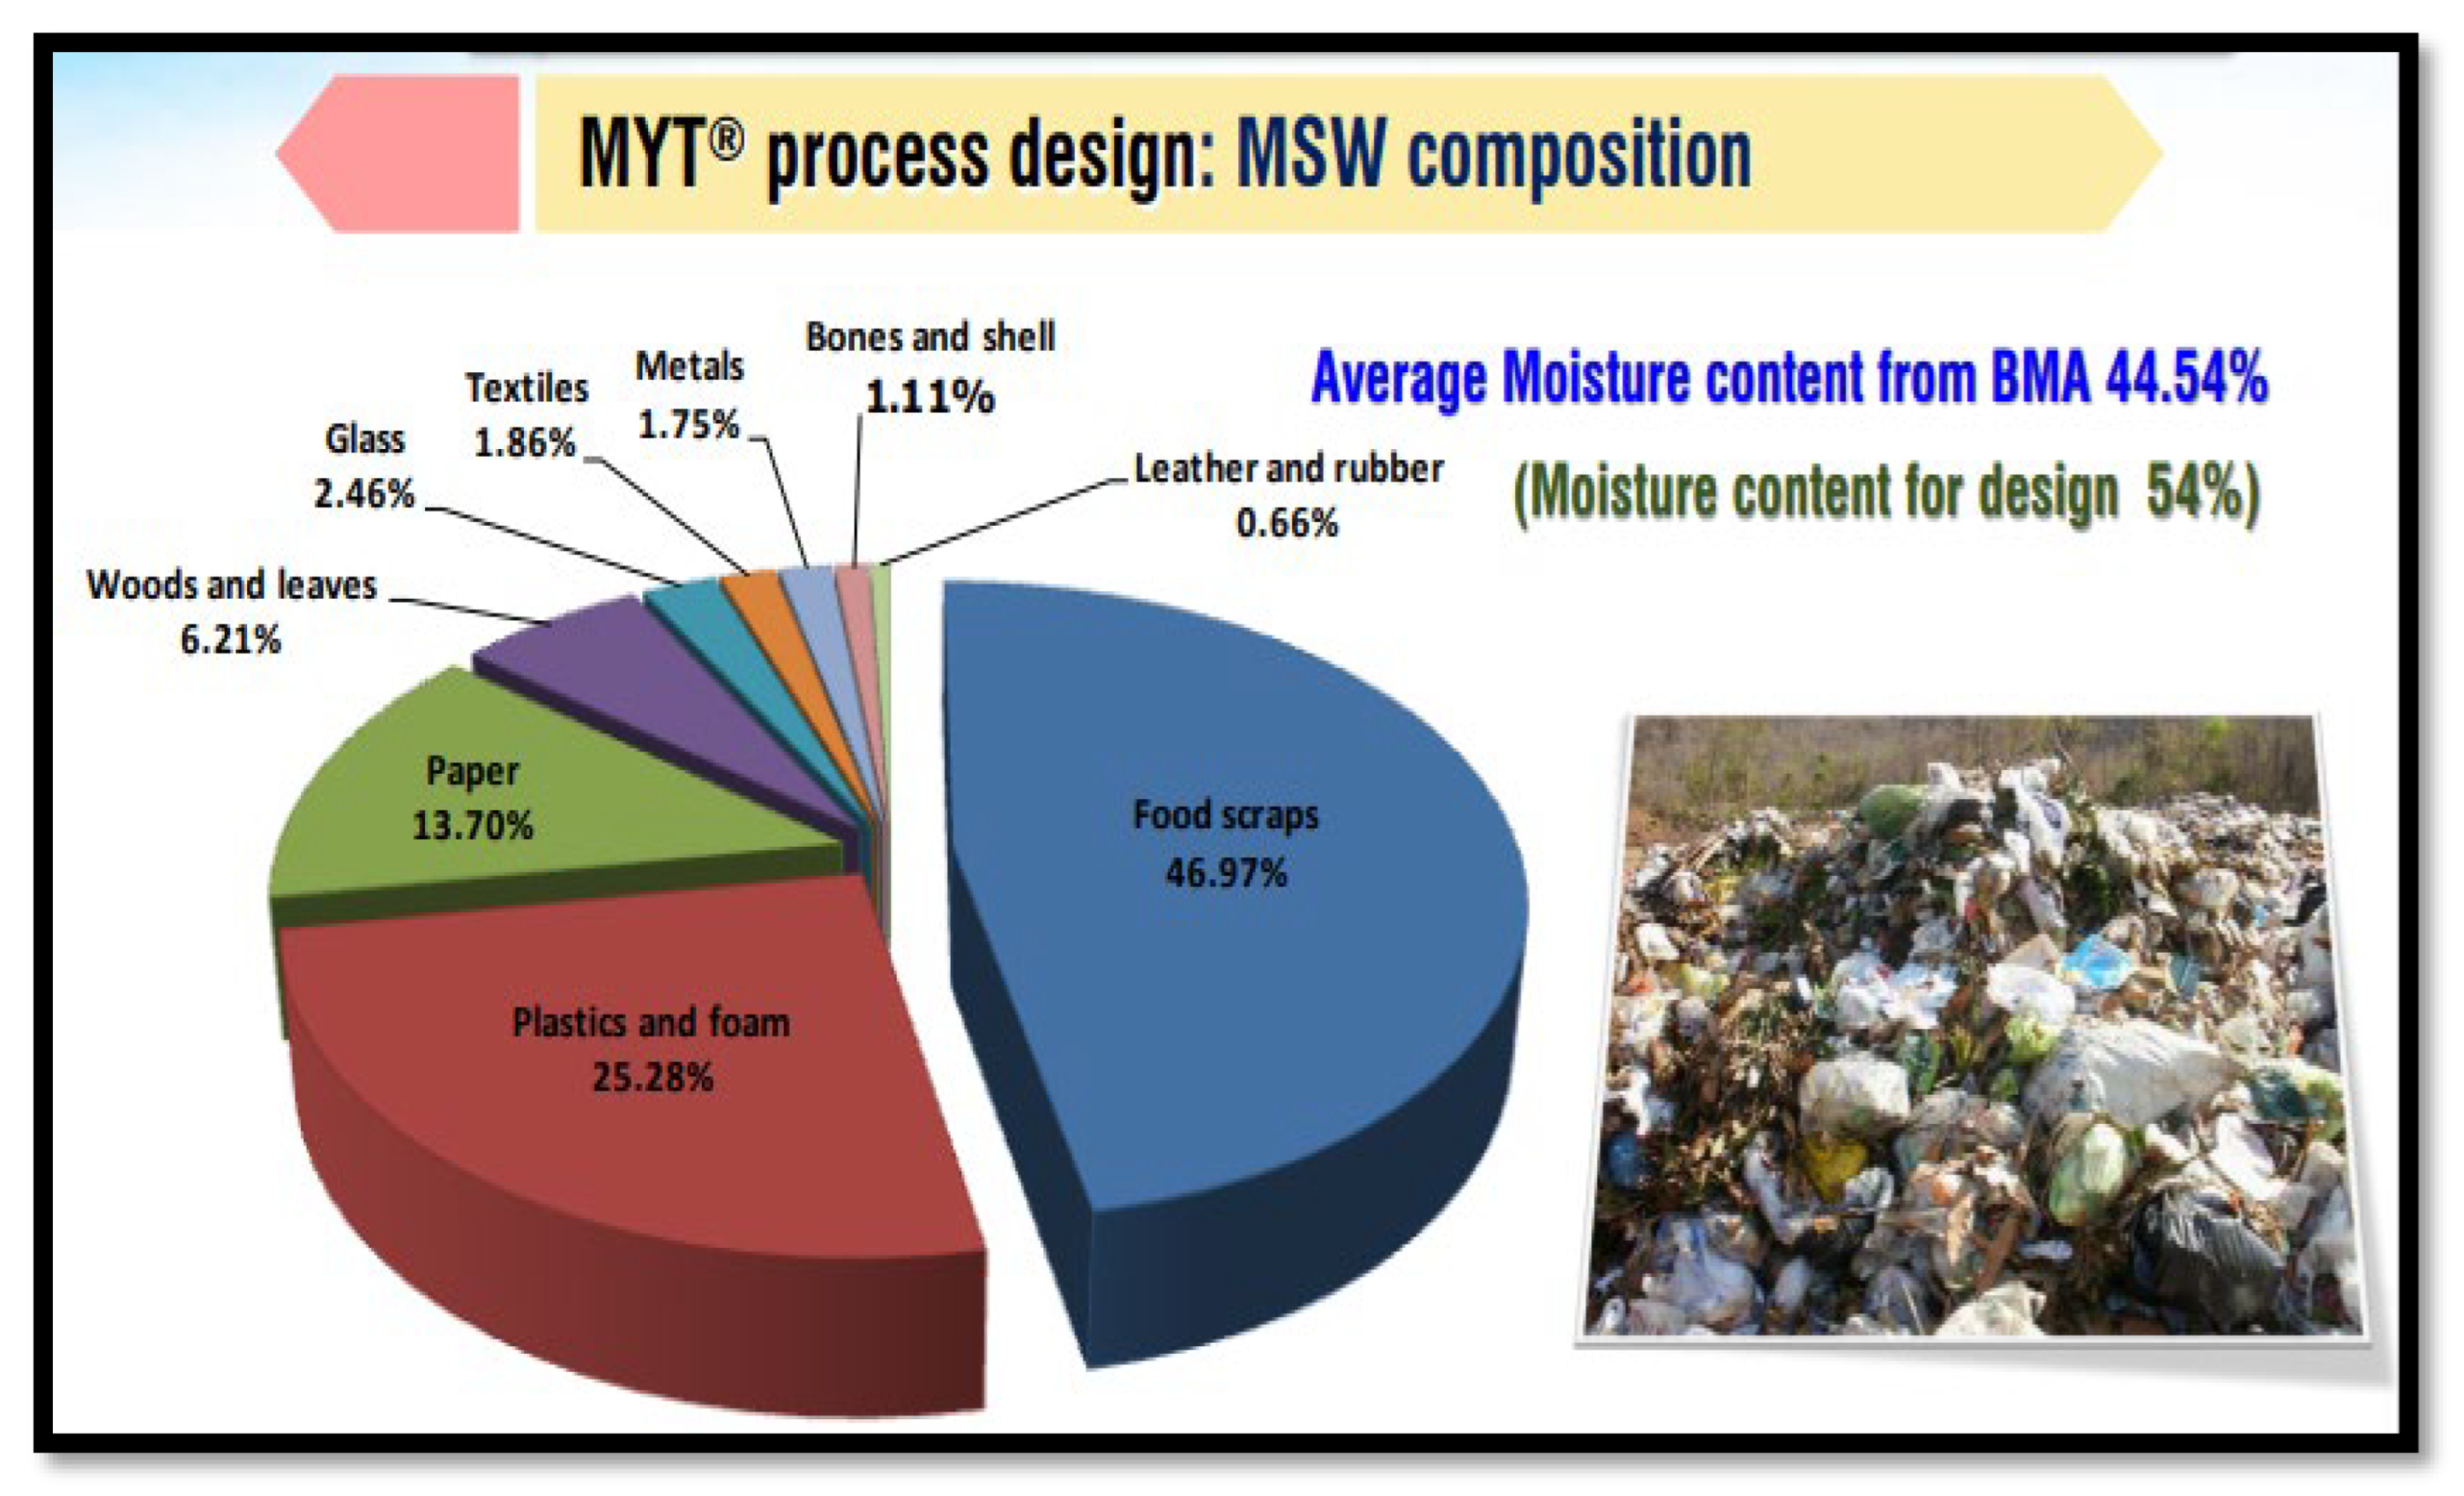


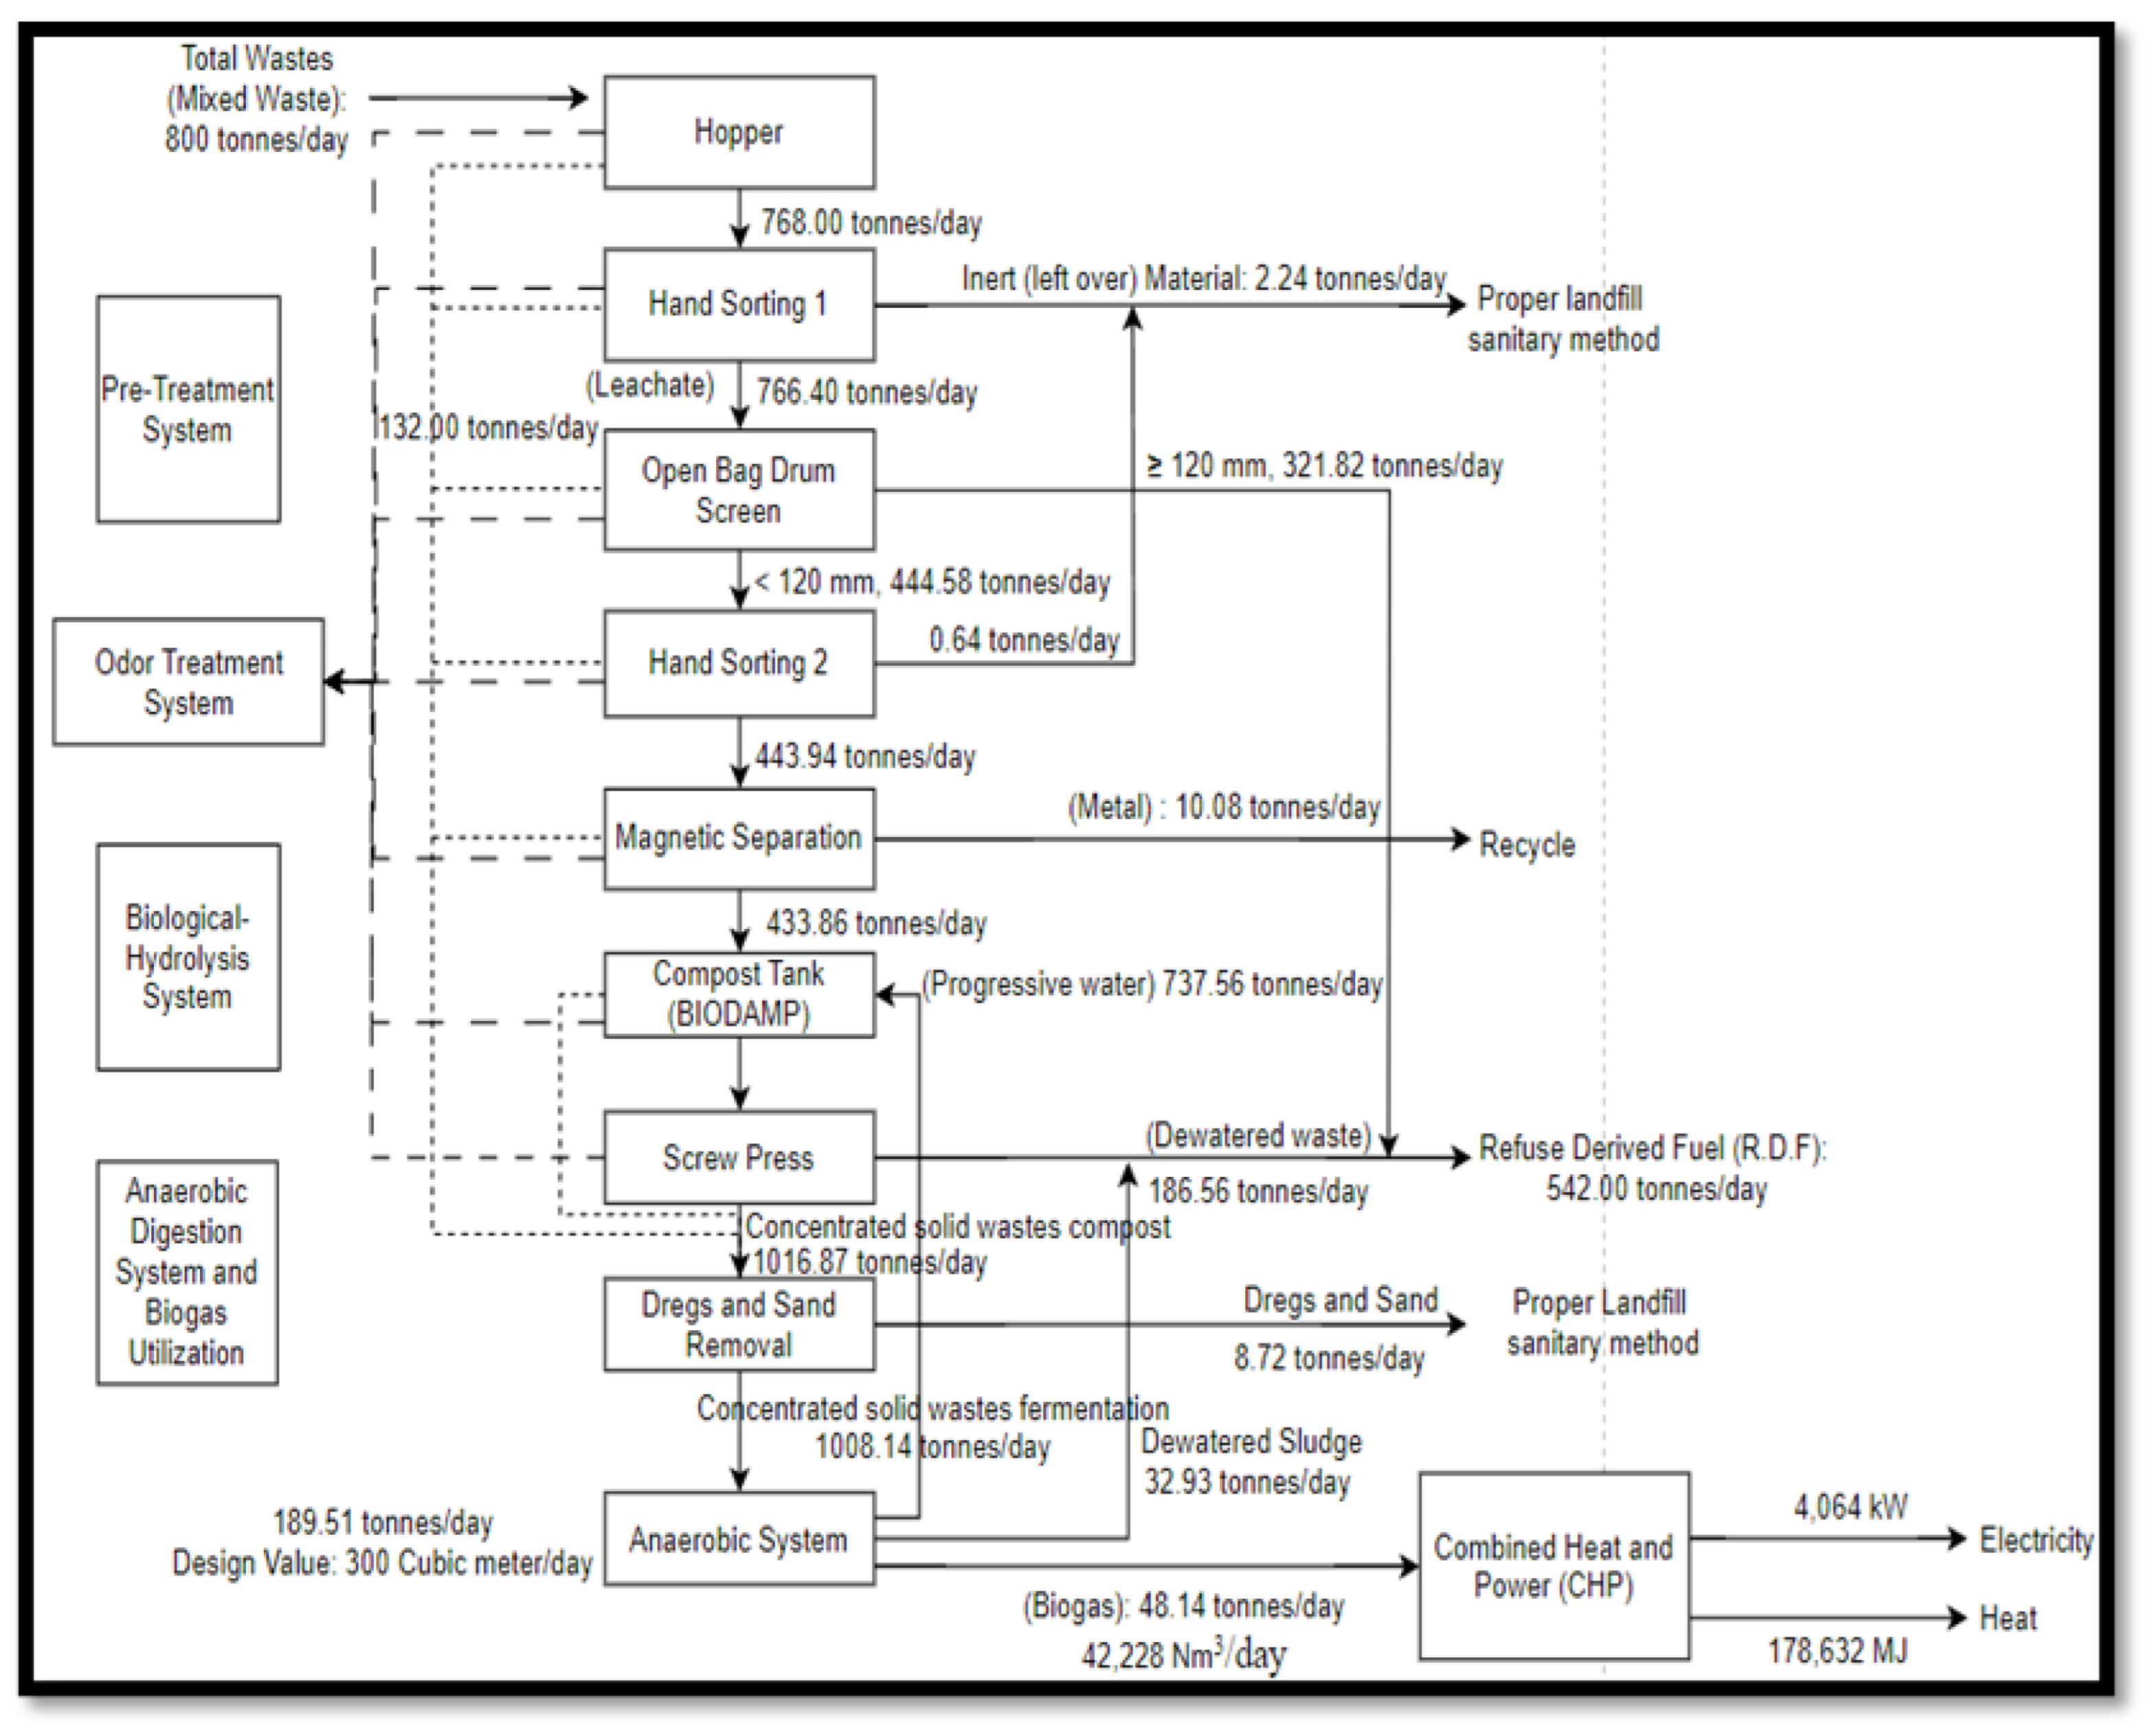
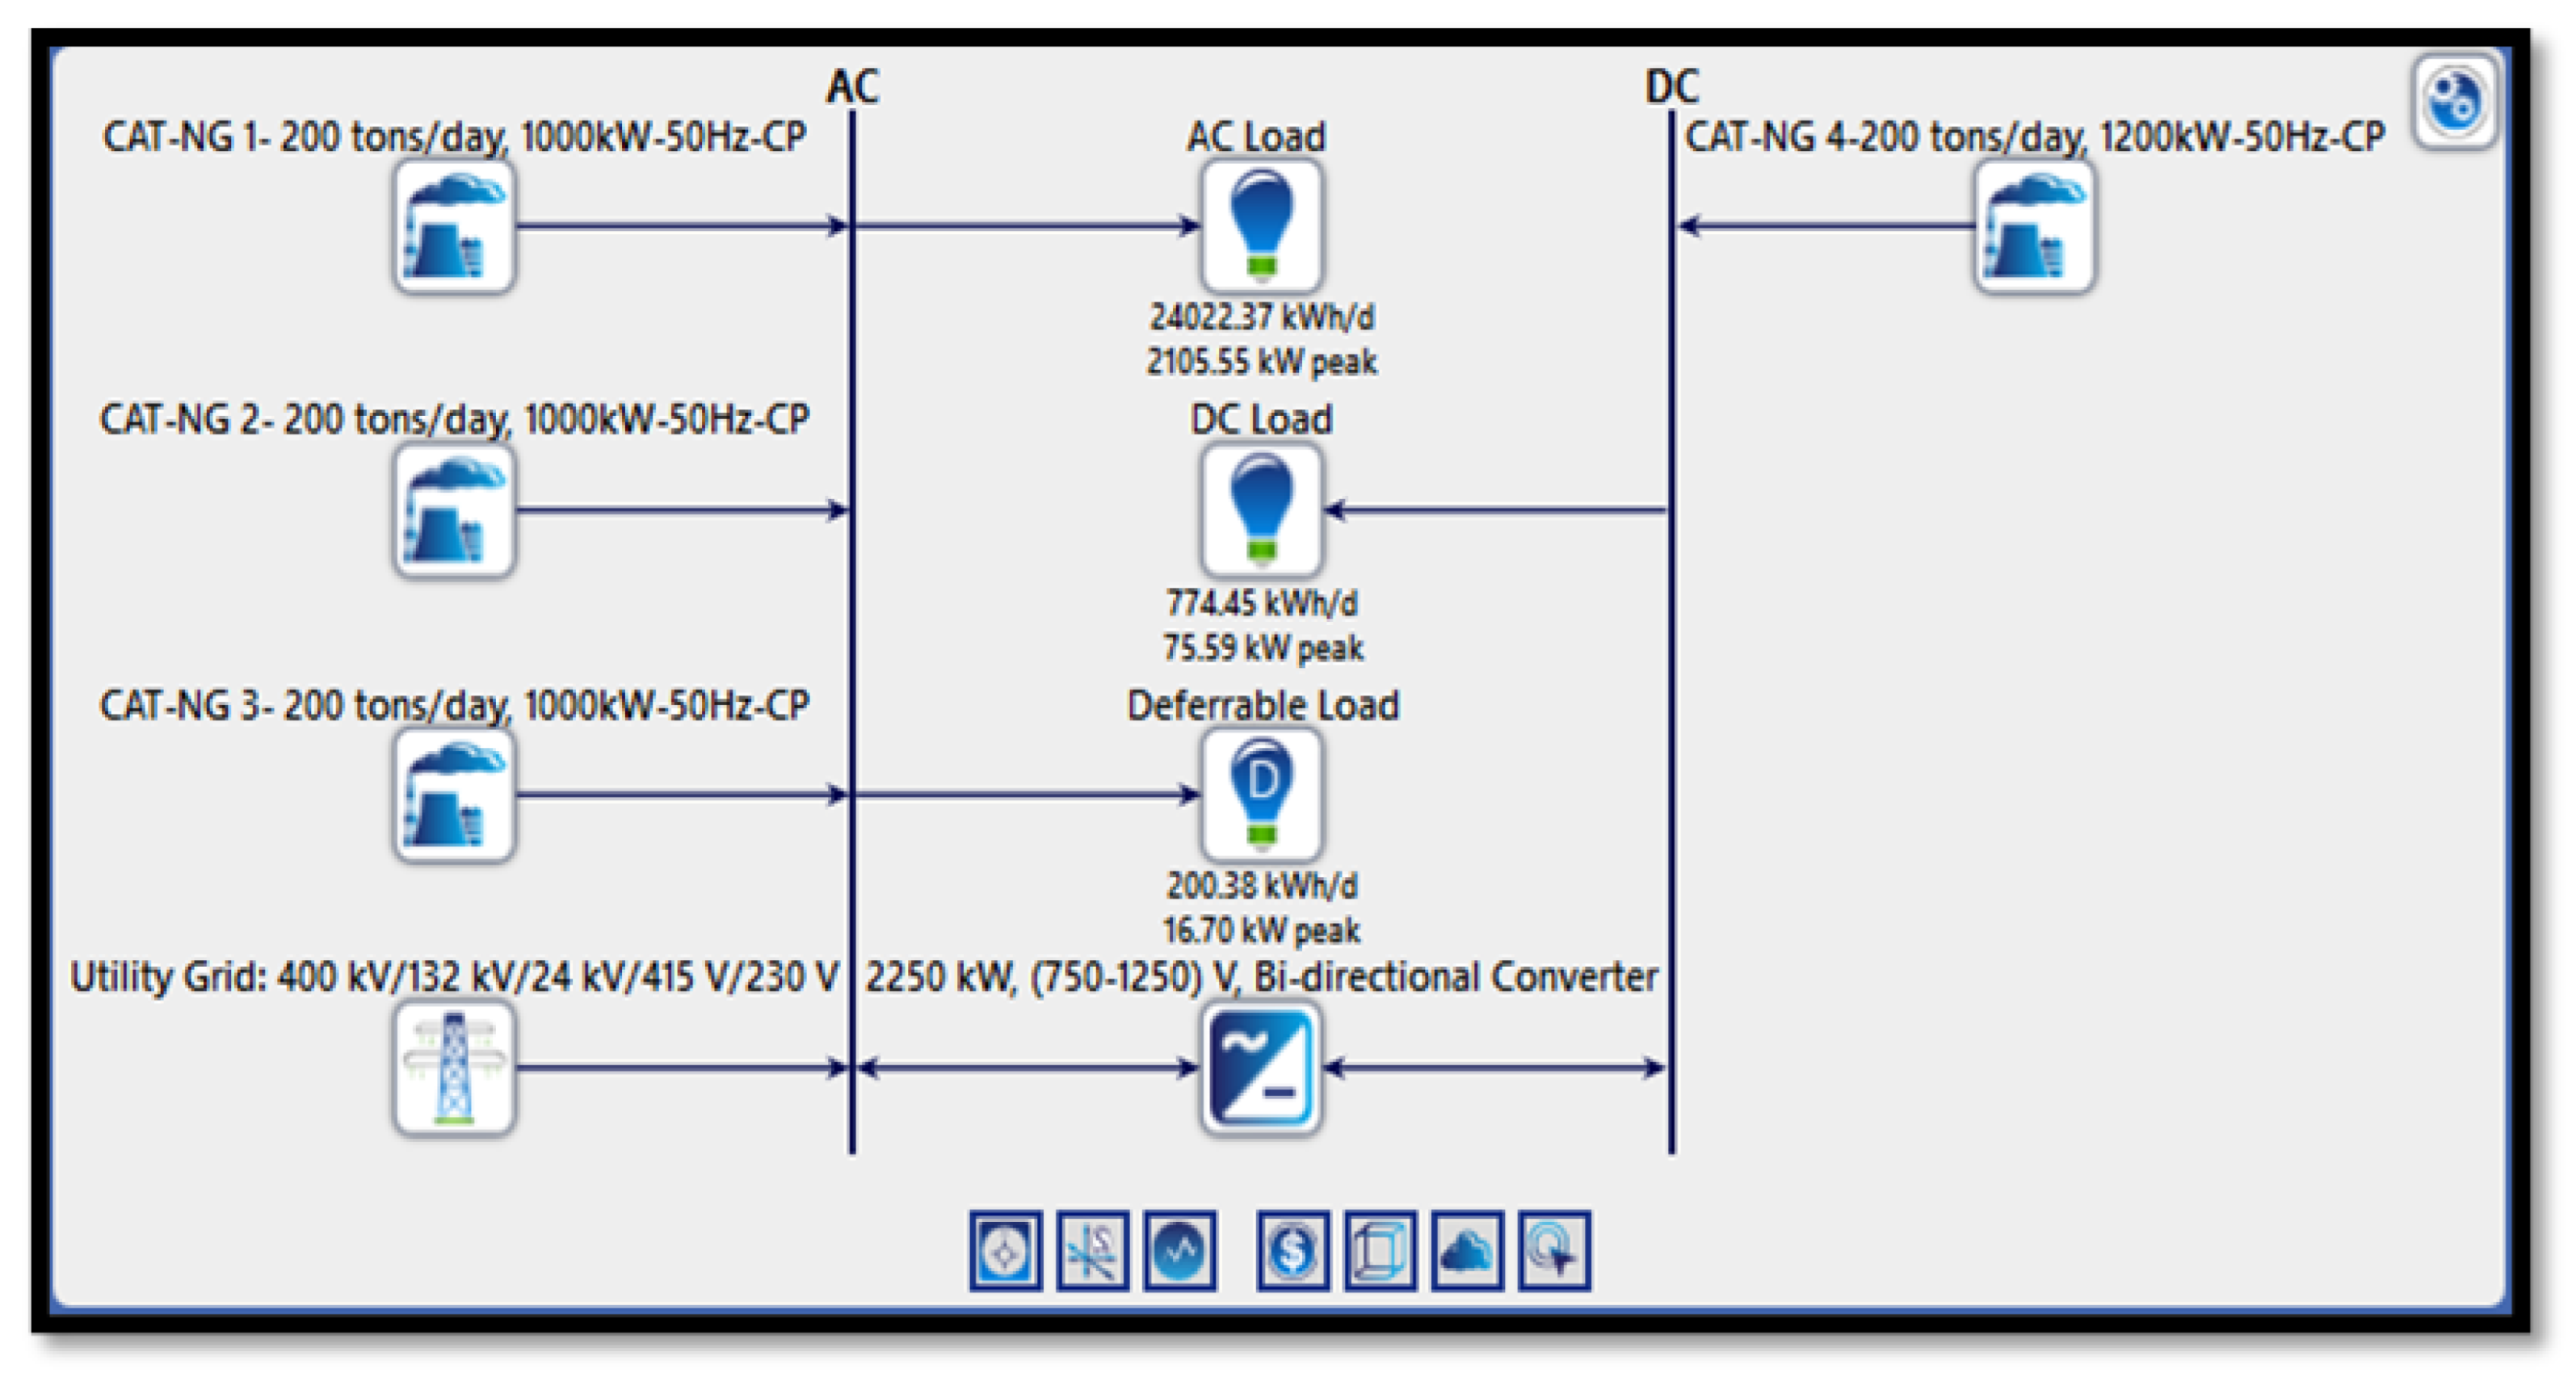

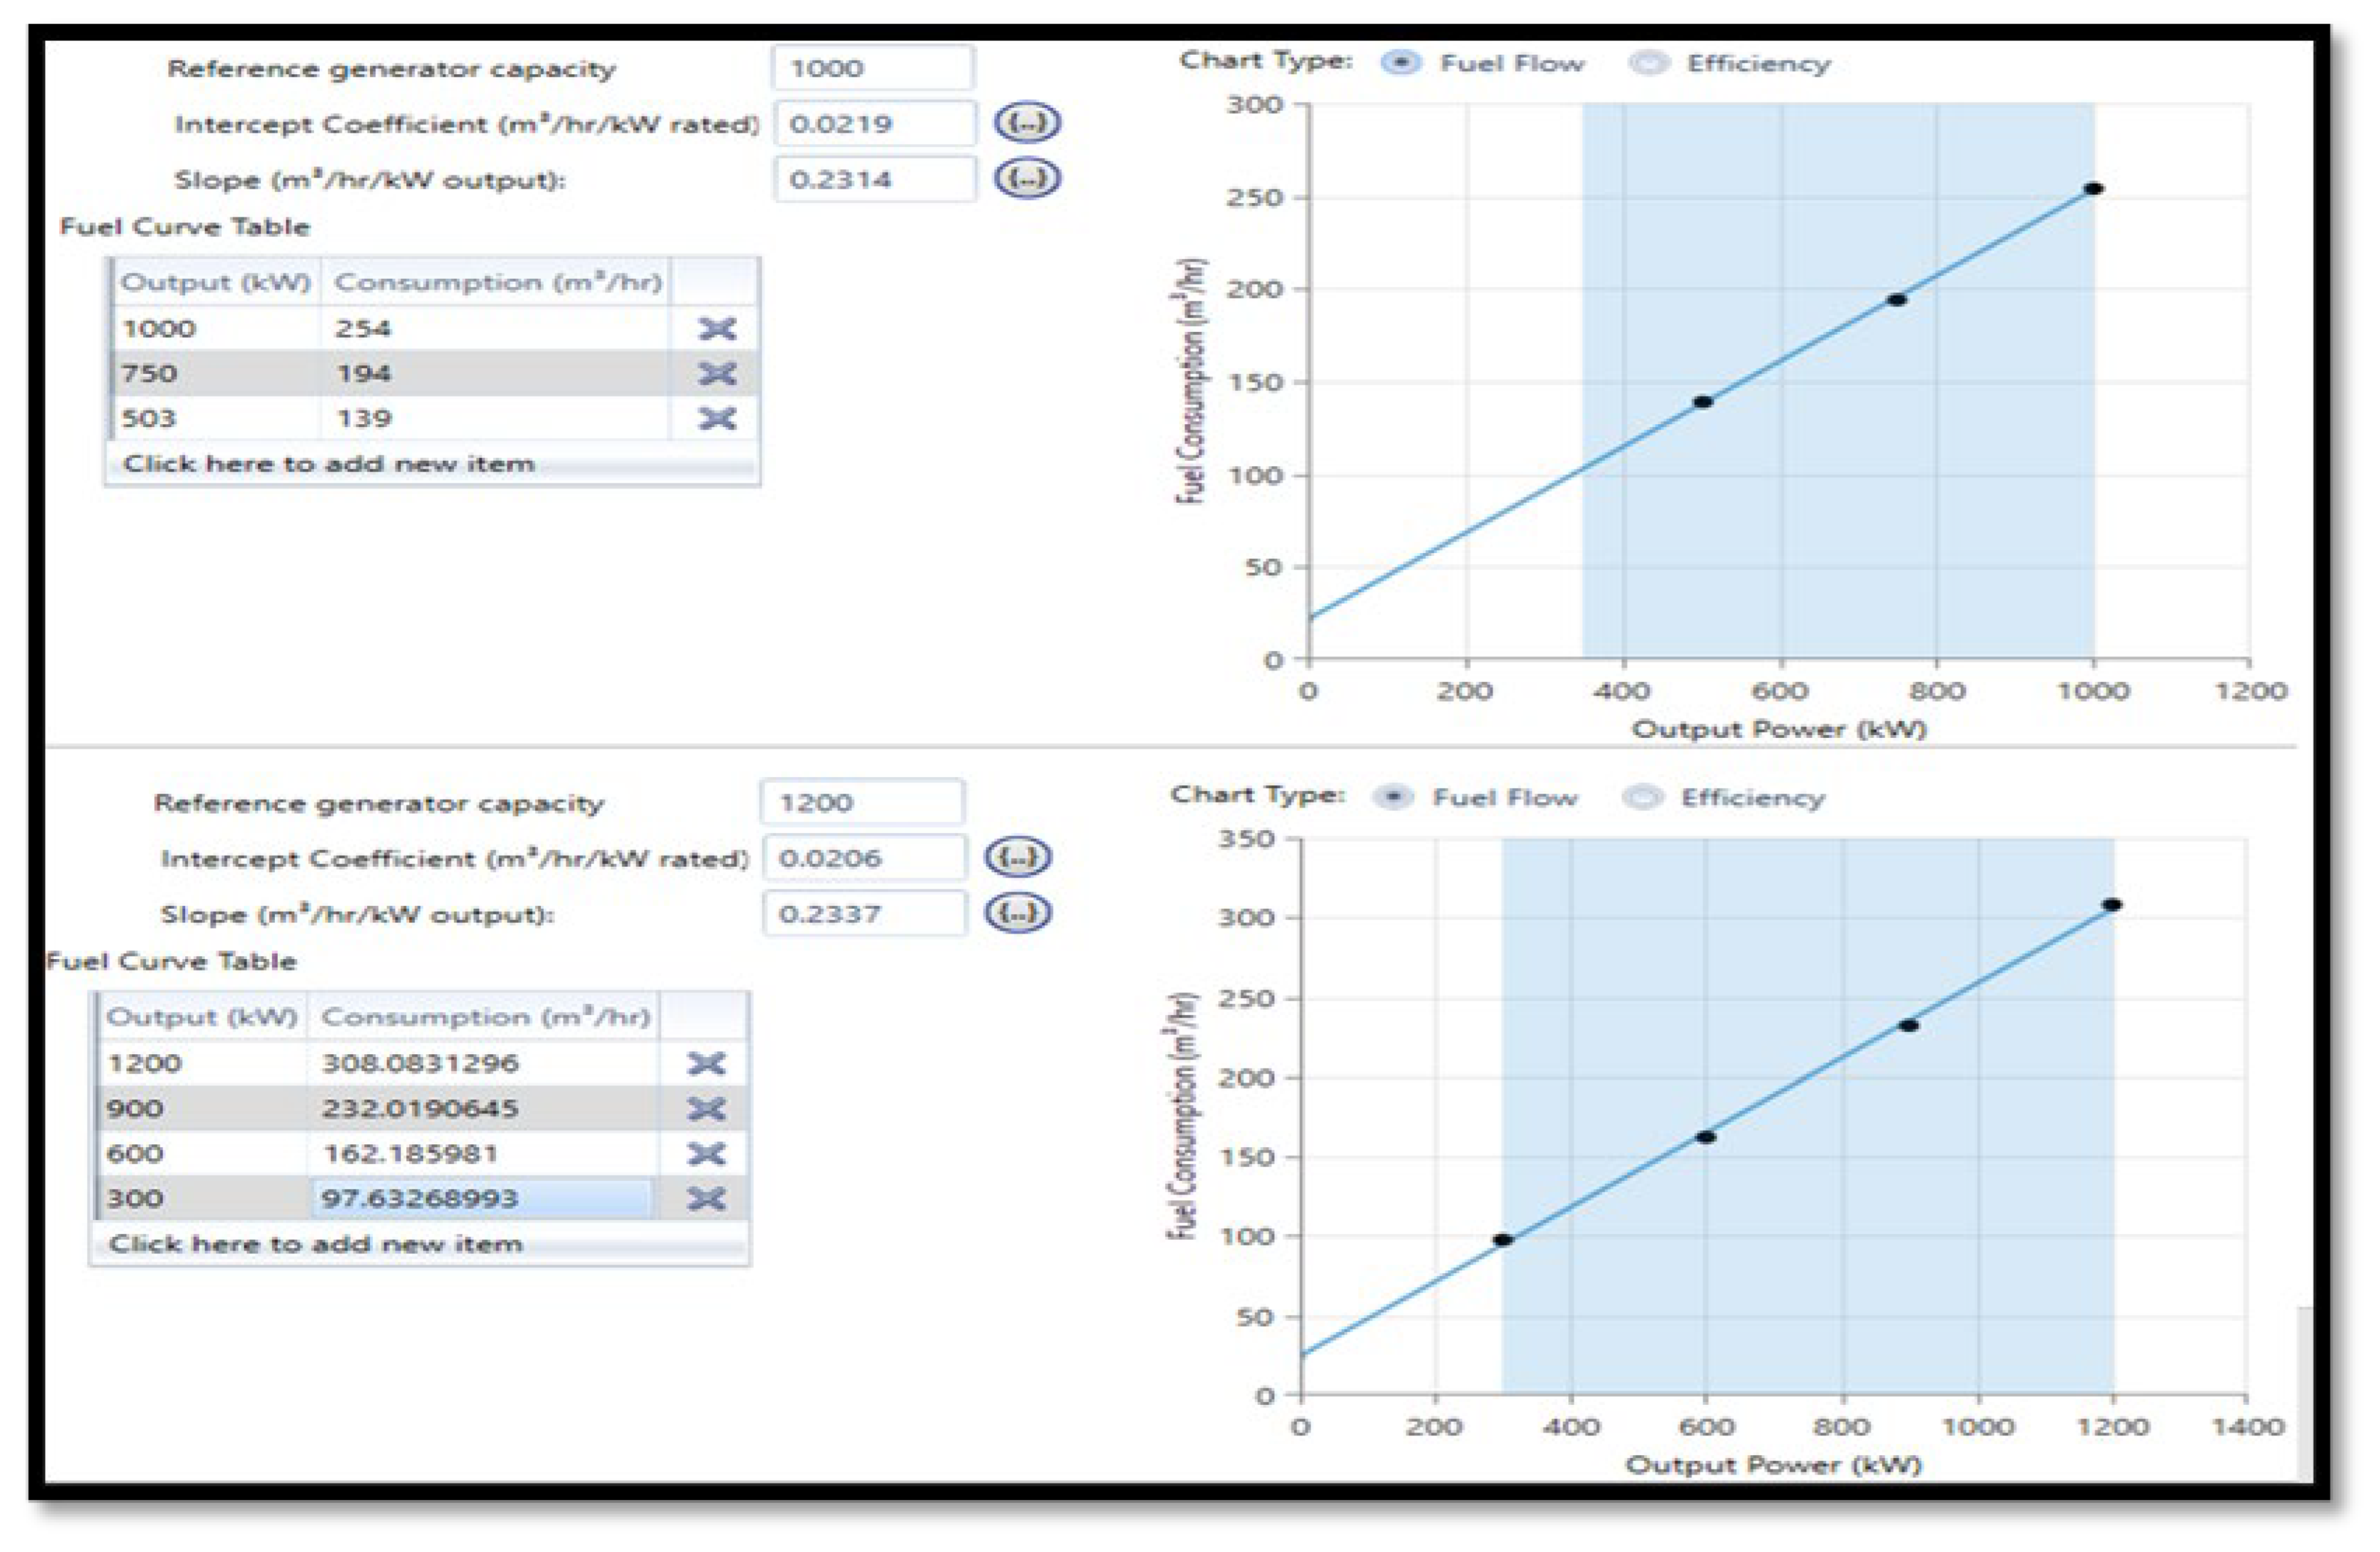

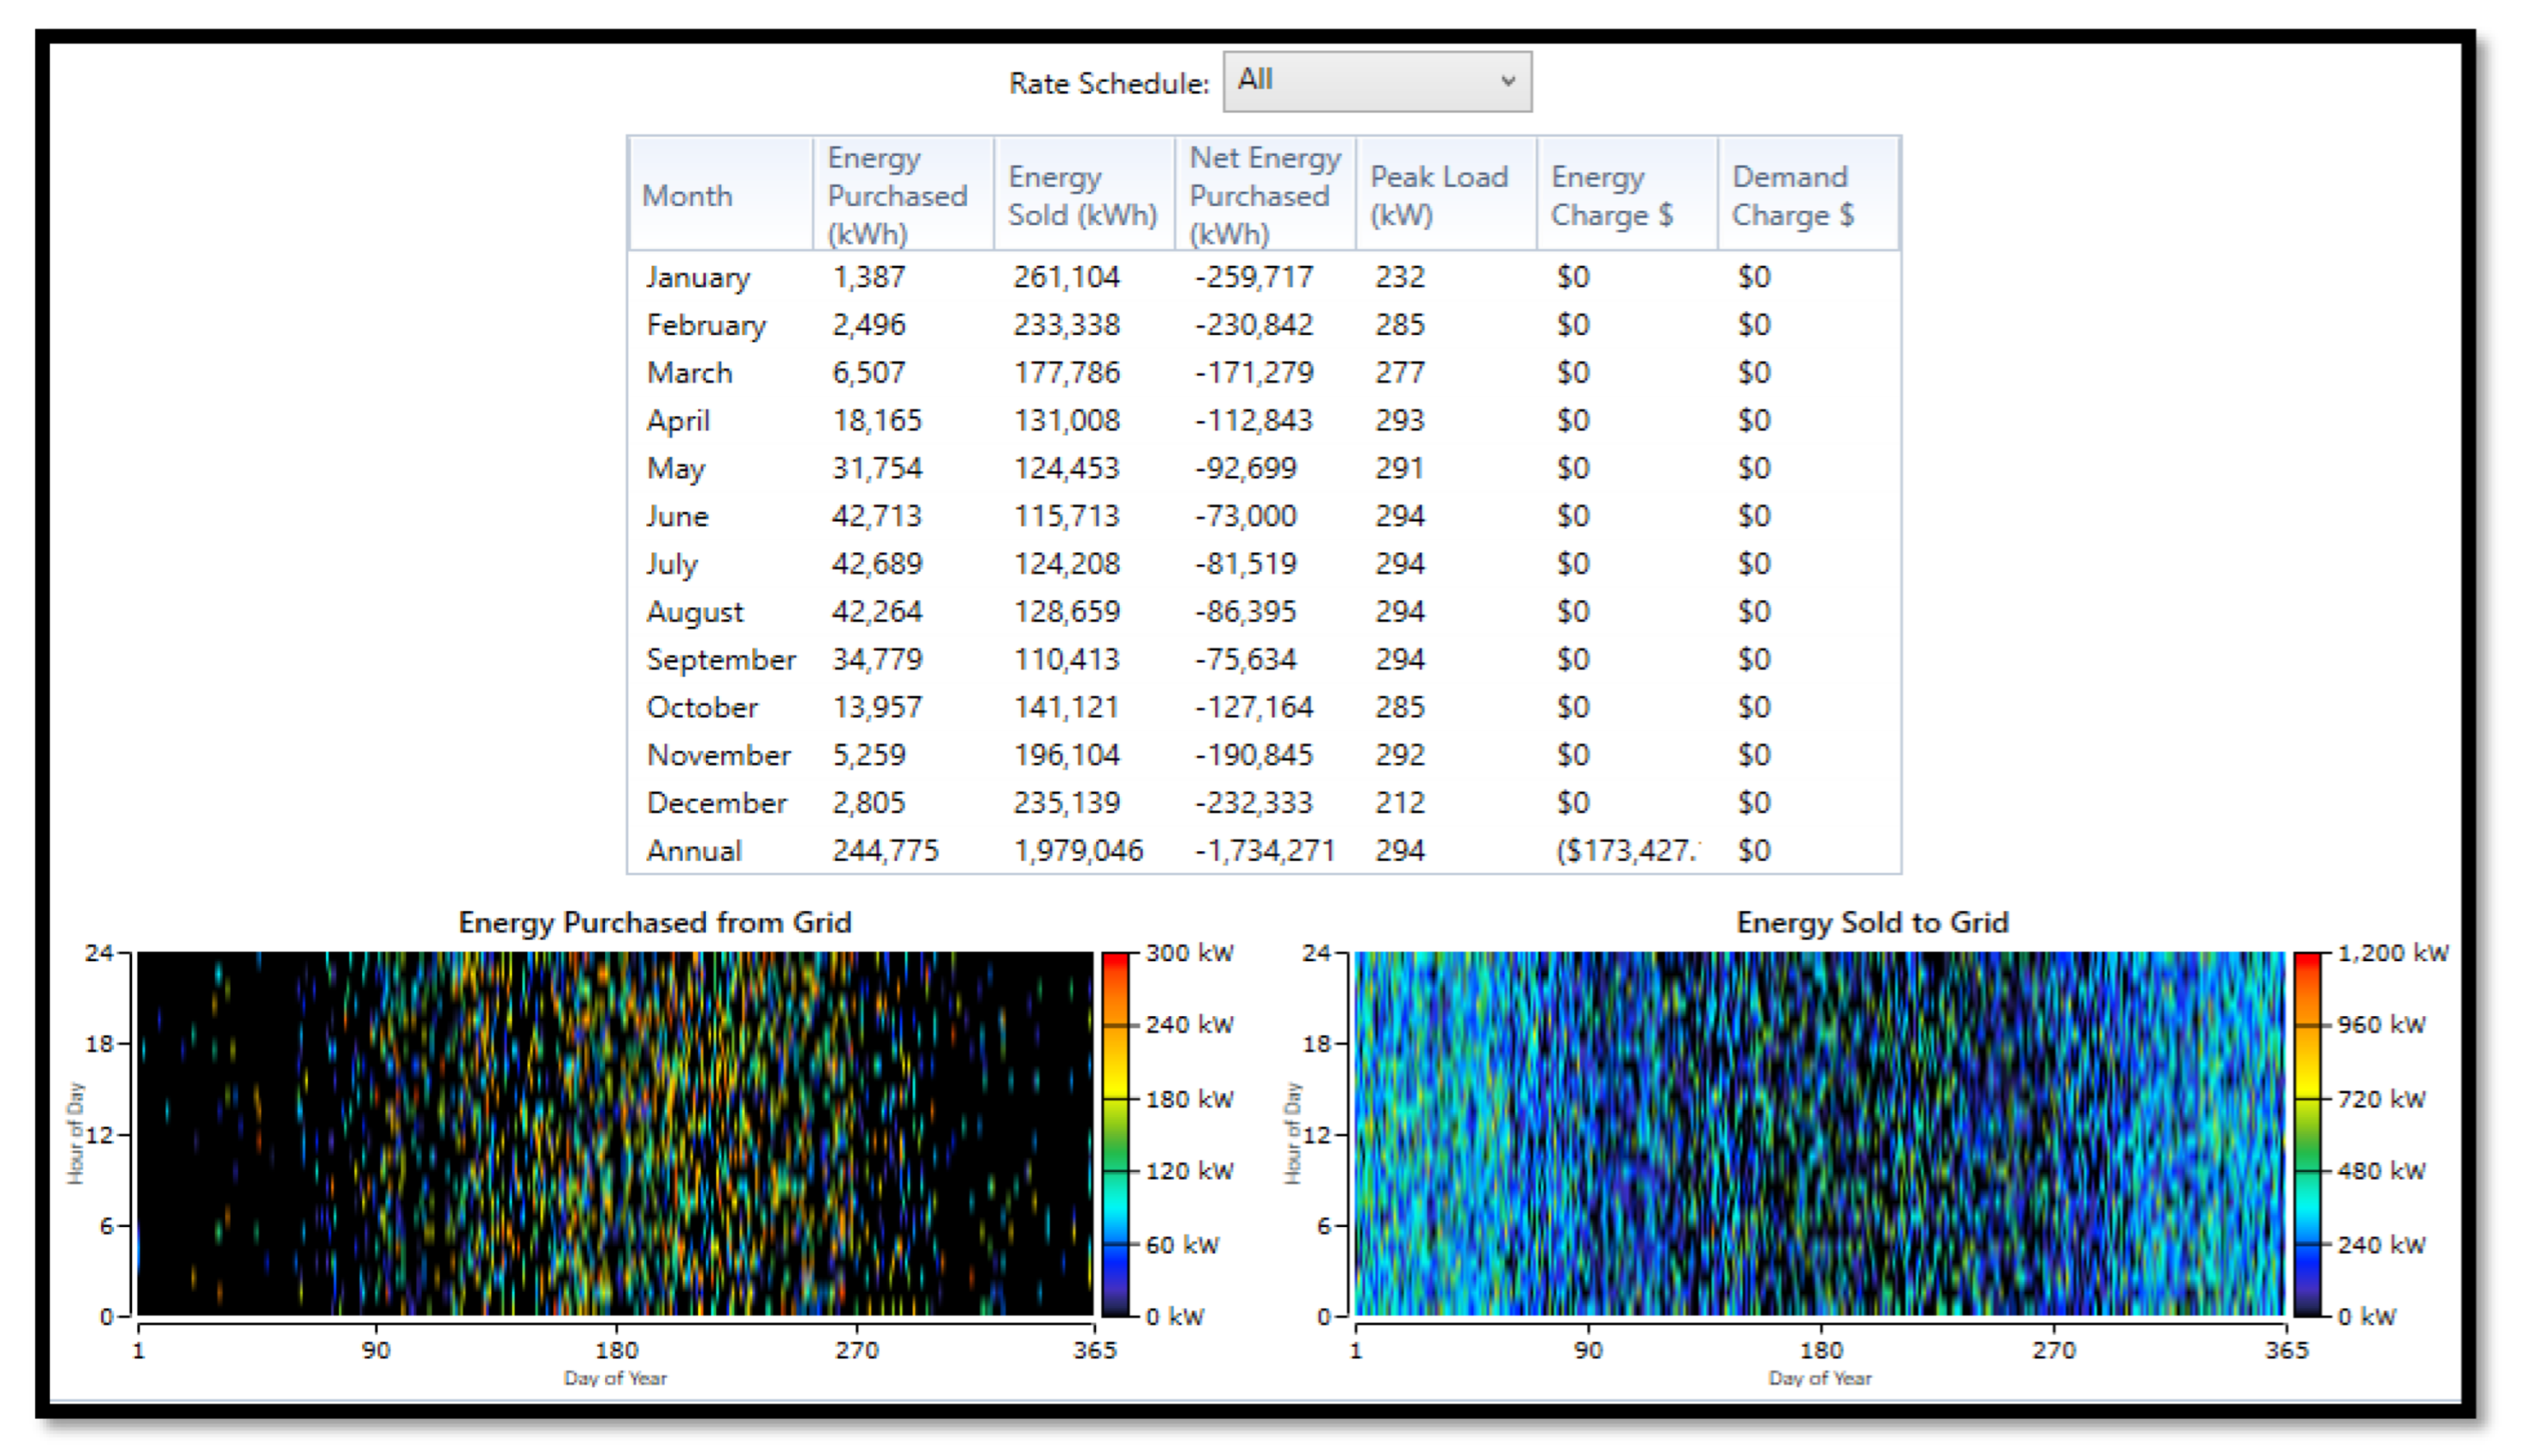
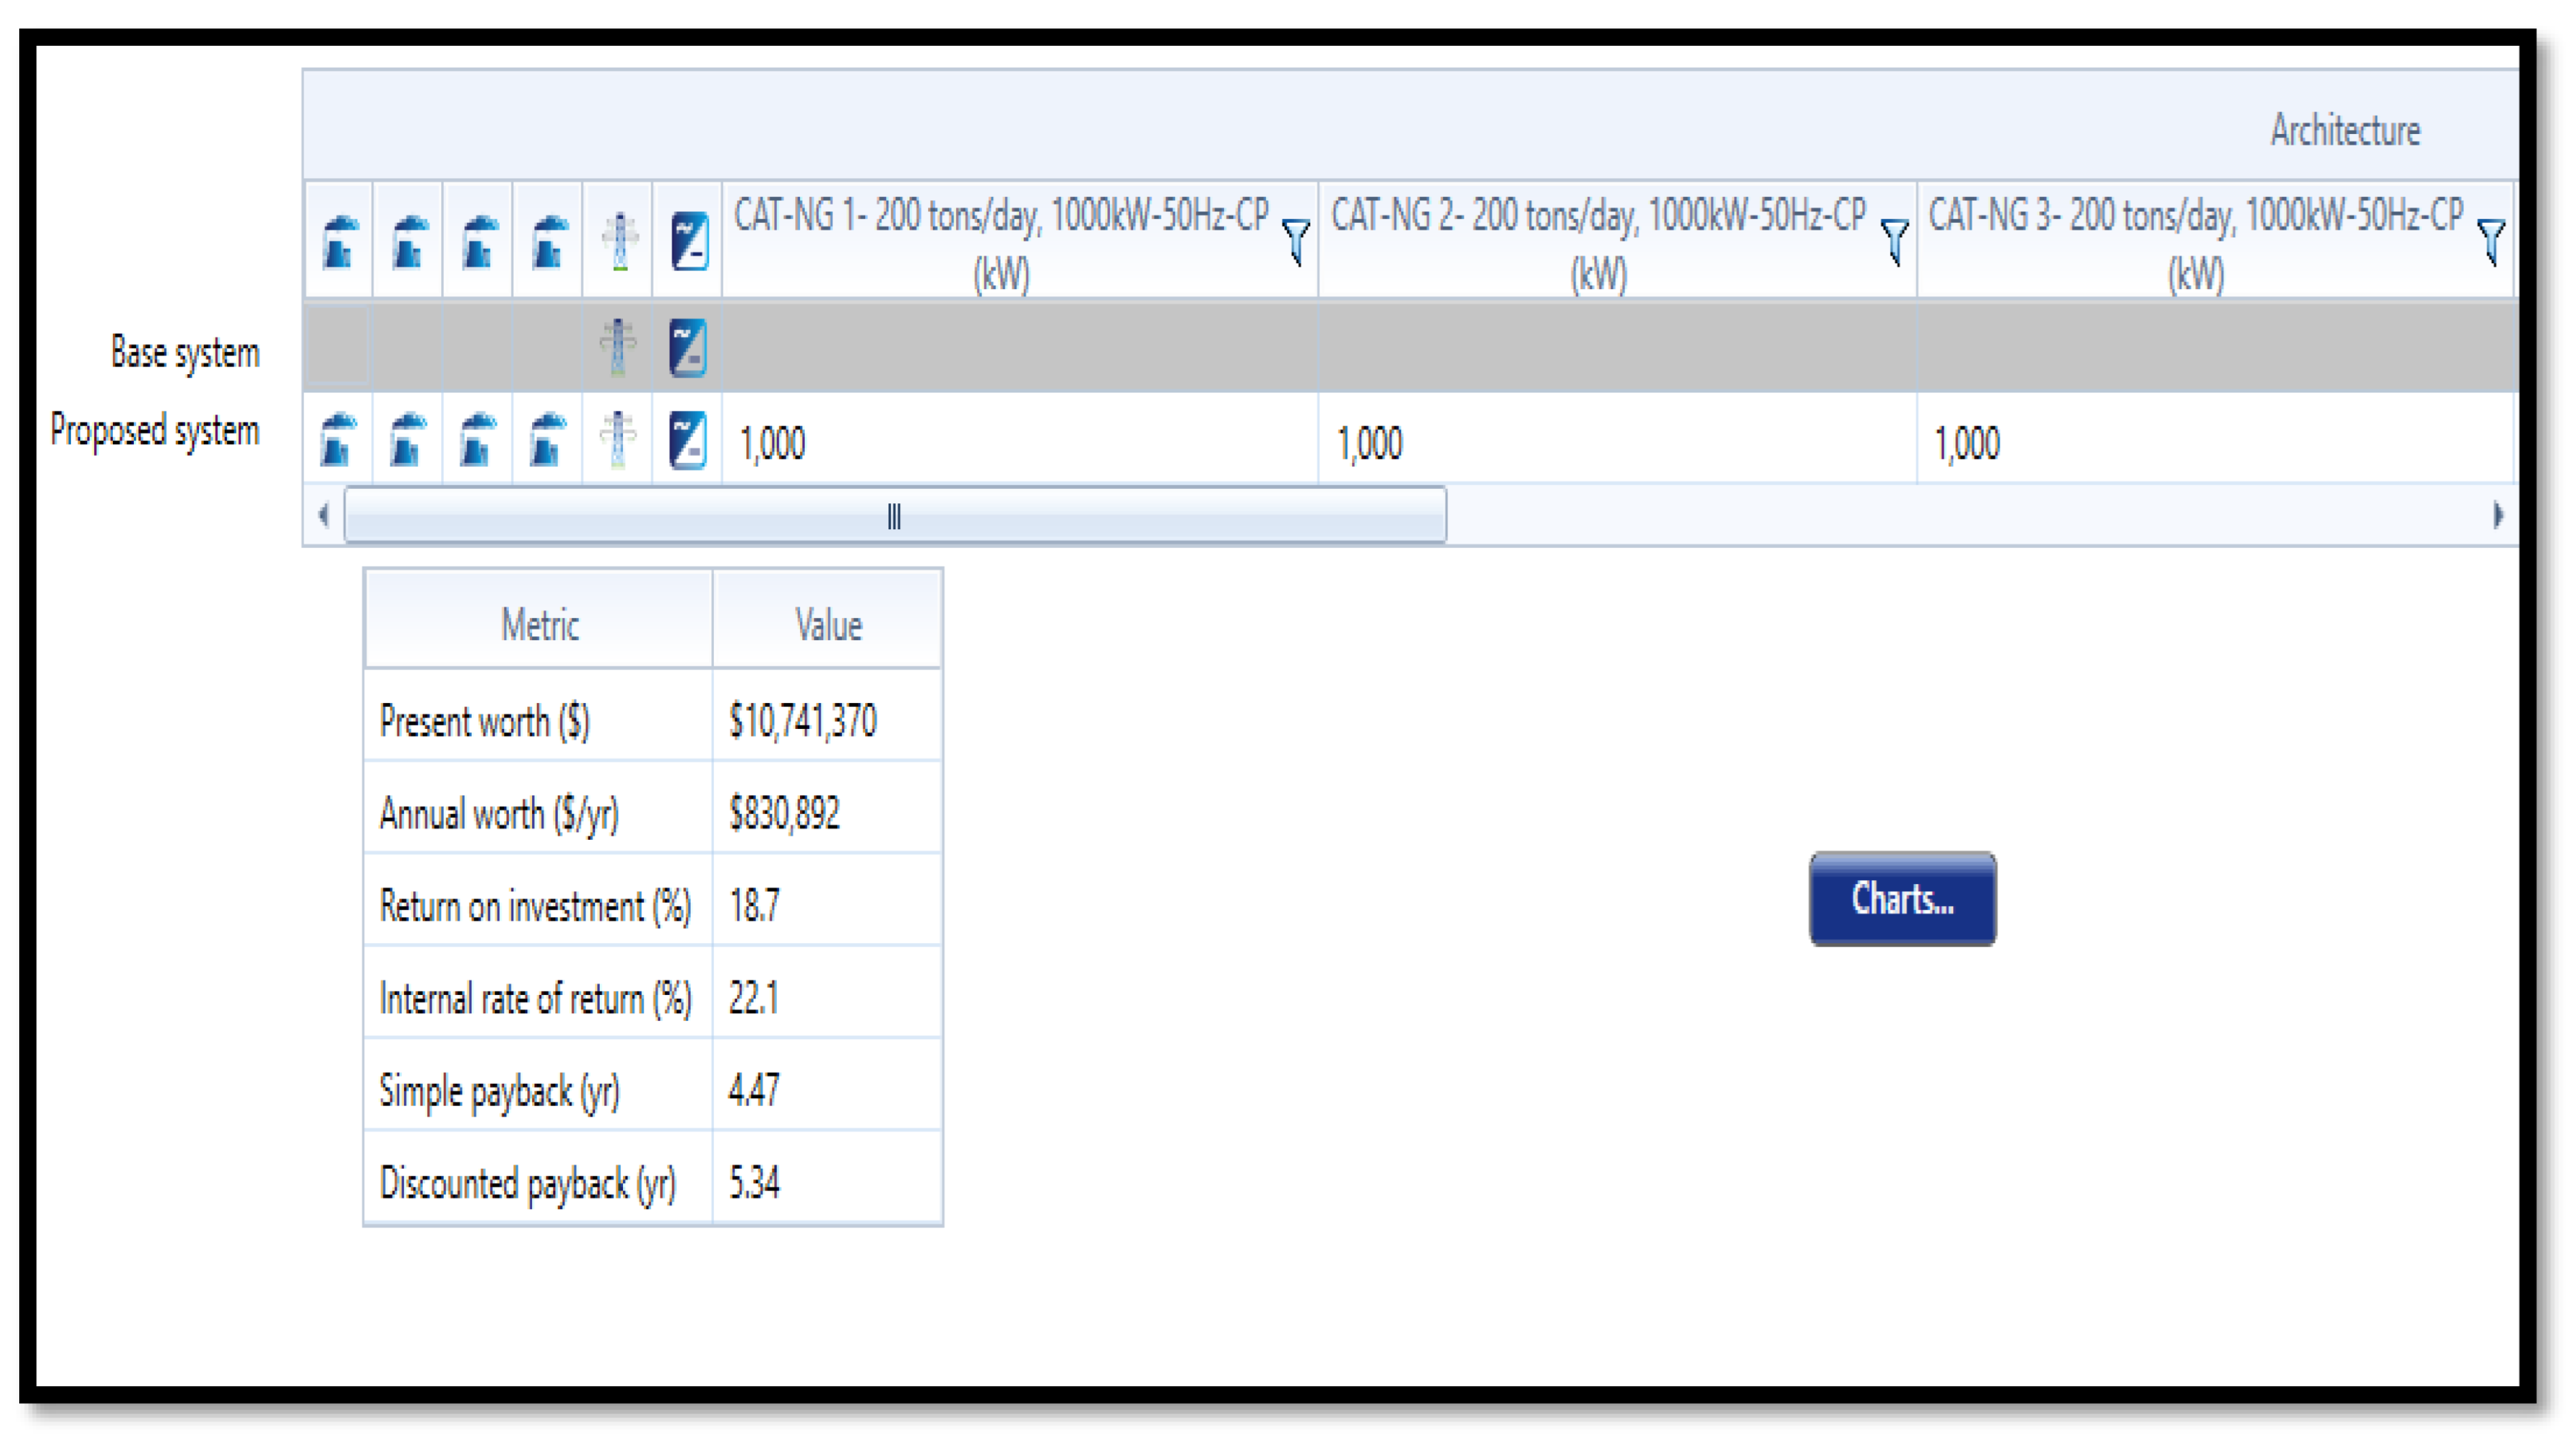

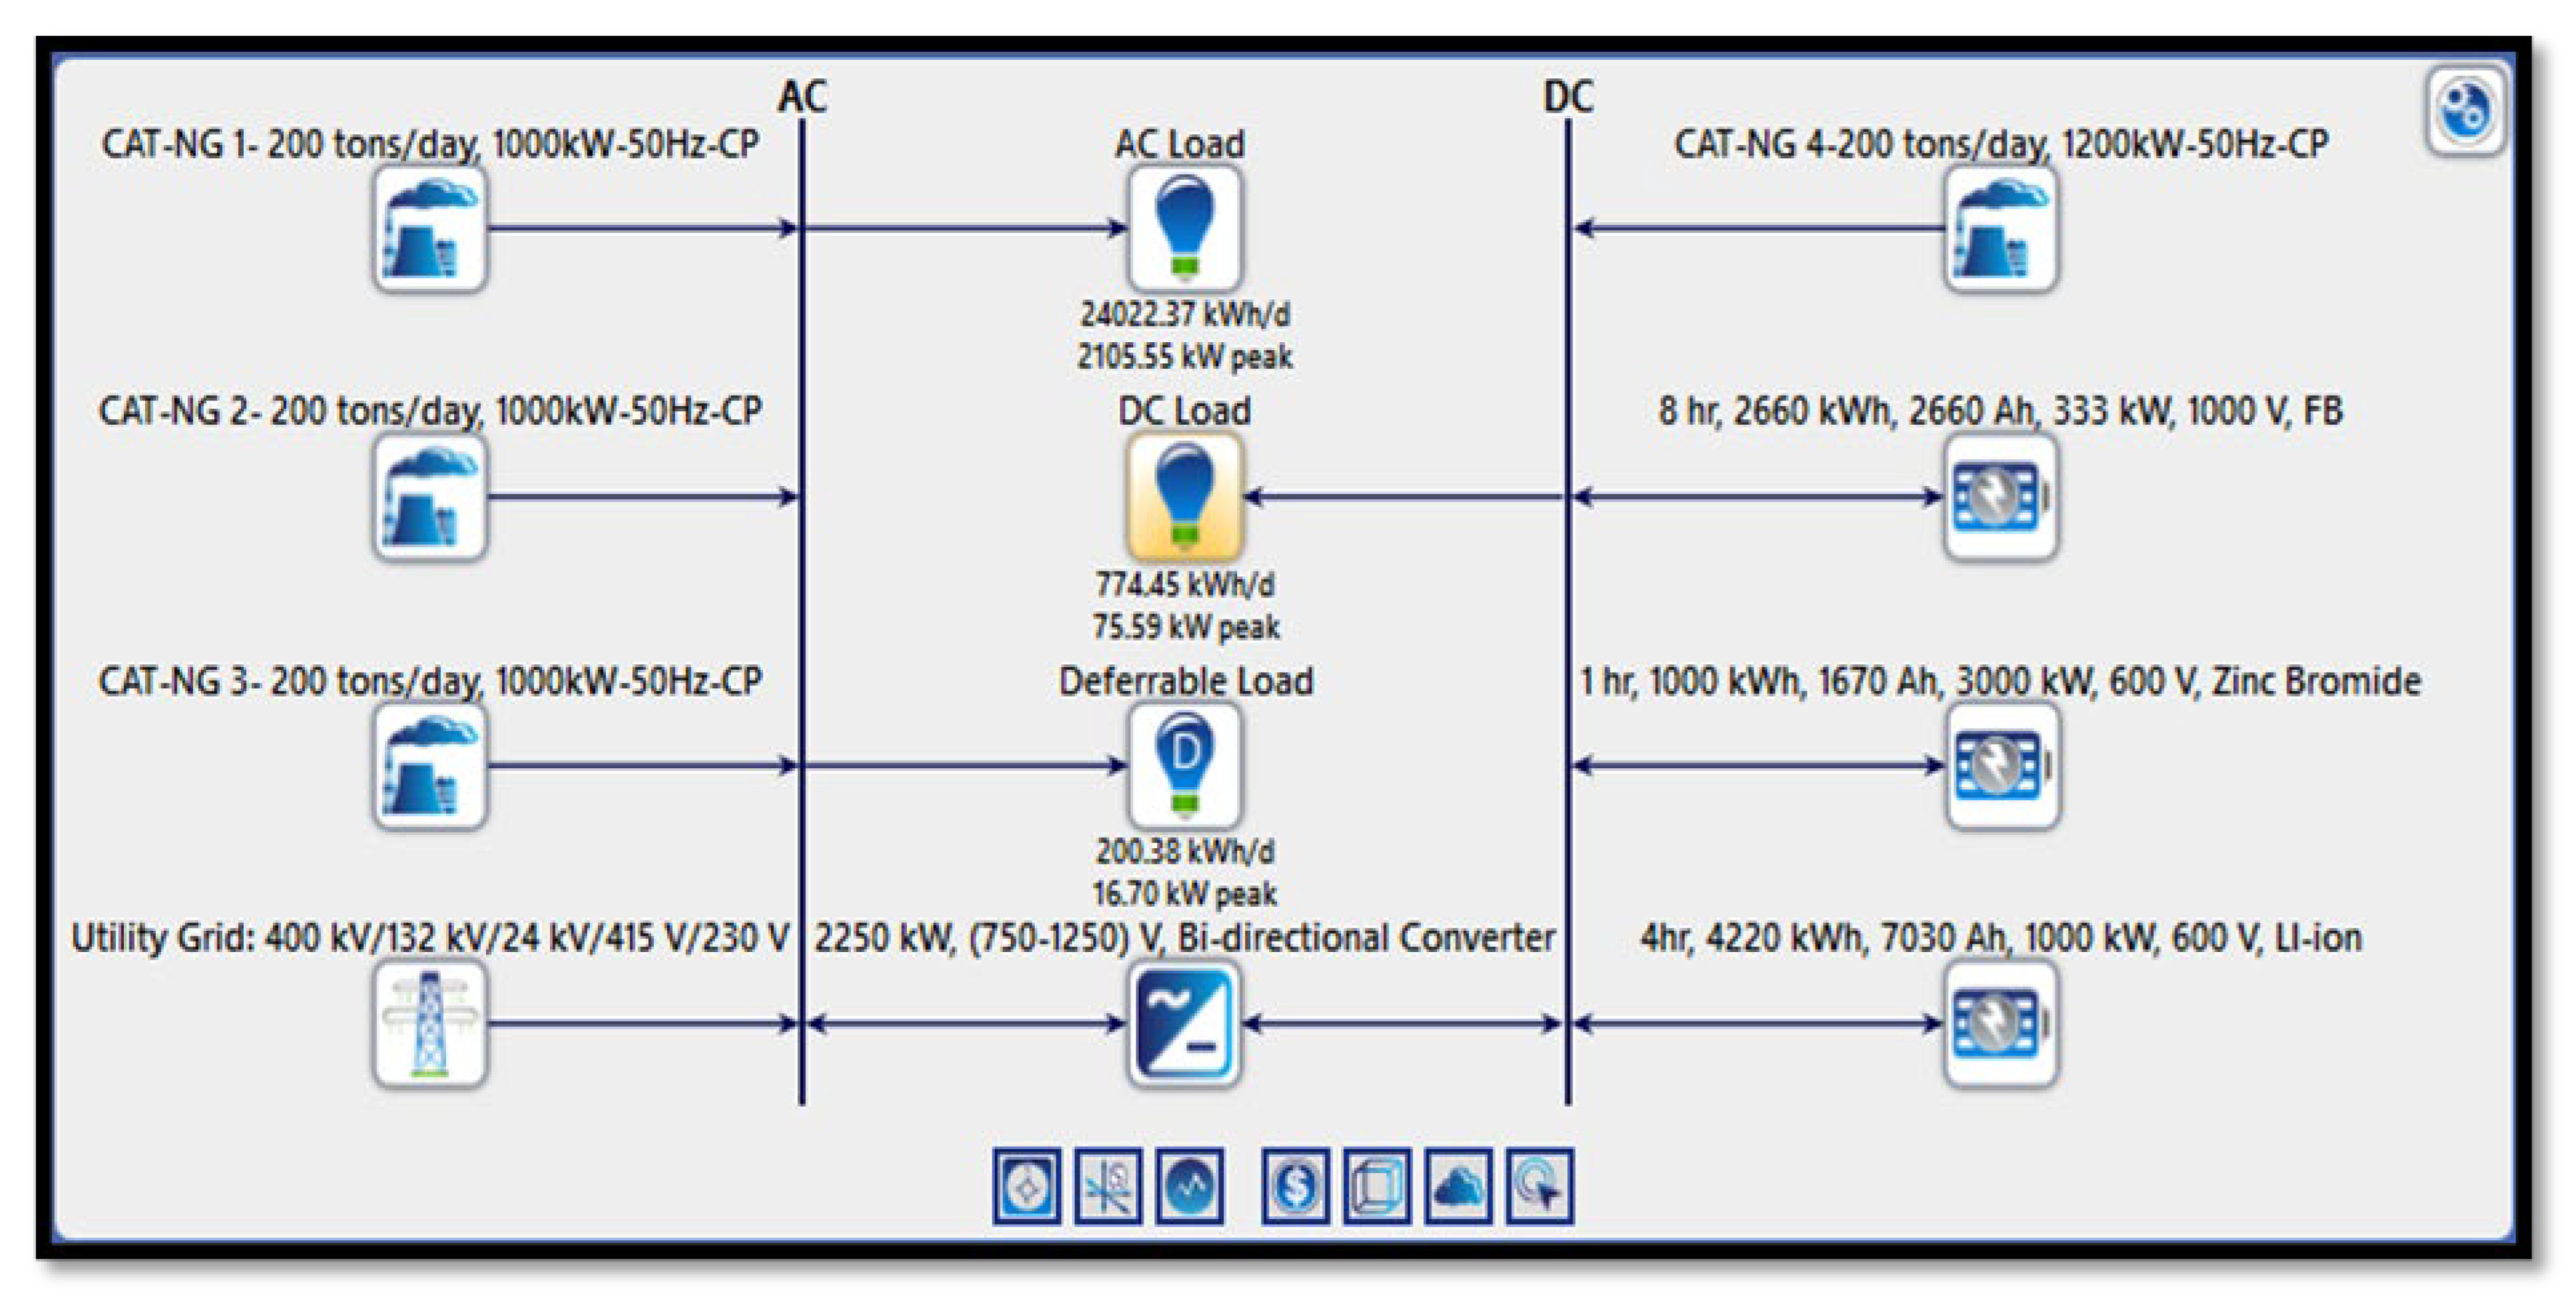
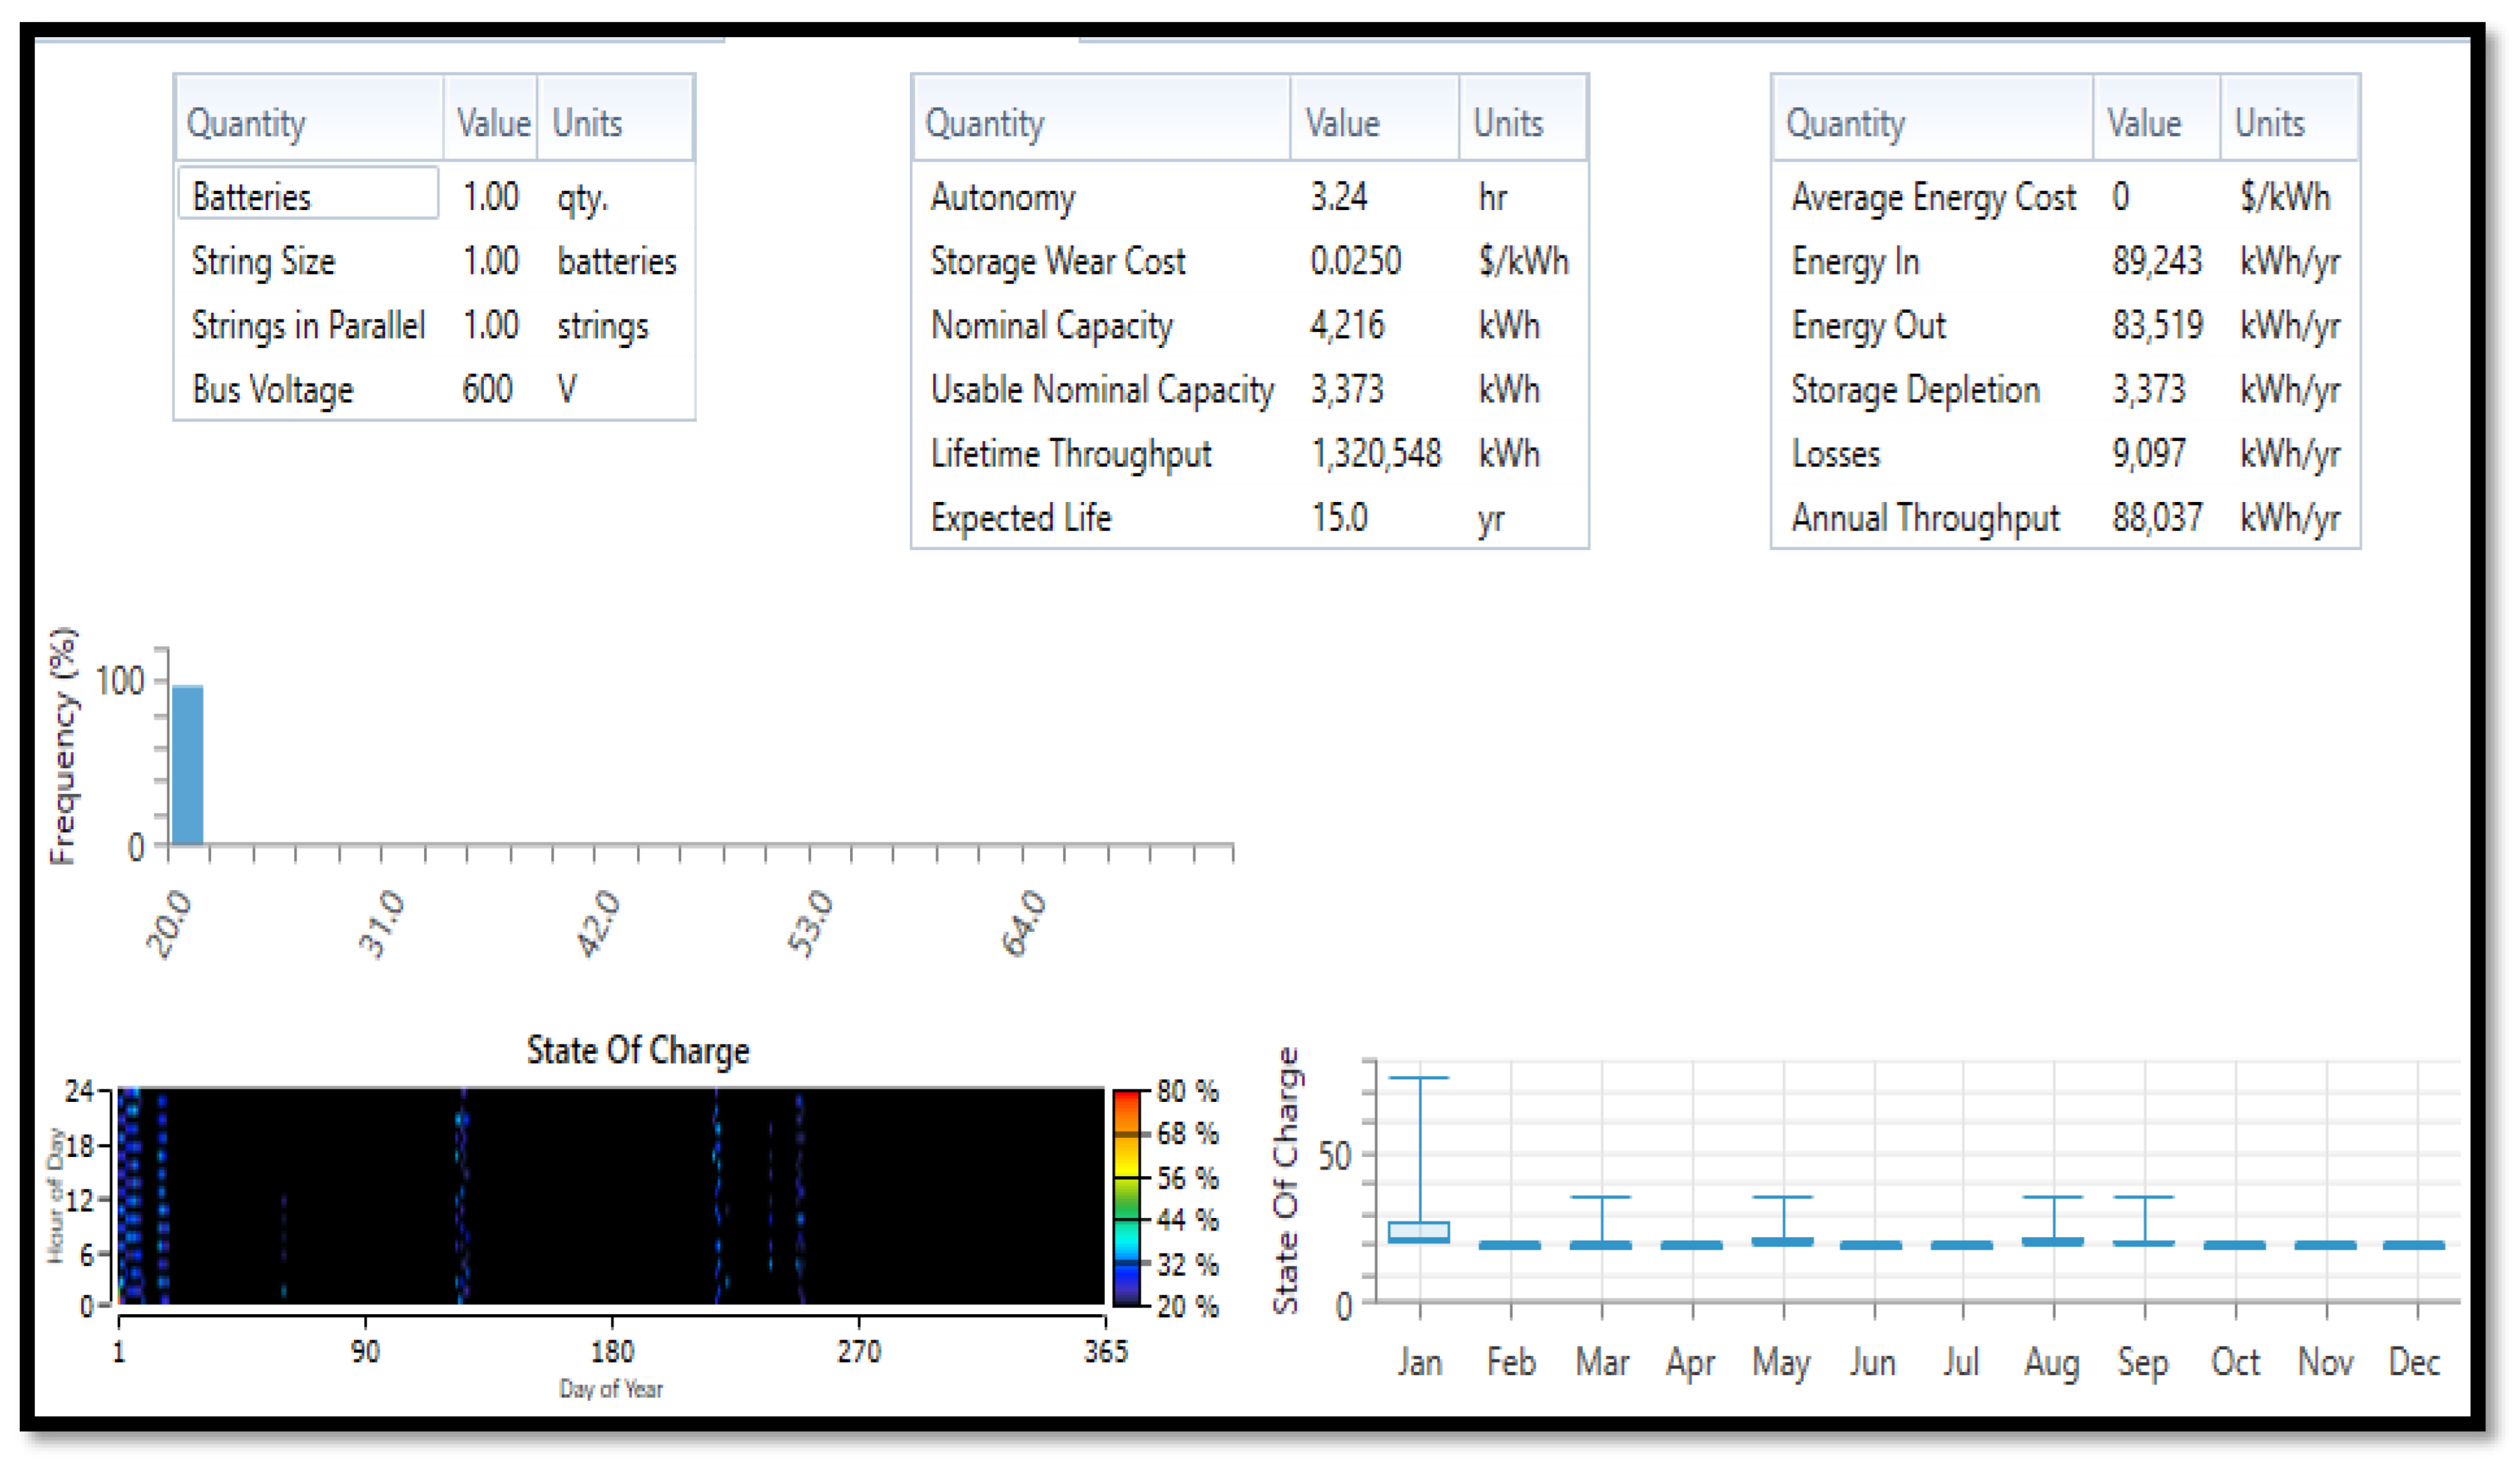
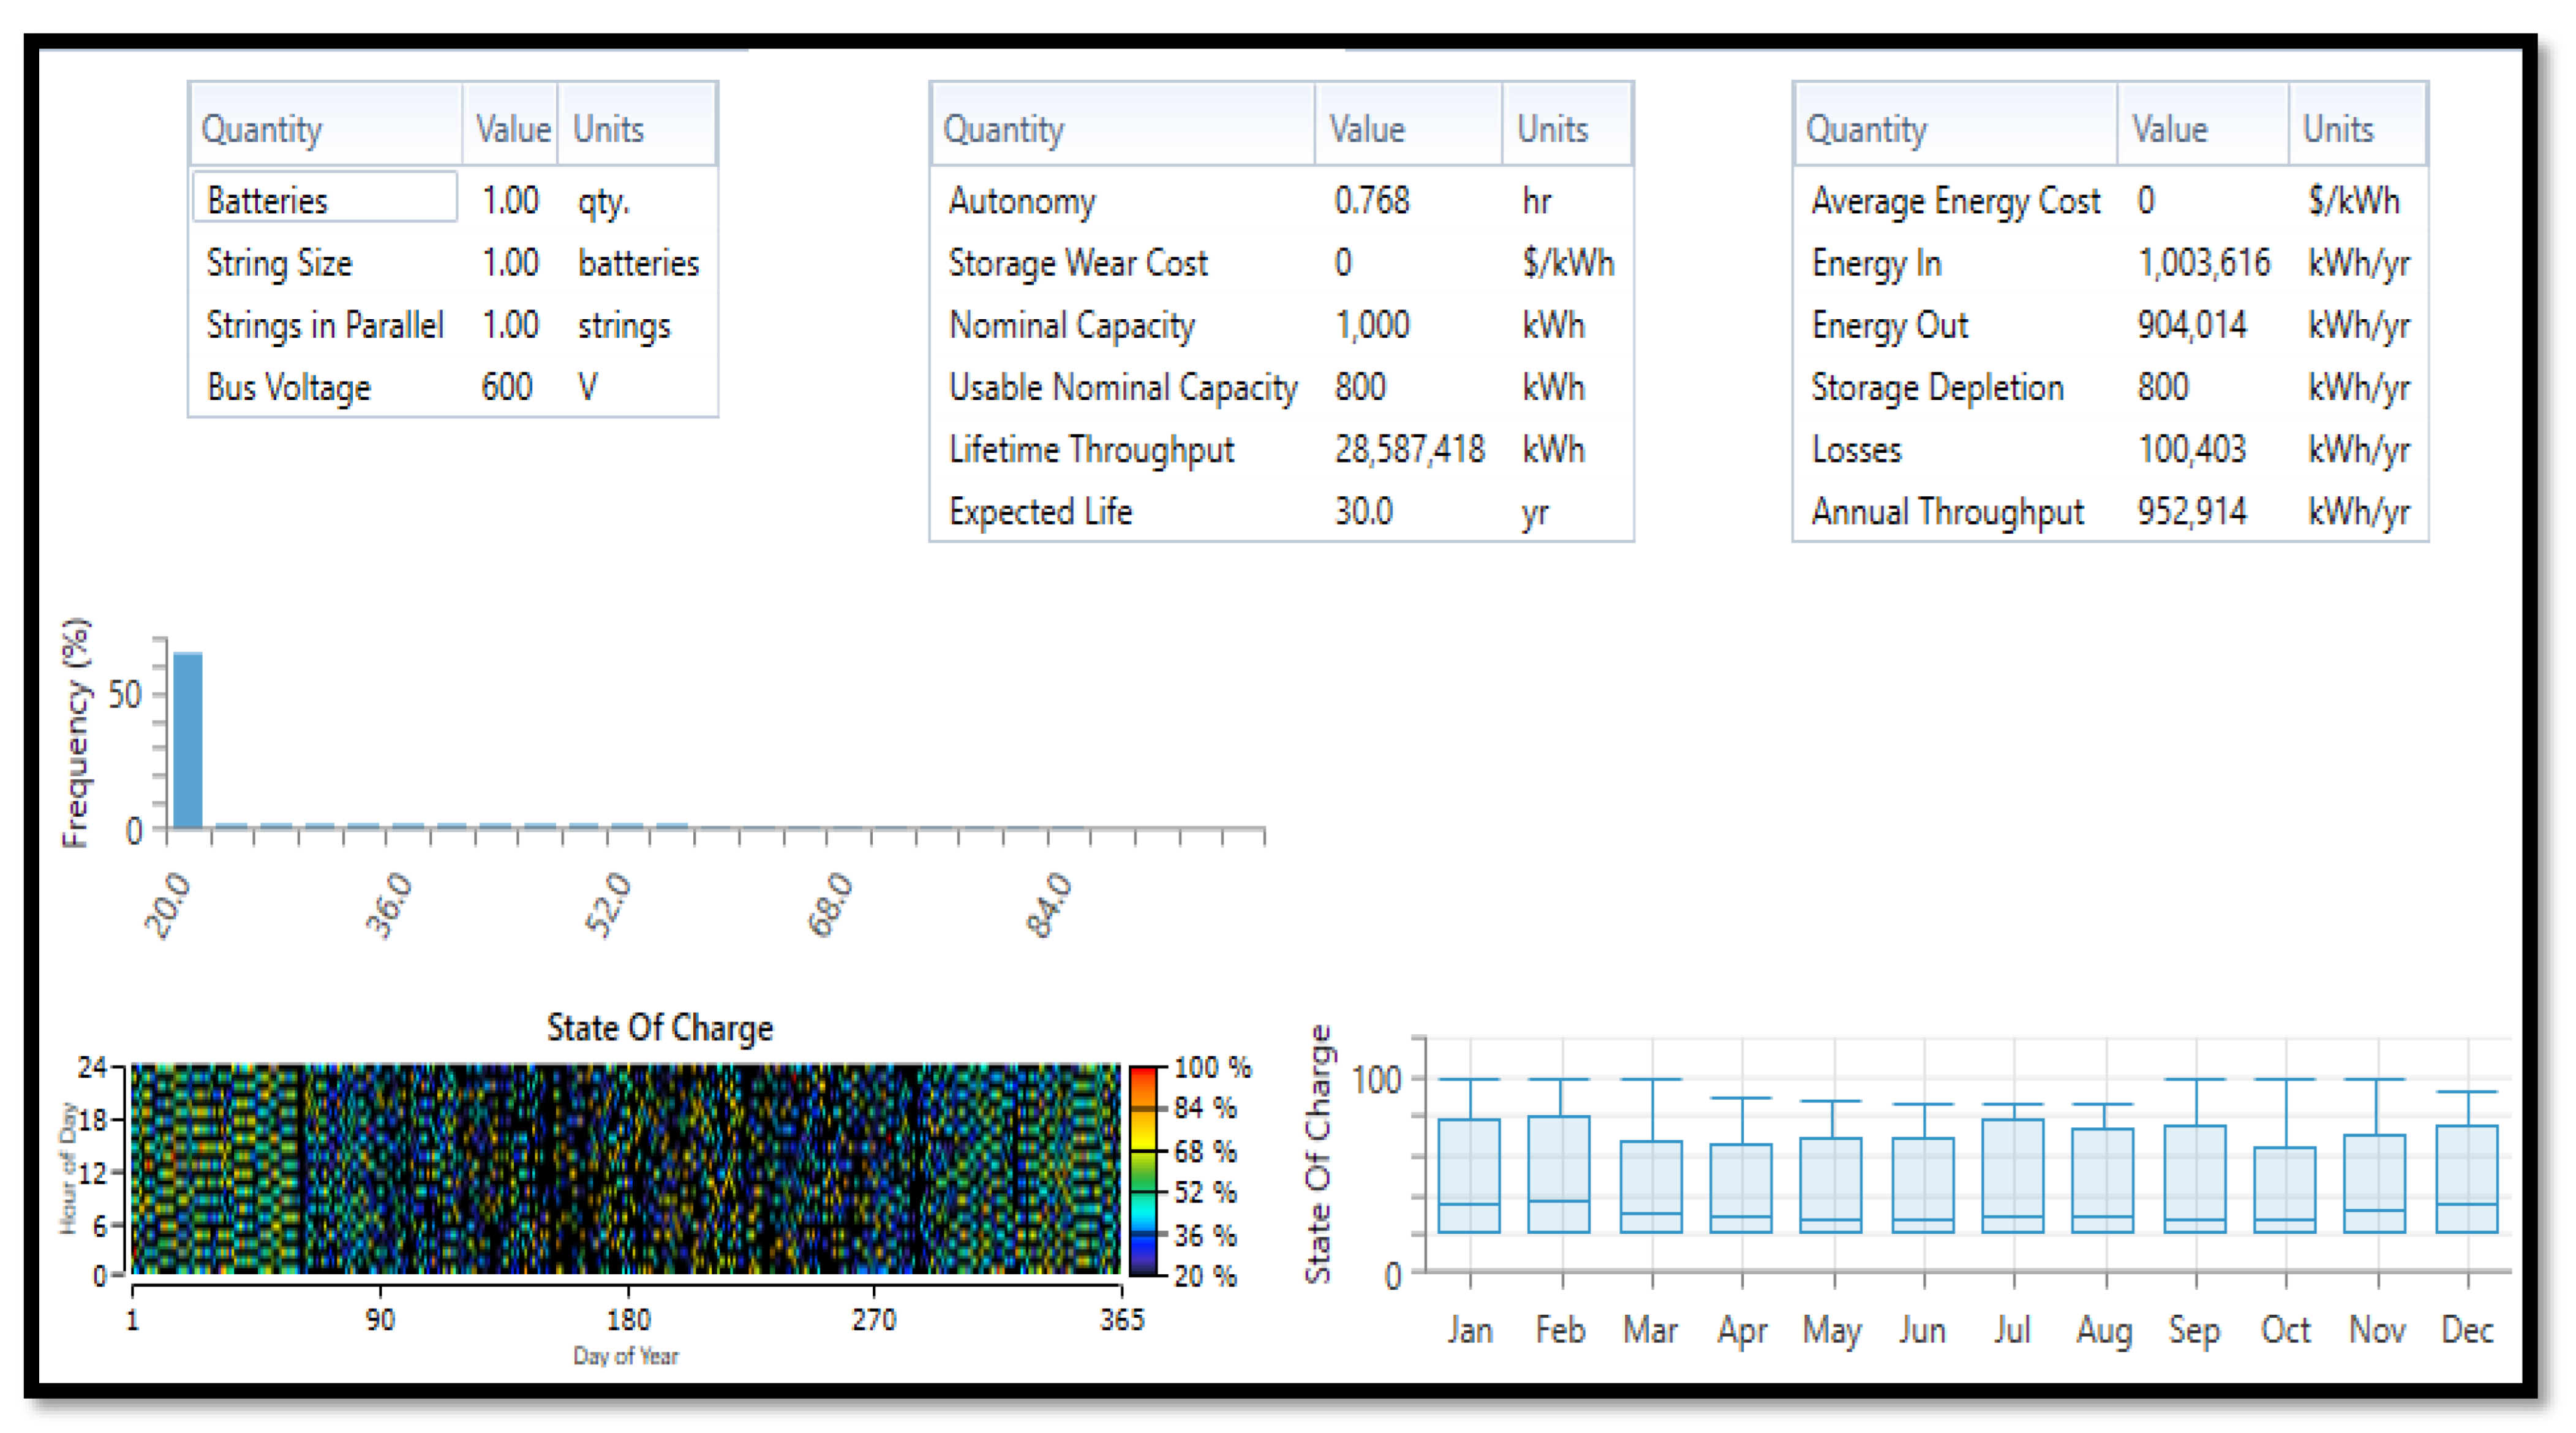
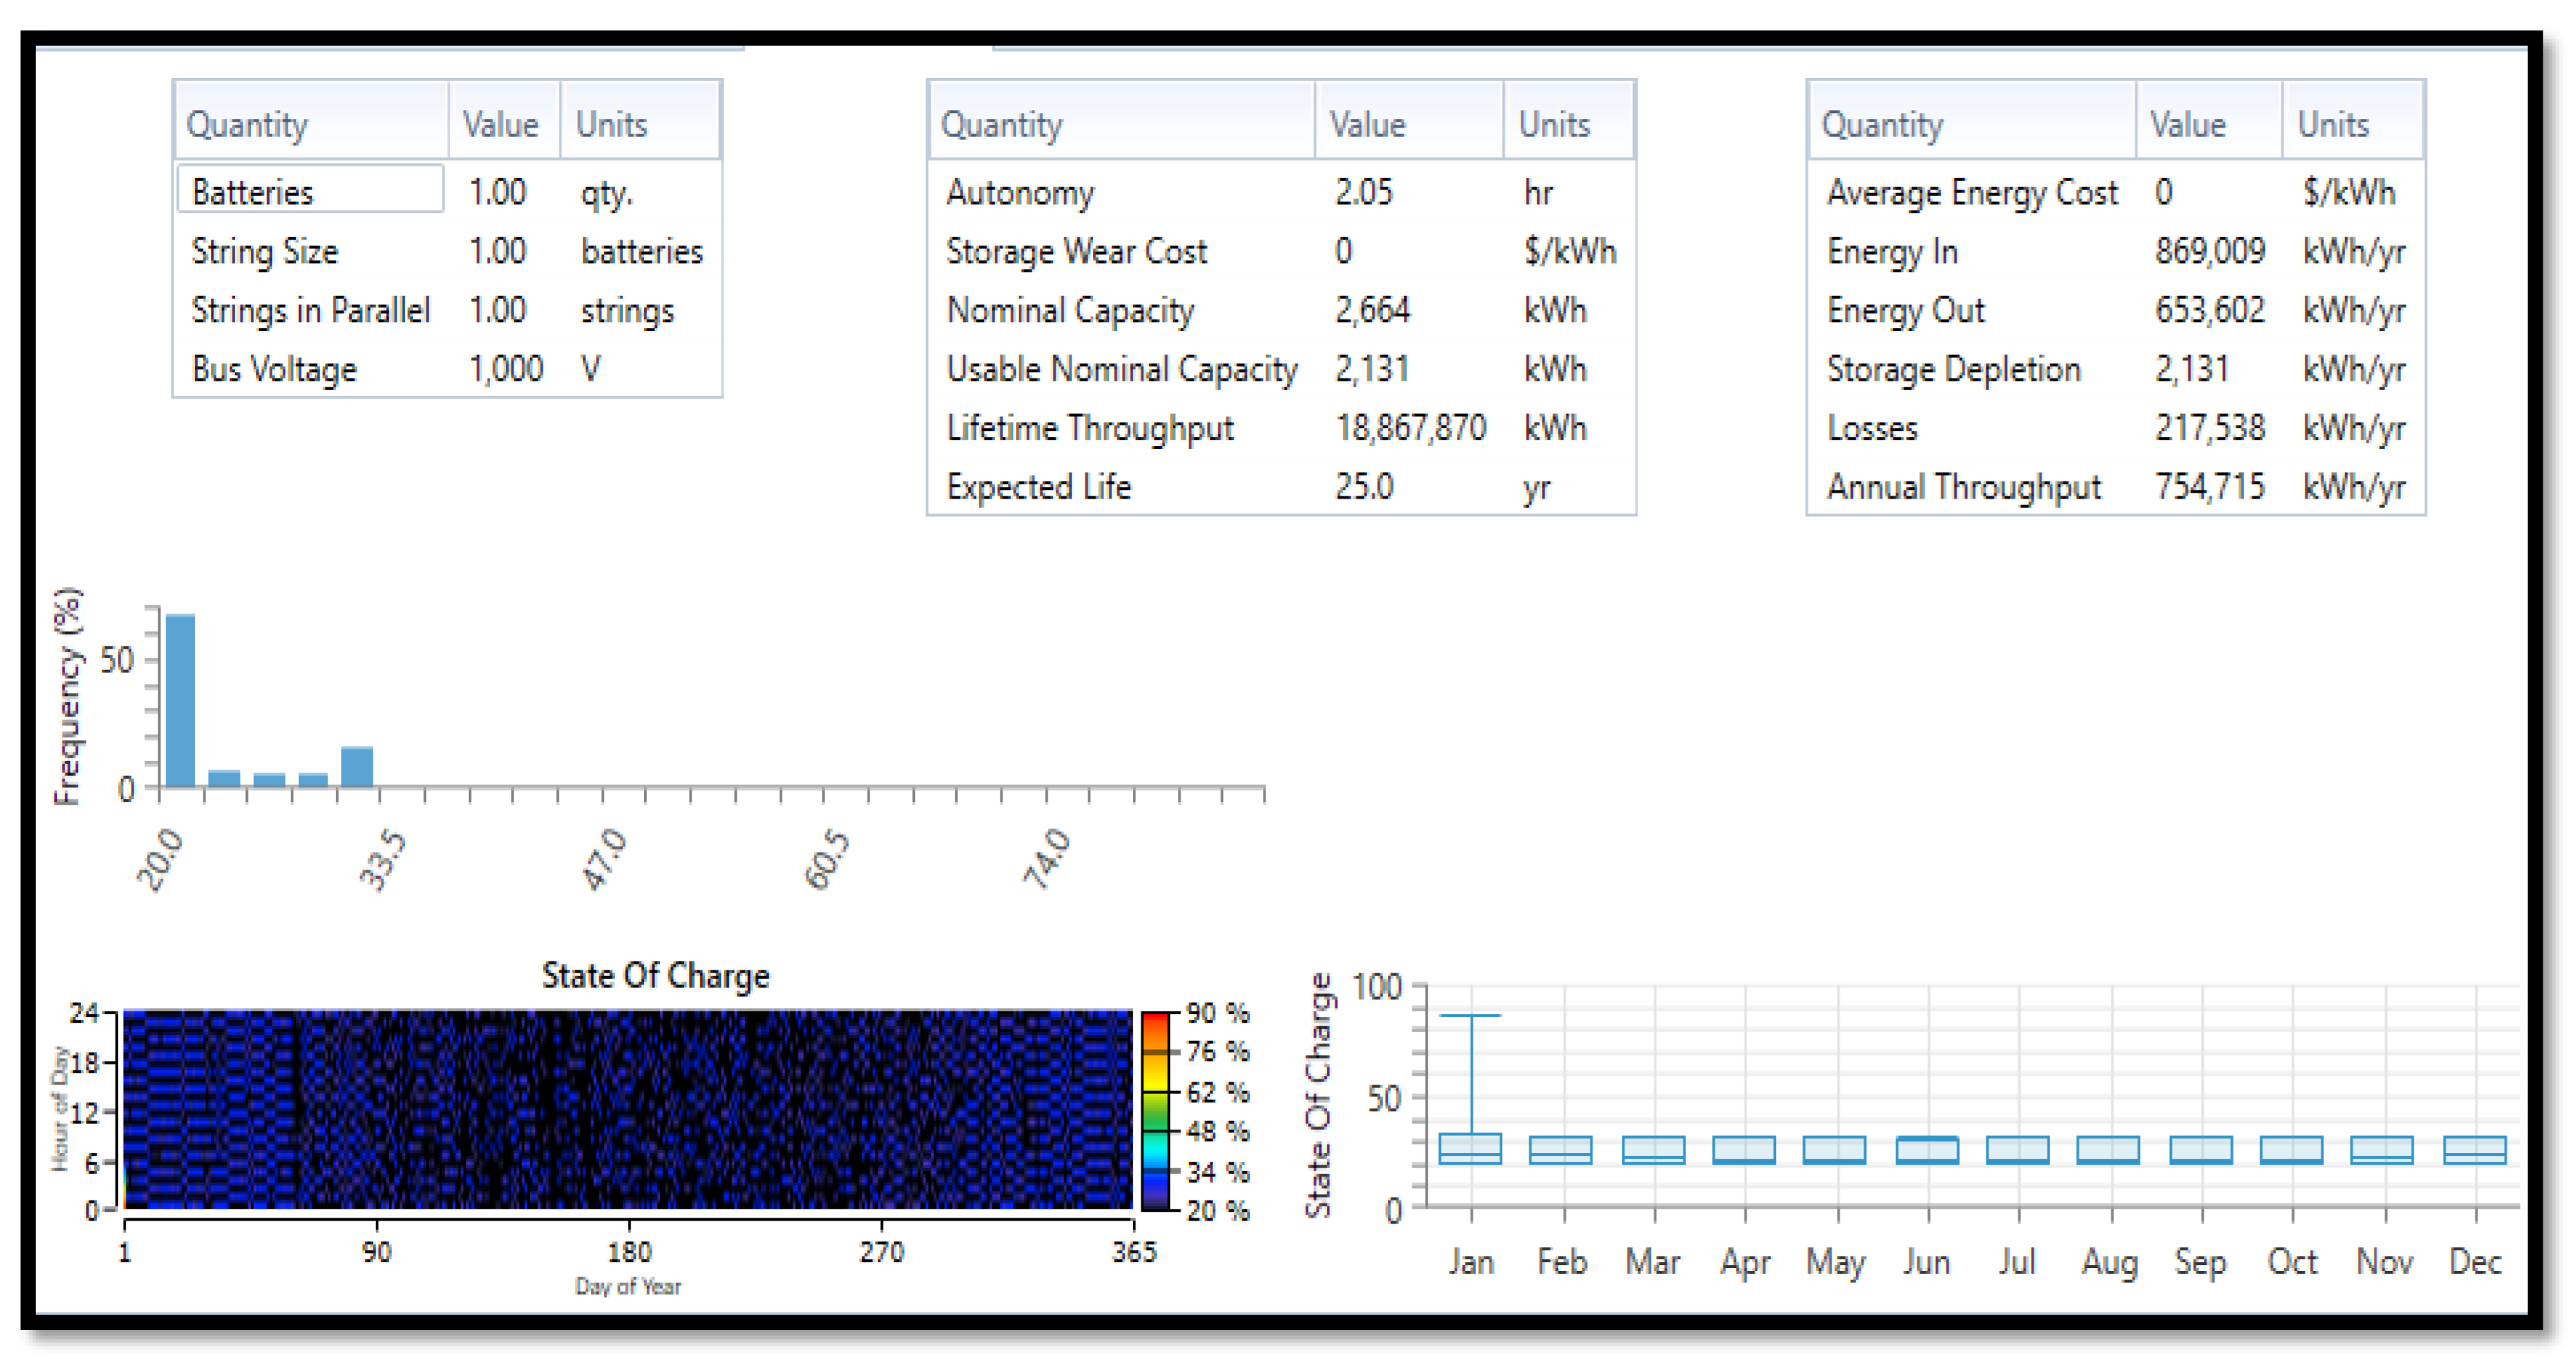
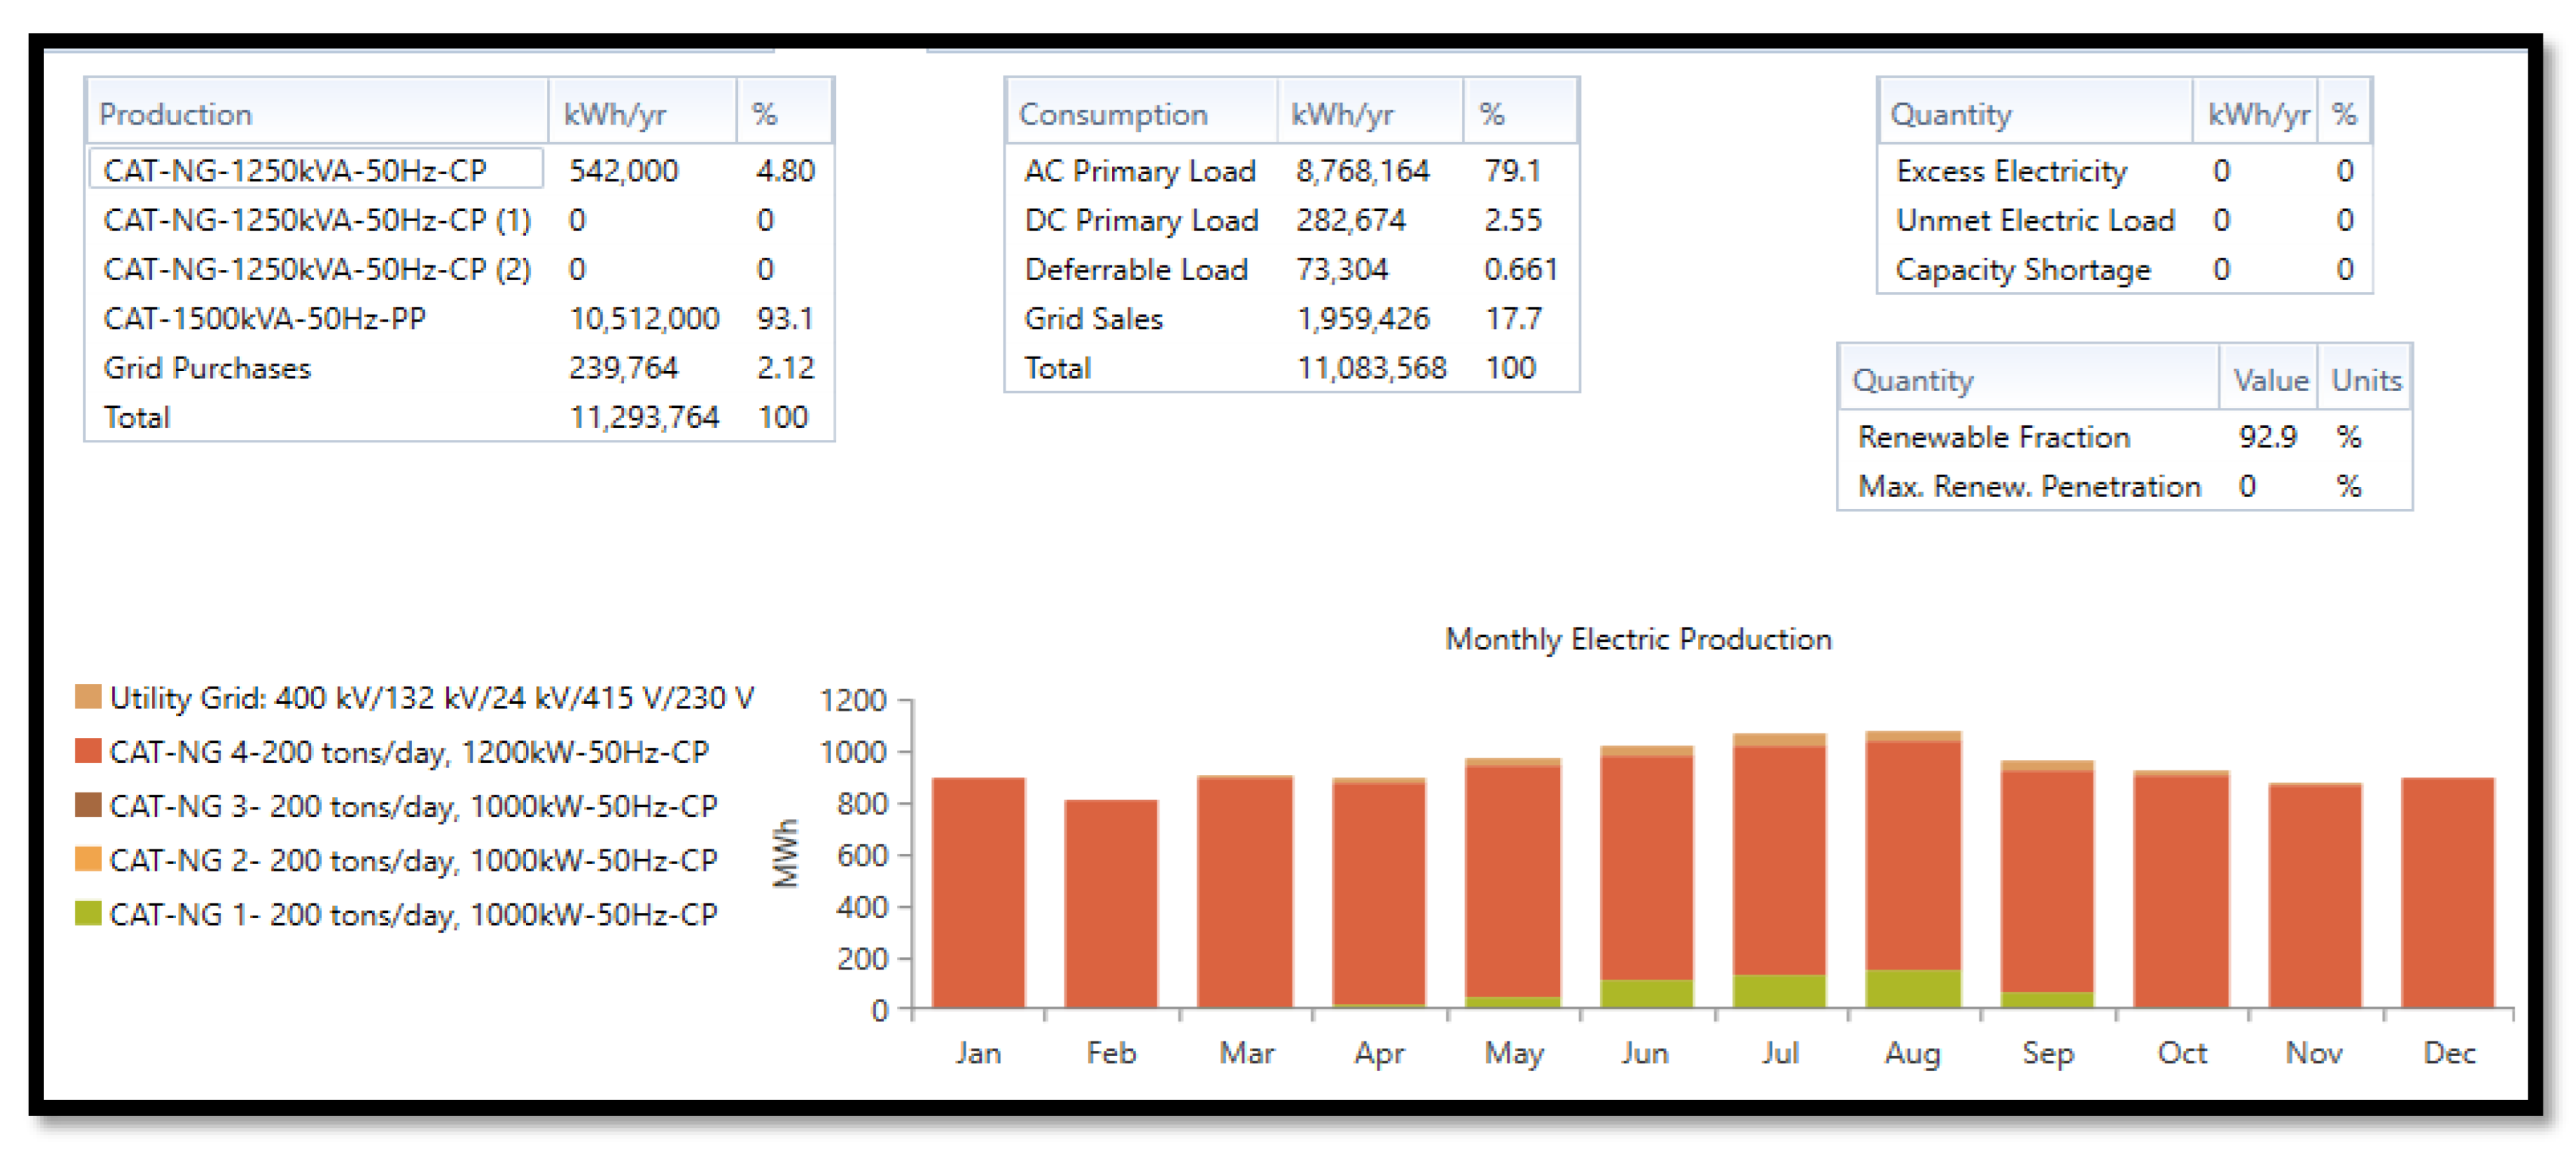


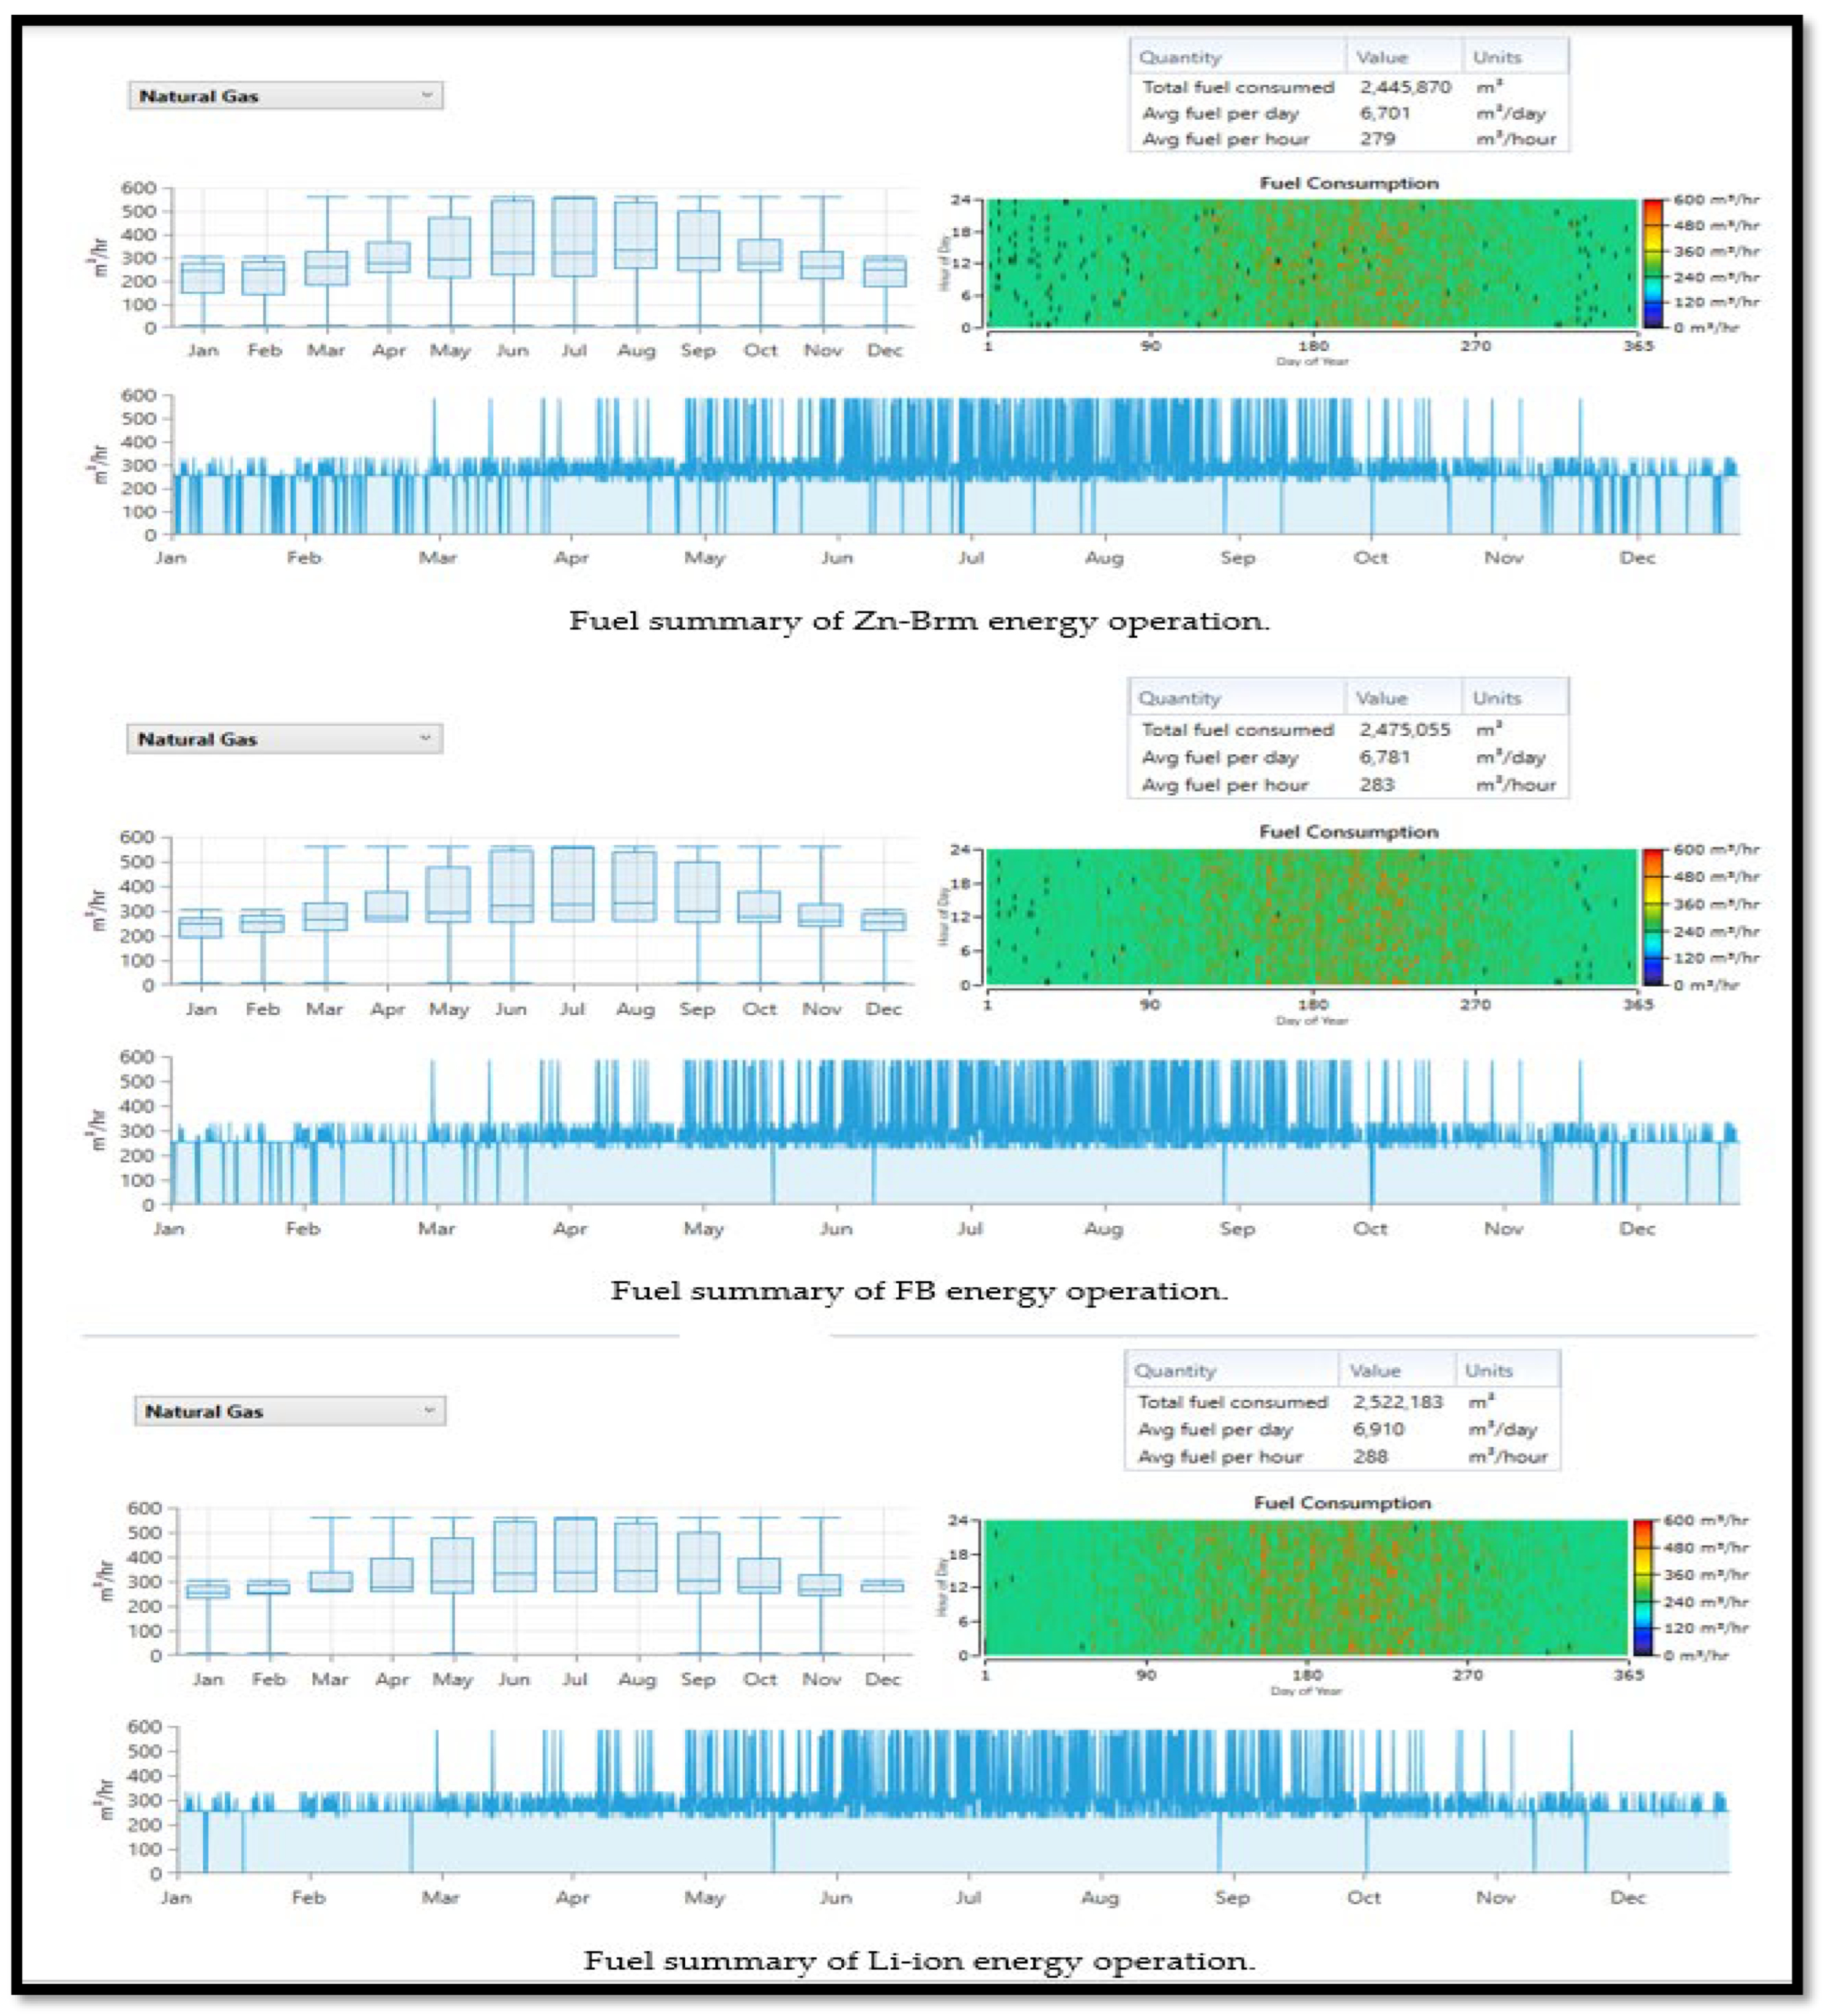
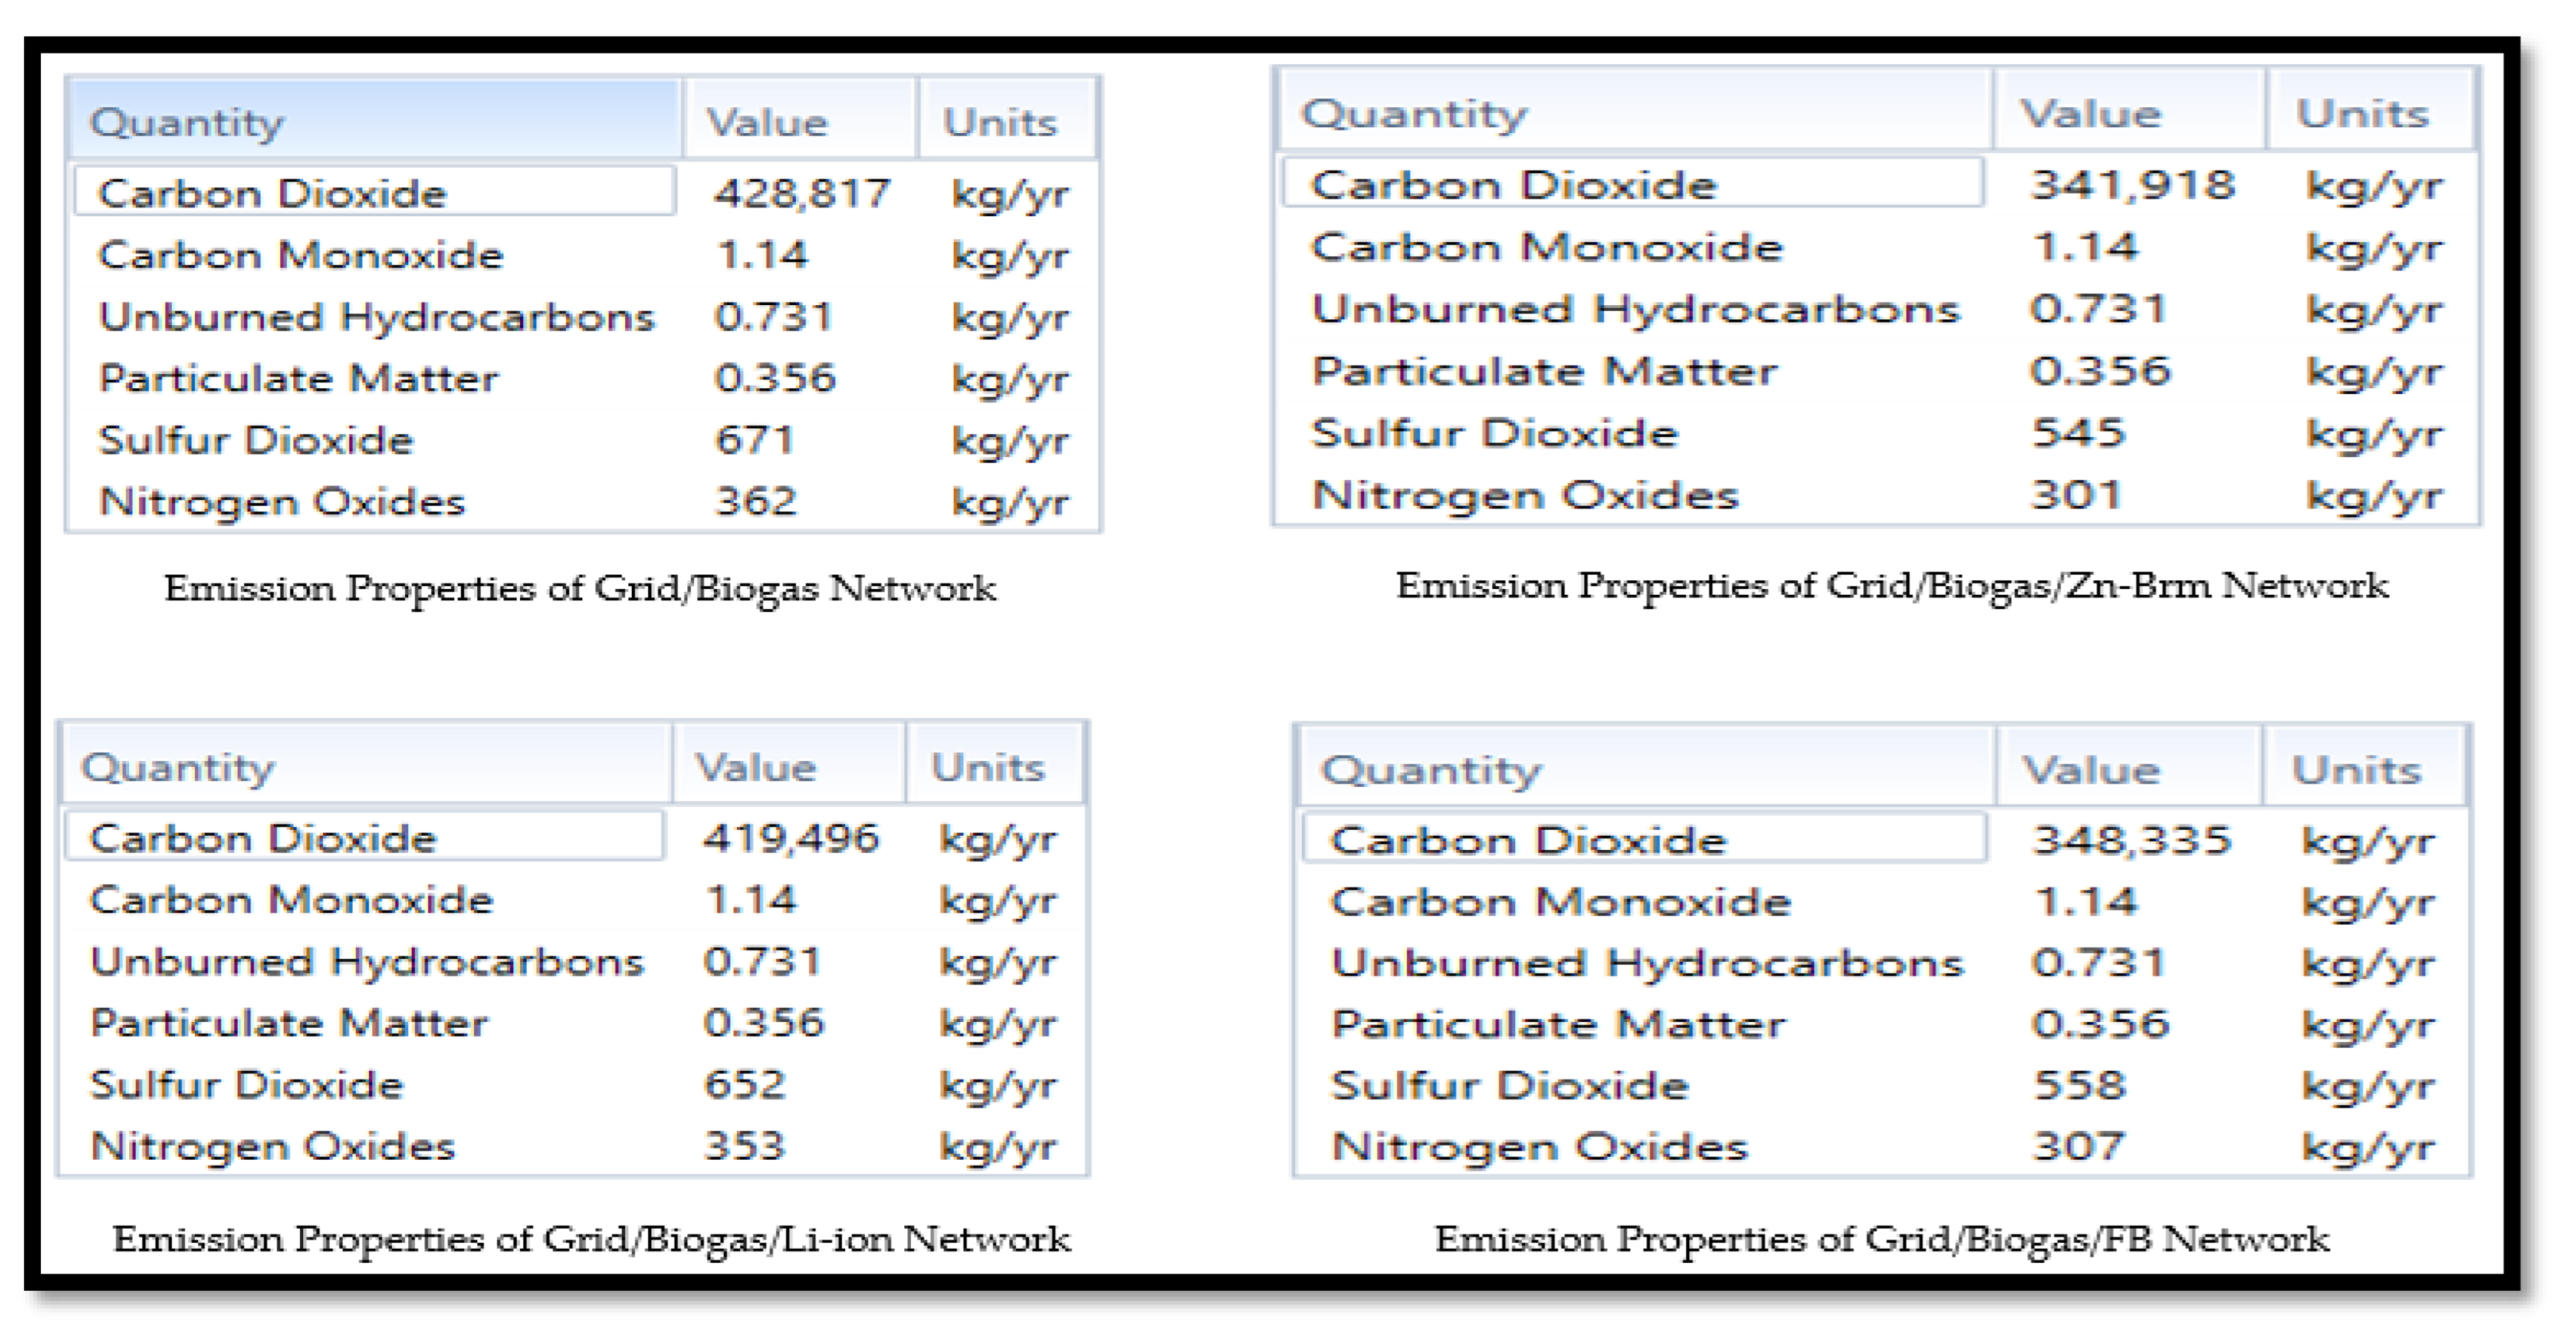


Disclaimer/Publisher’s Note: The statements, opinions and data contained in all publications are solely those of the individual author(s) and contributor(s) and not of MDPI and/or the editor(s). MDPI and/or the editor(s) disclaim responsibility for any injury to people or property resulting from any ideas, methods, instructions or products referred to in the content. |
© 2025 by the authors. Licensee MDPI, Basel, Switzerland. This article is an open access article distributed under the terms and conditions of the Creative Commons Attribution (CC BY) license (https://creativecommons.org/licenses/by/4.0/).