Article

Research on the Optimization of Collaborative Decision Making in Shipping Green Fuel Supply Chains Based on Evolutionary Game Theory

1
Policy Research Center, Tianjin Research Institute for Water Transport Engineering, Tianjin 300456, China
2
College of Transportation Engineering, Dalian Maritime University, Dalian 116026, China
*
Authors to whom correspondence should be addressed.
Sustainability 2025, 17(11), 5186; https://doi.org/10.3390/su17115186
Submission received: 23 April 2025 / Revised: 22 May 2025 / Accepted: 3 June 2025 / Published: 4 June 2025
(This article belongs to the Special Issue The Optimization of Sustainable Maritime Transportation System)

Abstract

:
In the context of global climate governance and the International Maritime Organization’s (IMO) stringent carbon reduction targets, the transition to green shipping fuels faces systemic challenges in supply chain coordination. This study focuses on the strategic interactions between governments and enterprises in the construction of green fuel supply chains. By constructing a multidimensional scenario framework encompassing time, technological development, social attention, policy intensity, and market competition, and using evolutionary game models and system dynamics simulations, we reveal the dynamic evolution mechanism of government–enterprise decision making. System dynamics simulations reveal that (1) short-term government intervention accelerates infrastructure development but risks subsidy inefficiency; (2) medium-term policy stability and market-driven mechanisms are critical for sustaining enterprise investments; and (3) high social awareness and mature technologies significantly reduce strategic uncertainty. This research advances the application of evolutionary game theory in sustainable supply chains and offers a decision support framework for balancing governmental roles and market forces in maritime decarbonization.

1. Introduction

Against the backdrop of global efforts to actively address climate change, the issue of carbon emissions in the international shipping industry has garnered increasing attention. The International Maritime Organization (IMO) has set emission reduction targets for 2030/2050, aiming to reduce the carbon intensity of international shipping by 40%, compared to the levels in 2008, by 2030 and achieve at least a 50% reduction in greenhouse gas emissions by 2050. The EU’s GHG emissions policy has also been clarified through the successive introduction of Monitoring, Reporting, and Verification (MRV), of the European Union Emissions Trading System, and then of the related provisions of FuelEU, stipulating that, from 2026 onward, 100% of shipping emissions will be required to be included in the EU ETS. Taking the full inclusion in 2026 as an example, for every ton of CO2 emitted, one EUA (European Union Allowance) must be submitted. As of 2025, the price of EUA is approximately EUR 90 per ton. The consistency in the regulatory recognition of carbon emissions is further accelerating the green transformation of the shipping industry. Green shipping fuels, as a key means of emission reduction, have broad development prospects. Zero-carbon fuels such as ammonia, hydrogen, and methanol are regarded as core pathways to achieving carbon neutrality in shipping. It is projected that, by 2050, green marine fuels will account for over 60% of global shipping energy consumption. Taking methanol as an example, according to predictions by the International Renewable Energy Agency (IRENA), methanol could comprise 30% of shipping fuels by 2050. The future demand for these green fuels is showing a rapid growth trend and is becoming an important direction for the sustainable development of the shipping industry.
The green shipping fuel supply chain encompasses multiple stages, including fuel production, transportation, storage, and refueling. The main entities in the production and transportation stages are fuel production and supply companies, while the main entities in the storage and refueling stages are ports. Currently, the overall capacity of the supply chain is insufficient to meet the rapid growth in future demand. For instance, in terms of green fuel storage and refueling infrastructure, global ports severely lack green fuel refueling facilities. According to a survey by the International Association of Ports and Harbors (IAPH), less than 10% of major ports currently have green fuel refueling capabilities, which hinders the optimal layout of future green fuel shipping routes. Therefore, joint efforts by governments and relevant enterprises in the supply chain are needed to enhance overall supply chain capacity.
From the actual measures taken by various countries, a collaborative model between governments and enterprises is evident. Governments provide financial support or directly invest in related infrastructure projects, while enterprises, under government guidance, carry out technological innovation and investment. However, in practice, the collaborative decision making for green shipping fuel supply chains faces numerous challenges. Conflicts of interest exist among governments, ports, and green fuel production enterprises in the decision-making process, with the core contradiction lying in the conflicting objectives of the parties: governments seek to maximize the social benefits of green shipping fuel supply chain development, while enterprises focus on the return on infrastructure investment (ports need to invest in retrofitting storage tanks, such as low-temperature storage for liquid ammonia at −33 °C, and refueling terminals with hybrid refueling systems compatible with multiple fuel types, with single-port retrofitting costs exceeding USD 200 million). Production enterprises, on the other hand, weigh technological risks against market returns. For example, in the construction of methanol refueling facilities at the Port of Rotterdam, the government covered 40% of the infrastructure costs, while the port and enterprises engaged in prolonged negotiations over the allocation of the remaining 60%.
In this context, this study aims to address the following key issues:
  • Cost-sharing mechanism: How can the costs of port infrastructure retrofitting (e.g., ammonia fuel storage tanks) be dynamically balanced between government fiscal allocations and corporate funds?
  • Policy tool optimization: How can a combination of direct investments (e.g., government equity participation in port infrastructure) and indirect incentives (production-side subsidies, carbon tax exemptions) drive the rapid formation of the supply chain?
By addressing these key issues, this study will expand the application of evolutionary game theory in the context of green energy supply chains. By analyzing the feedback mechanisms and equilibrium conditions of strategy adjustments among stakeholders, it will provide a scientific basis for governments to formulate differentiated subsidy policies, enabling more precise guidance for the development of green shipping fuel supply chains. Simultaneously, it will guide ports in infrastructure planning and green fuel pricing strategies, reduce technological investment risks and market uncertainties for green fuel production enterprises, and promote the healthy development of the entire supply chain.
The paper is structured as follows. Section 2 reviews research progress on green shipping fuel supply chains, collaborative decision-making optimization for green and low-carbon supply chain development, and the intersection with evolutionary game theory applications. Section 3 constructs a two-party evolutionary game model involving government and enterprises, defining the payoff matrix and replicator dynamics equations. Section 4 simulates equilibrium paths under different policy scenarios based on system dynamics modeling. Section 5 summarizes the research conclusions and outlook.

2. Literature Review

2.1. Research on the Shipping Green Fuel Supply Chain

Current research on shipping green fuel supply chains focuses on three interrelated themes: fuel technology comparison, infrastructure adaptability, and policy–market dynamics.
Nguyen et al. (2023) analyzed zero/near-zero carbon fuels (e.g., ammonia, hydrogen) and found that their current commercialization is hindered by high costs and insufficient infrastructure, though they are critical for long-term decarbonization [1]. Wang et al. (2025) argue that achieving the transition to near-zero emission shipping requires deploying ships powered by low-carbon or zero-carbon alternative fuels. A transition plan is proposed for the fleet, including selecting fuel types (diesel, bio-liquefied natural gas (bio-LNG), bio-methanol, and green ammonia) for each vessel, and determining the quantity and size of ships to be added to or removed from the fleet through purchases, leases, and retrofits in each period [2]. Jasper et al. (2024) modeled green ammonia as a viable decarbonization solution, projecting a 3–4 fold increase in demand by 2050 compared to current grey ammonia production. Their spatial framework highlighted the need for regionalized infrastructure investments and predicted supply concentration in specific ports [3]. Balci et al. (2024) believe that green ammonia is one of the alternative fuels that can achieve the industry’s net-zero target. They studied the success factors for the industry-wide adoption of green ammonia and the structural relationships between these factors to explore antecedents, illustrated the priority relationships among success factors, and proposed a roadmap [4]. Yu et al. (2024) developed an integer linear programming (ILP) model to optimize port bunkering methods, concluding that ship-to-ship bunkering is most cost-efficient for LNG under certain port conditions, considering fixed, variable, and extra costs [5]. Iris et al. (2019) conducted a systematic literature review to analyze operational strategies (e.g., peak shaving, operations optimization), technology usage (e.g., electrification of equipment, cold-ironing, energy storage systems), renewable energy, alternative fuels, and energy management systems (e.g., smart grid with renewable energy) for improving the energy efficiency and environmental performance of ports and terminals [6].
Policy and market factors act as key levers for green fuel adoption: Bortnowska and Zmuda (2024) applied a socio-technical transitions framework to analyze the UK’s hydrogen/ammonia fuel adoption, identifying regional suitability through case studies amid economic challenges like energy security and cost-of-living crises [7]. Liang et al. (2024) proposed a bi-level programming model to coordinate shipping companies and regulators, where the upper level optimizes vessel retrofitting for profitability and the lower level sets subsidies/fines to achieve emission reductions, with simulations showing >50% annual emission cuts [8].
However, this research may simplify some complex real-world factors, such as geopolitical influences on the construction of ammonia production and transportation infrastructure and the potential impact of technological breakthroughs on production costs and supply patterns. Moreover, the socio-technical transitions framework used may not fully capture all the complex factors influencing the adoption of green fuels, such as the impact of international trade policies on fuel import and export, the dynamic changes in shipping demand, and fluctuations in fuel prices. In conclusion, while the application of green ship fuels in global shipping decarbonization holds great promise, the challenges in their production and supply cannot be ignored. To ensure the sustainable supply of green shipping fuels, not only are technological innovation and breakthroughs needed, but so are coordinated layouts and planning among the government and enterprises. The layout and optimization of the production and supply chain are of particular importance.

2.2. Review on Optimization Models for Green Supply Chain Collaborative Decision Making

In the contemporary academic landscape, green supply chain management has emerged as a pivotal research domain. Driven by the global push for sustainability, issues related to environmental and social sustainability in supply chain operations have gained paramount importance. Against this backdrop, scholars worldwide are actively exploring ways to enhance the green quotient of supply chains via novel technologies and collaborative models.
Government regulations on pollution and social equity have intensified research into sustainable supply chain network design, which balances social, economic, and environmental objectives. Amit and Kumar (2024) proposed a mixed integer linear programming model for cost-minimizing supply chain networks with carbon and social factors, though it oversimplifies real-world dynamics like tech-driven emission fluctuations [9]. Amar et al. (2010) integrated carbon emissions and logistics costs via multi-objective modeling to support trade-off analysis in carbon-sensitive supply chains [10]. Under emission restrictions and uncertain fuel prices, Gu et al. (2025) developed a mixed-integer nonlinear robust optimization model to provide shipping alliances with integrated solutions for green technology adoption, ship speed optimization, and space management [11]. Regarding the policy making of the government in supply chain low-carbon transformation, Chen, Yan et al. (2023), and Yao, Jun et al. (2022) explored how government subsidies affect supply chain coordination. They found that subsidies could expand negotiation space [12,13]. Shi and Liu (2022) studied low-carbon supply chains with a theoretical model. They analyzed the impact of carbon tax rates and risks, suggesting that a higher carbon tax could cut emissions but raise costs [14]. Li et al. (2022) discussed government compensation strategies in supply chain management. They believed that optimized government participation could boost supply chain efficiency. However, the research lacks clarity on the optimal strategy’s boundaries and fails to consider policy conflicts [15].
In summary, the existing research on green supply chain collaborative decision-making optimization mainly focuses on issues related to low-carbon supply chain cooperation, such as achieving low carbon goals through supply chain management and enhancing the environmental performance of supply chains through cooperation. Contemporary research increasingly adopts multi-objective models to balance economic, environmental, and social imperatives. However, current studies have limitations in terms of model assumptions, comprehensiveness of factor consideration, and adaptability to dynamic market changes.

2.3. Review on the Application of Evolutionary Game Theory

Evolutionary game theory offers a highly practical decision-making framework under bounded rationality, and it has been effectively applied in resolving the game problems between government policy making and enterprise operations. Wei and Xiao (2024) constructed an evolutionary game model involving the government, enterprises, and parking demanders to explore the stability strategies of these stakeholders. Their research indicated that the rates and stabilities of these evolutionary strategies were constrained by the common interests of the three parties, and government subsidies were decisive factors in determining the strategic choices of enterprises and demanders [16]. Jun et al. (2025) developed an evolutionary game model for international trade. Through mathematical analysis and computer simulation methods, they revealed the impact of trade policy differences on the game pay offs of various countries and the overall international trade network [17]. In the field of low-carbon supply chain cooperation, evolutionary game theory has also been widely applied. Qu et al. (2021) effectively utilized the evolutionary game method to solve the problem of low-carbon supply chain cooperation and explored the multi-party collaborative governance of energy conservation and emission reduction from the perspective of a low-carbon supply chain. By establishing a three-party evolutionary game model including local governments, suppliers, and downstream enterprise groups, they simulated the evolutionary results and paths of the model under different strategies and proposed corresponding policy recommendations from the perspectives of different parties [18]. Li et al. (2022) established an evolutionary game model regarding the role of digital transformation in low-carbon supply chain cooperation. They analyzed the stability of the supply chain equilibrium under two different conditions and found that government support and management were key links in the formation of the low-carbon supply chain cooperation path [19].
In conclusion, above studies have recognized the important role of the government in low-carbon supply chain decision making. However, these studies have their own limitations in terms of model assumptions, the consideration of influencing factors, and the reflection of real-world complexities. In real-world supply chains, information asymmetry is common. Logistics enterprises and manufacturers may have incomplete information about government policies, and the government may also lack accurate data on the actual carbon reduction capabilities and costs of enterprises. The relationships between factors such as government supervision intensity, supplier emission reduction costs, and downstream enterprise incentives are complex and may change over time.

2.4. Summary

The reviewed literature reveals three systemic limitations. Firstly, there are limitations regarding the game bodies. The majority of studies center on the “government enterprise” bilateral game, where the government’s role is often confined to policy making and implementing rewards and punishments. In the context of green shipping supply chain construction, however, the government may also engage in infrastructure investment and construction, as well as overall service pricing. Thus, the various actions of the government as a key entity must be factored into the decision-making benefits of all parties within the model. Secondly, there is a lack of dynamic elements. Current models feature static parameter designs, failing to incorporate technological diffusion, such as the decline in green fuel production costs, government subsidies, and policy iterations like the subsidy phase-out mechanism, into the game rules. Thirdly, strategies tend to be singular, with existing solutions mainly relying on static cost-sharing ratios and lacking scenario simulation tools for multi policy combinations.
This study bridges these gaps through three innovations. Firstly, it involves the cross hierarchical construction of a tripartite evolutionary game model among the government, ports, and enterprises. This model portrays the “quasi public good” nature of port infrastructure sharing, for example, the equilibrium between exclusivity and competitiveness, and defines the interdependent strategic relationships among the three parties (government investment, port utilization, and enterprise revenue). Secondly, there is a methodological improvement. A dynamic coupling mechanism integrating technological diffusion and policy feedback is established, with the technology learning curve embedded in the replicator dynamic equation to simulate the adaptive adjustment of policy tools as technology matures. Thirdly, the practical application scenarios of the model are further expanded. A 3 × 3 × 3 scenario matrix is established to enable multi-dimensional strategy optimization under varying market conditions.

3. Models

3.1. Model Assumptions and Symbol Definition

Given the complexity of real-world socio-economic environments and decision-making issues, traditional game theory based on the assumption of perfect rationality struggles to yield reliable conclusions. Evolutionary game theory, as an analytical method for bounded rationality games, has become an effective tool for addressing bounded rationality problems. Evolutionary game theory is founded on biological evolution principles, positing that individuals within a population can achieve a stable dynamic equilibrium through processes such as imitation, learning, and mutation, ultimately forming evolutionarily stable strategies. Therefore, this study constructs an evolutionary game model to examine the game dynamics between government policy decisions and maritime green fuel supply chain enterprises (including green fuel producers and suppliers) in the development of green shipping fuel supply chains. The game scenario is based on the following assumptions:
(1)
Both the government and maritime green fuel supply chain enterprises are boundedly rational and can achieve a stable state in the green shipping fuel supply chain development game through autonomous learning.
(2)
The government has two strategies, “Active (S1)” and “Inactive (S2),” with selection probabilities of x and (1 − x), respectively, where x [ 0 , 1 ] .
(3)
Maritime green fuel supply chain enterprises have two strategies, “Invest (A1)” and “Do Not Invest (A2),” with selection probabilities of y and (1 − y), respectively, where y [ 0 , 1 ] .
(4)
Government decisions are divided into two strategic choices: active and inactive. Under the active strategy, there are two sub-choices: incentives and penalties. The incentive strategy includes two scenarios: direct government investment in infrastructure and subsidies to relevant enterprises. The penalty strategy involves imposing carbon taxes on traditional energy suppliers.
(5)
Supply chain enterprise decisions are divided into two choices: increasing R&D investment for technological innovation and corresponding infrastructure construction to achieve green shipping fuel supply capabilities, or maintaining traditional fuel operations without changes.
(6)
The government’s revenue takes into account the overall social benefits and the carbon tax levied. The overall social benefits include the improvement of environmental benefits brought by the development of the shipping green fuel supply chain, the technological spillover effects generated by the development of the shipping green fuel supply chain, and the enhancement of the overall social and economic benefits brought by the development of regional industries.
(7)
The enterprises’ revenue mainly consists of two situations: the sales revenue from the supply of green fuels by shipping green fuel supply chain enterprises and the government subsidies obtained.
This leads to four core game scenarios (Table 1).
The corresponding payoff functions are constructed as follows.
π G = R + B C i n f C s u b T C i n f L R + B L G 1 E 1 G 1 E 2 G 2 E 1 G 2 E 2
π E = E + S I T L E I L G 1 E 1 G 1 E 2 G 2 E 1 G 2 E 2
  • R denotes the environmental benefits derived from green shipping fuel supply chain development;
  • B represents the technological spillover effects and associated socio-economic benefits from regional industrial advancement;
  • C signifies the government costs for infrastructure construction and subsidy expenditures, where:
  • C i n f refers to the direct infrastructure investment costs by the government;
  • C s u b indicates the costs of subsidy policies;
  • T signifies carbon tax revenue collected from conventional energy suppliers;
  • L reflects potential losses due to inadequate green fuel supply capacity;
  • E corresponds to enterprise revenue generated from green fuel sales;
  • I encompasses R&D and infrastructure investment outlays by enterprises;
  • S designates direct subsidy income received from the government.
Thus, the evolutionary game payoff matrix is presented in Table 2.

3.2. Replication Dynamic Equation Building

According to the description of the payoff matrix, the expected benefits of the government’s active and inactive decision-making behaviors are as follows.
u p G = y ( R + B C i n f C s u b ) + ( 1 y ) ( T C i n f L )
u n G = y ( R + B ) + ( 1 y ) ( L )
The average benefit of government decision making is as follows.
u G = x u p G + ( 1 x ) u n G
The expected benefits for enterprises investing and not investing are as follows.
u i C = x ( E + S I ) + ( 1 x ) ( E I )
u k C = x ( T L ) + ( 1 x ) ( L )
The average benefit for the enterprise is as follows.
u C = y u i C + ( 1 y ) u k C
According to the basic idea of the replication dynamics model proposed by Taylor and Jonker, the probabilities x and (1 − x) for the government choosing “active” and “inactive” strategies, and the probabilities y and (1 − y) for enterprises choosing “invest” and “not invest” strategies, are all functions of time t. The replication dynamics equation can be used to describe the dynamic changes in the frequency of a strategy being selected within a population over time. The replication dynamics equation for a single population can be expressed as follows.
d z i d t = z i [ f z i f ¯ z ]
In the equation, z i represents the frequency of strategy i being selected, f ( z ) i denotes the expected payoff when adopting strategy i, and f ¯ z represents the average expected payoff of the entire population choosing different strategies. Based on this, the replication dynamic equation for government decision making is obtained as follows.
F ( x , y ) = d x d t = x [ u p G u G ] = x ( 1 x ) [ T C i n f ( C s u b + T ) y ]
The replication dynamic equation for enterprise decision making is as follows.
G ( x , y ) = d y d t = y [ u i C u C ] = y ( 1 y ) [ E I + L + ( S + T ) x ]

4. Evolutionary Game Model Simulation Analysis

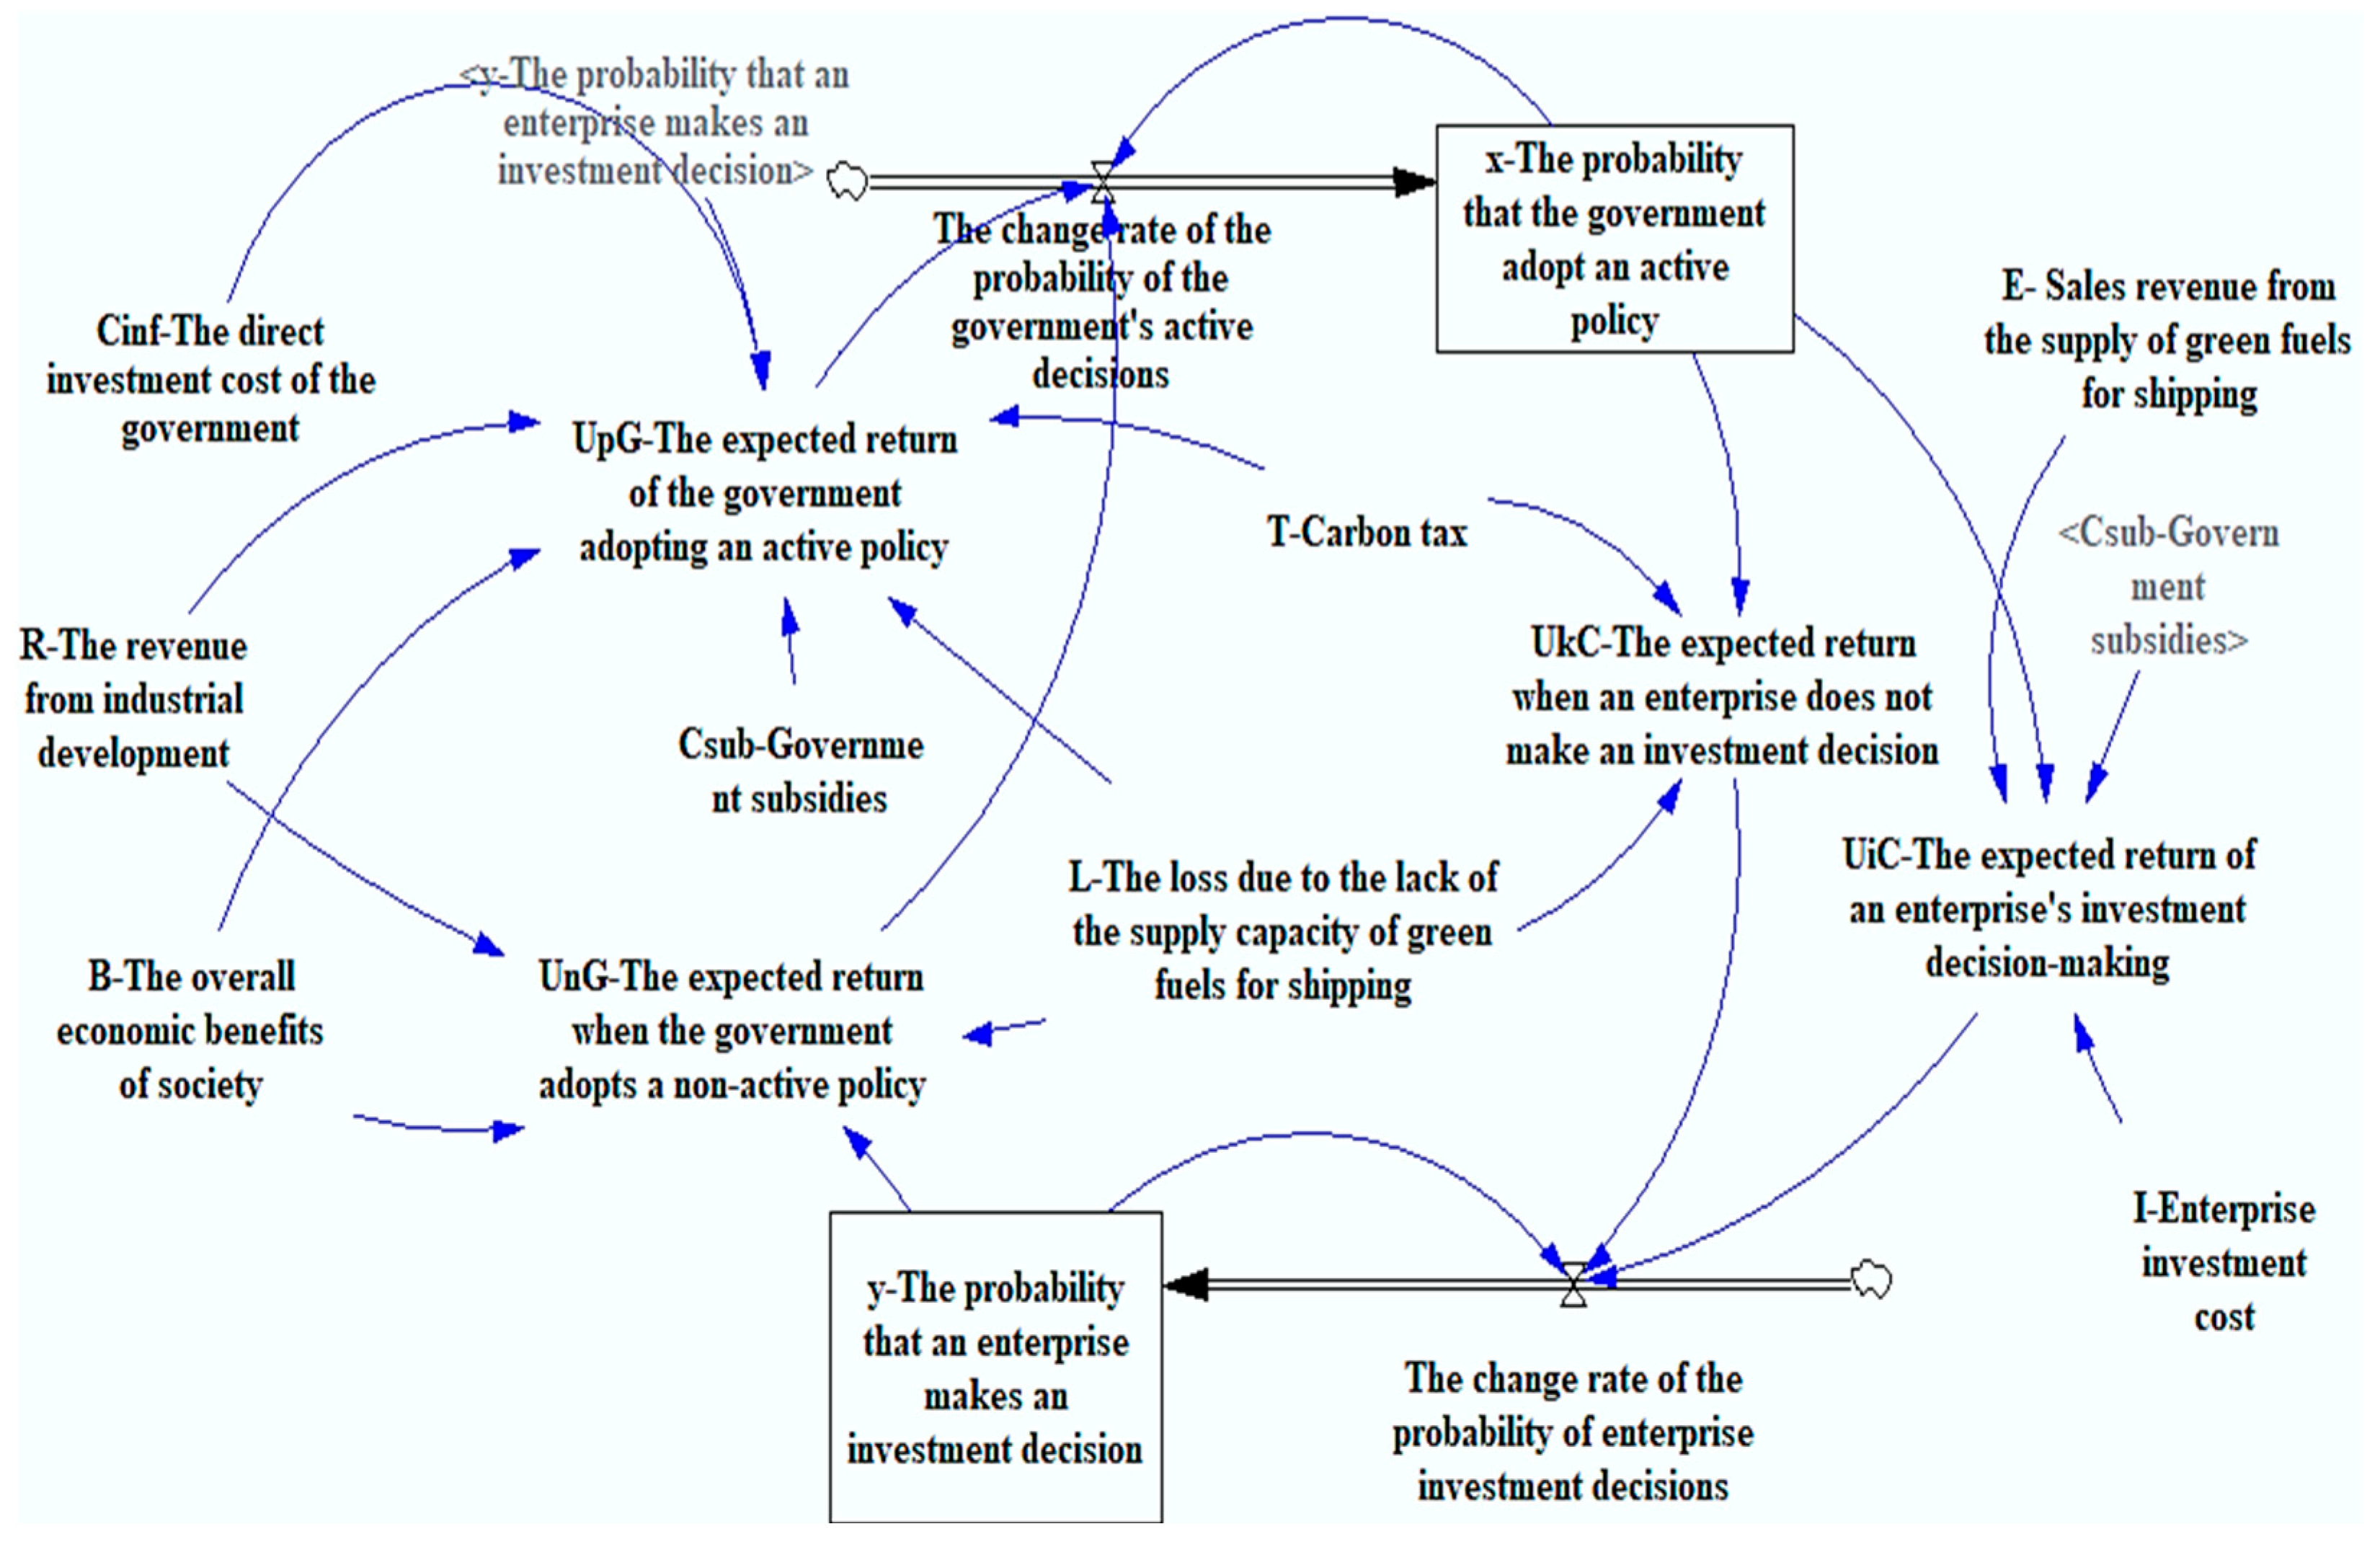
4.1. Construction of the System Dynamics Simulation Model

To further validate the strategic choices of both parties under different conditions, a system dynamics model is employed to conduct a simulation analysis on the strategies of both the government and enterprises. As a powerful tool for studying dynamic issues in complex systems, system dynamics can effectively characterize the decision-making behaviors of stakeholders from a systemic perspective. This study uses VENSIM (7.3.5) software to construct an SD model of decision making and performs simulation analysis to explore the evolutionary strategies among the various entities. The SD model is illustrated in Figure 1.

4.2. Simulation Scenarios and Parameter Design

In the global shipping industry’s active pursuit of green transition, government and corporate decision making are influenced by a complex interplay of external factors. To thoroughly analyze this intricate decision-making environment, we construct a multi-dimensional scenario framework encompassing time, technological development, societal attention, policy intensity, and market competition. This framework allows for simulating decision-making variations and trends under different scenarios.

4.2.1. Temporal Scenarios

Against the backdrop of the global shipping industry’s green transition, the development of green shipping fuel supply chains represents a dynamic process with distinct characteristics at different stages, which forms the basis for establishing the temporal scenarios. The phased timeline primarily follows the general progression of green shipping fuels from research and development to widespread adoption while accounting for corresponding changes in infrastructure construction and market acceptance levels. In accordance with the International Energy Agency’s (IEA) phase classification standards for energy transitions and considering the capital-intensive nature of the shipping industry, the temporal dimension is divided into short-term (0–5 years), medium-term (5–15 years), and long-term (>15 years) phases [20]. During the short-term phase (0–5 years), green shipping fuel applications are predominantly in the exploratory and validation stage, with infrastructure development starting virtually from scratch and requiring substantial upfront investment. At this stage, policies primarily focus on pilot projects aimed at accumulating practical experience through localized trials to inform subsequent large-scale implementation. The boundary conditions for this phase depend on the completion level of technological validation and the actual effectiveness of pilot policies; successful validation and significant pilot results may accelerate the transition to the next phase, while setbacks could prolong the short-term period. The medium-term phase (5–15 years) sees the gradual maturation of applications, entering a diffusion stage where scaled implementation becomes feasible while industry standardization becomes imperative. This phase division is based on application stability and market demand for large-scale supply, with boundaries determined by the pace of technological diffusion, market expansion rate, and standardization progress. In the long-term phase (>15 years), applications reach full maturity with the market-driven replacement of conventional fuels by green alternatives. This scenario assumes complete technological maturity and fully developed markets, with boundaries primarily shaped by the overall progress of the global shipping industry’s green transition and the degree of international coordination. The specific classification criteria are presented in Table 3.

4.2.2. Technology Development Scenario

Technology serves as the core driving force for the development of green shipping fuel supply chains. Different levels of technological maturity create completely different decision-making environments. With reference to the International Renewable Energy Agency’s (IRENA) evaluation system for new energy technologies, the scenarios are categorized along three dimensions: fuel production efficiency, storage and transportation safety, and supply chain coordination [21]. Under the low technological maturity scenario, fuel production efficiency is low. For example, green ammonia synthesis consumes more than 12 kWh/kg of energy, leading to high production costs that make large-scale production difficult to achieve. At the same time, there are prominent safety hazards in storage and transportation, such as hydrogen storage requiring special equipment and conditions, which increases operational risks. The boundary of this scenario lies in whether key technological breakthroughs are achieved, such as reductions in green ammonia synthesis energy consumption or effective solutions to storage and transportation safety issues. When key technological breakthroughs are achieved, such as cryogenic liquid hydrogen storage costs decreasing to USD 3/kg, the scenario transitions to medium technological maturity. However, at this stage, supply chain coordination is insufficient, with inadequate cooperation between upstream and downstream enterprises, affecting overall development efficiency. The boundary of this phase depends on whether effective coordination can be achieved across all supply chain segments to establish sound cooperation mechanisms. When the entire supply chain reaches mature development, with the widespread adoption of methanol–ammonia–hydrogen multi-fuel-compatible bunkering systems, the scenario enters high technological maturity. The main boundary at this stage lies in preventing technological monopolies and maintaining market innovation vitality, as shown in Table 4.

4.2.3. Social Awareness Scenario

The level of social attention on green shipping fuels significantly influences decision making by both governments and enterprises, which forms the basis for establishing this social awareness scenario framework. The classification of social awareness levels primarily considers public environmental consciousness, behavioral characteristics, and the resulting pressure exerted on governments and enterprises, dividing social awareness into low, medium, and high levels. Under the low social awareness scenario, environmental issues are marginalized at the societal level, with consumer acceptance of green premiums below 5%, indicating low public awareness and demand for green shipping fuels. The boundary condition depends on the awakening of public environmental consciousness and the intensity of environmental organizations’ activities. When environmental organizations begin applying pressure and the penetration rate of green financial products reaches 30–50%, the scenario transitions to medium social awareness. At this stage, public attention to environmental protection increases, and capital markets begin focusing on the green shipping sector. The boundary condition lies in the further escalation of public environmental demands and the development level of green financial markets. When climate activism surges, as evidenced by global shipping strike events demonstrating strong public demand for emission reductions in the shipping industry, and consumer willingness to pay premiums exceeds 20%, the scenario enters high social awareness. The boundary condition depends on whether public demands for green shipping are met and whether government and corporate response measures prove effective, as shown in Table 5.

4.2.4. Policy Intensity Scenario

Policy plays a crucial guiding and regulatory role in the development of green shipping fuel supply chains, with different policy intensities leading to distinct government–enterprise dynamics. The classification of policy intensity is primarily based on the policy instruments adopted by governments and their binding constraints on enterprises. For example, the 2023 IMO Greenhouse Gas Emission Reduction Strategy is also divided into three stages, setting a long-term goal of achieving net-zero emissions around 2050, while establishing phased emission reduction targets for 2030 and 2040. For instance, by 2030, emissions should be reduced by at least 20% (with a target of 30%) compared to 2008 and, by 2040, the reduction targets are 70% (with a target of 80%). Drawing from the practical experience of the EU ETS and IMO emission reduction policies, policy intensity is divided into three levels: weak, moderate, and strong [22]. Under weak policy intensity, governments mainly rely on voluntary emission reduction agreements without clear binding targets. This grants enterprises greater autonomy but may also lead to superficial green commitments without substantive emission reduction measures. The boundary of this scenario depends on corporate self-discipline and the effectiveness of government oversight. When governments implement carbon tax + partial subsidy policies (e.g., the EU ETS covering shipping), the scenario transitions to moderate policy intensity. At this stage, the fairness of subsidy allocation becomes a focal point of government–enterprise interaction. Governments aim to target subsidies to enterprises genuinely committed to green transition, while enterprises seek more subsidies to reduce costs. The boundary lies in policy adjustments and optimizations, as well as enterprises’ adaptability to regulatory changes. Under strong policy intensity, governments enforce mandatory fuel quotas (e.g., IMO’s 2030 mandate for ≥5% ammonia fuel adoption) coupled with infrastructure nationalization policies. Here, the risk of excessive market intervention rises, requiring negotiation between governments and enterprises on policy boundaries and corporate operational autonomy. The boundary depends on the appropriateness of government intervention and enterprises’ ability to survive and thrive under regulatory constraints, as shown in Table 6.

4.2.5. Market Competition Scenario

The market structure determines corporate behavior, and different degrees of market competition will drive enterprises to adopt different strategies, which forms the basis for setting the market competition scenario. Under the low market competition scenario, regional monopolies exist (e.g., a single enterprise dominates fuel supply), giving the dominant enterprise strong bargaining power in the market. The boundary lies in the difficulty for other potential competitors to enter the market and changes in market demand. When the market forms an oligopolistic competition dominated by 3–5 suppliers, it enters the medium market competition scenario. At this stage, enterprises will choose differentiated technology routes and provide unique products and services to stand out from the competition. The boundary of this scenario depends on the speed of technological innovation and the effectiveness of differentiation strategies. When the market shows a state of perfect competition, with multiple fuels and suppliers competing, it enters the high market competition scenario. Enterprises face fierce price competition while protecting their technological innovations through patent barriers. The boundary of this scenario lies in market saturation and enterprises’ cost control capabilities, as shown in Table 7.

4.3. Scenario Simulation Results and Analysis
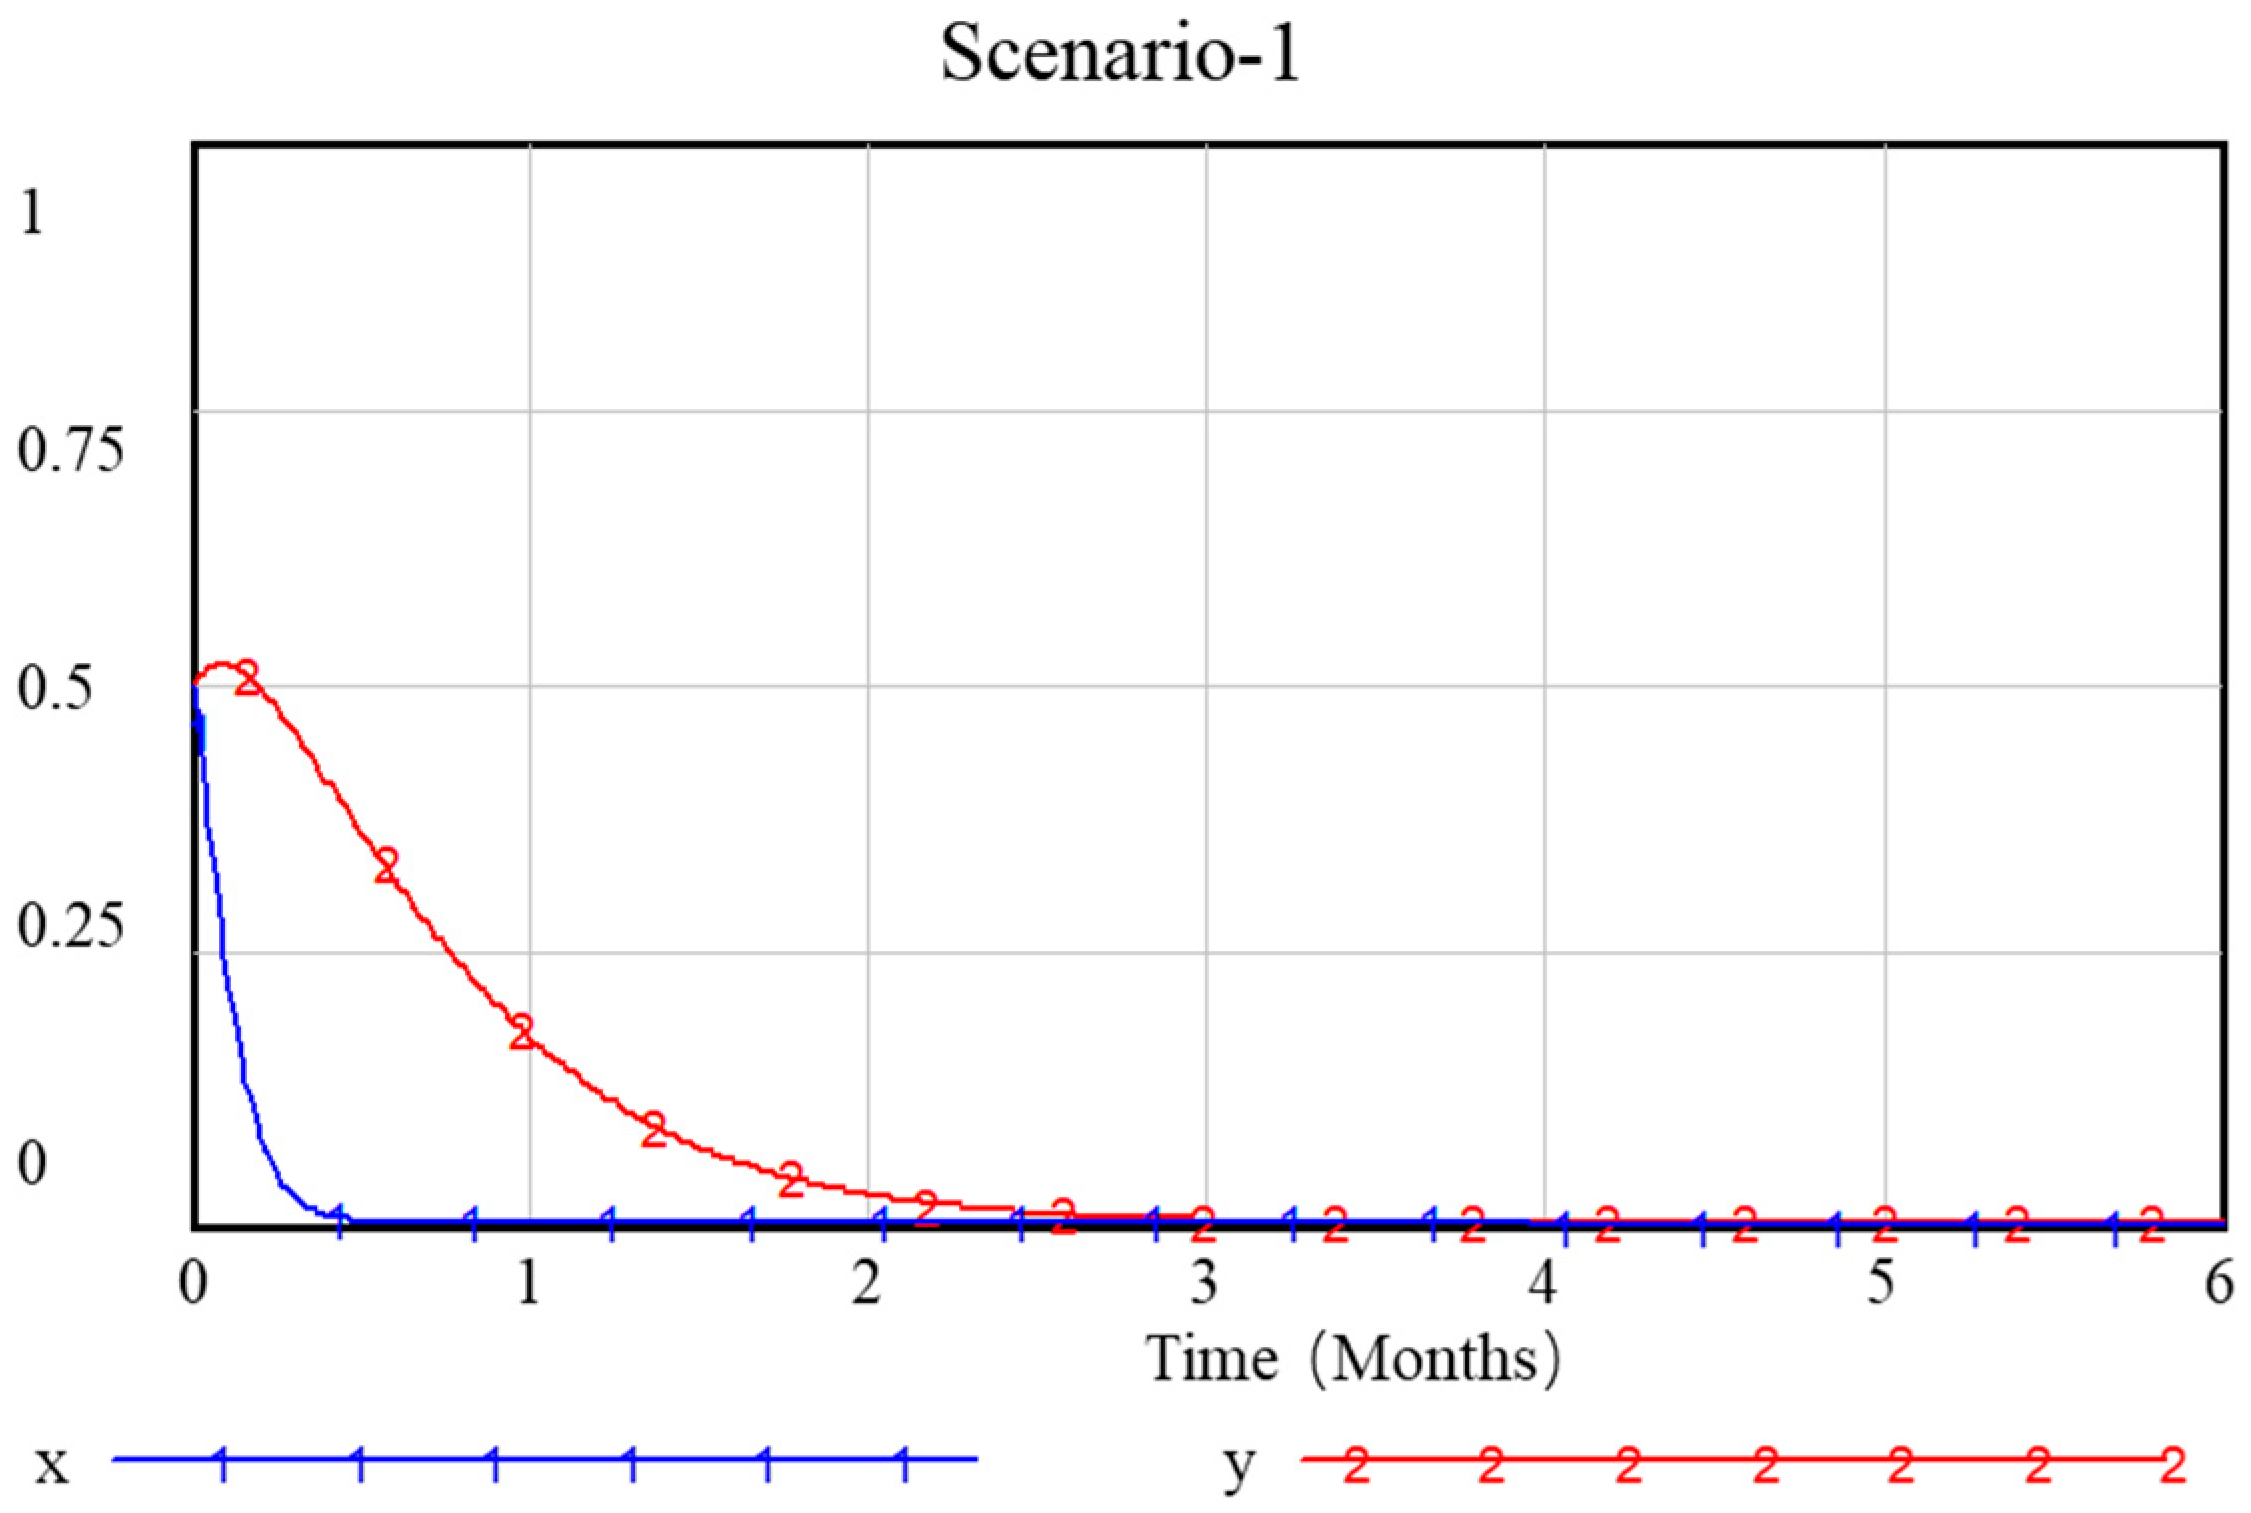
The model initial conditions are set as INITIAL TIME = 0; FINAL TIME = 12; TIME STEP = 0.0015625. Table 8 shows the parameter values based on five independent dimensions (time, technology development, social attention, policy intensity, market competition), with each dimension containing three scenarios. Parameter values for each dimension are set independently to reflect different external environments’ varying impacts on government–enterprise decisions. Units are in million USD/year.
(1)
Simulation under initial conditions
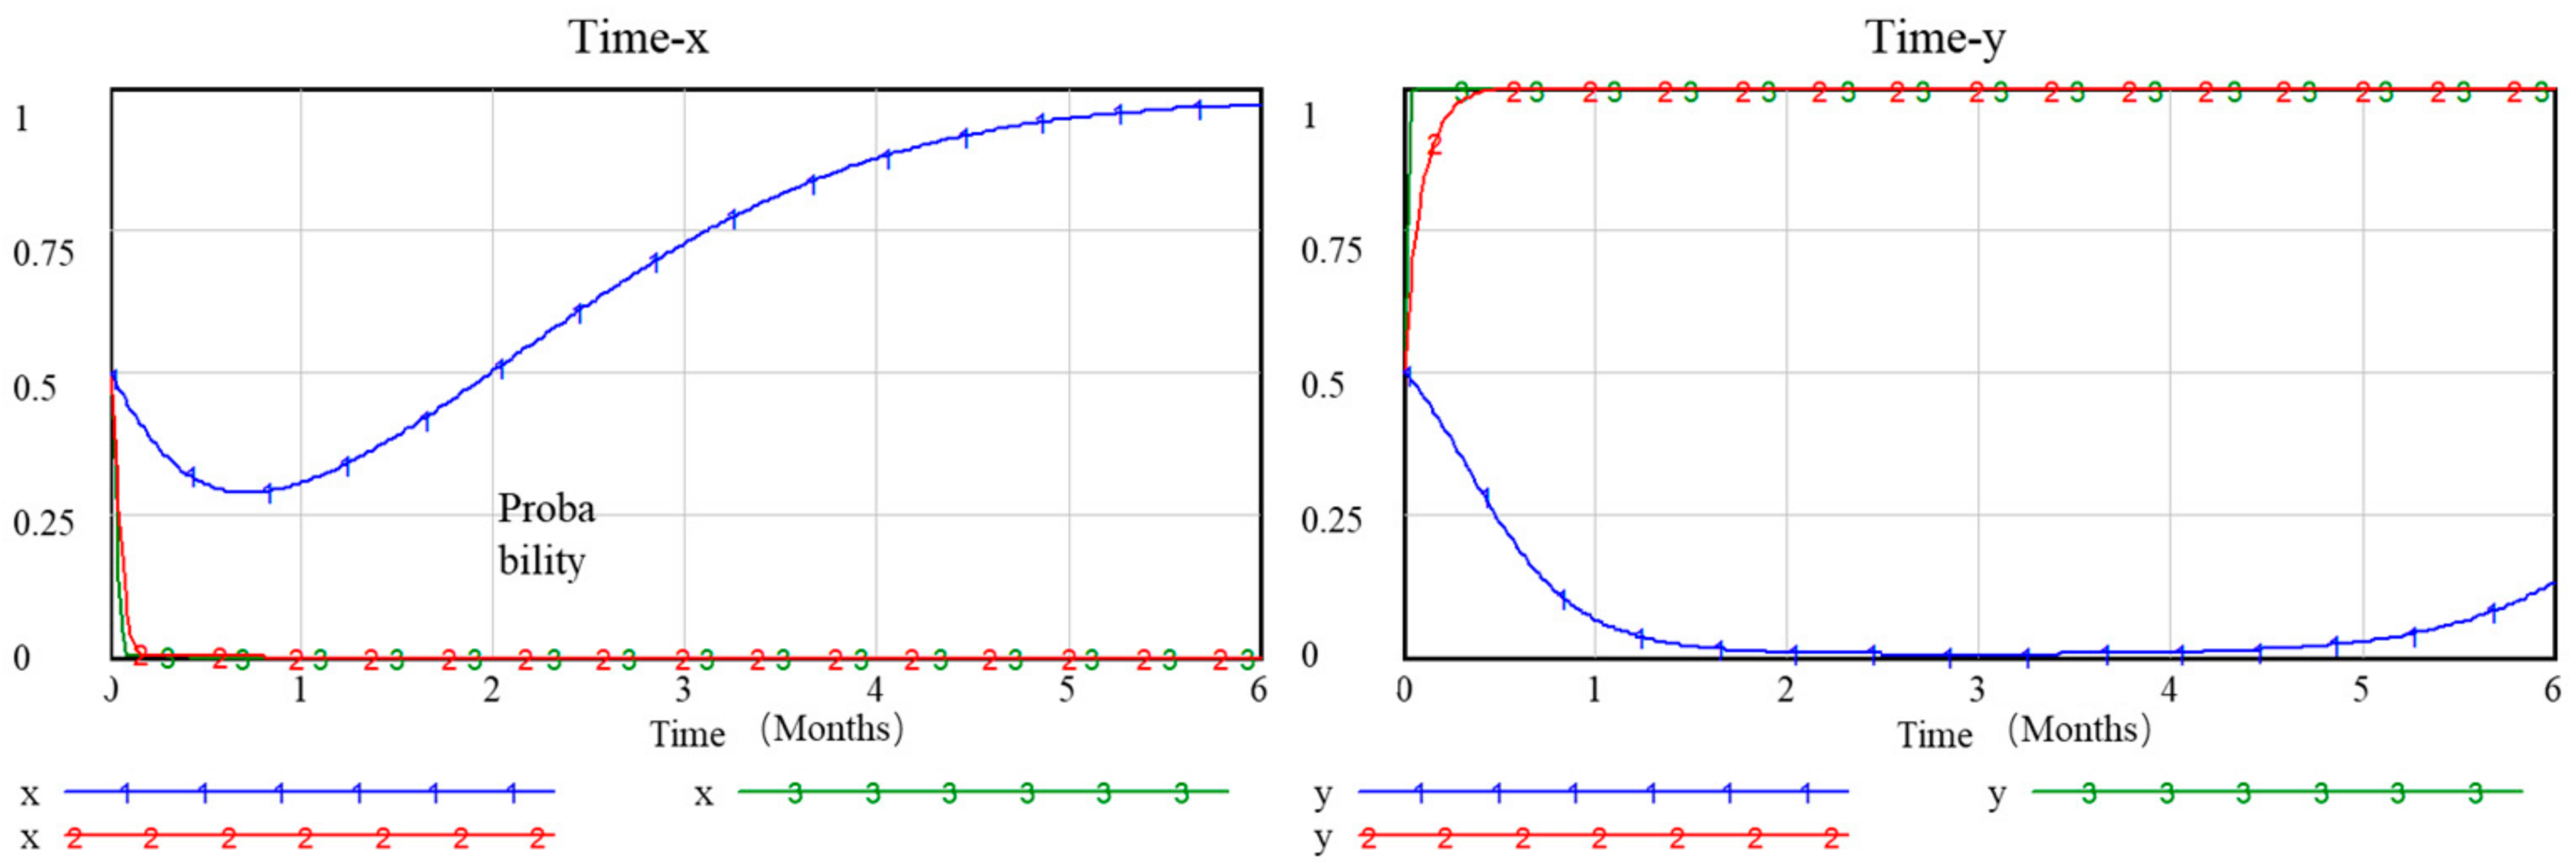
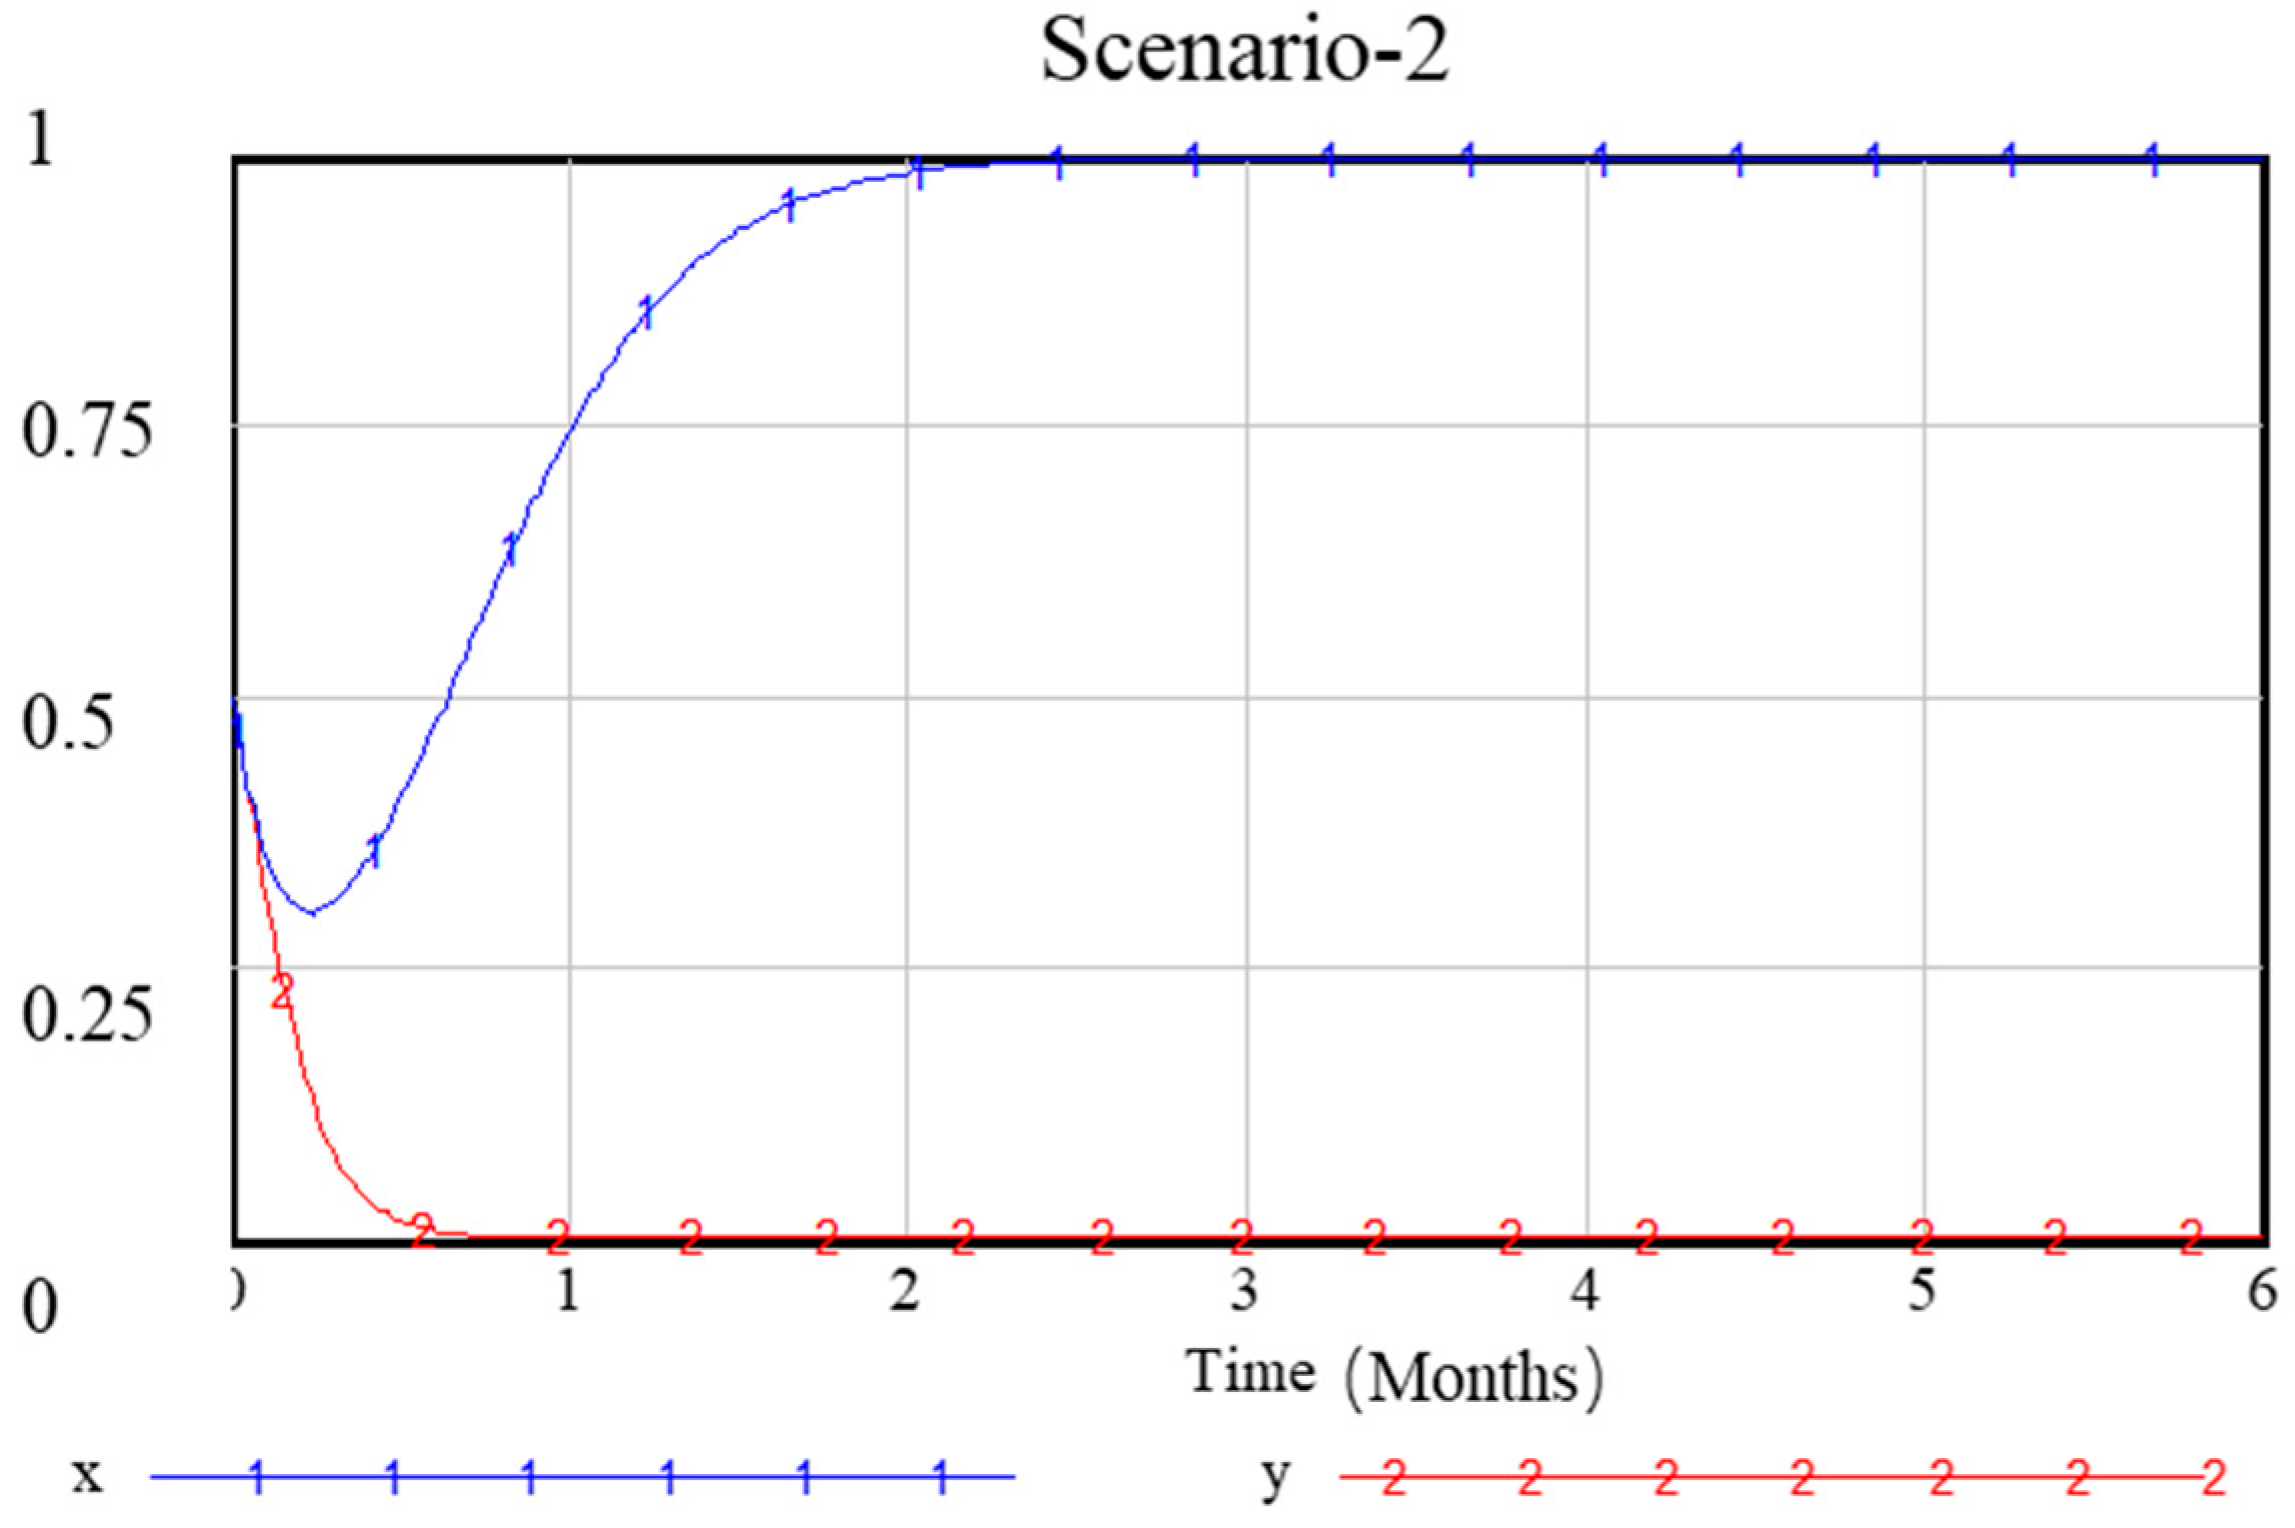
Using the short-term parameters from the time dimension as the initial parameters, with initial decision probabilities all set to 0.5, the simulation calculation is conducted, and the results are shown in Figure 2. In the initial state, both government and enterprise decisions show unstable fluctuations. Enterprise decisions exhibit a tendency to follow government decisions, with a certain time lag in the distribution: when government decisions evolve toward being less active, enterprise decisions also shift toward non-investment; when government decisions turn more active, enterprise decisions also change toward investment.
(2)
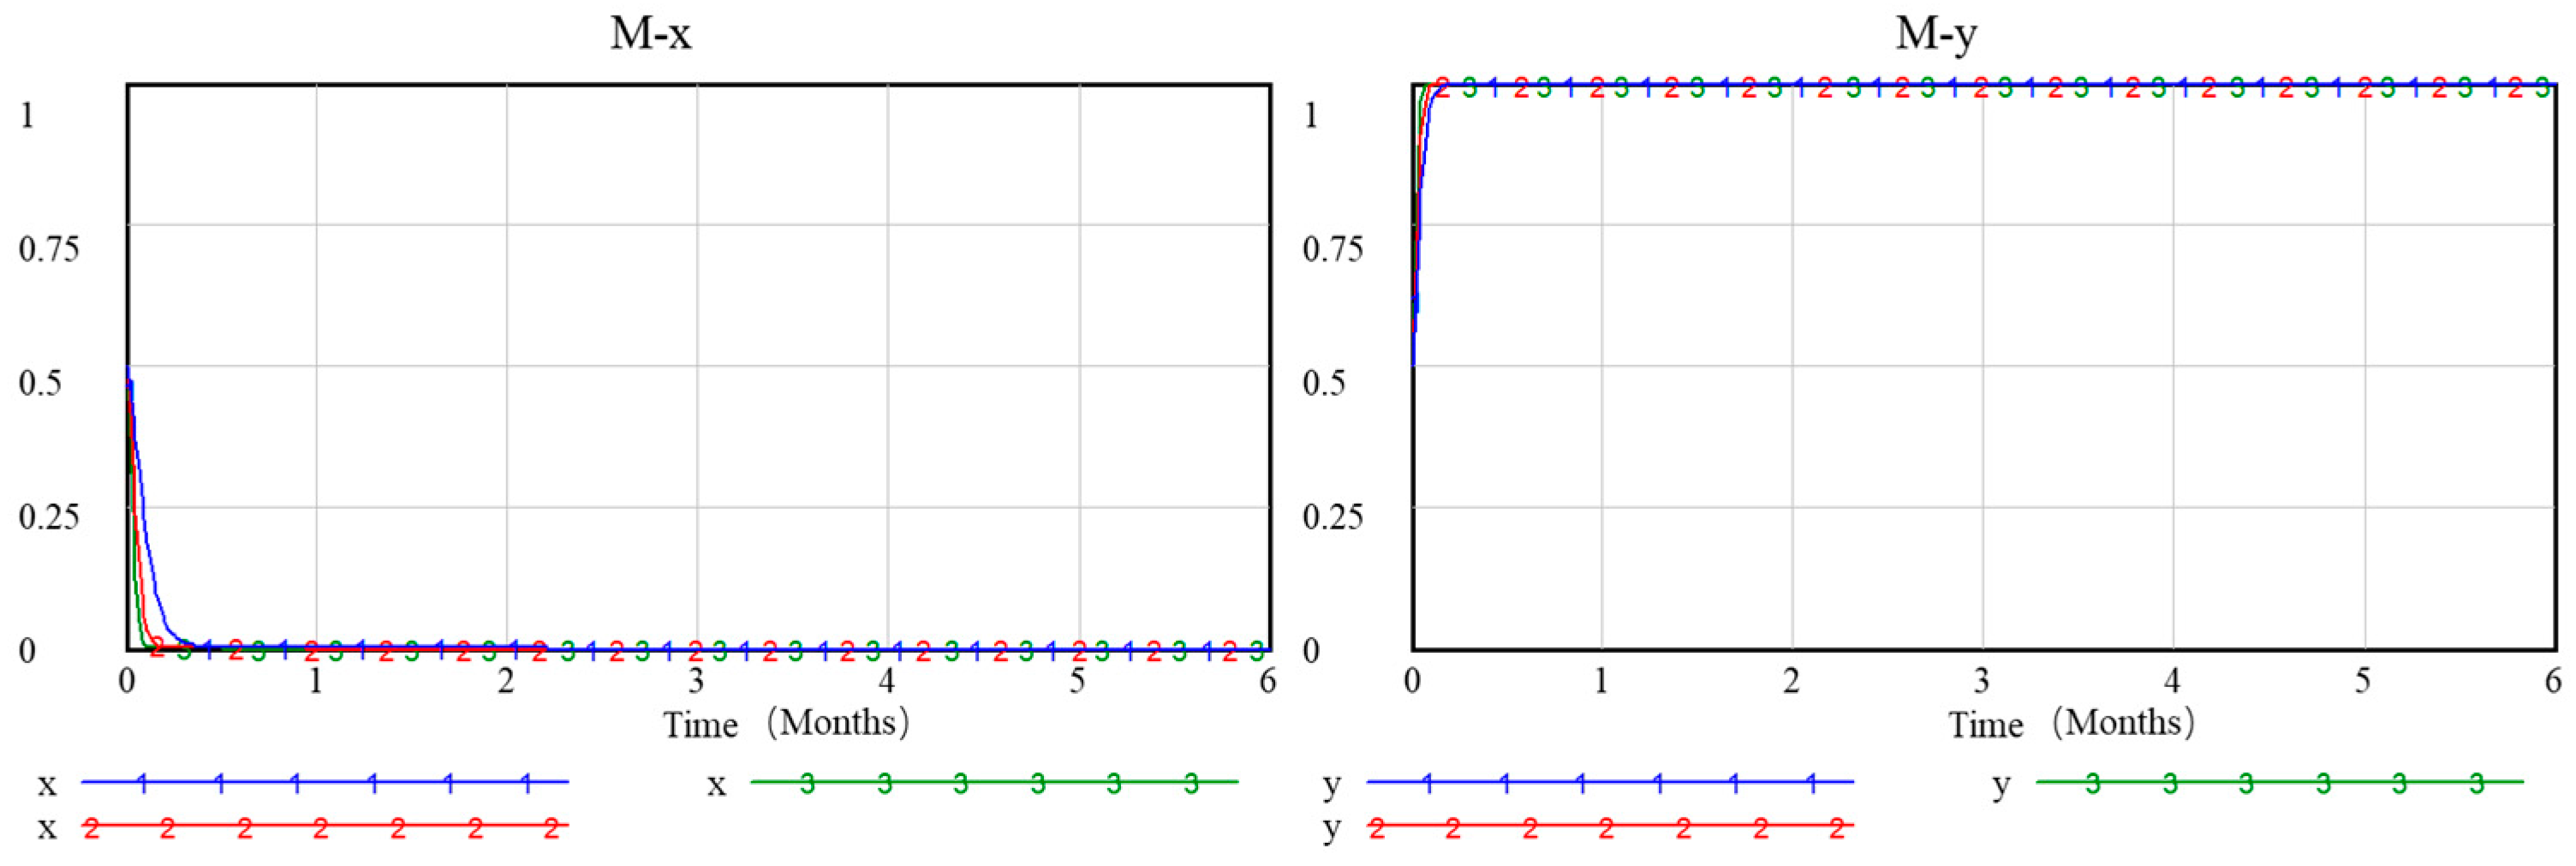
Numerical simulation under temporal scenarios
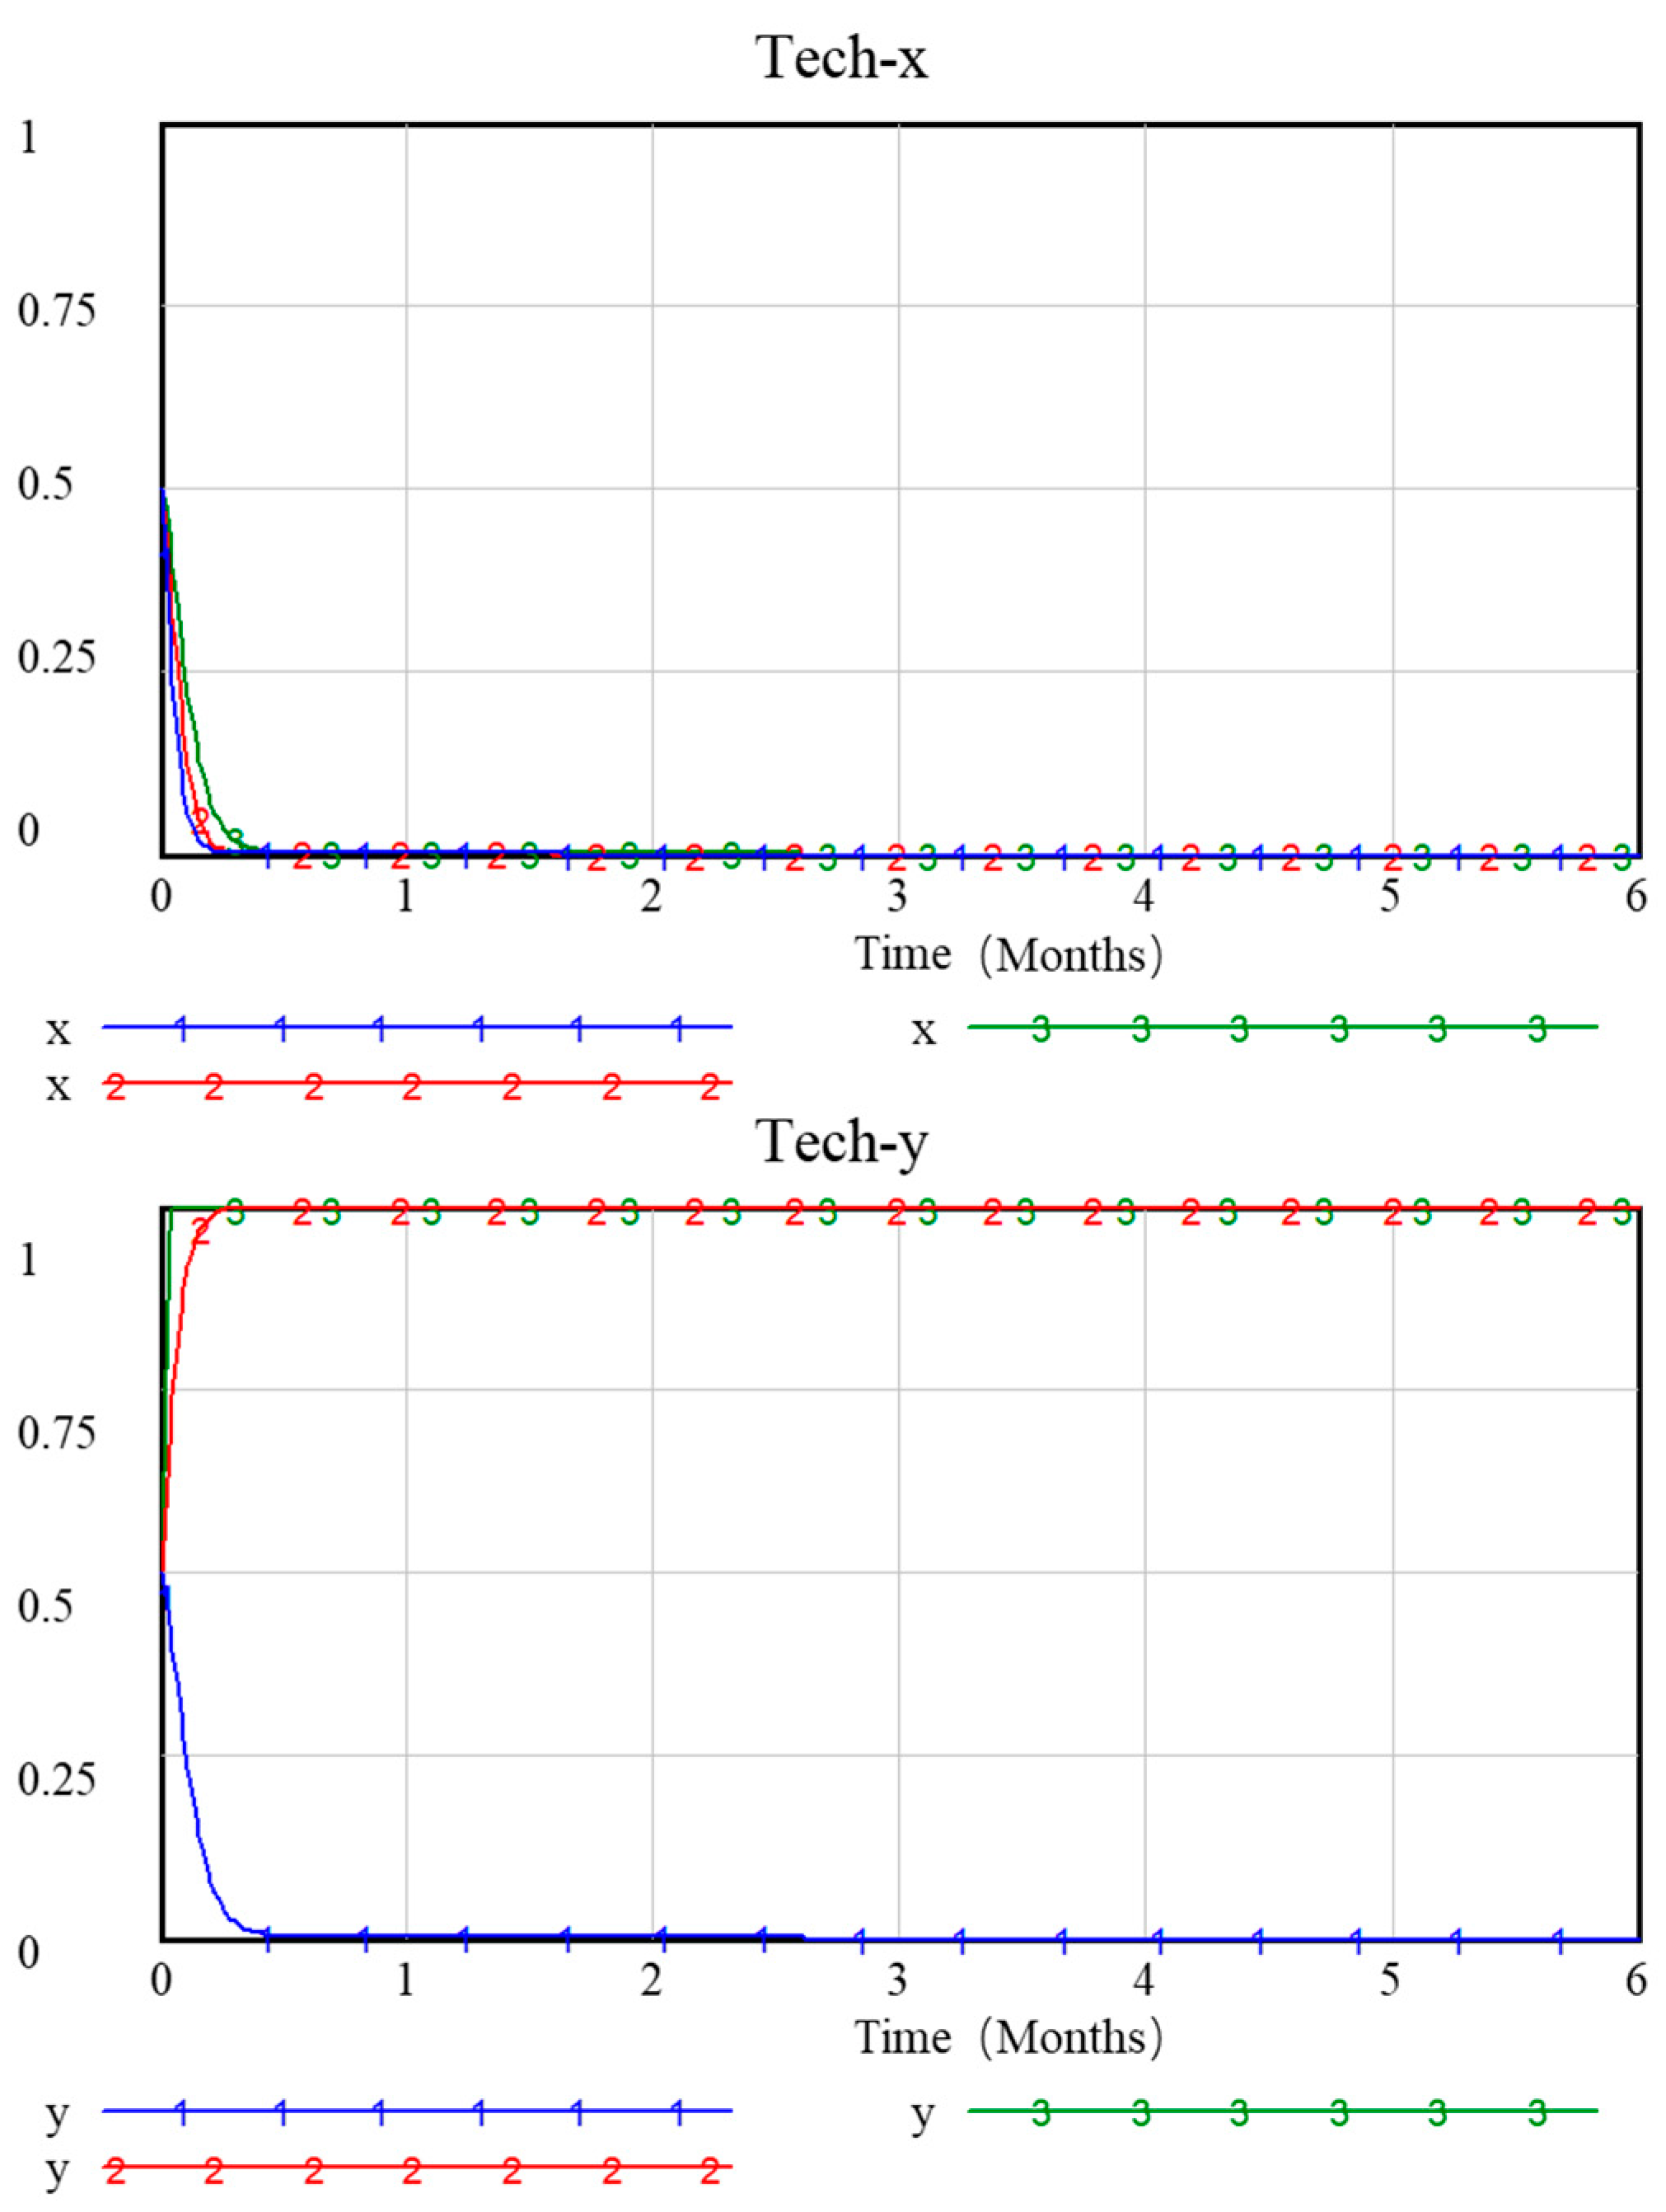
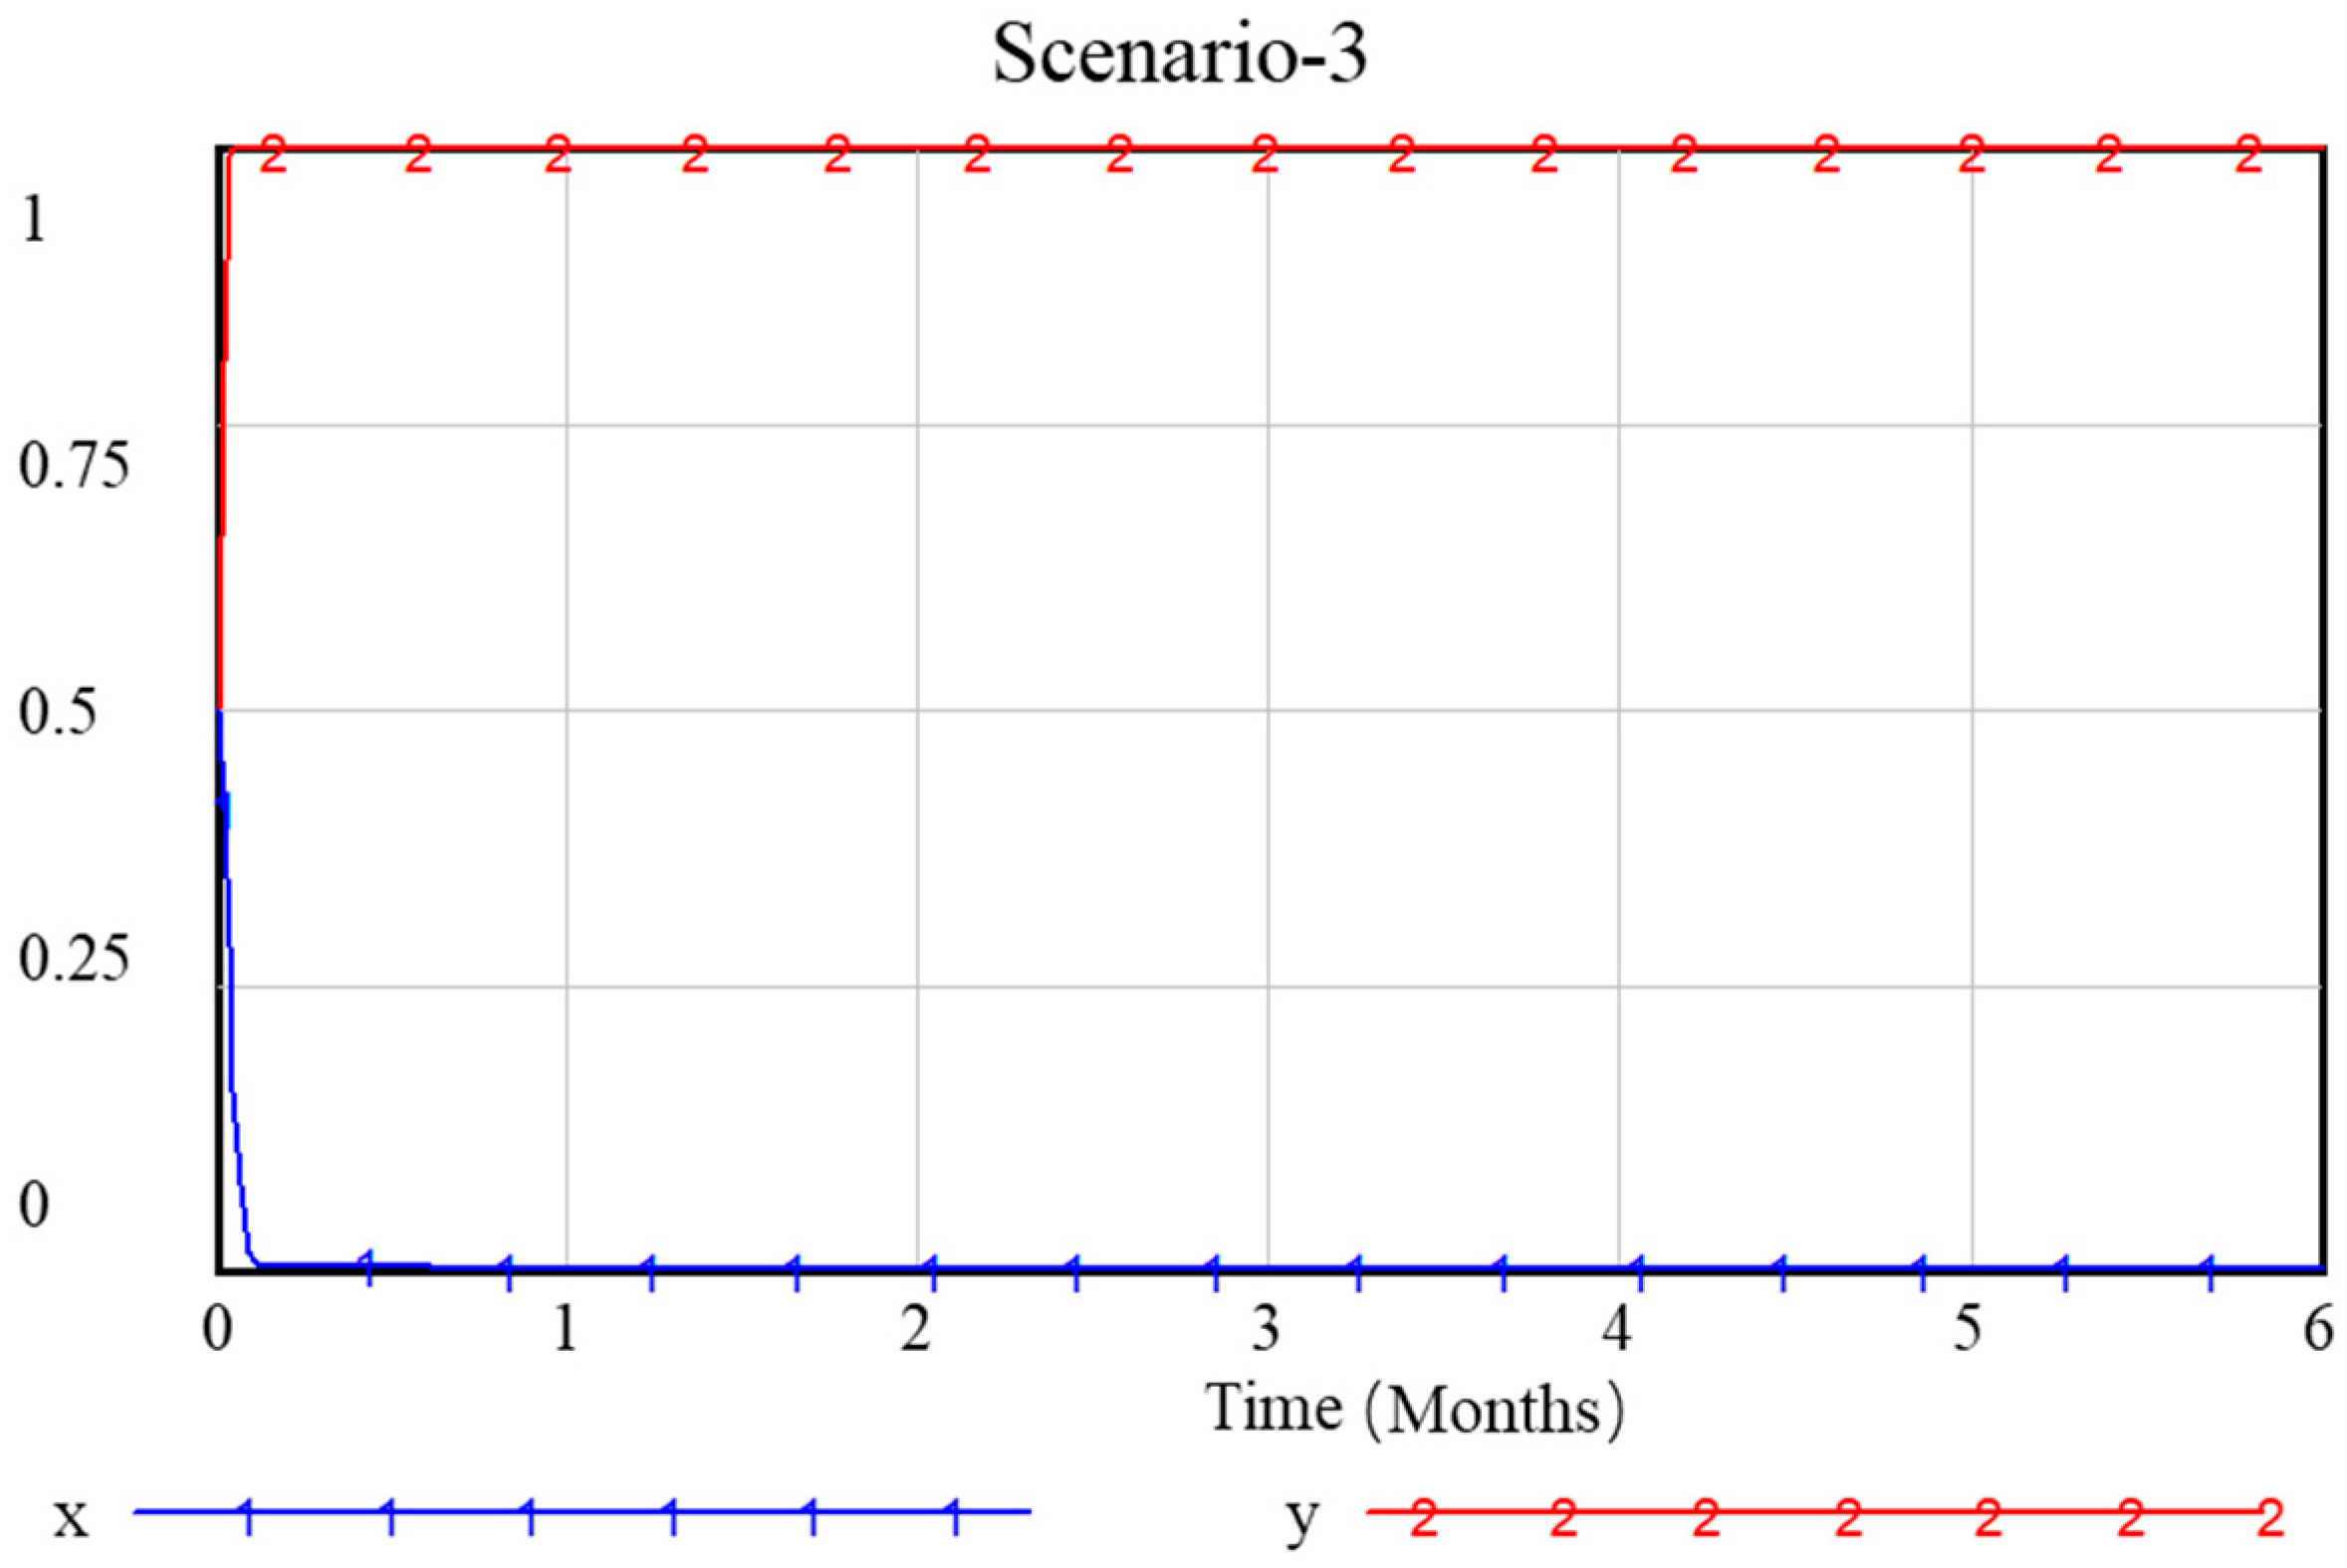
Parameter adjustments are made according to short-term, medium-term, and long-term phases. Based on scenario characteristics, environmental benefits, technology spillover, and socio-economic benefits all maintained growth. The government directly participates in infrastructure investment in early stages, and then gradually shifts to enterprise subsidies in the mid–late stages. Infrastructure construction costs decrease progressively, while subsidy costs and government carbon tax revenue gradually increase. For enterprises, market maturity improves over time, with sales revenue, investment costs, and subsidies received all increasing, while potential losses gradually decrease. Parameters for short-, medium-, and long-term scenarios are input into the model, respectively, yielding the results shown in Figure 3.
Figure 3 reveals that, in the short term, the government tends to adopt active policies. However, as the market remains in its incubation phase, enterprises—seeing limited short-term returns—predominantly choose non-investment decisions. With the passage of time and gradual market maturation, enterprises rapidly shift toward investment-oriented decisions. Concurrently, as market forces begin to dominate industrial development during this temporal phase, the government—facing increasing subsidy costs—starts transitioning toward less active policy considerations.
(3)
Numerical simulation under technological scenarios
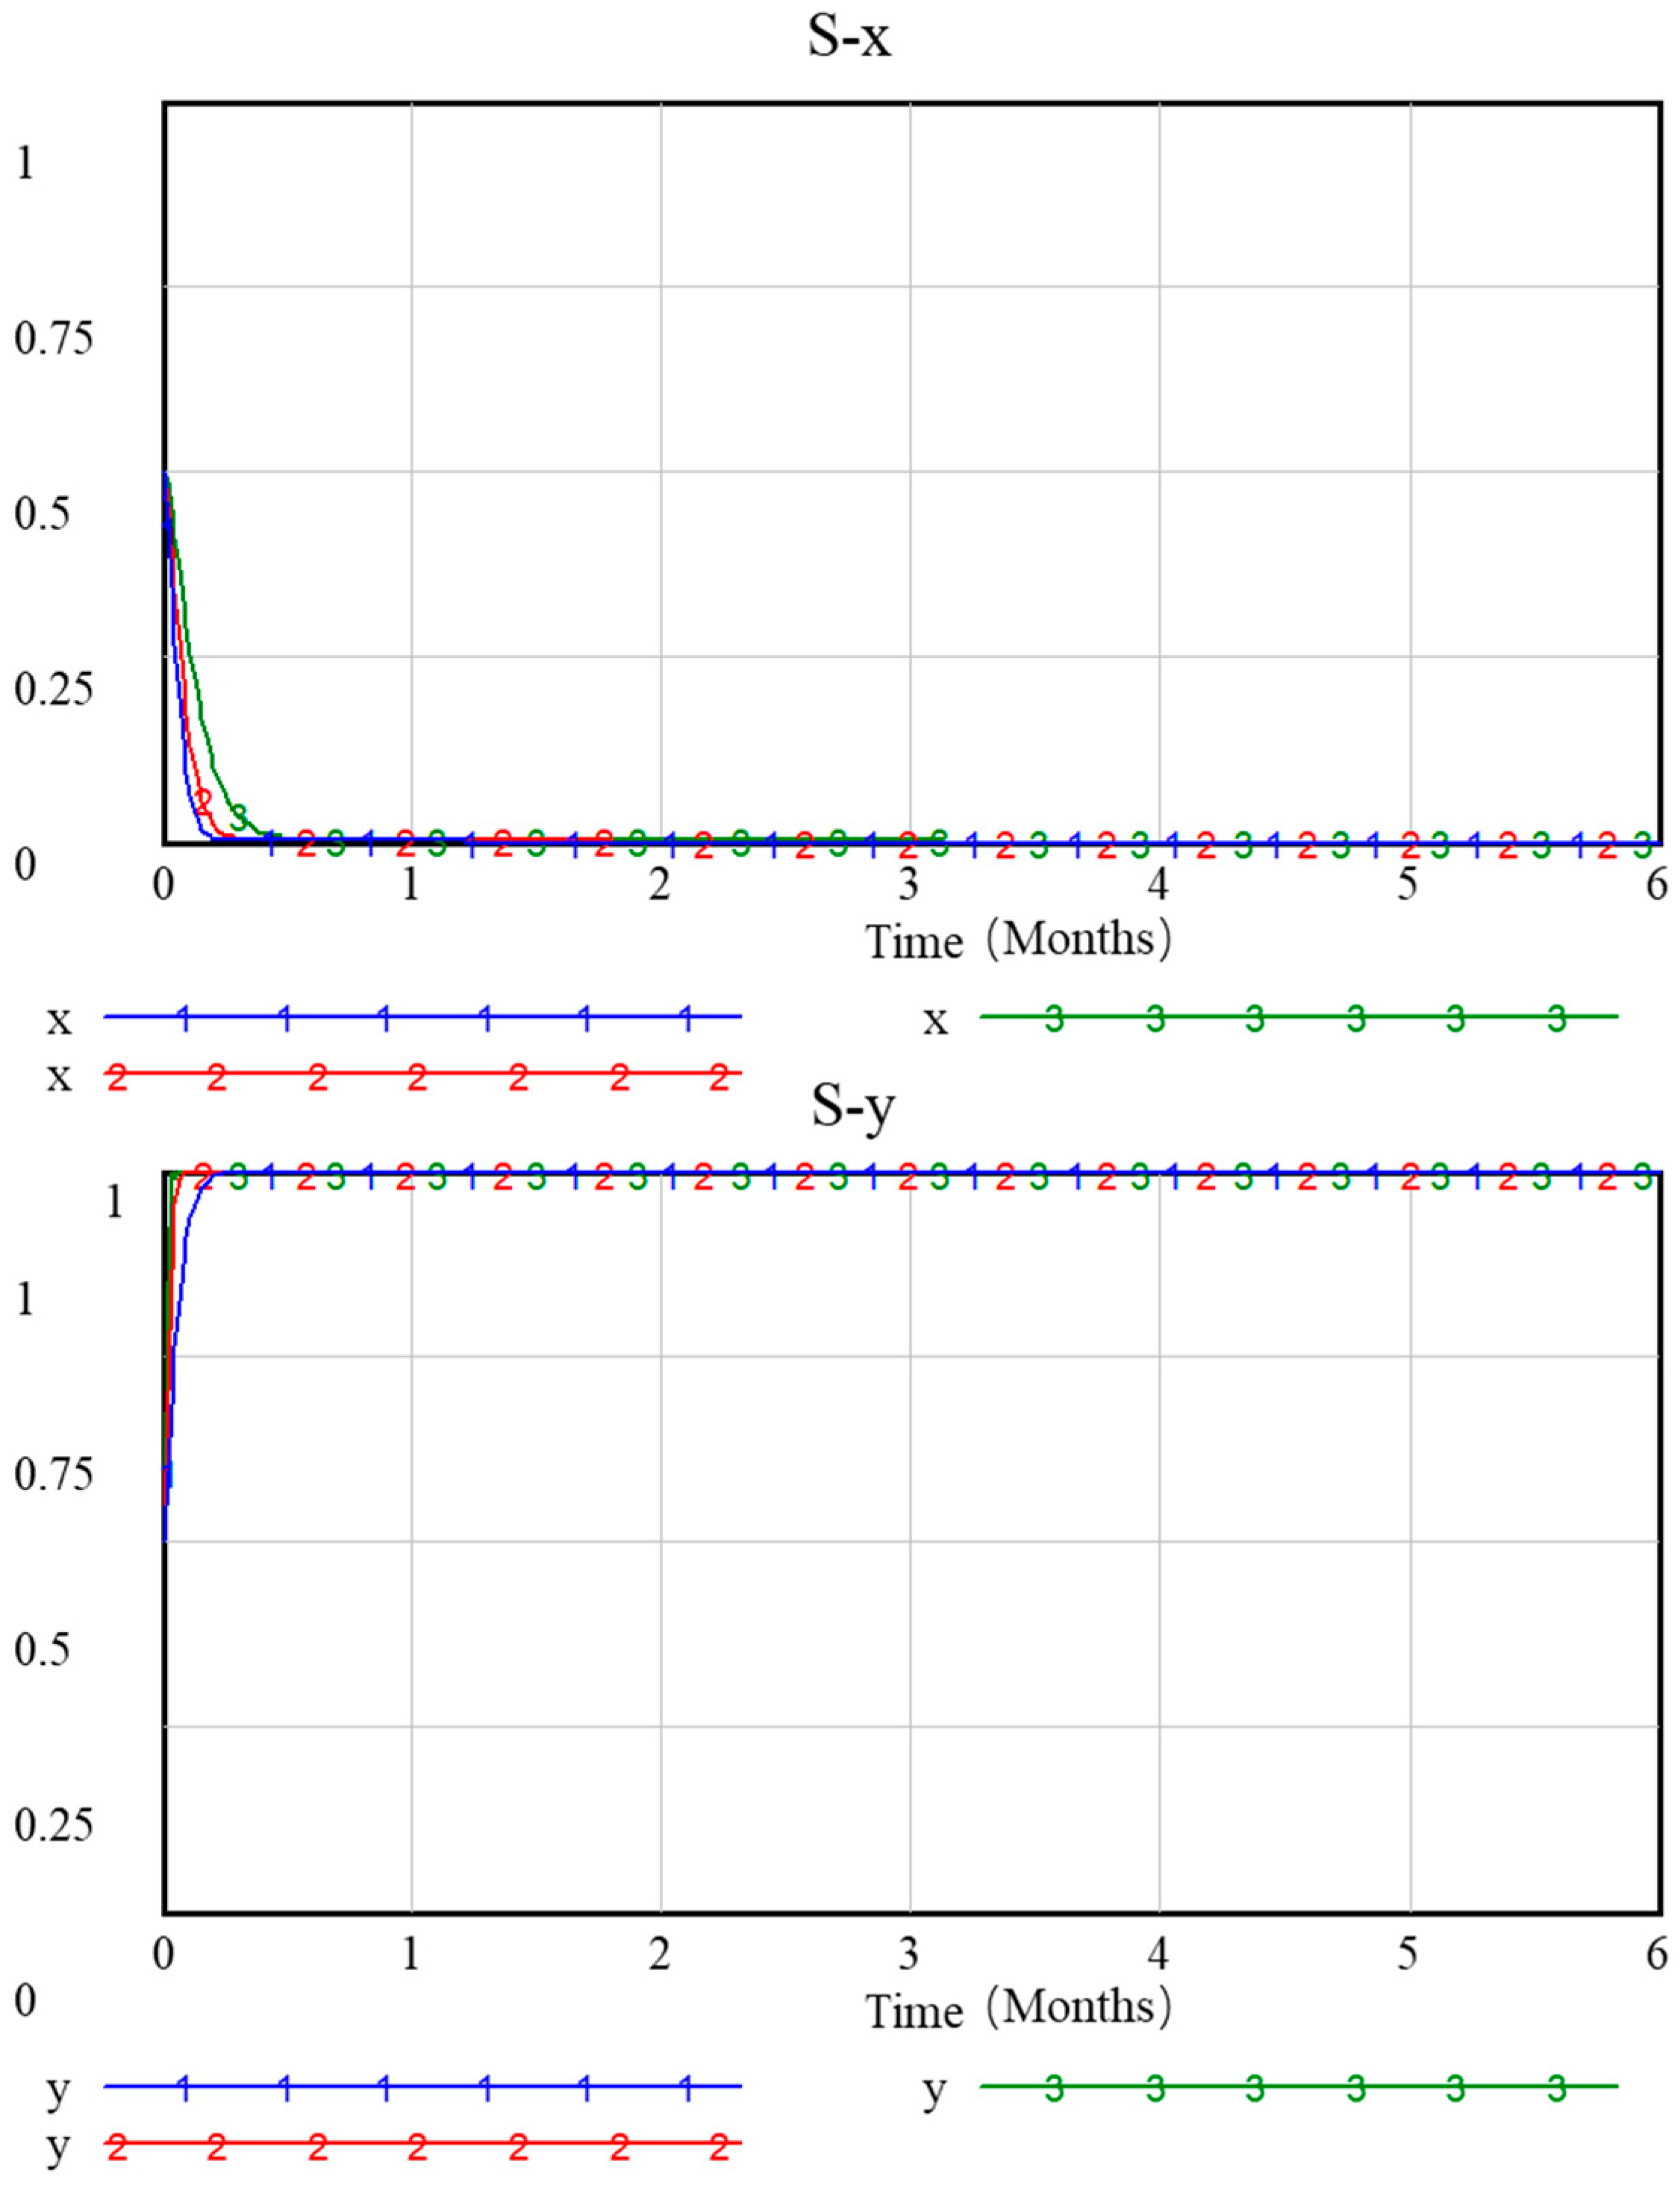
Parameter adjustments are made according to low-, medium-, and high-maturity phases. Based on scenario characteristics, environmental benefits, technology spillover, and socio-economic benefits all maintain growth. The government directly participates in infrastructure investment and provides subsidies in early stages, but gradually withdraws in the mid–late stages. Infrastructure construction costs and subsidy expenditures progressively decrease. For enterprises, technological levels and application maturity gradually improve under this scenario. Enterprise sales revenue maintains growth while investment costs significantly decrease, with corresponding subsidies further reduced and potential losses progressively diminishing. Parameters for low-, medium-, and high-maturity phases are input into the model, respectively, yielding the results shown in Figure 4.
Figure 4 demonstrates that technological development has minimal impact on government decision making. However, for enterprises, as technological advancements progressively reduce investment costs, their decisions rapidly shift from non-investment to investment. With further technological progress, enterprise decisions ultimately stabilize at choosing active investment.
(4)
Numerical simulation under social awareness scenarios
Parameter adjustments are made according to low, medium, and high awareness levels. Based on scenario characteristics, environmental benefits, technology spillover, and socio-economic benefits all maintain growth. The government directly participates in infrastructure investment in early stages but gradually shifts to increasing enterprise subsidies in mid–late stages. Infrastructure construction costs progressively decrease while subsidy expenditures gradually increase. For enterprises, under rising social attention and advocacy for low-carbon fuels, customer preference for low-carbon fuels strengthens significantly. This leads to substantial growth in enterprise sales revenue, continued reduction in investment costs, the corresponding decrease in subsidies received, and a significant reduction in potential losses. Parameters for low, medium, and high awareness levels are input into the model, respectively, yielding the results shown in Figure 5.
From Figure 5, it can be observed that social attention influences both government and enterprise decision making. For the government, it reduces the selection rate of inactive policies, while increased social attention accelerates fluctuations in enterprise investment decisions, causing enterprises to stabilize more quickly on choosing active investment.
(5)
Numerical simulation under policy intensity scenarios
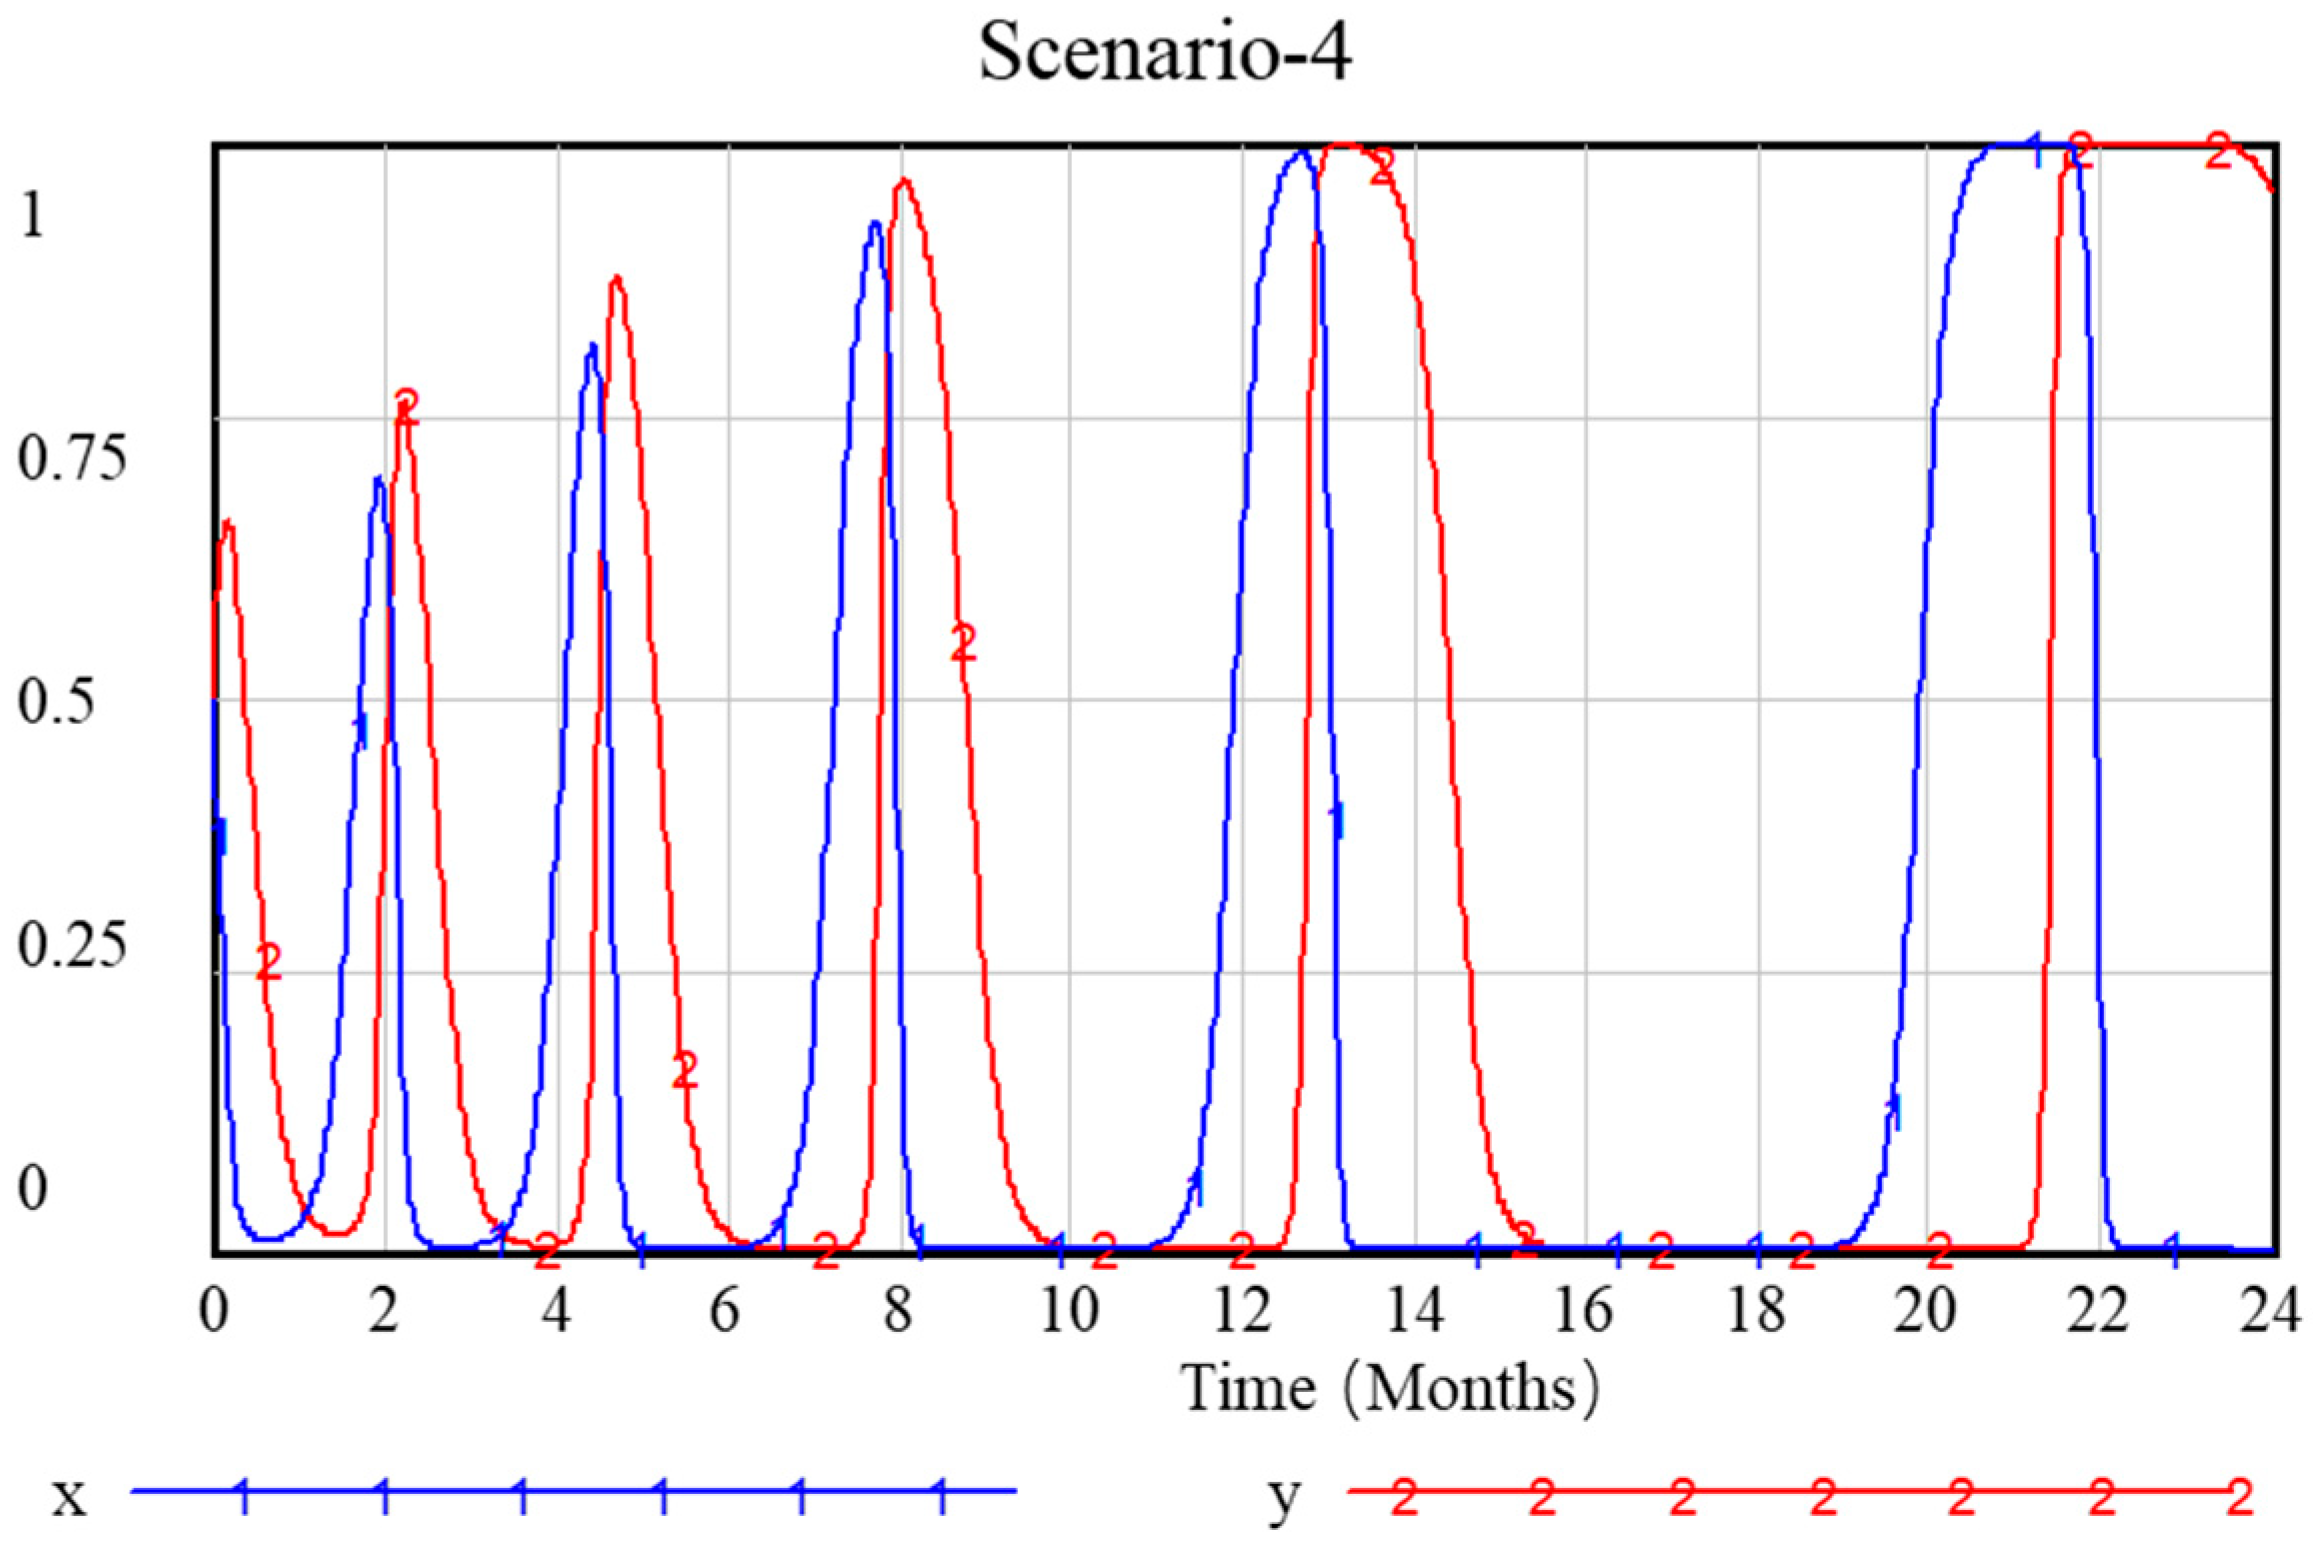
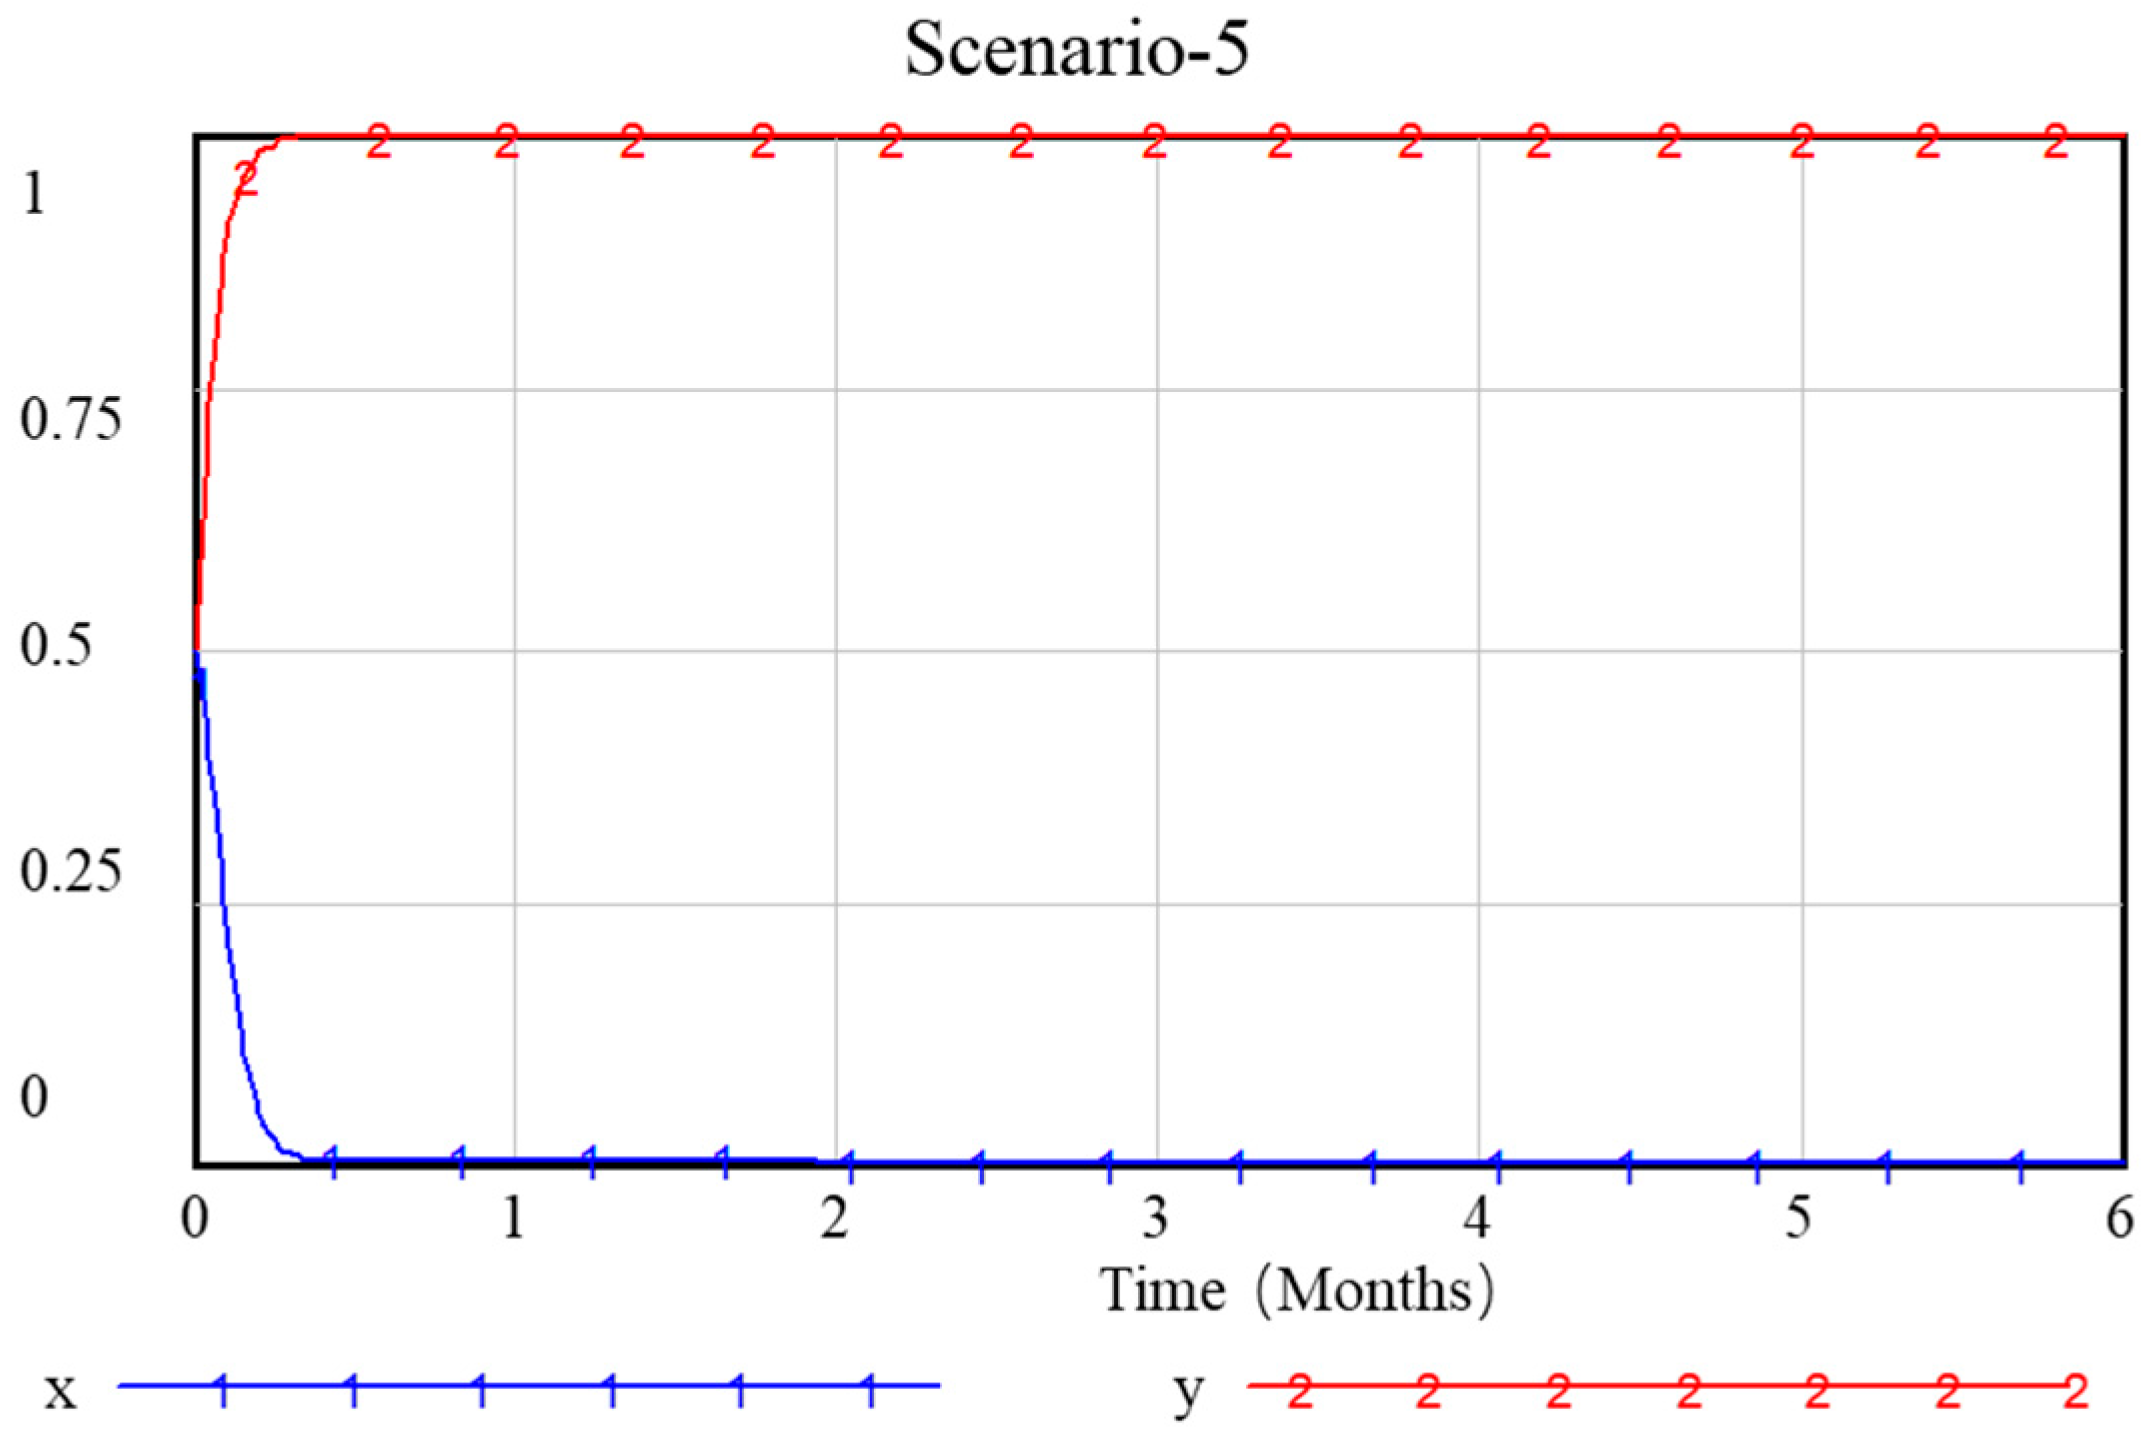
Parameter adjustments are made according to weak, moderate, and strong policy dimensions. Based on scenario characteristics, environmental benefits, technology spillover, and socio-economic benefits all maintain growth. The government’s direct participation in infrastructure investment, subsidies to enterprises, and carbon tax revenue all increase significantly with stronger policy intensity. For enterprises, the main impact is significantly increased subsidies received as policy intensity grows. Parameters for weak, moderate, and strong policy phases are input into the model, respectively, yielding the results shown in Figure 6.
Figure 6 demonstrates that policy intensity significantly impacts both government and enterprise decision making. Among the three hypothetical scenarios, both weak and strong policy scenarios show government decisions shifting toward inactivity while enterprise decisions shift toward investment. However, under moderate policy intensity, policy ineffectiveness emerges; government decisions become more active but, correspondingly, lead to enterprises abandoning investment, leaving the government to bear market demand for green marine fuel supply.
(6)
Numerical simulation under market competition scenarios
Parameter adjustments are made according to low, medium, and high competition dimensions. Based on scenario characteristics, environmental benefits, technology spillover, and socio-economic benefits all maintain growth. The government’s direct participation in infrastructure investment, subsidies to enterprises, and carbon tax revenue all increase significantly with stronger policy intensity. For enterprises, as market mechanisms become more effective and competition intensifies, the demand for green marine fuel supply grows substantially, highlighting enterprises’ dominant market role. This is mainly reflected in significant growth in enterprise sales revenue and markedly increased subsidies received with stronger policy intensity. Parameters for low, medium, and high competition dimensions are input into the model, respectively, yielding the results shown in Figure 7.
Figure 7 reveals that market competition significantly impacts both government and enterprise decision making. Among the three hypothetical scenarios, the analysis shows that, as market competition intensifies, enterprises demonstrate a stronger tendency to adopt active investment decisions, while governments increasingly prefer to let market forces dominate and, consequently, adopt less active policies.
(7)
Numerical simulation under comprehensive scenarios
To further simulate possible decision-making environments in real development, parameters from different stages of the above five dimensional scenarios are selected and combined to form the following five scenarios for simulation. Scenario 1 is the start-up type, assuming low environmental benefits, low government costs, and high enterprise investment. Scenario 2 is the transition type, assuming significant technology spillover, increased carbon tax revenue, and growing enterprise income. Scenario 3 is the mature type, assuming the highest environmental benefits, high government costs, and explosive enterprise income growth. Scenario 4 is the policy-driven type, assuming short-term phase and high social attention. Scenario 5 is the market-driven type, assuming high technology but weak policies, with high potential losses. Specific parameters are shown in Table 9.
The parameters of comprehensive Scenarios 1–5 are input into the model for simulation, with the results shown in Figure 8, Figure 9, Figure 10, Figure 11 and Figure 12. Scenario 1’s final outcome showed both government and enterprises evolving toward non-action decisions. Scenario 2’s final outcome resulted in the government adopting active policies, while enterprises chose non-investment decisions. Scenario 3 and 5’s final outcomes show the government not taking action, while enterprises evolved toward active investment. Under Scenario 4, both parties’ decisions exhibited unstable fluctuations, with enterprise decisions changing following government policy shifts.

4.4. Parameter Sensitivity Analysis

Parameter sensitivity analysis aims to investigate the impact of changes in key parameters in the model on the strategic choices of the government and enterprises, and to identify the core factors driving the Evolutionary Stable Strategy (ESS). Combining the model settings, the following key parameters are selected for analysis.

4.4.1. Infrastructure Construction Cost

The government’s infrastructure construction cost directly affects the sustainability of its “active policy”. If C i n f is high (e.g., in the short-term stage), the government may shift to an “inactive” strategy due to fiscal pressure (as shown in the short-term scenario of Figure 3). By gradually reducing C i n f to simulate technological maturity or the participation of social capital, the critical point at which the government’s strategy shifts toward “active” is observed. As shown in Figure 13, the results show that, when C i n f is less than 30% of the enterprise’s investment cost I , the probability of the government maintaining an active policy increases.

4.4.2. Subsidy Costs and Carbon Tax Revenue

Subsidies are a key tool to incentivize corporate investment, but excessively high C s u b may lead to policy unsustainability; carbon tax revenue can offset government expenditures. In a scenario with moderate policy intensity, if T increases by 50% (such as a carbon tax rate hike), the government’s decision making for an “active policy” accelerates further. Conversely, if C s u b exceeds 40% of enterprises’ sales revenue ( E ), it may trigger path-dependent policy reliance among enterprises, reducing their willingness for autonomous investment.

4.4.3. Investment Costs and Sales Revenue

Investment costs are the main obstacle to enterprises’ “investment” strategy, while E determines the strategic benefits. Improved technological maturity (such as reduced energy consumption in green ammonia synthesis) can significantly lower I , accelerating enterprises’ shift to “investment” (as shown in the high-tech scenario of Figure 4). When the investment cost decreases from USD 400 million to USD 200 million (with high technological maturity), the stable convergence time for enterprises’ “investment” strategy is shortened by 66%, as shown in Figure 14.

5. Conclusions and Prospects

5.1. Conclusions and Recommendations

This study systematically analyzes the dynamic evolutionary pathways of collaborative decision making in green shipping fuel supply chains by constructing an evolutionary game model between government and enterprises. The proposed scenario matrix provides quantitative tools for differentiated government subsidy policies, the shared pricing of port infrastructure, and enterprise technology investment risk assessment, revealing the differential impacts of multidimensional external environments on stakeholders’ strategic choices. The main conclusions are as follows:
① Time dimension simulations show that government–enterprise collaboration exhibits a “policy-driven → market-led” phased characteristic. The short term requires government leadership in infrastructure investment with enterprise strategies driven by subsidy intensity. The mid-term sees enterprises shifting to vertical integration as technologies diffuse, with governments optimizing resource allocation through tiered carbon taxes. The long term sees gradual policy withdrawal, with enterprises achieving service model innovation through global deployment.
② Technology–market interaction mechanisms reveal a nonlinear relationship between technological maturity and policy intensity. Medium policy intensity scenarios are prone to “policy failure,” while technology diffusion (e.g., green ammonia production costs falling to USD 3/kg) significantly reduces investment risks and drives strategic equilibrium toward collaboration. In fully competitive markets (high competition), enterprises prefer securing advantages through patent barriers (e.g., multi-fuel compatibility patents) rather than price wars.
③ Policy intensity and market competition interact in complex game equilibria: weak policies risk “greenwashing” and strong policies may over-intervene, while medium intensity highlights subsidy allocation fairness as key. The nonlinear efficacy of policies underscores the need for dynamic subsidy adaptation. Strong policies during low technological maturity may cause compliance cost surges, whereas high social attention (e.g., >20% consumer premium willingness) can accelerate green transition.
Based on these scenarios, the following policy recommendations are proposed:
① Governments should develop phased dynamic policy toolkits. To align policies with development stages, dynamic tools should be established covering “short-term pilots (0–5 years)—mid-term diffusion—long-term transition”. The short term requires strong government guidance through dedicated port infrastructure funds and “subsidy-carbon tax” bundles to mitigate early risks while preventing free-riding. The mid-term should implement tiered carbon taxes with subsidy phase-outs to balance policy costs and market autonomy. In the long term, when enterprise investment probability stabilizes above 85%, direct subsidies can be reduced by 40–60%, shifting to international coordination (e.g., carbon tariff reciprocity) to enhance regional competitiveness.
② Build technology–market collaborative innovation ecosystems. Address technological immaturity and market imbalances by establishing full-chain coordination across “R&D—standardization—market application”. Technologically, form green fuel standard alliances to set energy thresholds (e.g., for green ammonia/hydrogen) and create patent pools for compliant firms. Market-wise, implement 3–5-year “innovation protection periods” for core technologies (e.g., cryogenic hydrogen storage) to prevent excessive price wars in competitive markets.
③ Strengthen multi-stakeholder governance with social participation. Create collaborative systems integrating “government oversight—corporate disclosure—public engagement”. Enhance transparency by mandating blockchain-tracked lifecycle emissions data. Incentivize shippers choosing green routes with freight discounts to simultaneously drive corporate initiative and emission reductions.

5.2. Future Directions

This study provides cross-level decision support for the carbon-neutral transition of the global shipping industry while opening new perspectives for the application of evolutionary game theory in complex system governance. Future research could be further expanded in the following aspects:
① The current study focuses on the strategic interaction between governments and enterprises. Future research could introduce port operators as key intermediary entities to construct a tripartite game framework involving governments (policymakers), ports (infrastructure operators), and enterprises (fuel producers and suppliers). By characterizing ports’ strategic choices in infrastructure sharing (e.g., investment in multi-fuel-compatible refueling systems) and pricing mechanisms (e.g., the profit sharing of green fuel refueling service fees), this framework would reveal the synergistic decision-making mechanism of “policy guidance—port adaptation—enterprise response”, addressing the oversimplified assumption in current research that “ports act as mere implementing entities”. It would provide theoretical support for defining ports’ role and interest coordination in supply chains.
② The parameter settings in this study are based on numerical simulations. Follow-up research could collect real-world data on green fuel production costs, port infrastructure investment allocation ratios, and carbon tax policy implementation effects through multi-case studies and industry surveys to establish a parameter calibration system based on real-world scenarios and enhance empirical calibration.
③ Future research could further focus on the impact of improved information transparency on supply chain game equilibrium. Blockchain technology could be employed to achieve the full chain traceability of green fuels (e.g., Well-to-Wake carbon emission tracking), quantifying how changes in information symmetry affect government regulatory efficiency and enterprise strategy selection.

Author Contributions

Conceptualization, L.Z.; Data curation, X.L. and S.L.; Methodology, L.Z. and J.L.; Writing—original draft, L.Z.; Writing—review and editing, R.Z. and J.L. All authors have read and agreed to the published version of the manuscript.

Funding

This research was funded by the Tianjin Key Research and Development Program-Research and Demonstration of Key Technologies for Zero-Carbon Port Areas (24ZXTKSN00030) and the project of TIWTE (TKS20240104).

Data Availability Statement

The original contributions presented in this study are included in the article. Further inquiries can be directed to the corresponding author.

Conflicts of Interest

The authors declare no conflicts of interest.

References

  1. Nguyen, V.N.; Rudzki, K.; Dzida, M.; Pham, N.D.K.; Pham, M.T.; Nguyen, P.Q.P.; Xuan, P.N. Understanding Fuel Saving and Clean Fuel Strategies Towards Green Maritime. Pol. Marit. Res. 2023, 30, 146–164. [Google Scholar] [CrossRef]
  2. Wang, Y.; Iris, Ç. Transition to near-zero emission shipping fleet powered by alternative fuels under uncertainty. Transp. Res. Part D Transp. Environ. 2025, 142, 104689. [Google Scholar] [CrossRef]
  3. Jasper, V.; Salmon, N.; Hall, J.; Baares, R.; Alcantara, R. Optimal Fuel Supply of Green Ammonia to Decarbonise Global Shipping. Environ. Res. Infrastruct. Sustain. 2024, 4, 015001. [Google Scholar]
  4. Balci, G.; Phan, T.T.N.; Surucu-Balci, E.; Iris, Ç. A roadmap to alternative fuels for decarbonising shipping: The case of green ammonia. Res. Transp. Bus. Manag. 2024, 53, 101100. [Google Scholar] [CrossRef]
  5. Yu, G.; Yan, R.; Qi, J.; Liu, Y.; Wang, S.; Zhen, L. LNG Bunkering Infrastructure Planning at Port. Multimodal Transp. 2024, 3, 100134. [Google Scholar]
  6. Cagatay, I.; Lam, J.S.L. A review of energy efficiency in ports: Operational strategies, technologies and energy management systems. Renew. Sustain. Energy Rev. 2019, 112, 170–182. [Google Scholar]
  7. Bortnowska, M.; Zmuda, A. The Possibility of Using Hydrogen as a Green Alternative to Traditional Marine Fuels on an Offshore Vessel Serving Wind Farms. Energies 2024, 17, 5915. [Google Scholar] [CrossRef]
  8. Liang, C.; Sun, W.; Shi, J.; Wang, K.; Zhang, Y.; Lim, G. Decarbonizing Maritime Transport through Green Fuel Powered Vessel Retrofitting: A Game Theoretic Approach. J. Mar. Sci. Eng. 2024, 12, 1174. [Google Scholar] [CrossRef]
  9. Amit, K.; Kumar, K. An Uncertain Sustainable Supply Chain Network Design for Regulating Greenhouse Gas Emission and Supply Chain Cost. Clean. Logist. Supply Chain 2024, 10, 100142. [Google Scholar]
  10. Amar, R.; Ramudhin, A.; Amin, C.; Paquet, M. Carbon Market Sensitive Sustainable Supply Chain Network Design. Int. J. Manag. Sci. Eng. Manag. 2010, 5, 30–38. [Google Scholar]
  11. Gu, Y.; Wang, Y.; Iris, Ç. Integrated Green Technology Adoption, Ship Speed Optimization and Slot Management for Shipping Alliance under Emission Limits and Uncertain Fuel Prices. J. Clean. Prod. 2025, 494, 144939. [Google Scholar] [CrossRef]
  12. Chen, Y.; Wang, Z.; Liu, Y.; Mou, Z. Coordination Analysis of the Recycling and Remanufacturing Closed Loop Supply Chain Considering Consumers’ Low Carbon Preference and Government Subsidy. Sustainability 2023, 15, 2167. [Google Scholar] [CrossRef]
  13. Yao, J.; Chen, D.; Yu, H. Decision Making and Coordination of Remanufacturing Closed Loop Supply Chain with PIR under the Different Government Subsidy Strategies. Sustainability 2022, 14, 16122. [Google Scholar] [CrossRef]
  14. Shi, S.; Liu, G. Pricing and Coordination Decisions in a Low Carbon Supply Chain with Risk Aversion under a Carbon Tax. Math. Probl. Eng. 2022, 2022, 7690136. [Google Scholar] [CrossRef]
  15. Li, N.; Deng, M.; Mou, H.; Tang, D.; Fang, Z.; Zhou, Q.; Cheng, C.; Wang, Y. Government Participation in Supply Chain Low Carbon Technology R&D and Green Marketing Strategy Optimization. Sustainability 2022, 14, 8342. [Google Scholar] [CrossRef]
  16. Wei, Q.; Xiao, G. Evolutionary Game Analysis of Shared Parking Market Diffusion under Government Management. Transp. Saf. Environ. 2024, 6, 17–27. [Google Scholar] [CrossRef]
  17. Jun, Z.; Wang, J.; Shen, A. Evolutionary Game of International Trade Network Based on Trade Policy Differences. Sci. Rep. 2025, 15, 1095. [Google Scholar]
  18. Qu, G.; Wang, Y.; Xu, L.; Qu, W.; Zhang, Q.; Xu, Z. Low Carbon Supply Chain Emission Reduction Strategy Considering the Supervision of Downstream Enterprises Based on Evolutionary Game Theory. Sustainability 2021, 13, 2827. [Google Scholar] [CrossRef]
  19. Li, G.; Yu, H.; Lu, M. Low Carbon Collaboration in the Supply Chain under Digital Transformation: An Evolutionary Game Theoretic Analysis. Processes 2022, 10, 1958. [Google Scholar] [CrossRef]
  20. International Energy Agency (IEA). Developing Capacity for Long-Term Energy Policy Planning: A Roadmap; International Energy Agency: Paris, France, 2024. [Google Scholar]
  21. Nicholls, J.; Mawhood, B.; Gross, R. Evaluating Renewable Energy Policy: A Review of Criteria and Indicators for Assessment; IRENA & UKERC: Masdar City, United Arab Emirates, 2014. [Google Scholar]
  22. Dechezleprêtre, A.; Nächtigall, D.; Venmans, F. The joint impact of the European Union emissions trading system on carbon emissions and economic performance. J. Environ. Econ. Manag. 2022, 118, 102758. [Google Scholar] [CrossRef]
Figure 1. System dynamics model for decision making in green fuel supply chains in shipping.
Sustainability 17 05186 g001
Figure 2. Initial simulation results.
Sustainability 17 05186 g002
Figure 3. Simulation results across temporal scenarios.
Sustainability 17 05186 g003
Figure 4. Simulation results across technological scenarios.
Sustainability 17 05186 g004
Figure 5. Simulation results across social awareness scenarios.
Sustainability 17 05186 g005
Figure 6. Simulation results across policy intensity scenarios.
Sustainability 17 05186 g006
Figure 7. Simulation results under different policy intensity scenarios.
Sustainability 17 05186 g007
Figure 8. Simulation results for comprehensive Scenario 1.
Sustainability 17 05186 g008
Figure 9. Simulation results for comprehensive Scenario 2.
Sustainability 17 05186 g009
Figure 10. Simulation results for comprehensive Scenario 3.
Sustainability 17 05186 g010
Figure 11. Simulation results for comprehensive Scenario 4.
Sustainability 17 05186 g011
Figure 12. Simulation results for comprehensive Scenario 5.
Sustainability 17 05186 g012
Figure 13. Sensitivity analysis of infrastructure construction costs on government decision making.
Sustainability 17 05186 g013
Figure 14. Sensitivity analysis of investment costs on enterprise decision making.
Sustainability 17 05186 g014
Table 1. Government–enterprise game scenarios in maritime green fuel supply chain.
Scenario CodeGovernment StrategyEnterprise StrategyDynamic Characteristics
G1E1S1A1Government–enterprise synergy with strong policy-driven rapid transformation. Infrastructure sharing reduces enterprise costs, while subsidies accelerate technology implementation. The government bears the costs of infrastructure construction and enterprise subsidies, while enterprises bear investment costs such as technological research and development.
G1E2S1A2Government plays a dominant role in resource allocation but risks resource waste: idle infrastructure and ineffective subsidy conversion. When the government assumes the costs of infrastructure construction, enterprises face potential losses from market opportunities missed.
G2E1S2A1Enterprises pursue independent transformation with insufficient policy support, facing high-cost investment risks. Enterprises bear investment risks.
G2E2S2A2Locked in traditional models, stagnation in green fuel supply chain development, hindering carbon reduction targets. Both the government and enterprises face losses from backward carbon emission reduction efforts.
Table 2. Government–enterprise payoff matrix for green shipping fuel supply chain.
EnterpriseGovernment
ActiveNot Active
Invest( R + B C i n f C s u b , E + S I )( R + B , E I )
Not Invest( T C i n f L , T L )( L , L )
Table 3. Temporal scenario classification and key characteristics.
StageKey CharacteristicsGovernment Strategy FocusEnterprise Strategy Focus
Short term
(0–5 years)
Pilot verification phase, high infrastructure investment needs, policy experimentationTargeted subsidies, port infrastructure pilotsTechnology reserves, small-scale demonstration projects
Medium term (5–15 years)Application diffusion phase, scaling and standardizationTiered carbon tax, networked infrastructure deploymentCapacity expansion, vertical supply chain integration
Long term (>15 years)Market maturity phase, complete market-driven substitutionPolicy exit mechanisms, international regulation coordinationGlobal deployment, service model innovation
Table 4. Technology development scenario classification and key characteristics.
Maturity LevelTechnical CharacteristicsGovernment Decision-Making ChallengesEnterprise Risk Types
LowLow fuel production efficiency (e.g., green ammonia synthesis energy consumption >12 kWh/kg), prominent storage and transportation safety risksTechnology pathway selection riskSunk cost risk
MediumKey technology breakthroughs (e.g., cryogenic liquid hydrogen storage cost reduced to USD 3/kg), but insufficient industry chain coordinationCross-departmental technical standardizationSupply chain disruption risk
HighFull industry chain maturity (e.g., widespread adoption of methanol–ammonia–hydrogen multi-fuel-compatible bunkering systems)Preventing technology monopoliesExcessive market competition risk
Table 5. Social awareness scenario classification and key characteristics.
Awareness LevelPublic Behavior CharacteristicsGovernment Pressure SourcesCorporate Response Strategies
LowEnvironmental issues marginalized, green premium acceptance < 5%Significant policy implementation resistanceAvoid publicity, maintain traditional operations
MediumEnvironmental organizations exert pressure, green finance product penetration 30–50%Balancing economic growth with emission reduction targetsOptimize ESG disclosure, selective investment
HighClimate activism surges (e.g., global shipping strikes), willingness to pay premium > 20%Radical policy demands (e.g., full fleet decarbonization by 2030)Full supply chain green certification, brand premium strategy
Table 6. Policy intensity scenario classification and government–enterprise interaction characteristics.
Intensity LevelRepresentative Policy ToolsFocus of Government–Enterprise Interaction
WeakVoluntary emission reduction agreements, non-binding targetsMonitoring corporate compliance
ModerateCarbon tax + partial subsidies (e.g., EU ETS covering shipping)Fairness of subsidy distribution
StrongMandatory fuel quotas (e.g., IMO 2030 ≥ 5% ammonia fuel requirement) + infrastructure nationalizationRisks of excessive policy intervention in markets
Table 7. Market competition scenario classification and enterprise strategy characteristics.
Competition LevelMarket Structure CharacteristicsEnterprise Strategic Response
LowRegional monopoly (e.g., single enterprise dominates fuel supply)Cost control prioritization
MediumOligopolistic competition (3–5 dominant enterprises)Differentiated technology pathways
HighPerfect competition (multiple fuels/enterprises competing)Price competition and patent barriers
Table 8. Parameter values of five independent dimensions.
SymbolParameter NameTime
Dimension
Technology
Development
Social AttentionPolicy
Intensity
Market
Competition
R Environmental BenefitShort:50
Mid:150
Long:300
Low:30
Med:120
High:250
Low:80
Med:150
High:200
Weak:50
Med:120
Strong:250
Low:100
Med:180
High:250
B Tech Spillover EffectsShort:30
Mid:100
Long:200
Low:20
Med:80
High:150
Low:50
Med:100
High:150
Weak:40
Med:90
Strong:180
Low:60
Med:120
High:180
C i n f Government Infrastructure CostShort:150
Mid:120
Long:80
Low:200
Med:150
High:100
Low:180
Med:130
High:80
Weak:50
Med:120
Strong:200
Low:100
Med:150
High:200
C s u b Government Subsidy CostShort:50
Mid:230
Long:420
Low:100
Med:50
High:30
Low:60
Med:100
High:140
Weak:50
Med:130
Strong:200
Low:50
Med:150
High:250
T Carbon Tax RevenueShort:20
Mid:80
Long:150
Low:10
Med:60
High:120
Low:30
Med:90
High:180
Weak:20
Med:90
Strong:160
Low:40
Med:80
High:120
L Potential LossesShort:100
Mid:50
Long:10
Low:120
Med:70
High:30
Low:150
Med:80
High:20
Weak:130
Med:60
Strong:20
Low:100
Med:60
High:30
E Enterprise RevenueShort:250
Mid:500
Long:1000
Low:150
Med:400
High:800
Low:300
Med:600
High:120
Weak:250
Med:550
Strong:850
Low:400
Med:700
High:1000
I Enterprise CostsShort:400
Mid:450
Long:500
Low:400
Med:300
High:200
Low:400
Med:350
High:250
Weak:200
Med:350
Strong:500
Low:250
Med:400
High:550
S Environmental BenefitShort:50
Mid:150
Long:300
Low:30
Med:120
High:250
Low:80
Med:150
High:200
Weak:50
Med:120
Strong:250
Low:100
Med:180
High:250
Table 9. Parameter values for comprehensive Scenarios 1–5.
Parameter NameScenario 1
(Conservative) (Short Term,
Low Tech,
Low Attention, Weak Policy, Low Competition)
Scenario 2
(Transition)
(Mid Term,
Medium Tech,
Medium Attention, Medium Policy,
Medium Competition)
Scenario 3
(Mature)
(Long Term,
High Tech,
High Attention, Strong Policy, High Competition)
Scenario 4
(Policy-Driven) (Short Term,
Medium Tech, High Attention, Medium Policy, Low Competition)
Scenario 5
(Market-Driven) (Mid Term,
High Tech,
Low Attention, Weak Policy, High Competition)
Environmental Benefit Increase5012030080200
Technology Spillover Effects308020050150
Infrastructure Cost100150200120180
Subsidy Cost5010020080170
Carbon Tax Revenue208015018040
Potential Losses80301050100
Enterprise Revenue2005001200250800
Enterprise Investment Cost300400600350500
Enterprise Subsidies Received5010020080170
Disclaimer/Publisher’s Note: The statements, opinions and data contained in all publications are solely those of the individual author(s) and contributor(s) and not of MDPI and/or the editor(s). MDPI and/or the editor(s) disclaim responsibility for any injury to people or property resulting from any ideas, methods, instructions or products referred to in the content.

