Article

Analyzing the Effective Contributions of Local Governments in Promoting Regional Sustainable Development: Evidence from Hainan, China

College of Public Administration and Law, Hunan Agricultural University, Changsha 410128, China
*
Author to whom correspondence should be addressed.
Sustainability 2025, 17(11), 5173; https://doi.org/10.3390/su17115173
Submission received: 27 March 2025 / Revised: 23 May 2025 / Accepted: 28 May 2025 / Published: 4 June 2025

Abstract

:
Based on the framework of the United Nations 2030 Agenda for Sustainable Development, this study takes Hainan Province of China as a typical case. It evaluates a comprehensive sustainable development assessment system covering six dimensions: economic development, social welfare, resources and environment, consumption and emission, governance and protection, and agricultural development through the entropy method. It quantifies the sustainable development levels of the entire province from 2015 to 2023 and of 18 cities and counties in 2023 using cluster analysis. It also analyzes the mechanism of the local government’s role through policy text analysis. The study shows that, firstly, the comprehensive sustainable development level of Hainan Province has been steadily rising. Economic development, social welfare, resources and environment, and consumption and emission have generally improved, but the governance and protection and agricultural development indicators have shown significant phased fluctuations. Secondly, in 2023, the sustainable development levels of cities and counties in Hainan Province presented a “stepwise distribution” spatial differentiation feature. Central cities such as Haikou and Sanya have developed ahead, while the development in the central and western regions has been relatively moderate. Thirdly, local governments have achieved multi-dimensional goal coordination through policies such as industrial structure optimization and ecological compensation mechanisms. The study suggests that while strengthening the leading role of local governments, it is necessary to build a multi-party collaborative mechanism involving enterprises, social organizations, and the public to address the regional imbalance in the implementation of SDGs.

1. Introduction

The Sustainable Development Goals (SDGs) aim to address development challenges in a comprehensive manner across social, economic, and environmental dimensions from 2015 to 2030. They guide the global transition towards sustainable development [1]. To date, implementation of the SDGs in various regions has yielded significant achievements [2,3,4]. The 2030 Agenda for Sustainable Development emphasizes the importance of regional cooperation and the vital role of local governments in promoting regional sustainable development [5,6]. However, sustainable development requires concrete actions to be effectively implemented [7]. Local governments can facilitate efficient regional sustainable development implementation by providing strategic planning and guidance, policy regulation and support, public services, ecological conservation, stakeholder coordination and collaboration, interest balancing, and supervision, evaluation, and management mechanisms [8,9].
In April 2018, the Central Committee of the Communist Party of China and the State Council published the “Guiding Opinions on Supporting Hainan in Fully Deepening Reform and Opening Up”. The policy highlights that, as one of China’s few tropical island provinces, Hainan has multiple unique advantages for promoting regional sustainable development. These include distinctive natural and ecological resources (e.g., a tropical climate and marine resources), institutional innovations underpinned by free trade port policies, progress in the transformation to a green, low-carbon, clean energy economy (e.g., practices in the near-zero carbon demonstration zone), advancements in the marine economy and technological innovation (e.g., deep-sea technology and marine industries), and significant potential for the revitalization of agriculture and rural areas through efficient tropical agriculture. However, Hainan’s relatively single and vulnerable industrial structure is constrained by high transportation and logistics costs, which have limited its economic structure and development model. The province also faces challenges such as unbalanced regional development. Nevertheless, since the establishment of the free trade port in 2018, Hainan’s geographical advantages have become increasingly apparent, driving growth in related industries and fostering regional development. Therefore, selecting Hainan as a case study for sustainable development is highly representative and offers valuable insights and lessons for other regions seeking to do the same.
This study attempts to assess the level of sustainable development in Hainan Province, China, and its 18 cities and counties. It conducts this from the perspective of mainstreaming and localizing the SDGs globally. The study also analyzes the role of local governments in regional and urban sustainable development, referencing relevant studies. In this context, the study addresses the following questions: Since the establishment of the SDGs in 2015, what is the level of sustainable development in Hainan Province as of 2023? What is the level of sustainable development in Hainan Province’s 18 cities and counties in 2023? How can local governments effectively promote sustainable development in Hainan Province?
This study is based on the SDGs and the framework of the United Nations 2030 Agenda for Sustainable Development. Starting from a participatory and comprehensive assessment model, it takes the perspective of stakeholders and refers to the relevant indicators from China’s sustainable development evaluation reports with Chinese characteristics, as well as the relevant data from official databases. Using Hainan Province in China as a case study, the study uses the entropy value method to evaluate the province’s comprehensive sustainable development system. This system covers six dimensions: economic development, social welfare, resources and environment, consumption and emissions, governance and protection, and agricultural development. The study also quantifies Hainan Province’s sustainable development level from 2015 to 2023, as well as the level of 18 cities and counties in 2023, by combining the cluster analysis method. At the same time, the policy text analysis is employed to analyze the mechanisms of the role of local government. The effective contribution of the local government in promoting sustainable development in Hainan Province, as discussed in this study, provides valuable experience for other regional studies on the role of local governments in promoting regional sustainable development.
The second section of this study provides a literature review. The third section outlines the materials and methods employed in the research. The fourth section presents the results, which assess Hainan Province’s overall sustainable development level from 2015 to 2023. These results are presented alongside a description of the province’s development status across six dimensions: economic development, social welfare, resources and the environment, consumption and emissions, governance and protection, and agricultural development. It also evaluates the sustainable development levels of the 18 cities and counties in Hainan Province in 2023. The fifth section analyzes the Hainan provincial government’s contributions to regional sustainable development, focusing on key areas such as economic development, social development, the ecological environment, and social governance. The sixth section discusses the three research questions in detail. Finally, the seventh section provides conclusions and policy recommendations.

2. Literature Review

2.1. The Concept of Sustainable Development

In 1987, the report “Our Common Future” on human development first systematically defined sustainable development as “development that meets the needs of the present without compromising the ability of future generations to meet their own needs” [10]. During the United Nations Conference on Environment and Development held in Rio de Janeiro, Brazil, in 1992, goals and action plans for implementing sustainable development were formulated, and the principle of establishing a global partnership to address global environmental issues collectively was established [11]. This marked the first time in human history that a sustainable development strategy had transitioned from concept to global action [12]. In 1999, the report titled “Our Common Journey: A Transition to Sustainable Development” introduced the term “sustainability science” and defined it as “the science of sustainable development” [13]. Then, in September 2015, the United Nations Sustainable Development Summit reviewed the implementation of the Millennium Development Goals (MDGs) and adopted the “Transforming Our World: The 2030 Agenda for Sustainable Development” [14]. This agenda set out the SDGs, encompassing 17 key areas and 169 specific targets. Compared with the MDGs, the SDGs fundamentally transformed the traditional concept of development by proposing inclusive growth and emphasizing the coordinated development of the economy, society, and environment.

2.2. The Framework of Sustainable Development Goals (SDGs)

The sustainable development of regions and cities is a widely discussed topic in China and around the world. There are numerous definitions of the sustainable development of regions and cities, all of which are rooted in the specific conditions and needs of the region or city in question and characterized by multidimensional standards [15,16]. Regarding the framework of regional sustainable development indicators, the existing dimensions can be summarized as follows: The sustainable development of a region or city is generally defined as achieving balance among the three core dimensions of sustainability: environmental, social, and economic. The aim of a sustainable region or city is to provide an environmentally sound, socially equitable, and economically viable habitat for human beings while ensuring long-term development for future generations [17]. Recent scholarly discourse highlights the crucial role of institutional frameworks in tackling sustainability issues. Nováček, P. et al. argue that systemic urban and regional issues require a more comprehensive approach than environmental, social, and economic interventions alone. To achieve holistic sustainability, a fourth institutional dimension must be systematically integrated, encompassing formal regulations, informal norms, and decision-making processes. These elements facilitate interactions among ecological, socio-cultural, and economic systems, fostering synergistic outcomes [18,19,20]. In addition, certain scholarly works have highlighted the “cultural dimension” of regional or urban sustainability [15,16,21]. A significant number of existing research frameworks provide ample scope for further exploration. Building on this foundation, scholars aim to systematically examine the sustainable indicator frameworks of 50 selected global and European cities. The primary objective of the study is to identify the most relevant urban sustainability indicator framework, analyze its content in detail across dimensions, thematic categories, and specific indicators, and clarify the prevailing trends and challenges in the field of urban sustainability assessment. The research results indicate that, first, all selected frameworks include the environmental sustainability dimension in terms of the dimensions of urban sustainability assessment. This is followed by the social dimension, then the economic dimension; the least evaluated dimension is the institutional sustainability dimension. Secondly, with regard to the thematic categories within the urban sustainability assessment framework, the environmental dimension of sustainability comprises seven primary categories: water; traffic and transport; waste; air quality; energy; land use; and climate change. The sustainable economic dimension encompasses two primary thematic categories: the economy and employment. The sustainable social dimension comprises eight primary thematic categories: education; health; housing; safety and security; social and economic fairness; social infrastructure; green space; and culture. The sustainable institutional dimension includes four primary thematic categories: participation; urban planning; environmental management; and governance. Finally, specific indicators are scientifically defined based on these themes [22].

2.3. Local Governments and Regional Sustainable Development

In accordance with SDG 11 and 17, which aim to make cities and human settlements inclusive, safe, resilient, and sustainable and to strengthen the means of implementation and revitalize the global partnership for sustainable development, respectively, both goals highlight the critical influence and role of local governments as key stakeholders in achieving the SDGs [14]. In this study, the localization of the SDGs refers to local governments formulating and implementing policies tailored to achieving goals that align with national and local characteristics [23]. There are numerous successful cases that demonstrate the effectiveness of this approach. For example, in terms of mainstreaming and localizing the SDGs globally, local governments in South Korea’s Gyeonggi Province have developed and assessed SDG indicators. Based on the ideal types and rankings of 31 indicator indices, policy recommendations for urban sustainable development were formulated [5]. In one study, scholars drew on surveys and focus group research conducted in Newfoundland and Labrador on Canada’s east coast. They argued that, when pursuing regional sustainability, it is crucial to recognize the role of mid-level political actors and their interactions with national and local governments [1]. Through a case study of the Barcelona City Council and its policies addressing climate change and promoting sustainable development, the analysis highlights that local governments must possess diverse capabilities to enable them to analyze, manage, and transform their environments through public policies, thereby playing a pivotal role in climate change strategies [24]. Using Japan as a case study, scholars examined how local governments can foster partnerships with the private sector to achieve the SDGs. They identified the potential for local governments to serve as mediators of transformation and made recommendations, contributing to the expanding body of literature on SDG localization and partnerships [6].
In summary, most existing research on local governments and regional sustainable development focuses on policy recommendations and assesses the capabilities of local governments using theoretical frameworks. Research methods are predominantly qualitative, primarily using interview techniques to gather evaluations of government performance from various local groups, which are then analyzed based on the research topic. The limited number of quantitative studies on sustainable development tend to be concentrated in developed countries, which have relatively superior economic, social, and environmental conditions compared to developing countries. Indicator sets with methodological guidelines provide a framework for evaluating sustainability at different spatial levels [25]. However, given the significant disparities between cities in terms of data availability, population size, historical development, and urban functions, a variety of sustainable indicator frameworks have gradually emerged [26]. Therefore, this study is grounded in the development context of Hainan Province in China, leveraging its geographical advantages. Relevant indicators [27,28] are used to categorize Hainan Province’s sustainable development indicator system into six dimensions: economic development, social welfare, resources and the environment, consumption and emissions, governance and protection, and sustainable agriculture. The entropy method is employed to evaluate Hainan Province’s sustainable development level from 2015 to 2023. Furthermore, the study analyzes the effective contributions of the Hainan provincial government towards promoting regional sustainable development from a stakeholder perspective. This study adopts multivariate statistical analysis methods, integrating local governments with regional development to enrich the research content and approaches.

3. Materials and Methods

3.1. Study Area

Hainan Province, abbreviated as “Qiong”, is located in southern China. To the north lie the Qiongzhou Strait and Guangdong Province; to the west, the Gulf of Tonkin and Vietnam; and to the southeast and south, the South China Sea. Neighboring countries include the Philippines, Brunei, Indonesia, and Malaysia. Hainan’s administrative regions include Hainan Island and the Xisha, Zhongsha, and Nansha Islands, and their surrounding sea areas, making it China’s largest province by total area. The province covers 35,400 square kilometers of land and approximately 2 million square kilometers of sea [29]. Hainan has a tropical monsoon marine climate with no distinct seasons. Summers are warm but not extreme, and winters are mild but not cold, with an average annual temperature of 24.9 °C. Rainfall is concentrated in summer and autumn, while winter and spring are dry. Annual precipitation ranges from 1500 to 2500 mm (approximately 1000 mm along the western coast) [30]. Hainan Island has a dome-shaped, mountainous terrain that is high in the center and low around the edges. The core of this uplifted region is formed by Wuzhishan and Parrot Ridge, and it gradually descends into mountains, hills, plateaus, and plains, creating a circular, layered landform with a clear gradient structure [31].
Regional coordinated development is critical for promoting the high-quality development of the Hainan Free Trade Port. The aim is to establish a new model of regional coordinated development that encompasses the Haikou Economic Circle, the Sanya Economic Circle, the Danyang Economic Circle, the Coastal City Belt, and the Central Ecological Conservation Area while adhering to the principle of “treating the whole province as one chessboard and the entire island as one city”. This approach facilitates urban-rural integration, land-sea integration, mountain-sea connectivity, resource consolidation, and unified planning, construction, and management across the island (Figure 1) [32].

3.2. Evaluation Indicator System for Sustainable Development Level in Hainan Province

The core task of global governance is to achieve sustainable development and build a community with a shared future for humanity in the new era. In order to achieve this, efforts should be made to implement the “Global Development Initiative”, jointly create an inclusive, balanced, coordinated, and win-win development pattern that leads to shared prosperity, and contribute Chinese wisdom and solutions to the global development agenda. Based on the aforementioned research objectives, this study draws on the provincial sustainable development indicators from China’s “China Sustainable Development Evaluation Report (2023)” [27] and integrates them with indicators from other relevant literature [17,18,19,20,21,28]. This forms the basis of the evaluation indicators used to assess the sustainable development level of Hainan Province. Specific adjustments have been made to time series, calculation methods, and certain indicator expressions. This indicator system comprises six first-level indicators, 26 second-level indicators, and 45 third-level indicators. The 45 third-level indicators include 34 positive indicators and 11 negative indicators (Table 1).

3.3. Data Sources

The analysis covers the whole province and its 18 cities and counties, using data from 2015 to 2023—a nine-year time series that makes it possible to analyze trends and compare different years. All data are sourced from official channels, ensuring public accessibility for third-party verification, thereby guaranteeing authenticity and objectivity while minimizing subjective bias. The primary data sources include the China Statistical Yearbook [33], the Hainan Statistical Yearbook [34], the China Statistical Yearbook on Science and Technology [35], the China Statistical Yearbook on Environment [36], and the China Energy Statistical Yearbook [37]. A small portion of the data is drawn from the Hainan Ecological and Environmental Bulletin [38], the China Statistical Yearbook of Culture, Heritage and Tourism, the China Urban Construction Statistical Yearbook, the China Health Statistical Yearbook, the China Rural Statistical Yearbook, the Hainan Provincial Statistical Bulletin of National Economic and Social Development, National Energy Administration, the Poverty Monitoring Report of Rural China, and publicly available information on relevant official websites. Missing data for individual years is estimated using methods such as arithmetic averaging and trend extrapolation based on data from adjacent years.

3.4. Research Methodology

3.4.1. Entropy Value Method

(1)
Data standardization
First, the raw values of the indicators are standardized using the normalization method to ensure that all values fall within the range [0, 1]. This step makes the indicators more comparable with each other. Within the indicator system, indicators with higher values representing better performance are classified as positive, while those with the opposite relationship are categorized as negative [39]. The formulas for positive indicators (1) and negative indicators (2) (where Equations (1)–(7) are drawn from reference [39]) are presented as follows:
Y i j = X i j m i n ( X i j ) m a x ( X i j ) m i n ( X i j )
Y i j = m a x ( X i j ) X i j m a x ( X i j ) m i n ( X i j )
where X i j   represents the value of the jth indicator in the ith year, m i n ( X i j ) is the minimum value of the jth indicator in the ith year, m a x ( X i j ) is the maximum value of the jth indicator in the ith year, and Y i j is the standardized value of the jth indicator in the ith year.
(2)
Calculate the characteristic weight P i j of the jth indicator in year i as follows:
Since logarithms are required for the calculation of information entropy and the value of the indicator cannot be zero, this study adjusts the data by adding a small constant (0.001) to ensure that H i j = Y i j + d, where d is a positive constant that makes the value slightly greater than zero. In this study, d is set to 0.001:
P i j = H i j i = 1 n H i j   0 P i j 1  
(3)
The information entropy e j   of the jth indicator is calculated using the entropy formula:
e j = 1 ln n × i = 1 n P i j × ln ( P i j )   (   0     e j     1 )
where n depends on the total number of years in the sample; ln is the natural logarithm.
(4)
Calculate the coefficient of variation g j for the jth indicator using the information entropy.
The coefficient of variation of an indicator directly affects its weight and can be found by subtracting the information entropy e j of the indicator from 1. The specific formula for the coefficient of variation g j of the jth indicator is as follows:
g j = 1 e j  
(5)
Calculate the weight w j of the jth indicator based on the coefficient of variation.
The entropy method is used to calculate the weight of each indicator; essentially, it uses the variability coefficient of the indicator’s information to determine the weight. A greater variability coefficient indicates a larger weight. The weight of the jth indicator is calculated as follows:
w j = g j j = 1 m g j  
(6)
The composite evaluation score U i is calculated by performing a weighted summation.
U i = j = 1 m w j × Y i j
where U denotes the comprehensive evaluation score, m is the number of indicators, and w j is the weight of the jth indicator. A higher U-value indicates a better composite score and more favorable evaluation results. Ultimately, the evaluation results are compared based on all U-values [40].

3.4.2. Cluster Analysis Method

Cluster analysis is a multivariate statistical method that categorizes samples or indicators quantitatively according to specific criteria, with the aim of achieving homogeneity within groups and heterogeneity between them. In order to evaluate the level of comprehensive development of cities and counties in Hainan Province, this study used SPSS software (version 25.0) to conduct a hierarchical cluster analysis of the composite evaluation scores of the sustainable development levels of 18 cities and counties in Hainan Province. In this analysis, squared Euclidean distance was used as the measurement method, and average linkage was used for clustering [41].

3.4.3. Policy Text Analysis Method

The policy text analysis method is a systematic research approach that examines official documents, such as policy files, laws, regulations, and government reports. The aim is to uncover the logic, value orientation, interest dynamics, and potential impacts of policy formulation by analyzing the content, structure, language, and context of these texts. In this study, NVivo software [42] (version 14.0) was used as a tool for policy text analysis. NVivo facilitates the rapid searching and summarization of policy texts by importing text files. In this study, it served as a coding tool, enabling thematic coding and keyword collation for the statistical analysis of policies issued by the Hainan provincial government at three distinct stages, focusing on local economic development, social livelihoods, the ecological environment, and governance and protection.

4. Results

4.1. Overall Level of Sustainable Development in Hainan Province

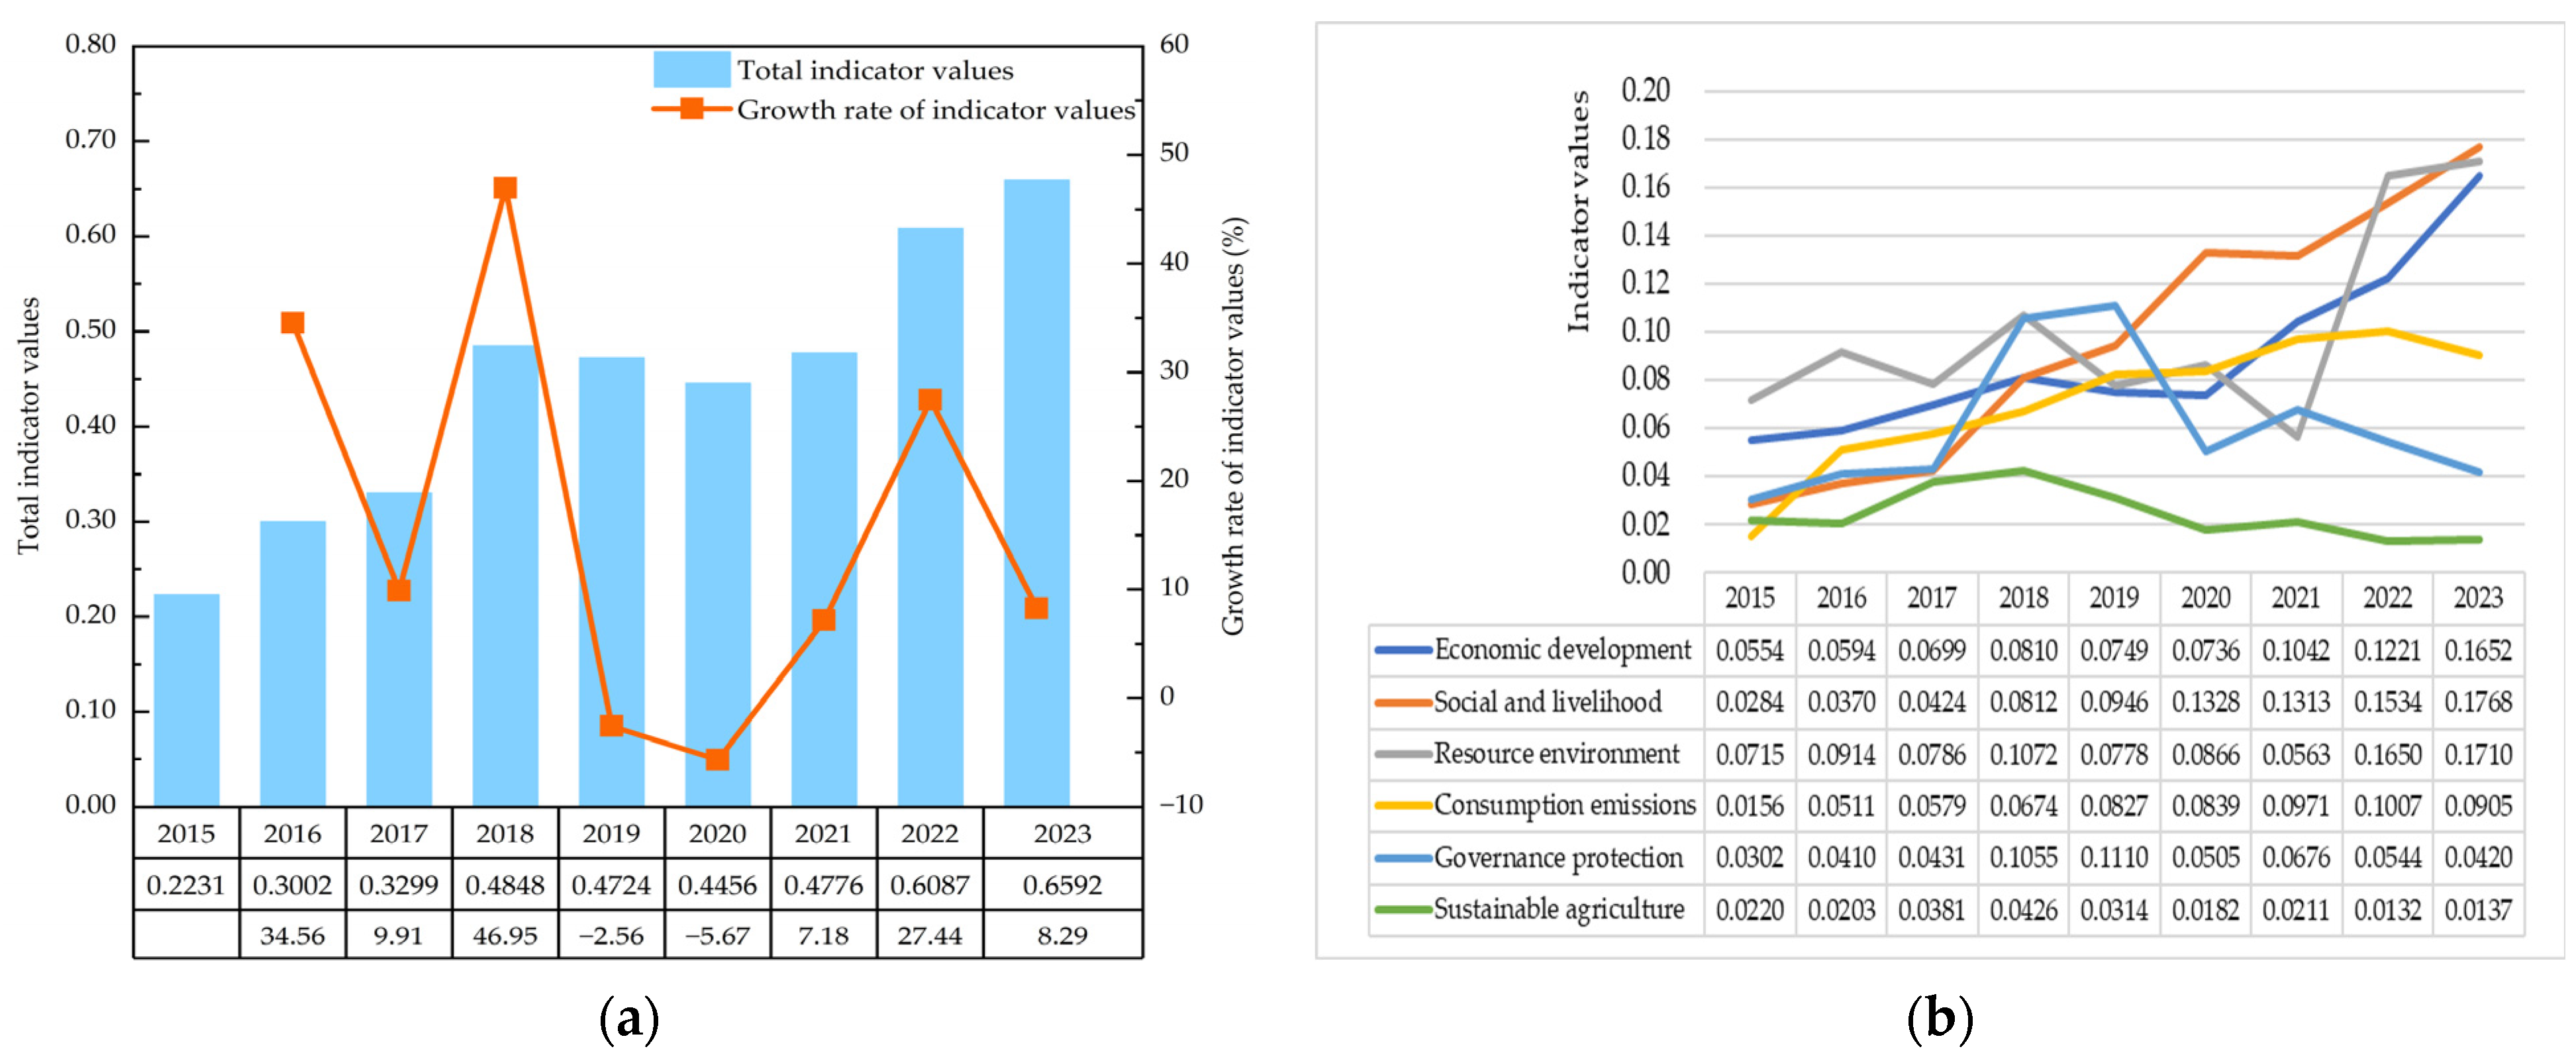
The sustainable development indicator for Hainan Province increased from 0.2231 in 2015 to 0.6592 in 2023, marking a 195.43% growth. This significant increase reflects a marked improvement in the province’s overall development situation. Apart from the governance and protection and sustainable agriculture indicators, which exhibited substantial fluctuations, the economic development, social livelihood, resource environment, and consumption and emission indicators generally showed positive trends, achieving notable progress. The negative growth rates in 2019 and 2020 can be attributed to the severe impact of the novel coronavirus pneumonia epidemic. In contrast, growth rates were consistently above 7% in other years, with the highest growth rate of 46.95% recorded in 2018. In conclusion, the overall indicator value displayed an upward trend from 2015 to 2023 (Figure 2).

4.2. Describing the Level of Sustainable Development in Hainan Province from Each of the Six Dimensions

4.2.1. Significant Increase in Economic Strength

The first-level indicator of “Economic Development” increased from 0.0554 in 2015 to 0.1652 in 2023, reflecting an average annual growth rate of 19.4%. Compared to 2022, this indicator rose by 35.28% in 2023. Overall, the province’s economic strength improved significantly from 2015 to 2023.
The three secondary indicators under the primary “Economic Development” index—namely “Innovation-driven”, “Structural Optimization”, and “Open Development”—demonstrated an overall upward trend during the period. The “Innovation-driven” indicator experienced relatively rapid growth, rising from 0.0000 in 2015 to 0.0659 in 2023. The “Structural Optimization” indicator value increased from 0.0064 in 2015 to 0.0364 in 2023, with minor declines observed in 2016 and 2021, otherwise maintaining a consistent upward trajectory. The “Open Development” indicator increased from 0.0129 in 2015 to 0.0277 in 2023, peaking at 0.0324 in 2022, reflecting stable growth. The “Stable Growth” indicator showed a gradual increase, rising from 0.0360 in 2015 to 0.0455 in 2018. However, the indicator value dropped significantly in 2020 due to the severe impact of the 2019–2020 COVID-19 pandemic, reaching a low of 0.0094. Following the implementation of effective epidemic control measures and government support in Hainan Province in 2021, the economy began to recover. Due to the annual GDP growth rate, the indicator value was slightly lower in 2022 than in 2021 but resumed an upward trend in 2023 (Figure 3).

4.2.2. Continuous Improvement of People’s Livelihood

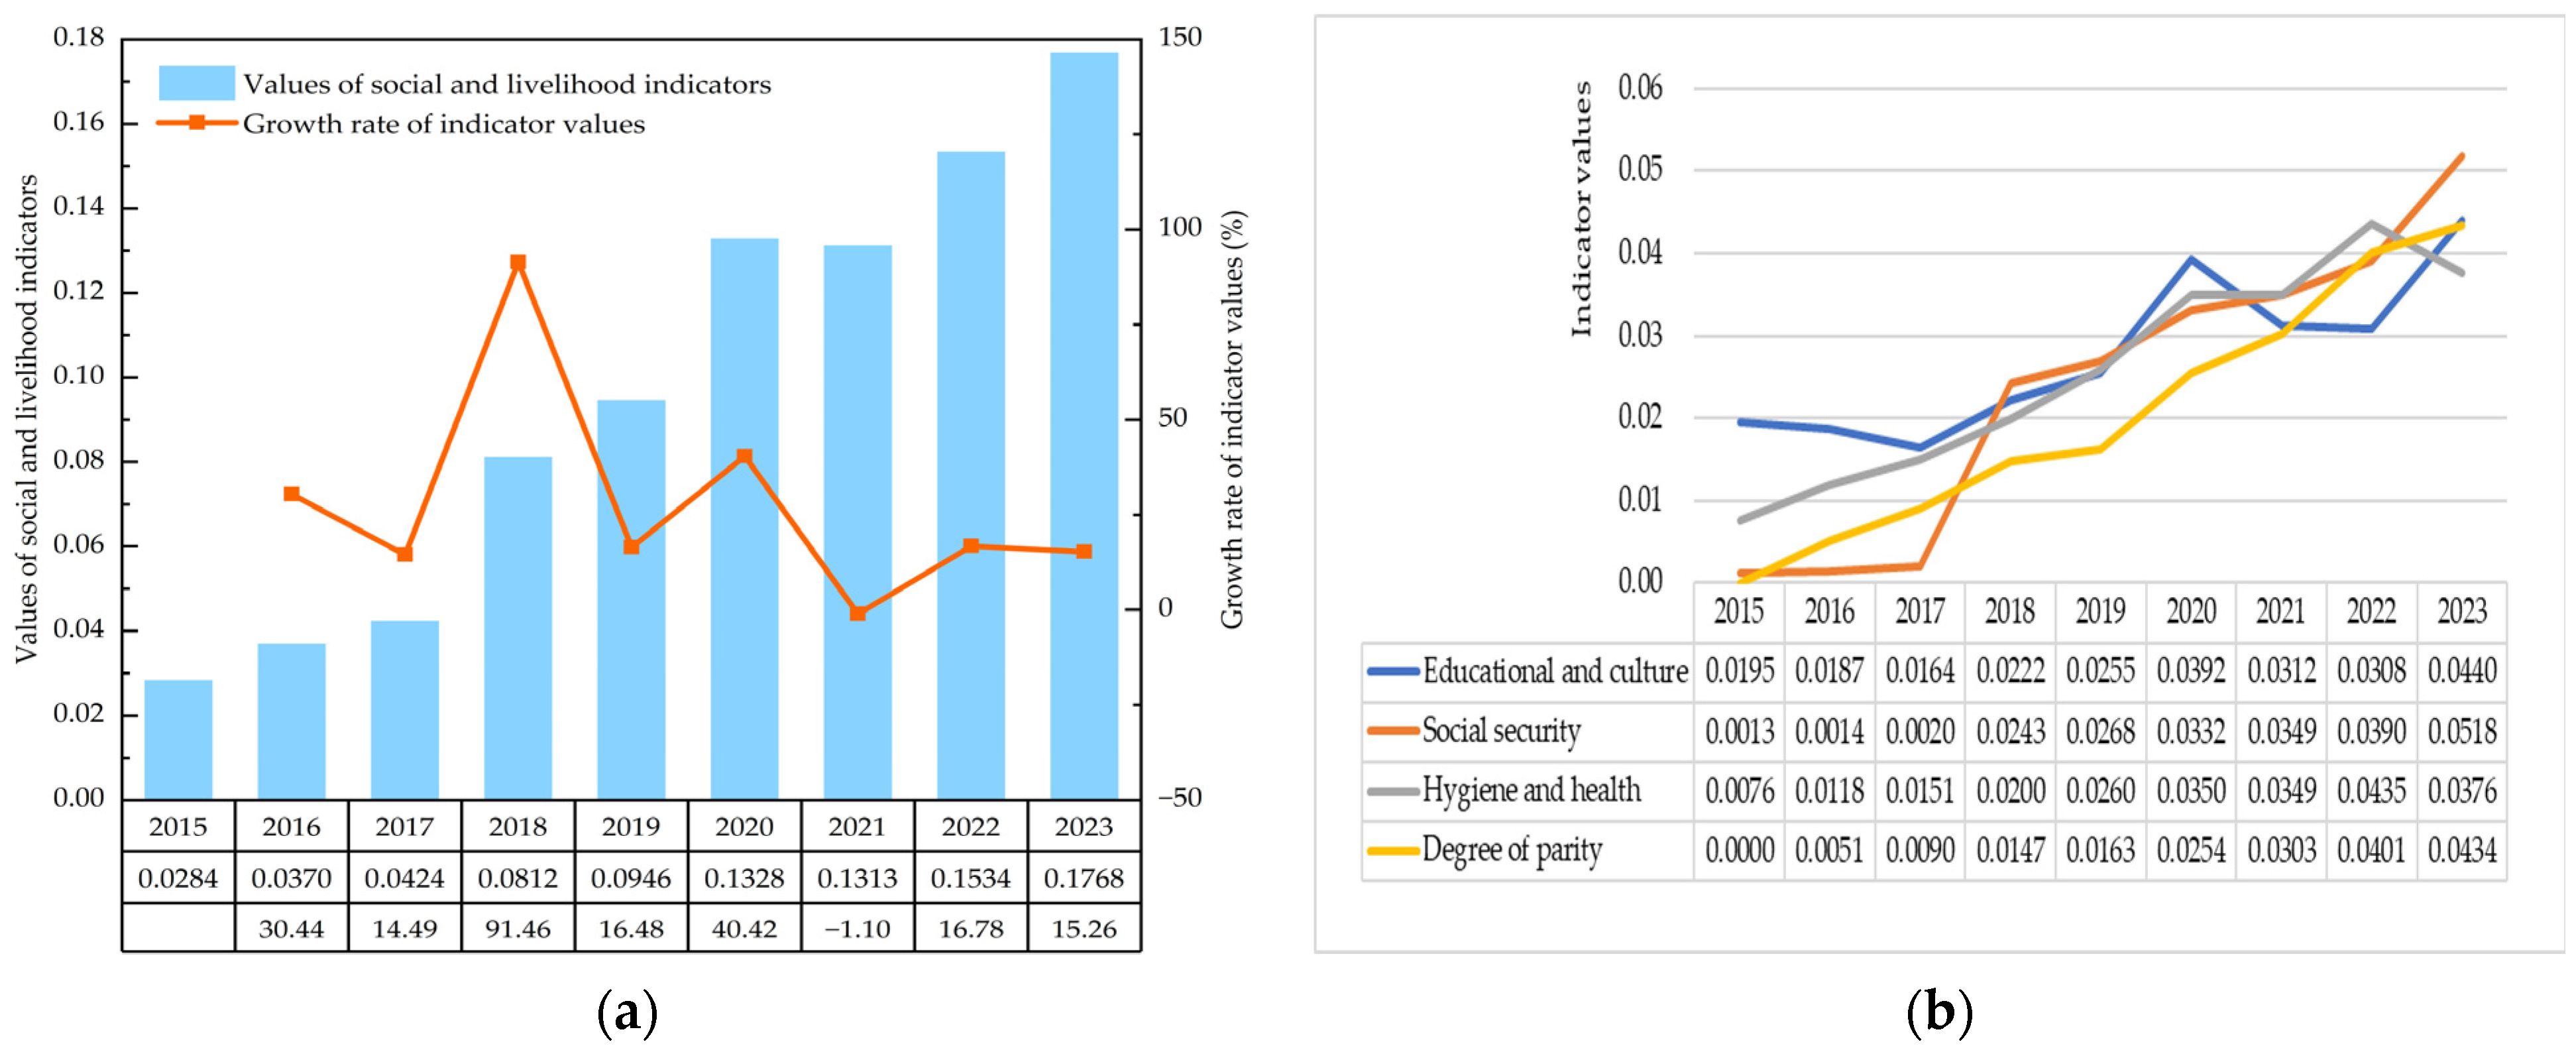
The “Social Livelihood” indicator value increased from 0.0284 in 2015 to 0.1768 in 2023, representing an average annual growth rate of around 22.4%. The overall trend is upwards, with significant growth.
Each of the four secondary indicators under the primary “Social Livelihood” index has demonstrated an overall upward trend. Specifically, the “Education and Culture” indicator increased from 0.0195 in 2015 to 0.0440 in 2023, peaking in 2023 and showing slightly lower values in 2021 and 2022. The “Social Security” indicator has shown a consistent upward trend, rising significantly from 0.0013 in 2015 to 0.0518 in 2023, peaking in the same year. The “Health and Wellness” indicator showed a fluctuating yet upward trend, peaking at 0.0435 in 2022 before declining slightly to 0.0434 in 2023, with the indicator value rising from 0.0076 in 2015. The “Degree of Parity” indicator maintained a clear upward trend, increasing steadily from 0.0000 in 2015 to 0.0434 in 2023 (Figure 4).

4.2.3. Overall Improvement in the State of the Resource Environment

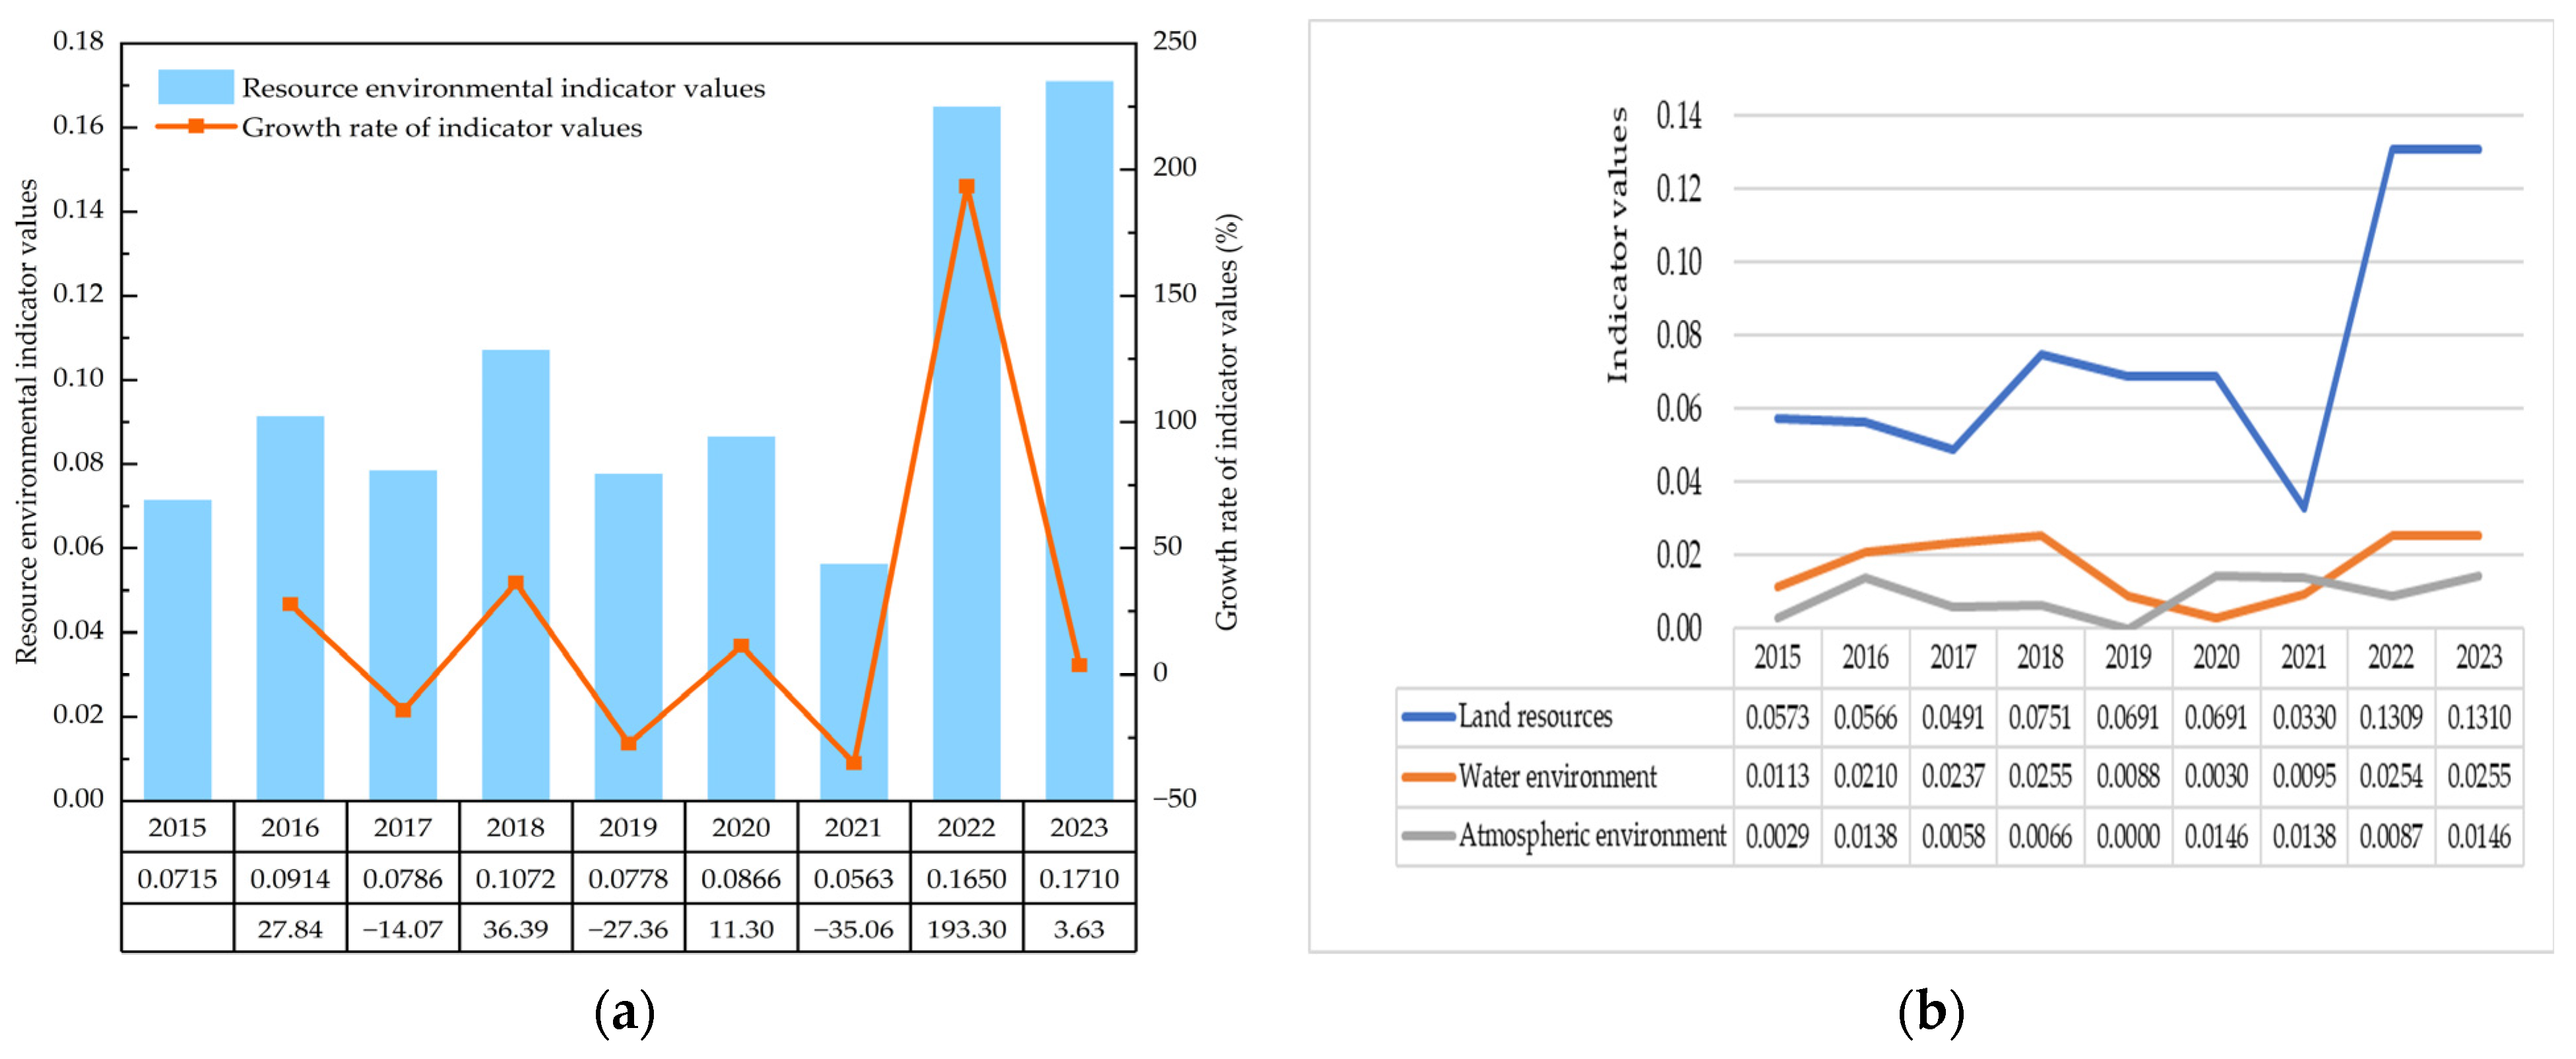
The status of resources and the environment is highly sensitive to climate and environmental influences, resulting in significant year-on-year fluctuations. The value of the “Resource and Environmental” indicator increased overall from 0.0715 in 2015 to 0.1710 in 2023, demonstrating a fluctuating upward trend with an average annual growth rate of 10.5%. This suggests a notable improvement in the state of resources and the environment as a whole.
From the perspective of secondary indicators, the improvement in resource and environmental conditions is primarily attributed to fluctuating increases in “Land Resources” and “Water Environment”. The growth trend of the “Atmospheric Environment” indicator is relatively mild, with no substantial increase observed. The “Land Resources” indicator specifically exhibits an upward trend, rising from a low of 0.0330 in 2021 to a high of 0.1310 in 2023. The “Water Environment” indicator shows a fluctuating upward trend, peaking at 0.0255 in 2023. Meanwhile, the “Atmospheric Environment” indicator has remained relatively stable, with minimal fluctuations, and the changes in its value have been modest (Figure 5).

4.2.4. Consumption and Emission Control Is Highly Effective

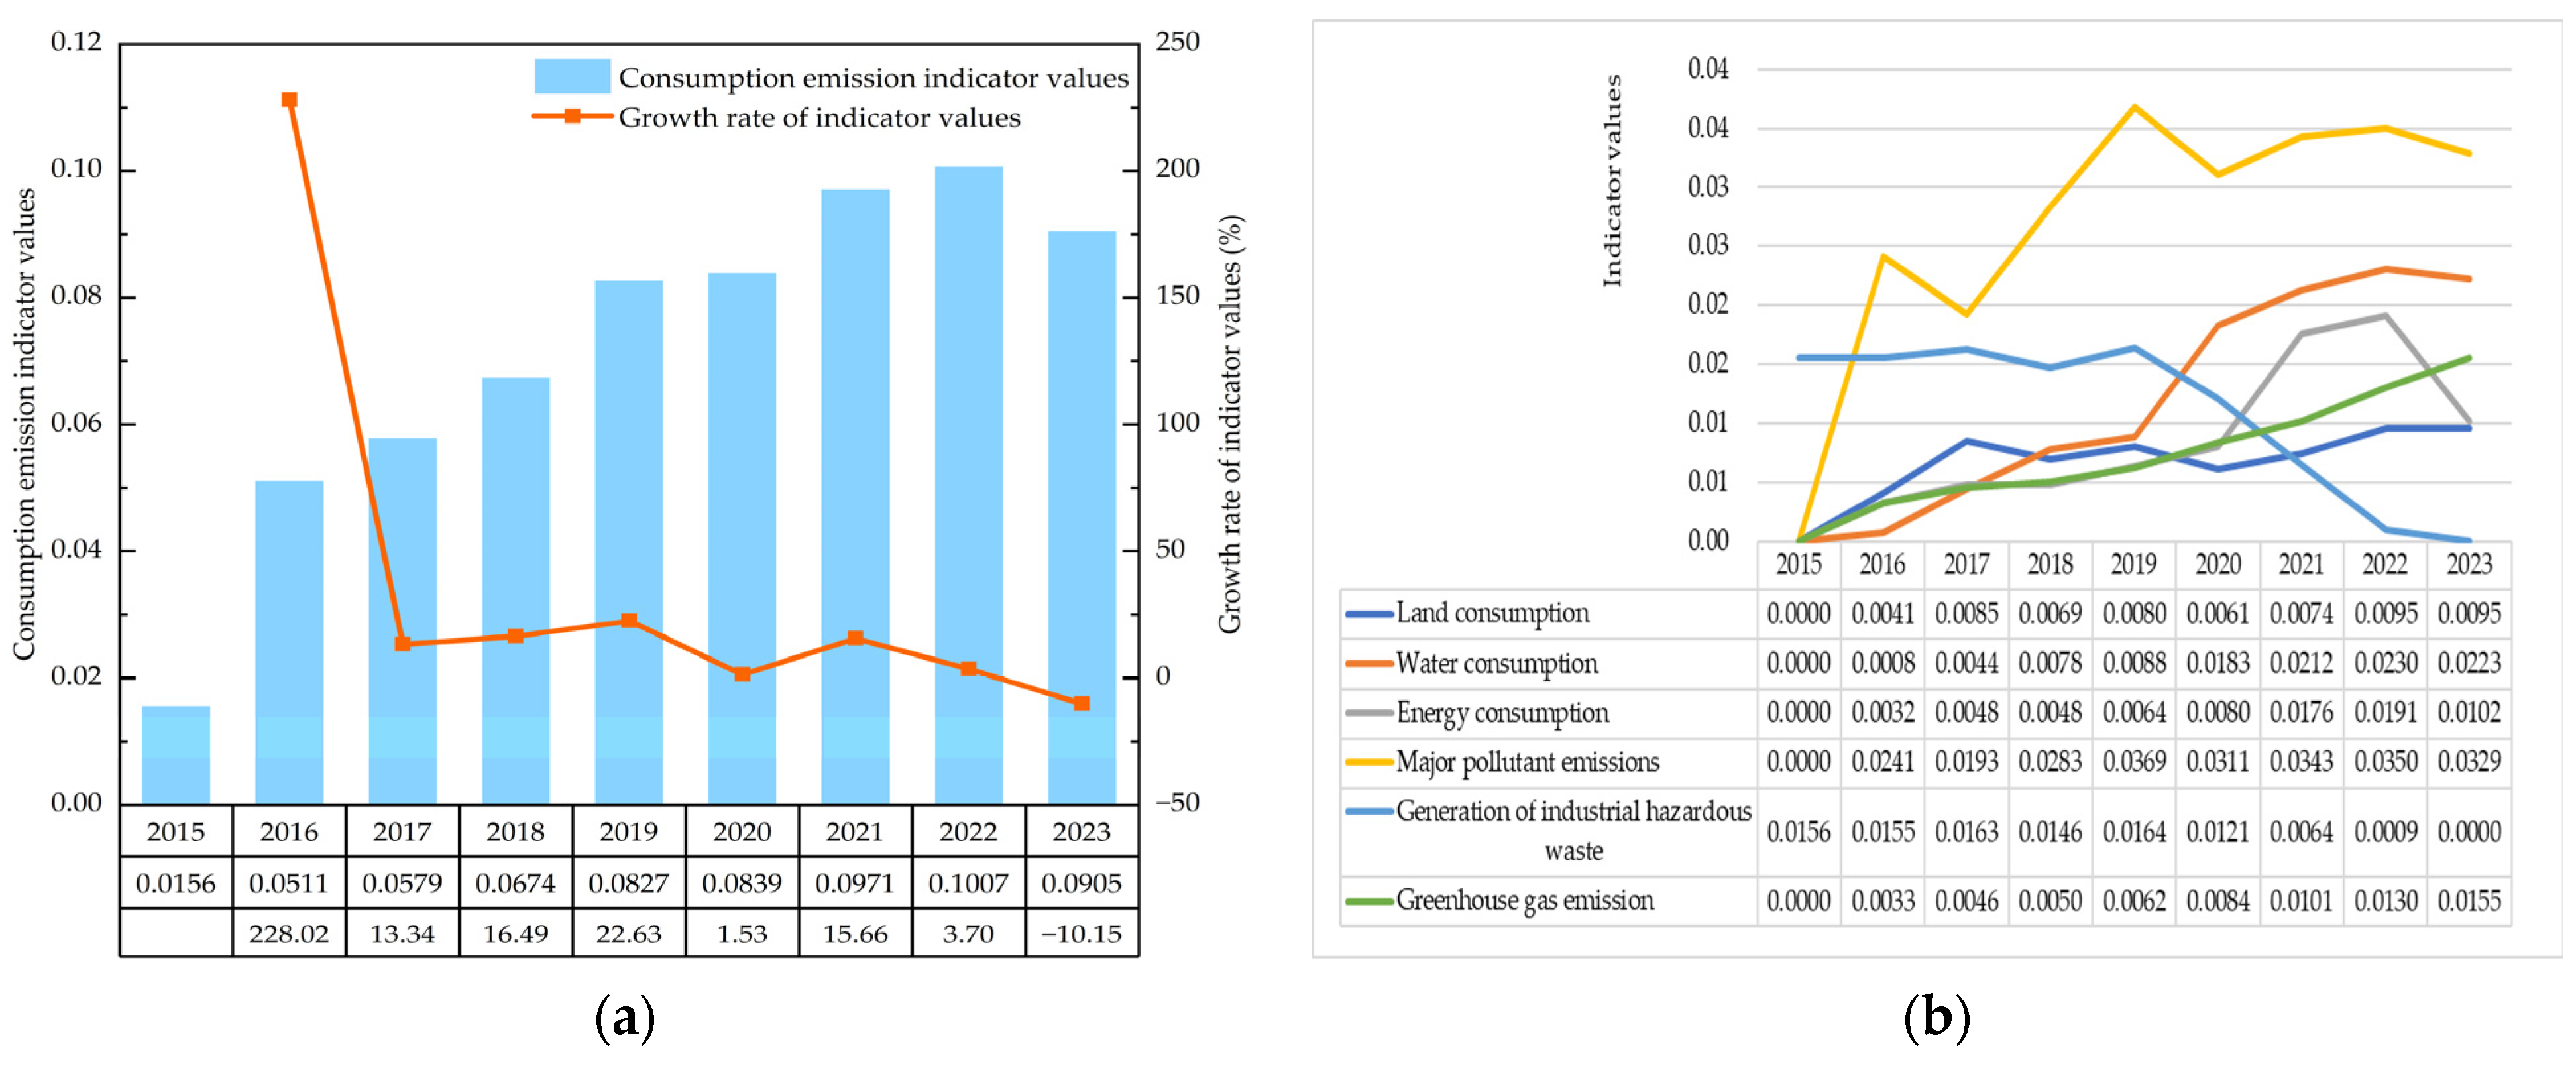
Following the thorough implementation of the pollution prevention and control campaign, the primary “Consumption and Emissions” indicator has shown consistent growth. Its value increased from 0.0156 in 2015 to 0.1007 in 2022, the latter being the peak year. The indicator value in 2023 is slightly lower. The indicator’s average annual growth rate is approximately 30.55%, and the overall trend shows a steady upward trajectory.
Under the first-level “Consumption and Emissions” index, there are six secondary indicators. Four of these—“Land Consumption”, “Water Consumption”, “Main Pollutant Emissions”, and “Greenhouse Gas Emissions”—show an overall upward trend. The growth trend of “Land Consumption” is relatively mild, with no significant changes in its value. The “Water Consumption” indicator demonstrates a more pronounced upward trend, increasing from 0.000 in 2015 to 0.0230 in 2022 before peaking and declining slightly in 2023. The “Main Pollutant Emissions” indicator value was at its lowest in 2015 at 0.0000, peaked in 2019 at 0.0369, declined slightly in 2020, and experienced fluctuations between rises and falls from 2021 to 2023. In contrast, the “Greenhouse Gas Emissions” indicator has exhibited a continuous upward trend, rising steadily from 0.000 in 2015 to 0.0155 in 2023, reaching its peak in the latter year. The “Industrial Hazardous Waste Generation” indicator shows an overall downward trend. Its value remained relatively stable from 2015 to 2019, but then decreased significantly, reaching its lowest value of 0.0000 in 2023. The “Energy Consumption” indicator demonstrated an upward trend from 2015 to 2022, increasing from 0.000 to 0.0191. It then declined to 0.0102 in 2023 (Figure 6).

4.2.5. The Effectiveness of Governance and Protection Needs to Be Improved

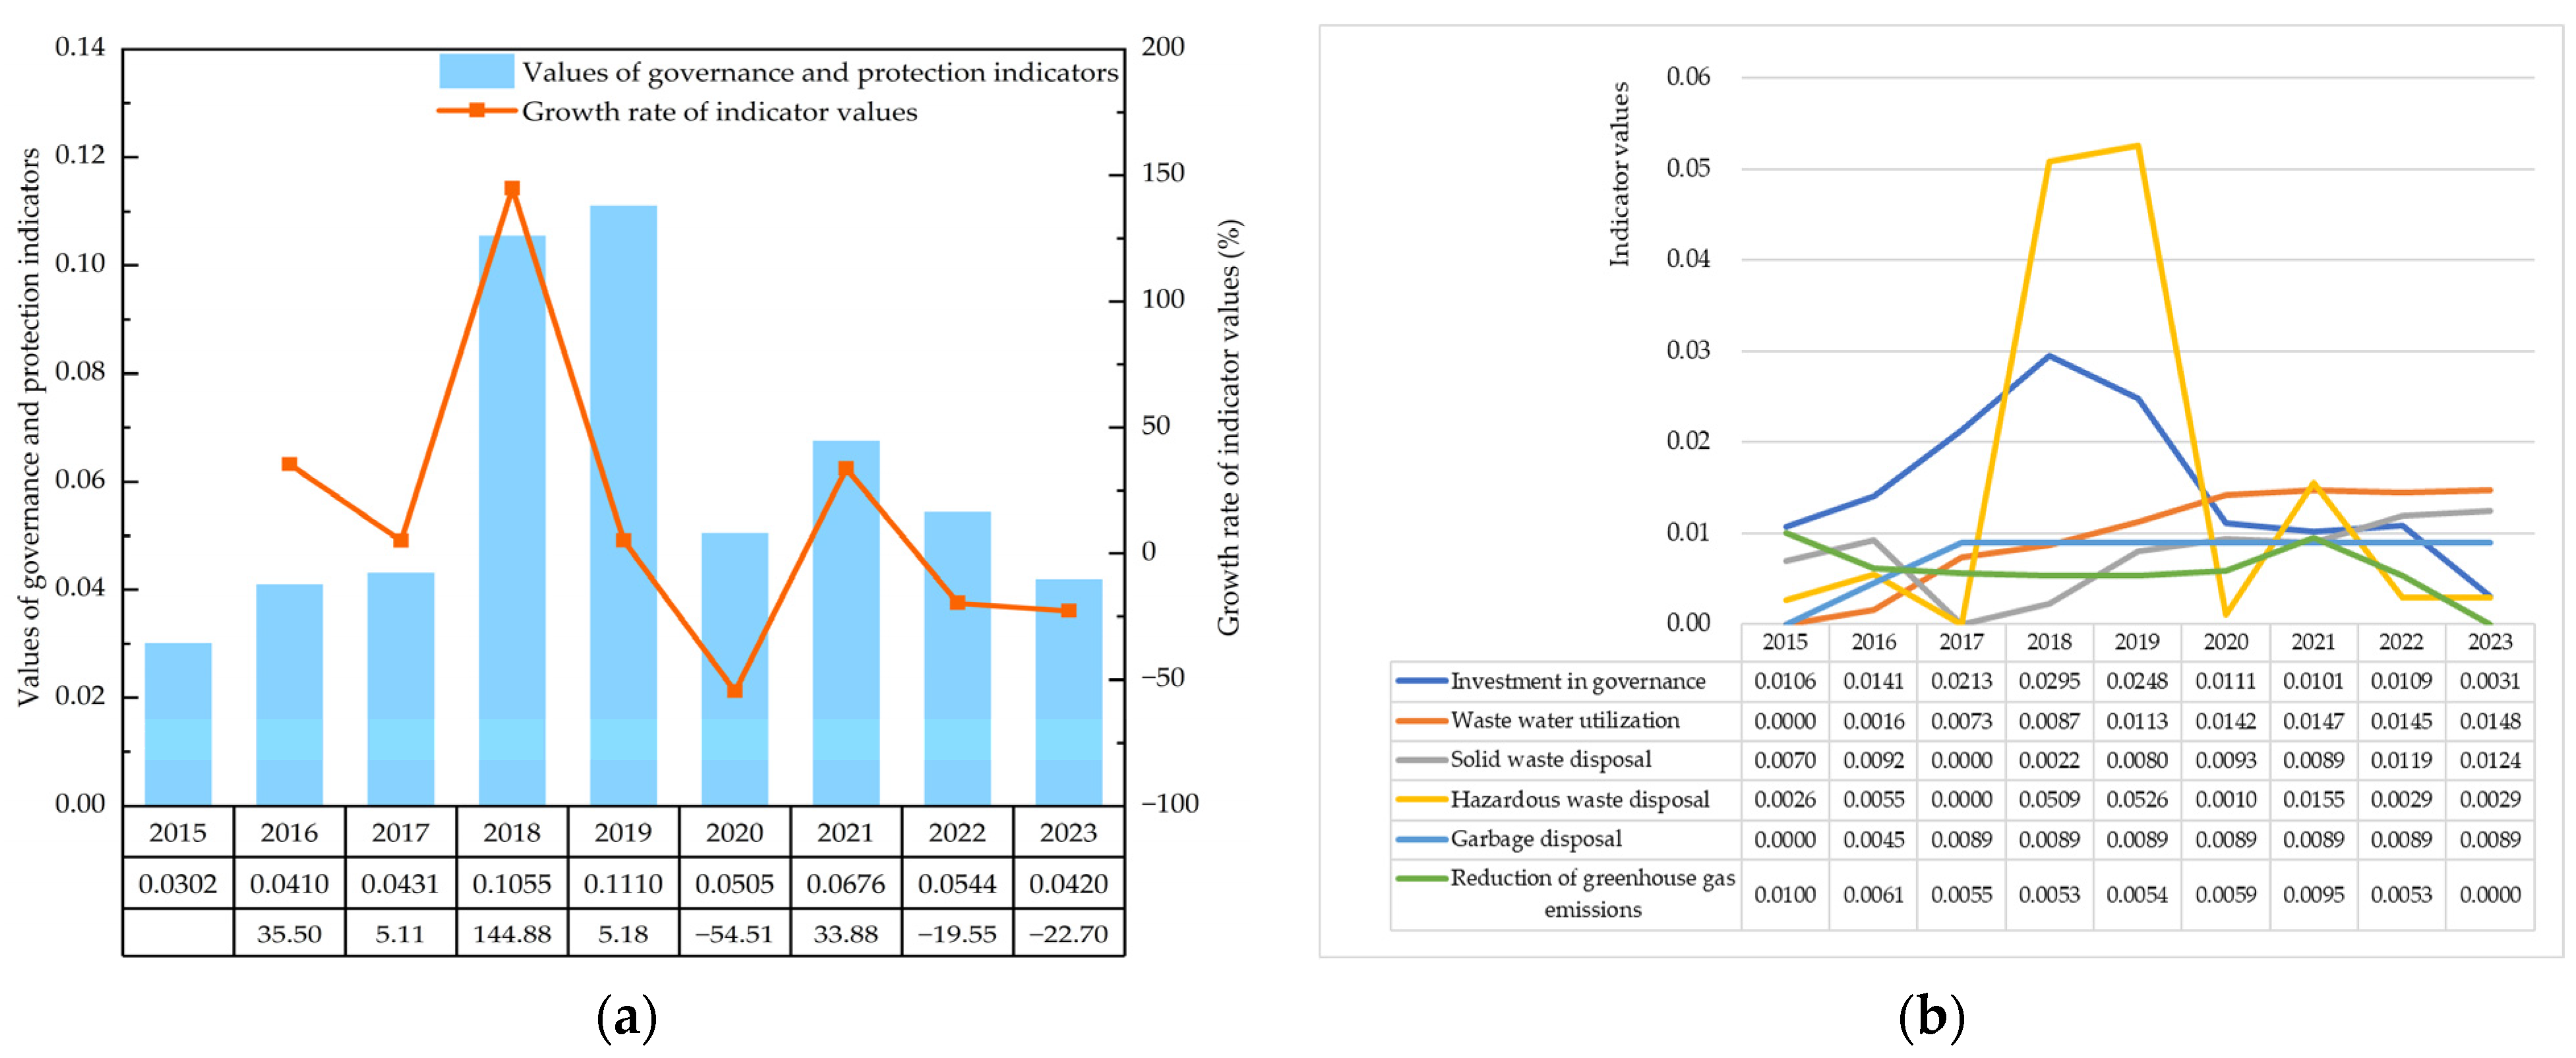
The overall trend of the “Governance and Protection” first-level indicator exhibits significant fluctuations. From 2015 to 2019, the value of the indicator demonstrated a continuous upward trend. However, it experienced a marked decline from 2019 to 2020. From 2020 to 2023, the value initially rose and then fell. The indicator’s peak value was 0.1110 in 2019, while its lowest value was 0.0302 in 2015. Overall, the governance and protection situation from 2015 to 2023 was unstable and required improvement.
The first-level “Governance and Protection” indicator comprises six secondary indicators. Three of these indicators—“Wastewater” Utilization Rate”, “Solid Waste Disposal”, and “Garbage Disposal”—show an overall upward trend. The “Wastewater Utilization Rate” indicator started at its lowest value of 0.0000 in 2015, maintaining a steady upward trend to reach a maximum of 0.0148 in 2023. The “Garbage Disposal” indicator also demonstrates an overall upward trend, starting at 0.0000 in 2015 and stabilizing at 0.0089 from 2017 onwards. The “Solid Waste Disposal” indicator exhibits an overall upward trend with relatively minor fluctuations. Its lowest value was 0.0000 in 2017, and its highest value was 0.0124 in 2023. The “Governance Investment” indicator shows significant fluctuations. It increased year on year from 2015 to 2018 before gradually decreasing from 2018 to 2023. Its highest value was 0.0295 in 2018, and its lowest was 0.0031 in 2023. This indicator is highly correlated with policy changes. The “Hazardous Waste Disposal” indicator follows a ‘几’-shaped distribution, with significant overall fluctuations. Its value was relatively high from 2018 to 2019 but relatively low in other years. The highest value was 0.0526 in 2019, and the lowest was 0.0000 in 2017. Meanwhile, the “Reduction of Greenhouse Gas Emissions” indicator decreased from 2015 to 2018, increased from 2019 to 2021, and exhibited a notable improvement in 2021. It then decreased again from 2022 to 2023. Its peak value was 0.0100 in 2015, and its lowest value was 0.0000 in 2023 (Figure 7).

4.2.6. The Level of Agricultural Development Needs to Be Improved

The overall trend of the first-level “Sustainable Agriculture” indicator shows significant fluctuations. After declining from 2015 to 2016 and increasing from 2016 to 2018, it dropped again from 2018 to 2020. There were then further fluctuations, with rises and falls, from 2020 to 2023. The highest value, 0.0426, was recorded in 2018, while the lowest value, 0.0132, occurred in 2022.
The first-level “Sustainable Agriculture” indicator comprises three secondary indicators. Of these, the “Index of Total Agricultural Output Value” indicator shows a fluctuating downward trend, reaching a high of 0.0123 in 2015 and a low of 0.0000 in 2023. Meanwhile, the “Proportion of the Disaster Area of Tropical Agricultural Land” indicator reached its lowest point in 2016 at 0.0000, remaining relatively stable from 2017 to 2023 with no clear trend of change. The “Per Capita Area of Tropical Agricultural Land” indicator experienced significant fluctuations. It rose steadily from 2015 to 2018, after which it fell sharply from 2018 to 2020. From 2020 to 2023, it showed a slight upward trend. Its maximum value was 0.0283 in 2018, and its minimum value was 0.0000 in 2020 (Figure 8).

4.3. Comprehensive Evaluation Score and Ranking of Cities and Counties in Hainan Province

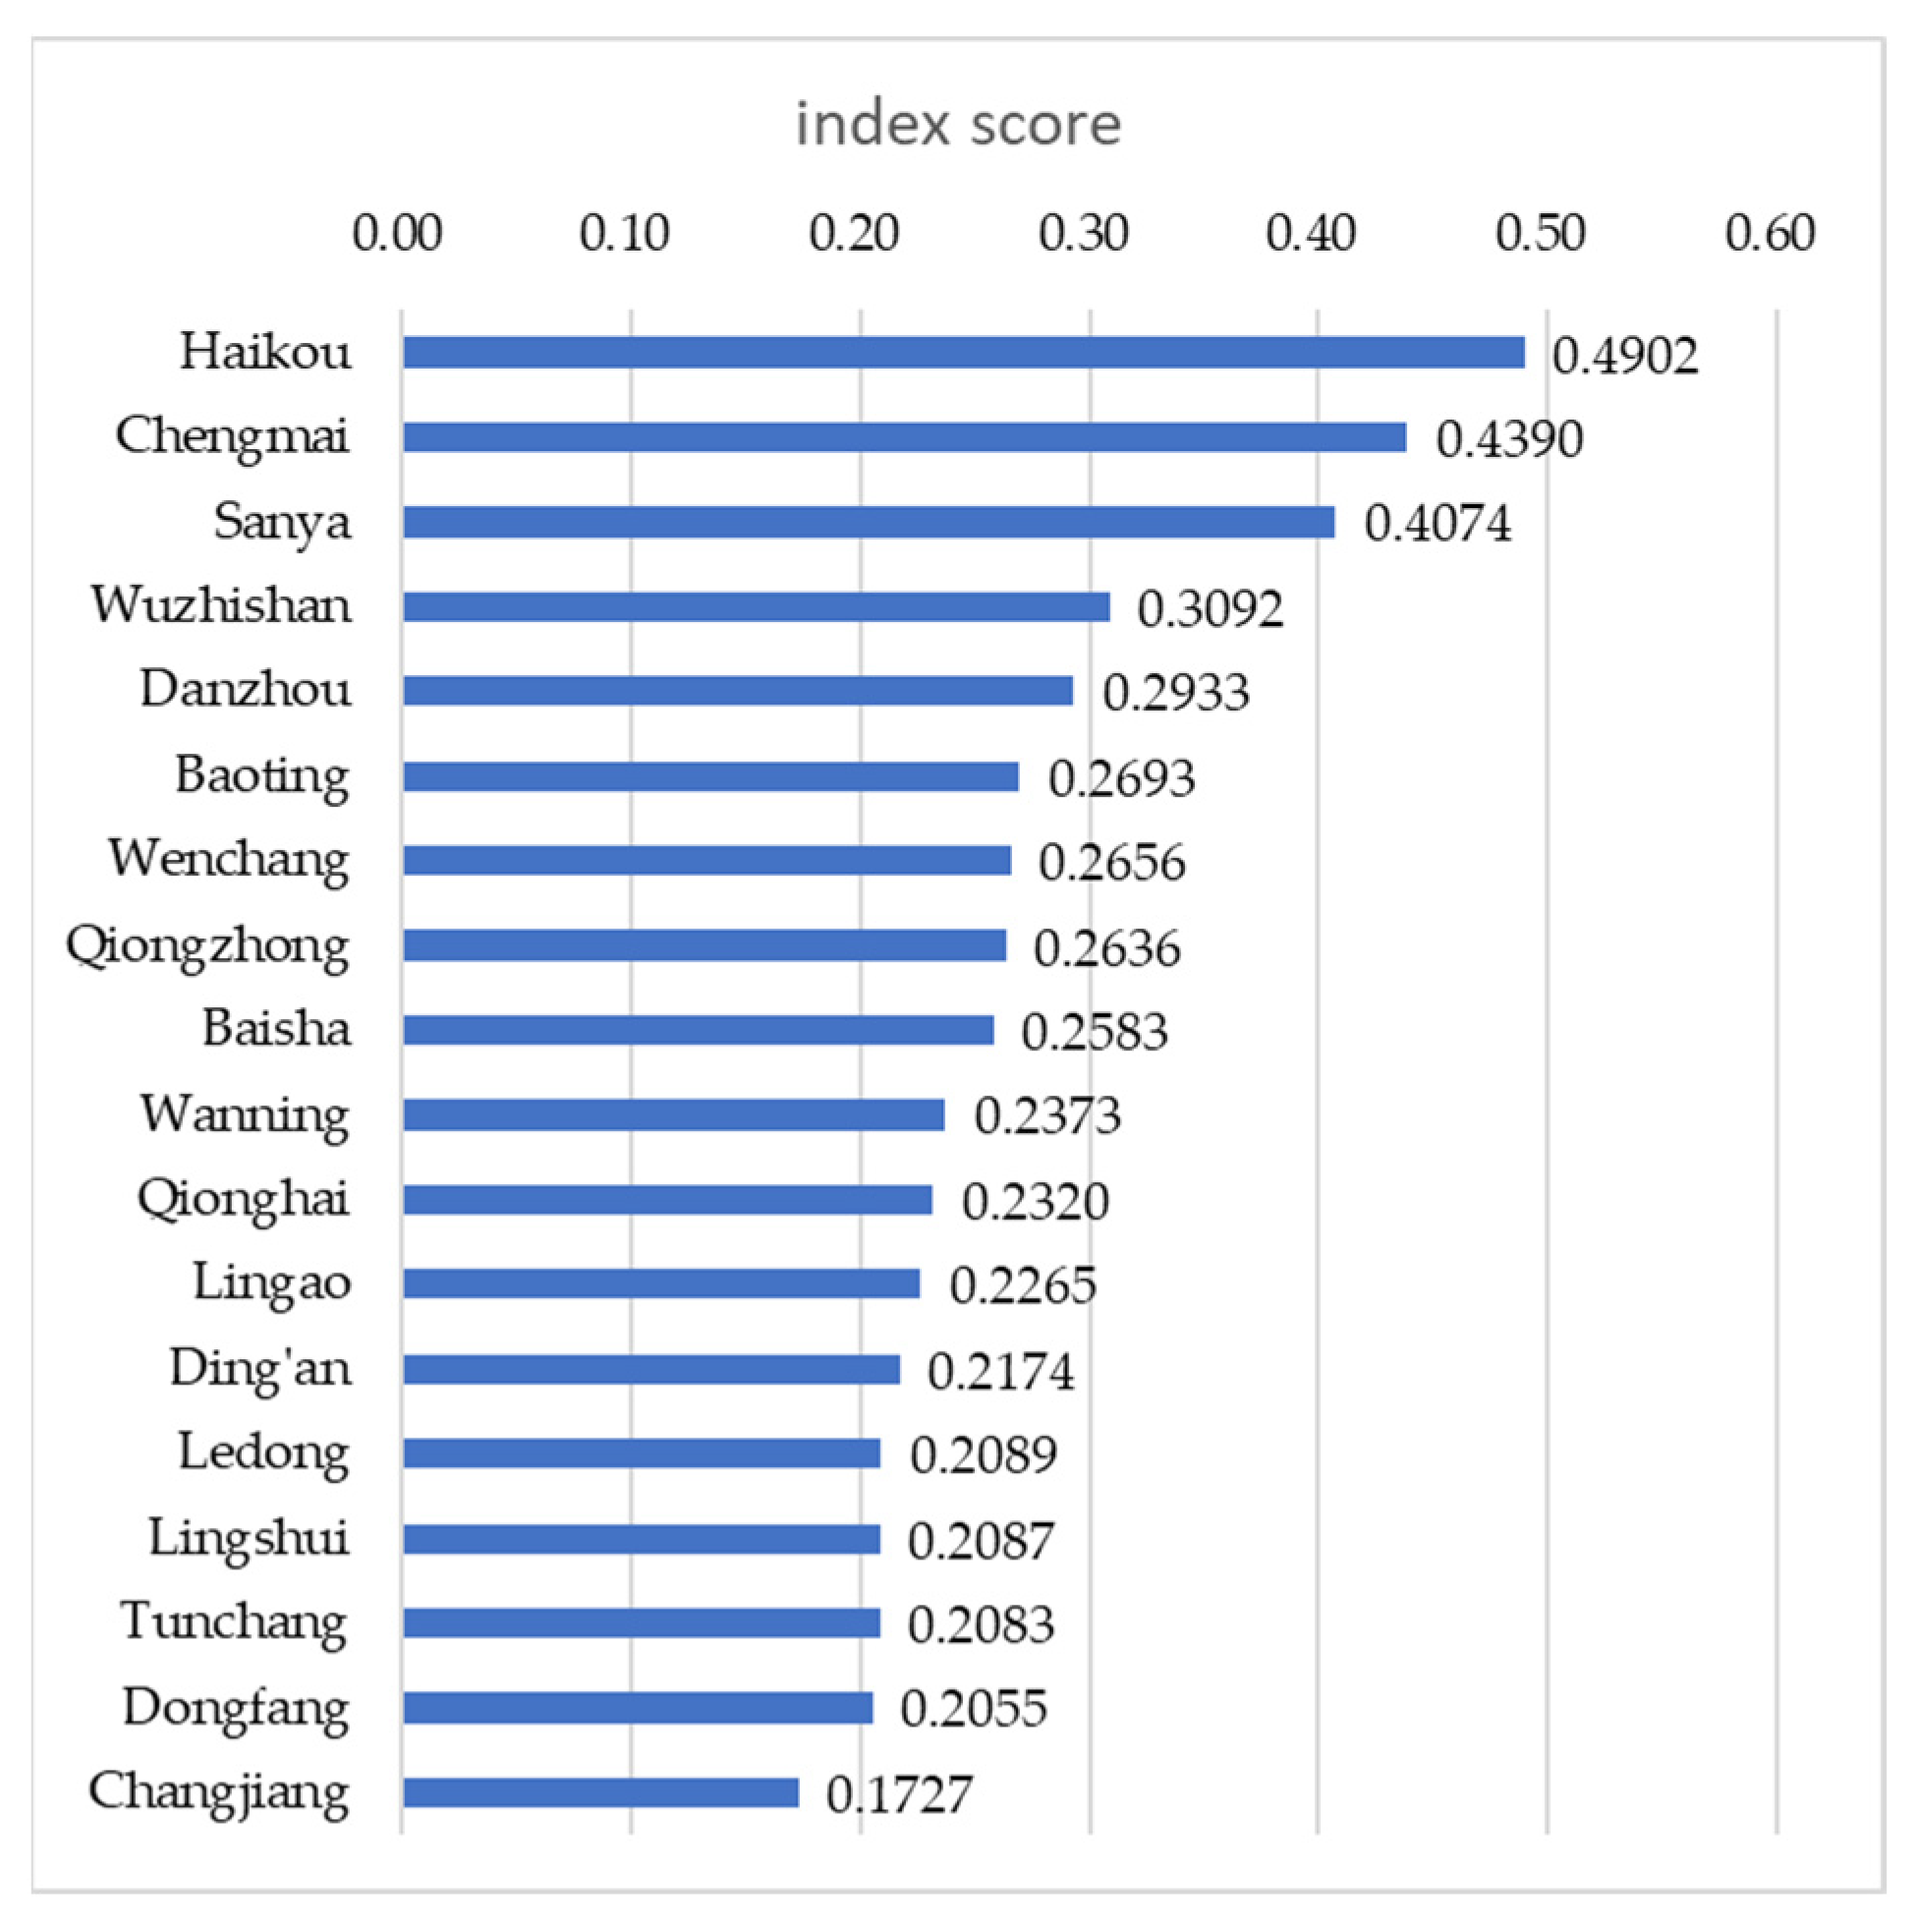
As the above analysis shows, Hainan Province achieved its highest comprehensive evaluation score in 2023 compared with other years. Furthermore, as it is the most recent year in this research sequence, 2023 is of particular importance to the study. Therefore, this study used the entropy value method to calculate the comprehensive evaluation results for the sustainable development level of the 18 counties and cities in Hainan Province in 2023. Based on these results, the sustainable development levels of these counties and cities exhibit a stepped distribution pattern in 2023, with significant disparities observed (Figure 9).

4.4. Cluster Analysis Results

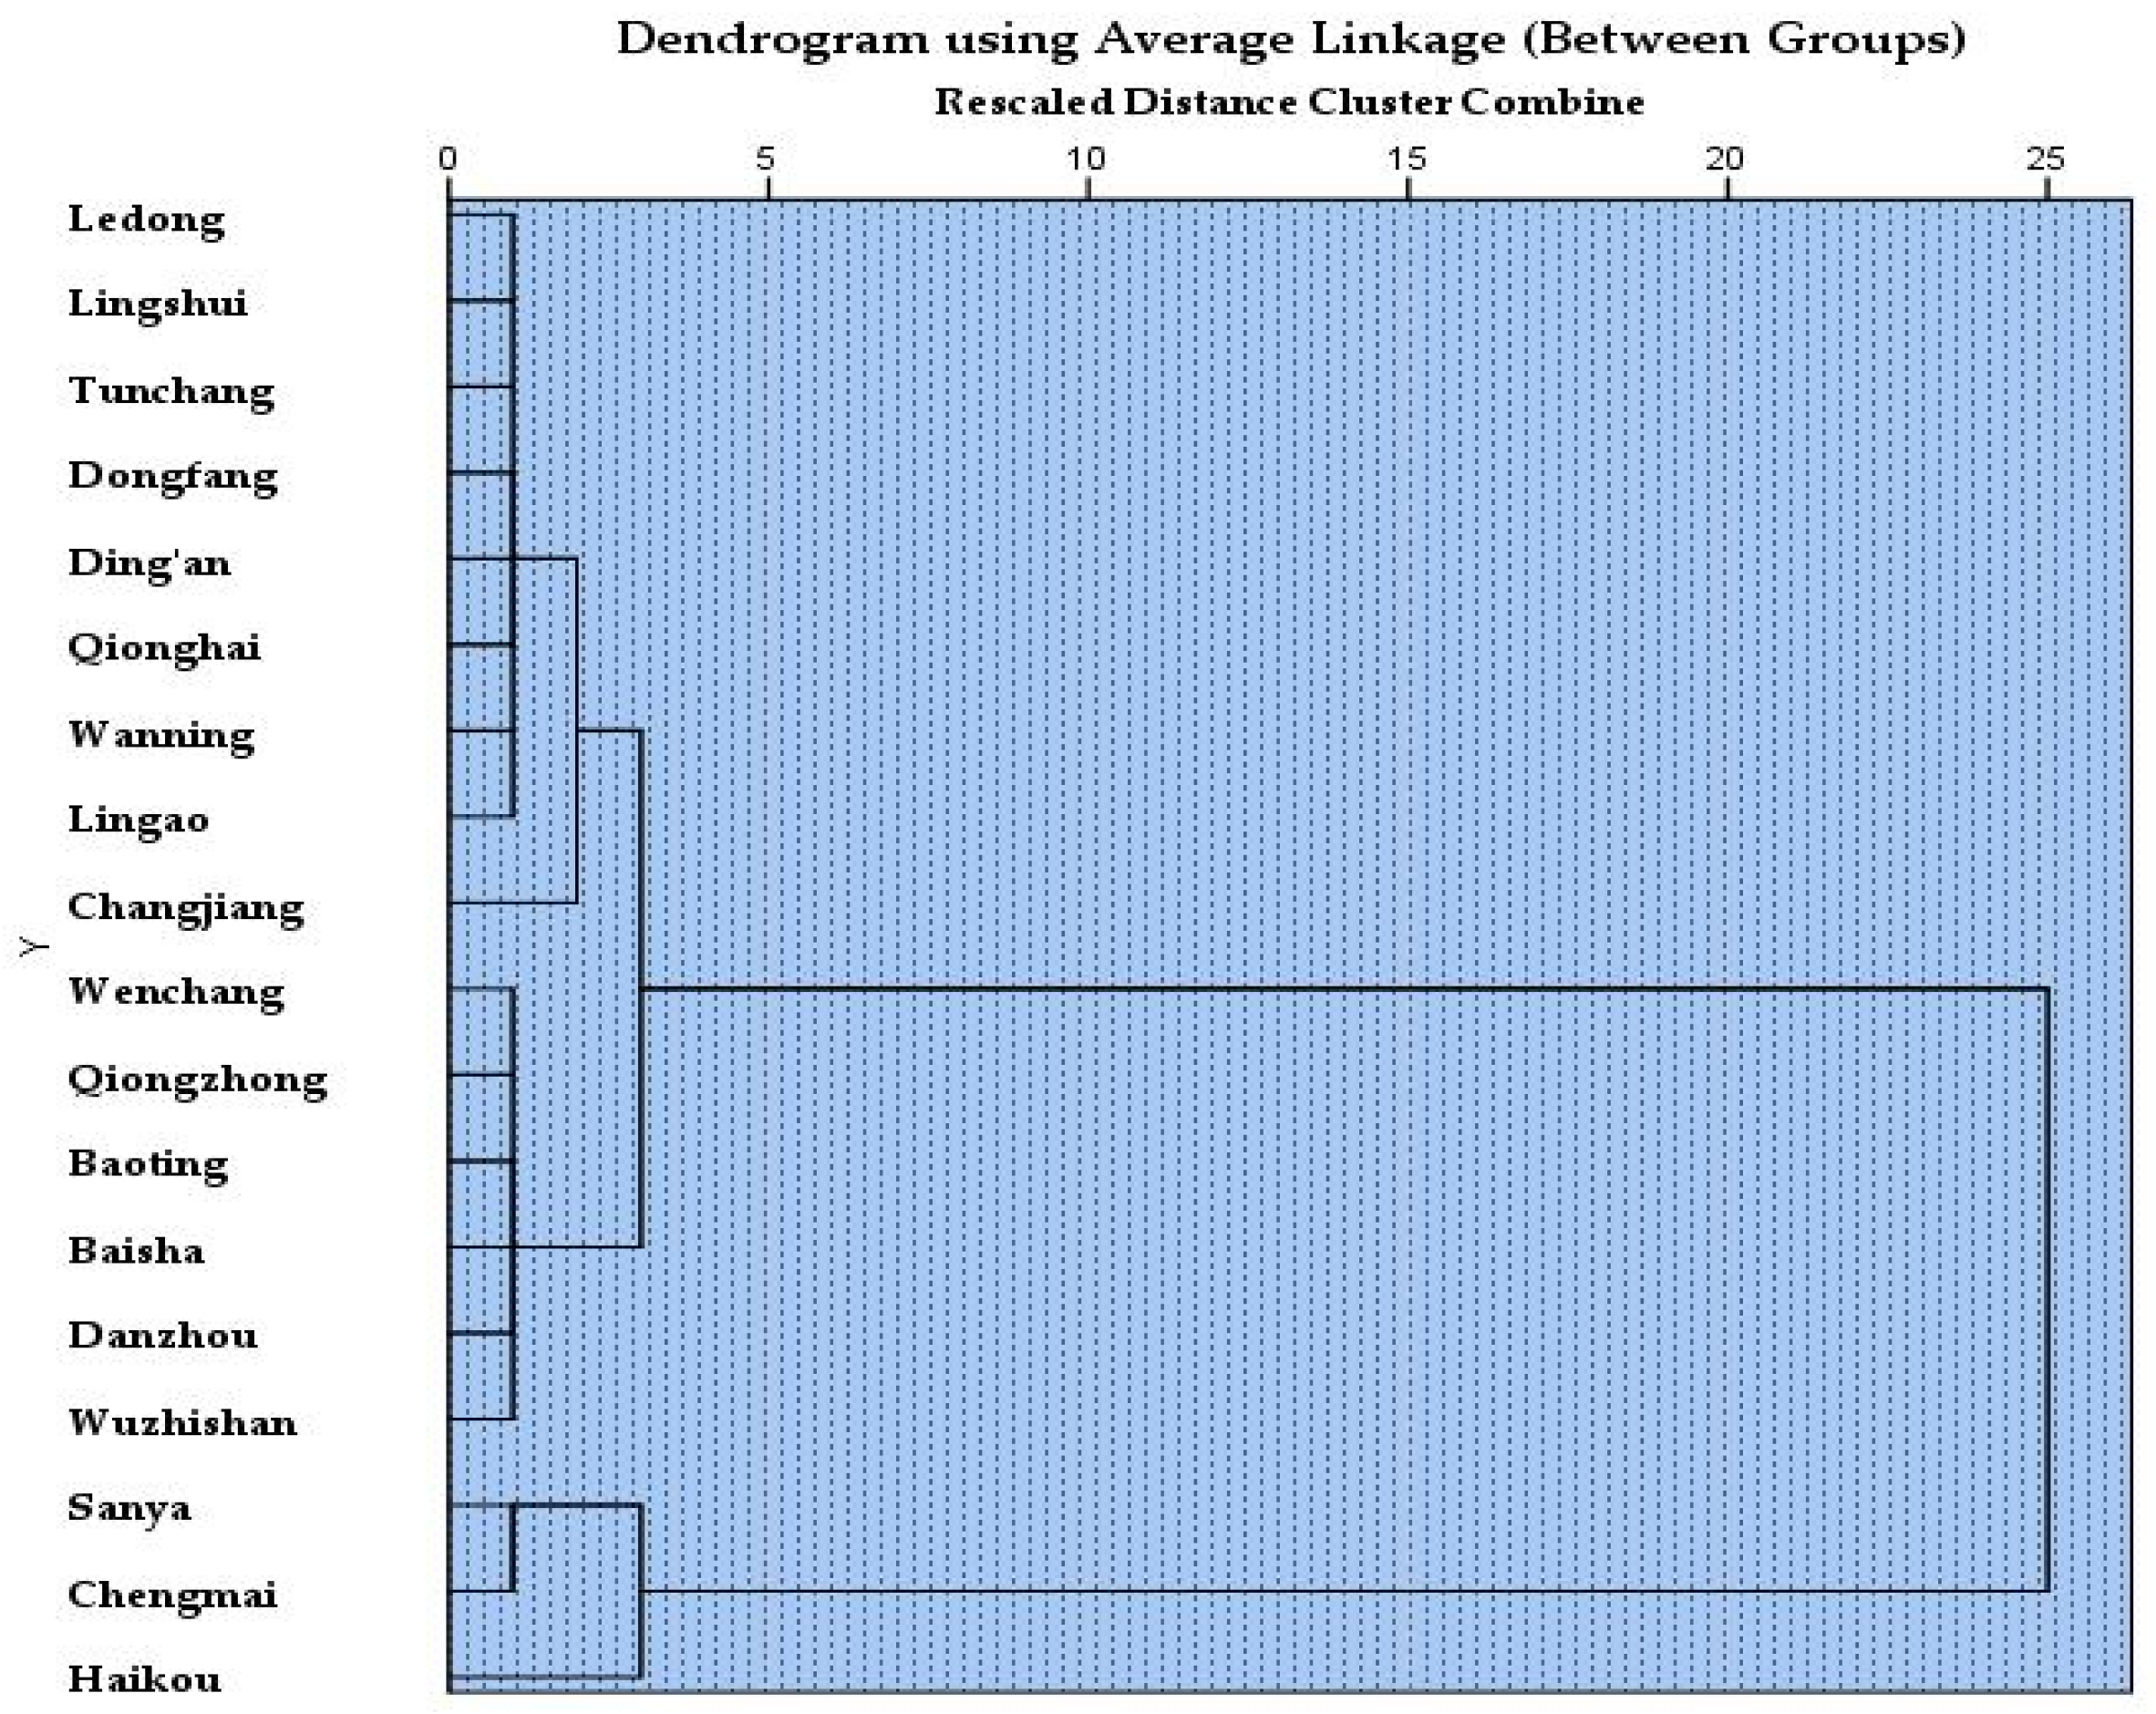
The average linkage (between groups) clustering analysis method was employed based on the comprehensive score to analyze and generate the clustering dendrogram for the sustainable development level of the 18 cities and counties in Hainan Province in 2023. Taking into account the specific conditions of Hainan Province and the results of the clustering analysis, it was determined that dividing the regions into three categories would yield a more appropriate classification. The clustering analysis revealed a strong agglomeration trend, grouping the regions into the Pioneer Development Area, the Stable Development Area, and the General Development Area (Figure 10 and Table 2). The cluster analysis results for the 18 cities and counties were visualized using ArcGIS (version 10.2) software (Figure 11).
Based on the comprehensive scores of the 18 cities and counties in Hainan Province in 2023, as well as the results of the cluster analysis, these areas can be divided into three distinct regions. The first category is the Pioneer Development Area, comprising Haikou, Chengmai, and Sanya. As shown in Figure 11, these cities are located in the purple area, with Haikou and Chengmai in the north and Sanya in the south.
The second category is the Stable Development Area, which comprises the cities of Wuzhishan, Danzhou, Baisha, Baoting, Qiongzhong, and Wenchang. These cities are located within the green area shown in Figure 11. Of these, Wenchang borders Haikou, while Baoting and Wuzhishan adjoin Sanya, and Baisha and Qiongzhong neighbor Danzhou.
The third category is the General Development Area and includes the cities of Changjiang, Lingao, Wanning, Qionghai, Ding’an, Dongfang, Tunchang, Lingshui, and Ledong. These cities are located within the blue area shown in Figure 11. While some of these cities are in remote areas in the northwest and southwest of the study area, others are in the central region or the eastern coastal area.

5. Analysis of the Effective Contributions of the Hainan Provincial Government in Promoting Regional Sustainable Development

This section analyzes the effective contributions of the Hainan provincial government in promoting local sustainable development through an examination of Chinese official discourse, including policy documents issued by the Hainan provincial government and work reports from the Hainan Provincial People’s Government. The policy documents were sourced from the policy compilation section of the Hainan Provincial People’s Government website and the Hainan Provincial Policy Documents Database, covering the period from January 2015 to December 2023. Through keyword searches and manual screening, 64 policy documents and nine government work reports relevant to the research theme and content were identified, excluding those unrelated to the study. This section employs in-depth reading and content analysis methods to systematically analyze each selected policy document. NVivo software (version 14.0) is utilized for coding and integration, enabling the categorization and thematic coding of policies according to the predefined research themes (Table 3 and Table 4) [43].
Since this study covers the period from 2015 to 2023, and considering China’s national conditions, 2015 marks the final year of the 12th Five-Year Plan. The years 2016 to 2020 correspond to the 13th Five-Year Plan period, while 2021 to 2023 represent the early years of the 14th Five-Year Plan. Therefore, this section is described by integrating themes with chronological order [44].

5.1. Hainan Provincial Government and Economic Development

5.1.1. Phase I, 2015, Marks the Final Year of the 12th Five-Year Plan

In 2015, the economic operation of Hainan Province as a whole showed a “steady progress, steady improvement” trend, and various undertakings have made new progress. Economic development can be expressed through innovation, structural optimization, stable growth, and open development.
  • Driving innovation. Deepen the reform of the scientific and technological system and stimulate the power and vitality of innovation. Driving the industry chain with the innovation chain, promoting the effective integration of science and technology with the economy, and boosting industrial development. Implementation of major provincial scientific and technological projects to accelerate key common technology research and development. Expanding openness and cooperation and improving the level of collaborative innovation. Vigorously develop crowdsourcing spaces to promote mass entrepreneurship and innovation.
  • Structural optimization. Actively promote structural adjustment and transformation, focusing on the development of twelve industries. Tourism upgrading accelerated structural adjustment of agriculture, the Internet leading enterprises to speed up the layout of Hainan, aircraft financing and leasing, and other new forms of financial services continue to emerge, the real estate industry structure is gradually optimized, etc., and has begun to show results.
  • Stabilizing growth. Grasp projects, promote investment, and promote stable and rapid economic growth. Establishment of the target management responsibility system, the implementation of monthly and quarterly assessments and inspections, to carry out the “100-day battle of investment projects”. Three hundred and ninety three provincial key projects complete the investment of CNY 191.5 billion, exceeding the annual plan by CNY 19.4 billion.
  • Open development. Successfully organized major events such as the 2015 China-Korea Humanities Exchange Theme Provincial Road Activity, the Launching Ceremony of the “China-ASEAN Year of Maritime Cooperation”, and the International Regatta around Hainan Island. Strengthening cooperation and exchanges with relevant countries and regions along the route, the annual actual utilization of foreign capital of USD 2.47 billion, an increase of 28.7%.

5.1.2. Phase II, Spanning from 2016 to 2020, Corresponds to the 13th Five-Year Plan Period

Since the comprehensive deepening of reform and opening up and the construction of a free trade port with Chinese characteristics, Hainan’s position and role in the overall situation of national development have become more prominent, and a series of profound economic and social changes have taken place.
  • Driving innovation. China’s efforts to strengthen basic research and key core technologies have resulted in a steady flow of major innovations. “Chang’e” probes the moon, “Beidou” sets up a network, “Shenzhou” flies to the sky, and “Tianyan” patrols the sky, “Jiaolong” into the sea, “Kunlong” hits the water…several “national important weapons” have been unveiled. Original achievements with international influence have emerged in many fields, such as iron-based superconductivity, quantum information, stem cells, and synthetic biology.
  • Structural optimization. Historic breakthroughs have been made in the structural transformation of the economy. The structure of the three industries is adjusted to 20.5:19.1:60.4, with the proportion of the service sector increasing by 6.4 percentage points and its contribution to economic growth reaching 95.8%, an increase of 31.5 percentage points. Tourism revenue achieves the 100 billion target one year ahead of schedule, with tourism revenue growing faster than the number of tourists by an annual average of 4.6 percentage points. High-tech enterprises have increased nearly four-fold, and the average annual growth rate of the size of the Internet industry has exceeded 30%.
  • Stabilizing growth. Removing the economy’s dependence on real estate, the real estate industry’s value-added, investment, and tax revenue account for 4%, 21.9%, and 25.1% of the regional GDP, fixed-asset investment, and local general public budget revenue, respectively, falling from the highest level, but the economy has always maintained a stable and healthy development, and has successfully realized the breakthrough.
  • Open development. Comprehensively deepening reform and opening up to a new level. The visa-free entry policy is extended to 59 countries, and the annual scale of inbound tourists has increased by 56%. The amount of actual utilized foreign capital doubled for three consecutive years. Thirty two colleges and universities have signed up and moved into the International Education and Innovation Island. Open platforms, such as the Boao Forum for Asia, have been consolidated and expanded, and the 2020 Joint Meeting of Chief Executives for Pan-Pearl River Delta Regional Cooperation has been successfully organized.

5.1.3. Phase III, Spanning from 2021 to 2023, Marks the Beginning of the 14th Five-Year Plan

Hainan Province implements the new development concepts of innovation, coordination, green, openness, and sharing, and promotes economic and social development to present a good situation of higher quality, better structure, better ecology, more practical people’s livelihood, and more solid and effective risk prevention and control [45].
  • Driving innovation. Scientific and technological innovation has achieved breakthroughs. The Yazhou Bay Laboratory is up and running. The “Deepsea Warrior” successfully deployed a seafloor in situ scientific experiment station. A series of major launch missions for China’s space station are completed, and the country’s first commercial space launch site begins construction. Social investment in research and development (R&D) increased by nearly 50%.
  • Structural optimization. Focusing on structural optimization, industrial investment increased by 33.5%, of which manufacturing investment increased by 84.2%. Consumption is upgraded in quality. The first China International Consumer Goods Fair was an instant success, with the degree of internationalization, the value of exhibits per unit area, and the number of debut exhibitions far exceeding expectations, making it the largest consumer boutique exhibition in the Asia-Pacific region.
  • Stabilizing growth. The broader economy is stabilizing and improving. Two rounds of extraordinary actions have been carried out to stabilize the economy, special measures have been introduced to assist enterprises in their difficulties and development, and tax reductions and fee reductions totaling CNY 28.09 billion have been made to stabilize the economy. Industrial investment grows by 33%, increasing its share by 5.2 percentage points.
  • Open development. The export-oriented economy is booming. The total import and export of goods is expected to exceed CNY 200 billion, an increase of 35%. Trade-in services increased by 21.6%. The actual use of foreign capital exceeds USD 4 billion, an increase of 15%. Actual outward investment of USD 1.7 billion doubled year-on-year.

5.2. Hainan Provincial Government and Social Livelihood Development

In 2015, it continued to increase investment in people’s livelihoods, with annual livelihood expenditures of CNY 93.93 billion, an increase of 13.9% year-on-year, and livelihood expenditures accounting for 75.7% of local general public budget expenditure, an increase of 2.2 percentage points year-on-year. Social livelihood can be expressed through four aspects: education and culture, social security, health and wellness, and degree of parity [46,47].

5.2.1. Phase I, 2015, Marks the Final Year of the 12th Five-Year Plan

  • Education and culture. It has realized full coverage of public kindergartens in all townships, launched a project to introduce and cultivate good principals and teachers in primary and secondary schools, and added 4000 places in ordinary high schools. The scope of tuition exemption for secondary schools is expanded, the average per-pupil allocation standard for public higher vocational institutions is raised to CNY 12,000 per person per year, and CNY 30.92 million in living allowances are granted to nearly 10,000 teachers in the province’s arduous and remote areas.
  • Social security. The province has realized the same system and the same treatment for rural residents and urban residents in old-age insurance, and the subsidy standard has been raised uniformly to CNY 145 per person per month, ranking among the highest in the country. The establishment of a major disease insurance system covering urban and rural residents and the realization of provincial-level coordination of the three medical insurance systems, namely, employees’ medical insurance, urban residents’ medical insurance, and maternity insurance.
  • Health and wellness. Construction and improvement of food inspection and testing system. Solving the problem of safe drinking water for 150,000 rural residents. The provincial oncology hospital is completed and opened, and free national pre-pregnancy eugenic health examinations and thalassemia gene screening and diagnostic services are carried out. The comprehensive reform of county-level public hospitals has been comprehensively launched, and the pilot comprehensive reform of primary healthcare organizations has been solidly advanced.
  • Degrees of parity. Rehabilitation of 44,000 dilapidated rural houses, exceeding the target set at the beginning of the year by 3.4 times, and commencement of the re-habilitation of 35,800 shantytowns. Implementing precise poverty alleviation, 86,000 people are lifted out of poverty. An additional 101,000 people are employed in urban areas. Comprehensively completing the construction of rural roads in ethnic areas and implementing financial interest subsidies of CNY 110 million for small loans to farmers throughout the province [48].

5.2.2. Phase II, Spanning from 2016 to 2020, Corresponds to the 13th Five-Year Plan Period

This is a five-year period of highlighting the shortcomings in the field of people’s livelihood and increasing the people’s sense of gain. More than 75 percent of fiscal expenditure is spent on people’s livelihoods, an increase of 3.8 percentage points over the previous five years.
  • Education and culture. Introducing and negotiating the cooperation of quality educational resources to run 104 schools. The indicators for preschool education are higher than the national requirements, the main indicators for primary and secondary education exceed the national average, and the ratio of large classes has been reduced to 0.49 percent. Vocational education covers 452 specializations in 32 categories. Higher education has an overall layout of “1 comprehensive university + 2 specialized universities + multiple universities”.
  • Social security. Social insurance coverage has increased, with the basic pension insurance participation rate reaching 91%. A total of CNY 6.85 billion have been invested in social assistance for the needy, benefiting 1.6 million people in need. The rate of basic rehabilitation services for persons with disabilities has reached 100 percent. Newly adding 297,000 units of various types of housing with security functions, and launching a pilot program of residential commercial housing.
  • Health and wellness. Elimination of malaria throughout the province. The introduction of 49 high-quality hospitals, the addition of seven new Grade 3A hospitals, “one hour three hospitals service circle” covering the province, the completion of the standardization of 1272 primary health care institutions, the addition of 22 kinds of Chinese and Western medical specialties do not go out of the island for treatment, “staying out of the city for minor illnesses and off the island for major ones” is starting to become a reality.
  • Degrees of parity. The growth of people’s income outpaced the economic growth rate, and the income gap between urban and rural residents narrowed by 5.8 percent. The number of new urban jobs increased by 616,000, and the growth rate reached 29.2 percent.

5.2.3. Phase III, Spanning from 2021 to 2023, Marks the Beginning of the 14th Five-Year Plan

In the past three years, people’s livelihoods and social undertakings have made great progress, and people’s well-being has been effectively safeguarded. Approximately 72.9% of the province’s local general public budget expenditures are used to safeguard people’s livelihoods.
  • Education and culture. A total of 83 primary and secondary kindergartens have been introduced, providing 160,000 quality places, as well as 40,000 new places in basic education. More than 200 mass cultural activities are organized to celebrate the 100th anniversary of the founding of the Party. Completion of the second phase of the provincial library, Hainan Science and Technology Museum, and the provincial art museum.
  • Social security. The construction of 39,000 units of residential housing has begun and the first batch is successfully placed for sale, and 13,000 units of public rental housing are guaranteed. The special rectification of the real estate and housing rental market has been effective. The monthly per capita pension for retirees is increased by CNY 138. There are 3015 new beds for the elderly and 6735 nursery places for infants and children aged 0–3. Completing vocational skills training for 241,000 people.
  • Health and wellness. Shanghai Jiao Tong University School of Medicine-affiliated Ruijin Hospital Hainan Hospital trial run, 50 provincial clinical medical centers and provincial capitals of public tertiary hospitals to speed up the implementation of the layout and construction, to achieve the “one-hour tertiary hospital service circle” province-wide coverage. It is the first in the country to realize a 5G remote diagnosis and treatment system covering all village (residential) health institutions.
  • Degrees of parity. All 13,000 urban workers in difficulty have been relieved of their difficulties. Vigorous efforts have been made to organize farmers to go out to work to increase their incomes, with the growth rate of wage income increasing by 4.9 percentage points and the per capita disposable income of rural residents growing by 11 percent. The per capita disposable income of rural residents is expected to grow 5.5 percentage points faster than that of urban areas.

5.3. Hainan Provincial Government and Ecological Environment Development

5.3.1. Phase I, 2015, Marks the Final Year of the 12th Five-Year Plan

Adhere to the problem-oriented, vigorously carried out environmental remediation six special actions.
Firstly, a special three-year campaign to rectify illegal structures is carried out, removing about 8.7 million square meters of illegal structures. Secondly, special inspections and rectification actions are carried out on the island’s 1823 km of coastline, with 805 violations fully rectified, 257,000 square meters of illegal structures demolished, and 8765 acres of shoreline land resumed. Thirdly, with the comprehensive management of urban and rural environments, the “dirty and chaotic” phenomenon has been effectively curbed; the Haikou effect is remarkable; the Sanya comprehensive pilot is carried out to achieve a good start; Danzhou, Wenchang, Qionghai, and Haikou Yanfeng towns are listed as national comprehensive pilots of the new urbanization; Qionghai is assessed as a national health city. Fourthly, to carry out the town river (lake) water pollution control three-year special action, Sanya River and Lingshui River remediation have achieved significant results. Fifthly, carrying out ecological restoration and wetland protection in forested areas, and completing afforestation of 201,000 mu in the “Greening Treasure Island Campaign”. Sixthly, special air pollution control actions have been carried out, and an early warning and forecasting system for ambient air quality has been completed.

5.3.2. Phase II, Spanning from 2016 to 2020, Corresponds to the 13th Five-Year Plan Period

This is a five-year period of higher standards, greater efforts, and stricter governance for ecological environmental protection.
The implementation of the National Ecological Civilization Pilot Area Implementation Plan and the 30 measures of the provincial party committee was refined. Two rounds of central environmental protection inspectors and national marine inspectors’ feedback problems rectification have been grasped, and the formation of environmental protection issues regularized remediation mechanism. The pilot program of the Tropical Rainforest National Park System was launched and passed the national assessment and acceptance, covering more than 95% of the original forests and more than 55% of the natural forests on the whole island. The proportion of clean energy installed capacity reaches 67%, an increase of 23 percentage points; the proportion of clean energy vehicle ownership reaches 4.2%, 1.3 times higher than the national level; and the vehicle-to-pile ratio is 2.4:1, 20% better than the national level. The ban on the production, sale, and use of non-biodegradable plastic products is off to a good start, with assembled floor space doubling for the third consecutive year. Historically, it has achieved zero domestic waste to landfill. The proportion of good air quality days reaches 98%, fine particulate matter (PM2.5) concentrations fall by 1 microgram per cubic meter on average per year, and emissions of major pollutants, energy consumption, and carbon intensity complete ahead of schedule the control targets set by the state [49].

5.3.3. Phase III, Spanning from 2021 to 2023, Marks the Beginning of the 14th Five-Year Plan

Breakthroughs in ecological civilization have been made in the past three years.
The proportion of good air quality days for the year reaches 99.4%, the concentration of fine particulate matter (PM2.5) is 13 micrograms per cubic meter, the ozone concentration is at a low value in recent years, the water quality of rivers, lakes, reservoirs, and near-shore sea areas remain excellent, the amount of fertilizers applied and the amount of chemical pesticides used are reduced by 3.4% and 3.6%, and the quality of the ecological environment is maintained at a first-rate level in the country. The completion rate of rectification and improvement due to the national marine inspectors reaches 90.7%. The first national park Gross Ecosystem Product (GEP) accounting results are released. A carbon emission environmental impact assessment for planning and construction projects is launched on a pilot basis. Hainan Tropical Rainforest National Park is among the first five national parks announced by General Secretary Xi Jinping. New energy vehicles add more than 58,000 licenses, accounting for 7.2% of ownership, 4.6 percentage points higher than the country, and 25.8% of new vehicles, 13.1 percentage points higher than the country. The proportion of clean energy installed reaches 70%, an increase of 3 percentage points. Implementing the nation’s first local regulation banning the production, sale, and use of non-biodegradable plastic products. Promoting 22.8 million square meters of assembled buildings, doubling for four consecutive years [50].

5.4. Hainan Provincial Government and Social Governance Development

5.4.1. Phase I, 2015, Marks the Final Year of the 12th Five-Year Plan

Social governance is being strengthened.
It has cracked down on all kinds of illegal and criminal activities, following the law, and has achieved remarkable results in the fight against drugs; the island-type three-dimensional security prevention and control system has been continuously improved, and the comprehensive management of social security has been strengthened in all respects. Food and drug supervision has been stepped up, and the work of strengthening the quality of the province has been effective. By strictly implementing the responsibility system for production safety and carrying out comprehensive production safety inspections, the overall situation of production safety has remained stable. The core socialist values are being practiced in depth, and virtues such as self-improvement and bravery are being vigorously promoted. Efforts to publicize and educate on the rule of law, people’s mediation, resettlement and re-education, and community corrections have been stepped up. The mechanism for handling emergencies and the system for disaster prevention and mitigation has been continuously improved, and the whole province has been mobilized urgently, with all the people of the province united as one, to combat the onslaught of “Typhoon Caihong” and the impact of the continuing drought in a powerful, orderly, and effective manner.

5.4.2. Phase II, Spanning from 2016 to 2020, Corresponds to the 13th Five-Year Plan Period

These have been five years of marked improvement in the capacity and level of social governance.
Accelerating the “four-in-one” construction of comprehensive governance centers, social management information platforms, grid-based service management, and diversified settlement of conflicts and disputes, the grassroots social governance system has been continuously improved, and several difficult petition issues have been resolved. Haikou and Qionghai have successfully created national civilized cities. In-depth promotion of the rule of law and the construction of a safe Hainan have significantly increased the people’s sense of security. Upgrading the island-type three-dimensional, intelligent, visualized security and control system, the number of criminal cases filed and the number of public security cases received in the province fell by 34.7 percent and 32.3 percent, and the number of active homicides fell to the lowest since the founding of the province. The Special Struggle Against Gangs and Evil has led to the elimination of 308 gangs involved in gang-related organizations and crimes. The anti-drug war has pushed the drug abuse rate down from 8 per thousand to 2.67 per thousand. There are no major accidents in production safety, and the number of road traffic accidents and fatalities falls by 25.8 percent and 35.1 percent. The food and drug quality and safety situation is generally stable.

5.4.3. Phase III, Spanning from 2021 to 2023, Marks the Beginning of the 14th Five-Year Plan

The urban and rural landscape and level of governance have improved significantly.
A new chapter in coordinated regional development has been opened. The Danzhou-Yangpu integration has been formally implemented, the spatial planning of the Xinying Bay area has been accelerated, and the coordinated regional development strategy for the free-trade port has successfully taken its first step. The provincial-level coordination mechanism for the integration of the two major economic circles in the north and south has been established and improved. The urban and rural environments have been upgraded, and six cities and counties have been created as national health cities (counties). The daily sewage treatment capacity of cities and towns has been increased by 8.7 percent, the coverage rate of domestic sewage treatment facilities in administrative villages has been increased by 14.3 percentage points, the coverage rate of sanitary latrines has reached 98.8 percent, and the rate of harmless treatment of urban and rural domestic garbage has exceeded 95 percent. Additionally, special actions to plant grass and green rural bare land have been carried out, with a completion rate of 95.8%. Special rectification in the areas of land use and territorial spatial planning have been coordinated, with rectification rates of 63.2% and 99.5%, respectively. The introduction of regulations on the disposal of unused land have been promoted, improving the secondary market for construction land. The disposal rate of land granted but not supplied and unused land amounts to 17.7 percent and 35.6 percent, respectively, exceeding the annual target, and the phenomenon of illegally occupying arable land to build houses has been effectively curbed [51,52,53,54].

6. Discussion

6.1. A Discussion on the Overall Sustainable Development Level of Hainan Province from 2015 to 2023

Based on the above, this study addresses the following questions: Since the establishment of the SDGs in 2015, what is the level of sustainable development in Hainan Province as of 2023? What is the level of sustainable development in Hainan Province’s 18 cities and counties in 2023? How can local governments effectively promote sustainable development in Hainan Province?
To answer the first question, the overall sustainable development indicators in Hainan Province have shown an upward trend, reflecting a significant improvement in overall development. Specifically, apart from the governance and protection and sustainable agriculture indicators, which have exhibited significant fluctuations, the four indicators of economic development, social livelihood, resource environment, and consumption emissions have generally shown positive trends and achieved notable progress.
From 2015 to 2023, Hainan Province’s economic strength has been enhanced through progress in four key areas: innovation-driven development, structural optimization, stable growth, and open development. Regarding innovation-driven development, Hainan Province has gradually increased its fiscal investment in science and technology, implementing the Science and Technology Innovation Action Plan. Concerning structural optimization, Hainan Province has promoted supply-side reform and fostered the growth of high-tech industries. In terms of open development, Hainan Province has advanced the construction of a free trade port, expanded industrial openness, and strengthened international cooperation and exchanges. However, the stable growth indicator was significantly impacted by the COVID-19 pandemic, leading to substantial fluctuations. Meanwhile, Hainan Province has taken a series of measures to actively combat the pandemic, thereby stabilizing the economic situation. Since then, economic development has gradually exhibited a stable trend. Nevertheless, due to the influence of the annual GDP growth rate, the indicator value in 2022 was slightly lower than that in 2021.
The continuous improvement in social welfare and people’s livelihoods in Hainan Province can be attributed to advancements in four key areas: education and culture, social security, healthcare, and equalization. From 2015 to 2023, the proportion of national fiscal expenditure on education in Hainan Province steadily increased, as did the average years of education attained by the population. In terms of social security, basic pensions and medical care were effectively guaranteed in Hainan Province during this period, accompanied by an increase in fiscal expenditure on social security and employment. In the healthcare sector, residents’ average life expectancy has increased, government healthcare expenditure has risen, and the healthcare system has been progressively enhanced. Regarding equalization, the poverty incidence rate in Hainan Province decreased annually from 2015 to 2023, and poverty alleviation efforts yielded positive outcomes. Disposable income for both urban and rural residents has grown year on year, and the income distribution system has been gradually refined, thereby improving living standards.
The overall improvement in Hainan Province’s resources and environmental conditions is primarily due to the comprehensive enhancement of land resources and the water environment. Indicators of the atmospheric environment have shown a relatively stable trend with minimal fluctuation. From 2015 to 2023, the forest and wetland coverage rates in Hainan Province increased gradually, while the cultivated land coverage rate decreased gradually. The grassland coverage rate initially increased and then decreased. These changes are closely associated with factors such as demands for economic development, adjustments to land use structures, environmental protection and ecological restoration efforts, and policy guidance. The water environment is significantly influenced by weather conditions. As urbanization levels rise and the number of permanent urban residents grows, water resources are becoming increasingly scarce. In response, Hainan Province has set goals for the utilization and protection of water resources, implementing measures such as promoting water conservation in key areas, optimizing the allocation of water resources, improving water supply infrastructure, and enhancing water quality supervision in order to ensure the rational use of water resources. The proportion of days with good air quality in Hainan Province has consistently remained above 97%, with minimal variation. This is thanks to the province’s effective pollution prevention and control measures, management of industrial and transportation pollution sources, and favorable meteorological conditions.
The remarkable achievements in consumption and emission control are due to the effective reduction in major pollutant emissions, water consumption, greenhouse gas emissions, and land consumption. In order to address land pollution, Hainan Province has introduced a “five-in-one” odor control system and vertical anti-seepage technology at landfill sites. The province has also completed the transportation of garbage out of the province, prevented groundwater pollution, and promoted the closure of landfills in an ecological manner and the utilization of resources. To combat soil acidification and organic matter loss, the “winter southern breeding-summer green manure” rotation model has been widely adopted. To tackle water pollution, the province has prioritized sewage treatment by constructing water purification plants, carrying out pipe network inspections and repairs, and increasing the treatment rate of polluted water bodies in urban and rural areas. The goal is to achieve an integrated urban and rural water supply system by 2025. The “biochar soil improvement + dam interception” method is used to reduce the inflow of nitrogen and phosphorus into bodies of water. To combat air pollution, the province strictly controls “three highs and one low” projects, eliminates outdated production capacities such as solid clay bricks, promotes new energy vehicles, and increases the proportion of non-fossil energy consumption. Dust monitoring has been implemented at construction sites, and the use of prefabricated buildings has been promoted to reduce construction-related emissions. An increase in the index value of industrial hazardous waste generation indicates a rise in emissions that requires further control measures. Hainan Province plans to establish a provincial hazardous waste disposal center incorporating processes such as incineration, physical and chemical treatment, stabilization/solidification, safe landfilling, and resource utilization to treat hazardous waste from industries such as petrochemicals, pharmaceuticals, and automotive manufacturing. Overall, energy consumption indicators show an upward trend with slight declines in some years, suggesting that the Hainan provincial government has optimized energy utilization and reduced energy consumption per unit of GDP.
The effectiveness of governance and protection needs to be improved further. There are six secondary indicators under this umbrella. The overall trends of the wastewater utilization rate, solid waste disposal, and garbage disposal are positive. This shows that the urban sewage disposal rate in Hainan Province has steadily increased from 2015 to 2023, the comprehensive utilization rate of general industrial solid waste has continuously improved, and the rate of harmless treatment of domestic waste has remained at 100% for seven consecutive years. Conversely, the governance investment indicator exhibits volatility, reflecting fluctuations in government investment in governance due to policy changes across different years. To sustain high-quality environmental development, the Hainan provincial government should enhance its investment in environmental governance. The hazardous waste disposal indicator demonstrates significant volatility. The main reason for this is that, between 2018 and 2019, the volume of hazardous waste processed exceeded the volume generated, resulting in relatively high indicator values during this period. However, this does not imply poor performance in the disposal of hazardous waste in Hainan Province. According to the collected data, the hazardous waste disposal rate in Hainan Province has consistently exceeded 97% from 2015 to 2023. The indicator value for reducing greenhouse gas emissions has shown a downward trend from 2021 to 2023. This is because the annual decline rate of energy intensity was relatively low during this period, and energy consumption per unit of GDP was slightly higher in 2023 than in 2022.
The level of sustainable development in agriculture in Hainan Province requires improvement. The reduction in the per capita area of tropical agricultural land in Hainan Province is due to intensified competition for land resources, population growth, constraints imposed by natural conditions, and policy adjustments. The decline in the total value index of agriculture in Hainan Province is the result of multiple factors, including natural risks, policy adjustments, market fluctuations, and technological lags. In the future, it will be necessary to promote a shift in agriculture from “scale expansion” to “quality and efficiency” through technological innovation, industrial chain integration, and policy coordination in order to achieve stable production and income growth and ensure sustainable development. Hainan Island’s climate is characterized by long summers without winters, heavy rainfall and high temperatures, and frequent typhoons. This represents a natural advantage for tropical agriculture and poses challenges in the form of natural disasters and climate change. Key strategies for Hainan to achieve sustainable agricultural development include scientifically addressing risks such as typhoons and droughts, as well as the rational utilization of light, heat, and water resources.
This research is significant because it evaluates the sustainable development level of Hainan Province from 2015 to 2023 based on relevant indicators. This allows for a thorough analysis of the province’s strengths and weaknesses in terms of the economy, society, resources, the environment, governance, and agriculture. The identified strengths should be further promoted and consolidated. The weaknesses must be systematically summarized and reflected upon, and effective countermeasures must be sought to enhance the province’s overall sustainable development.
The sustainable development indicators of Hainan Province, as evaluated in this study, align with the United Nations SDGs across three core dimensions: economic, social, and environmental sustainability. Economic indicators correspond to SDGs 2, 8, and 9; social indicators align with SDGs 1, 3, 4, and 10; and environmental indicators are consistent with SDGs 6, 7, 13, and 15. The study emphasizes the pivotal role of local governments in advancing sustainable development, particularly in alignment with SDG 17. In summary, Hainan Province’s sustainable development trend, as described in this study, is grounded in a comprehensive indicator system and backed by robust data analysis. This analysis takes into account the interdependencies among six key areas: the economy, society, resources, the environment, governance, and agriculture. Thus, it exemplifies a genuinely sustainable trajectory.

6.2. A Discussion on the Sustainable Development Levels of the 18 Cities and Counties in Hainan Province in 2023

Regarding the second question, based on the comprehensive scoring results, the sustainable development levels of the 18 counties and cities in Hainan Province in 2023 show a step-like distribution with significant differences. According to the cluster analysis map, the sustainable development levels of the 18 counties and cities in Hainan Province in 2023 can be classified into three groups: the Pioneer Development Areas, the Stable Development Areas, and the General Development Areas.
The clustering analysis results reflect the current development situation in Hainan Province, corresponding to the new pattern of coordinated regional development known as the “Three Poles, One Belt, and One Zone”. The pioneer development areas centered on Haikou and Sanya form the “Haikou Economic Circle” and the “Sanya Economic Circle”. The “Haikou Economic Circle” should leverage Haikou’s leading role, integrate with surrounding counties and cities, and strive to establish a new, comprehensive competitive advantage for “Greater Haikou”. It should also construct the core area of the China-featured free trade port. Meanwhile, the “Sanya Economic Circle” should drive the development of surrounding counties and cities, actively fostering and developing future industries such as South China agricultural breeding, deep sea exploration, and next-generation information technology. It should also position itself as a scientific and technological innovation hub and an international tourist destination for the Hainan Free Trade Port.
Most of the stable development areas are located near Haikou, Sanya, and Danzhou. Specifically, Wenchang is near Haikou; Wuzhishan and Baoting are close to Sanya; and Baisha and Qiongzhong are adjacent to Danzhou. The “Danzhou-Yangpu Economic Circle” in the stable development area aims to accelerate integrated and coordinated development by leveraging the development potential of historical and cultural cities. This will be achieved by combining the policy, location, and industrial advantages of Yangpu with the urban functions and hinterland resources of Danzhou. The ultimate goal is to create a demonstration and pilot zone for the integrated development of the industry and city within the Hainan Free Trade Port.
The third category comprises general development areas, encompassing cities in coastal regions, central mountainous areas, and remote western regions. The convenient transportation links in coastal areas mean that the focus should be on promoting the coordinated development of coastal towns, with the aim of creating a world-class coastal urban belt led by central cities and featuring harmonious development among large, medium, and small towns. Central mountainous areas serve as ecological conservation zones and will prioritize the construction of the Hainan Tropical Rainforest National Park. This will be the starting point for the vigorous development of the tropical rainforest tourism industry, fostering a new development paradigm that emphasizes interaction between mountains and seas and complementarity between blue and green economies. In the remote western regions of Hainan Province, sustainable development should be based on ecological restoration, with technological innovation and industrial integration as the main drivers. A balance between ecological protection and economic development can be achieved through policy guidance, infrastructure upgrades, and community participation. Priorities include integrated desertification control, clean energy development, upgrading tropical agriculture for greater efficiency, expanding cultural tourism and initiatives for the low-altitude economy, and investing in digital infrastructure and talent cultivation.
This research question is significant because analyzing the comprehensive sustainable development levels of the 18 cities and counties in Hainan Province in 2023 will provide insights into their overall development levels. Leveraging the development levels and characteristics of different cities allows us to utilize their geographical location advantages and policy incentives to their fullest potential. Driven by the “Haikou Economic Circle”, the “Sanya Economic Circle”, and the “Danzhou-Yangpu Economic Circle”, regional coordinated development can be achieved, providing a replicable “Hainan Model” for other similar regions to follow.
Furthermore, this study evaluates the level of sustainable development in 18 cities and counties in Hainan Province in 2023. Given the varying development speeds and opportunities in these areas, their rankings may differ in other years.

6.3. A Discussion on the Effective Contributions of the Hainan Provincial Government in Promoting Regional Sustainability

In response to the third question, the effective contributions of the Hainan provincial government to the promotion of local sustainable development are analyzed using a combination of thematic and chronological approaches. The chronological narrative is divided into three periods: 2015, 2016–2020, and 2021–2023. These correspond to the closing year of China’s 12th Five-Year Plan, the period of its 13th Five-Year Plan, and the opening years of its 14th Five-Year Plan, respectively. This approach aligns with China’s development context and enables more systematic comparisons to be made. Thematic discussions focus on four key areas: the Hainan provincial government’s role in economic, social, ecological, and governance development. Economic development is explored through topics such as innovation-driven growth, structural optimization, stable economic growth, and open development strategies. Social and people’s livelihood development is examined from the following perspectives: education and culture, social security, health and wellness, and equalization of public services. Due to the fragmented nature of ecological environment and social governance themes, a comprehensive, integrated discussion approach is adopted. This discussion format aligns with the evaluation index system for Hainan’s sustainable development level mentioned earlier, demonstrating the effectiveness of the proactive measures taken by the Hainan provincial government in promoting regional sustainable development.
This research question is significant because it analyzes the proactive measures implemented by the Hainan provincial government to promote economic development, social welfare, ecological environment preservation, and social governance. These measures are based on relevant policies and government work reports from 2015 to 2023. Furthermore, the research evaluates the contributions of local governments to regional sustainable development from the perspective of relevant stakeholders.
Local governments play a pivotal role in promoting regional sustainable development. However, they encounter challenges. These include administrative barriers, fragmented policies, and the need to balance ecological protection with economic growth. In order to achieve a harmonious interaction between “ecology, production, and life”, local governments should strengthen regional collaboration mechanisms, optimize interest distribution systems, leverage technological empowerment to enhance governance capabilities, and refine ecological-economic cycles. Hainan Province has demonstrated two best practice examples: the construction of a clean energy island through the expansion of clean energy capacity and the reduction in reliance on coal, and the modernization of tropical agriculture through innovative models such as “shared farms” and crop rotation systems. This study systematically evaluates Hainan’s contributions to regional sustainable development and proposes targeted improvements to address existing deficiencies.

6.4. Limitations of the Study

This study uses the entropy value method to evaluate the level of sustainable development in Hainan Province. This method is characterized by its relative objectivity, its ability to be applied to complex indicator systems, and the simplicity and efficiency of the calculation process. However, it relies entirely on data distribution to calculate weights, which may result in the actual importance of indicators being ignored. If possible, it would be better to combine this method with expert scoring to determine the distribution of indicator weights. Similarly, the study is limited by the difficulty of obtaining sample data for a small number of indicators. For example, the contribution rate of scientific and technological progress—the share of economic growth contributed by technological progress in the broad sense—is difficult to obtain. Similarly, data on the average life expectancy of the population, the Gini coefficient (a measure of the degree of equilibrium in the distribution of income based on the Lorenz curve), and the biodiversity index (a measure of the number and homogeneity of species in a community) are difficult to obtain. Consequently, this study has focused on collecting data for analogous indicators where possible.
This study highlights the active role played by the Hainan provincial government in promoting sustainable development. At the same time, the study recognizes that various stakeholders, such as enterprises, social organizations, and residents, have a key role to play in promoting sustainable development in the region. Enterprises can stimulate new economic growth through the development of green industries. Non-governmental organizations (NGOs) can promote environmental and social responsibility by raising public awareness and monitoring behaviors. And residents can contribute through practical actions such as waste separation and energy conservation [55]. Given the focus of the study, this research does not provide an exhaustive account of the roles of other stakeholders but suggests that future research could further explore these aspects.
This study primarily examines the level of sustainable development in Hainan Province from 2015 to 2023, as well as the status of sustainable development in areas such as the economy, society, people’s livelihoods, resources, the environment, and agriculture. However, government action has not always been effective, and regional development has also had unsustainable aspects. Due to the limited scope of the research questions and the available space, this study primarily examines the sustainable development status of the Hainan provincial government in areas such as the economy, society, resources, the environment, and governance. Future research could examine specific environmental, agricultural, sociological, cultural, educational, health, and economic factors to assess the value of sustainable and unsustainable development.

7. Conclusions and Recommendations

7.1. Conclusions

From 2015 to 2023, the overall indicator value in Hainan Province showed an upward trend. In particular, apart from the governance and protection indicators and the sustainable agriculture indicators, which displayed significant fluctuations, the four indicators of economic development, social welfare, the resource environment, and consumption emissions demonstrated a positive trend, achieving notable progress. Hainan Province’s economic strength has improved significantly, people’s well-being has increased, the state of the environment has improved, and consumption emissions have been effectively controlled. However, the effectiveness of governance and protection, as well as the sustainability level of agriculture, require further enhancement.
In 2023, the sustainable development level of the 18 cities and counties in Hainan Province exhibits a step-like distribution with significant disparities. Cluster analysis reveals a clear agglomeration trend, categorizing the regions into three groups: the Pioneer Development Area, the Stable Development Area, and the General Development Area. Specifically, the pioneer development area comprises Haikou, Chengmai, and Sanya. The stable development area includes Wuzhishan, Danzhou, Baisha, Baoting, Qiongzhong, and Wenchang. The general development area encompasses Changjiang, Lingao, Wanning, Qionghai, Ding’an, Dongfang, Tunchang, Lingshui, and Ledong. These results closely align with Hainan Province’s actual development situation and correspond to the new pattern of regional coordinated development in Hainan Province, namely, the “three poles, one belt, and one area”.
From 2015 to 2023—encompassing the final year of the 12th Five-Year Plan, the entirety of the 13th Five-Year Plan, and the early years of the 14th Five-Year Plan—the Hainan provincial government has played a key role in promoting local economic development, social welfare, ecological preservation, and social governance. Specifically, it has facilitated economic growth through innovation-driven strategies, structural optimization, stable growth policies, and open development initiatives. It has enhanced social welfare in areas such as education and culture, social security systems, healthcare services, and the equalization of public resources. The provincial government has reinforced ecological protection by improving land resource management, conserving water quality, and controlling air pollution. Furthermore, it has strengthened social governance by fostering a positive social environment, effectively managing diverse social groups, encouraging broad social participation, and implementing collaborative governance mechanisms.

7.2. Recommendations

Based on the conclusions, it can be seen that there are deficiencies in governance protection and sustainable agriculture in Hainan Province. Taking into account the specific situation of Hainan Province, we explore specific measures to promote governance protection and sustainable agriculture in Hainan Province.
Regarding governance and protection. Firstly, ecological protection and restoration should be strengthened to build a solid ecological security barrier. Additionally, we will expand the scope of restoration of mangrove forests, coral reefs, and other typical ecosystems, promote the experience of restoring mangrove wetlands in Lingshui, and explore the mechanism of “mangrove forest carbon trading”, combining ecological restoration with the carbon economy to form a sustainable financial cycle. Secondly, we will optimize marine resource management to ensure that sustainable development will be implemented using the strategy of “intelligent ocean”, develop deep-sea science and technology and the intelligent equipment industry relying on the National Comprehensive Marine Experimental Ground, and promote the transformation of the marine economy to high value-added. Thirdly, we will promote the green transformation of industries and cultivating new productivity. Furthermore, we will accelerate the replacement of clean energy, strive to reach 85 percent of installed clean energy capacity by 2025, promote major projects such as deep-sea wind power and photovoltaic power in the Orient, and create a benchmark for a new type of power system.
Regarding sustainable agricultural development. Firstly, we will strengthen policy guidance and financial support to stimulate agricultural innovation, implement the 2025 New Deal on Agricultural Scholarships and Subsidies, and provide precise support for the upgrading of the modern seed industry, the development of the entire chain of tropical agriculture, and the replanting of abandoned land. Secondly, we will deepen scientific and technological empowerment, and promote the intelligent and green transformation of agriculture. The application of technologies such as drone drug application, intelligent irrigation systems, and Internet of Things (IoT) monitoring reduces labor costs and improves the efficiency of resource use. The “Southern Breeding Internet of Things Display Platform” in Sanya Yazhou Bay Science and Technology City has realized real-time monitoring of the farmland environment and early warning of pests and diseases, which can be extended to the whole province. Thirdly, we will optimize the industrial structure and extend the value chain of tropical agriculture. Relying on the Haikou Tanxian, Dazhipo, and other agricultural product processing industrial parks, we will develop the deep processing of tropical fruits and vegetables, cold-chain logistics, and other businesses, and make use of the Free Trade Port processing value-added domestic sales tariff-free policy to expand the international market. Additionally, we will develop shared farms, flower theme parks, and other businesses, and promote the integration of agriculture with tourism and recreation industries.

Author Contributions

Conceptualization, X.X.; supervision, X.X.; writing—original draft, H.Y.; writing—review and editing, H.Y. All authors have read and agreed to the published version of the manuscript.

Funding

Project “Research on Security Governance System for Digital Government Construction” of Major Project of the National Social Science Fund: 20ZDA038; Project “Research on ‘Artificial Intelligence + Case’ Practice Teaching System for Rural Digital Governance Talent Cultivation” of Key Projects for Teaching Reform Research in Ordinary Higher Education Institutions of Hunan Province: HNJG-2022-0110; Hunan Provincial Social Science Fund Project: Research on the Construction Mechanism of an Emergency Governance Community Based on the Symbiotic Relationship Between the Digital and Physical Worlds: 23JD022.

Institutional Review Board Statement

Not applicable.

Informed Consent Statement

Not applicable.

Data Availability Statement

All data are available in the manuscript.

Conflicts of Interest

The authors declare no conflicts of interest.

References

  1. Stoddart, M.C.J.; Yang, Y.; Atlin, C. Regionalizing the sustainable development goals: Interpretations of priorities and key actors for creating sustainable island futures. Ecol. Soc. 2023, 28, 4. [Google Scholar] [CrossRef]
  2. Gianluca, Z.; Andreea, M.-P.; Larisa Loredana, D. European Sustainable Development Goals Reporting: A Qualitative Comparative Analysis on Cultural Impact. Econ. Comput. Econ. Cybern. Stud. 2024, 58, 258–275. [Google Scholar] [CrossRef]
  3. Halim, M.A.; Moudud-Ul-Huq, S. Green economic growth in BRIC and CIVETS countries: The effects of trade openness and sustainable development goals. Heliyon 2024, 10, e30148. [Google Scholar] [CrossRef]
  4. Masuda, H.; Okitasari, M.; Morita, K.; Katramiz, T.; Shimizu, H.; Kawakubo, S.; Kataoka, Y. SDGs mainstreaming at the local level: Case studies from Japan. Sustain. Sci. 2021, 16, 1539–1562. [Google Scholar] [CrossRef]
  5. Koh, J.; Huh, T.; Ye, M. Developing an index of sustainable development goals for local governments: The case of Gyeonggi province in korea. Ecosyst. Health Sustain. 2021, 7, 1980437. [Google Scholar] [CrossRef]
  6. Masuda, H.; Kawakubo, S.; Okitasari, M.; Morita, K. Exploring the role of local governments as intermediaries to facilitate partnerships for the Sustainable Development Goals. Sustain. Cities Soc. 2022, 82, 103883. [Google Scholar] [CrossRef]
  7. Płonka, A.; Dacko, M.; Satoła, Ł.; Dacko, A. The Idea of Sustainable Development and the Possibilities of Its Interpretation and Implementation. Energies 2022, 15, 5394. [Google Scholar] [CrossRef]
  8. Uquillas Granizo, G.G.; Mostacero, S.J.; Puente Riofrío, M.I. Exploring the Competencies, Phases and Dimensions of Municipal Administrative Management towards Sustainability: A Systematic Review. Sustainability 2024, 16, 5991. [Google Scholar] [CrossRef]
  9. Leavesley, A.; Trundle, A.; Oke, C. Cities and the SDGs: Realities and possibilities of local engagement in global frameworks. Ambio 2022, 51, 1416–1432. [Google Scholar] [CrossRef]
  10. World Commission on Environment and Development. Our Common Future; Oxford University Press: Oxford, UK, 1987. [Google Scholar]
  11. Xinzhang, S. Review and Prospect of the UN Efforts for Sustainable Development. Chin. J. Popul. Resour. Environ. 2012, 10, 31–38. [Google Scholar] [CrossRef]
  12. Shi, L.; Han, L.; Yang, F.; Gao, L. The Evolution of Sustainable Development Theory: Types, Goals, and Research Prospects. Sustainability 2019, 11, 7158. [Google Scholar] [CrossRef]
  13. Fang, X.; Zhou, B.; Tu, X.; Ma, Q.; Wu, J. What Kind of a Science is Sustainability Science? An Evidence-Based Reexamination. Sustainability 2018, 10, 1478. [Google Scholar] [CrossRef]
  14. United Nations. Transforming Our World: The 2030 Agenda for Sustainable Development; United Nations: New York, NY, USA, 2015; ISBN 9780826190123. [Google Scholar]
  15. Tanguay, G.A.; Rajaonson, J.; Lefebvre, J.-F.; Lanoie, P. Measuring the sustainability of cities: An analysis of the use of local indicators. Ecol. Indic. 2010, 10, 407–418. [Google Scholar] [CrossRef]
  16. Mori, K.; Christodoulou, A. Review of sustainability indices and indicators: Towards a new City Sustainability Index (CSI). Environ. Impact Assess. Rev. 2012, 32, 94–106. [Google Scholar] [CrossRef]
  17. ICLEI—Local Governments for Sustainability. ICLEI—Local Governments for Sustainability: ICLEI—Brochure; ICLEI: Bonn, Germany, 2016; p. 4. [Google Scholar]
  18. Nováček, P.; Mederly, P. How to Measure Progress Towards Quality and Sustainability of Life? Ekológia 2015, 34, 7–18. [Google Scholar] [CrossRef]
  19. Braulio-Gonzalo, M.; Bovea, M.D.; Ruá, M.J. Sustainability on the urban scale: Proposal of a structure of indicators for the Spanish context. Environ. Impact Assess. Rev. 2015, 53, 16–30. [Google Scholar] [CrossRef]
  20. Dahl, A.L. Contributions to the evolving theory and practice of indicators of sustainability. In Routledge Handbook of Sustainability Indicators; Bell, S., Morse, S., Eds.; Routledge: London, UK, 2018; pp. 42–58. [Google Scholar]
  21. Zimmermann, F. Nachhaltigkeit wofür? In Von Chancen und Herausforderungen für Eine Nachhaltige Zukunft; Springer: Berlin, Germany, 2016; p. 288. [Google Scholar]
  22. Michalina, D.; Mederly, P.; Diefenbacher, H.; Held, B. Sustainable Urban Development: A Review of Urban Sustainability Indicator Frameworks. Sustainability 2021, 13, 9348. [Google Scholar] [CrossRef]
  23. Patole, M. Localization of SDGs through Disaggregation of KPIs. Economies 2018, 6, 15. [Google Scholar] [CrossRef]
  24. Salvador, M.; Sancho, D. The Role of Local Government in the Drive for Sustainable Development Public Policies. An Analytical Framework Based on Institutional Capacities. Sustainability 2021, 13, 5978. [Google Scholar] [CrossRef]
  25. Spangenberg, J.H. Indicators for sustainable development. In Routledge International Handbook of Sustainable Development; Redclift, M., Springett, D., Eds.; Routledge: London, UK, 2015; pp. 308–322. [Google Scholar]
  26. Cohen, M. A Systematic Review of Urban Sustainability Assessment Literature. Sustainability 2017, 9, 2048. [Google Scholar] [CrossRef]
  27. China Centre for International Economic Exchanges; Columbia University Earth Institute; Philips (China) Investment Co., Ltd.; Dadao Climate Change Response Promotion Centre. Evaluation Report on the Sustainable Development of China (2023), 1st ed.; Social Science Academic Press: Beijing, China, 2023; pp. 39–41. [Google Scholar]
  28. Ye, H.; Wang, H.; Nie, C.; Wang, J.; Huang, W.; Teng, L.; Wu, M. Measurement Indicators and an Evaluation Approach for Assessing the Sustainable Development Capacity of Tropical Agriculture: A Case Study for Hainan Province, China. Sustainability 2023, 15, 8778. [Google Scholar] [CrossRef]
  29. The People’s Government of Hainan Province. Overview of Hainan. Available online: https://www.hainan.gov.cn/hainan/hngl/201809/02b6b908146c4ce89c0dbd1fad7720a6.shtml?ddtab=true (accessed on 10 February 2025).
  30. The People’s Government of Hainan Province. Climatic Situation. Available online: https://www.hainan.gov.cn/hainan/qhqk/201701/f54b1ce75d1e4aae9103feefcb7bf026.shtml?ddtab=true (accessed on 10 February 2025).
  31. The People’s Government of Hainan Province. Topography and Geomorphology. Available online: https://www.hainan.gov.cn/hainan/dxdm/201701/1e8ee90b981f4ff4818fec2bab95c472.shtml?ddtab=true (accessed on 10 February 2025).
  32. The People’s Government of Hainan Province. On Behalf of the Members of the Heated Discussion of the “Three Poles, One Belt, One Region”: The Direction of the New Highlights Is Clearer. Available online: https://www.hainan.gov.cn/hainan/5309/202501/7bddf278f5774439b6ac61ef2d5c37d8.shtml (accessed on 10 February 2025).
  33. National Bureau of Statistics. China Statistical Yearbook (2016–2024); China Statistical Press: Beijing, China, 2024. Available online: https://www.stats.gov.cn/sj/ndsj/ (accessed on 27 April 2025).
  34. Hainan Provincial Bureau of Statistics. Hainan Statistical Yearbook (2016–2024); China Statistical Press: Beijing, China, 2024. Available online: https://stats.hainan.gov.cn/tjj/tjsu/ndsj/ (accessed on 27 April 2025).
  35. Department of Social, Science and Technology, and Cultural Statistics, National Bureau of Statistics. China Statistical Yearbook on Science and Technology (2016–2024); China Statistical Press: Beijing, China, 2024; Available online: https://data.cnki.net/yearBook/single?id=N2025020147&pinyinCode=YBVCX (accessed on 27 April 2025).
  36. Ministry of Ecology and Environment, National Bureau of Statistics. China Statistical Yearbook on Environment (2016–2024); China Statistical Press: Beijing, China, 2024; Available online: https://data.cnki.net/yearBook/single?id=N2024050561&pinyinCode=YHJSD (accessed on 27 April 2025).
  37. Department of Energy Statistics, National Bureau of Statistics. China Energy Statistical Yearbook (2016–2024); China Statistical Press: Beijing, China, 2024; Available online: https://data.cnki.net/yearBook/single?id=N2024050932&pinyinCode=YCXME (accessed on 27 April 2025).
  38. Department of Ecology and Environment of Hainan Province. Hainan Ecological and Environmental Bulletin (2015–2023). Available online: https://hnsthb.hainan.gov.cn/hjzl/hjzlxx/hjzkgb_51008/ (accessed on 27 April 2025).
  39. Lin, W.; Hong, C.; Zhou, Y. Multi-Scale Evaluation of Suzhou City’s Sustainable Development Level Based on the Sustainable Development Goals Framework. Sustainability 2020, 12, 976. [Google Scholar] [CrossRef]
  40. Wang, T.; Wang, D.; Zeng, Z. Research on the Construction and Measurement of Digital Governance Level System of County Rural Areas in China—Empirical Analysis Based on Entropy Weight TOPSIS Model. Sustainability 2024, 16, 4374. [Google Scholar] [CrossRef]
  41. Kanzari, E.; Fazio, G.; Fricano, S. Analysing the energy landscape in Africa using cluster analysis: Drivers of renewable energy development. Energy Policy 2024, 195, 114366. [Google Scholar] [CrossRef]
  42. Zamawe, F.C. The Implication of Using NVivo Software in Qualitative Data Analysis: Evidence-Based Reflections. Malawi Med. J. 2015, 27, 13–15. [Google Scholar] [CrossRef] [PubMed]
  43. Yang, J.; Huang, G.; Xue, D. The Changing Roles of the Local Government in Environmental Governance in Guangzhou, China. Pol. J. Environ. Stud. 2024, 33, 1401–1412. [Google Scholar] [CrossRef]
  44. Petushkova, V.V. China’s Experience and Prospects for Sustainable Development. Her. Russ. Acad. Sci. 2022, 92, 207–215. [Google Scholar] [CrossRef]
  45. Wang, B.; Liu, F.; Yang, S. Green economic development under the fiscal decentralization system: Evidence from China. Front. Environ. Sci. 2022, 10, 955121. [Google Scholar] [CrossRef]
  46. Meng, X.; Ding, T.; Wang, H. Incentives for local government expenditures on people’s livelihood: The role of high-speed rail. Socio-Econ. Plan. Sci. 2023, 89, 101700. [Google Scholar] [CrossRef]
  47. Pu, G.; Chang-Richards, A.Y. Livelihood recovery for sustainable development: A study of the Lushan earthquake. Int. J. Disaster Risk Reduct. 2022, 82, 103317. [Google Scholar] [CrossRef]
  48. Su, F.; Song, N.; Ma, N.; Sultanaliev, A.; Ma, J.; Xue, B.; Fahad, S. An Assessment of Poverty Alleviation Measures and Sustainable Livelihood Capability of Farm Households in Rural China: A Sustainable Livelihood Approach. Agriculture 2021, 11, 1230. [Google Scholar] [CrossRef]
  49. Liu, H.; Zhou, R.; Yao, P.; Zhang, J. Assessing Chinese governance low-carbon economic peer effects in local government and under sustainable environmental regulation. Environ. Sci. Pollut. Res. 2023, 30, 61304–61323. [Google Scholar] [CrossRef] [PubMed]
  50. Du, J.; Zhu, X.; Li, X.; Ünal, E.; Longhurst, P. Explaining the Green Development Behavior of Local Governments for Sustainable Development: Evidence from China. Behav. Sci. 2023, 13, 813. [Google Scholar] [CrossRef] [PubMed]
  51. The People’ Government of Hainan Province. Work Report of Hainan Provincial People’s Government in 2016. Available online: https://www.hainan.gov.cn/hainan/szfgzbg/201602/d9aecd65483e4b7b978dd14d08b11137.shtml?ddtab=true (accessed on 12 March 2025).
  52. The People’ Government of Hainan Province. Work Report of Hainan Provincial People’s Government in 2021. Available online: https://www.hainan.gov.cn/hainan/szfgzbg/202102/40b0485136d642a7b9c5454bffe85fdb.shtml?ddtab=true (accessed on 12 March 2025).
  53. The People’ Government of Hainan Province. Work Report of Hainan Provincial People’s Government in 2022. Available online: https://www.hainan.gov.cn/hainan/szfgzbg/202201/6da8f2ca08ce440792389398d9a78459.shtml?ddtab=true (accessed on 12 March 2025).
  54. The People’ Government of Hainan Province. Work Report of Hainan Provincial People’s Government in 2023. Available online: https://www.hainan.gov.cn/hainan/szfgzbg/202301/d0465d7368334abfa40b7db6b982720c.shtml?ddtab=true (accessed on 12 March 2025).
  55. Bulmer, E.; del Prado-Higuera, C. Revitalizing the Global Alliances for Sustainable Development: Analyzing the Viability of Sustainable Development Goal 17—A Multi-Actor Governance Approach. Sustainability 2021, 13, 4247. [Google Scholar] [CrossRef]
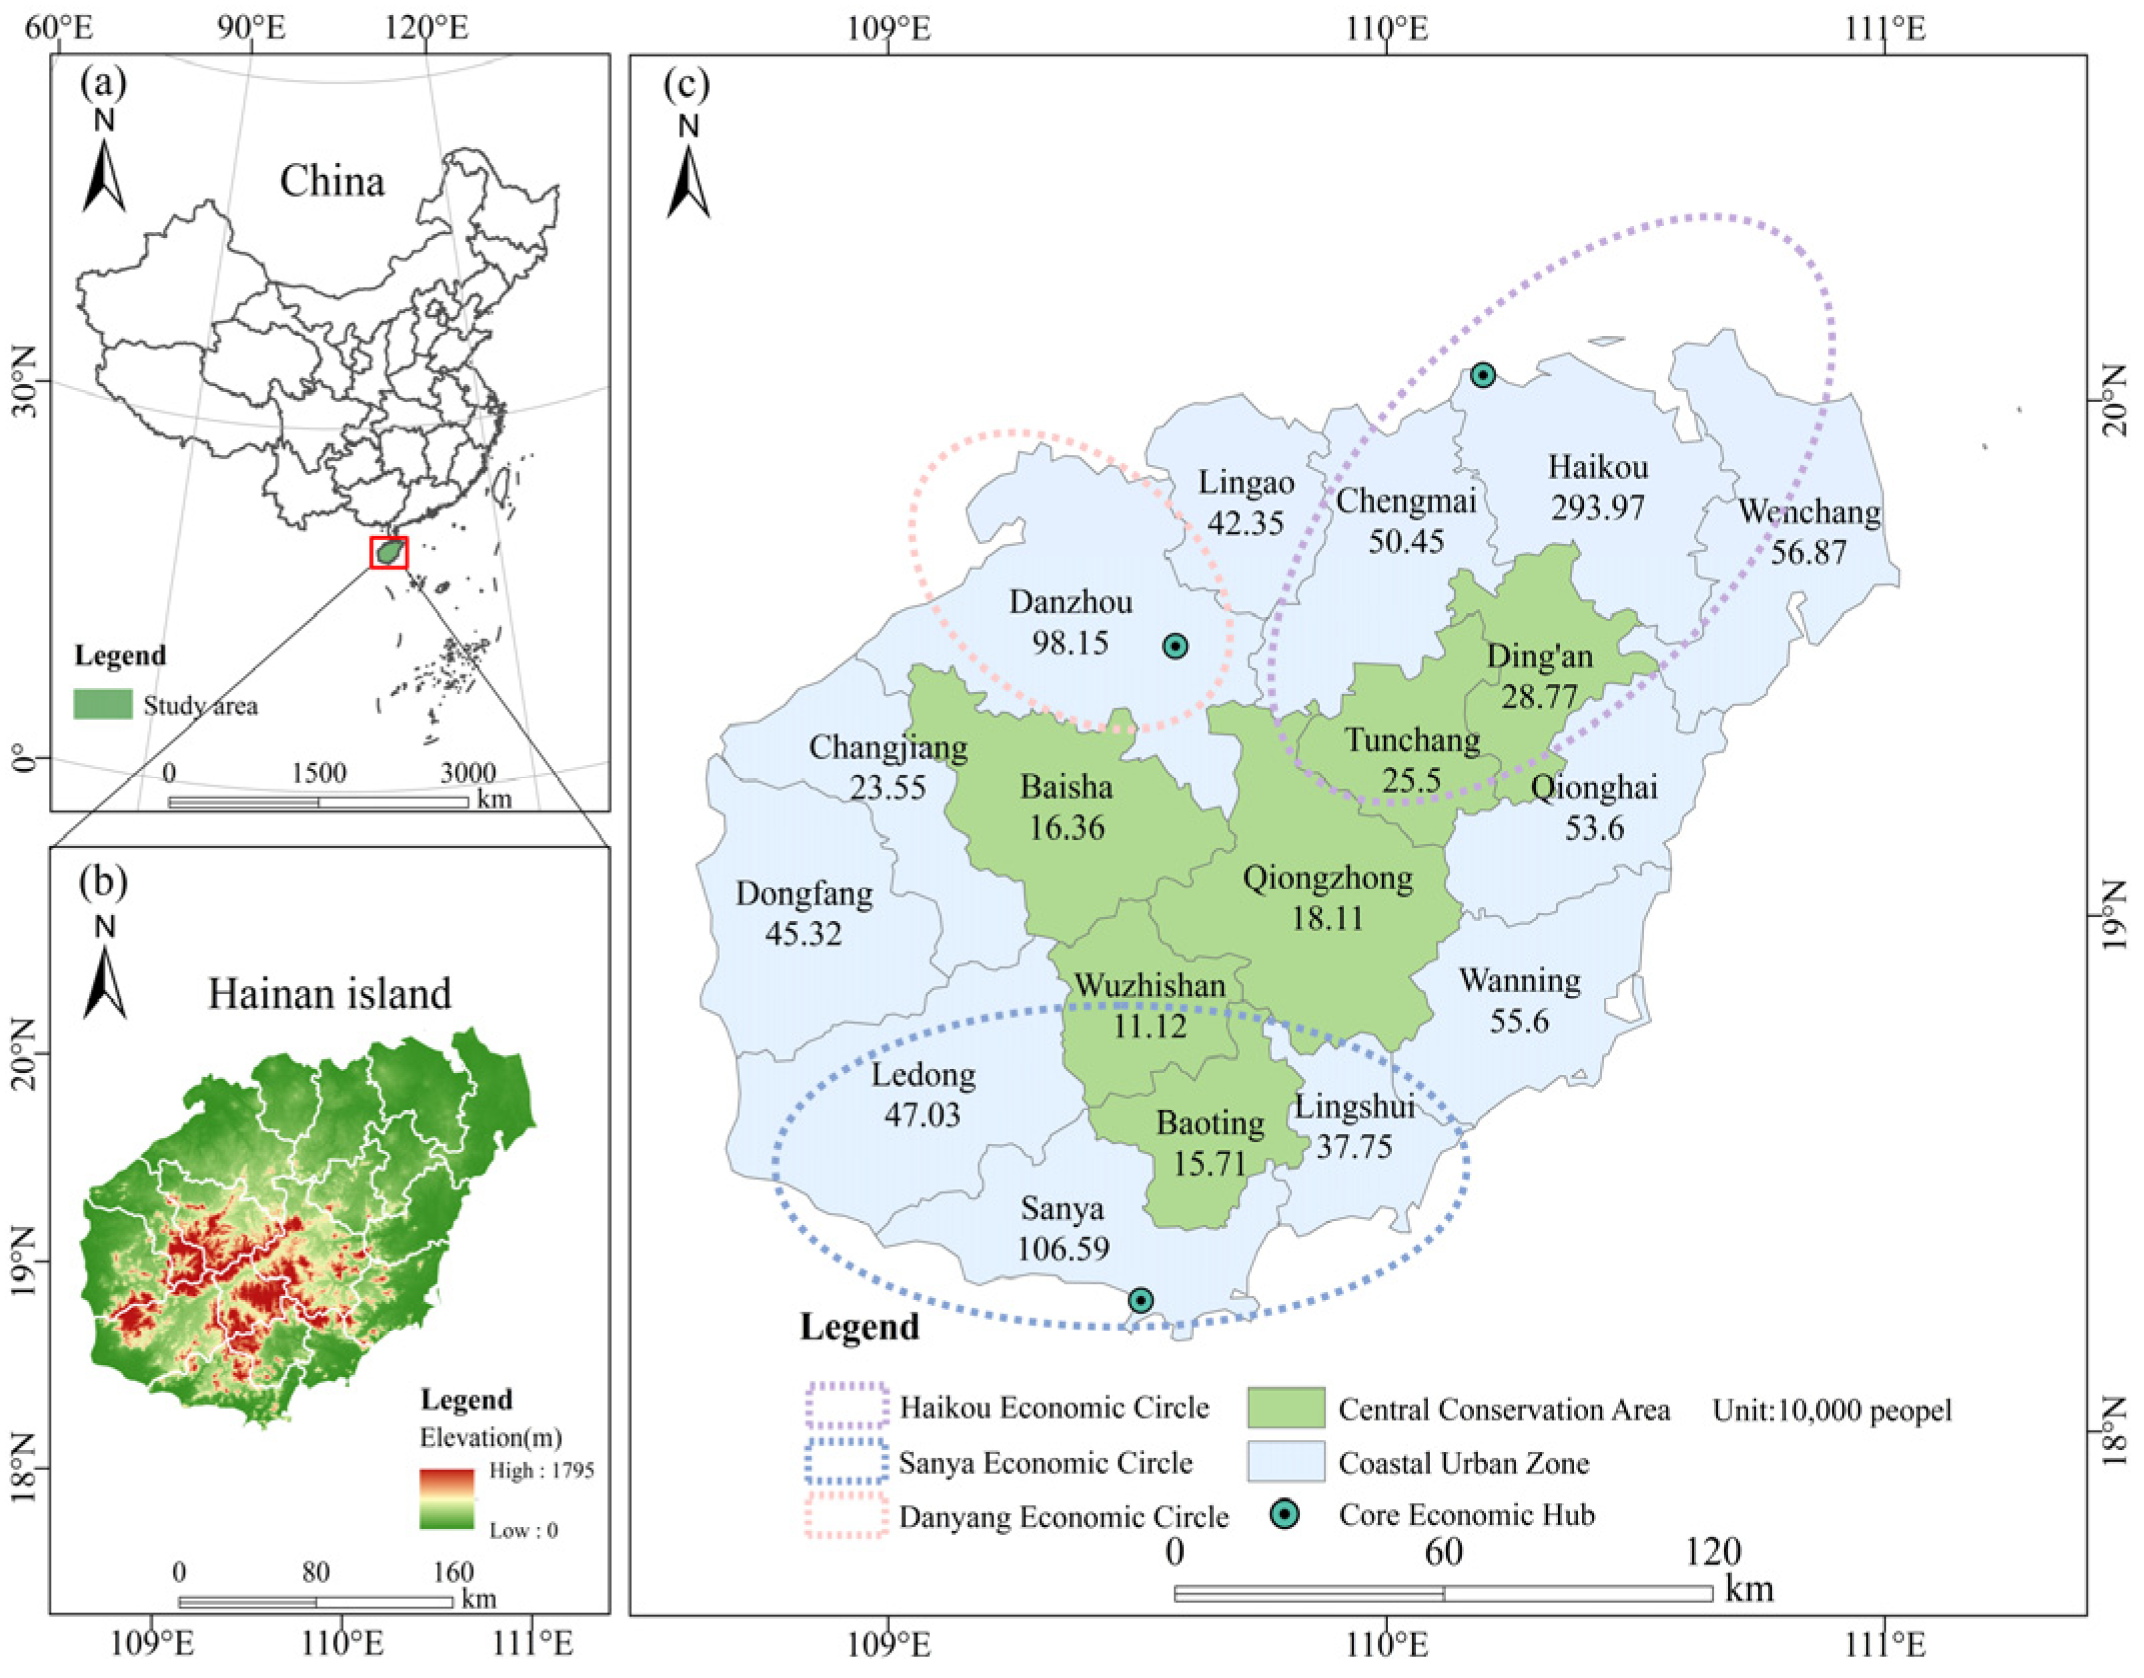
Figure 1. (a) Geographical location of the study area; (b) Altitude of the study area; (c) Current status and urban positioning of the study area (Note: Based on the Standard Map No. GS (2024)0650 on the Standard Map Service website of the Ministry of Natural Resources with no modifications to the base map boundaries).
Sustainability 17 05173 g001
Figure 2. (a) Changes in total indicator values from 2015 to 2023. (b) Changes in the five first-tier indicators from 2015 to 2023.
Sustainability 17 05173 g002
Figure 3. (a) Changes in the first-level indicator “economic development” from 2015 to 2023. (b) Changes in secondary indicators under “economic development” from 2015 to 2023.
Sustainability 17 05173 g003
Figure 4. (a) Changes in the first-level indicators for “social livelihoods” from 2015 to 2023. (b) Changes in secondary indicators under “social livelihoods” from 2015 to 2023.
Sustainability 17 05173 g004
Figure 5. (a) Changes in the first-tier indicators for “resources and environment” from 2015 to 2023. (b) Changes in secondary indicators under “resources and environment” from 2015 to 2023.
Sustainability 17 05173 g005
Figure 6. (a) Changes in the primary indicator “emissions and consumption” from 2015 to 2023. (b) Changes in secondary indicators under “consumption and emission” from 2015 to 2023.
Sustainability 17 05173 g006
Figure 7. (a) Changes in the first-level indicators of “governance and protection” from 2015 to 2023. (b) Changes in secondary indicators under “governance and protection” from 2015 to 2023.
Sustainability 17 05173 g007
Figure 8. (a) The changes in the first-level indicator of “sustainable agriculture” from 2015 to 2023. (b) Changes in secondary indicators under “sustainable agriculture” from 2015 to 2023.
Sustainability 17 05173 g008
Figure 9. Comprehensive evaluation results of the sustainable development level of 18 cities and counties in Hainan Province.
Sustainability 17 05173 g009
Figure 10. Clustering spectrum of 18 cities and counties in Hainan Province.
Sustainability 17 05173 g010
Figure 11. Results of cluster analysis of 18 cities and counties in Hainan Province in 2023.
Sustainability 17 05173 g011
Table 1. Indicators of sustainable development in Hainan Province and their weights.
Primary IndexSecondary IndexTertiary IndexIndex TypeWeightIndicator Source
Economic development (A)Innovation drive (A1)The proportion of R&D expenditure in GDP (a1)+0.0305China Statistical Yearbook on Science and Technology (2016–2024)
Effective patent ownership of inventions per 10,000 population (a2)+0.0354China Statistical Yearbook on Science and Technology; Hainan Statistical Yearbook
(2016–2024)
Structural optimization (A2)The ratio of main business income to industrial value added in high-tech industries (a3)+0.0220China Statistical Yearbook on Science and Technology; China Statistical Yearbook
(2016–2024)
The proportion of e-commerce in GDP (a4)+0.0339China Statistical Yearbook (2016–2024)
Stable growth (A3)GDP growth rate (a5)+0.0206China Statistical Yearbook (2016–2024)
Total labor productivity (a6)+0.0200Hainan Statistical Yearbook (2016–2024)
The proportion of the working-age population in the total population (a7)+0.0335Hainan Statistical Yearbook (2016–2024)
Open development (A4)Actual utilization of foreign capital per capita (a8)+0.0118Hainan Statistical Yearbook (2016–2024)
Total exports and imports per capita (a9)+0.0206China Statistical Yearbook (2016–2024)
Social and livelihood (B)Education and culture (B1)The proportion of education expenditure in GDP (b10)+0.0195China Statistical Yearbook (2016–2024)
Average years of education (population aged 6 and above) (b11)+0.0274Hainan Statistical Yearbook (2016–2024)
Number of public cultural institutions per 10,000 persons (b12)+0.0122China Statistical Yearbook of Culture, Heritage and Tourism; Hainan Statistical Yearbook (2016–2024)
Social security (B2)Basic social security coverage rate (b13)+0.0217China Statistical Yearbook (2016–2024)
Per capita expenditure on social security and employment (b14)+0.0302China Statistical Yearbook (2016–2024)
Hygiene and health (B3)Per capita government health expenditure (b15)+0.0206China Statistical Yearbook (2016–2024)
The total incidence rate of Class A and B notifiable infectious diseases (1/100,000) (b16)0.0078China Health Statistical Yearbook; Hainan Statistical Yearbook
(2016–2024)
Number of health technicians per thousand population (b17)+0.0180China Statistical Yearbook (2016–2024)
Degree of parity (B4)Poverty incidence rate (b18)0.0131Poverty Monitoring Report of Rural China (2016–2020)
The ratio of disposable income of urban and rural residents (b19)0.0303China Statistical Yearbook (2016–2024)
Resource environment (C)Land resources (C1)Forest coverage rate (c20)+0.0266China Statistical Yearbook (2016–2024)
Cultivated land coverage rate (c21)+0.0498China Statistical Yearbook; Hainan Statistical Yearbook (2016–2024)
Coverage rate of wetland (c22)+0.0977Hainan Statistical Yearbook (2016–2024)
Grassland coverage rate (c23)+0.0419China Statistical Yearbook; Hainan Statistical Yearbook (2016–2024)
Water environment (C2)Per capita water resources (c24)+0.0179China Statistical Yearbook (2016–2024)
Percentage of water quality sections in river basins with water quality categories I, II, and III nationwide (c25)+0.0192Hainan Ecological and Environmental Bulletin
(2015–2023)
Atmospheric environment (C3)Percentage of overall good ambient air quality days in the province (c26)+0.0146Hainan Ecological and Environmental Bulletin
(2015–2023)
Consumption and emission (D)Land consumption (D1)Value added of secondary and tertiary industries per unit of construction land area (d27)+0.0095China Statistical Yearbook, China Urban Construction Statistical Yearbook
(2016–2024)
Water consumption (D2)Water consumption per unit of industrial-added value (d28)0.0230China Statistical Yearbook (2016–2024)
Energy consumption (D3)Energy consumption per unit of GDP (d29)0.0191Hainan Statistical Yearbook (2016–2024)
Major pollutant emission (D4)Chemical Oxygen Demand (COD) emissions per unit of GDP (d30)0.0113China Energy Statistical Yearbook (2016–2024)
Ammonia and nitrogen emissions per unit of GDP (d31)0.0089China Energy Statistical Yearbook (2016–2024)
Sulfur dioxide emissions per unit of GDP (d32)0.0088China Energy Statistical Yearbook (2016–2024)
NOx emissions per unit of GDP (d33)0.0111China Energy Statistical Yearbook (2016–2024)
Generation of industrial hazardous waste (D5)Hazardous waste generation per unit of GDP (d34)0.0164China Statistical Yearbook; China Statistical Yearbook on Environment
(2016–2024)
Greenhouse gas emission (D6)The proportion of renewable energy power consumption in the total electricity consumption of the whole society (d35)+0.0155National Energy Administration (NEA) (2015–2023)
Governance and protection (E)Investment in governance (E1)The proportion of fiscal expenditure on energy conservation and environmental protection in GDP (e36)+0.0165China Statistical Yearbook (2016–2024)
The ratio of investment in environmental pollution control to investment in fixed assets (e37)+0.0162China Statistical Yearbook; Hainan Statistical Yearbook (2016–2024)
Wastewater
utilization rate (E2)
Urban sewage treatment rate (e38)+0.0148China Statistical Yearbook on Environment
(2016–2024)
Solid waste disposal (E3)Comprehensive utilization rate of general industrial solid waste (e39)+0.0124China Statistical Yearbook on Environment
(2016–2024)
Hazardous waste disposal (E4)Hazardous waste disposal rate (e40)+0.0526China Statistical Yearbook on Environment
(2016–2024)
Garbage disposal (E5)Non-hazardous treatment rate of domestic waste (e41)+0.0089China Statistical Yearbook on Environment
(2016–2024)
Reduction in greenhouse gas emission (E6)Annual rate of reduction in energy intensity (e42)+0.0100Hainan Statistical Yearbook (2016–2024)
Sustainable agriculture (F)Level of agricultural productivity (F1)Index of total agricultural output value (f43)+0.0123Hainan Statistical Yearbook (2016–2024)
Proportion of crop production affected by disasters (F2)Proportion of the disaster area of tropical agricultural land (f44)0.0078China Rural Statistical Yearbook (2016–2024)
Regional agricultural production capacity per capita (F3)Per capita area of tropical agricultural land (f45)+0.0283China Rural Statistical Yearbook (2016–2024)
Note: The capital letters (A, B, C, etc.) represent the dimensions of the primary index and secondary index. The lowercase letters (a, b, c, etc.) represent the dimensions of the tertiary index. Numbers are used solely for sorting purposes. Due to the large number of indicators in the manuscript, these markings are used to make the review process easier. "+" represents positive indicators; "−" represents negative indicators.
Table 2. Cluster analyses are divided into three categories of results.
Class OrderCities and Counties in Hainan ProvinceScore RangeCategory
Category 1Haikou, Chengmai, Sanya>0.40Pioneer development area
Category 2Wuzhishan, Danzhou, Baisha, Baoting, Qiongzhong, Wenchang0.25~0.31Stable development area
Category 3Changjiang, Lingao, Wanning, Qionghai, Ding’an, Dongfang, Tunchang, Lingshui, Ledong0.17~0.24General development area
Table 3. Main research data.
TypeSource and Year
Annual work reportsWork reports of Hainan Provincial People’s Government, 2015–2023
Hainan Province sustainable development-related policy documentsHainan Province policy document database, 2015–2023
Compilation of policy documents on the construction of Hainan Free Trade Port, 2018–2023
Table 4. Codes and keywords.
Primary CodeSecondary CodeNo. of ReportsTertiary Code (Keywords)
Economic development Innovation drive 8Talent introduction, Innovation-driven development, Science and technology innovation
Structural optimization 9Structural upgrading, Supply-side structural reform, High-quality development
Stable growth 3Stabilizing the broader economy, Economic recovery
Open development7Reform and opening-up, Cross-border e-commerce, Active utilization of foreign investment, Foreign trade development, Construction of Hainan free trade port
Social and livelihood Education and culture6Establishment of education, Vocational education, Introduction of educational resources, Educational reform, Tourism and culture
Social security 6Social insurance for poverty alleviation, Stable employment, Unemployment protection, Assistance for persons with disabilities, Social assistance
Hygiene and health 5Medical and health service system, Health care, “Good director, good doctor”, Chinese medicine inheritance
Degree of parity 6Poverty eradication, Rural revitalization, Poor persons with disabilities, Urban-rural gap
Ecological environment (C)7Forest harvesting quota, Green development of assembled buildings, Water resource utilization and conservation, Land resource planning, Forestry ecological restoration and wetland protection, Peak carbon implementation
Social governance (D)7Social order maintenance, Social conflict resolution, Social group management, Social environment creation, Social risk prevention and control, Social participation and collaborative governance
Disclaimer/Publisher’s Note: The statements, opinions and data contained in all publications are solely those of the individual author(s) and contributor(s) and not of MDPI and/or the editor(s). MDPI and/or the editor(s) disclaim responsibility for any injury to people or property resulting from any ideas, methods, instructions or products referred to in the content.