1. Introduction
In recent years, livestock farming in Europe has increasingly been confronted with sustainability and societal concerns. Through emissions of greenhouse gases, ammonia, nitrates, phosphorus, and antibiotic pollution, the livestock sector has a major influence on water quality, soil quality, air quality, and biodiversity (for reviews of the literature, see, for example, [
1,
2,
3]. For instance, 18% of global greenhouse gas emissions are estimated to originate from livestock farming [
1]. As such, livestock farming plays an important role in the current environmental and climate challenges Europe faces.
This is also, if not especially, true for livestock farming in The Netherlands. The Netherlands is one of the largest exporters of agricultural products in the world and has the highest number of livestock units per hectare of agricultural land in Europe [
4]. This leading position comes at a cost. Livestock farming is responsible for roughly 10% of greenhouse gas emissions in The Netherlands [
5]. Ammonia emissions from the agricultural sector, in particular, are one of the main contributors to the nitrogen crisis in The Netherlands, which imposes restrictions on Dutch society and its economy. The nitrogen crisis emerged in 2019 when the Council of State ruled that the policies in place to ensure that The Netherlands adheres to the European agreements on the protection of Natura 2000-areas were insufficient. Since then, it must first be proven that Natura-2000 areas do not suffer from the expansion of a specific economic activity, such as the construction of roads or houses, before construction may take place.
Such pressures on livestock farming support the need for transformative changes in dairy and food systems, for example, through the EU’s Common Agricultural Policy (CAP) [
6]. In the past, the CAP has failed in its attempts to promote a more sustainable European agricultural sector [
7]. In 2021, the European Court of Auditors (ECA) concluded that the EU greening scheme did not incentivise farmers to adopt effective climate-friendly measures, and its impact on climate had been only marginal [
8].
The CAP 2023-27 aims to contribute significantly more to the targets of the European Green Deal than its predecessors did. One of the new elements of the CAP 2023-27 is the introduction of eco-schemes. Eco-schemes are designed to incentivise farming practices that have lower environmental and climate impacts. Each member state can formulate its own eco-scheme and set grant criteria in its national CAP Strategic Plan on the condition that at least 25% of direct payments are allocated to eco-schemes [
9]. The Dutch CAP Strategic Plan allocates 32% of the national CAP budget to eco-schemes to support sustainable farming practices that benefit the climate, nature, and environment [
10].
The main objective of this paper is to provide a first broad analysis of the application of the eco-scheme in The Netherlands. Given the large financial commitments and ambitions of the eco-schemes, it is important to understand how they function and what the effects are. Although the eco-schemes were only recently introduced, some research has already been published on the policy. For instance, ref. [
11] explores eco-scheme design plans in 15 EU member states. They found that all 15 member states addressed Green Deal targets, with particular emphasis being given to biodiversity enhancement and non-productive land. The authors of [
11] conclude that adding another policy instrument to the CAP’s toolbox vastly increased the CAP’s complexity and that it remained to be seen how farmers would respond. The authors of [
12] assess both the environmental effectiveness and cost-effectiveness of two possible eco-schemes in a case study in Spain. They find that the eco-schemes can be environmentally beneficial; however, they are not cost-effective for individual farmers. A study by [
13] explores the applications of an eco-scheme focused on carbon farming and nutrient management in Poland. Their results show that there were fewer applications submitted than expected due to strict conditions and impractical regulations. Hence, the existing literature focuses on analysing the proposed (i.e., ex-ante) eco-scheme designs and practical aspects of the eco-scheme. As far as we know, the literature provides no ex-durante insights that reveal the actual relationship between the amount of grant funding from the eco-schemes farmers receive and farmers’ sustainability performance. Our research explicitly fills in this knowledge gap and is the first study that provides such insights by quantifying this relation based on extensive data analysis. Understanding the relationship between the eco-scheme grants and sustainability performance is especially important as there is evidence that previous CAPs had a large and often negative impact on the sustainability of the livestock sector. The authors of [
7] provide an extensive and recent review of this literature. In their review, they conclude, among others, that the negative impacts on, for example, greenhouse gas emissions and animal welfare are the result of intensification of the livestock sector, which, in turn, is fostered by the positive correlation between (previous) CAP payments and farm size. Furthermore, they state that the eco-schemes introduced in the new CAP are aimed at addressing this problem and to incentivise more sustainable farming practices.
This paper contributes to this existing literature by investigating whether the eco-schemes live up to these expectations and how they are related to sustainable livestock farming practices. To be more specific, we investigate whether farmers who receive a larger amount of grant funding from the Dutch eco-schemes perform better on sustainability. To address this hypothesis, we answer three questions for the eco-scheme in The Netherlands. First, who are the recipients of the eco-scheme grants within livestock farming? Second, how have EU grants developed over time for these recipients? Third, do eco-scheme recipients farm more sustainably? By analysing administrative and microeconomic data from the Farm Accountancy Data Network (FADN), we show that most recipients of eco-scheme grants are dairy farmers. Larger farms (in hectares) are more likely to receive higher payments per hectare from the eco-scheme. The introduction of the eco-scheme marked a shift toward less grant funding being awarded for income support and more to encourage sustainable farming practices. This resulted in a significant downturn in the financial situation of many Dutch dairy farmers. Dairy farmers who scored higher on sustainability indicators benefit more on average from the eco-scheme, although a substantial share of dairy farmers also benefited financially but scored relatively low on sustainability. These findings provide a preliminary ex-durante evaluation of the Dutch eco-scheme that can contribute to further fine-tuning of eco-schemes and to the public debate on how to stimulate sustainable practices in livestock farming.
3. Data and Methodology
3.1. Administrative Data
To identify the recipients of the eco-scheme grants, we made use of data from The Netherlands Enterprise Agency (RVO) (these data are not publicly available; see the “Data Availability Statement” in the declarations at the end). The RVO administers all national and EU agricultural grants on behalf of the Dutch government. In this paper, we focus on the largest EU CAP grants: the greening scheme (until 2022), the eco-scheme (2023), and the BISS. Together, they account for 97% of the total grant funding received by Dutch livestock farmers and, therefore, provide an almost complete view of grants in the Dutch agricultural sector.
We received farm-level information from the RVO on the grants received by all Dutch livestock farmers per year, the category of livestock farming, and farm size in hectares. The grant information is complete for the period 2018–2022. For 2023, the grant information was nearly complete, as the RVO could provide only data on the number of hectares per farm and the eco-scheme medals awarded. However, we could calculate the expected monetary value of the main grant schemes for 2023 based on the size of the farms. The expected value is likely only a slight overestimation of the definitive amounts granted, as some farmers may receive less or nothing if they fail to meet some of the requirements or conditionalities. Conditionality (previously known as cross-compliance) encourages farmers to comply with high EU standards on public, plant, and animal health and welfare. For more information, see also:
https://agriculture.ec.europa.eu/common-agricultural-policy/income-support/conditionality_en (accessed on 13 March 2025). We calculated the amounts expected in previous years and compared them with the actual amounts, and we found an overestimation of roughly 5% in total.
3.2. Farm Accountancy Data Network
To investigate whether eco-scheme beneficiaries with higher medals perform better in terms of sustainability, we made use of the Dutch Farm Accountancy Data Network (FADN) administered by Wageningen Economic Research (WEcR). Through FADN, WEcR collects economic and sustainability data on a representative sample of Dutch farmers, fishers, and forestry companies (N.B., the FADN is not representative of very small farms that have a standard yield of less than EUR 25,000 per year). The FADN is a European instrument for evaluating the income of agricultural holdings and the impacts of the CAP. It is currently the best available dataset for the purpose of our research. For more information on the Dutch FADN, such as the selection of farms, see [
21].
From the FADN we selected a set of indicators that are related to sustainability. Within the academic literature, there is no uniform definition of sustainability [
7,
22]. Additionally, the Dutch eco-scheme setup does not define what sustainable farming is and how to measure it. Fortunately, the CAP did state specific objectives that the eco-schemes should contribute to, and from these objectives, we subtracted the following aspects: climate and energy, soil, air and water, biodiversity, and animal welfare and health [
23]. Consequently, we have selected all the indicators in the FADN dataset that belong to the four domains that are closely linked to these aspects: (1) climate and energy; (2) environment (water, soil, air); (3) biodiversity; and (4) animal health. There was one additional indicator that also fitted within the four domains: the use of antibiotics. However, there were no data available on this indicator for 2022. Thus, this indicator could not be included in the analysis.
Table 1 shows the 13 indicators that belong to each of the domains, including the unit of measurement. It is encouraging that these indicators correspond quite well to the indicators found in other academic literature on sustainability in dairy farming, e.g., [
24,
25].
For this study, we used data on sustainability indicators from 2022. A total of 330 dairy farmers participate in the FADN. The information on the sustainability indicators is complete for 195 of those dairy farmers. Because the FADN does not include the medals that were awarded under the eco-scheme, we linked the RVO data to the FADN data at the farm level, with a matching percentage of 94%. This left us with 184 observations for which we have complete information on both the sustainability indicators and the eco-scheme medal they received.
3.3. Empirical Analysis
Our study analyses the Dutch eco-scheme from various angles. We first examined who the recipients of the eco-scheme were within livestock farming. To do so, we used administrative data to create descriptive statistics on how the eco-scheme medals were distributed across different farms. Second, we used administrative data to review how the two largest grant schemes in the EU CAP developed over time for Dutch dairy farmers, the largest group of recipients within livestock farming, focusing on the introduction of the eco-scheme in 2023. Due to the richness of the data we were able to look at general trends, as well as trends at medal-category level and even individual level.
Lastly, we were interested in whether the eco-scheme reached more sustainable dairy farmers. This analysis required us to match the administrative data on the medals awarded to individual farmers with the FADN data on the sustainability indicators (for more details please see the section Farm Accountancy Data Network). For each of the 13 indicators in the FADN data, we compared the average performance of farmers with a gold medal against that of all other farmers. We used the non-parametric Wilcoxon test to analyse whether differences between the two groups were statistically significant. Moreover, we wanted to know how farmers with different eco-scheme medals performed on a more comprehensive measure of sustainability; this made it easier to compare the medal categories with each other. We, therefore, combined the 13 indicators into one sustainability score. To calculate this score, we first normalized the indicators’ values using the following formula:
where
is the value of indicator
i for farmer
f,
is the average of indicator
i and
is the standard deviation of indicator
i. If the minimum or maximum value of an indicator was less than 3 times the standard deviation from the average, this minimum or maximum value was employed instead of the average plus or minus 3 times the standard deviation. Moreover, in case the normalized values fall below 0 (poorest) or above 1 (best performance), they were corrected to 0 and 1, respectively. To construct a comprehensive sustainability score between 0 and 1, we aggregated the scores employing the weights included in
Table 1. The weights were selected such that each sustainability domain was represented equally within the score. We subsequently divided the sample of farmers into quartiles by sustainability score and analysed how the quartiles were distributed across the four medal categories. This gave us an indication of how recipients of different medals score on the comprehensive sustainability score.
4. Results
4.1. Who Are the Recipients of the Eco-Scheme?
A total of 88% of all Dutch dairy farmers received a medal. This number is substantially higher than, for example, pig and poultry farmers, of whom 42% and 34%, respectively, received a medal. This large difference is driven by the fact that dairy farmers are land-based, contrary to pig and poultry farmers, who tend to keep their animals indoors. As many activities within the Dutch eco-scheme are aimed at land-based farming practices, it was more difficult for non-land-based farming practices to benefit from the scheme. As dairy farmers represent by far the largest group of recipients within livestock farming, the rest of the empirical analysis is focused on them.
Table 2 shows the number of observations per medal category. The majority of dairy farmers have a silver medal, followed by gold and bronze. In addition, the table shows that there is a clear correlation between average farm size and the medal received: the eco-scheme tends to favour larger farms. This is a consequence of the activities being aimed at land-based farming practices. As payment of the eco-scheme is based on a fixed amount per hectare, farmers in the gold category benefit twice. Once from the higher payment per hectare and once from having, on average, more hectares of land.
4.2. How Have EU Subsidies Developed over Time?
The introduction of the eco-scheme marked a shift in the EU CAP’s focus compared to previous years, with potentially large financial consequences.
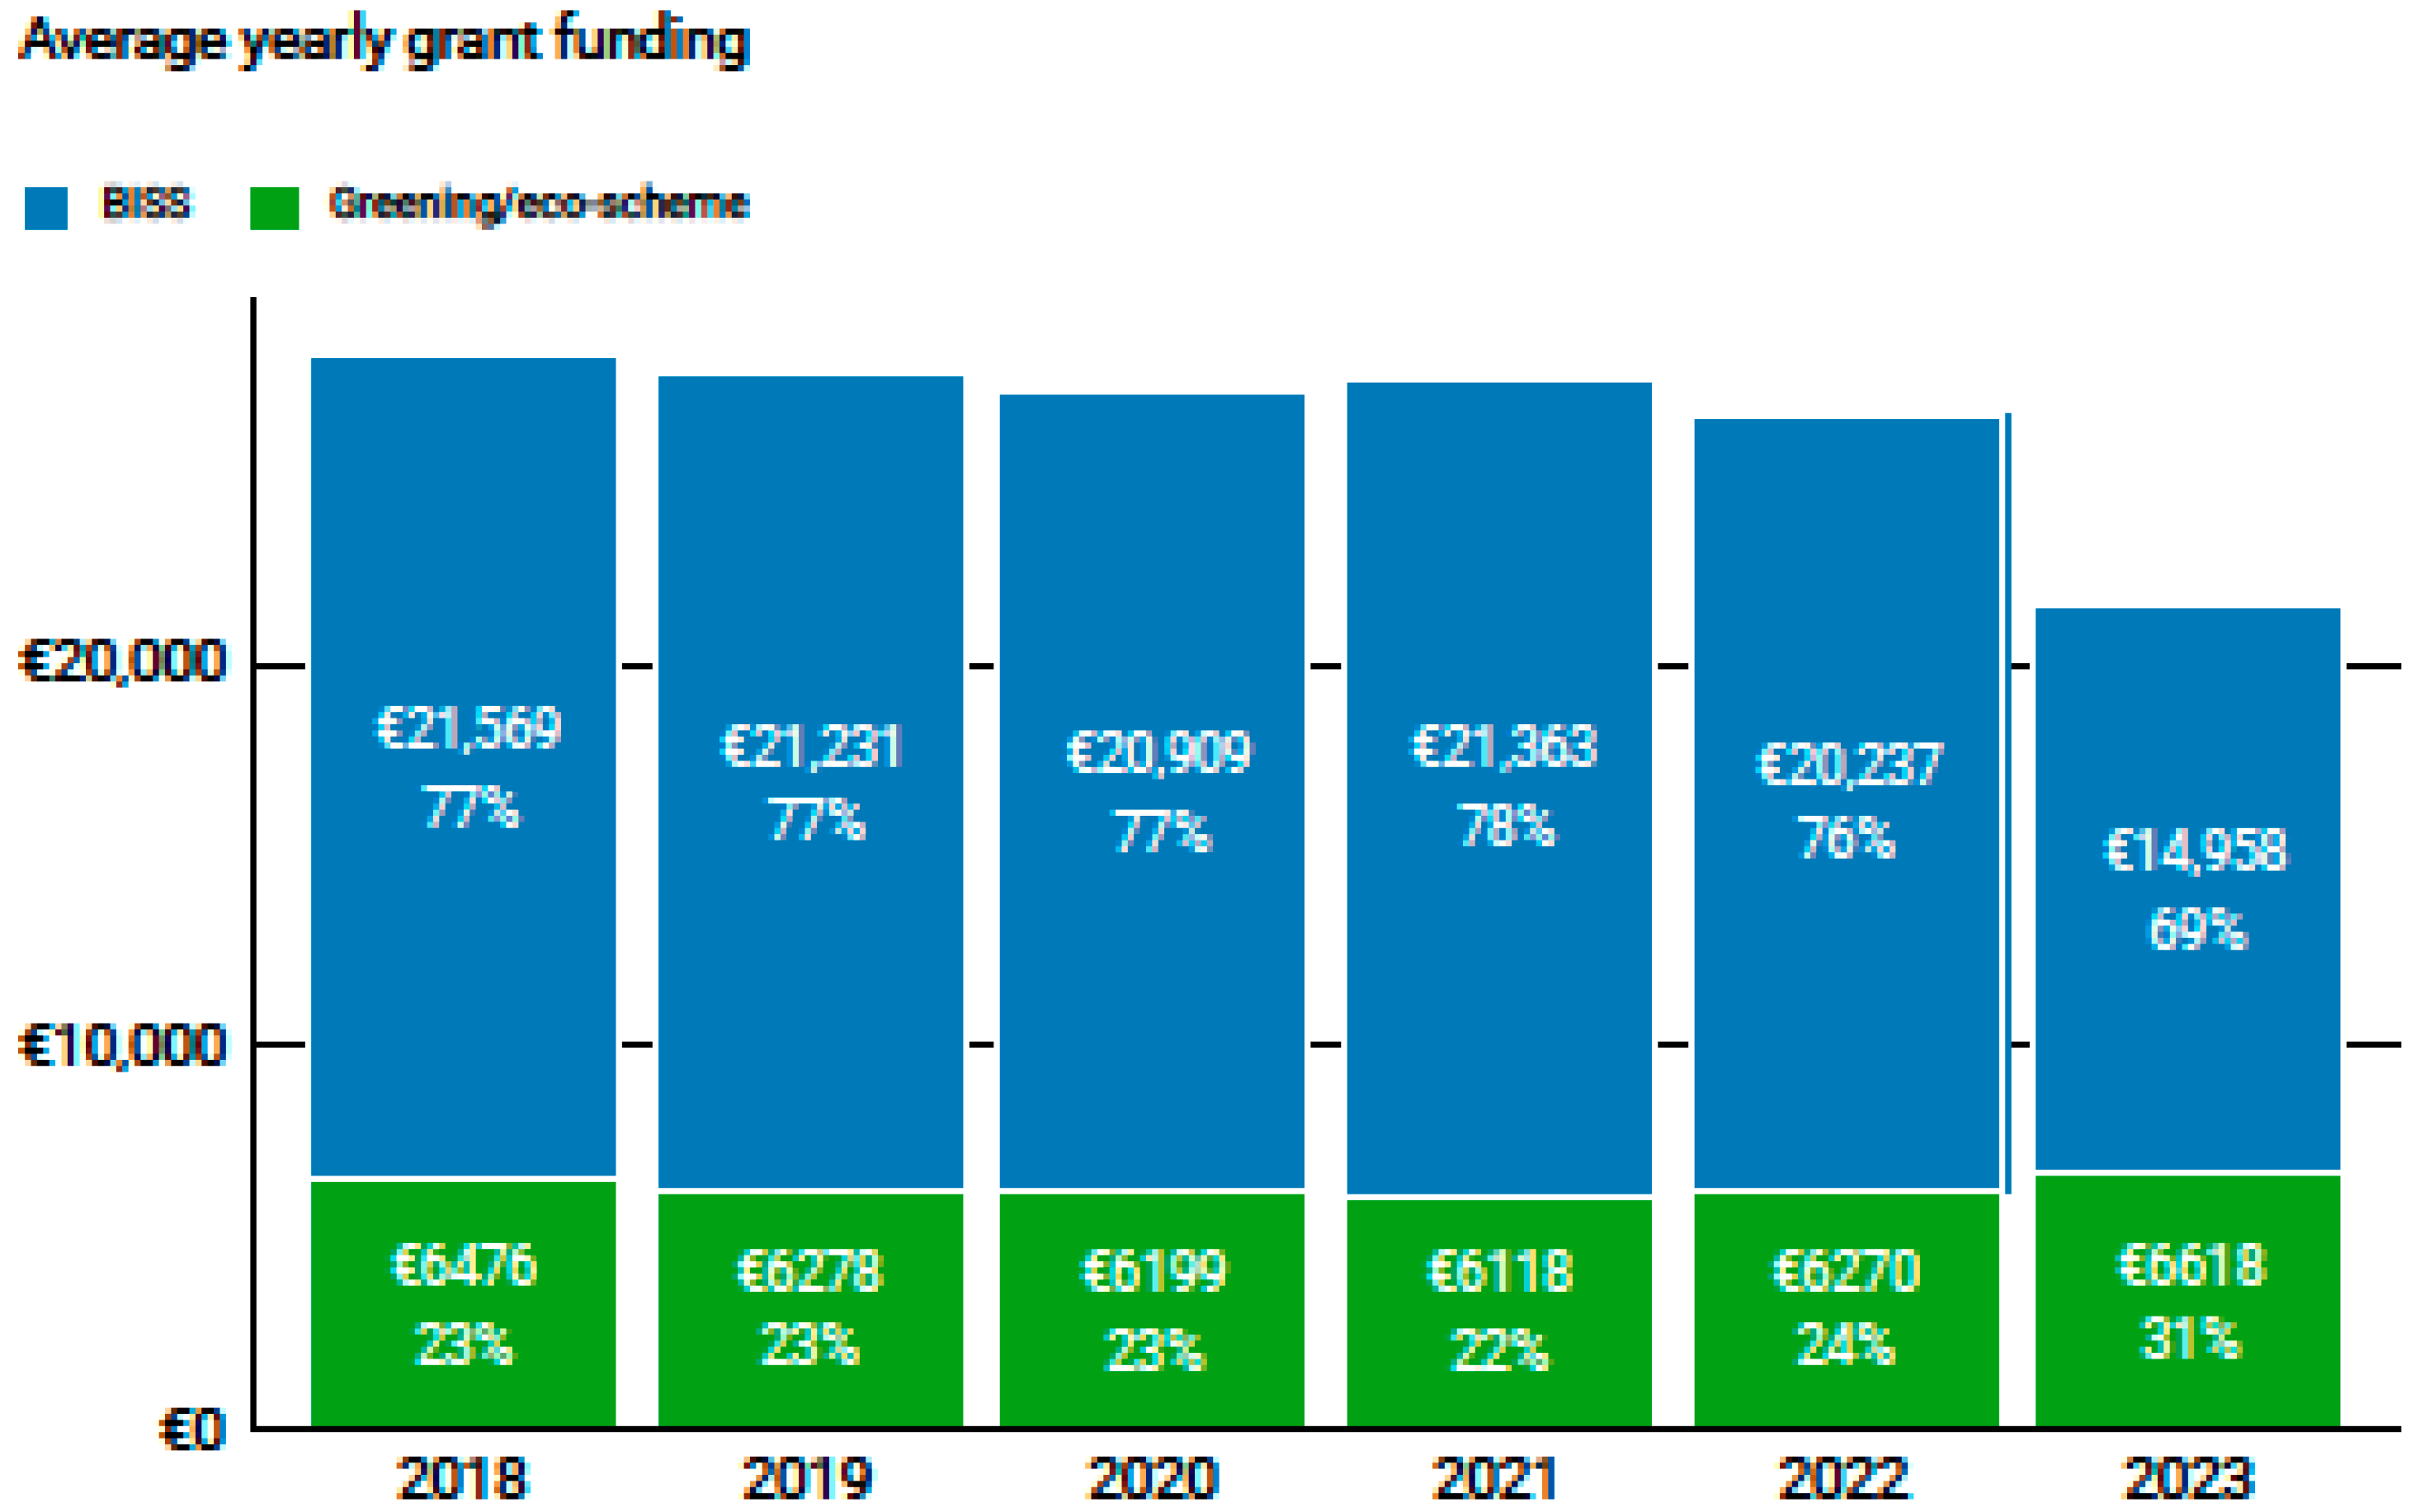
Figure 1 plots the average share of the BISS and the greening/eco-scheme for the years 2018 to 2023. Two patterns can be seen from the figure that relate to the new CAP period that started in 2023. First, the total amount of the two schemes—which form the majority of the CAP payments—was lower. Second, the share of the BISS fell from roughly 77% to 69%. This is in accordance with the shift in focus to more environmentally sustainable farming practices in the CAP 2023–2027.
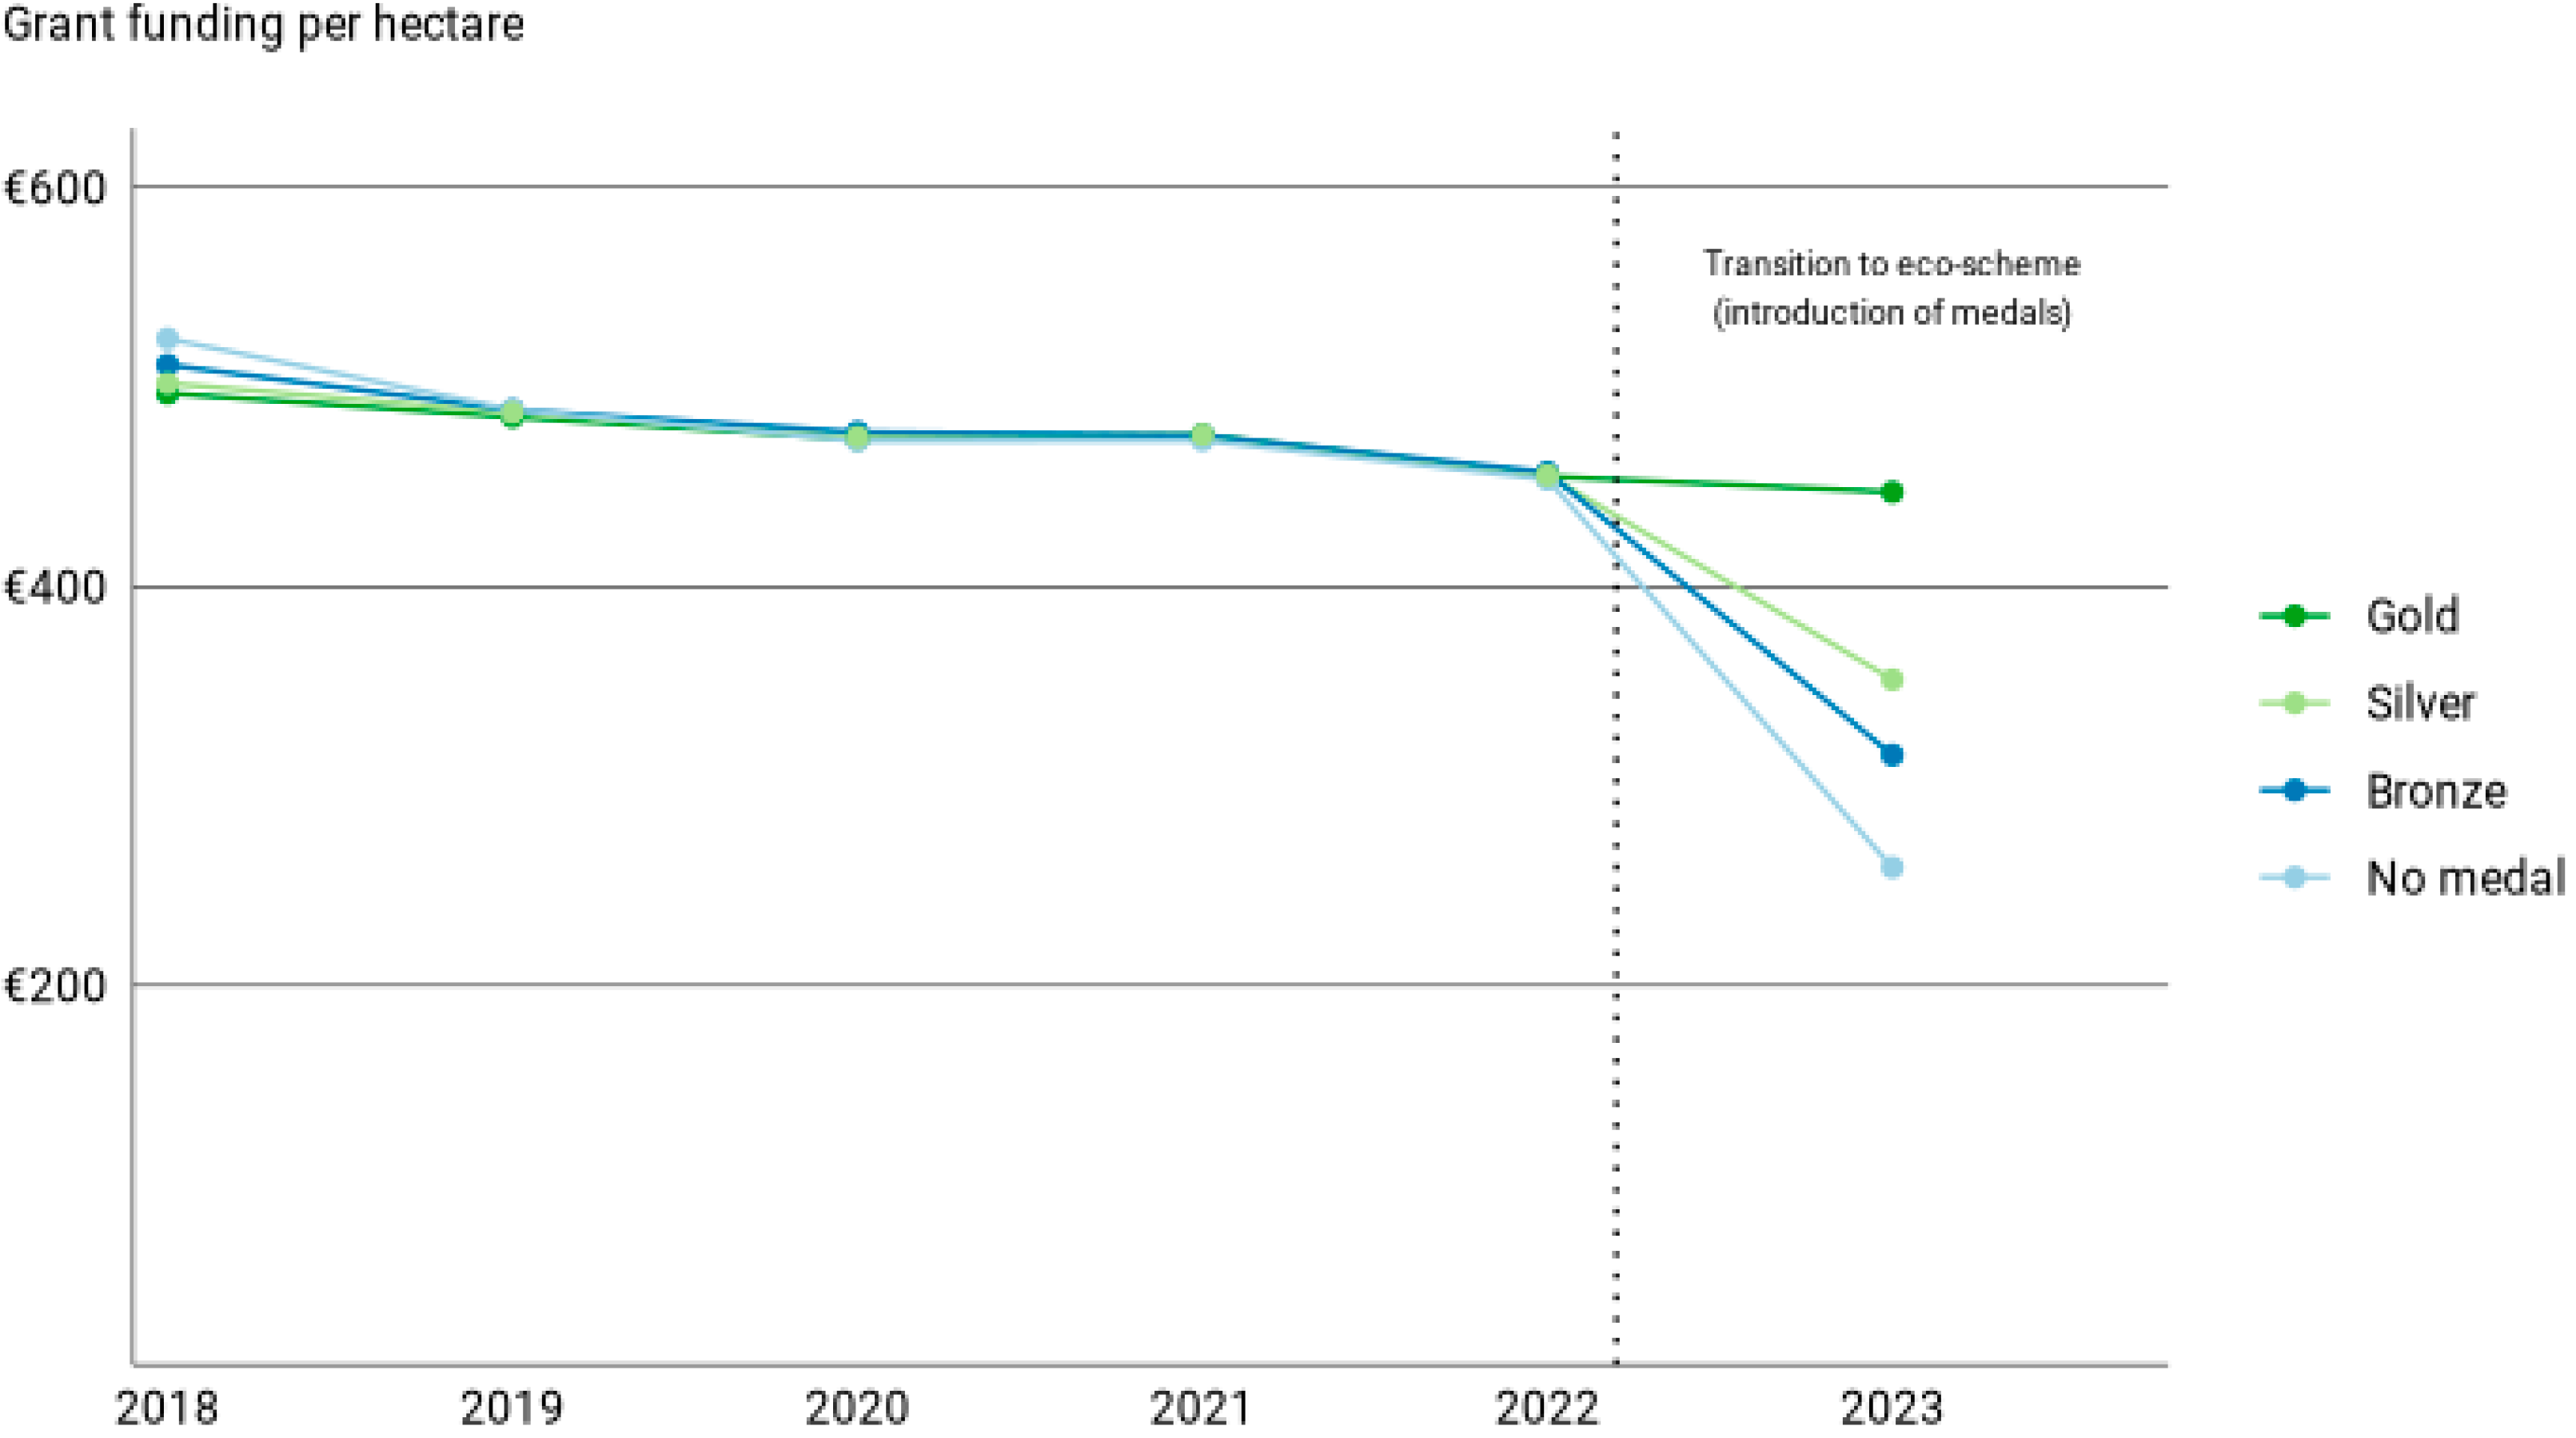
To understand how these general trends affected different types of farmers,
Figure 2 shows the development over time for each medal category in the eco-scheme. To account for the fact that farm size is correlated with medal category, we show the amount of grant funding per hectare.
Figure 2 shows that not much changed for gold medal dairy farmers in 2023, the year the medals were introduced. Statistical testing indeed shows no significant difference in average grant funding between 2022 and 2023 for the gold medal category. However, for farmers with a silver, bronze, or no medal, the change in grant funding was increasingly negative and statistically significant.
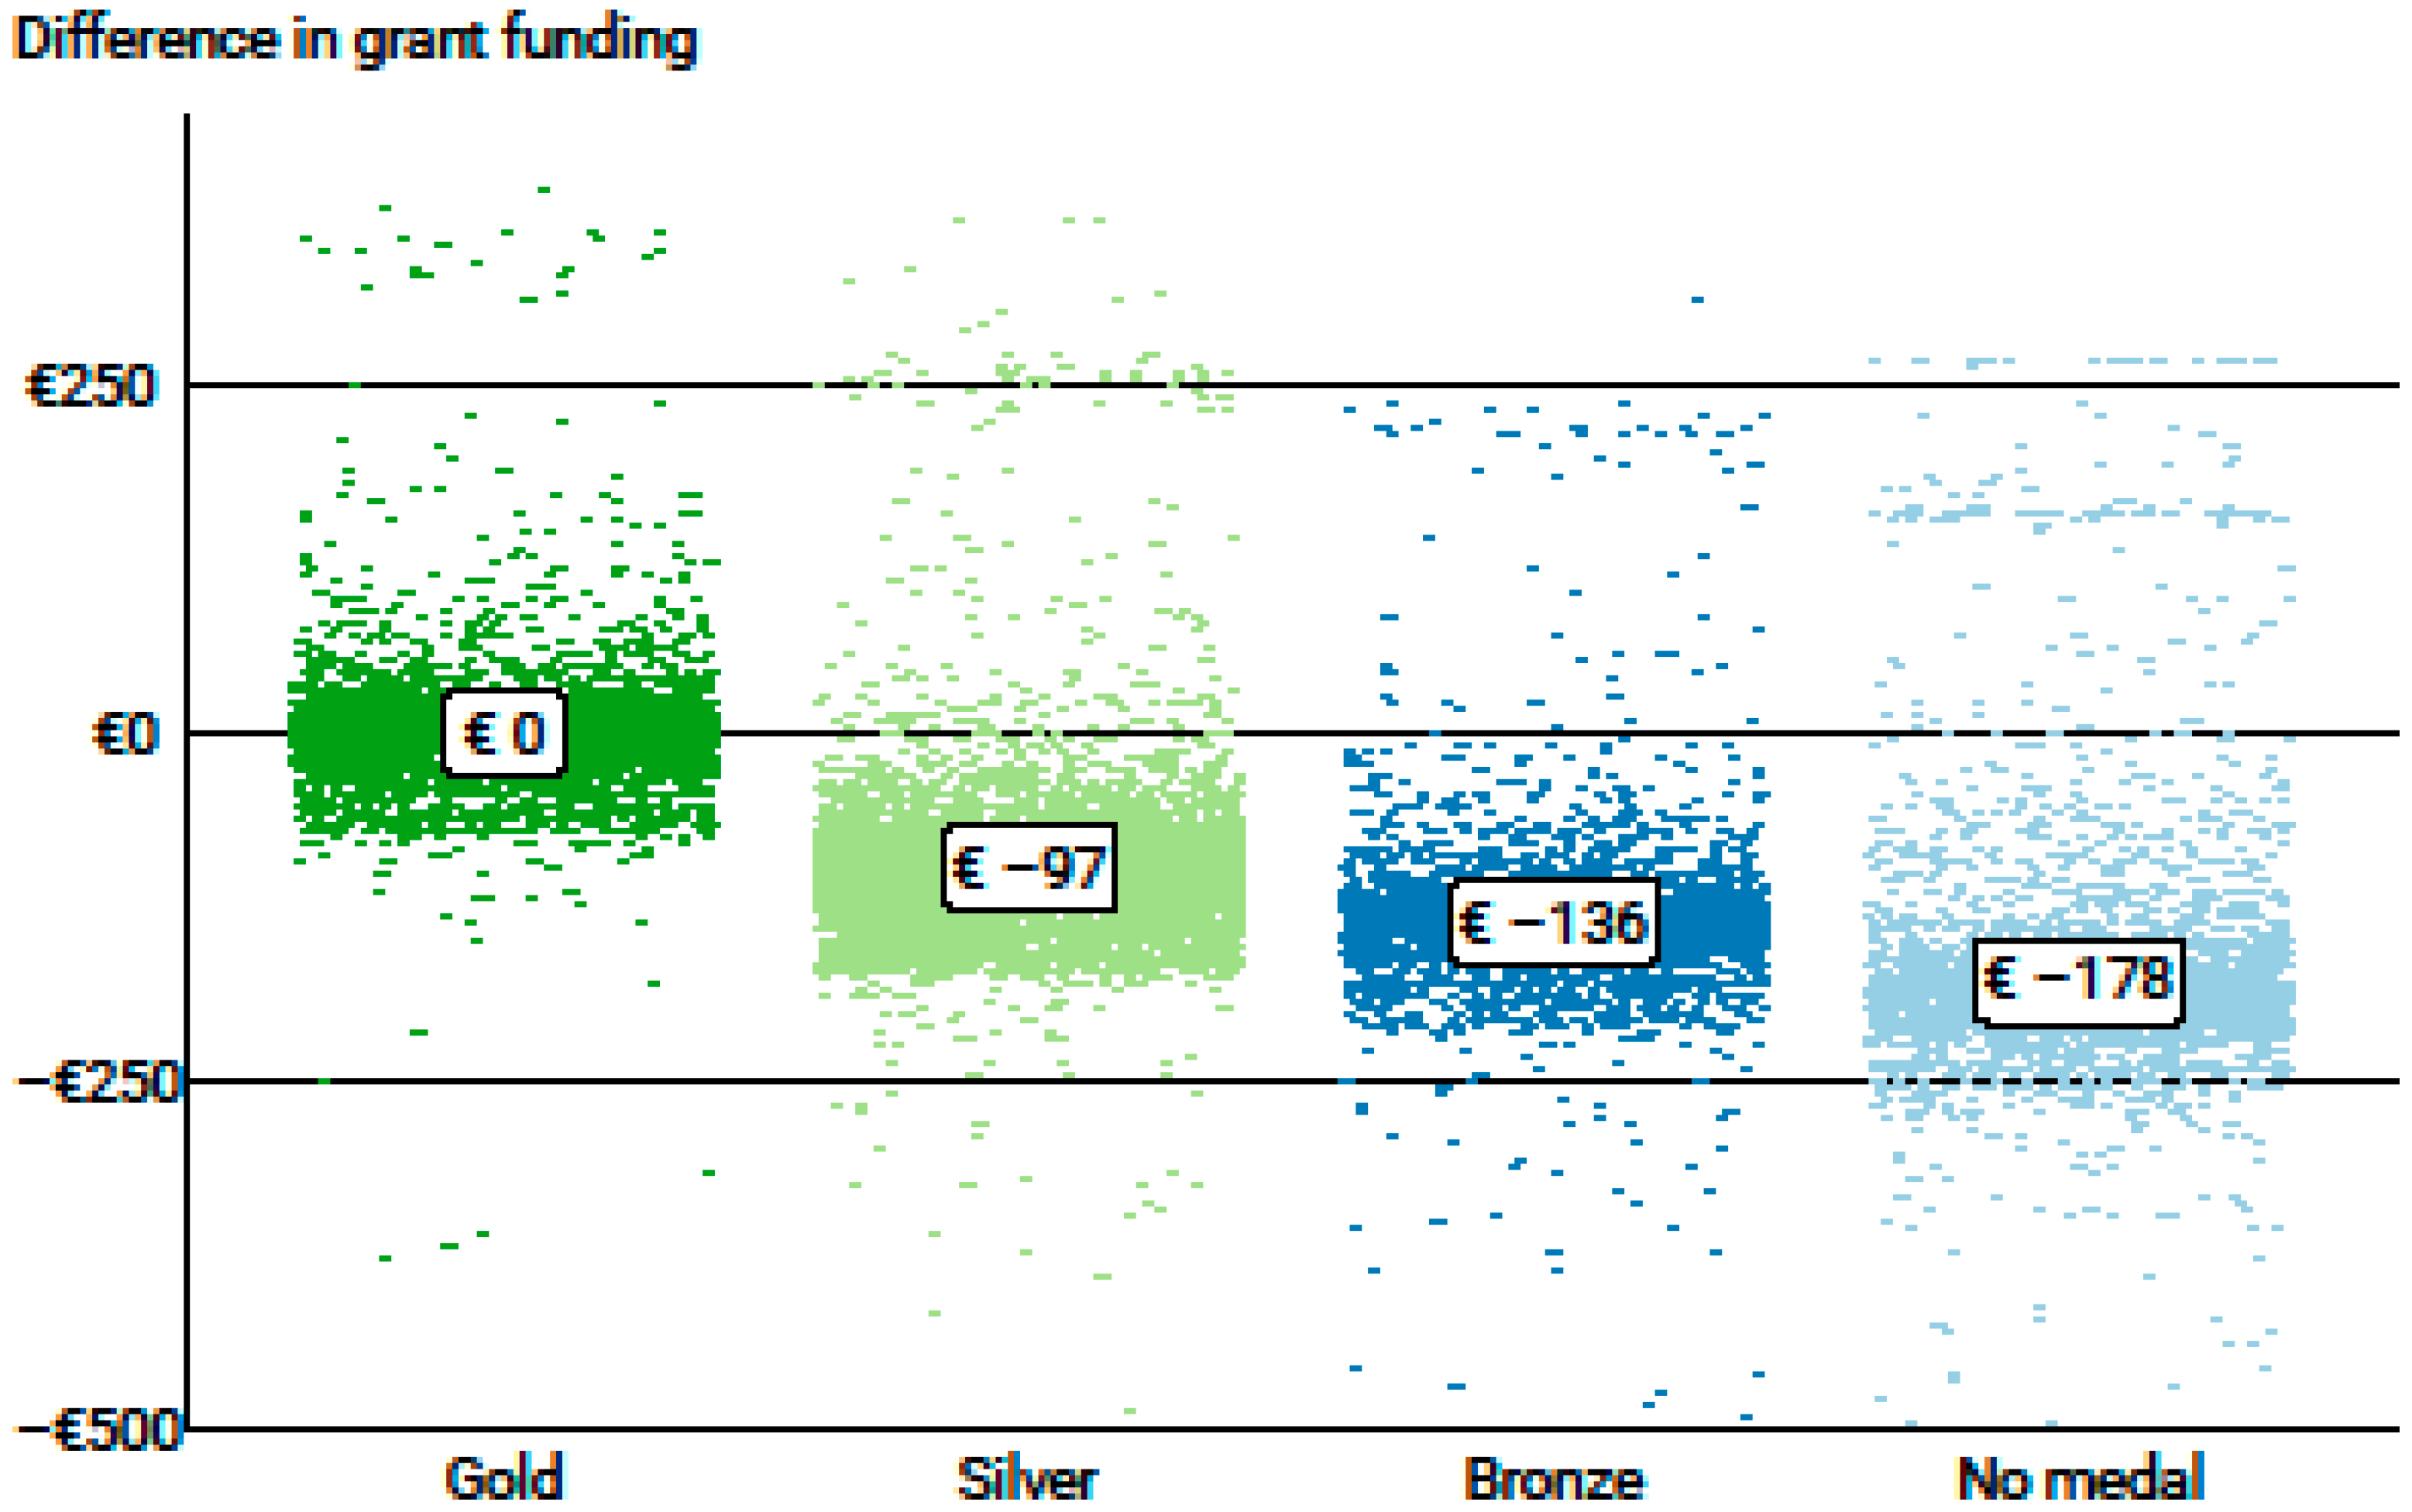
The change in an individual farmer’s financial situation can be even larger.
Figure 3 shows the difference in grant funding per hectare between 2022 and 2023, where each dot represents an individual dairy farmer. The averages per medal category conceal the great diversity at an individual level. For example, on average, there is no significant drop in grant funding for the gold medal category, but some gold medal farmers still experienced a large drop in grant funding in 2023. Simultaneously, some farmers without a medal received more grant funding. This is due to changes in individual circumstances between the years.
4.3. Does the Eco-Scheme Reach More Sustainable Farmers?
Eco-scheme medals are awarded for the sustainability activities dairy farmers perform, i.e., they are rewarded for the inputs they deliver. Awarding a gold medal to a dairy farmer, however, does not necessarily mean the farmer actually performs better on sustainability, i.e., on their output. Two main drivers can cause a discrepancy between input and output. First, the sustainability performance of gold medal farmers may be inherently different from that of silver, bronze, or no medal farmers. Hence, if the sustainability baseline of farmers in the various medal categories differs, the output may differ as well. Second, the activities that farmers undertake for the eco-scheme may have little or no effect on sustainability performance. In other words, the input may not relate to the output. To be able to say anything about how effective the eco-scheme is in causing the dairy farming sector to become more sustainable, these two aspects must be disentangled. This paper focuses on the former aspect.
To this end,
Table 3 compares performance on the sustainability indicators in 2022 of gold medal farmers with that of all other farmers. Performance on the sustainability indicators we measured in the year before the eco-scheme started can be seen as the sustainability baseline for these two groups of farmers. It is clear from
Table 3 that the gold medal category performs statistically significantly better on the indicators in the environment domain and the biodiversity and grazing domain. For example, on average, gold medal farmers emit 12% and 17% less ammonia per cow and per hectare, respectively, than those in the other categories. For the indicators related to the other two domains—animal health and welfare and climate and energy—we do not observe better performance in the gold medal category. There is no statistically significant difference between the groups for the replacement percentage, energy consumption, and GHG emissions, whereas the other categories perform better regarding cell number since a lower cell number indicates better animal health. A possible explanation of this finding is that organic dairy farmers are automatically awarded a gold medal and are, thus, overrepresented in the gold category. As the use of antibiotics is severely restricted in organic farming, the higher cell count can be a consequence of less use of antibiotics, which is considered beneficial for human health. Overall, farmers who received a gold medal in the first year of the eco-scheme were already performing better on most sustainability indicators in the previous year.
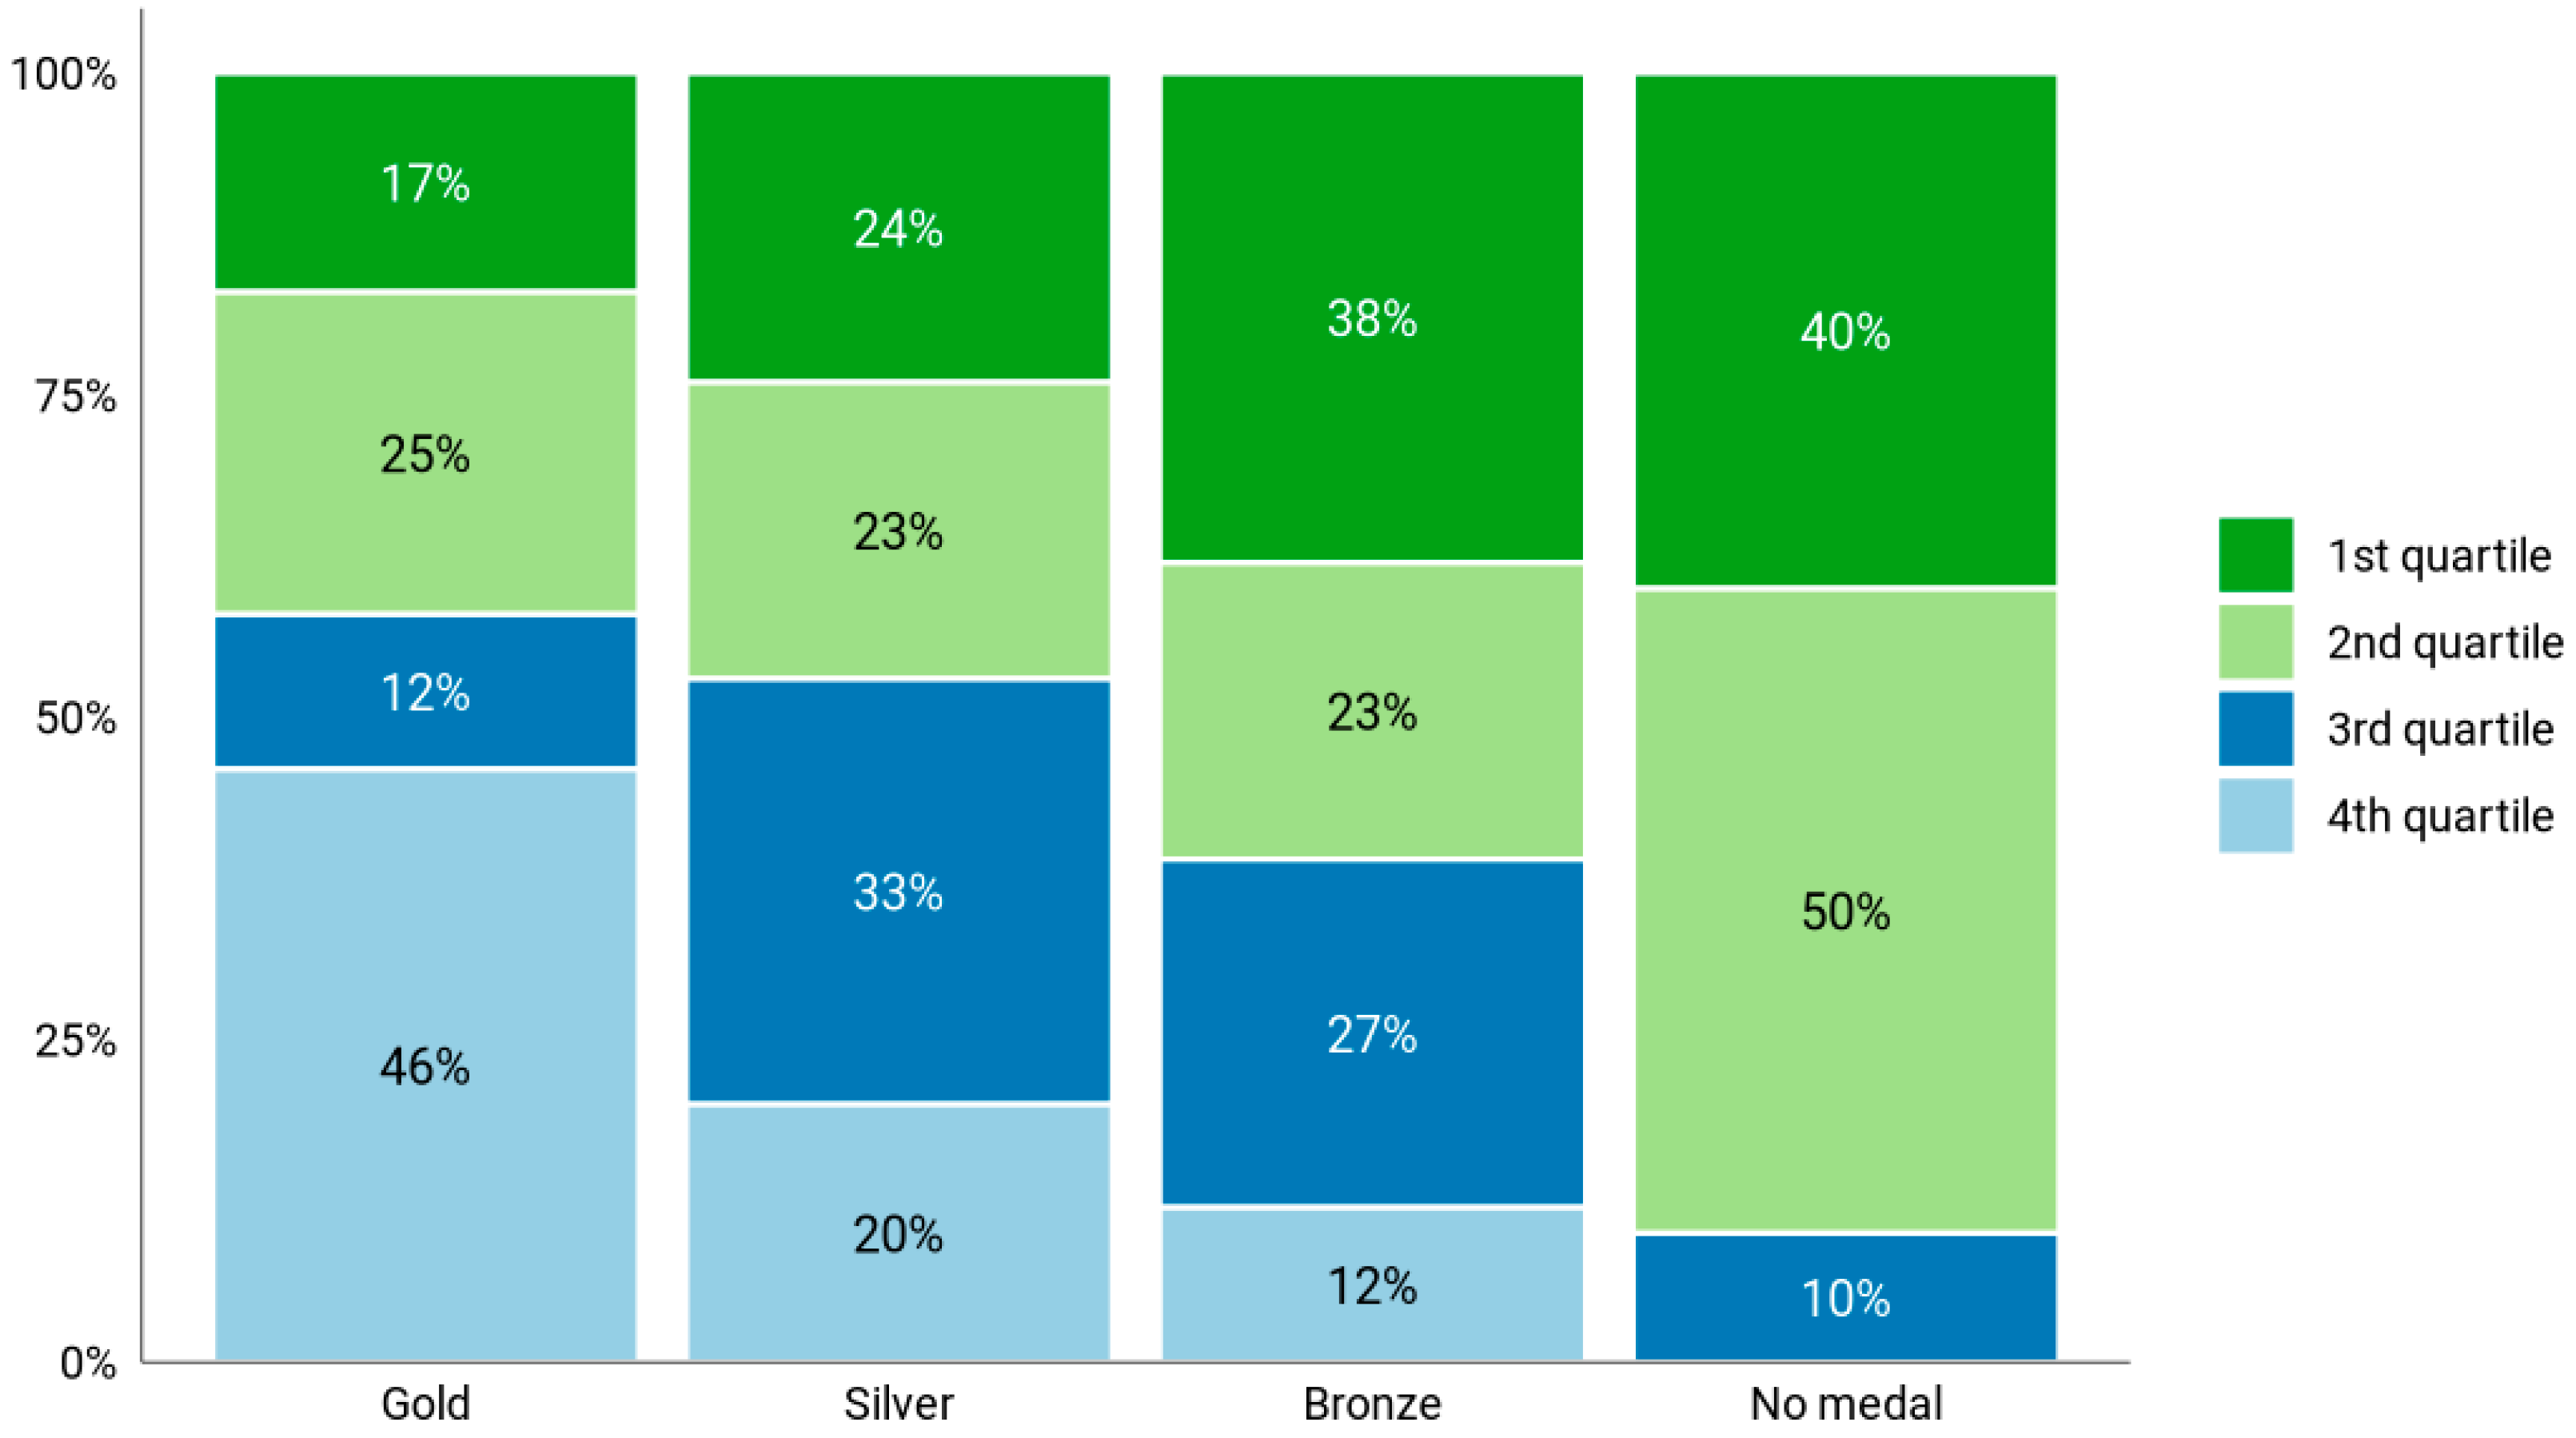
However, these averages might hide significant differences between farmers within each medal category. We, therefore, created a comprehensive sustainability score, divided the sample of farmers into quartiles by this sustainability score, and calculated the percentage of each quartile by medal category.
Figure 4 shows the results of this exercise. On the one hand, we can see that, as expected, the higher the medal, the larger the percentage in the fourth quartile and the lower the percentage in the first quartile. For instance, almost half of the gold medal farmers rank among the highest 25% of the comprehensive sustainability score. On the other hand, the correlation is by no means perfect. We can also see that 42% of the gold medal farmers (17% + 25%) perform below the average sustainability score of the entire sample.
5. Conclusions and Discussion
The environmental and climate challenges that Europe is facing have prompted the EU to stimulate a more sustainable livestock sector. The introduction of the eco-scheme under the EU Common Agricultural Policy (CAP) in 2023 is a manifestation of this movement. We show that the eco-scheme has changed the financial landscape for Dutch dairy farmers. In recent years, fewer grants have been awarded for BISS and more for sustainable farming practices. Our analysis shows that higher medals—and, thus, higher grant funding per hectare—are awarded more often to dairy farmers who score better on most of the sustainability indicators. Simultaneously, a considerable percentage of dairy farmers benefited financially from the eco-scheme but had relatively low sustainability scores.
There may be different reasons why farmers with higher medals do not always perform well on the sustainability indicators. First, we show the sustainability performance of farmers
before the introduction of the eco-scheme and, hence, who the recipients of the eco-scheme grants are. It is possible that with the introduction of the eco-scheme, farmers changed their practices and, over time, will become more sustainable. Moreover, the activities within the eco-scheme may not
cause higher performance on the sustainability indicators. When more multiyear data become available, this would be an interesting avenue for further study, potentially in combination with some case studies to reveal the link between activities and sustainability indicators in practice, especially since the Dutch eco-scheme reimburses farmers for the
activities that they undertake and not for the
impact those activities have on the environment. In this paper, we provide information on potential selection mechanisms in the eco-scheme that are necessary to evaluate these causal effects. The eco-scheme plan does not elaborate on how the activities translate into improved performance on sustainability. Future agricultural policies could benefit from strengthening the link between the activities for which farmers receive grants and the final goal of improved sustainability. Lastly, the indicators might not capture all aspects of sustainable farming. The Dutch eco-scheme plan does not include indicators of how to measure sustainability, and a uniform definition of sustainable farming is also lacking in The Netherlands. We made use of the well-known FADN data, but consensus on a uniform yardstick that enables unambiguous key performance indicators for sustainability would foster national and international discussions and comparisons. The literature also shows that there has long been a need for a uniform definition, but one does not currently exist [
7,
22].
Another finding of this paper is that larger farms receive relatively more grant funding per hectare from the eco-scheme than smaller farms. This is in line with earlier studies that show a similar positive relationship between farm size and payments received with previous CAPs [
7]. This relationship may stimulate the intensification of farms, which in the past has had a large and often negative impact on the sustainability of the livestock sector [
7]. The eco-schemes are meant to be less susceptible to this problem. However, our findings show that the Dutch eco-schemes still favour larger farms. In this context, this seems to be mainly driven by the type of eco-scheme activities that are included. Many of them have an element of economies of scale, which makes them more feasible to be implemented by larger farms. Hence, when designing future policies, it is advised to take these (unintended) consequences into account when selecting agricultural activities.
The research for this paper has some limitations. First, the analysis linking the eco-schemes medals to the sustainability indicators is based on a sample of farmers who participate in the FADN. The FADN data include a sample of Dutch farmers with a standard output above EUR 25,000. Small farms that fall below this threshold are not included in the data, and hence, the results may differ for this minor group, which amounts to less than 0.5% of the total production capacity in The Netherlands. Another limitation of the FADN data is that there might be a selection bias in which farmers are willing to participate. It is reassuring that the FADN sample is representative of the target population based on the acreage and standard output per farm [
21]. With regard to the eco-scheme medals, we observe that, compared to the entire population, the percentage of dairy farmers with a gold medal in the FADN data is a bit higher. This could indicate that more sustainable farms are more likely to participate in the FADN data. However, because we compare the differences in the sustainability indicators and score
relative to the other medal categories within the FADN data, this does not threaten the internal validity of our results. Lastly, our study focuses on the Dutch context only, whereas each EU member state has implemented eco-schemes. A suggestion for future research is, therefore, to perform similar analyses of eco-schemes in other EU member states to see if the results are comparable: does it also hold for other member states that farmers who score higher on sustainability indicators benefit most from eco-schemes? If so, this would be a first vindication that eco-schemes meet the ambitions of the CAP 2023-2027. If not, it could be the start of policy decision-making to adapt eco-schemes so as to meet the CAP 2023-2027 ambitions.


