
Carbon Emission Reduction Effects of Government Talent Attraction Policies: Evidence from Fujian Province, China


Abstract
1. Introduction
2. Literature Review
3. Research Design
3.1. Econometric Model
3.2. Variable Construction
3.2.1. Dependent Variable: County-Level Carbon Emissions
3.2.2. Independent Variable: Government Talent Attraction Policies
3.2.3. Control Variables
3.3. Data Sources and Sample Selection
4. Empirical Analysis
4.1. Benchmark Regression Results
4.2. Validity Tests for Time-Varying DID Model
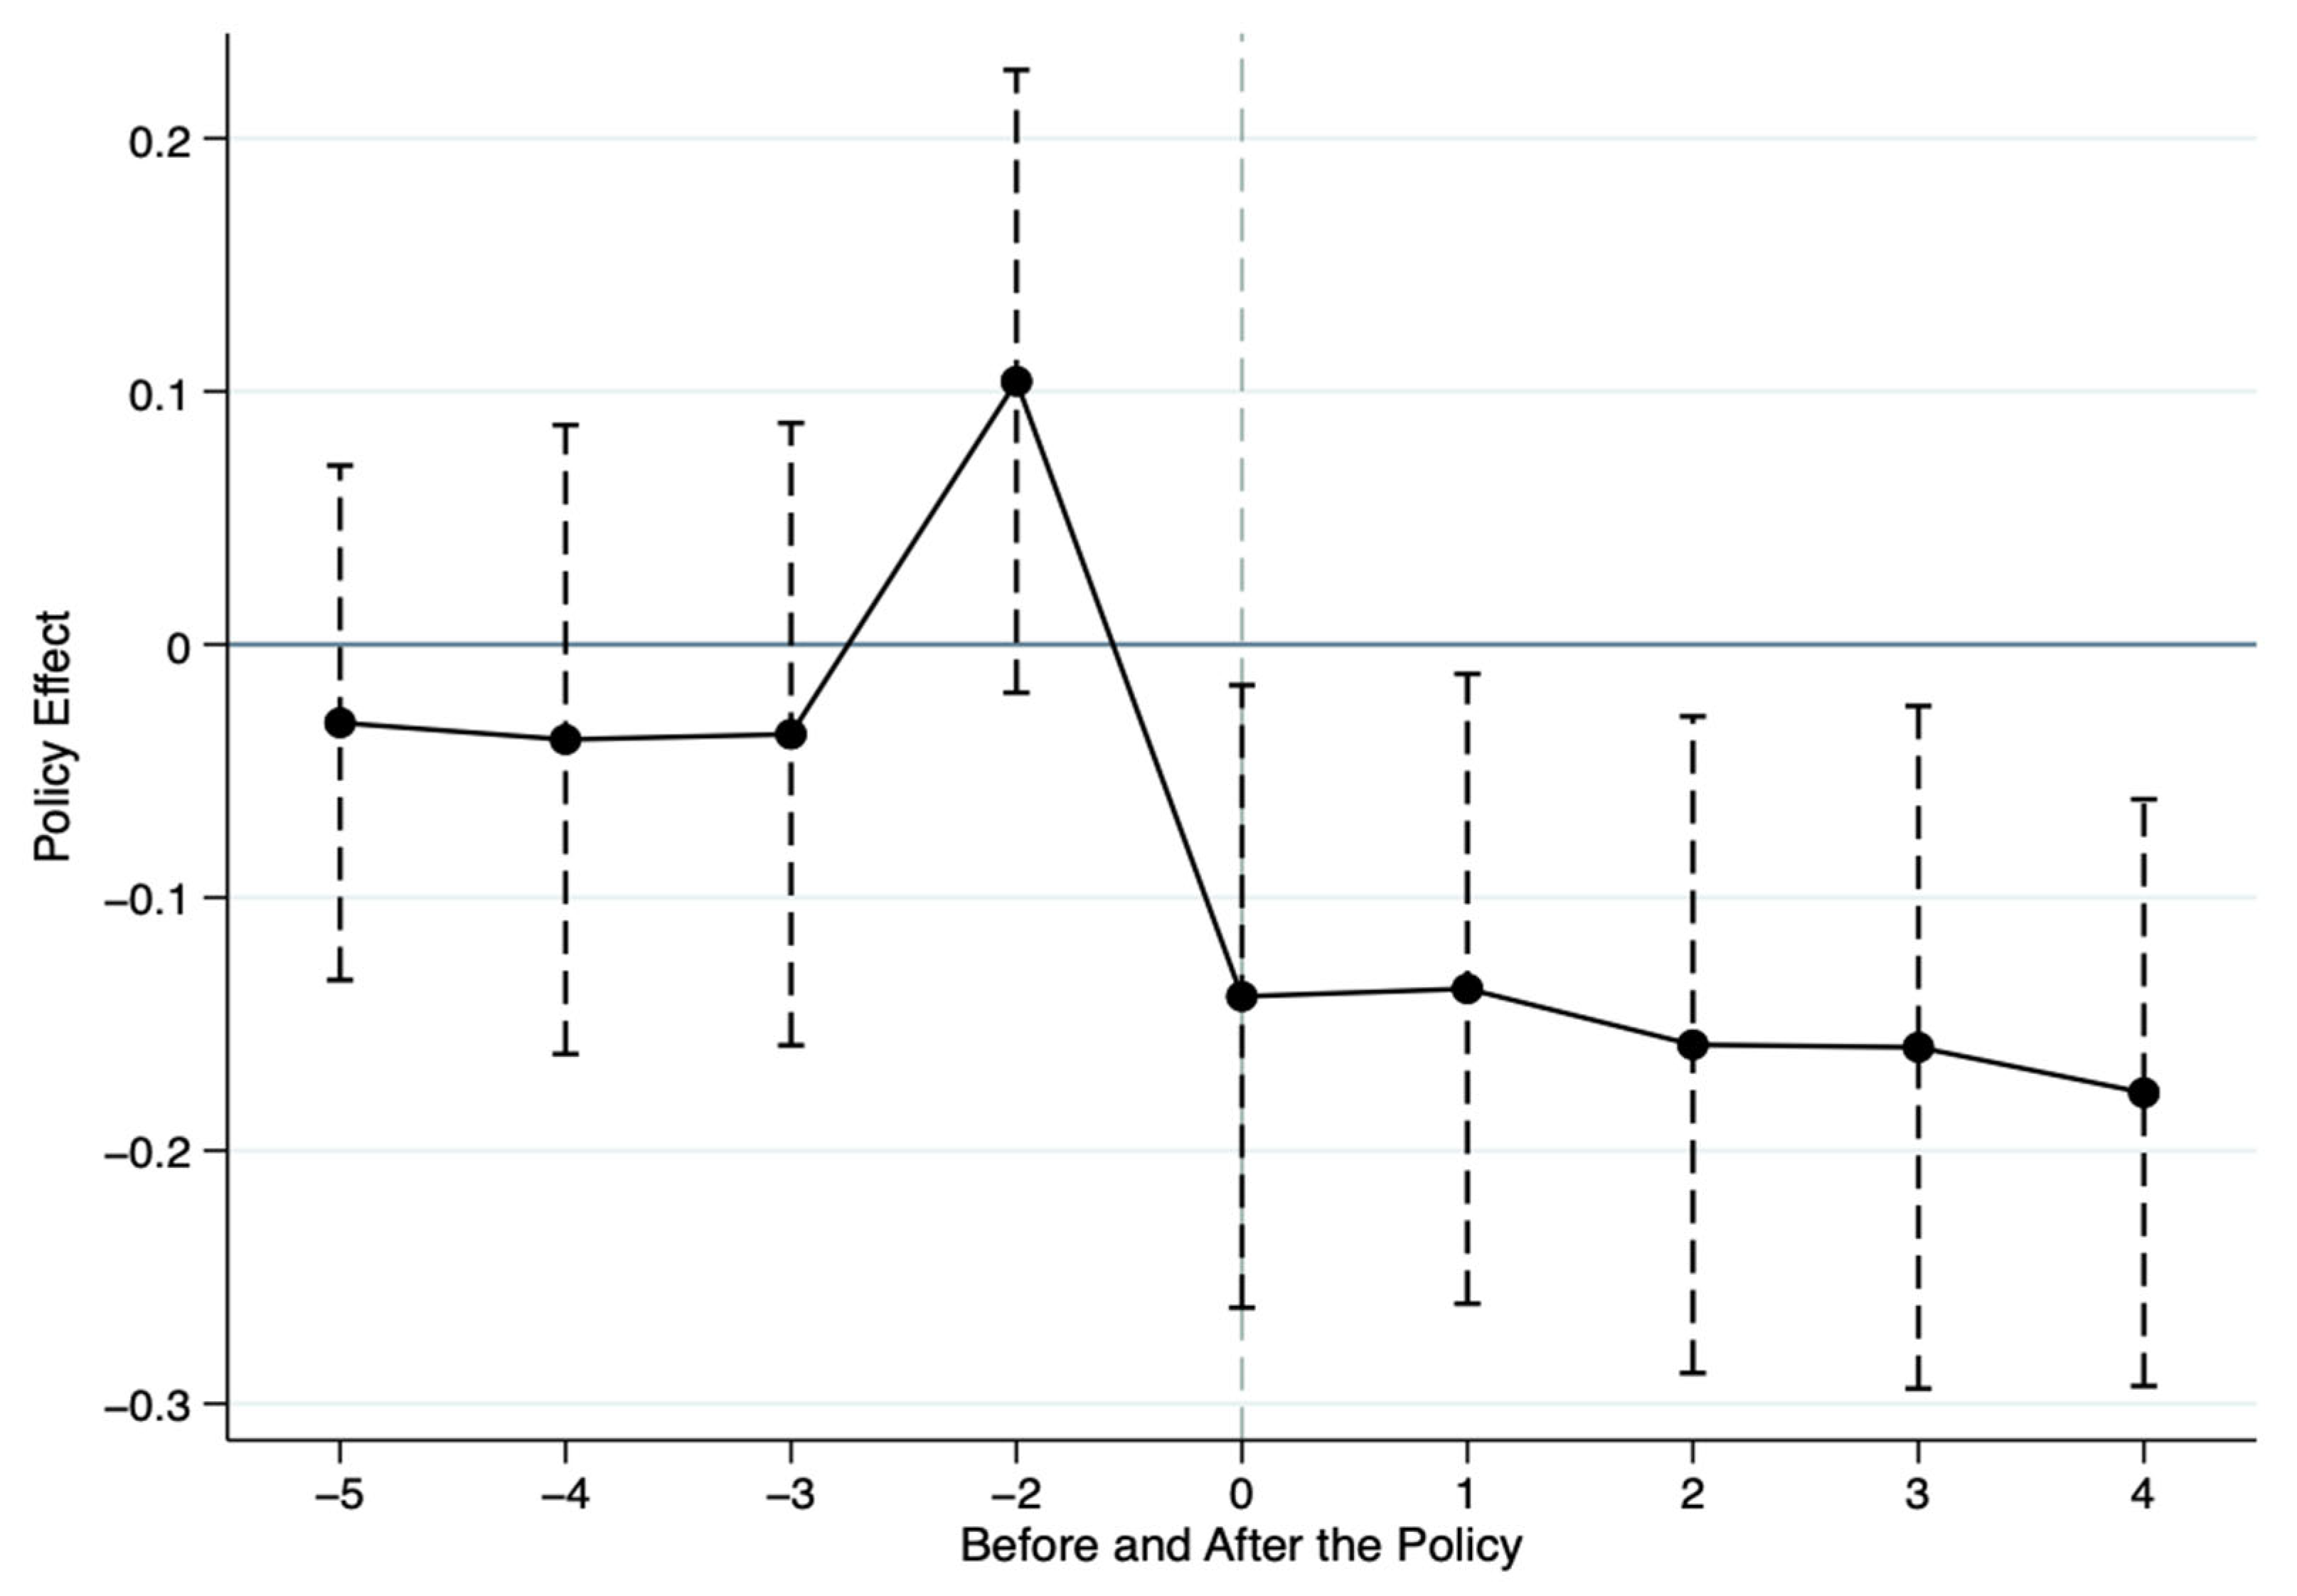
4.2.1. Parallel Trend Test
4.2.2. Placebo Test
4.2.3. Goodman–Bacon Decomposition
4.3. Robustness Checks
4.3.1. Propensity SCORE Matching Estimation (PSM-DID)
4.3.2. Exclusion of Other Policy Impacts
4.3.3. Joint Fixed Effects Control
4.3.4. Substitution of Dependent Variables
4.3.5. Alteration of POLICY Implementation Timeline
4.4. Mechanism Analysis
4.5. Heterogeneity Analysis
4.5.1. Heterogeneity by County Type
4.5.2. Heterogeneity by Economic Development Level
4.6. Extended Analysis
5. Discussion
5.1. Benchmark Regression Interpretation
5.2. Robustness and Validity Assessment
5.3. Mechanism Analysis: Green Technological Innovation
5.4. Heterogeneity of Policy Impact
5.5. Interaction Effects: Administrative Units and Public Awareness
5.6. Policy Implications
6. Conclusions
Author Contributions
Funding
Data Availability Statement
Conflicts of Interest
References
- Li, H.; Zhou, L.-A. Political turnover and economic performance: The incentive role of personnel control in China. J. Public Econ. 2005, 89, 1743–1762. [Google Scholar] [CrossRef]
- Yang, H.; Luo, D.; Chen, S. Resource endowment, Cadre Rotation and economic growth. J. Manag. World 2010, 5, 17–26. [Google Scholar]
- Xu, W.; Chen, D.; Liu, L.; Liang, S. Lessons from Industrial Structure Adjustment: Evidence from Cross-Regional Official Transfers. J. World Econ. 2023, 46, 79–102. [Google Scholar]
- Xu, L.; Wang, W. Provincial “Political CEOs” and Local Economic Growth: Are Businessmen More Likely to Be Promoted? J. Manag. World 2016, 1, 29–43. [Google Scholar]
- Jiang, D.; Jiang, G.; Dong, H. Promotion of Local Officials and Economic Efficiency: An Empirical Study Based on Performance Evaluation and Cadre Heterogeneity. China Ind. Econ. 2015, 10, 21–36. [Google Scholar]
- Lin, Y. Demystifying the Chinese Economy; Peking University Press: Beijing, China, 2018. [Google Scholar]
- Xu, X.; Wang, X.; Shu, Y. Local Officials and Economic Growth: Evidence from Cross-Provincial Transfers of Governors and Party Secretaries. Econ. Res. J. 2007, 9, 18–31. [Google Scholar]
- Du, X.; Zeng, Q.; Wu, J. Cadre Experience, Economic Growth, and Political Promotion: Evidence from Chinese Provincial Officials (1978–2008). J. Financ. Res. 2012, 2, 30–47. [Google Scholar]
- Fan, Z.; Li, X. Political Connections of Ministers and the Distribution of Fiscal Transfers. Econ. Res. J. 2014, 49, 129–141. [Google Scholar]
- Xu, Y.; Ma, G. Local Government Official Turnover and Overcapacity of Enterprises. Econ. Res. J. 2019, 54, 29–145. [Google Scholar]
- Eaton, S.; Kostka, G. Authoritarian environmentalism undermined? Local leaders’ time horizons and environmental policy implementation in China. China Q. 2014, 218, 359–380. [Google Scholar] [CrossRef]
- Piotroski, J.D.; Zhang, T. Politicians and the IPO decision: The impact of impending political promotions on IPO activity in China. J. Financ. Econ. 2014, 111, 111–136. [Google Scholar] [CrossRef]
- Gan, C.; Zou, J.; Wang, J. Local Officials’ Tenure, Firms’ Resource Acquisition, and Overcapacity. China Ind. Econ. 2015, 3, 44–56. [Google Scholar]
- Qian, X.; Cao, Y. Money Follows the Official: Local Cadres and Interregional Capital Flows. Econ. Res. J. 2017, 52, 156–170. [Google Scholar]
- Zhang, J.; Gao, Y. Officials’ Tenure, Cross-Regional Rotation, and Economic Growth: Evidence from Provincial Data. Econ. Res. J. 2007, 11, 91–103. [Google Scholar]
- Xu, X.; Li, S. Officials’ Hometown Preferences: A Resource Transfer Perspective. Econ. Res. J. 2019, 54, 111–126. [Google Scholar]
- Zhao, Y.; Luo, Y. Central Performance Appraisal and Local Livelihood Governance: Conforming or Standing Still? J. World Econ. 2022, 45, 185–211. [Google Scholar]
- Zhou, B.; Zhang, C.; Song, H.; Wang, Q. How does emission trading reduce China’s carbon intensity? An exploration using a decomposition and difference-in-differences approach. Sci. Total Environ. 2019, 676, 514–523. [Google Scholar]
- Wu, Y.; Qi, J.; Xian, Q.; Chen, J. Carbon Reduction Effects of China’s Carbon Market: From the Perspective of Synergy between Market Mechanisms and Administrative Interventions. China Ind. Econ. 2021, 8, 114–132. [Google Scholar]
- Moser, P.; Voena, A.; Waldinger, F. German Jewish émigrés and U.S. invention. Am. Econ. Rev. 2014, 104, 3222–3255. [Google Scholar] [CrossRef]
- Zhong, T.; Luo, J.; Wang, C. Do Local Government Talent Introduction Policies Promote Regional Innovation? Evidence from a Quasi-Natural Experiment. J. Financ. Res. 2021, 5, 135–152. [Google Scholar]
- Shao, S.; Fan, M.; Yang, L. Economic Restructuring, Green Technological Progress, and China’s Low-Carbon Transition: An Empirical Study from the Perspectives of Overall Technology Frontier and Spatial Spillovers. Econ. Res. J. 2022, 38, 46–69+4–10. [Google Scholar]
- Shi, D.; Li, P. Evolution and Current Evaluation of China’s Industrial Development Quality Over 70 Years. China Ind. Econ. 2019, 9, 5–23. [Google Scholar]
- Xiong, G.; Fang, F. Does Low-Carbon City Construction Improve Green Total Factor Productivity? Empirical Evidence from 278 Prefecture-Level Cities. Fujian Trib. Humanit. Soc. Sci. 2022, 12, 101–114. [Google Scholar]
- Barney, J.B. Firm resources and sustained competitive advantage. J. Manag. 1991, 17, 99–120. [Google Scholar] [CrossRef]
- Xiang, Q.; Wang, W. China’s Energy Structure Adjustment and Its Energy-Saving and Emission Reduction Potential. Res. Econ. Manag. 2014, 7, 13–22. [Google Scholar]
- Angrist, J.D.; Pischke, J.S. Mostly Harmless Econometrics: An Empiricist’s Companion; Princeton University Press: Princeton, NJ, USA, 2009. [Google Scholar]
- Shao, S.; Zhang, K.; Dou, J. The Energy-Saving and Emission-Reduction Effect of Economic Agglomeration: Theory and Chinese Evidence. J. Manag. World 2019, 35, 36–60+226. [Google Scholar]
- Zhang, R.; Zhong, C. Smart City Pilots, Pollution Proximity Transfer, and Green Low-Carbon Development: New Evidence from Chinese Counties. China Popul. Resour. Environ. 2022, 32, 91–104. [Google Scholar]
- Beck, T.; Levine, R.; Levkov, A. Big bad banks? The winners and losers from bank deregulation in the United States. J. Financ. 2010, 65, 1637–1667. [Google Scholar] [CrossRef]
- Goodman-Bacon, A. Difference-in-differences with variation in treatment timing. J. Econ. 2021, 225, 254–277. [Google Scholar] [CrossRef]
- Liu, R.; Li, L.; Kang, Y.; Zhao, Y. Scenic Spot Ratings, Government Public Service Supply, and Regional Tourism Economic Development. China Ind. Econ. 2018, 2, 118–136. [Google Scholar]
- Jiang, T. Mediating and Moderating Effects in Empirical Causal Inference Research. China Ind. Econ. 2022, 5, 100–120. [Google Scholar]
- Tan, Z. The Carbon Emission Reduction Effect of Natural Resource Asset Audits upon Official Departure. Contemp. Financ. Econ. 2023, 10, 145–156. [Google Scholar]


| Year | Authors | Brief Description of Research Content | Summary of Research Conclusions |
|---|---|---|---|
| 2023 | Xu et al. [3] | Studied whether the industrial structure experience of officials from their previous posts affects the product structure adjustment paths of enterprises in their current jurisdictions after cross-regional transfer. | Official transfers lead to convergence in the product structure of enterprises in the current jurisdiction with that of their previous jurisdiction. This trend is significantly influenced by characteristics such as the economic development level, tenure length, and typicality of the officials’ previous posts, reflecting a path dependence in industrial policies. |
| 2016 | Xu & Wang [4] | Investigated whether local officials with corporate executive experience (“political CEOs”) can more effectively promote economic growth, and explored their functional pathways. | Officials with market-oriented enterprise experience significantly boost local economic growth, with longer tenures enhancing this effect. The mechanisms involve management capabilities, knowledge structure, and social capital. |
| 2007 | Xu et al. [7] | Constructed a panel dataset on cross-regional exchanges of provincial officials and empirically tested its impact on economic growth in the receiving regions. | Cross-regional exchange of provincial governors can significantly increase the GDP growth rate in the receiving regions by approximately 1 percentage point, with the mechanism primarily achieved through promoting the development of the secondary industry and driving industrial structural adjustment. |
| 2012 | Du et al. [8] | Developed an “official experience index” to explore the relative roles of provincial officials’ career resumes and economic growth in political promotion. | Official promotion is influenced by both their economic performance and experience background, with experiential qualifications (especially central government or enterprise backgrounds) showing stronger explanatory power in promotion. |
| 2014 | Fan & Li [9] | Based on a quasi-natural experiment of ministerial replacements, used the difference-in-differences method to study the impact of political connections on fiscal transfers to the ministers’ home regions. | The appointment of new ministers significantly increases special transfer payments to their home regions, with this effect exhibiting a non-linear “inverted U-shaped” pattern. |
| 2019 | Xu & Ma [10] | Using enterprise capacity utilization data, examined whether changes in municipal party secretaries lead to excess capacity behavior driven by performance evaluation. | Official turnover exacerbates excess capacity among local enterprises, particularly during non-routine leadership transitions, with land and financial resource allocation identified as key intervention tools. |
| 2014 | Eaton & Kostka [11] | Based on field research in multiple Chinese regions, analyzed the impact of high-frequency local official turnover on the effectiveness of environmental policy implementation. | Short official tenures weaken their motivation for environmental protection, leading to low-quality, low-cost policy implementation methods, thereby reducing the overall effectiveness of environmental governance. |
| 2014 | Piotroski & Zhang [12] | Explored the influence of local officials’ promotion incentives on the timing of enterprises’ initial public offerings (IPOs). | Officials’ promotion expectations significantly drive an early surge in IPO activities within their jurisdictions, but such IPO enterprises generally perform poorly in financial metrics and long-term returns, reflecting market distortions caused by performance pressure. |
| 2015 | Gan et al. [13] | Using enterprise data, analyzed how officials incentivize enterprise expansion through resource allocation (e.g., land and financing) during their term-end periods. | To pursue political performance, officials at the end of their terms tend to provide preferential resources to enterprises, leading to a decline in enterprise capacity utilization—with state-owned enterprises benefiting most notably. |
| 2017 | Qian & Cao [14] | Based on payment system data, examined whether capital flows during local officials’ tenures exhibit regional preferences. | A distinct “money follows officials” effect exists, with capital flowing more to officials’ birthplaces and original regions during their tenures. |
| 2007 | Zhang & Gao [15] | Using 1978–2004 provincial panel data, analyzed the mechanisms through which official tenure length and cross-regional exchanges affect economic growth. | Official tenure and economic growth show an “inverted U-shaped” relationship, with cross-regional exchanges exerting a stronger positive effect on economic growth in eastern regions. |
| 2019 | Xu & Li [16] | Aggregated manufacturing enterprise capital data to the county level to study whether officials prefer allocating resources to their hometowns. | During officials’ tenures, manufacturing capital and enterprise numbers in their hometown counties grow significantly, alongside notable regional economic growth, reflecting hometown preference behavior. |
| 2022 | Zhao & Luo [17] | Used a multi-period difference-in-differences method to evaluate the impact of central performance evaluation mechanism adjustments on local governments’ expenditures in people’s livelihood areas. | Reforms to performance evaluation mechanisms effectively enhance local officials’ emphasis on education, healthcare, and other livelihood investments, weakening the “tournament-style” behavior of purely pursuing GDP. |
| Variables | Symbol | Measurement | Average Value | Standard Deviation |
|---|---|---|---|---|
| Carbon intensity | CO2 | total CO2 emissions/real regional GDP | 8.900 | 1.132 |
| Government talent attraction policies | TALENT | districts and counties that have implemented the policy are assigned a value of 1, while those that have not are assigned a value of 0. | 0.133 | 0.339 |
| Production level of enterprises | PE | number of industrial enterprises with annual revenue of more than 20 million yuan | 5.231 | 1.012 |
| Regional population density | PD | total population at the end of the year/area of the administrative region | 6.033 | 1.220 |
| Population size | POP | total regional population at the end of the year | 3.889 | 0.701 |
| Industrial structure | IS | value added of the secondary industry/value added of the tertiary industry at county level | 0.173 | 0.554 |
| Industrial development | ID | value added of the secondary industry/nominal regional GDP | −0.808 | 0.331 |
| Urban–rural income gap | GAP | urban disposable income per capita/rural disposable income per capita | 1.100 | 0.369 |
| Internal openness | OPEN | total retail sales of consumer goods/real regional GDP | −1.076 | 0.385 |
| Variables | CO2 | |||
|---|---|---|---|---|
| (1) | (2) | (3) | (4) | |
| TALENT | −0.1469 *** (0.0300) | −0.1576 *** (0.0304) | −0.1253 *** (0.0310) | −0.1225 *** (0.0306) |
| PE | −0.1333 *** (0.0244) | −0.1253 *** (0.0310) | −0.1003 *** (0.0249) | |
| PD | −0.0745 (0.0817) | −0.0608 (0.0807) | −0.0517 (0.0797) | |
| POP | 0.0058 (0.1071) | −0.0265 (0.1059) | −0.0490 (0.1047) | |
| IS | −0.3982 *** (0.0609) | −0.2422 *** (0.0640) | ||
| ID | 0.3803 *** (0.0951) | 0.2053 ** (0.0975) | ||
| GAP | 0.0921 (0.0600) | |||
| OPEN | 0.2668 *** (0.0370) | |||
| Constants | 10.0428 *** (0.0854) | 11.1508 *** (0.3821) | 11.5470 *** (0.3895) | 11.5018 *** (0.4067) |
| County FE | Yes | Yes | Yes | Yes |
| Time FE | Yes | Yes | Yes | Yes |
| Observations | 2010 | 2010 | 2010 | 2010 |
| R2 | 0.9286 | 0.9298 | 0.9316 | 0.9335 |
| Variables | CO2 | ||
|---|---|---|---|
| Nearest Neighbor Matching with a Caliper | Kernel Matching | Radius Matching | |
| TALENT | −0.1219 *** (0.0435) | −0.1252 *** (0.0309) | −0.1227 *** (0.0306) |
| Control variables | Yes | Yes | Yes |
| Constant | 12.1022 *** (0.7133) | 11.6618 *** (0.4727) | 11.5227 *** (0.4074) |
| County FE | Yes | Yes | Yes |
| Time FE | Yes | Yes | Yes |
| Observation | 1171 | 1965 | 2008 |
| R2 | 0.9196 | 0.9321 | 0.9336 |
| Variables | CO2 | |||||
|---|---|---|---|---|---|---|
| Exclude Parallel Policies | Joint Fixed Effects | Replace Explained Variables | Change Policy Time | |||
| (1) | (2) | PCO2 (3) | TCO2 (4) | AD3 (5) | AD4 (6) | |
| TALENT | −0.1033 *** (0.0309) | −0.0672 ** (0.0329) | −0.4411 ** (0.1774) | −0.2628 *** (0.0954) | −0.0599 (0.0710) | −0.0442 (0.0662) |
| Control variables | Yes | Yes | Yes | Yes | Yes | Yes |
| Constant | 11.9772 *** (0.4271) | 11.4475 *** (0.4155) | 9.3421 *** (2.3603) | 2.2522 * (1.2699) | 11.3322 *** (0.5791) | 11.2904 *** (0.5654) |
| County FE | Yes | Yes | Yes | Yes | Yes | Yes |
| Time FE | Yes | Yes | Yes | Yes | Yes | Yes |
| Province × year joint fixed effects | No | Yes | No | No | No | No |
| Observation | 2010 | 2010 | 2010 | 2010 | 2010 | 2010 |
| R2 | 0.9343 | 0.9353 | 0.9633 | 0.9703 | 0.9331 | 0.9330 |
| Variables | (1) | (2) |
|---|---|---|
| TALENT | 0.7345 *** (0.1376) | 0.5289 *** (0.1426) |
| Control variables | No | Yes |
| Constant | 4.9067 *** (0.3914) | 9.7793 *** (1.8973) |
| County FE | Yes | Yes |
| Time FE | Yes | Yes |
| Observation | 2010 | 2010 |
| R2 | 0.6932 | 0.7042 |
| Variables | County Type | Economic Development | ||
|---|---|---|---|---|
| (1) Resource-Based | (2) Non-Resource-Based | (3) Low | (4) High | |
| TALENT | 0.0073 (0.0346) | −0.2088 *** (0.0442) | −0.0666 (0.0558) | −0.1392 *** (0.0376) |
| Control variables | Yes | Yes | Yes | Yes |
| Constant | 12.9823 *** (0.8350) | 11.4829 *** (0.5297) | 11.5490 *** (0.8496) | 12.4205 *** (0.5103) |
| County FE | Yes | Yes | Yes | Yes |
| Time FE | Yes | Yes | Yes | Yes |
| Observation | 660 | 1350 | 1166 | 844 |
| R2 | 0.9592 | 0.9203 | 0.9048 | 0.9690 |
| p value tested by Talent coefficient group difference | 0.026 ** | 0.074 * | ||
| Variables | (1) | (2) |
|---|---|---|
| TALENT | 0.0966 (0.0911) | −0.1234 *** (0.0305) |
| RANK | −1.9826 *** (0.3008) | |
| TALENT × RANK | −0.3889 *** (0.1098) | |
| PUBLIC | 0.0911 (0.3638) | |
| TALENT × PUBLIC | −0.1166 *** (0.0377) | |
| Control variables | Yes | Yes |
| Constants | 12.2586 *** (0.6381) | 2.3410 *** (0.4953) |
| County FE | Yes | Yes |
| Time FE | Yes | Yes |
| Observations | 1365 | 2010 |
| R2 | 0.9268 | 0.9339 |
Disclaimer/Publisher’s Note: The statements, opinions and data contained in all publications are solely those of the individual author(s) and contributor(s) and not of MDPI and/or the editor(s). MDPI and/or the editor(s) disclaim responsibility for any injury to people or property resulting from any ideas, methods, instructions or products referred to in the content. |
© 2025 by the authors. Licensee MDPI, Basel, Switzerland. This article is an open access article distributed under the terms and conditions of the Creative Commons Attribution (CC BY) license (https://creativecommons.org/licenses/by/4.0/).
Share and Cite
Ou, Y.; Li, H.; Long, H. Carbon Emission Reduction Effects of Government Talent Attraction Policies: Evidence from Fujian Province, China. Sustainability 2025, 17, 5159. https://doi.org/10.3390/su17115159
Ou Y, Li H, Long H. Carbon Emission Reduction Effects of Government Talent Attraction Policies: Evidence from Fujian Province, China. Sustainability. 2025; 17(11):5159. https://doi.org/10.3390/su17115159
Chicago/Turabian StyleOu, Yangting, Haixian Li, and Houyin Long. 2025. "Carbon Emission Reduction Effects of Government Talent Attraction Policies: Evidence from Fujian Province, China" Sustainability 17, no. 11: 5159. https://doi.org/10.3390/su17115159
APA StyleOu, Y., Li, H., & Long, H. (2025). Carbon Emission Reduction Effects of Government Talent Attraction Policies: Evidence from Fujian Province, China. Sustainability, 17(11), 5159. https://doi.org/10.3390/su17115159