Article

Assessing Benefits and Risks of Urban and Peri-Urban Agriculture (UPA): A Spatial Approach

Interuniversity Department of Regional and Urban Studies and Planning (DIST), Politecnico di Torino, Viale Mattioli 39, 10125 Torino, Italy
Sustainability 2025, 17(11), 5151; https://doi.org/10.3390/su17115151
Submission received: 29 April 2025 / Revised: 22 May 2025 / Accepted: 28 May 2025 / Published: 4 June 2025

Abstract

:
The benefits and positive effects of urban and peri-urban agriculture (UPA) on different urban dimensions have already been extensively recognized by scholars and practitioners so far. Even possible risks of these professional and non-professional activities have been discussed, especially in the field of landscape ecology and from a social perspective. However, how these benefits are measured, monitored and assessed is still a critical point and a less investigated issue that requires further studies, especially in the research fields that aim to measure and monitor sustainability of urban practices. The evidence on quantitative approaches to estimate benefits and risks of UPA is less advanced than others. This paper aims to define spatial criteria and indicators to evaluate benefits and possible risks of UPA, using the case study of Turin and its bordering municipalities (Italy). Based on the definition and testing of indicators, embracing a spatial approach, this research aims to verify the feasibility of a set of instruments, to define methods and techniques to collect useful data, to test the replicability and transferability of this approach in other urban contexts, as well as to identify its limitations and gaps. Selected indicators showed a good level of versatility and high potential in order to collect information on UPA and its benefits. Furthermore, results of the application on the case study highlighted a significant growth of UPA benefits, especially profit initiatives and the social and economic domains. Finally, the author outlines policy recommendations to improve the evaluation and monitoring of UPA advantages and risks, as well as a possible trajectory for future research.

1. Introduction

Urban and peri-urban agriculture (UPA), both commercial and non-commercial, can contribute significantly to achieving some of the goals of urban agendas and overcome some of the problems of cities and metropolitan areas. The connections between the benefits produced by different forms of UPA and some urban policy issues are as follows: social inclusion; food security; circular economy; climate change adaptation and mitigation; green infrastructure and nature-based solutions; urban development and regeneration; cultural heritage; and well-being and quality of urban environments.
The multiple values of UPA are recognized not only by researchers but also by citizens, farmers, and all those who practice agriculture in the city for different purposes. The multiplicity of benefits of UPA is proven by the literature. There is now a great quantity of scientific evidence produced by research conducted especially in the last decade [1,2,3,4,5]. However, there is limited evidence to what extent and how UPA can contribute to improve sustainability of cities. Some recent studies [1,6,7] have highlighted that science has mainly focused on the perceived and unmeasured benefits so far. In addition, according to Artmann and Sartison [8], many studies were dedicated to a single benefit of UPA or a specific UPA initiative. Still, fewer address the possible risks and disservices produced by UPA initiatives. In general, it can be stated that there are two main approaches in the literature: a limited amount of research that has quantitatively estimated the benefits of UPA and a substantial number of scholars who have collected indicators, including different dimensions of the concept of sustainability.
There are a few studies that evaluate, in quantitative terms, the benefits of UPA. For instance, Haberman et al. [9] defined a performance index and land use-based scenarios to identify possible spaces in order to allocate urban agriculture in Montréal. Thiesen et al. [10] developed a tool for the assessment of performance of urban agroecosystems and tested it in South Florida. Recent research has developed and tested a model and set of indicators to measure the benefits of UPA. It includes urban heat island, runoff prevention, green area accessibility, nitrogen dioxide sequestration, jobs created, and volunteers involved, green per capita and food production indicators [6,11].
Many studies collected indicators. According to the recent literature review carried out by Cassatella and Gottero [1] the majority of evidence focused on environmental and socio-cultural dimensions. References and indicators for the assessment of economic, health, well-being and food domains of UPA are less frequently explored and studied.
For instance, Dumitru and Wendling [12], within a study that collected the results of H2020 projects and European programmes, developed a handbook to assess socio-economic benefits and the impact of NBS on the quality of life, including solutions promoted by UPA practices. Other scholars have identified, collected or promoted indicators related to the possible contribution of UPA in terms of social inclusion, gender equality, education, knowledge and innovation [4,13,14,15]. The reduction in food carbon footprint or urban heat island effects, as well as the improvement of the efficient use of resources, quality and quantity of urban green spaces and urban biodiversity, are evaluative dimensions studied by several scholars [11,14,16,17,18]. The role of UPA in the improvement of food security and quality has been investigated especially by Zasada et al. [19] and Eiter et al. [11], respectively, in projects such as Foodmetres and EdiCitNet.
Although many studies and scholars have identified tools to assess the benefits of UPA, the majority of them have not proven and quantified the value of its positive and negative effects. For these reasons, the potential (and possible) risks of UPA are less obvious to decision-makers and policy-makers at all levels. This paper aims to select (from previous research) and apply a set of indicators in order to guide decision-makers for the implementation of UPA initiatives and maximize the impact of UPA on the sustainability of cities. In addition, this paper aims to verify if these indicators can contribute to the development of methods and tools to assess and monitor benefits and to collect information on UPA. The second section provides the methodological framework on the evaluation of benefits and possible unwanted effects of UPA and identifies a set of indicators. In the third section results are shown with the application of these tools, using the case study of Turin and its bordering municipalities (Italy). The last section presents a discussion of the main results, the methodological limits, and possible field of applications of this approach, as well as a possible trajectory for future research.

2. Materials and Methods

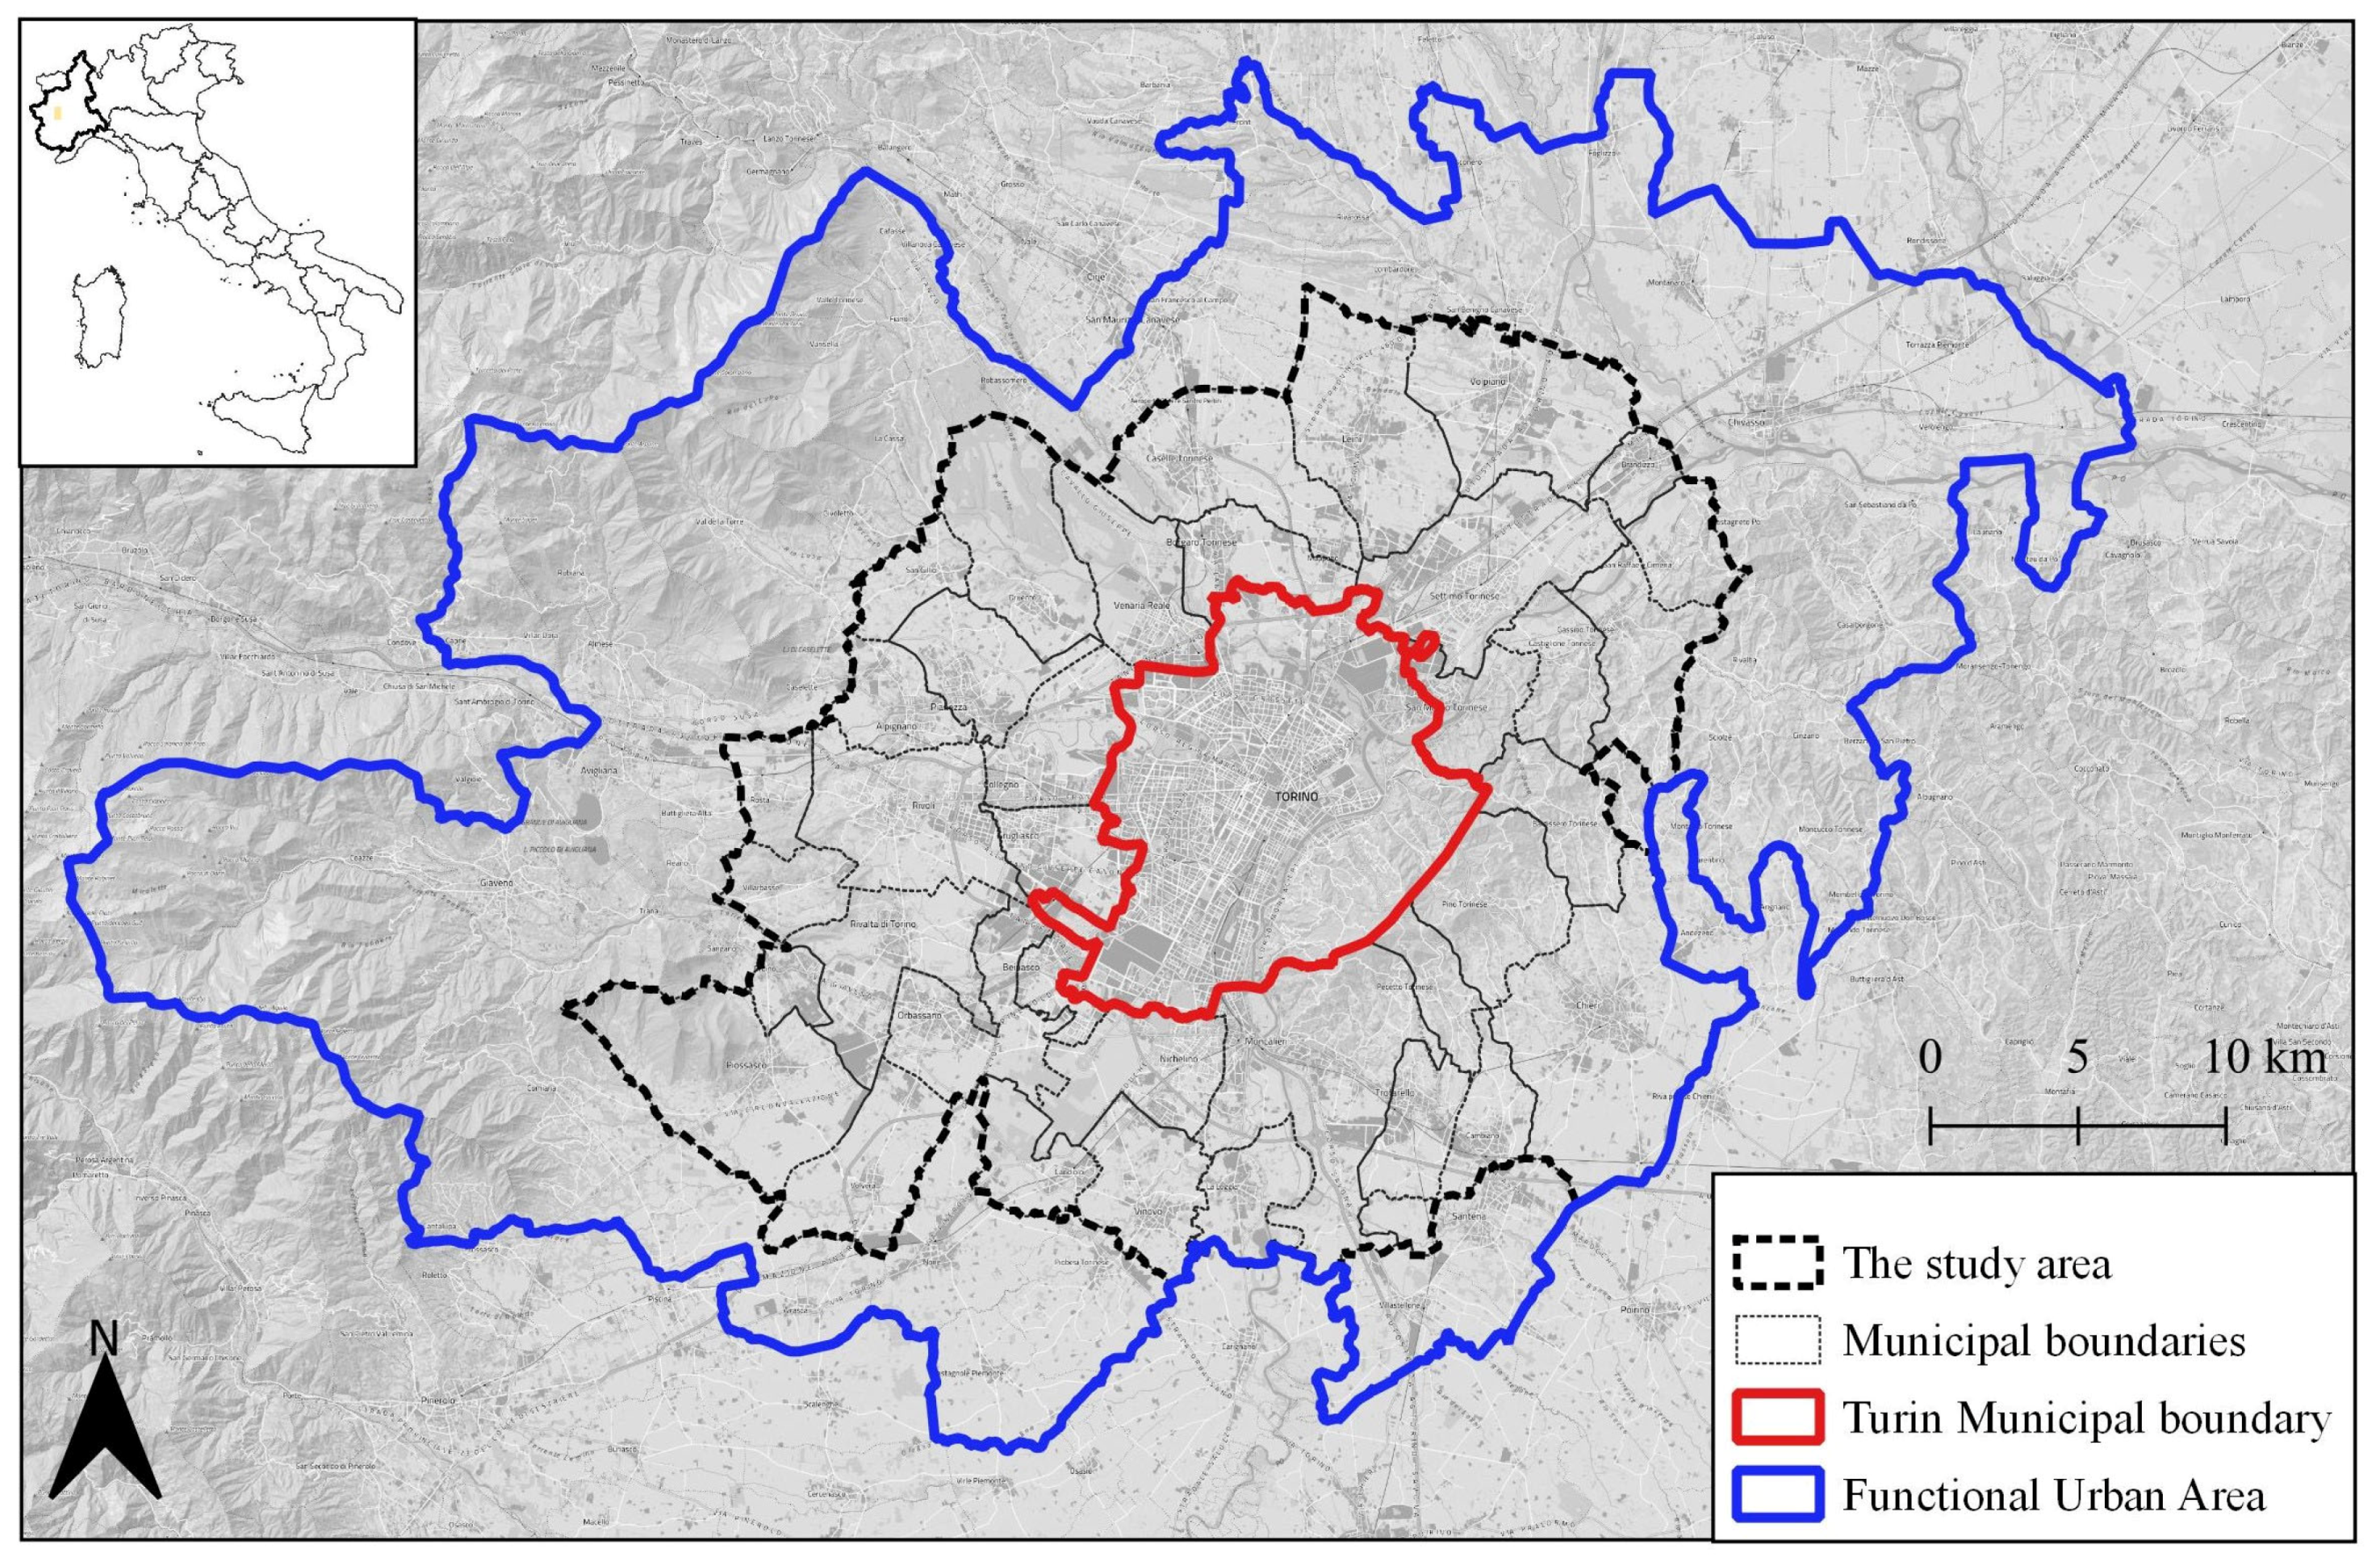
2.1. The Study Area: Turin and Its Closest Municipalities

The study area is located in the Northwest of Italy, in the Piedmont Region. It is included in the larger Turin Metropolitan Area (TMA), an area of approximately 6800 km2 with a population slightly above 2.2 million, of which 850,000 inhabitants live in the City of Turin. The area under analysis coincides with the administrative boundaries of 38 municipalities, with a total surface area of 858.67 km2. According to the Piedmont Farm Register (2023), the number of registered (commercial) farms in this area is approximately 2000 units, while according to Gottero and Cassatella [20] the number of urban gardens (UGs) is around 3800 units. This area includes about 29,000 hectares of utilized agricultural area (UAA), i.e., approximately 30% of the total area (Figure 1).

2.2. The Selected Core Set of Indicators: Criteria and Data Sources

Several studies have collected methods and tools to evaluate positive effects of commercial and non-commercial agriculture in urban and peri-urban areas. One of the most recent research projects, the “European Forum on Urban Agriculture (EFUA)” has collected and classified, through the systematic review of the literature and research projects, over 200 indicators for evaluating the main benefits and possible undesirable effects of UPA. Starting from this overall list, a key set of 16 indicators was selected to represent the most important benefit categories, considering feasibility and applicability of indicators. This set of indicators was classified considering the following five potential dimensions: culture and society; environment and climate; food; health and well-being; and economy [1].
The following sections will refer to this classification in order to verify the feasibility and possible application of these tools on a case-by-case basis, as a sort of spin-off of mentioned research. This set of indicators is primarily designed for decision-makers and includes status and impact indicators, which can be used in both the design and implementation phases. They were selected considering the availability of spatial data, the difficulty in finding and/or building the database for the calculation, as well as possible use for decision-makers. The selected 9 indicators were adapted to the specific context of TMA and covered only main categories of benefits identified by Cassatella and Gottero [1], excluding typologies that required specific data collection surveys (such as health and well-being sphere). Many of these mainly concern status or impact indicators, while others are proxy indicators, i.e., tools to indirectly assess or monitor benefits when main information is not available, or difficult to find or build [21]. In most cases they are suitable for calculation over the entire metropolitan area. In other cases, however, they have been applied to the scale of the city due to the availability or complexity of spatial data. The majority of these indicators concerns the benefits of UPA. However, the possible unwanted effects resulting from the gentrification process that might be produced by UPA initiatives have also been measured (Table 1 and Appendix A). Finally, Table 2 shows the main local data sources used to calculate the indicators.

3. Results

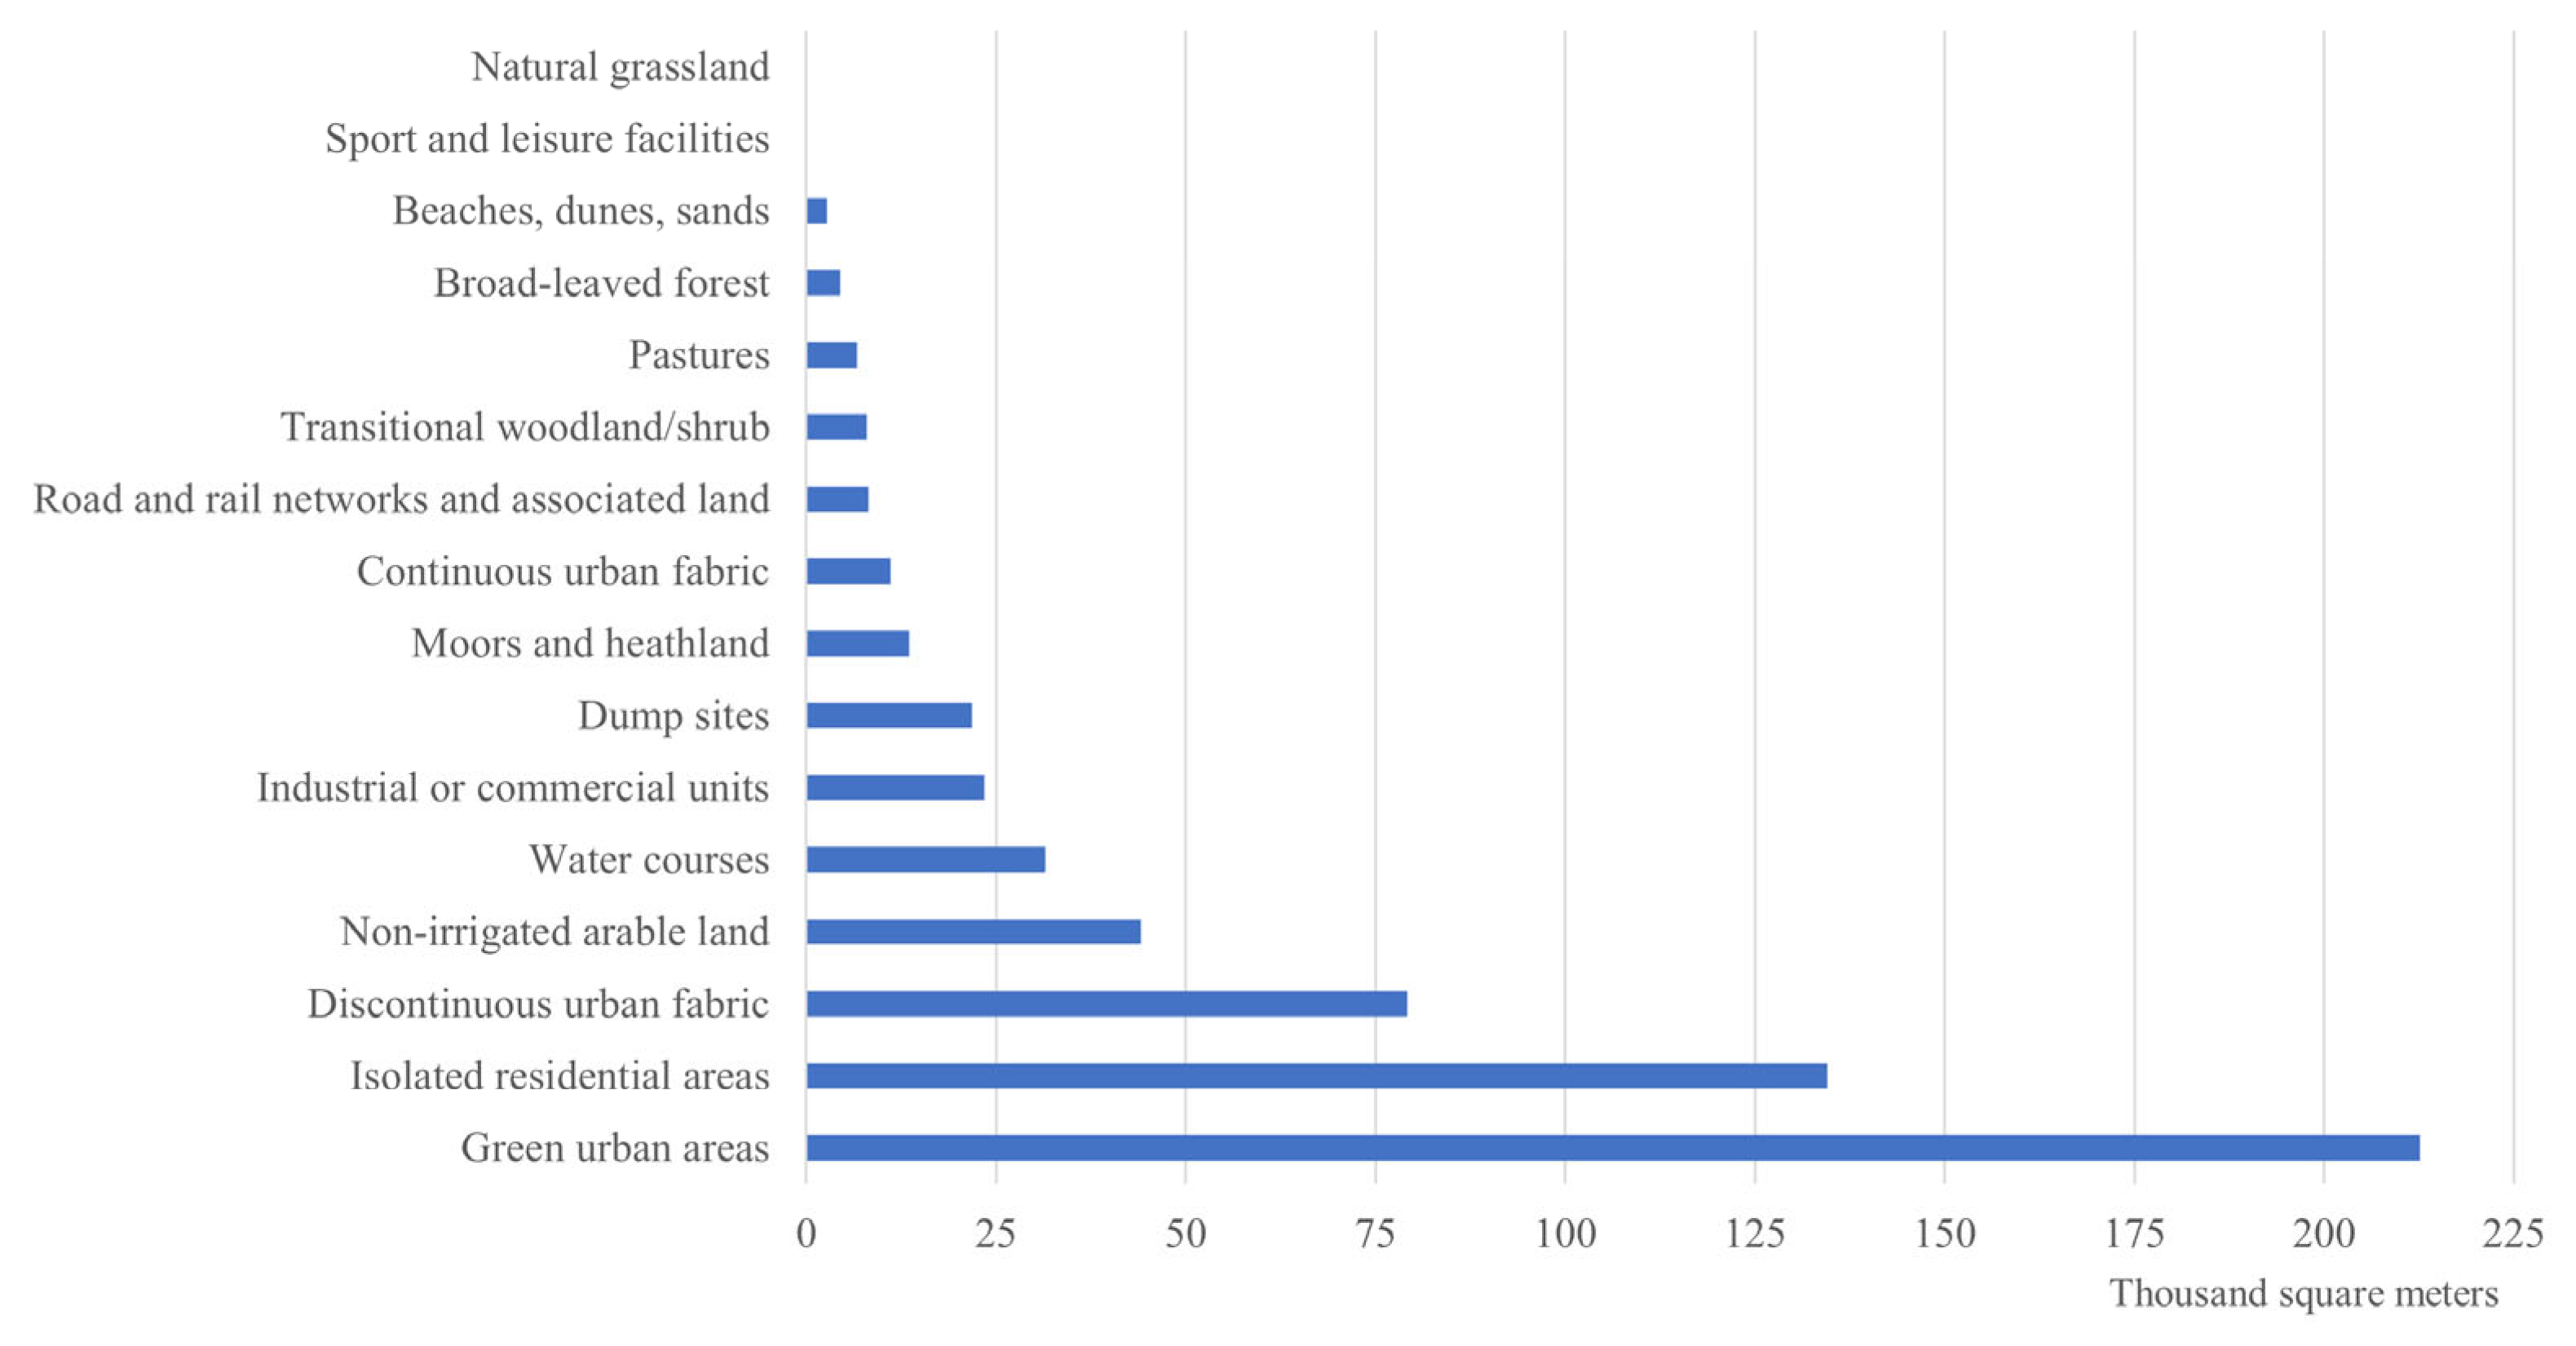
3.1. Spatial Configuration and Land Use

The indicator aims to assess the change in land use over time and the variation in the spatial configuration of the area under consideration. In the Turin case, Figure 2 shows that urban gardens are mostly located to the south, in the area of district 2 (Santa Rita-Mirafiori), and to the northwest, near districts 5 and 6. These are mainly areas of less than one hectare and bottom-up initiatives that have developed spontaneously without formal recognition.
The analysis of land use on a Piedmont Land Cover basis (third level, 2021) also shows that the surface area for non-commercial urban agriculture is mostly classified as urban green areas (public or private) and residential areas (isolated or with discontinuous urban fabric) (Figure 3). Figure 4, on the other hand, shows that more than 50% of allotments are located in public green areas and green areas subject to public use, and about 10% in areas for public services. Less significant are the areas for roads and service areas in transformation areas. With regard to commercial agriculture, according to the AAU register the UAA increased by 3% in the study area in the 2013–2023 decade. There has been a significant increase in arable land (approximately +20%) and forests (+50%), while there has been a significant decrease in permanent meadows and pastures (Figure 5). Finally, it must be considered that the indicator requires the collection and construction of a cartographic base at the level of the individual UPA initiative, also in order to determine the change in the spatial configuration of the area under consideration and to assess the climatic–environmental contribution of the various initiatives.

3.2. Urban Heat Island Effect

The indicator aims to assess the role of the UPA in the change in urban heat island (UHI) impact over time. In this case, the proxy indicator that best represents this phenomenon, also considering the availability of information, is the number of urban gardens in the close proximity of areas with medium or high UHI. Spatial analysis shows that most of the urban gardens are located near to the medium UHI areas (71%), none of them in areas where the heat island effect risk is high (Figure 6). However, it should be considered that the indicator only calculates the spatial proximity between urban gardens and areas with medium/high UHI but is not able to measure the contribution of UPA in terms of reducing the heat island effect. Indeed, the indicator requires the monitoring of individual initiatives and the collection of meteorological data in the areas characterized by these practices.

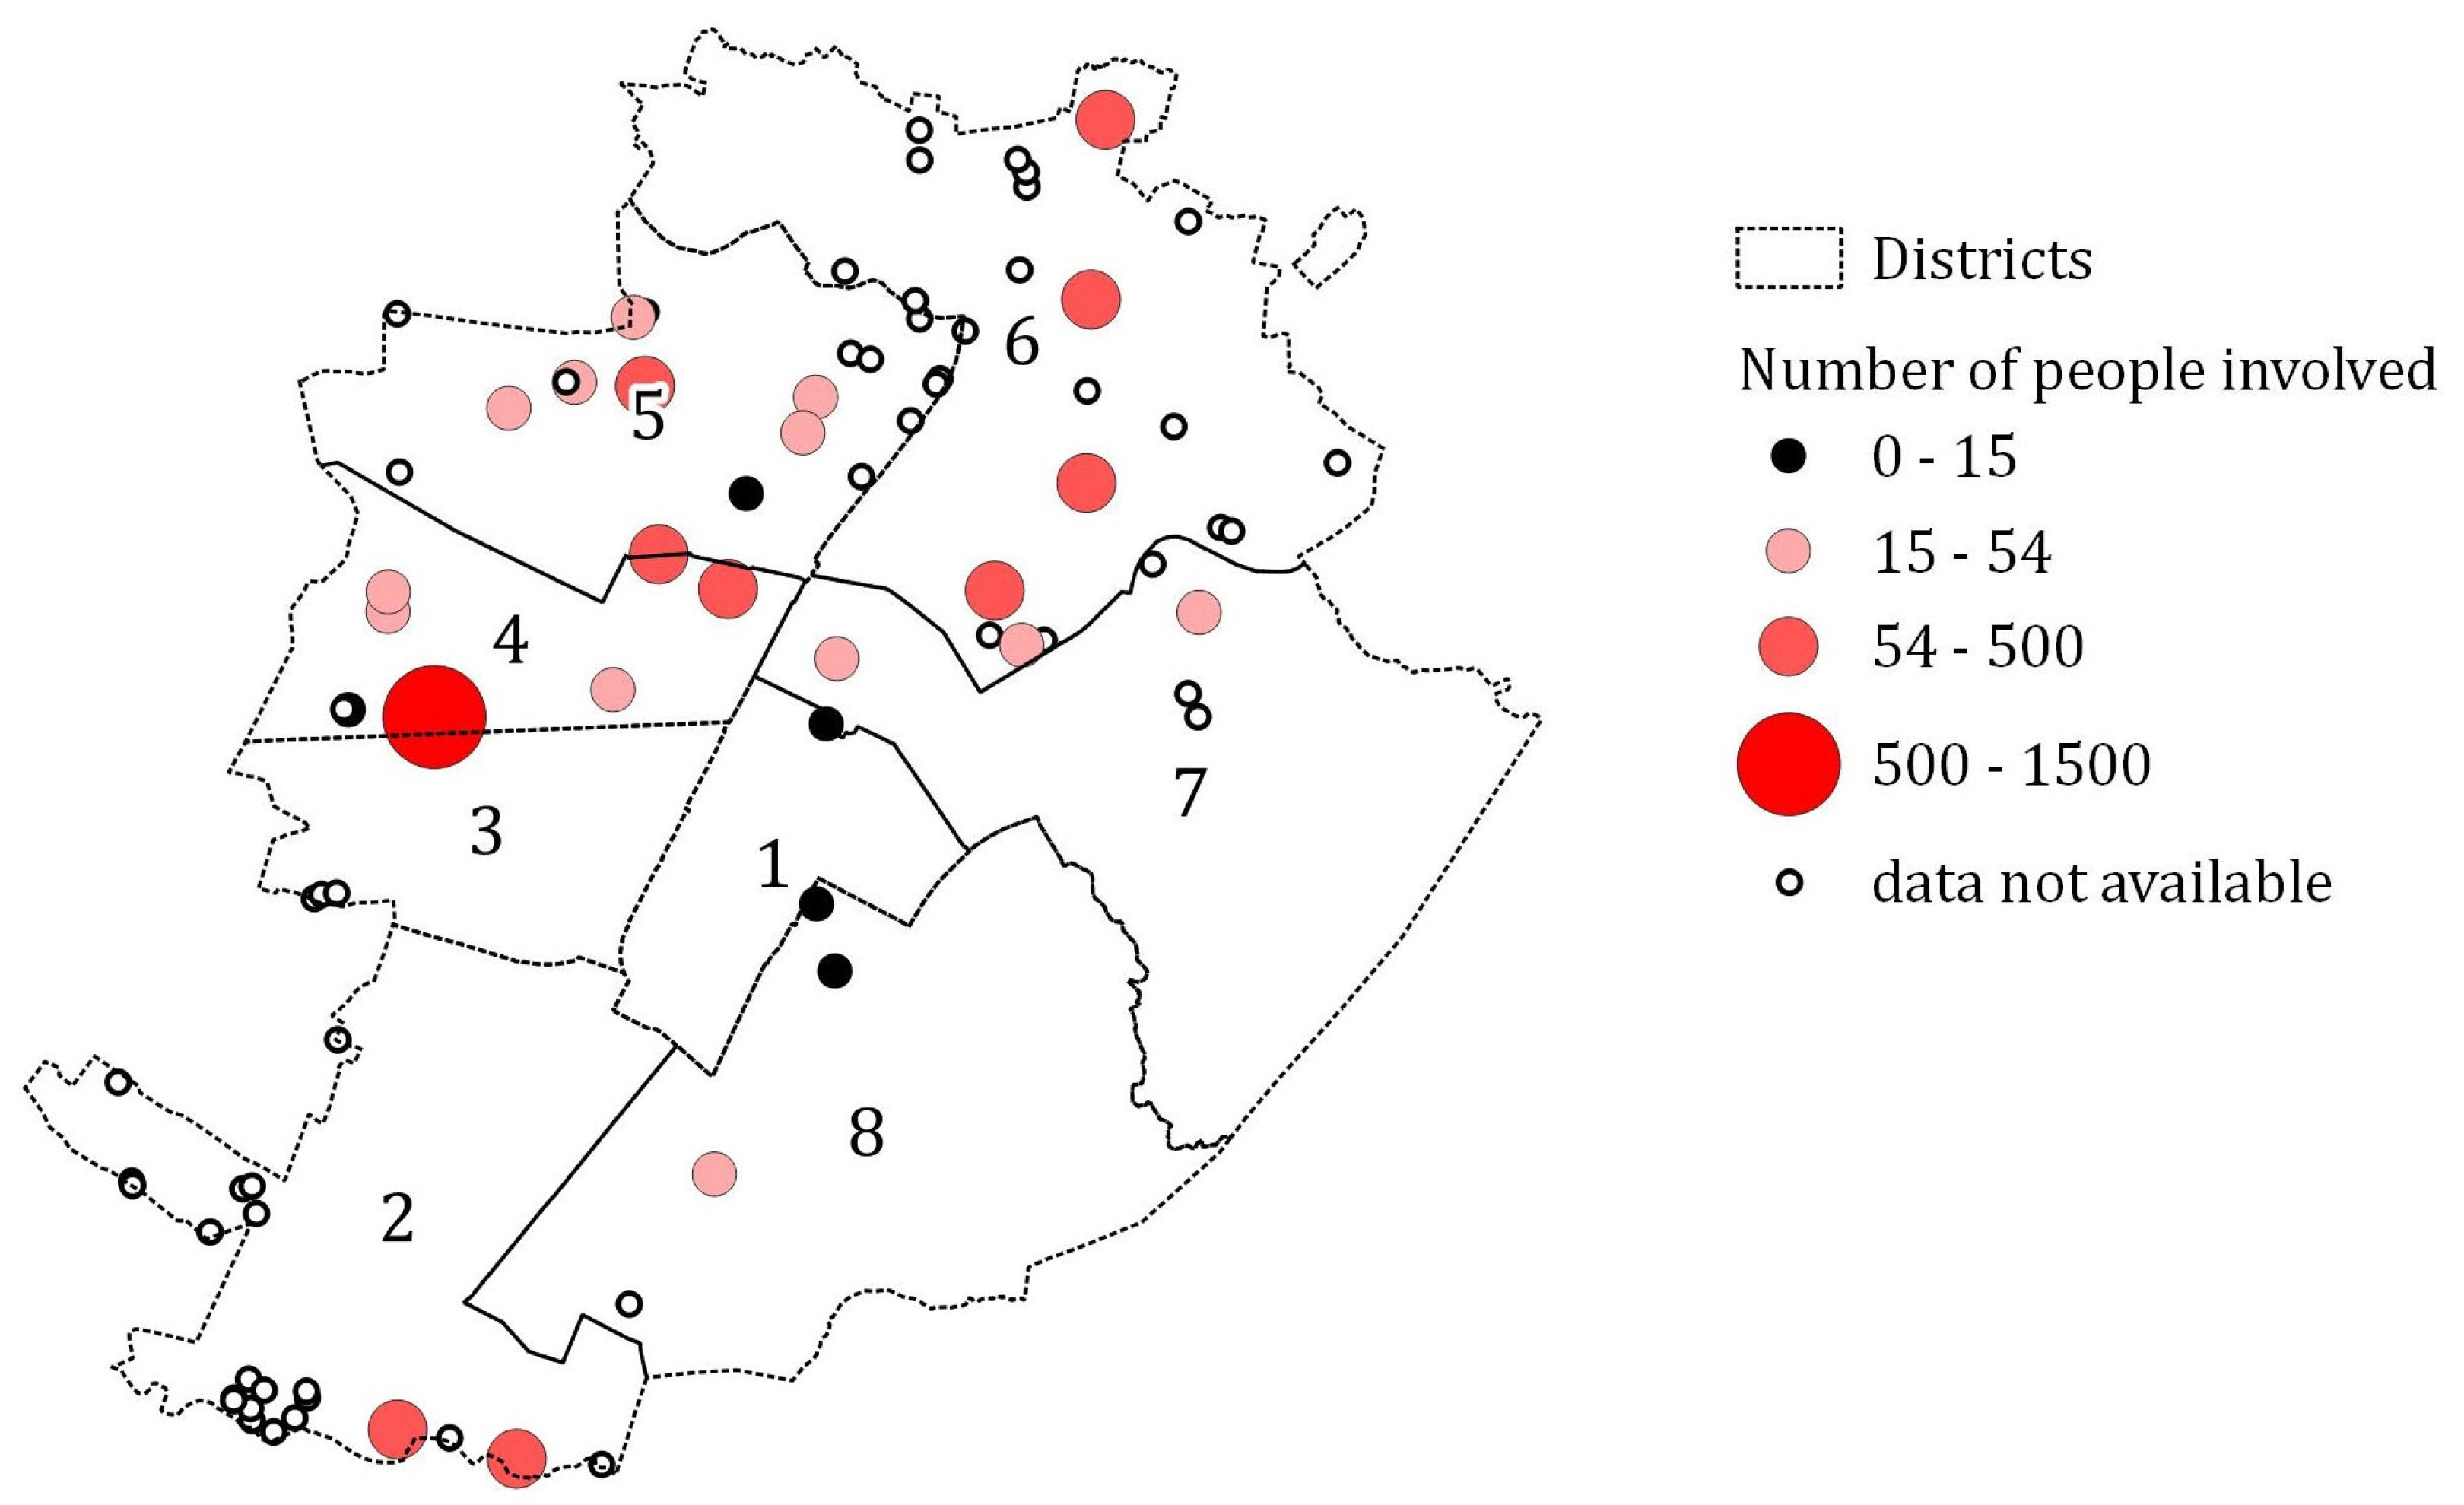
3.3. Participation Rate

The indicator aims to assess the number and/or role of participants in non-commercial urban and peri-urban farming practices. In the case under consideration, the indicator shows that the number of people involved in such practices in the municipality of Turin is over 3500 units, corresponding to an average value of 39.2 people/garden (Table 3). Figure 7 also underlines that the most numerous initiatives concern districts 4 (San Donato-Campidoglio-Parella), 2 (Santa Rita-Mirafiori) and 6 (Barriera di Milano-Regio Parco-Barca-Bertolla-Falchera-Rebaudengo-Villaretto). The indicator requires the monitoring of individual initiatives. In fact, it is currently not possible to calculate the variation over time due to the fact that the data refer to 2019.

3.4. Educational and/or Participatory Activities

The indicator aims to evaluate the change in the number of educational and/or participatory activities in urban and peri-urban agriculture over time. At this stage, it is not possible to calculate the number of educational activities within non-commercial UPA activities. In the case under consideration, the proxy indicator that best represents this phenomenon, also considering the availability of data, is the number of educational farms in the study area. According to the AAU register, in this area the number of farms that offer these services increased by 70% (+57% excluding Turin municipality) during 2015–2023. Figure 8 also highlights that the increase in these facilities takes place in the south and west, while there is a slight decrease in the Turin hill area (east municipalities).

3.5. Number of School Gardens

The indicator aims to measure the number of school gardening initiatives. According to the City of Turin, there are currently 58 schools with school gardens, 31 in the open field and 27 in boxes (above ground) [27]. It is not possible, at this stage, to assess the change over time due to the fact that the data refer to 2022. In fact, the indicator requires further monitoring of individual initiatives.

3.6. Recreational Value
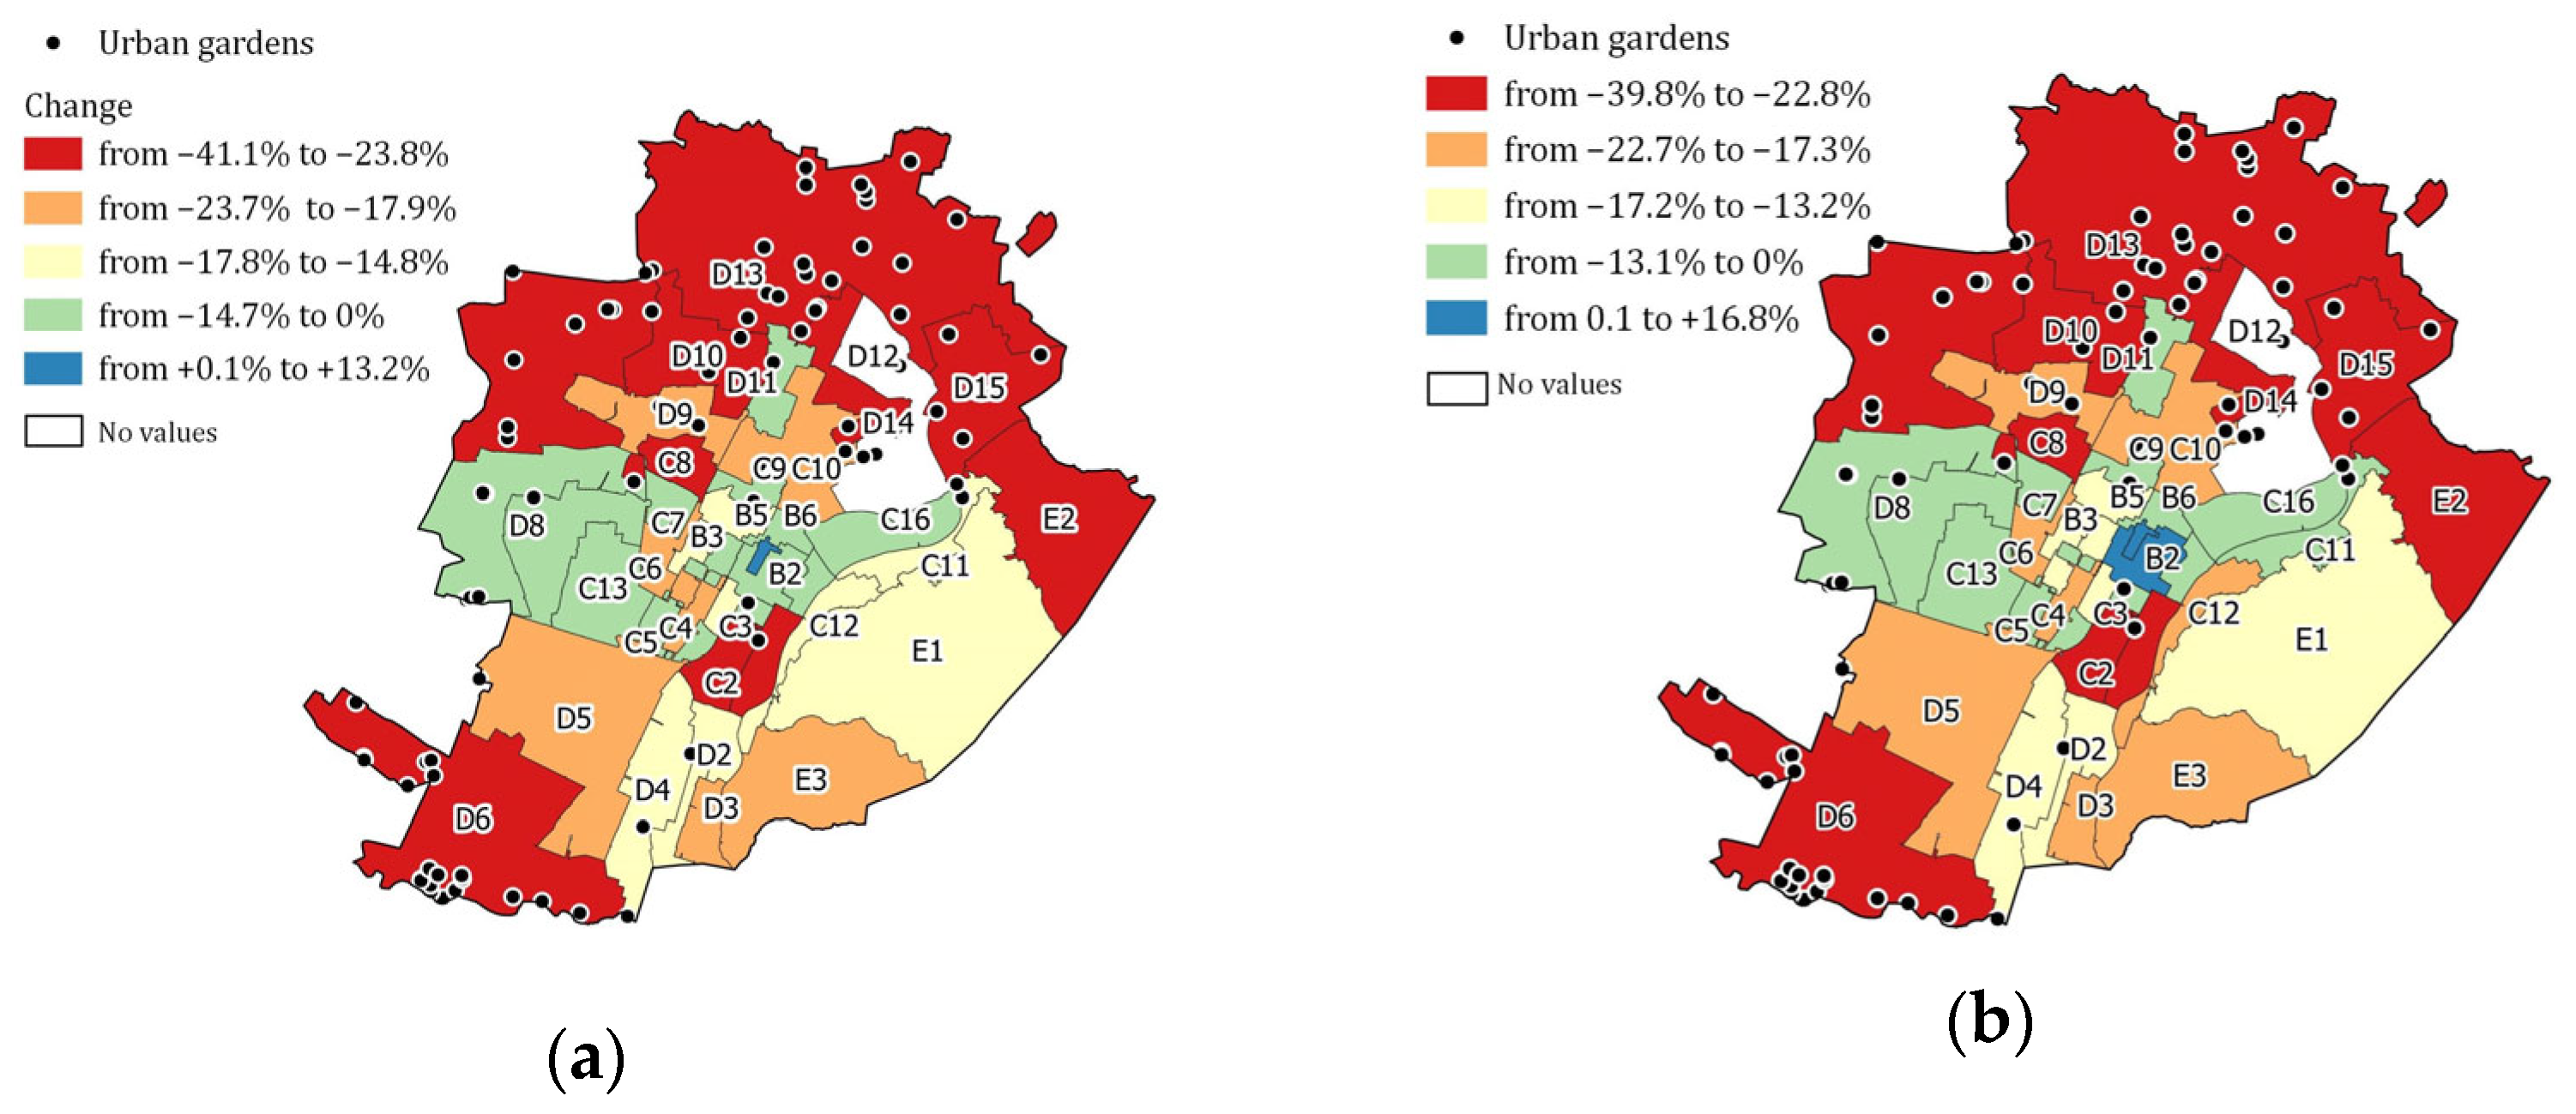
The indicator aims to assess the change in the number of visitors and/or recreational activities in the context of UPA initiatives over time. However, at present, it is not possible to define exactly this number in the study area. In the case under consideration, the proxy indicator that best represents this phenomenon, also considering the availability of spatial data, is the number of recreational and tourism farms (agriturismo). According to the AAU register, in the study area the number of farms that offer these services increased by 21% (+12% excluding Turin) in the 2015–2023 period. Figure 9 also shows that the increase in these facilities occurs mainly in the north and south-east quadrants, while there is a slight decrease in some municipalities in the north-west and south-east areas.

3.7. Gentrification

The indicator aims to estimate the possible gentrification process as an unintended consequence of UPA initiatives. In the present case, the proxies that best represent this phenomenon concern socio-demographic changes and other economic variables such as property development, land price changes and house value trends. On the one hand, the analysis of the change in the resident population in the proximity of the urban gardens and within the administrative limits of the City of Turin in the 2011–2021 decade, shows that less than half of these gardens (approximately 47%) are located in growing or unchanged sections. On the other hand, the majority of urban gardens are located near decreasing census sections, even if spontaneous gardens are excluded from the analysis (Figure 10). The change in property values underlines that average purchase and sale values have decreased over the 2013–2023 period. According to the OMI, Osservatorio del Mercato Immobiliare di Torino (Real Estate Market Observatory of Turin), overlaying the map of urban gardens in the City of Turin, the presence of urban gardens seems to be unrelated to the change in real estate values. In the districts where there are no urban gardens, the market value decreases by 14.9%, while in the areas where there are urban gardens, the average quotations decrease further (−19%) (Figure 11a). It should also be considered that urban gardens are often in peripheral areas of the city, where the market value tends to be lower. Even when looking at the maximum value of sales, the value decreases significantly (−13% in the absence of gardens, −18% in the presence of gardens) (Figure 11b). The maximum value of sales in areas characterized by the presence of urban gardens is EUR 2027.30, while EUR 3025.63 where there are no urban gardens. Finally, this estimation shows that it is necessary to carry out an in-depth study at the neighborhood scale, also through a qualitative approach and with the help of interviews and questionnaires. These tools could be helpful in highlighting the perceptions of residents and users regarding possible gentrification phenomena that cannot be observed through quantitative methods.

3.8. Organic and Local Food

The indicator aims to evaluate the change in the number and type of local and organic food production over time. In the case under consideration, the proxy indicators that best represent this phenomenon, also considering the availability of information, are the number of organic farms, the UAA cultivated with organic methods, the number of farms with an on-site sale, as well as the presence and distribution of markets for local agricultural products. In the study area there is a significant increase in the number of organic farms (+59%), as well as in the UAA with organic methods (+218% in the 2016–2022 period). Compared to the overall values of the TMA, organic farms currently represent about 12%, while the agricultural area cultivated with organic methods is 3% of the total area. Moreover, according to the AAU register, farms that sell agricultural products directly on-site have sharply increased (+33%), especially in the eastern side of the TMA, although they represent only 1% of farms in the TMA (Table 4, Figure 12a,b). In the City of Turin, the presence of municipal markets and stands for direct sales of agricultural products is very significant, especially in district 1 (Centro-Crocetta) and district 8 (San Salvario-Cavoretto-Borgo Po-Nizza Millefonti-Lingotto-Filadelfia) (Figure 13). Finally, it should be considered that, at present, it is not possible to calculate the number and type of agri-food products in non-commercial UPA activities, due to the lack of data.

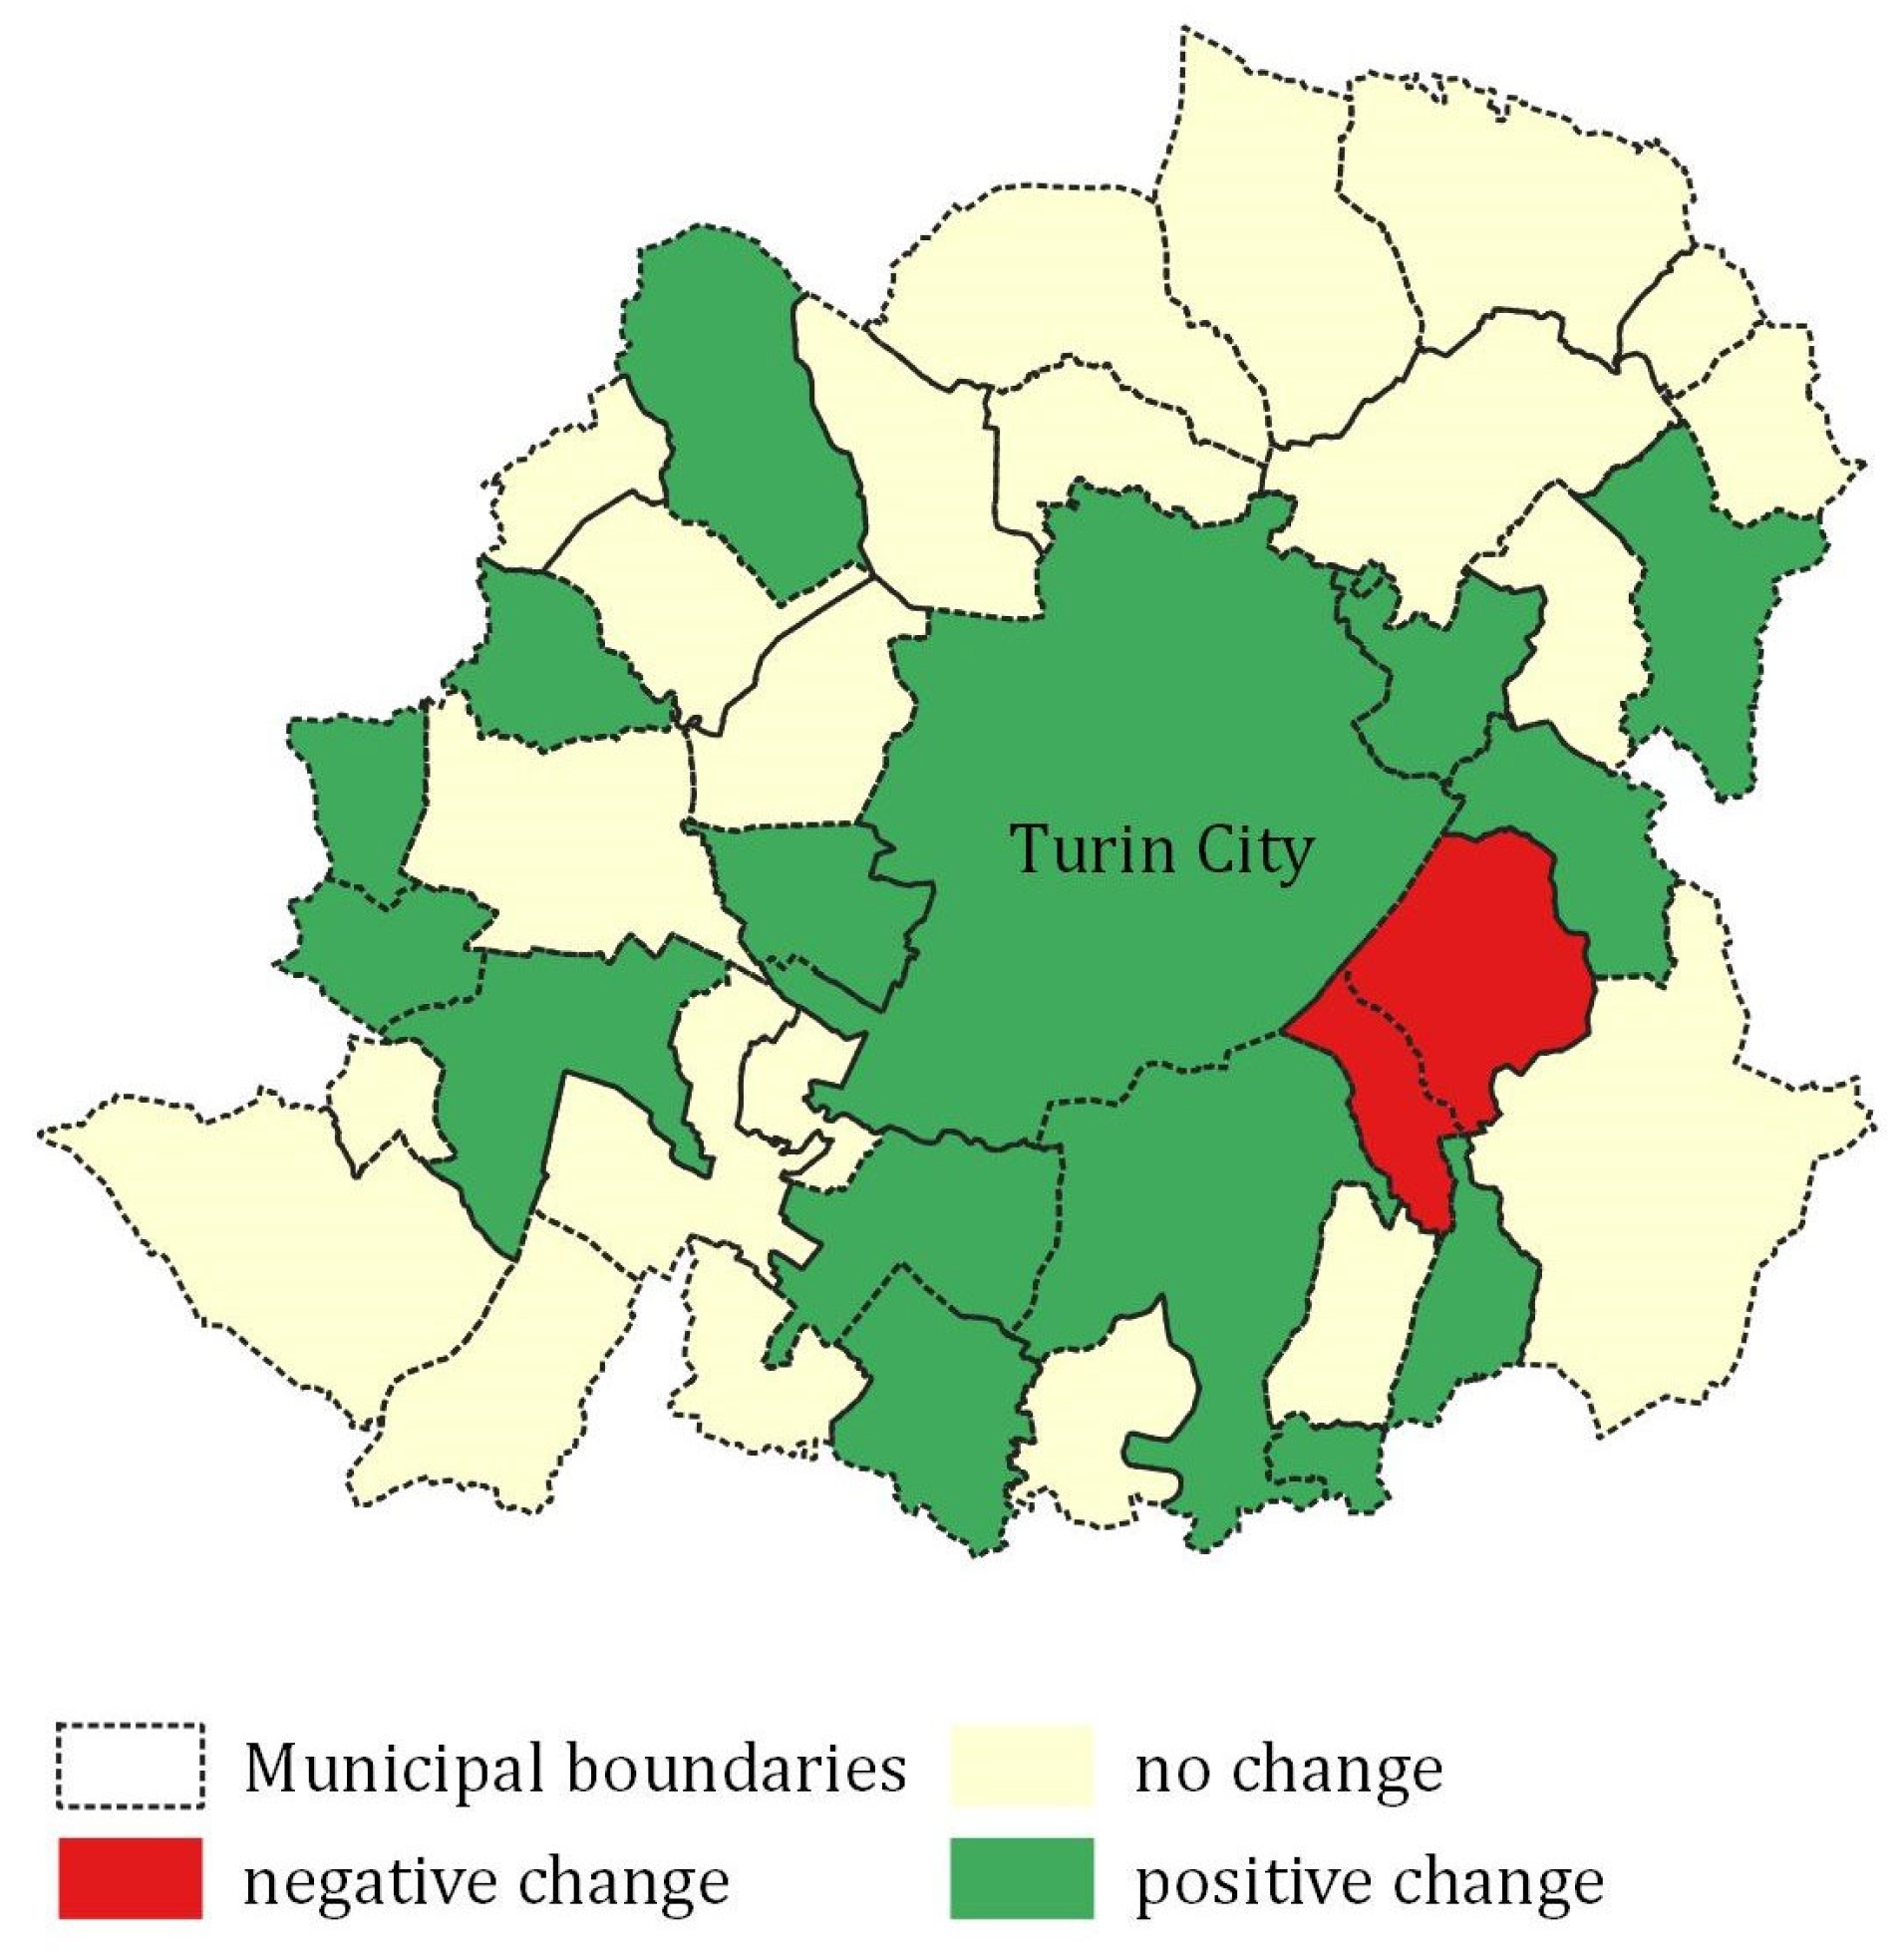
3.9. New Commercial Farms Created

The indicator aims to measure the change in the number of commercial agricultural businesses created over time. In the study area, according to the AAU register, in the 2015–2023 period, there is a significant drop in the number of farms of 19% (without considering farms based in Turin), especially in the southwest and north quadrant of Turin (Figure 14). However, this reduction can also be observed throughout the country and the region. It is compatible with the values recorded in other Italian urban areas.

4. Discussion and Conclusions

4.1. Applicability of the Initial Set of Indicators and Possible Future Research Outlines

Some indicators proposed by Cassatella and Gottero [1] cannot be calculated: ‘increased biodiversity’, ‘number of invasive species’, and ‘physical and mental impact’, require further studies, data collection and monitoring activities at the level of the individual UPA initiative. Some data sets used to calculate indicators such as local economic development and number of new jobs created, are not available. Some of these indicators are potentially calculable, but the information is not accessible or updated. The Author hypothesizes that this can be easily calculated and updated over time using existing databases. In addition, some information is still lacking and/or not up-to-date, especially that concerning agricultural census data. Indicators such as ‘Foodshed’ and ‘Ratio of open spaces to built form’ requires expensive, time-consuming and complex preparatory activities and further research and data collection. The set of indicators is supposed to be easily transferable and applicable to other cities and metropolitan contexts, although the lack of specific information, especially on individual urban gardening initiatives, is an issue that may limit its applicability and ability to measure some phenomena. However, forthcoming research should investigate not only the impacts of individual initiatives but the cumulative city-level effect of UPA practices on various dimensions of sustainable city development. Moreover, in accordance with most recent research (See also: EFUA Manifesto, available from: https://www.efua.eu/sites/default/files/2024-07/Leaflet__A5__4.pdf (last access: 28 March 2025)), the lack of statistical information and data on UPA are pressing issues that require the development of UPA inventories and observatories at different levels. Finally, no action thresholds exist in the context of these studies. Future research could fill this gap in order to better understand the magnitude of UPA benefits and risks and allow comparisons between different socio-economic and environmental contexts.

4.2. Limits of Selected Indicators

In the task of assessing the advantages and disadvantages of UPA initiatives, the challenge in establishing a valid approach for a multiplicity of UPA types is an additional issue to be taken into account [28]. In general, the application of this set of indicators showed a good level of versatility and a high potential to collect information on UPA and its benefits. In fact, the evaluation of the benefits of UPA in the Turin area also highlighted the complexity and variety of UPA practices, as well as its multiple benefits. However, for some indicators, it is not possible to establish the change over time due to the lack of data. Some dimensions need further investigation and the construction of more detailed information bases (e.g., participation, educational and recreational activities, heat islands, etc.), as they are not currently able to show specific cause-effect relationships with UPA initiatives. In fact, most of the selected instruments are proxy indicators. This issue is a limitation of the research that could be overcome through the data collection and definition of specific databases. Finally, other indicators require periodic and more frequent evaluation, especially those belonging to the socio-cultural dimension.

4.3. Benefits and Risks of UPA: Findings and Recommendations for the Evaluation

Although with limits of applicability due to the lack of data, the set of indicators basically underlined a significant growth of UPA and its benefits, especially profit initiatives and the social and economic domains (Table 5). However, the majority of indicators highlighted an undefined or null change. Participation rate and Number of school gardens indicators showed the current situation. Organic and local food, educational activities and recreational indicators showed positive values, although further investigation on individual initiatives is indispensable for a correct assessment. On the one hand, spatial configuration and land use in the study area seem to show positive changes, although an increase in specific phenomena attributable to intensive agriculture (growth of arable land, reduction in meadows and pastures,) can be observed throughout Italy and the Piedmont region. On the other hand, organic and local production is growing strongly in the study area, as is the presence of markets and direct sales outlets. In addition, the number of urban gardens is assumed to have grown significantly in recent years. Concerning negative effects, the number of commercial farms has dramatically decreased, and it is assumed that the number of new commercial farms created is not sufficient enough to compensate for the losses. The research has also highlighted that there are no undesirable effects, especially in relation to possible gentrification. This indicator is very complex and should be defined on a more detailed scale.

4.4. The Potential Role of UPA in the Current and Upcoming Policy Framework

Finally, monitoring progress and negative impacts of UPA initiatives is a crucial activity for cities and metropolitan authorities. However, the potential of the UPA is not yet fully recognized and expressed due to poor integration in sectoral planning and programming tools, lack of urban policies and targeted funds, as well as possible social or land use conflicts [29]. The crucial role of the UPA in cities is recognized by numerous international agreements, such as the UN 2030 Agenda, the EU Urban Agenda, the Paris Agreement on Climate Change, the European Green Deal, the New European Bauhaus, etc. The UPA can also plays a key role in the context of the new ‘nature restoration regulation’ and its possible application, especially considering the potential agroecological value of UPA practices [30], specific targets for urban ecosystems such as the increase in share of green spaces and the avoidance of land take, as well as climate change adaptation and mitigation measures in city strategies. It is time for planners to use and capitalize on the many benefits of UPA as nature-based solutions to achieve the targets of city policy agendas and nature restoration plans.

Funding

This research was funded by IRES Piemonte and Piedmont Region Authority within the context of the evaluation of the Rural Development Program 2014–2020, and 2021–2024 research agreement between IRES Piemonte and Politecnico di Torino (DIST) titled “Studies and research on the environmental and landscape effects of rural policies and emerging policies for urban agriculture, with applications to the Piedmont Region”.

Institutional Review Board Statement

Not applicable.

Informed Consent Statement

Not applicable.

Data Availability Statement

Some publicly available datasets were analyzed in this study (see Table 2). The new data that were created in this study are not publicly available due to restrictions. They are available from the corresponding author with the permission of Piedmont Region Authority.

Acknowledgments

The author would like to thank Piedmont Region Authority, Claudia Cassatella (scientific coordinator of this research project for the Politecnico di Torino, DIST) and Stefano Aimone (responsible for the research agreement on behalf of IRES Piemonte) for the valuable support. The author would also like to thank CSI Piemonte and the City of Turin Authority for providing data.

Conflicts of Interest

The author declares no conflicts of interest.

Appendix A

Table A1. The overall list of metadata related to the proposed set of indicators to evaluate benefits and unwanted effects of UPA (reworked from [1]).
CategoryBenefitIndicatorMethodological ReferencesProxy IndicatorsScale of ApplicationType of Indicator Suggested Methods for Calculation and Data CollectionRequire Data
Environment and climateIncreased quality and quantity of urban green spaces Spatial configuration and land use[12,22]̶TMA/City of TurinStateparticipatory data collection, remote sensing, community mapping, land use analysis land use and cover
Reduction in the urban heat island effectUrban Heat Island effect[12,18,23,24] Spatial proximity UPA/UHICity of TurinStatemeteorological temperature, measurement stationstemperature measurement
Culture and societyImprovement of social cohesion and developing feelings of belonging and a sense-of-placeParticipation rate[11,15]̶City of TurinStateparticipatory data collection, survey number of people attending initiatives
Development of education and knowledgeEducational and/or participatory activities[12,24]n. of educational farmsTMAState/changeparticipatory data collection, surveynumber of activities
Number of school gardens[12,14]̶City of TurinStateSurvey, local datasetnumber of initiatives
Improvement of leisure, recreation activities and tourist attractionsRecreational value[12,22]n. of recreational and tourism farmsTMAState/changeSurveyNumber of visitors and activities
Neighborhood gentrificationGentrification[25]land price, house values
demographic trends
City of TurinStatesurveys, desk/document studiesSocio-demographic trends, land price and house values
FoodImprovement of food qualityOrganic and local food[11]n. of organic farms, local markets and on-site sell pointsTMAState/changesurveys, desk/document studiesNumber and type of local and organic food
EconomyImprovement of local econmiesNew professional farms created[12,24] n. of farmsTMAState/changesurveys, desk/document studiesNumber of farms

References

  1. Cassatella, C.; Gottero, E. Type-Benefit Matrix, Including Set of Indicators, and Benefit Leaflets; H2020 Project n. 101000681, European Forum for a Comprehensive Vision on Urban Agriculture (EFUA), Deliverable D3.2. 2022. Available online: https://cordis.europa.eu/project/id/101000681/results (accessed on 28 April 2025).
  2. Lohrberg, F.; Lička, L.; Scazzosi, L.; Timpe, A. Urban Agriculture Europe; Jovis: Berlin, Germany, 2016. [Google Scholar]
  3. Provè, C. The Politics of Urban Agriculture. An International Exploration of Governance, Food Systems, and Environmental Justice. Ph.D. Thesis, Ghent University, Ghent, Belgium, 2018. [Google Scholar]
  4. Tapia, C.; Randall, L.; Wang, S.; Aguiar Borges, L. Monitoring the contribution of urban agriculture to urban sustainability: An indicator-based framework. Sustain. Cities Soc. 2021, 74, 103130. [Google Scholar] [CrossRef]
  5. Vásquez-Moreno, L.; Córdova, A. A conceptual framework to assess urban agriculture’s potential contributions to urban sustainability: An application to San Cristobal de Las Casas, Mexico. Int. J. Urban Sustain. Dev. 2013, 5, 200–224. [Google Scholar] [CrossRef]
  6. Pueyo-Ros, J.; Comas, J.; Corominas, L. Ediblecity: An R package to model and estimate the benefits of urban agriculture [version 2; peer review: 1 approved, 2 approved with reservations]. Open Res. Eur. 2023, 3, 112. [Google Scholar] [CrossRef]
  7. Langemeyer, J.; Madrid-Lopez, C.; Mendoza Beltran, A.; Villalba Mendez, G. Urban agriculture—A necessary pathway towards urban resilience and global sustainability? Landsc. Urban Plan. 2021, 210, 104055. [Google Scholar] [CrossRef]
  8. Artmann, M.; Sartison, K. The role of urban agriculture as a nature-based solution: A review for developing a systemic assessment framework. Sustainability 2018, 10, 1937. [Google Scholar] [CrossRef]
  9. Haberman, D.; Gillies, L.; Canter, A.; Rinner, V.; Pancrazi, L.; Martellozzo, F. The potential of urban agriculture in Montréal: A quantitative assessment. ISPRS Int. J. Geo-Inf. 2014, 3, 1101–1117. [Google Scholar] [CrossRef]
  10. Thiesen, T.; Bhat, M.G.; Liu, H.; Rovira, R. An Ecosystem Service Approach to Assessing Agro-Ecosystems in Urban Landscapes. Land 2022, 11, 469. [Google Scholar] [CrossRef]
  11. Eiter, S.; Fjellstad, W.; Metselaar, K.; Teixeira da Silva, R. Prioritised Indicators and Baseline. Edible Cities Network—Integrating Edible City Solutions for Social, Resilient and Sustainably Productive Cities. H2020 Project n. 776665, EdiCitNet, Deliverable D5.5. 2020. Available online: https://cordis.europa.eu/project/id/776665/results (accessed on 28 April 2025).
  12. Dumitru, A.; Wendling, L. Evaluating the Impact of Nature-Based Solutions: Appendix of Methods; Publications Office of the European Union: Luxembourg, 2021. [Google Scholar]
  13. Giacchè, G.; Consalès, J.-N.; Grard, B.-P.; Daniel, A.-C.; Chenu, C. Toward an evaluation of cultural ecosystem services delivered by urban micro-farms. Sustainability 2021, 13, 1716. [Google Scholar] [CrossRef]
  14. Gómez-Villarino, M.; Ruiz-Garcia, L. Adaptive design model for the integration of urban agriculture in the sustainable development of cities. A case study in northern Spain. Sustain. Cities Soc. 2021, 65, 102595. [Google Scholar] [CrossRef]
  15. Teitel-Payne, R.; Kuhns, J.; Nasr, J. Indicators for Urban Agriculture in Toronto: A Scoping Analysis; Toronto Urban Growers: Toronto, ON, Canada, 2016. [Google Scholar]
  16. Caputo, S.; Schoen, V.; Specht, K.; Grard, B.; Blythe, C.; Cohen, N.; Fox-Kämper, R.; Hawes, J.; Newell, J.; Poniży, L. Applying the food-energy-water nexus approach to urban agriculture: From FEW to FEWP (Food-Energy-Water-People). Urban For. Urban Green. 2021, 58, 126934. [Google Scholar] [CrossRef]
  17. Corbin, L.; Coudard, A.; Garmulewicz, A.; Powell, Z.; Singh, A.; Smith, C.; Bolumburu, P. Circular Principles and Indicators. H2020 Project n. 820937, REFLOW—Constructive Metabolic Processes for MateriaL Flows Inurban and Peri-Urban Environments across Europe, Deliverable 3.1. 2020. Available online: https://cordis.europa.eu/project/id/820937/results (accessed on 28 April 2025).
  18. Wendling, L.; Rinta-Hiiro, V.; Jermakka, J.; Fatima, Z.; Ascenso, A.; Miranda, A.; Roebeling, P.; Martins, R.; Mendonça, R. Performance and Impact Monitoring of Nature-Based Solutions. H2020 Project n. 730052, Unalab—D3.1 NBS Performance and Impact Monitoring Protocols. 2020. Available online: https://cordis.europa.eu/project/id/730052/results (accessed on 28 April 2025).
  19. Zasada, I.; Schmutz, U.; Wascher, D.; Kneafsey, M.; Corsi, S.; Mazzocchi, C.; Monaco, F.; Boyce, P.; Doernberg, A.; Sali, G.; et al. Food beyond the city—Analysing foodsheds and self-sufficiency for different food system scenarios in European metropolitan regions. City Cult. Soc. 2019, 16, 25–35. [Google Scholar] [CrossRef]
  20. Gottero, E.; Cassatella, C. Spatial Tools to Renew the Planning Paradigm Through Metropolitan Agriculture. The Case Study of Turin (Italy). In Agrourbanism. Tools for Governance and Planning of Agrarian Landscape; Gottero, E., Ed.; Springer: Cham, Switzerland, 2019; Volume 124, pp. 241–258. [Google Scholar]
  21. Kemp, D. The Environment Dictionary; Routledge: London, UK, 1998. [Google Scholar]
  22. Connop, S.; Nash, C.; Elliot, J.; Haase, D.; Dushkova, D. Nature-Based Solution Evaluation Indicators: Environmental Indicators Review. Horizon 2020 Project n. 730222, Connecting Nature. 2020. Available online: https://connectingnature.eu/nature-based-solution-evaluation-indicators-environmental-indicators-review (accessed on 28 April 2025).
  23. Song, Y.; Gil, J.; Wandl, A.; Timmeren, A.V. Evaluating sustainable urban development using urban metabolism indicators in urban design. Eur. XXI 2018, 34, 5–22. [Google Scholar] [CrossRef]
  24. Urban GreenUP, D5.3: City Diagnosis and Monitoring Procedures. Horizon 2020 Project n. 730426, URBAN GreenUP—New Strategy for Re-Naturing Cities through Nature-Based Solutions. 2019. Available online: https://cordis.europa.eu/project/id/730426/results (accessed on 28 April 2025).
  25. Nature4Cities. D2.1—System of Integrated Multi-Scale and Multithematic Performance Indicators for the Assessment of Urban Challenges and NBS, Horizon 2020 Project n. 730468, Nature4Cities—Nature Based Solutions for Re-Naturing Cities: Knowledge diffusion and Decision Support Platform Through New Collaborative Models. 2017. Available online: https://cordis.europa.eu/project/id/730468/results (accessed on 28 April 2025).
  26. City of Turin. Atlante Degli Orti Urbani—Allegato 2 del Piano Strategico Dell’infrastruttura Verde [Atlas of Urban Gardens—Annex 2 of the Green Infrastructure Strategic Plan]. 2019. Available online: https://servizi.comune.torino.it/consiglio/prg/documenti1/atti/allegati/202002957_1_2bis.pdf (accessed on 26 April 2024).
  27. City of Turin. Torino Food Metrics Report 2022; Università di Torino: Torino, Italy, 2022. [Google Scholar]
  28. John, H.; Artmann, M. Introducing an integrative evaluation framework for assessing the sustainability of different types of urban agriculture. Int. J. Urban Sustain. Dev. 2024, 16, 35–52. [Google Scholar] [CrossRef]
  29. Cassatella, C.; Gottero, E. Integrating urban and peri-urban agriculture in planning systems. Barriers, policy tools and recommendations. Plan. Pract. Res. 2025, 1–34. [Google Scholar] [CrossRef]
  30. Marino, D.; Curcio, F.; Felici, F.B.; Mazzocchi, G. Toward Evidence-Based Local Food Policy: An Agroecological Assessment of Urban Agriculture in Rome. Land 2024, 13, 30. [Google Scholar] [CrossRef]
Figure 1. The study area.
Sustainability 17 05151 g001
Figure 2. Spatial dimensions and map of the concentration of urban gardens in the municipality of Turin (Source: Author’s elaboration on [20,26]). Numbers from 1 to 8 in this map identify the district.
Sustainability 17 05151 g002
Figure 3. Land use and land cover of urban gardens in the municipality of Turin (Source: Author’s elaboration on Piedmont Land Cover data, 2021).
Sustainability 17 05151 g003
Figure 4. Code zones of urban gardens in the municipality of Turin (Source: Author’s elaboration on TMA data—Mosaic PRG, 2021).
Sustainability 17 05151 g004
Figure 5. Agricultural land use in the study area (Source: Author’s elaboration on AAU data).
Sustainability 17 05151 g005
Figure 6. Value of the UHI index near urban gardens (Source: Author’s elaboration on [26]). Numbers from 1 to 8 in this map identify the district.
Sustainability 17 05151 g006
Figure 7. Number of participants per urban garden (Source: Author’s elaboration on alphanumeric data [26]). Numbers from 1 to 8 in this map identify the district.
Sustainability 17 05151 g007
Figure 8. Change in the number of educational farms in the study area (Source: Author’s elaboration on CSI Piemonte 2015 and 2023 data).
Sustainability 17 05151 g008
Figure 9. Change in the number of recreational and tourism farms (agriturismi) in the study area (Source: Author’s elaboration on CSI Piemonte 2014 and 2022 data).
Sustainability 17 05151 g009
Figure 10. Population change near urban gardens based on census sections (Source: Author’s elaboration on ISTAT 2019 data and [26]).
Sustainability 17 05151 g010
Figure 11. (a) Change in average market value of residential buildings near urban gardens (Source: Author’s elaboration on data from Agenzia delle Entrate—OMI, 2023); (b) change in highest market value of residential buildings near urban gardens (Source: Author’s elaboration on data from Agenzia delle Entrate, OMI, 2023). The color ranged from red to yellow represents from strong decrease to stable values. Blue sections represent increasing values. Numbers from B1 to E3 in these maps identify homogeneous real estate market zones defined by OMI.
Sustainability 17 05151 g011
Figure 12. (a) Change in the number of organic farms in the study area (Source: Author’s elaboration on AAU 2016 and 2022 data); (b) change in the number of farms with on-site sale points in the study area (Source: Author’s elaboration on AAU 2016 and 2022 data).
Sustainability 17 05151 g012
Figure 13. Markets and direct sale stands in the City of Turin (Source: Author’s elaboration on [20,27]). Numbers from 1 to 8 in this map identify the district.
Sustainability 17 05151 g013
Figure 14. Change in the number of farms per municipality in the study area (Source: Author’s elaboration on AAU 2015–2023 data). The color ranged from red to yellow represents negative values from strong decrease to low. Green municipalities represent stable or increasing values.
Sustainability 17 05151 g014
Table 1. The core set of indicators. Reworked from: [1].
CategoryBenefit or RiskIndicatorReferencesProxy Indicators
Environment and climateIncreased quality and quantity of urban green spaces Spatial configuration and land use[12,22]̶
Reduction in the urban heat island effectUrban Heat Island effect[12,18,23,24]Spatial proximity UPA/UHI
Culture and societyImprovement of social cohesion and developing feelings of belonging and a sense of placeParticipation rate[11,15]̶
Development of education and knowledgeEducational and/or participatory activities[12,24]n. of educational farms
Number of school gardens[12,14]̶
Improvement of leisure, recreation activities and tourist attractionsRecreational value[12,22]n. of recreational and tourism farms
Neighborhood gentrificationGentrification[25]land price, house values
demographic trends
FoodImprovement of food qualityOrganic and local food[11]n. of organic farms, local markets and on-site sell points
EconomyImprovement of local economiesNew commercial farms created[12,24]n. of farms
Table 2. The main data sources used to calculate indicators.
Indicator or Proxy Indicator DataProducer (Year)
Spatial configuration and land useLand cover and use Piedmont Region authority (2021)
Urban garden spatial configurations[20]
Zoning Turin Metropolitan Authority (TMA)—Mosaic of urban plans (2021)
Urban Heat Island effectUHI Index [26]
Participation raten. of people involved[26]
Educational and/or participatory activitiesn. of educational farmsPiedmont Region authority—AAU register (2015 and 2019)
Number of school gardensn. of school gardens[26]
Recreational valuen. of recreational and tourism farms (agriturismi)Piedmont Region authority—AAU register (2014 and 2022)
Gentrificationland priceAgenzia Entrate—OMI (2013 and 2023)
house valuesAgenzia Entrate—OMI (2013 and 2023)
demographic trendsISTAT (2011 and 2021)
Organic and local foodOrganic farms, farm on-site sell pointsPiedmont Region authority—AAU register (2016 and 2022)
Local market [27]; Campagna Amica Register (2016)
New commercial farms createdn. of farmsPiedmont Region authority—AAU register (2015 and 2023)
Table 3. Number of participants per district (Reworked from: [26]).
DistrictNamen. Urban Gardensn. People InvolvedPeople/Garden
1Centro-Crocetta11212.0
2Santa Rita-Mirafiori2260227.4
3San Paolo-Cenisia-Pozzo Strada-Cit Turin-Borgata Lesna3n.d.n.d.
4San Donato-Campidoglio-Parella71702243.1
5Borgo Vittoria-Madonna di Campagna-Lucento-Vallette1929415.5
6Barriera di Milano-Regio Parco-Barca-Bertolla-Falchera-Rebaudengo-Villaretto2252123.7
7Aurora, Vanchiglia-Sassi-Madonna del Pilone58416.8
8San Salvario-Cavoretto-Borgo Po-Nizza Millefonti-Lingotto-Filadelfia4379.3
Total83325239.2
Table 4. Organic and local production in the Turin metropolitan area (Source: Author’s elaboration on AAU data).
Total ChangeTotal Change (Except Turin)Percentage over TMA (2023)
Organic farms (2015–2023)+59.6+62.612.3%
UAA BIO (2016–2022) +218.3+236.33.4%
Farms with on-site sale (2015–2023)+33.3+22.21.2%
Table 5. Results of the application of core set indicators and recommendations.
CategoryIndicatorProxy IndicatorsMeasured BenefitApplicabilityRecommendations
Environment and climateSpatial configuration and land use̶Sustainability 17 05151 i001mediumCollect spatial data and temporal land use change at UPA project/initiative level
Urban Heat Island effectSpatial proximity UPA/UHI Sustainability 17 05151 i002hard
  • Install measuring stations near urban gardens
  • Repeat periodic measurements
Culture and societyParticipation rate̶ easyConduct periodic monitoring of single initiatives
Educational and/or participatory activitiesn. of educational farmsSustainability 17 05151 i001mediumConduct periodic monitoring of single initiatives, especially for non-profit practices
Number of school gardens̶Sustainability 17 05151 i002mediumConduct periodic monitoring of single initiatives
Recreational valuen. of agriturismoSustainability 17 05151 i001mediumConduct periodic monitoring of the number of visitors and activities in the profit and non-profit initiatives
Gentrificationland price, house values, demographic trendsSustainability 17 05151 i002hardCollect spatial data on socio-demographic trends, land price and house values at district level
FoodOrganic and local foodn. of organic farms, local markets and on-site sell pointsSustainability 17 05151 i001medium
  • Collect data of non-profit initiatives
  • Conduct periodic monitoring of number of local markets
EconomyNew commercial farms createdn. of farmsSustainability 17 05151 i003easy
  • Collect data on non-commercial initiatives
  • Collect and share data of new commercial initiatives created per year
Sustainability 17 05151 i001: Positive change; Sustainability 17 05151 i003: Negative change; Sustainability 17 05151 i002: Undefined or null change.
Disclaimer/Publisher’s Note: The statements, opinions and data contained in all publications are solely those of the individual author(s) and contributor(s) and not of MDPI and/or the editor(s). MDPI and/or the editor(s) disclaim responsibility for any injury to people or property resulting from any ideas, methods, instructions or products referred to in the content.

