Article

Comparative Analysis of CO2 Emissions and Transport Efficiency in 174k CBM LNG Carriers with X-DF and ME-GI Propulsion

by
Aleksandar Vorkapić
1,2,*,
Martin Juretić
1 and
Radoslav Radonja
1,*
1
Faculty of Maritime Studies, University of Rijeka, Studentska 2, 51000 Rijeka, Croatia
2
Faculty of Informatics and Digital Technologies, University of Rijeka, Radmile Matejčić 2, 51000 Rijeka, Croatia
*
Authors to whom correspondence should be addressed.
Sustainability 2025, 17(11), 5140; https://doi.org/10.3390/su17115140
Submission received: 9 May 2025 / Revised: 29 May 2025 / Accepted: 30 May 2025 / Published: 3 June 2025

Abstract

This study investigates the environmental and operational performance of X-DF and ME-GI propulsion systems in large LNG carriers, focusing on key emission and transport efficiency metrics—CO2, the EEOI, and the CII—and their relationship with operational factors such as shaft power, vessel speed, propeller slip, and specific fuel oil consumption. Statistical methods including correlation analysis, regression modeling, outlier detection, and clustering are employed to evaluate engine behavior across the ship’s fuel gas steaming envelope and to identify critical efficiency trends. The results show that ME-GI engines deliver lower CO2 emissions and consistent efficiency under steady-load conditions, due to their higher thermal efficiency and precise control characteristics. In contrast, X-DF engines demonstrate greater adaptability, leveraging LNG combustion to achieve cleaner emissions and optimal performance in specific operational clusters. Clustering analysis highlights distinct patterns: ME-GI engines excel with optimized shaft power and RPM, while X-DF engines achieve peak efficiency through adaptive load and fuel management. These findings provide actionable insights for integrating performance indicators into SEEMP strategies, enabling targeted emission reductions and fuel optimization across diverse operating scenarios—thus supporting more sustainable maritime transport.

1. Introduction

Two-stroke marine diesel engines are a cornerstone of the maritime industry, powering the vast majority of large commercial vessels due to their superior thermal efficiency and lower specific fuel consumption compared to four-stroke engines. Their design, optimized for high power and fuel economy, makes them essential for sustaining the economic viability of global shipping [1,2,3]. These engines are characterized by their robust performance under heavy loads and their ability to operate with minimal maintenance downtime, further cementing their role in modern maritime transport [4].
However, the environmental impact of two-stroke diesel engines presents a significant challenge. International shipping is responsible for approximately 2–3% of global CO2 emissions, with marine diesel engines also contributing to NOx and SOx emissions that exacerbate air pollution and contribute to climate change [5,6]. As regulations tighten under frameworks such as MARPOL Annex VI, the maritime sector faces growing pressure to reduce greenhouse gas emissions by improving energy efficiency through advanced propulsion technologies and operational optimization [7,8,9,10].
To address these challenges, the International Maritime Organization (IMO) has introduced the Shipboard Energy Efficiency Management Plan (SEEMP), a mandatory framework designed to enhance energy efficiency and reduce emissions from ships. The SEEMP consists of three key components: SEEMP Part I, which focuses on operational measures to reduce energy consumption; SEEMP Part II, which mandates ship-specific targets and monitoring plans aligned with IMO’s Data Collection System (DCS); and SEEMP Part III, introduced in 2023, which requires the periodic evaluation and verification of a ship’s compliance with decarbonization goals [11].
The framework leverages key efficiency metrics, including the Energy Efficiency Operational Indicator (EEOI), which evaluates a vessel’s emissions per unit of transport work, and the Carbon Intensity Indicator (CII), which assesses emissions relative to cargo and distance traveled. Additionally, the Energy Efficiency Design Indicator (EEDI) applies to new ships, ensuring compliance with design-based efficiency standards, while the Energy Efficiency Existing Ship Index (EEXI) establishes similar benchmarks for vessels built before EEDI regulations. Together, these metrics form a comprehensive toolkit for guiding operational decision-making and improving both design and operational performance.
By integrating these measures, the SEEMP aims to align shipping operations with global decarbonization targets while maintaining economic competitiveness, ensuring that vessels operate more efficiently and with reduced environmental impact [12].
Building on these considerations, this study focuses on the comparative analysis of dual-fuel propulsion systems, X-DF and ME-GI engines, evaluating their emissions performance and transportation work efficiency. By leveraging real-world data from LNG carriers, the study seeks to provide actionable insights for optimizing ship energy efficiency and integrating these findings into SEEMP strategies to align with IMO decarbonization goals.
Research in the field of two-stroke marine engine efficiency has primarily focused on analyzing and improving propulsion systems’ fuel efficiency and emissions reduction capabilities [2,13,14,15]. For instance, advanced computational models have been developed to predict specific fuel consumption (SFC) across varying operating conditions, with some models achieving a maximum deviation of less than 3.6%, demonstrating their accuracy and applicability for engine optimization [16]. In addition to computational modeling, studies have explored the integration of hybrid propulsion systems to improve energy efficiency [17,18].
These findings highlight the importance of operational optimization and advanced system integration in achieving better efficiency [19,20]. However, existing models often lack empirical validation using real-world datasets, particularly for dual-fuel engines. Additionally, while regression and clustering techniques have been explored, their application in understanding operational variability’s impact on emissions metrics such as the Carbon Intensity Indicator (CII) and the Energy Efficiency Operational Indicator (EEOI) remains limited [21].
The effectiveness of these metrics under dynamic operational conditions remains underexplored. Comparisons of different propulsion technologies, such as X-DF and ME-GI engines, under identical operational scenarios are rare, leaving a significant gap in understanding their relative efficiency and emissions profiles.
Operational variability, including load fluctuations and speed adjustments, has also been a focus of efficiency research. Maintaining optimal scavenge air pressure and turbocharger speeds has been shown to enhance combustion efficiency and reduce emissions [22]. Despite these insights, relevant studies fail to employ statistical analyses to link real environments operational parameters such as shaft power, vessel speed, and propeller slip directly to emissions trends and fuel consumption. Clustering techniques, which can identify patterns and inefficiencies in operational data, are underutilized in this context. Furthermore, there is a lack of practical recommendations tailored to voyage-specific scenarios, which could support real-time decision-making and better alignment with SEEMP goals.
To address these gaps, our study extends beyond the reported work in quantifying and comparing emissions and transportation work metrics (CO2, EEOI, and CII) for X-DF and ME-GI engines, focusing on their performance under full-steaming conditions. It further seeks to assess the influence of operational parameters, including shaft power, speed, and propeller slip, on emissions efficiency. Clustering techniques were employed to detect operational inefficiencies and categorize trends, providing insights into engine-specific behavior. The results will inform voyage-specific strategies for minimizing emissions and improving efficiency, with direct applicability to SEEMP compliance.
This research is a continuation of our previous work and provides new insights through a comprehensive comparison of propulsion systems, the application of statistical methods, and the development of practical decarbonization strategies to improve sustainability in maritime transport.

2. Materials and Methods

In this study, we utilized operational data from two 174,000 CBM LNG carriers built by leading South Korean shipbuilders. With the recent discontinuation of further development of ME-GA engines, the industry has been left with two primary propulsion technologies for LNG carriers: X-DF and ME-GI engines. This shift underscores the relevance of this study, as it focuses on comparing the performance and environmental impact of these two dominant propulsion systems.
The first ship has principal particulars of 114,084 GT and 89,432 DWT. Its propulsion system consists of two dual-fuel Wärtsilä 6X62DF main engines, capable of delivering a total power output of 25,080 kW at 90.3 RPM. The propulsion setup includes two five-blade fixed-pitch propellers (FPP) with a diameter of 7.3 m and a pitch ratio of 0.9691. The second ship has a gross tonnage of 117,162 GT and a deadweight of 91,610 DWT. It is powered by two MAN B&W 5G70ME-C9.5-GI main engines, with a combined maximum continuous rating (MCR) of 27,616 kW at 73.2 RPM per engine. The propulsion system features two three-blade fixed-pitch propellers (FPP) with a diameter of 8.7 m and a pitch ratio of 0.94.

2.1. Data Source

The X-DF dataset provides a robust foundation for analysis, spanning over five years of operation. It was obtained from proprietary onboard measurements collected during routine operation of a 174,000 m3 LNG carriers under the author’s technical supervision. It includes 388 instances of data collected under full steaming on gas fuel, capturing a wide range of engine loads within set operational conditions. This offers significant statistical power for identifying trends and evaluating propulsion performance. In contrast, the ME-GI dataset covers a shorter timeframe of 229 days, consisting of 46 noon reports that meet the criteria for full navigation on gas fuel. Despite its smaller size and reduced statistical power, the ME-GI dataset provides a focused and detailed perspective on engine performance, allowing for meaningful comparative analysis under consistent operational conditions. Each entry represents a 24 h full-steaming period on gas fuel, ensuring statistical relevance and comparability with the X-DF dataset (Table 1).
For this study, we collected operational data from X-DF and ME-GI propulsion engines, which operate using different combustion principles (Otto vs. diesel cycle) and fuel types (LSMGO/BOG vs. LSHFO/BOG). In both cases, LSMGO and LSHFO were used exclusively as pilot fuels. The dataset includes sensor measurements of key parameters such as fuel consumption, ship speed (over ground and through water), cargo mass, and shaft power. Additional metrics, including average speed, propeller slip, and performance indicators like CO2 emissions, the EEOI, and the CII, were calculated from these inputs to provide a comprehensive evaluation of engine performance. Following the acquisition of raw operational data, derived performance metrics were computed to assess environmental and transport efficiency. The methods for calculating CO2 emissions, the EEOI, and the CII are described below.
To estimate the total amount of CO2 emitted during a voyage, the following fuel-based emission factors were applied depending on the type and quantity of fuel consumed [23]:
CO2 = (M/E × 2.75) + (PM/E × 3.206) + (D/G × 2.75) + (PD/G × 3.206)
where M/E is quantity of fuel gas consumed (t) for propulsion, PM/E is quantity of pilot fuel consumed for propulsion (t), D/G is diesel generator consumption (t), and PD/G is consumption of pilot fuel for diesel generators (t); 2.75 is emission factor for LNG fuel (t CO2/t fuel) and 3.206 is emission factor for pilot fuel (t CO2/t fuel). This formula provides an estimate of total CO2 emissions in metric tons (t CO2) for the given voyage.
The EEOI expresses the amount of CO2 emitted per ton-mile of transport work performed. It is calculated as follows:
E E O I = C O 2   e m i s s i o n s s a i l e d   d i s t a n c e   ×   c a r r i e d   c a r g o
The CII quantifies CO2 emissions per deadweight ton-nautical mile, serving as a regulatory metric under IMO guidelines:
C I I = C O 2   e m i s s i o n s s a i l e d   d i s t a n c e   ×   d w t

2.2. Data Preparation

For both datasets, data preparation involved filtering to retain only instances of navigation on LNG, isolating 24 h periods when the engines operated exclusively on gas fuel. This filtering excluded noon reports involving fuel transitions, dual-fuel usage, or any entries with incomplete or missing data.
To ensure comparability between the X-DF and ME-GI datasets, we applied several specific adjustments to account for operational differences. These included (i) aligning generator fuel consumption with comparable voyage profiles, (ii) excluding all entries where auxiliary systems such as the reliquefication plant, gas combustion unit (GCU), forcing vaporizer, or auxiliary boiler were active, and (iii) normalizing transport work metrics (e.g., EEOI, CII) relative to voyage distance and cargo carried. Although such auxiliary system activity is rare during full navigation, its exclusion ensures consistency and focuses the analysis on steady-state propulsion performance. Normalization was applied by adjusting for transport work (ton-nautical miles) to ensure comparability across engine types, and operational filters were applied to select consistent full-steaming conditions.
Key metrics, including fuel consumption, CO2 emissions, and transportation work performance metrics (EEOI and CII), were normalized relative to voyage distance and cargo carried. This normalization ensured a consistent basis for evaluating engine performance across different voyages and operational contexts. While the datasets were unbalanced, this had no significant impact on the regression or other analyses, as our focus was on averages and relationships, which represent the best available approach without unnecessary data manipulation. Additionally, voyage load status (laden or ballast) was harmonized across both datasets to ensure consistent transport work calculations. Since emission metrics such as the EEOI and CII inherently account for cargo and distance, load effects are embedded within the normalized indicators used throughout the analysis.

2.3. Methods and Experimental Design

The methods used in this study include Spearman correlation analyses to assess the strength and direction of monotonic relationships between operational parameters, emission and transportation work performance metrics. The Spearman correlation coefficient ( ρ ) is a non-parametric measure of rank correlation that assesses the strength and direction of a monotonic relationship between two variables:
ρ = 1 6 d i 2 n n 2 1 ,
where di is the difference between the ranks of each pair of observations and n is the number of observations.
In interpreting the correlation results, ρ = 1 indicates a perfect positive monotonic relationship, ρ = 1 − indicates a perfect negative monotonic relationship, and ρ = 0 indicates no monotonic relationship. Spearman’s correlation coefficient operates on ranked data and does not require the assumption of normality, making it robust to skewed distributions and outliers, both common in real-world operational datasets.
Descriptive statistics were used to summarize the data and understand its overall characteristics. Key metrics such as the mean, median, and standard deviation provided an understanding of the central tendency, variability, and distribution of emissions and operational parameters. These measures helped assess data consistency and identify potential irregularities for further examination. Outlier detection was conducted using the Interquartile Range (IQR) method to ensure data integrity by identifying and addressing anomalous values in emissions metrics such as CO2 emissions, the EEOI, and the CII. The IQR method establishes thresholds based on the first (Q1) and third quartiles (Q3) of the data, with outliers defined as values falling below Q1 − 1.5 × IQR or above Q3 + 1.5 × IQR. Observations identified as outliers were reviewed to determine their relevance, with non-representative data points excluded from the analysis to maintain consistency and focus on steady-state operational conditions.
A statistical comparison using a two-sample independent t-test was conducted to identify significant differences in mean emissions metrics, such as CO2 emissions, the EEOI, and the CII, between two engine types. This test evaluated whether the observed differences in these metrics were statistically significant. The study implementation test statistic was calculated as
t = X ¯ 1 X ¯ 2 s 1 2 n 1 + s 2 2 n 2 ,
where X ¯ 1   a n d   X ¯ 2 are means of the two groups, s 1 2 and s 2 2 are the variances of the two groups, and n 1   a n d   n 2 are sample sizes of the two groups.
This statistic measures the standardized difference between the group means, accounting for within-group variability and sample sizes. The t-test was applied under the assumption of independent samples and approximate normality of the data. The resulting t-value and associated p-value determined the statistical significance of the observed differences in emissions and transportation work performance metrics, enabling a comparison of the environmental performance of the two engine types.
Ordinary Least-Squares (OLS) regression analysis was employed to gain deeper insights into the factors influencing CO2 emissions by modeling their relationships with key operational parameters, such as shaft power, speed, and propeller slip. Interaction terms were incorporated into the model to capture the combined effects of these parameters, providing a nuanced understanding of how operational conditions impact emissions. OLS was chosen for its interpretability and ability to quantify the effect of each predictor while controlling for others. OLS regression minimizes the sum of squared residuals to estimate the coefficients (β):
m i n i = 1 n ( C O 2 , i C O 2 , i ^ ) 2 ,
where C O 2 , i is the observed value for the i-th observation, while C O 2 , i ^ is the predicted regression model value. Residuals from the OLS model were tested for normality using the Shapiro–Wilk test, which showed no significant deviation (p > 0.05), supporting the validity of the model assumptions.
By leveraging OLS regression after Spearman’s correlation, this study quantified the effects of operational parameters while incorporating interaction terms to capture non-linear and combined effects, providing a comprehensive understanding of how these factors influence the relevant parameters.
Clustering techniques, specifically k-means clustering, were employed to group voyages based on key operational parameters, such as speed, shaft power, and propeller slip. The aim was to identify patterns and trends in operational performance and emissions efficiency across different operating conditions. The k-means clustering algorithm groups data points into k clusters by minimizing the within-cluster variance. The algorithm iteratively assigns data points to the cluster with the nearest centroid and updates the centroids to reflect the mean of their assigned points until convergence is reached. The objective function minimized by the algorithm is
J = i = 1 k j C i x j μ i 2 ,
where k is the number of clusters, xj data point in the dataset, μ i is centroid of cluster Ci, and x j μ i 2 is squared Euclidean distance between data point xj and its cluster centroid. The optimal number of clusters (k) was selected using the elbow method, which involved plotting the within-cluster sum of squares (WCSS) against varying values of k and identifying the inflection point beyond which additional clusters yielded marginal improvement.
Visualization methods, including scatterplots, cluster visualizations, and distribution plots, were used to analyze and present trends, relationships, and variability in emissions and operational data.
Through these steps, the methodology was expanded into an experimental framework that aligned the data processing pipeline with this study’s objectives. By integrating data-driven insights with a stratified experimental approach, the study ensured robust and reliable conclusions regarding the environmental and operational performance of X-DF vs. ME-GI engines.
The analysis was conducted using Python 3.11, alongside open-source libraries such as Pandas, NumPy, Statsmodels, Scikit-learn, Matplotlib, and Seaborn. These tools provided the computational foundation for statistical modeling, clustering, regression analysis, and data visualization, ensuring reproducibility and transparency. The applied models carry limitations, including potential sensitivity to sample imbalance, assumed linearity in regression, and unsupervised cluster boundary decisions in k-means. These constraints were considered during result interpretation.

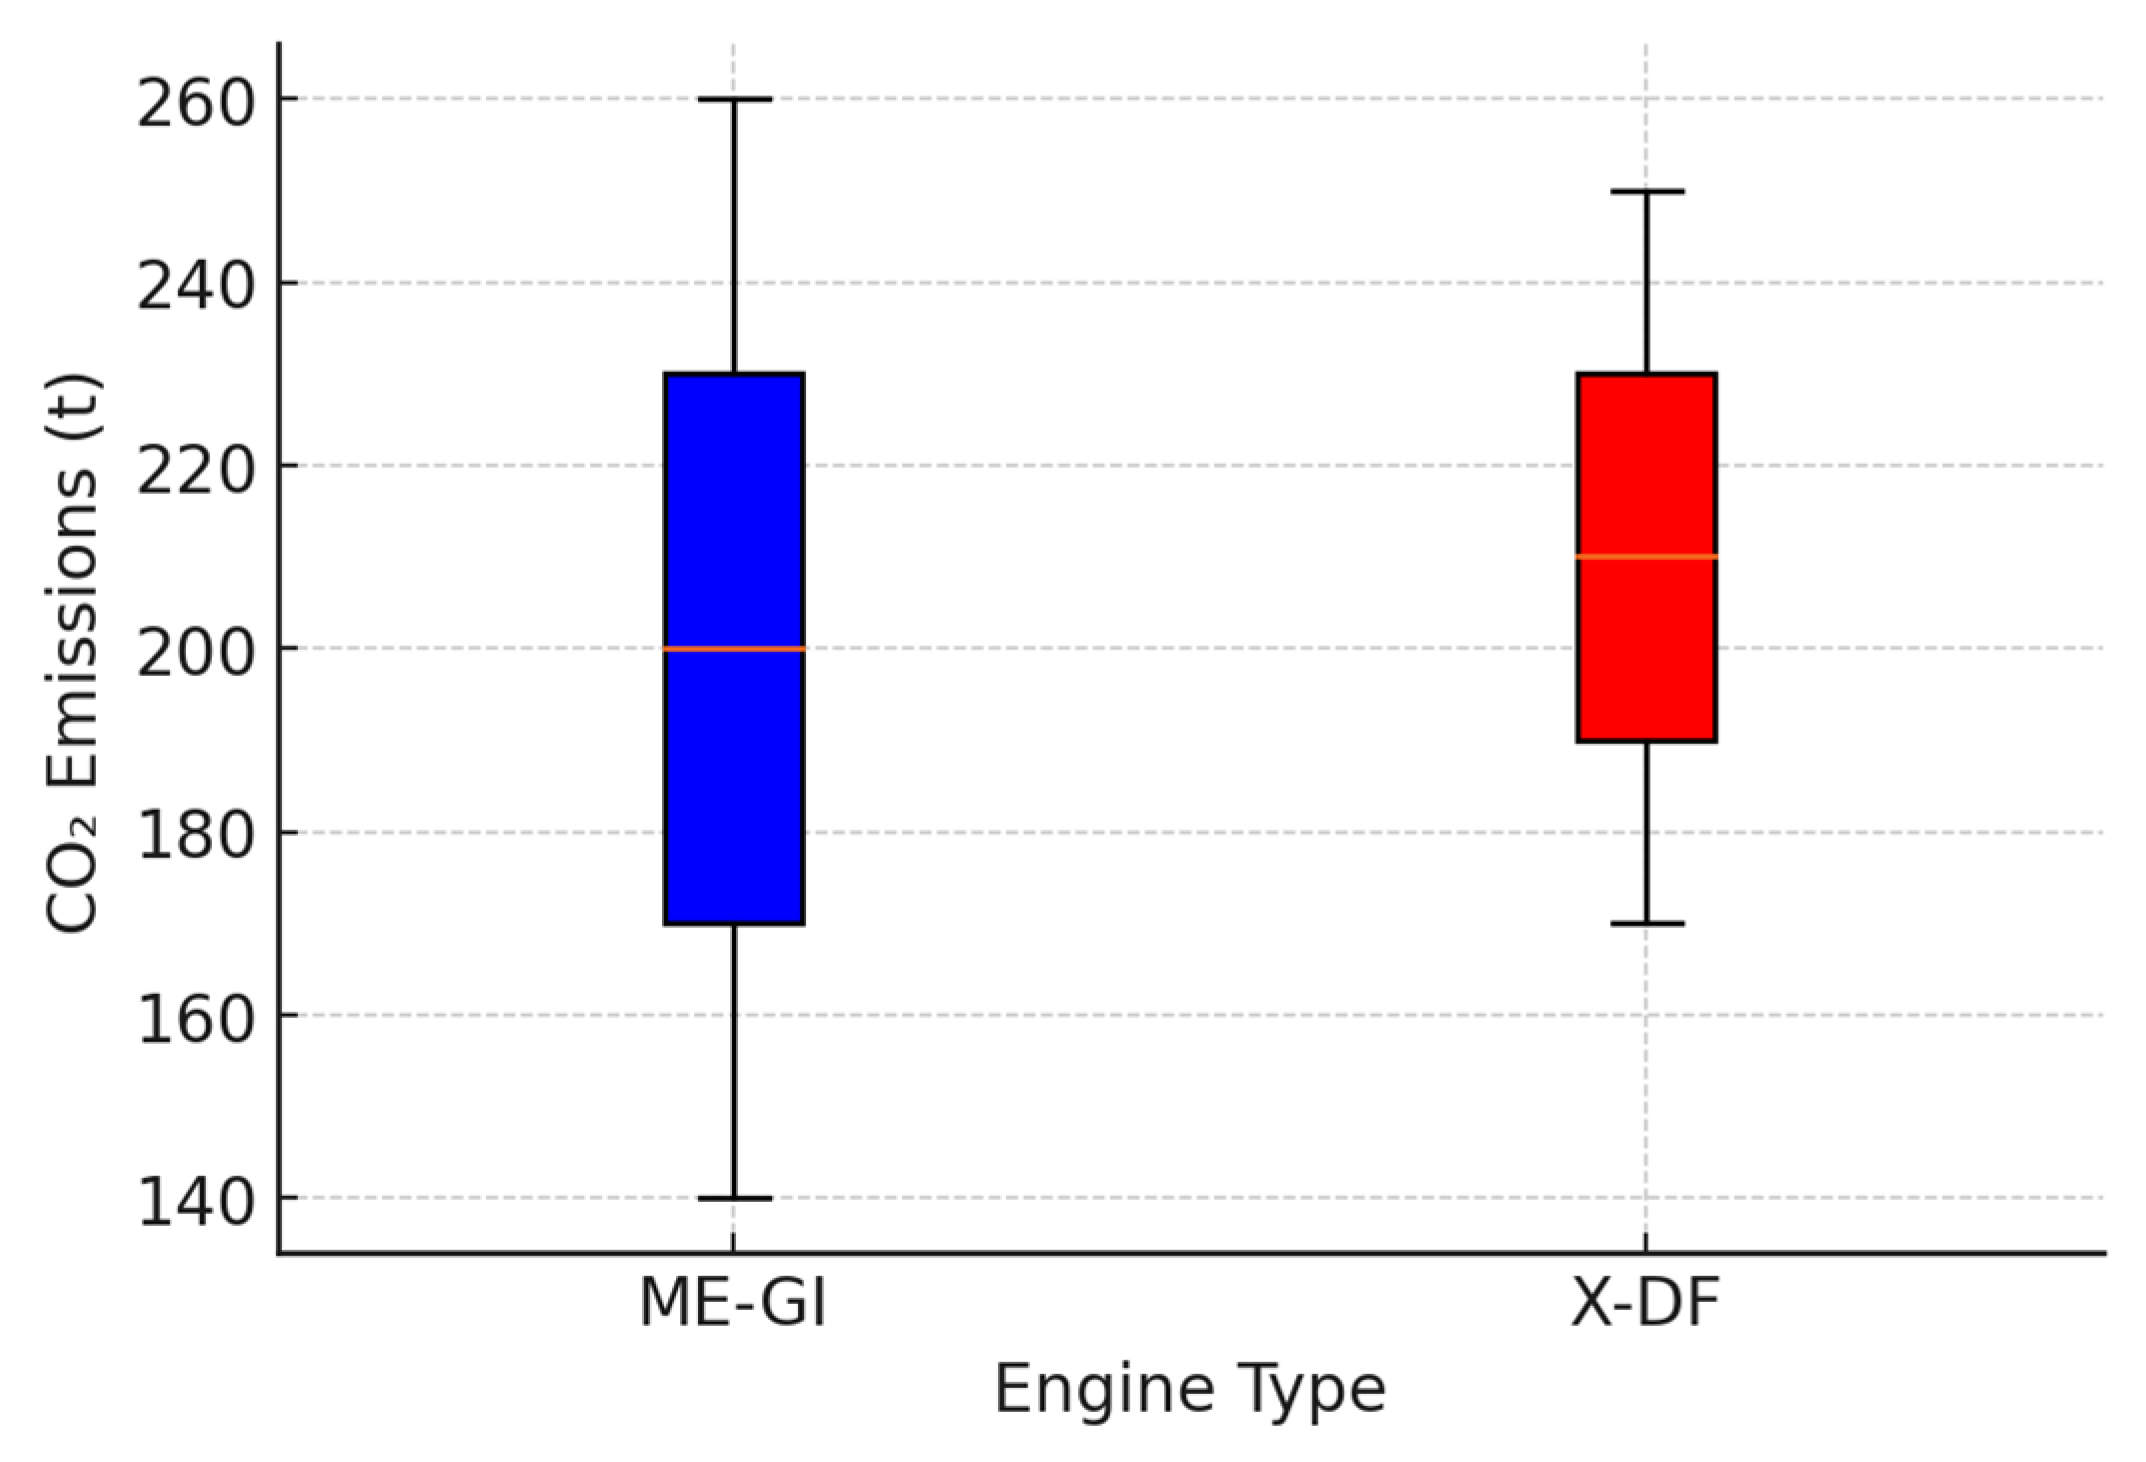
3. Results and Discussion

Next, we present and discuss the results obtained from statistical analyses, including variable correlations, t-tests, regression modeling, clustering techniques, and visualization methods, to evaluate the environmental and operational performance of X-DF and ME-GI propulsion systems.

3.1. Exploratory Data Analyses

The Spearman correlation analysis revealed distinct operational and environmental relationships between ME-GI and X-DF engines. It focused on key variables directly influencing emissions and propulsion performance, including shaft power, RPM, slip, speed over ground (SOG), fuel gas (FG) consumption, CO2 emissions, the EEOI, and the CII. These variables were selected to capture the interplay between operational conditions, fuel efficiency, and environmental impact, forming a comprehensive foundation for evaluating the performance of the two propulsion systems. To maintain clarity in visualizations, Appendix A presents the most impactful correlations. Full correlation matrices with corresponding p-values for all parameters are available in Appendix B. Appendix C contains complementary visualizations of the clustering results and residual patterns for the OLS model discussed in Section 3.2.
For X-DF engines (Appendix A, Figure A1), shaft power shows a strong correlation with CO2 emissions (0.88) and RPM (0.94), reflecting the consistent impact of power demand on fuel combustion and emissions. However, a slightly weaker correlation with RPM compared to ME-GI (Appendix A, Figure A2) engines suggests differences in efficiency, potentially due to operational tuning in X-DF engines. Similarly, slip (%) in X-DF engines exhibits a notable negative correlation with SOG (−0.54), emphasizing inefficiencies under specific speed ranges. The weaker correlation between shaft power and the EEOI (0.33) further highlights X-DF engines’ optimization potential for reducing emissions under variable conditions.
For ME-GI engines, a stronger correlation is observed between shaft power and CO2 emissions (0.91) and between shaft power and RPM (1.0), indicating tighter operational control. This is further supported by the consistent relationship between engine speed and propulsion efficiency, as evidenced by the correlation between RPM and SOG (0.83). However, slip (%) demonstrates limited correlation with most parameters and is weakly negatively correlated with SOG (−0.30), highlighting its limited impact on propulsion efficiency in ME-GI engines.
The environmental metrics reveal additional contrasts. For X-DF engines, the slightly lower correlations between the CII vs. CO2 (0.69) and the EEOI (0.47) indicate better performance in reducing greenhouse gas intensity per unit of transport work. The moderate correlation between slip (%) and the CII (0.64) underlines the role of slip dynamics in influencing environmental efficiency. In ME-GI engines, higher correlations between the CII and CO2 emissions (0.83) suggest a more direct link between power demands, fuel combustion, and emissions intensity.
The relationship between SFOC and key operational parameters provides insight into combustion quality and efficiency. For MEGI engines, a strong correlation exists between SFOC and shaft power, suggesting that maintaining engines within their optimal load range minimizes fuel consumption and emissions. Moderate correlations with RPM and slip further emphasize the importance of efficient propulsion and speed management. Conversely, higher SFOC values are linked to increased CO2 emissions, underscoring the need to align operational conditions with combustion efficiency. In XDF engines, SFOC is strongly influenced by fuel type, with LNG exhibiting lower SFOC due to its cleaner burn and higher thermal efficiency. Variations in load and RPM also show measurable impacts on SFOC, highlighting the potential for dynamic fuel management and load balancing to optimize combustion efficiency. This analysis reveals that both engine types require tailored operational strategies to minimize SFOC, with MEGI engines benefiting from load and propulsion adjustments, and XDF engines excelling through LNG prioritization and real-time fuel optimization.
These insights collectively demonstrate the distinct operational characteristics and trade-offs between ME-GI and X-DF engines. While ME-GI engines exhibit stronger correlations that reflect tighter operational control and higher efficiency under steady conditions, X-DF engines show more nuanced dynamics that align with their dual-fuel technology and potential for optimizing emissions under varying loads.
ME-GI engines exhibit precise and consistent relationships between key operational parameters, such as power, speed, and emissions, underscoring their efficiency and stability under steady-state conditions. In contrast, X-DF engines, with their slightly more variable operational patterns, leverage their adaptability and dual-fuel capabilities to achieve lower emissions intensity across a wider range of conditions. This flexibility makes X-DF engines particularly suited for meeting stringent environmental regulations while optimizing performance under diverse operational demands.

3.2. Interferential Model-Based Analyses

The analysis of emission performance revealed notable differences between ME-GI and X-DF engines with statistical evidence supporting significant distinctions in their operational efficiency and environmental impact. Descriptive statistics for CO2 emissions demonstrate that ME-GI engines, on average, emit 188.07 tons of CO2, with a standard deviation of 33.57 tons and a range from 134.34 to 260.05 tons. In contrast, X-DF engines exhibit higher mean emissions of 205.21 tons, with a smaller standard deviation of 20.01 tons and a range spanning 176.14 to 253.99 tons. These figures highlight the greater variability in ME-GI engine emissions, potentially reflecting differing operational conditions or load profiles.
A statistical comparison using a t-test further substantiated these findings, yielding a test statistic of −5.04 and a p-value of 6.92 × 10⁻⁷. This indicates a statistically significant difference in mean CO2 emissions between the two engine types, with ME-GI engines consistently emitting less CO2 than their X-DF counterparts. This result underscores the efficiency advantages of ME-GI engines, despite their reliance on pilot fuels with higher carbon intensity.
The regression analysis provided deeper insights into the factors influencing CO2 emissions, with the model achieving a strong fit (adjusted R2 = 0.855), explaining 85.5% of the variability in emissions. Shaft power is identified as a significant predictor, with CO2 emissions increasing by 0.0043 tons per additional kilowatt of shaft power (p < 0.001). Similarly, slip is shown to play a critical role, where a 1% increase in propeller slip results in a 2.52-ton rise in CO2 emissions (p < 0.001). Vessel speed also emerges as a key driver, with each additional knot increasing emissions by 11.52 tons (p < 0.001).
Engine type is a significant determinant of emissions, even after controlling for other factors. ME-GI engines are associated with emissions per voyage that are 12.84 tons lower compared to those of X-DF engines (p < 0.001). This finding reflects the higher thermal efficiency of ME-GI engines operating on the diesel cycle, despite the higher carbon intensity of their pilot fuels. In contrast, X-DF engines, while leveraging cleaner-burning LNG, exhibit higher overall emissions, likely due to their reliance on the less efficient Otto cycle and the impact of methane slip [24].
The visualization on Figure 1 highlights key distinctions between ME-GI and X-DF engines in terms of CO2 emissions and their relationship with operational parameters. The distribution of CO2 emissions by engine type reveals that ME-GI engines exhibit a broader range of emissions, reflecting greater variability in operational conditions. However, both the mean and median CO2 emissions are lower for ME-GI engines compared to X-DF engines, suggesting superior emissions performance under similar conditions.
The relationship between shaft power and CO2 emissions further underscores the efficiency of ME-GI engines. While both engine types display a positive correlation between shaft power and emissions, ME-GI engines consistently achieve lower CO2 emissions at equivalent power levels. This indicates that the higher thermal efficiency of ME-GI engines plays a significant role in reducing emissions, even under varying load conditions.
Similarly, the impact of speed on CO2 emissions demonstrates a clear positive trend for both engine types, with higher speeds associated with greater emissions. However, ME-GI engines emit less CO2 at comparable speeds relative to X-DF engines, reaffirming their superior performance in minimizing emissions. These insights underscore the importance of operational parameters such as power and speed in shaping emissions performance and highlight the advantages of ME-GI engines in achieving lower emissions under similar conditions.
Figure 2 highlights differences in CO2 emissions between ME-GI and X-DF engines, emphasizing the influence of shaft power and speed on emissions performance. ME-GI engines display a broader range of emissions but achieve lower mean and median CO2 values compared to X-DF engines, reflecting their efficiency under varying operational conditions. This range underscores the variability in ME-GI engine emissions, likely due to differences in load profiles and operational tuning.
A clear positive correlation is observed between shaft power and CO2 emissions for both engine types, indicating that higher power output is directly associated with increased emissions. However, ME-GI engines generally exhibit lower CO2 emissions at equivalent shaft power levels compared to X-DF engines. This suggests higher thermal efficiency in ME-GI engines, likely attributable to their diesel cycle operation, despite their reliance on pilot fuel with higher carbon intensity.
The relationship between SOG and CO2 emissions (Appendix B, Figure A3) highlights a direct positive correlation for both ME-GI and X-DF engines, where higher speeds result in increased energy output and higher emissions. Similarly, STW shows a moderate correlation (Appendix B, Figure A4) with CO2 emissions, particularly for ME-GI engines, with a Spearman correlation of −0.47, indicating that increased STW reduces emissions due to enhanced efficiency. Regression analysis (Appendix B, Figure A5) of apparent slip versus CO2 emissions further reveals that a 1% increase in slip leads to approximately 12.34 tons of additional CO2 emissions for ME-GI engines, compared to 0.92 tons for X-DF engines. This demonstrates that slip has a significantly greater impact on emissions for ME-GI engines, likely due to their higher sensitivity to hydrodynamic conditions and operational differences. These findings underscore the importance of managing vessel speed and slip to optimize both operational efficiency and environmental performance.
In terms of the EEOI, ME-GI engines demonstrate better operational efficiency with lower and more consistent values (Appendix C, Figure A6). This is indicative of their effective use of fuel and emissions management per ton-mile. X-DF engines, on the other hand, show a broader and higher distribution of EEOI values, which reflects greater variability in fuel efficiency and operational conditions.
The CII distribution further highlights the advantages of ME-GI engines, which maintain lower and more consistent values due to their optimized use of HFO and BOG under operational conditions. X-DF engines generally have higher CII values despite the lower carbon intensity of LNG fuel. This suggests that the higher fuel consumption of X-DF engines outweighs the emissions benefits of LNG.
Overall, the data confirms that ME-GI engines deliver better performance in terms of emissions and operational efficiency, while X-DF engines face challenges in balancing fuel consumption and emissions performance. This emphasizes the trade-offs between thermal efficiency, fuel type, and emissions management in dual-fuel engine systems.
The graphical representation in Appendix D (Figure A7) displays the detected outliers for the EEOI across ME-GI and X-DF engines. A small number of ME-GI outliers (shown in cyan) are identified, reflecting occasional deviations in operational efficiency, likely linked to low transport work scenarios such as ballast voyages or reduced cargo loads. No EEOI outliers are observed for X-DF engines, indicating greater consistency in performance across the analyzed voyages.
Importantly, the EEOI uniquely captures variations in both fuel consumption and actual cargo transported, making it more sensitive to operational anomalies than total CO2 emissions or the CII, which are normalized against static vessel capacity (DWT). The absence of CO2 and CII outliers supports the conclusion that the EEOI provides higher diagnostic resolution for identifying suboptimal or non-standard operating profiles. This makes it particularly valuable for voyage-level performance monitoring under SEEMP Part III frameworks.
To further contextualize the cluster analysis, Cluster 1 primarily captures high-load steady steaming at optimal shaft power, while Cluster 3 reflects transitional regimes characterized by elevated slip and variable RPM.
The clustering analysis in Appendix E, Figure A8 provides actionable insights into the performance of ME-GI and X-DF engines under varying operational conditions, offering a valuable foundation for optimizing SEEMP I strategies.
Cluster 0, dominated by X-DF engines, represents operations with high RPM and moderate shaft power. While X-DF engines show relatively high CO2 emissions (227 tons), their EEOI (13.3 gCO2/ton-mile) and CII (5.8 gCO2/dwt-NM) indicate efficiency under these conditions. In contrast, ME-GI engines in this cluster operate with higher shaft power (20,412 kW) and a significantly poorer EEOI (19.4 gCO2/ton-mile), signaling inefficiencies likely due to unfavorable operational conditions. SEEMP recommendations for this cluster include optimizing RPM tuning for X-DF engines to reduce CO2 emissions and addressing ME-GI operational inefficiencies, such as speed–load alignment and power output optimization.
Cluster 1, where X-DF engines again dominate, is characterized by lower shaft power and moderate emissions efficiency. ME-GI engines are underrepresented but exhibit a drastically higher EEOI (128.1 gCO2/ton-mile), indicating potential inefficiencies linked to suboptimal load conditions or maneuvering profiles. SEEMP action plans should focus on refining ME-GI operations within this cluster by aligning speed and load profiles while maintaining X-DF efficiency through targeted improvements in fuel optimization and voyage planning.
Cluster 2 is exclusive to X-DF engines and represents their optimal operational range. With low shaft power (15,656 kW), RPM (62.3), and CO2 emissions (193.5 tons), this cluster achieves the best EEOI (6.62 gCO2/ton-mile) and CII (5.0 gCO2/dwt-NM). Maintaining these conditions and replicating them across similar voyages should be a key SEEMP objective for X-DF engines.
Cluster 3, dominated exclusively by ME-GI engines, showcases their optimal operational profile. With moderate shaft power (15,656 kW) and lower RPM (62.3) and CO2 emissions (193.5 tons), ME-GI engines achieve improved efficiency metrics (CII: 5.55 gCO2/dwt-NM). SEEMP recommendations should focus on replicating these conditions across voyages, emphasizing voyage planning and load distribution to sustain performance.
The greater dispersion observed in CO2 emissions among ME-GI engines is likely due to fluctuations in shaft power and slip, as well as operational variability in load profiles and voyage planning. Although the dataset reflects standardized LNG fuel usage, transient conditions and suboptimal load control during certain voyages may have contributed to increased variability. This highlights the sensitivity of ME-GI engines to operational fine-tuning, especially outside their steady-state efficiency range.
These findings highlight that X-DF engines excel in achieving low emissions and high efficiency under specific operational clusters, such as Cluster 2, while ME-GI engines demonstrate superior efficiency in their own optimal range (Cluster 3). The visualization of these cluster-specific patterns (Appendix E, Figure A8) underscores the potential of aligning engine performance metrics with SEEMP goals. By leveraging these insights, SEEMP I plans can implement targeted strategies—such as RPM optimization, load balancing, and speed alignment—to reduce emissions and improve operational efficiency.
The following table provides a comprehensive comparison and analysis of ME-GI and X-DF marine engines, focusing on their operational characteristics and environmental impact under full navigation conditions. This analysis is based on empirically gathered data from extensive maritime operations, reflecting real-world performance and emissions metrics. Each engine type is analyzed for its unique operational strengths and challenges, aligning with the objectives of the Ship Energy Efficiency Management Plan (SEEMP) which aims to reduce CO2 emissions and enhance the Carbon Intensity Indicator (CII) and the Energy Efficiency Operational Indicator (EEOI).
ME-GI engines are distinguished by their high thermal efficiency and stability under consistent load conditions, resulting in lower CO2 emissions. In contrast, X-DF engines are adaptable to a range of operational scenarios, showcasing variable combustion efficiency that can be optimized for diverse conditions. The table outlines targeted actions that operators can implement based on these findings to improve engine performance, reduce environmental impacts, and comply with stringent maritime regulations.
It is important to note that while the strategies presented are derived from specific datasets, they are adaptable and can be modified as new data becomes available or if operating conditions change (Table 2).
This ensures that the comparison remains a practical and dynamic tool for maritime operators seeking to optimize performance and sustainability in line with global decarbonization efforts.

4. Conclusions

This study evaluated the environmental and operational performance of X-DF and ME-GI propulsion systems through an analysis of CO2, the EEOI, and the CII and their relationship with key operational factors. Using statistical methods, including correlation analyses, regression modeling, and outlier and clustering techniques, the study identified performance trends, operational inefficiencies, and optimal operating conditions for each engine type. The findings were integrated into actionable recommendations for SEEMP strategies to enhance engine performance and minimize emissions.
Key results indicate that ME-GI engines achieve superior emissions efficiency under stable load conditions, leveraging their thermal efficiency to maintain low CO2 emissions and consistent operational performance. In contrast, X-DF engines excel in dynamic operational contexts, with optimal performance observed under specific clusters where LNG usage minimizes emissions and fuel consumption. Both engines show distinct strengths, with ME-GI engines benefiting from precise operational control and X-DF engines offering adaptability to variable conditions.
While the datasets were unbalanced, normalization ensured comparability across engine types and operational contexts. By focusing on averages and relationships, the analysis minimized the impact of dataset imbalance and avoided unnecessary data manipulation. This approach represented the most practical methodology given the available data, although it may not have captured the full scope of operational variability.
Future studies should aim to incorporate a broader range of operational data, including longer observation periods and more diverse operating conditions, to enhance the robustness of statistical models and provide deeper insights into the performance of dual-fuel propulsion systems. Although seasonal influences are indirectly captured through slip-related resistance, future research could benefit from a more explicit temporal analysis to better understand time-dependent performance trends. Additionally, future studies could incorporate advanced multivariate diagnostics to improve the interpretability of overlapping operational factors.

Author Contributions

Conceptualization, A.V. and R.R.; methodology, A.V.; software, A.V.; validation, A.V. and R.R.; formal analysis, A.V., M.J. and R.R.; investigation, A.V., M.J. and R.R.; resources, A.V. and M.J.; data curation, A.V. and M.J.; writing—original draft preparation, A.V.; writing—review and editing, A.V. and R.R.; visualization, A.V.; supervision, R.R.; funding acquisition. All authors have read and agreed to the published version of the manuscript.

Funding

This research received no external funding.

Institutional Review Board Statement

Not applicable—this study did not involve humans or animals.

Informed Consent Statement

Not applicable.

Data Availability Statement

The datasets generated and analyzed during this study are publicly available via Figshare at the following link: https://figshare.com/projects/Comparative_Analysis/251150 (accessed on 27 May 2025).

Conflicts of Interest

The authors declare no conflicts of interest.

Abbreviations

The following abbreviations are used in this manuscript:
BOGBoil-Off Gas
CIICarbon Intensity Indicator
CTSCustody Transfer Measurement System
DCSData Collection System
DWTDeadweight Tonnage
EEOIEnergy Efficiency Operational Indicator
EEDIEnergy Efficiency Design Index
EEXIEnergy Efficiency Existing Ship Index
FGFuel Gas
FO EQFuel Oil Equivalent
FPPFixed Pitch Propeller
GCUGas Combustion Unit
GTGross Tonnage
IMOInternational Maritime Organization
LOGLog Distance
LSHFOLow-Sulphur Heavy Fuel Oil
LSMGOLow-Sulphur Marine Gas Oil
MARPOL 73/78International Convention for the Prevention of Pollution from Ships
MCRMaximum Continuous Rating
ME-GIMAN B&W Electronically Controlled Gas Injection (Diesel Cycle)
OGOverground Distance
RPMRevolutions Per Minute
SEEMPShip Energy Efficiency Management Plan
SFOCSpecific Fuel Oil Consumption
SOGSpeed Over Ground
STWSpeed Through Water
X-DFLow-Pressure Dual-Fuel Engine (by Wärtsilä/WinGD, Otto cycle)

Appendix A

Spearman Correlation Analysis Visualization

Figure A1. Spearman correlation matrix for X-DF.
Sustainability 17 05140 g0a1
Figure A2. Spearman correlation matrix for ME-GI.
Sustainability 17 05140 g0a2

Appendix B

CO2 Emissions vs. Ship’s Speed

Figure A3. CO2 emissions vs. SOG by engine type.
Sustainability 17 05140 g0a3
Figure A4. CO2 emissions vs. STW by engine type.
Sustainability 17 05140 g0a4
Figure A5. Regression analyses for slip vs. CO2 emissions.
Sustainability 17 05140 g0a5

Appendix C

CO2, EEOI, and CII Distributions

Figure A6. Distributions of CO2 emissions, EEOI, and CII.
Sustainability 17 05140 g0a6

Appendix D

Outliers

Figure A7. EEOI outliers.
Sustainability 17 05140 g0a7

Appendix E

Cluster Analyses

Figure A8. Cluster analyses of engine performance metrics.
Sustainability 17 05140 g0a8

References

  1. Guan, C.; Theotokatos, G.; Chen, H. Analysis of Two Stroke Marine Diesel Engine Operation Including Turbocharger Cut-Out by Using a Zero-Dimensional Model. Energies 2015, 8, 5738–5764. [Google Scholar] [CrossRef]
  2. He, K.; Zhang, X.; Ren, S.; Sun, J. Deep Residual Learning for Image Recognition. In Proceedings of the 2016 IEEE Conference on Computer Vision and Pattern Recognition (CVPR), Las Vegas, NV, USA, 30 June 2016; IEEE: Piscataway, NJ, USA, 2016; pp. 770–778. [Google Scholar]
  3. Yang, J.; Wu, L.; Zheng, J. Multi-Objective Weather Routing Algorithm for Ships: The Perspective of Shipping Company’s Navigation Strategy. J. Mar. Sci. Eng. 2022, 10, 1212. [Google Scholar] [CrossRef]
  4. Llamas, H.; Eriksson, L. Control-oriented modeling of two-stroke diesel engines with exhaust gas recirculation for marine applications. Sage J. 2019, 233, 2. [Google Scholar] [CrossRef]
  5. Buhaug, Ø.; Corbett, J.J.; Endressen, Ø.; Eyring, V.; Faber, J. Second IMO GHG Study 2009; IMO: London, UK, 2009. [Google Scholar]
  6. Dettner, F.; Hilpert, S. Modelling CO2 emissions and mitigation potential of Northern European shipping. Transp. Res. Part D Transp. Environ. 2023, 119, 103745. [Google Scholar] [CrossRef]
  7. Bach, H.; Hansen, T. IMO off course for decarbonisation of shipping? Three challenges for stricter policy. Mar. Policy 2023, 147, 105379. [Google Scholar] [CrossRef]
  8. Fan, L.; Yang, H.; Zhang, X. Targeting the Effectiveness Assessment of the Emission Control Policies on the Shipping Industry. Sustainability 2024, 16, 2465. [Google Scholar] [CrossRef]
  9. Hansen, E.K.; Rasmussen, H.B.; Lützen, M. Making shipping more carbon-friendly? Exploring ship energy efficiency management plans in legislation and practice. Energy Res. Soc. Sci. 2020, 65, 101459. [Google Scholar] [CrossRef]
  10. Sardar, A.; Islam, R.; Anantharaman, M.; Garaniya, V. Advancements and obstacles in improving the energy efficiency of maritime vessels: A systematic review. Mar. Pollut. Bull. 2025, 214, 117688. [Google Scholar] [CrossRef] [PubMed]
  11. IMO. 2023 IMO Strategy on Reduction of Ghg Emissions from Ships. Resolution MEPC.377(80). 2023. Available online: https://wwwcdn.imo.org/localresources/en/MediaCentre/PressBriefings/Documents/Clean%20version%20of%20Annex%201.pdf (accessed on 17 October 2024).
  12. Vorkapić, A.; Radonja, R.; Martinčić-Ipšić, S. A framework for the application of shipboard energy efficiency monitoring, operational data prediction and reporting. Pomorstvo 2021, 35, 3–15. [Google Scholar] [CrossRef]
  13. Rempel Da Silva, A.; França, G.C.; Ordonez, J.C.; Hood Marques, C. On the Prediction of Fuel Consumption for Dual-Fuel Low-Speed Marine Engines. In Proceedings of the ASME 2023 International Mechanical Engineering Congress and Exposition, New Orleans, LA, USA, 29 October–2 November 2023; American Society of Mechanical Engineers: New York, NY, USA, 2023; Volume 7, p. V007T08A004. [Google Scholar] [CrossRef]
  14. Vorkapić, A.; Radonja, R.; Babić, K.; Martinčić-Ipšić, S. Machine learning methods in monitoring operating behaviour of marine two-stroke diesel engine. Transport 2020, 35, 462–473. [Google Scholar] [CrossRef]
  15. Zhu, L.; Li, B.; Li, A.; Ji, W.; Qian, Y.; Lu, X.; Huang, Z. Effects of fuel reforming on large-bore low-speed two-stroke dual fuel marine engine combined with EGR and injection strategy. Int. J. Hydrogen Energy 2020, 45, 29505–29517. [Google Scholar] [CrossRef]
  16. Marques, C.H.; Caprace, J.-D.; Belchior, C.R.P.; Martini, A. An Approach for Predicting the Specific Fuel Consumption of Dual-Fuel Two-Stroke Marine Engines. J. Mar. Sci. Eng. 2019, 7, 20. [Google Scholar] [CrossRef]
  17. Inal, O.B.; Charpentier, J.-F.; Deniz, C. Hybrid power and propulsion systems for ships: Current status and future challenges. Renew. Sustain. Energy Rev. 2022, 156, 111965. [Google Scholar] [CrossRef]
  18. Geertsma, R.D.; Negenborn, R.R.; Visser, K.; Hopman, J.J. Design and control of hybrid power and propulsion systems for smart ships: A review of developments. Appl. Energy 2017, 194, 30–54. [Google Scholar] [CrossRef]
  19. Oh, M.-J.; Roh, M.-I.; Park, S.-W.; Chun, D.-H.; Son, M.-J.; Lee, J.-Y. Operational Analysis of Container Ships by Using Maritime Big Data. J. Mar. Sci. Eng. 2021, 9, 438. [Google Scholar] [CrossRef]
  20. Huang, L.; Pena, B.; Liu, Y.; Anderlini, E. Machine learning in sustainable ship design and operation: A review. Ocean Eng. 2022, 266, 112907. [Google Scholar] [CrossRef]
  21. Rauca, L.; Batrinca, G. Impact of Carbon Intensity Indicator on the Vessels’ Operation and Analysis of Onboard Operational Measures. Sustainability 2023, 15, 11387. [Google Scholar] [CrossRef]
  22. Yu, H.; Gao, J.; Zhang, P.; Han, F.J.; Yang, Q.; Cui, B. The impact of scavenging air state on the combustion and emission performance of marine two-stroke dual-fuel engine. Sci. Rep. 2024, 14, 15776. [Google Scholar] [CrossRef]
  23. IMO. 2018 Guidelines on the Method of Calculation of the Attained Energy Efficiency Design Index (EEDI) for New Ships; IMO: London, UK, 2018; Available online: https://wwwcdn.imo.org/localresources/en/KnowledgeCentre/IndexofIMOResolutions/MEPCDocuments/MEPC.308(73).pdf (accessed on 27 May 2025).
  24. Balcombe, P.; Heggo, D.A.; Harrison, M. Total Methane and CO2 Emissions from Liquefied Natural Gas Carrier Ships: The First Primary Measurements. Environ. Sci. Technol. 2022, 56, 9632–9640. [Google Scholar] [CrossRef] [PubMed]
Figure 1. CO2 emission variability for X-DF and MEGI engines.
Sustainability 17 05140 g001
Figure 2. CO2 emissions vs. shaft power by engine type.
Sustainability 17 05140 g002
Table 1. The list of variables with tag abbreviation, description and measurement unit.
TagDescriptionUnit
dateDate of data collection-
voy#Voyage number with cargo state (ballast or laden)-
ctsCustody Transfer Measurement SystemMT
rhrsPropulsion running hourshrs
shaft powerAverage shaft powerkW
fo eqEquivalent fuel oil consumptionMT
ref. SFOCReference specific fuel oil consumptiong/kWh
% higherPercentage deviation from reference SFOC%
rpmShaft speed°/min
OGOverground millageNm
slipOverground apparent slip%
SOGSpeed over groundkts
LOGMillage through waterNm
STWAverage speed through waterkts
pilotPilot consumption (with DCC for X-DF)MT
FGFuel gas consumptionMT
CO2Carbon dioxide emissionsMT
EEOIEnergy Efficiency Operational IndicatorgCO2/ton-mile
CIICarbon Intensity IndicatorgCO2/dwt-Nm
Table 2. SEEMP-aligned strategies for optimizing X-DF and ME-GI propulsion.
AspectX-DF Actions for X-DF ME-GIActions for ME-GI
Combustion EfficiencyHigh adaptability with variable combustion efficiencyUtilize variable engine settings to adapt to changing conditionsHigh thermal efficiency with stable load conditionsMaintain engines at optimal operating points for efficiency
Emissions ProfileSlightly higher emission variability; adaptable to diverse operationsImplement advanced emission monitoring systemsConsistently lower CO2 emissions due to precise combustion controlFine-tune combustion timing and control
Operational OptimizationFocus on flexible fuel management and operational adaptabilityUse real-time data analytics for dynamic load and fuel managementFocus on maintaining optimal shaft power and RPMRegularly adjust load to maintain high thermal efficiency
CO2 Emission ImpactModifiable emissions profile through efficient LNG combustionEnhance combustion control and reduce methane slipLower emissions due to efficient fuel combustionOptimize operational parameters to minimize methane slip
EEOI (Efficiency Indicator)Variable EEOI, reflecting adaptive operational efficienciesOptimize voyage planning and operational strategies to improve EEOILower EEOI due to stable and efficient operationsConduct continuous performance analysis to maintain low EEOI
CII (Intensity Indicator)Potentially higher CII, necessitating targeted operational optimizationsStrategic route planning and optimization to improve CIIFavorably low CII values in optimized operational conditionsEngage in proactive route and speed optimization to maintain low CII
Strategic Operational FocusPrioritizes dynamic balancing of load and fuel adjustmentsEmploy hybrid energy systems where possible for better efficiencyEmphasis on load management and propulsion efficiencyImplement advanced propulsion management technologies
SEEMP Action RecommendationsLeverage fuel flexibility to optimize emissions and efficiency metricsFocus on continuous training and updating of operational practicesOptimize operational parameters to sustain efficiencyTrain crew on energy efficiency practices and system handling
Disclaimer/Publisher’s Note: The statements, opinions and data contained in all publications are solely those of the individual author(s) and contributor(s) and not of MDPI and/or the editor(s). MDPI and/or the editor(s) disclaim responsibility for any injury to people or property resulting from any ideas, methods, instructions or products referred to in the content.

