
Life Expectancy and Its Determinants in Selected European Union (EU) and Non-EU Countries in the Mediterranean Region


Abstract
1. Introduction
1.1. General Context in the Mediterranean Region
1.2. Life Expectancy in the Mediterranean Region: Interlinking the Input Variables
1.3. Novelty, Motivation for Research, and Research Questions
2. Literature Review
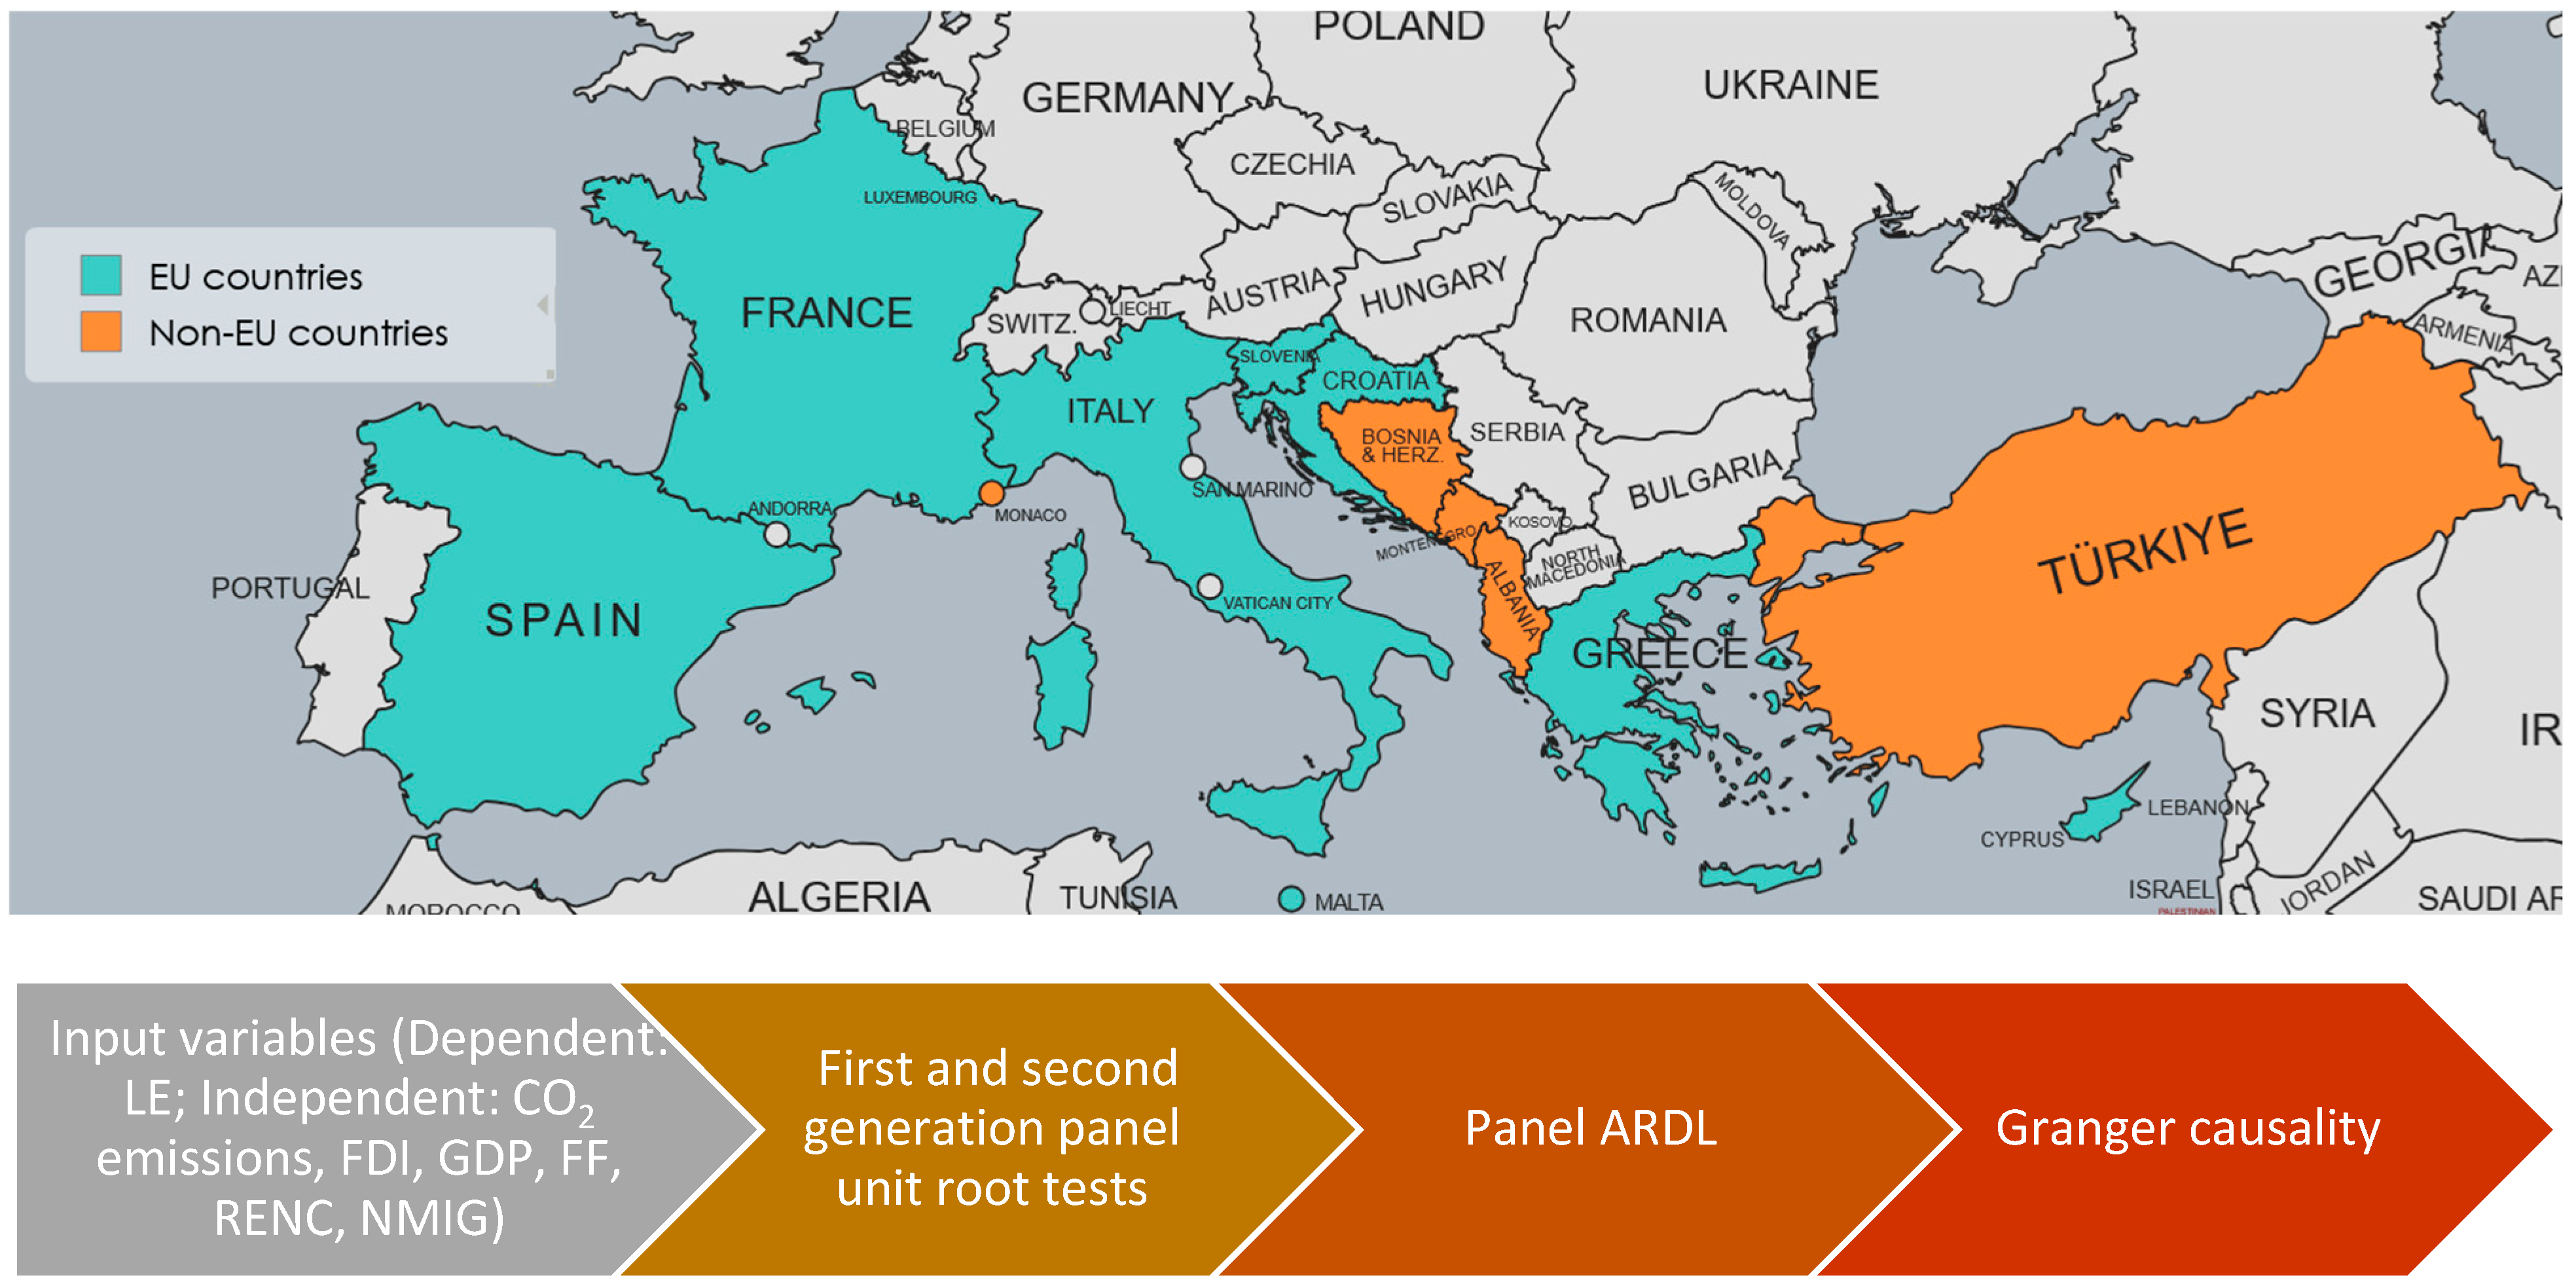
- Integrate multiple dimensions like migration, FDI, energy structure (fossil vs renewables), and CO2 emissions together as determinants of LE;
- Contrast EU and non-EU Mediterranean countries to reveal regional disparities in long-term health outcomes;
- Apply a dynamic econometric technique such as panel ARDL to disentangle short- and long-run effects of these factors;
- Examine the role of migration in relation to LE in the Mediterranean context, where migration pressure is high and politically salient.
3. Methodology
3.1. First-Generation PURTs
3.2. Second-Generation Panel Unit Root Tests
3.3. Panel ARDL
3.4. Data Quality and Missing Values Considerations
4. Results and Discussions
4.1. First- and Second-Generation PURT and Panel ARDL
4.2. Comparative Discussion for Med8 and Med4 Countries
5. Conclusions and Policy Implications
Author Contributions
Funding
Institutional Review Board Statement
Informed Consent Statement
Data Availability Statement
Acknowledgments
Conflicts of Interest
Nomenclature
| Abbreviation | Description |
| ADF | Augmented Dickey–Fuller |
| AH | Alternative Hypothesis |
| AIC | Akaike Information Criterion |
| ARDL | Autoregressive distributed lag |
| BMI | Body Mass Index |
| BRICS | Brazil, Russia, India, China, South Africa |
| CADF | Cross-section Augmented Dickey–Fuller |
| CIPS | Cross-sectionally augmented Im–Pesaran–Shin |
| CO2 | Carbon dioxide |
| CPI | Consumer price index |
| nGc | does not homogeneously cause |
| ECT | Error Correction Term |
| EKC | Environmental Kuznets Curve |
| EMR | Eastern Mediterranean Region |
| EPREN | Energy production from renewable sources |
| EU | European Union |
| FDI | Foreign Direct Investment |
| FF | Fossil fuels |
| GHG | Greenhouse gas |
| GDP | Gross Domestic Product per capita |
| GMM | Generalized Method of Moments |
| GNI | Gross National Income |
| HIV | Human Immunodeficiency Virus |
| HLE | Healthy life expectancy |
| IPS | Im–Pesaran–Shin |
| LE | Life expectancy |
| LLC | Levin, Lin, and Chu |
| Med4 | Non-EU Mediterranean Countries (Albania, Turkey, Montenegro, Bosnia and Herzegovina) |
| Med8 | EU Mediterranean Countries (Spain, France, Italy, Malta, Slovenia, Croatia, Greece, Cyprus) |
| NARDL | Nonlinear Autoregressive Distributed Lag |
| NH | Null hypothesis |
| NMIG | Net migration |
| Non-EU-Med4 | Non-EU Mediterranean Countries (Albania, Turkey, Montenegro, Bosnia and Herzegovina |
| PURT | Panel Unit Root Test |
| RENC | Renewable energy consumption |
| RES | Renewable Energy Sources |
| RQ | Research Question |
| SAARC | South Asian Association for Regional Cooperation |
| SDOH | Social determinants of health |
| SEE | Southeastern European countries |
| SEM | Structural equation modeling |
| STIRPAT | Stochastic Impacts by Regression on Population, Affluence, and Technology |
| UK | United Kingdom |
| URB | Urbanization |
| USA | United States of America |
| VAR | Vector autoregression |
| VECM | Vector Error Correction Model |
| WHO | World Health Organization |
Appendix A

| LE | GDP | RENC | FF | FDI | CO2 | NMIG | |
|---|---|---|---|---|---|---|---|
| LE | 1.000 | 0.384 | 0.221 | −0.186 | 0.340 | 0.036 | −0.077 |
| GDP | 0.384 | 1.000 | −0.219 | 0.238 | −0.362 | 0.642 | −0.591 |
| RENC | 0.221 | −0.219 | 1.000 | −0.679 | 0.715 | −0.573 | 0.254 |
| FF | −0.186 | 0.238 | −0.679 | 1.000 | −0.711 | 0.699 | −0.280 |
| FDI | 0.340 | −0.362 | 0.715 | −0.711 | 1.000 | −0.663 | 0.451 |
| CO2 | 0.036 | 0.642 | −0.573 | 0.699 | −0.663 | 1.000 | −0.437 |
| NMIG | −0.077 | −0.591 | 0.254 | −0.280 | 0.451 | −0.437 | 1.000 |
| LE | GDP | RENC | FF | FDI | CO2 | NMIG | |
|---|---|---|---|---|---|---|---|
| LE | 1.000 | 0.761 | 0.174 | −0.139 | 0.166 | −0.074 | 0.005 |
| GDP | 0.761 | 1.000 | 0.176 | −0.278 | 0.040 | 0.218 | −0.107 |
| RENC | 0.174 | 0.176 | 1.000 | −0.428 | −0.230 | −0.176 | −0.053 |
| FF | −0.139 | −0.278 | −0.428 | 1.000 | 0.218 | 0.163 | 0.450 |
| FDI | 0.166 | 0.040 | −0.230 | 0.218 | 1.000 | −0.276 | 0.278 |
| CO2 | −0.074 | 0.218 | −0.176 | 0.163 | −0.276 | 1.000 | −0.177 |
| NMIG | 0.005 | −0.107 | −0.053 | 0.450 | 0.278 | −0.177 | 1.000 |
References
- Scheffran, J. The Geopolitical Impact of Climate Change in the Mediterranean Region: Climate Change as a Trigger of Conflict and Migration. Mediterr. Yearb. 2020 Clim. Chang. Mediterr. 2020. Available online: https://www.iemed.org/publication/the-geopolitical-impact-of-climate-change-in-the-mediterranean-region-climate-change-as-a-trigger-of-conflict-and-migration/ (accessed on 25 May 2025).
- Zapata-Barrero, R. New Scales of Migration Governance in the Mediterranean: Regional Cities in the Spotlight. Eur. Urban Reg. Stud. 2023, 30, 121–134. [Google Scholar] [CrossRef]
- Etling, A.; Backeberg, L.; Tholen, J. The Political Dimension of Young People’s Migration Intentions: Evidence from the Arab Mediterranean Region. J. Ethn. Migr. Stud. 2020, 46, 1388–1404. [Google Scholar] [CrossRef]
- Tugcu, C.T. Tourism and Economic Growth Nexus Revisited: A Panel Causality Analysis for the Case of the Mediterranean Region. Tour. Manag. 2014, 42, 207–212. [Google Scholar] [CrossRef]
- Šimundić, B.; Kuliš, Z. Tourism and Economic Growth in Mediterranean Region: Dynamic Panel Data Approach. Acta Econ. Tur. 2016, 2, 65–84. [Google Scholar] [CrossRef]
- Gao, J.; Xu, W.; Zhang, L. Tourism, Economic Growth, and Tourism-Induced EKC hypothesis: Evidence from the Mediterranean Region. Empir. Econ. 2021, 60, 1507–1529. [Google Scholar] [CrossRef]
- Niavis, S.; Papatheochari, T.; Koutsopoulou, T.; Coccossis, H.; Psycharis, Y. Considering Regional Challenges When Prioritizing Tourism Policy Interventions: Evidence from a Mediterranean Community of Projects. J. Sustain. Tour. 2022, 30, 663–684. [Google Scholar] [CrossRef]
- Lionello, P.; Scarascia, L. The Relation Between Climate Change in the Mediterranean Region and Global Warming. Reg. Environ. Change 2018, 18, 1481–1493. [Google Scholar] [CrossRef]
- Torres, C.; Jordà, G.; de Vílchez, P.; Vaquer-Sunyer, R.; Rita, J.; Canals, V.; Cladera, A.; Escalona, J.M.; Miranda, M.Á. Climate Change and Their Impacts in the Balearic Islands: A Guide for Policy Design in Mediterranean Regions. Reg. Environ. Change 2021, 21, 107. [Google Scholar] [CrossRef]
- Hallett, C.S.; Hobday, A.J.; Tweedley, J.R.; Thompson, P.A.; McMahon, K.; Valesini, F.J. Observed and Predicted Impacts of Climate Change on the Estuaries of South-Western Australia, a Mediterranean Climate Region. Reg. Environ. Change 2018, 18, 1357–1373. [Google Scholar] [CrossRef]
- Taliotis, C.; Karmellos, M.; Fylaktos, N.; Zachariadis, T. Enhancing Decarbonization of Power Generation Through Electricity Trade in the Eastern Mediterranean and Middle East Region. Renew. Sustain. Energy Transit. 2023, 4, 100060. [Google Scholar] [CrossRef]
- Tekin, S.; Guner, E.D.; Cilek, A.; Cilek, M.U. Selection of Renewable Energy Systems Sites Using the MaxEnt Model in the Eastern Mediterranean Region in Turkey. Environ. Sci. Pollut. Res. 2021, 28, 51405–51424. [Google Scholar] [CrossRef] [PubMed]
- Jablonski, S.; Tarhini, M.; Touati, M.; Garcia, D.G.; Alario, J. The Mediterranean Solar Plan: Project Proposals for Renewable Energy in the Mediterranean Partner Countries Region. Energy Policy 2012, 44, 291–300. [Google Scholar] [CrossRef]
- Gjika, E.; Basha, L.; Sokoli, A. Climate Change and its Effect on the Energy Production from Renewable Sources—A Case Study in Mediterranean Region. J. Ecol. Eng. 2022, 23, 285–298. [Google Scholar] [CrossRef]
- Ulucak, Z.S.; Yucel, A.G. Can Renewable Energy Be Used as an Effective Tool in the Decarbonization of the Mediterranean Region: Fresh Evidence Under Cross-Sectional Dependence. Environ. Sci. Pollut. Res. 2021, 28, 52082–52092. [Google Scholar] [CrossRef]
- Panebianco, S. The EU and Migration in the Mediterranean: EU Borders’ Control by Proxy. J. Ethn. Migr. Stud. 2022, 48, 1398–1416. [Google Scholar] [CrossRef]
- Panebianco, S. Migration Governance in the Mediterranean: The Siracusa Experience. Geopolitics 2022, 27, 752–772. [Google Scholar] [CrossRef]
- Varani, N.; Bernardini, E. The Mediterranean Region: Between Terrorism, Tourism and Security. Geopolit. Soc. Secur. Free. J. 2018, 1, 135–148. [Google Scholar] [CrossRef]
- Radmehr, M.; Adebayo, T.S. Does Health Expenditure Matter for Life Expectancy in Mediterranean Countries? Environ. Sci. Pollut. Res. 2022, 29, 60314–60326. [Google Scholar] [CrossRef] [PubMed]
- Benassi, F.; Carella, M.; Heins, F. Migration in the Mediterranean Region: A Response to Crises and an Emergency in Its Own Right. Investig. Geogr. 2022, 77, 15–36. [Google Scholar] [CrossRef]
- Dhana, K.; Franco, O.H.; Ritz, E.M.; Ford, C.N.; Desai, P.; Krueger, K.R.; Holland, T.M.; Dhana, A.; Liu, X.; Aggarwal, N.T.; et al. Healthy Lifestyle and Life Expectancy with and without Alzheimer’s Dementia: Population Based Cohort Study. BMJ 2022, 377, e068390. [Google Scholar] [CrossRef]
- Sezaki, A.; Imai, T.; Miyamoto, K.; Kawase, F.; Shirai, Y.; Abe, C.; Sanada, M.; Inden, A.; Rato, T.; Sugihara, N.; et al. Association between the Mediterranean Diet Score and Healthy Life Expectancy: A Global Comparative Study. J. Nutr. Health Aging 2022, 26, 621–627. [Google Scholar] [CrossRef] [PubMed]
- Seddighi, H.; Nejad, F.N.; Basakha, M. Health Systems Efficiency in Eastern Mediterranean Region: A Data Envelopment Analysis. Cost Eff. Resour. Alloc. 2020, 18, 22. [Google Scholar] [CrossRef] [PubMed]
- Gilligan, A.M.; Skrepnek, G.H. Determinants of Life Expectancy in the Eastern Mediterranean Region. Health Policy Plan. 2015, 30, 624–637. [Google Scholar] [CrossRef] [PubMed]
- Mokdad, A.H.; Forouzanfar, M.H.; Daoud, F.; El Bcheraoui, C.; Moradi-Lakeh, M.; Khalil, I.; Afshin, A.; Tuffaha, M.; Charara, R.; Barber, R.M.; et al. Health in Times of Uncertainty in the Eastern Mediterranean Region, 1990–2013: A Systematic Analysis for the Global Burden of Disease Study 2013. Lancet Glob. Health 2016, 4, e704–e713. [Google Scholar] [CrossRef]
- Belaïd, F.; Zrelli, M.H. Renewable and Non-Renewable Electricity Consumption, Environmental Degradation and Economic Development: Evidence from Mediterranean Countries. Energy Policy 2019, 133, 110929. [Google Scholar] [CrossRef]
- Al Araby, L.; Samak, N.; Ibrahiem, D.M. The Impact of Renewable and Non-Renewable Energy on Carbon Dioxide Emission: An Empirical Analysis for Euro Mediterranean Countries. Int. J. Energy Econ. Policy 2019, 9, 103–108. [Google Scholar] [CrossRef]
- Farchi, S.; De Sario, M.; Lapucci, E.; Davoli, M.; Michelozzi, P. Meat Consumption Reduction in Italian Regions: Health co-Benefits and Decreases in GHG Emissions. PLoS ONE 2017, 12, e0182960. [Google Scholar] [CrossRef]
- Gyamfi, B.A.; Adebayo, T.S.; Bekun, F.V.; Agyekum, E.B.; Kumar, N.M.; Alhelou, H.H.; Al-Hinai, A. Beyond Environmental Kuznets Curve and Policy Implications to Promote Sustainable Development in Mediterranean. Energy Rep. 2021, 7, 6119–6129. [Google Scholar] [CrossRef]
- Tecel, A.; Katircioğlu, S.; Taheri, E.; Bekun, F.V. Causal Interactions Among Tourism, Foreign Direct Investment, Domestic Credits, and Economic Growth: Evidence from Selected Mediterranean Countries. Port. Econ. J. 2020, 19, 195–212. [Google Scholar] [CrossRef]
- Abdouli, M.; Omri, A. Exploring the Nexus Among FDI Inflows, Environmental Quality, Human Capital, and Economic Growth in the Mediterranean Region. J. Knowl. Econ. 2021, 12, 788–810. [Google Scholar] [CrossRef]
- Ulucak, R.; Erdogan, F.; Bostanci, S.H. A STIRPAT-Based Investigation on the Role of Economic Growth, Urbanization, and Energy Consumption in Shaping a Sustainable Environment in the Mediterranean Region. Environ. Sci. Pollut. Res. 2021, 28, 55290–55301. [Google Scholar] [CrossRef] [PubMed]
- Balli, E.; Sigeze, C.; Manga, M.; Birdir, S.; Birdir, K. The Relationship Between Tourism, CO2 Emissions and Economic Growth: A Case of Mediterranean Countries. Asia Pac. J. Tour. Res. 2019, 24, 219–232. [Google Scholar] [CrossRef]
- Aslan, A.; Altinoz, B.; Özsolak, B. The Nexus Between Economic Growth, Tourism Development, Energy Consumption, and CO2 Emissions in Mediterranean Countries. Environ. Sci. Pollut. Res. 2021, 28, 3243–3252. [Google Scholar] [CrossRef]
- Zrelli, M.H. Renewable Energy, Non-Renewable Energy, Carbon Dioxide Emissions and Economic Growth in Selected Mediterranean Countries. Environ. Econ. Policy Stud. 2017, 19, 691–709. [Google Scholar] [CrossRef]
- Gilligan, A.; Skrepnek, G. PIH30 the Determinants of Life Expectancy in Eastern Mediterranean Countries: An Analysis of World Health Organization (WHO) Data. Value Health 2010, 13, A185. [Google Scholar] [CrossRef]
- Warsame, A.A. Environmental Pollution and Life Expectancy in Somalia: Do Renewable Energy, Urbanization, and Economic Growth Matter? Environ. Sci. Pollut. Res. 2023, 30, 110528–110538. [Google Scholar] [CrossRef] [PubMed]
- Bayati, M.; Akbarian, R.; Kavosi, Z. Determinants of Life Expectancy in Eastern Mediterranean Region: A Health Production Function. Int. J. Health Policy Manag. 2013, 1, 57–61. [Google Scholar] [CrossRef]
- Noughabi, J.J.; Khanmohammadian, S.; Soltani, S.; Faramarzi, A.; Khosravi, B. Impact of the Economic Crisis on Health Indicators: A Panel Data Analysis in Eastern Mediterranean Countries. Res. J. Pharm. Biol. Chem. Sci. 2016, 7, 98–101. [Google Scholar]
- Rahman, M.M.; Rana, R.; Khanam, R. Determinants of Life Expectancy in Most Polluted Countries: Exploring the Effect of Environmental Degradation. PLoS ONE 2022, 17, e0262802. [Google Scholar] [CrossRef]
- Paramita, S.A.; Yamazaki, C.; Koyama, H. Determinants of life Expectancy and Clustering of Provinces to Improve Life Expectancy: An Ecological Study in Indonesia. BMC Public Health 2020, 20, 351. [Google Scholar] [CrossRef]
- Duque, A.M.; Peixoto, M.V.; Lima, S.V.; Goes, M.A.O.; Santos, A.D.; Araújo, K.C.G.M.; Nunes, M.A.P. Analysis of the Relationship between Life Expectancy and Social Determinants in a North-Eastern Region of Brazil, 2010–2017. Geospat. Health 2018, 13, 345–352. [Google Scholar] [CrossRef] [PubMed]
- Galvani-Townsend, S.; Martinez, I.; Pandey, A. Is Life Expectancy Higher in Countries and Territories with Publicly Funded Health Care? Global Analysis of Health Care Access and the Social Determinants of Health. J. Glob. Health 2022, 12, 04091. [Google Scholar] [CrossRef]
- Gutor, T.G.; Zaremba, N.I.; Kovalska, O.R.; Moskviak-Lesniak, D.J.; Gerasymovych, I.M.; Kobyletskyy, O.J.; Nahurna, Y.V. Comparative Analysis of the Main Social Health Determinants of Life Expectancy and Infant Mortality in Ukraine and Poland. Wiadomosci Lek. 2021, 74, 750–755. [Google Scholar] [CrossRef]
- Trpkova-Nestorovska, M.; Levkov, N. Determinants of Life Expectancy: Analysis of Southeastern European Countries. Knowl. Int. J. 2019, 31, 193–198. [Google Scholar] [CrossRef]
- Karma, E. Socioeconomic Determinants of Life Expectancy: Southeastern European Countries. Eur. J. Sustain. Dev. 2023, 12, 25. [Google Scholar] [CrossRef]
- Monsef, A.; Mehrjardi, A.S. Determinants of Life Expectancy: A Panel Data Approach. Asian Econ. Financial Rev. 2015, 5, 1251–1257. [Google Scholar] [CrossRef]
- I Sede, P.; Ohemeng, W. Socio-Economic Determinants of life Expectancy in Nigeria (1980–2011). Health Econ. Rev. 2015, 5, 2. [Google Scholar] [CrossRef]
- Alex Ekwueme Federal University; Onwube, O.; Chukwu, A.B.; Ahamba, K.; Emenekwe, C.; Oguwuike, M.E. Determinants of Life Expectancy in Nigeria: An Autoregressive Distributed Lag Approach. J. Sustain. Sci. Manag. 2021, 16, 177–192. [Google Scholar] [CrossRef]
- Aanegola, R.; Sakai, S.N.; Kumar, N. Longitudinal Analysis of the Determinants of Life Expectancy and Healthy Life Expectancy: A Causal Approach. Health Anal. 2022, 2, 100028. [Google Scholar] [CrossRef]
- Tafran, K.; Tumin, M.; Osman, A.F. Poverty, Income, and Unemployment as Determinants of Life Expectancy: Empirical Evidence from Panel Data of Thirteen Malaysian States. Iran. J. Public Health 2020, 49, 294–303. [Google Scholar] [CrossRef]
- Azam, M.; Uddin, I.; Saqib, N. The Determinants of Life Expectancy and Environmental Degradation in Pakistan: Evidence from ARDL Bounds Test Approach. Environ. Sci. Pollut. Res. 2023, 30, 2233–2246. [Google Scholar] [CrossRef] [PubMed]
- Wang, Z.; Asghar, M.M.; Zaidi, S.A.H.; Nawaz, K.; Wang, B.; Zhao, W.; Xu, F. The Dynamic Relationship between Economic Growth and Life Expectancy: Contradictory Role of Energy Consumption and Financial Development in Pakistan. Struct. Change Econ. Dyn. 2020, 53, 257–266. [Google Scholar] [CrossRef]
- Jafrin, N.; Masud, M.M.; Saif, A.N.M.; Mahi, M.; Khanam, M. A Panel Data Estimation of the Determinants of Life Expectancy in Selected SAARC Countries. Oper. Res. Decis. 2021, 31, 69–87. [Google Scholar] [CrossRef]
- Zang, B.Y.; Qu, J.H.; Zhou, J.W.; Wang, W.Q.; Liu, M.Z.; Li, M.R.; Zhao, H.Y.; Zhang, R.; Liu, Y.N.; Wang, L.J.; et al. Progress in Research of Determinants of Healthy Life Expectancy. Chin. J. Endem. 2022, 43, 1811–1820. [Google Scholar] [CrossRef]
- Wang, W.; Liu, Y.; Ye, P.; Xu, C.; Qiu, Y.; Yin, P.; Liu, J.; Qi, J.; You, J.; Lin, L.; et al. Spatial Variations and Social Determinants of Life Expectancy in China, 2005–2020: A Population-Based Spatial Panel Modelling Study. Lancet Reg. Health—West. Pac. 2022, 23, 100451. [Google Scholar] [CrossRef] [PubMed]
- Freeman, T.; Gesesew, H.A.; Bambra, C.; Giugliani, E.R.J.; Popay, J.; Sanders, D.; Macinko, J.; Musolino, C.; Baum, F. Why Do Some Countries Do Better or Worse in Life Expectancy Relative to Income? An Analysis of Brazil, Ethiopia, and the United States of America. Int. J. Equity Health 2020, 19, 202. [Google Scholar] [CrossRef]
- Levin, A.; Lin, C.-F.; Chu, C.-S.J. Unit Root Tests in Panel Data: Asymptotic and Finite-Sample Properties. J. Econ. 2002, 108, 1–24. [Google Scholar] [CrossRef]
- Im, K.S.; Pesaran, M.; Shin, Y. Testing for Unit Roots in Heterogeneous Panels. J. Econ. 2003, 115, 53–74. [Google Scholar] [CrossRef]
- Maddala, G.S.; Wu, S. A Comparative Study of Unit Root Tests with Panel Data and a New Simple Test. Oxf. Bull. Econ. Stat. 1999, 61, 631–652. [Google Scholar] [CrossRef]
- Pesaran, M.H. A Simple Panel Unit Root Test in the Presence of Cross-Section Dependence. J. Appl. Econ. 2007, 22, 265–312. [Google Scholar] [CrossRef]
- Pesaran, M.H.; Shin, Y.; Smith, R.P. Pooled Mean Group Estimation of Dynamic Heterogeneous Panels. J. Am. Stat. Assoc. 1999, 94, 621–634. [Google Scholar] [CrossRef]
- Preston, S.H. The Changing Relation Between Mortality and Level of Economic Development. Popul. Stud. 1975, 29, 231–248. [Google Scholar] [CrossRef]
- Mahalik, M.K.; Le, T.-H.; Le, H.-C.; Mallick, H. How Do Sources of Carbon Dioxide Emissions Affect Life Expectancy? Insights from 68 Developing and Emerging Economies. World Dev. Sustain. 2022, 1, 100003. [Google Scholar] [CrossRef]
- Das, S.; Debanth, A. Impact of CO2 Emission on Life Expectancy in India: An Autoregressive Distributive Lag (ARDL) Bound Test Approach. Futur. Bus. J. 2023, 9, 5. [Google Scholar] [CrossRef]
- Begu, L.-S.; Vasilescu, M.D.; Marin, E.; Enache, A.-O.; Stroe, A.; Vasile, R. Modeling the Relationship of the Migration Phenomenon and the Factors of Sustainable Development. Econ. Comput. Econ. Cybern. Stud. Res. 2022, 56, 37–51. [Google Scholar] [CrossRef]
| Ref. | Time Interval | Main Focus/Objectives | Variables | Geographical Scope | Methodology Employed |
|---|---|---|---|---|---|
| [32] | 1995–2016 | Impact of economic growth, energy consumption, and urbanization on CO2 emissions | GDP, fossil fuel consumption, urbanization, renewables | Developing Mediterranean countries | STIRPAT model, panel data analysis |
| [36] | 1995–2006 | Factors influencing life expectancy in Eastern Mediterranean countries | GDP, death rate, infant mortality rate, fertility rate, female LE, tuberculosis, time | Eastern Mediterranean | Random-effects regression |
| [37] | 1990–2016 | Impact of RES, urbanization, pollution, and GDP on life expectancy | RES, GDP, urbanization, pollution | Somalia | Kernel Regularized Least Squares |
| [24] | 1995–2010 | Factors influencing life expectancy using cluster analysis | GDP, vaccination rates, urbanization | Eastern Mediterranean Region (21 countries) | Cluster analysis, multilevel model |
| [38] | 1995–2007 | Estimating a health production function for life expectancy | Income per capita, education, food availability, urbanization, employment | Eastern Mediterranean Region (21 countries) | Grossman model, fixed-effects panel regression |
| [39] | 2005–2014 | Impact of economic crises on health indicators | LE, infant mortality, unemployment, health expenditure | Eastern Mediterranean countries | Panel data analysis |
| [40] | 2000–2017 | Effect of environmental degradation on life expectancy | GDP, CO2‚ emissions, health expenditure, clean water, sanitation | 31 most polluted countries | Preston curve model, Granger causality |
| [41] | 2015 | Factors influencing LE and regional disparities in Indonesia | Education, per capita expenditure, health workforce, health facilities | Indonesia | Structural equation modeling (SEM), cluster analysis |
| [42] | 2010–2017 | Relationship between social determinants and LE in Sergipe, Brazil | Dependency ratios, illiteracy, unemployment among elderly | Sergipe, Brazil (75 municipalities) | Spatial autocorrelation |
| [43] | Latest available data (2020–2021) | Impact of publicly funded healthcare and SDOH on LE | Public healthcare, SDOH (various) | 196 countries and 4 territories | Comparative analysis |
| [44] | 28 years (approx. 1990s–2018) | Regional differences in LE in Ukraine and Poland | Medical statistics, LE by gender | Ukraine and Poland | System analysis, statistical analysis |
| [45] | 2000–2015 | Key determinants of LE at birth in Southeastern Europe | CPI, employment, food production index, GNI, health expenditure, immunization | 12 Southeastern European countries | Cointegrated panel regression model |
| [46] | 2000–2019 | Socioeconomic factors influencing LE in Southeastern Europe | GDP, urbanization, emissions, fertility rate, health expenditure, marital status | Southeastern Europe | Fixed-effects panel data model |
| [47] | 2002–2010 | Social, economic, and environmental determinants of LE | Unemployment, inflation, gross capital formation, GNI, urbanization | 136 countries | Panel data analysis |
| [48] | 1980–2011 | Socioeconomic determinants of LE in Nigeria | Secondary school enrollment, health expenditure, income, unemployment, exchange rate | Nigeria | VAR and VECM models |
| [49] | 1981–2017 | Determinants of LE in Nigeria | GDP, inflation, imports, government and household consumption, exchange rate | Nigeria | ARDL model |
| [50] | LE: 2000–2016 Healthy LE: 2008–2019 | Determinants of health using LE, HLE, and their gap | Water services, public health expenditure, HIV prevalence, poverty, GNI, BMI | Global | Causal machine learning, statistical analysis |
| [51] | 2002–2014 | Socioeconomic determinants of LE in Malaysia | Poverty, income, unemployment, income inequality, public health spending | Malaysia (12 states, 1 federal territory) | Panel data analysis |
| [52] | 1975–2020 | Impact of environmental degradation on LE in Pakistan | CO2 emissions, inflation, food production, death rate, income, URB, birth rate, health expenditure, education | Pakistan | ARDL model |
| [53] | Not specified | Relationship between GDP and LE in Pakistan | GDP, financial development, energy consumption | Pakistan | Unit root tests, ARDL bounds test with structural breaks |
| [54] | 2000–2016 | Determinants of LE in SAARC countries | Schooling, sanitation, fertility rate, URB, emissions, health expenditure, GDP, internet usage | Bangladesh, India, Pakistan, Nepal, Sri Lanka | Panel data analysis |
| [55] | Databases used for the retrieval of related literatures published by 7 May 2022 | Factors influencing healthy life expectancy (HLE) | Personal characteristics, behavior, social networks, working/living conditions, SDOH | Global (90 studies, 28.9% China) | Ecological model, literature review |
| [56] | 2005–2020 | Association between SDOH and LE in China | GDP, Gini index, healthcare beds, natural population growth | China (provincial-level) | Regional analysis |
| [57] | 1990–2018 | Why some countries exceed or fall short of LE expectations relative to GDP | Community health, water access, female education, healthcare access, inequality | Global (case studies: Ethiopia, Brazil, USA) | Comparative country analysis |
| At Levels | |||||
|---|---|---|---|---|---|
| LE | RENC | FF | GDP | FDI | |
| Unit root (Common Unit Root Process) | |||||
| LLC | −7.09 *** (0.000) | 0.60 (0.727) | 0.24 (0.596) | −1.74 ** (0.04) | −2.23 ** (0.012) |
| Unit root (Individual Unit Root Process) | |||||
| IPS | −3.13 *** (0.198) | 2.58 (0.995) | 2.90 (0.998) | 0.403 (0.656) | −3.08 *** (0.001) |
| ADF | 37.64 *** (0.001) | 6.02 * (0.987) | 3.63 (0.999) | 9.40 (0.656) | 34.60 *** (0.004) |
| At first difference | |||||
| Unit root (Common Unit Root Process) | |||||
| LLC | −5.08 *** (0.000) | −5.77 *** (0.000) | −5.43 *** (0.000) | −6.06 *** (0.000) | −9.87 *** (0.000) |
| Unit root (Individual Unit Root Process) | |||||
| IPS | −8.79 *** (0.000) | −7.76 *** (0.000) | −8.03 *** (0.000) | −7.63 *** (0.000) | −12.61 *** (0.000) |
| ADF | 103.74 *** (0.000) | 88.85 *** (0.000) | 91.90 *** (0.000) | 87.73 *** (0.000) | 153.91 *** (0.000) |
| At levels | |||||
| CO2 | NMIG | ||||
| LLC | 2.25 (0.987) | −5.67 *** (0.000) | |||
| Unit root (Individual Unit Root Process) | |||||
| IPS | 3.23 (0.999) | −4.99 *** (0.000) | |||
| ADF | 4.21 (0.999) | 58.79 *** (0.000) | |||
| At first difference | |||||
| Unit root (Common Unit Root Process) | |||||
| LLC | −6.11 *** (0.000) | −10.42 *** (0.000) | |||
| Unit root (Individual Unit Root Process) | |||||
| IPS | −7.00 *** (0.000) | −10,52 *** (0.000) | |||
| ADF | 78.47 *** (0.000) | 58.79 *** (0.000) | |||
| At Levels | |||||
|---|---|---|---|---|---|
| LE | RENC | FF | GDP | FDI | |
| Unit root (Common Unit Root Process) | |||||
| LLC | −2.47 *** (0.006) | −1.49 * (0.068) | −1.57 * (0.057) | −2.10 ** (0.022) | −1.38 * (0.083) |
| Unit root (Individual Unit Root Process) | |||||
| IPS | −0.84 (0.198) | −1.66 ** (0.047) | −1.17 (0.12) | 1.40 (0.920) | −1.58 * (0.056) |
| ADF | 11.28 (0.186) | 14.51 * (0.069) | 13.97 * (0.082) | 8.04 (0.429) | 14.45 * (0.07) |
| At first difference | |||||
| Unit root (Common Unit Root Process) | |||||
| LLC | −13.23 *** (0.000) | −8.59 *** (0.000) | −6.04 *** (0.000) | −3.44 *** (0.000) | −6.34 *** (0.000) |
| Unit root (Individual Unit Root Process) | |||||
| IPS | −9.87 *** (0.000) | −9.60 *** (0.000) | −7.10 *** (0.000) | −6.09 *** (0.000) | −7.06 *** (0.000) |
| ADF | 73.74 *** (0.000) | 83.44 *** (0.000) | 59.42 *** (0.000) | 50.84 *** (0.000) | 58.96 *** (0.000) |
| At levels | |||||
| CO2 | NMIG | ||||
| LLC | −0.75 (0.224) | 0.717 (0.763) | |||
| Unit root (Individual Unit Root Process) | |||||
| IPS | 0.44 (0.679) | −0.369 (0.355) | |||
| ADF | 4.02 (0.855) | 8.498 (0.386) | |||
| At first difference | |||||
| Unit root (Common Unit Root Process) | |||||
| LLC | −6.63 *** (0.000) | −6.59 *** (0.000) | |||
| Unit root (Individual Unit Root Process) | |||||
| IPS | −7.28 *** (0.000) | −4.08 *** (0.000) | |||
| ADF | 61.24 *** (0.000) | 31.62 *** (0.000) | |||
| At Levels | |||||
|---|---|---|---|---|---|
| LE | RENC | FF | GDP | FDI | |
| CIPS | −2.54 (<0.05) | −2.35 (<0.05) | −2.10 (≥0.10) | −1.42 (≥0.10) | −2.94 (<0.01) |
| At first difference | |||||
| CIPS | −4.45 (<0.01) | −5.64 (<0.01) | −5.57 (<0.01) | −4.61 (<0.01) | −4.46 (<0.01) |
| At levels | |||||
| CO2 | NMIG | ||||
| CIPS | −1.69 (>0.10) | −1.8 (≥0.10) | |||
| CIPS | −4.38 (<0.01) | −6.59 (<0.01) | |||
| At Levels | |||||
|---|---|---|---|---|---|
| LE | RENC | FF | GDP | FDI | |
| CIPS | −1.09 (≥0.10) | −0.41 (≥0.10) | −0.08 (≥0.10) | −1.42 (≥0.10) | −1.10 (≥0.10) |
| At first difference | |||||
| CIPS | −4.45 (<0.01) | −2.37 (<0.05) | −6.61 (<0.01) | −3.56 (<0.05) | −3.89 (<0.01) |
| At levels | |||||
| CO2 | NMIG | ||||
| CIPS | −1.42 (>0.10) | −2.27 (<0.10) | |||
| CIPS | −4.71 (<0.01) | −2.98 (<0.01) | |||
| Variable | Coefficient | Std. Error | t-Statistic | Prob. * |
|---|---|---|---|---|
| Long-Run Equation | ||||
| RENC | 0.046981 | 0.012824 | 3.663477 | 0.000 *** |
| FF | 0.103384 | 0.060767 | 1.701304 | 0.092 * |
| GDP | 0.104497 | 0.01803 | 5.795577 | 0 |
| NMIG | −0.003969 | 0.002007 | −1.977823 | 0.051 * |
| FDI | −0.004147 | 0.001678 | −2.471631 | 0.015 ** |
| CO2 | 0.045902 | 0.018002 | 2.549821 | 0.012 ** |
| Short-Run Equation | ||||
| COINTEQ01 | −0.11979 | 0.052347 | −2.288403 | 0.024 ** |
| D(LE(−1)) | −0.253996 | 0.122385 | −2.07539 | 0.040 ** |
| D(LE(−2)) | −0.173416 | 0.07738 | −2.24111 | 0.027 ** |
| D(RENC) | −0.006997 | 0.00513 | −1.363948 | 0.176 |
| D(RENC(−1)) | 0.002341 | 0.008601 | 0.272156 | 0.786 |
| D(RENC(−2)) | −0.017265 | 0.00468 | −3.689231 | 0.000 *** |
| D(FF) | 0.068425 | 0.132788 | 0.515294 | 0.607 |
| D(FF(−1)) | −0.202505 | 0.109211 | −1.854246 | 0.067 * |
| D(FF(−2)) | −0.061023 | 0.055301 | −1.103473 | 0.272 |
| D(GDP) | 0.015147 | 0.025281 | 0.59916 | 0.550 |
| D(GDP(−1)) | −0.019163 | 0.017164 | −1.116459 | 0.267 |
| D(GDP(−2)) | −0.027077 | 0.016699 | −1.621473 | 0.108 |
| D(NMIG) | 0.001595 | 0.00112 | 1.424609 | 0.157 |
| D(NMIG(−1)) | −0.000132 | 0.000959 | −0.138074 | 0.890 |
| D(NMIG(−2)) | 0.003013 | 0.001733 | 1.738516 | 0.085 |
| D(FDI) | 0.000658 | 0.000563 | 1.16947 | 0.245 |
| D(FDI(−1)) | −0.000444 | 0.00055 | −0.805775 | 0.422 |
| D(FDI(−2)) | −0.000277 | 0.000523 | −0.529247 | 0.597 |
| D(CO2) | −0.014736 | 0.014356 | −1.026452 | 0.307 |
| D(CO2(−1)) | 0.026362 | 0.014508 | 1.817157 | 0.072 * |
| D(CO2(−2)) | 0.000958 | 0.00627 | 0.152712 | 0.879 |
| C | 0.325193 | 0.14087 | 2.308454 | 0.023 ** |
| Variable | Coefficient | Std. Error | t-Statistic | Prob. * |
|---|---|---|---|---|
| Long-Run Equation | ||||
| RENC | −0.168975 | 0.015889 | −10.63451 | 0 *** |
| FF | −0.265278 | 0.050585 | −5.244259 | 0 *** |
| GDP | −0.022717 | 0.017659 | −1.286428 | 0.201 |
| NMIG | 0.003423 | 0.001515 | 2.259659 | 0.026 ** |
| FDI | −0.008827 | 0.003443 | −2.563861 | 0.012 ** |
| CO2 | 0.07975 | 0.025336 | 3.14766 | 0.002 *** |
| Short-Run Equation | ||||
| COINTEQ01 | −0.243438 | 0.131278 | −1.854371 | 0.067 * |
| D(LE(−1)) | −0.07137 | 0.080314 | −0.888636 | 0.376 |
| D(LE(−2)) | 0.028723 | 0.129095 | 0.222496 | 0.824 |
| D(RENC) | 0.028552 | 0.020284 | 1.407596 | 0.162 |
| D(FF) | 0.111252 | 0.100718 | 1.104583 | 0.272 |
| D(GDP) | 0.124177 | 0.06434 | 1.930012 | 0.056 * |
| D(NMIG) | −0.000458 | 0.001141 | −0.401704 | 0.688 |
| D(FDI) | −0.000593 | 0.002571 | −0.230548 | 0.818 |
| D(CO2) | −0.048852 | 0.027922 | −1.749582 | 0.083 |
| C | 1.486862 | 0.798437 | 1.862216 | 0.065 * |
| NH: | F-Statistic | Prob. | Conclusion |
|---|---|---|---|
| RENC nGc LE | 1.20 | 0.3 | |
| LE nGc RENC | 6.18 | 0.002 *** | LE→RENC |
| FF nGc LE | 3.13 | 0.045 ** | FF→LE |
| LE nGc FF | 2.67 | 0.071 * | LE→FF |
| GDP nGc LE | 4.88 | 0.008 *** | GDP→LE |
| LE nGc GDP | 3.12 | 0.045 ** | LE→GDP |
| NMIG nGc LE | 0.05 | 0.947 | |
| LE nGc NMIG | 0.26 | 0.770 | |
| FDI nGc LE | 1.02 | 0.360 | |
| LE nGc FDI | 1.52 | 0.220 | |
| CO2 nGc LE | 2.99 | 0.051 * | CO2→LE |
| LE nGc CO2 | 13.53 | 3.00 × 10⁻⁶ *** | LE→CO2 |
| FF nGc RENC | 0.16 | 0.845 | |
| RENC nGc FF | 0.18 | 0.833 | |
| GDP nGc RENC | 1.99 | 0.138 | |
| RENC nGc GDP | 0.96 | 0.380 | |
| NMIG nGc RENC | 0.44 | 0.643 | |
| RENC nGc NMIG | 0.32 | 0.722 | |
| FDI nGc RENC | 1.40 | 0.246 | |
| RENC nGc FDI | 1.92 | 0.148 | |
| CO2 nGc RENC | 0.03 | 0.966 | |
| RENC nGc CO2 | 0.78 | 0.4562 | |
| GDP nGc FF | 2.77 | 0.064 * | GDP→FF |
| FF nGc GDP | 1.29 | 0.277 | |
| NMIG nGc FF | 0.56 | 0.571 | |
| FF nGc NMIG | 10.59 | 4.00 × 10⁻⁵ *** | FF→NMIG |
| FDI nGc FF | 1.45 | 0.235 | |
| FF nGc FDI | 0.71 | 0.487 | |
| CO2 nGc FF | 3.46 | 0.032 | |
| FF nGc CO2 | 0.10 | 0.904 | |
| NMIG nGc GDP | 0.01 | 0.987 | |
| GDP nGc NMIG | 1.10 | 0.333 | |
| FDI nGc GDP | 0.18 | 0.832 | |
| GDP nGc FDI | 0.22 | 0.801 | |
| CO2 nGc GDP | 1.66 | 0.191 | |
| GDP nGc CO2 | 3.78 | 0.024 ** | GDP→CO2 |
| FDI nGc NMIG | 2.75 | 0.065 | |
| NMIG nGc FDI | 1.21 | 0.292 | |
| CO2 nGc NMIG | 2.00 | 0.137 | |
| NMIG nGc CO2 | 0.56 | 0.567 | |
| CO2 nGc FDI | 1.18 | 0.306 | |
| FDI nGc CO2 | 0.84 | 0.429 |
| NH: | F-Statistic | Prob. | Conclusion |
|---|---|---|---|
| RENC nGc LE | 3.85 | 0.051 * | RENC→LE |
| LE nGc RENC | 14.26 | 0 *** | LE→RENC |
| FF nGc LE | 1.18 | 0.278 | |
| LE nGc FF | 6.84 | 0.009 *** | LE→FF |
| GDP nGc LE | 3.00 | 0.085 * | GDP→LE |
| LE nGc GDP | 0.45 | 0.503 | |
| NMIG nGc LE | 1.35 | 0.246 | |
| LE nGc NMIG | 0.01 | 0.907 | |
| FDI nGc LE | 1.71 | 0.192 | |
| LE nGc FDI | 0.19 | 0.663 | |
| CO2 nGc LE | 0.17 | 0.672 | |
| LE nGc CO2 | 22.51 | 5.00 × 10⁻⁶ *** | LE→CO2 |
| FF nGc RENC | 2.88 | 0.091 * | FF→RENC |
| RENC nGc FF | 0.28 | 0.596 | |
| GDP nGc RENC | 12.59 | 0 *** | GDP→RENC |
| RENC nGc GDP | 0.06 | 0.79 | |
| NMIG nGc RENC | 7.69 | 0.006 *** | NMIG→RENC |
| RENC nGc NMIG | 0.01 | 0.888 | |
| FDI nGc RENC | 7.30 | 0.007 *** | FDI→RENC |
| RENC nGc FDI | 3.14 | 0.078 * | RENC→FDI |
| CO2 nGc RENC | 0.11 | 0.735 | |
| RENC nGc CO2 | 0.24 | 0.618 | |
| GDP nGc FF | 3.90 | 0.050 ** | GDP→FF |
| FF nGc GDP | 0.14 | 0.702 | |
| NMIG nGc FF | 1.85 | 0.175 | |
| FF nGc NMIG | 0.98 | 0.322 | |
| FDI nGc FF | 7.94 | 0.005 *** | FDI→FF |
| FF nGc FDI | 2.47 | 0.118 | |
| CO2 nGc FF | 0.1177 | 0.7321 | |
| FF nGc CO2 | 0.01 | 0.908 | |
| NMIG nGc GDP | 1.86 | 0.174 | |
| GDP nGc NMIG | 11.41 | 0.001 *** | GDP→NMIG |
| FDI nGc GDP | 2.80 | 0.096 * | FDI→GDP |
| GDP nGc FDI | 0.01 | 0.909 | |
| CO2 nGc GDP | 2.13 | 0.146 | |
| GDP nGc CO2 | 11.55 | 0 *** | GDP→CO2 |
| FDI nGc NMIG | 2.17 | 0.142 | |
| NMIG nGc FDI | 0.77 | 0.380 | |
| CO2 nGc NMIG | 3.01 | 0.084 * | CO2→NMIG |
| NMIG nGc CO2 | 1.17 | 0.280 | |
| CO2 nGc FDI | 0.84 | 0.359 | |
| FDI nGc CO2 | 2.38 | 0.125 |
| Variable | Med8 LE (Long Run) | Med4 LE (Long Run) | Direction and Interpretation |
|---|---|---|---|
| RENC | +0.047% (***) | –0.169% (***) | Helps health in Med8, harms in Med4 due to transition challenges |
| FF | +0.103% (*) | –0.265% (***) | Still supports infrastructure in Med8, but damages health in Med4 |
| GDP | +0.104% (***) | –0.023% (ns) | Growth improves LE in Med8, not in Med4 |
| NMIG | –0.004% (*) | +0.0034% (**) | Strain in Med8; benefit in Med4 |
| FDI | –0.004% (**) | –0.009% (**) | Harmful in both due to dirty investments |
| CO2 | +0.046% (**) | +0.08% (***) | Proxy for development, with long-term trade-offs |
Disclaimer/Publisher’s Note: The statements, opinions and data contained in all publications are solely those of the individual author(s) and contributor(s) and not of MDPI and/or the editor(s). MDPI and/or the editor(s) disclaim responsibility for any injury to people or property resulting from any ideas, methods, instructions or products referred to in the content. |
© 2025 by the authors. Licensee MDPI, Basel, Switzerland. This article is an open access article distributed under the terms and conditions of the Creative Commons Attribution (CC BY) license (https://creativecommons.org/licenses/by/4.0/).
Share and Cite
Georgescu, I.A.; Bâra, A.; Oprea, S.-V. Life Expectancy and Its Determinants in Selected European Union (EU) and Non-EU Countries in the Mediterranean Region. Sustainability 2025, 17, 5103. https://doi.org/10.3390/su17115103
Georgescu IA, Bâra A, Oprea S-V. Life Expectancy and Its Determinants in Selected European Union (EU) and Non-EU Countries in the Mediterranean Region. Sustainability. 2025; 17(11):5103. https://doi.org/10.3390/su17115103
Chicago/Turabian StyleGeorgescu, Irina Alexandra, Adela Bâra, and Simona-Vasilica Oprea. 2025. "Life Expectancy and Its Determinants in Selected European Union (EU) and Non-EU Countries in the Mediterranean Region" Sustainability 17, no. 11: 5103. https://doi.org/10.3390/su17115103
APA StyleGeorgescu, I. A., Bâra, A., & Oprea, S.-V. (2025). Life Expectancy and Its Determinants in Selected European Union (EU) and Non-EU Countries in the Mediterranean Region. Sustainability, 17(11), 5103. https://doi.org/10.3390/su17115103