Article

A Comprehensive Evaluation of the Impact of China’s Carbon Market on Carbon Emission Efficiency from the Total-Factor Perspective

School of Economics and Management, China University of Petroleum (Beijing), Beijing 102249, China
*
Author to whom correspondence should be addressed.
Sustainability 2025, 17(11), 5101; https://doi.org/10.3390/su17115101
Submission received: 2 March 2025 / Revised: 29 April 2025 / Accepted: 31 May 2025 / Published: 2 June 2025

Abstract

:
Excessive carbon emission presents a considerable danger to the sustainability of global development. The carbon market, a crucial mechanism to cut carbon emissions, is gaining more attention from the Chinese government. In this study, provincial-level total-factor carbon emission efficiency in China is assessed, and the influence of the national carbon market on this efficiency is examined. Through the introduction of the carbon market’s internal constraint mechanism, a novel perspective for analyzing the driving mechanism is constructed. Empirical findings indicate that the carbon market significantly improves total-factor carbon emission efficiency. Currently, the constraint mechanism acts as the primary driver of this improvement, while the role of the market-based mechanism remains underutilized. Mediation analysis suggests that the improvement is mainly achieved through adjustments in the energy structure; by contrast, neither technological innovation nor industrial restructuring exhibits a significant effect. The conclusions are crucial for a comprehensive understanding of China’s carbon market. Lastly, several recommendations are proposed.

1. Introduction

Following the dawn of the industrial age, the widespread utilization of fossil fuels has propelled the progress of human industrial civilization. However, this extensive use has also posed significant challenges, including severe global warming, environmental degradation, and frequent extreme weather events. Carbon dioxide, the predominant greenhouse gas resulting from human activities, presents a considerable danger to the sustainability of global development [1]. Therefore, implementing actions to decrease carbon emissions is essential. The carbon trading policy is gaining traction as a vital mechanism for cutting carbon emissions, with more and more countries and regions adopting it. By early 2024, the emissions covered by the global carbon market represented over 17% of total greenhouse gas emissions, with 28 carbon trading systems currently operational worldwide [2].
As the leading developing nation on a global scale, China confronts a diverse range of intricacies. The dual-carbon goal, post-COVID-19 economic rejuvenation, and turbulence in the international energy market have significantly increased the pressure on China to reduce carbon emissions. As a pivotal policy instrument for realizing the dual-carbon goal, the carbon market holds great practical significance for China to fulfill its international carbon emission commitments, promote low-carbon transitions, and propel ecological civilization construction [3]. The carbon market, serving as a market-driven tool for emission cuts, is gaining more attention from the Chinese government, which has released numerous documents underscoring the urgency of advancing and refining the national carbon market [4]. To ensure both economic progress and environmental sustainability are achieved in tandem, China’s 14th Five-Year Plan places particular emphasis on the need to develop and utilize the carbon market vigorously [5]. After the inception of China’s pilot carbon markets, extensive academic research has been conducted [6], focusing mainly on their impact on emission reduction. These markets crucially facilitate total carbon emissions reduction. However, confronted with cost pressure brought by the carbon price, abatement entities may choose to reduce production scale, which in turn reduces the consumption of high-carbon fossil fuels. This approach of sacrificing economic development in exchange for reducing carbon emissions is clearly not the fundamental aim of relying on carbon trading to achieve control of carbon dioxide emissions through market mechanisms. Therefore, attention should not only be paid to total emission reduction but also to the input and output of other factors, that is, analyzing from the perspective of “efficiency”. Total carbon emissions reduction is significantly facilitated by these markets, as demonstrated by most researchers [7]. However, when discussing the emission reduction effect of China’s carbon market in the existing literature, the focus is mainly on quantifying the impact or analyzing the action path [8]. When assessing via carbon emissions or carbon intensity metrics, it inevitably ignores the input and output of other factors [9]. In contrast, total factor emission efficiency incorporates various indicators such as economy and environment, offering a more balanced and evidence-based assessment of carbon performance [10]. However, the existing literature focuses on answering whether China’s pilot carbon market policy affects carbon emission efficiency. The research objectives include industry and provincial levels, such as whether China’s pilot carbon markets promote the improvement in carbon emission efficiency in the steel industry [11] and at the provincial level [1]. Overall, although the existing literature has answered the question of whether or not this is the case, it lacks a systematic study of the mechanism of China’s carbon market policy on carbon emission efficiency from the total-factor perspective. Moreover, although China operated pilot carbon markets for over a decade, issues such as low carbon prices and weak market mechanisms persist [12]. In such contexts, the existing literature fails to explain how carbon emission efficiency is influenced adequately and its underlying driving mechanisms. Based on this, this paper attempts to answer the following questions: (1) Can China’s pilot carbon market improve total-factor carbon emission efficiency (TFCEE)? (2) Given the ineffective operation of market mechanisms, what are the driving factors and pathways through which China’s carbon market influences TFCEE, and what drives this reduction? Additionally, the carbon market’s total emission quotas, Monitoring, Reporting, and Verification (MRV) system, and punishment measures are crucial safeguards for the market’s operation. These elements inherently have specific ‘‘constraint’’ characteristics. By introducing the internal constraints in the carbon market, this paper offers a novel perspective on the driving mechanism underlying the carbon market, focusing on TFCEE. This research broadens the scope and depth of studies on the carbon market, offering valuable insights and guidance for relevant authorities in formulating carbon trading policies and decisions.
Below is a breakdown of the paper’s structure: Section 2 summarizes the advancements in the relevant field. Section 3 offers the research methodologies. Section 4 displays the findings and delves into their implications. Lastly, Section 5 summarizes the main conclusions.

2. Literature Review

Carbon trading entails allocating tradable carbon permits to leverage market mechanisms to decrease carbon emissions [13]. Early research primarily focused on the European Union’s carbon trading system. However, as pointed out by Streimikiene and Roos (2009) [14], this market failed to achieve emission reductions at a cost-effective rate efficiently. Many researchers have explored the implications of carbon trading from different perspectives [15,16,17]. Studies about emission efficiency impacts have evolved through two principal theoretical perspectives: the restricted single-factor view and the holistic total-factor conception. For the former, the measurement indicator is usually total carbon emissions and carbon intensity [18,19,20,21]. Additionally, research objects include provincial [22], city [23], industry [24], and firm levels [25]. Early methodological approaches were relatively limited, focusing mainly on simulation techniques, including the Computable General Equilibrium (CGE) model [26,27,28]. After the pilot carbon markets were set up in China, a foundation of data was established for conducting quasi-natural experiment research, including the differences-in-differences (DID) model, the Synthetic Control Method (SCM) method, as well as hybrid approaches combining both methodologies [29,30,31,32,33].
The above studies combine total carbon emissions for analysis or focus solely on single-factor indicators, which are easy to calculate but have the disadvantage of neglecting other factors [34]. However, total-factor TFCEE better captures the actual input–output dynamics. Scholars contend that carbon emission efficiency should be measured from a total-factor perspective, for example, Li and Cheng (2020) [35]. In contrast to single-factor research on China’s carbon market and its impact on carbon emission efficiency, there is a notable lack of studies exploring it from the total-factor perspective. It is undeniable that the existing literature has conducted analyses focusing on the operational dynamics of single-factor indicators through the lens of government or administrative intervention [23,36,37]. On the other hand, government and administrative interventions are considered from an external viewpoint, overlooking the carbon market’s internal constraint mechanisms. Additionally, the research findings in the existing literature are not unified. Therefore, a comprehensive evaluation of China’s carbon market influences total-factor emission efficiency metrics is necessary.
Overall, notwithstanding the increasing amount of research into China’s carbon market, the existing scholarly works exhibit the following shortcomings. (1) Most studies adopt a single-factor perspective, with a limited focus on carbon emission efficiency from a total-factor viewpoint. (2) While some scholars employ quasi-natural experimental methods such as synthetic control and propensity score matching difference-in-differences (PSM-DID), these approaches often face challenges in identifying appropriate control groups. Others rely on traditional DID models, typically assuming a uniform policy implementation date, thereby overlooking the asynchronous launch of pilot carbon markets across different regions in China. (3) Quantitative investigations into the effects of factors such as total quota allocation and market liquidity on TFCEE remain scarce. Furthermore, the mechanisms underlying China’s carbon market impacts total-factor carbon emission efficiency remain insufficiently articulated.
This study makes the following marginal contributions: (1) From a research perspective, it advances the current understanding of how China’s carbon market affects total-factor carbon efficiency. (2) Methodologically, it incorporates constraint mechanisms into a multi-period DID framework, allowing for the simultaneous assessment of market-based and regulatory drivers. (3) In terms of analytical depth, the study investigates the underlying drivers and transmission pathways of China’s carbon market.

3. Methodologies

3.1. Super-Efficiency SBM Model with an Undesirable Output

Data Envelopment Analysis (DEA) [38] stands as the dominant approach for assessing efficiency today. Unlike the conventional DEA model, the Slack-Based Measure (SBM) model employs a non-radial and non-angular approach. It excels in optimizing input and output slack problems and addressing efficiency assessments that involve undesirable outputs, according to Tone (2001) and Huang and Liu (2020) [39,40]. To overcome the limitation of the classic DEA method, which restricts the efficiency score to 1 or below, Tone (2002) [41] introduced a super-efficiency SBM model. The model can be expressed as Equation (1). When incorporating undesirable outputs,
ρ k = min 1 + 1 M m = 1 M s m x m k 1 1 R + W r = 1 R s r + y r k + w = 1 W s w b b w k s . t . j = 1 , j k n x m j λ j s m x m k j = 1 , j k n y r j λ j + s r + y r k j = 1 , j k n b w j λ j s w b b w k 1 1 R + W r = 1 R s r + y r k + w = 1 W s w b b w k > 0 λ j , s m , s r + , s w b 0 m = 1 , 2 , , M ; r = 1 , 2 , , R ; w = 1 , 2 , , W ; j = 1 , 2 , , n j k
where n is the count of decision-making units, each possessing M inputs, W undesirable outputs, and R desirable outputs; the m-th input, r-th desirable output, and w-th undesired output of the k decision-making unit are denoted as x m k ,   y r k ,   a n d   b w k . s m ,   s r + ,   a n d   s w b , respectively, indicate the slack variables corresponding to x m k ,   y r k ,     a n d   b w k , while λi represents the weight. If ρ k equals or exceeds 1, the decision-making unit is deemed efficient. Conversely, the unit is ineffective, necessitating further optimization of the input–output relationships to enhance the efficiency of resource allocation.

3.2. Multi-Period DID Model

Primarily utilized for assessing policy implementation effects, the DID model operates based on a counterfactual framework [42]. Considering the differing start dates of China’s pilot carbon markets, a multi-DID model, as shown in Equation (2), is constructed.
Y i t = α 0 + α 1 p o l i c y i × p o s t i t + α 2 X i t + ν t + μ i + ε i t
where Yit represents the dependent variable. Xit is a group of control variables that influence the dependent variable. ui stands for the fixed effects for provinces. νt stands for the fixed effects for years. εit is the random error component. policyi and postit are the dummy variables, and the interaction term of policyi and postit is namely the DIDit variable. For samples in the treatment group, set policyi to 1; otherwise, set it to 0. Analogously, if a carbon market exists in the current year, set postit to 1; otherwise, set it to 0.

3.3. Data

In 2021, China officially opened its national carbon market, extending carbon trading nationwide. This study collected provincial data from mainland China (excluding Tibet due to data scarcity) spanning 2008 to 2020 to carry out empirical analysis to eliminate this market’s influence. Shenzhen city is incorporated into the Guangdong province. Each province’s economic and energy consumption data are from the China Statistics Yearbook and the Energy Statistical Yearbook; all price data have been normalized to the 2000 price index for comparison purposes. Lastly, the carbon market data originate from the Wind database.

4. Empirics

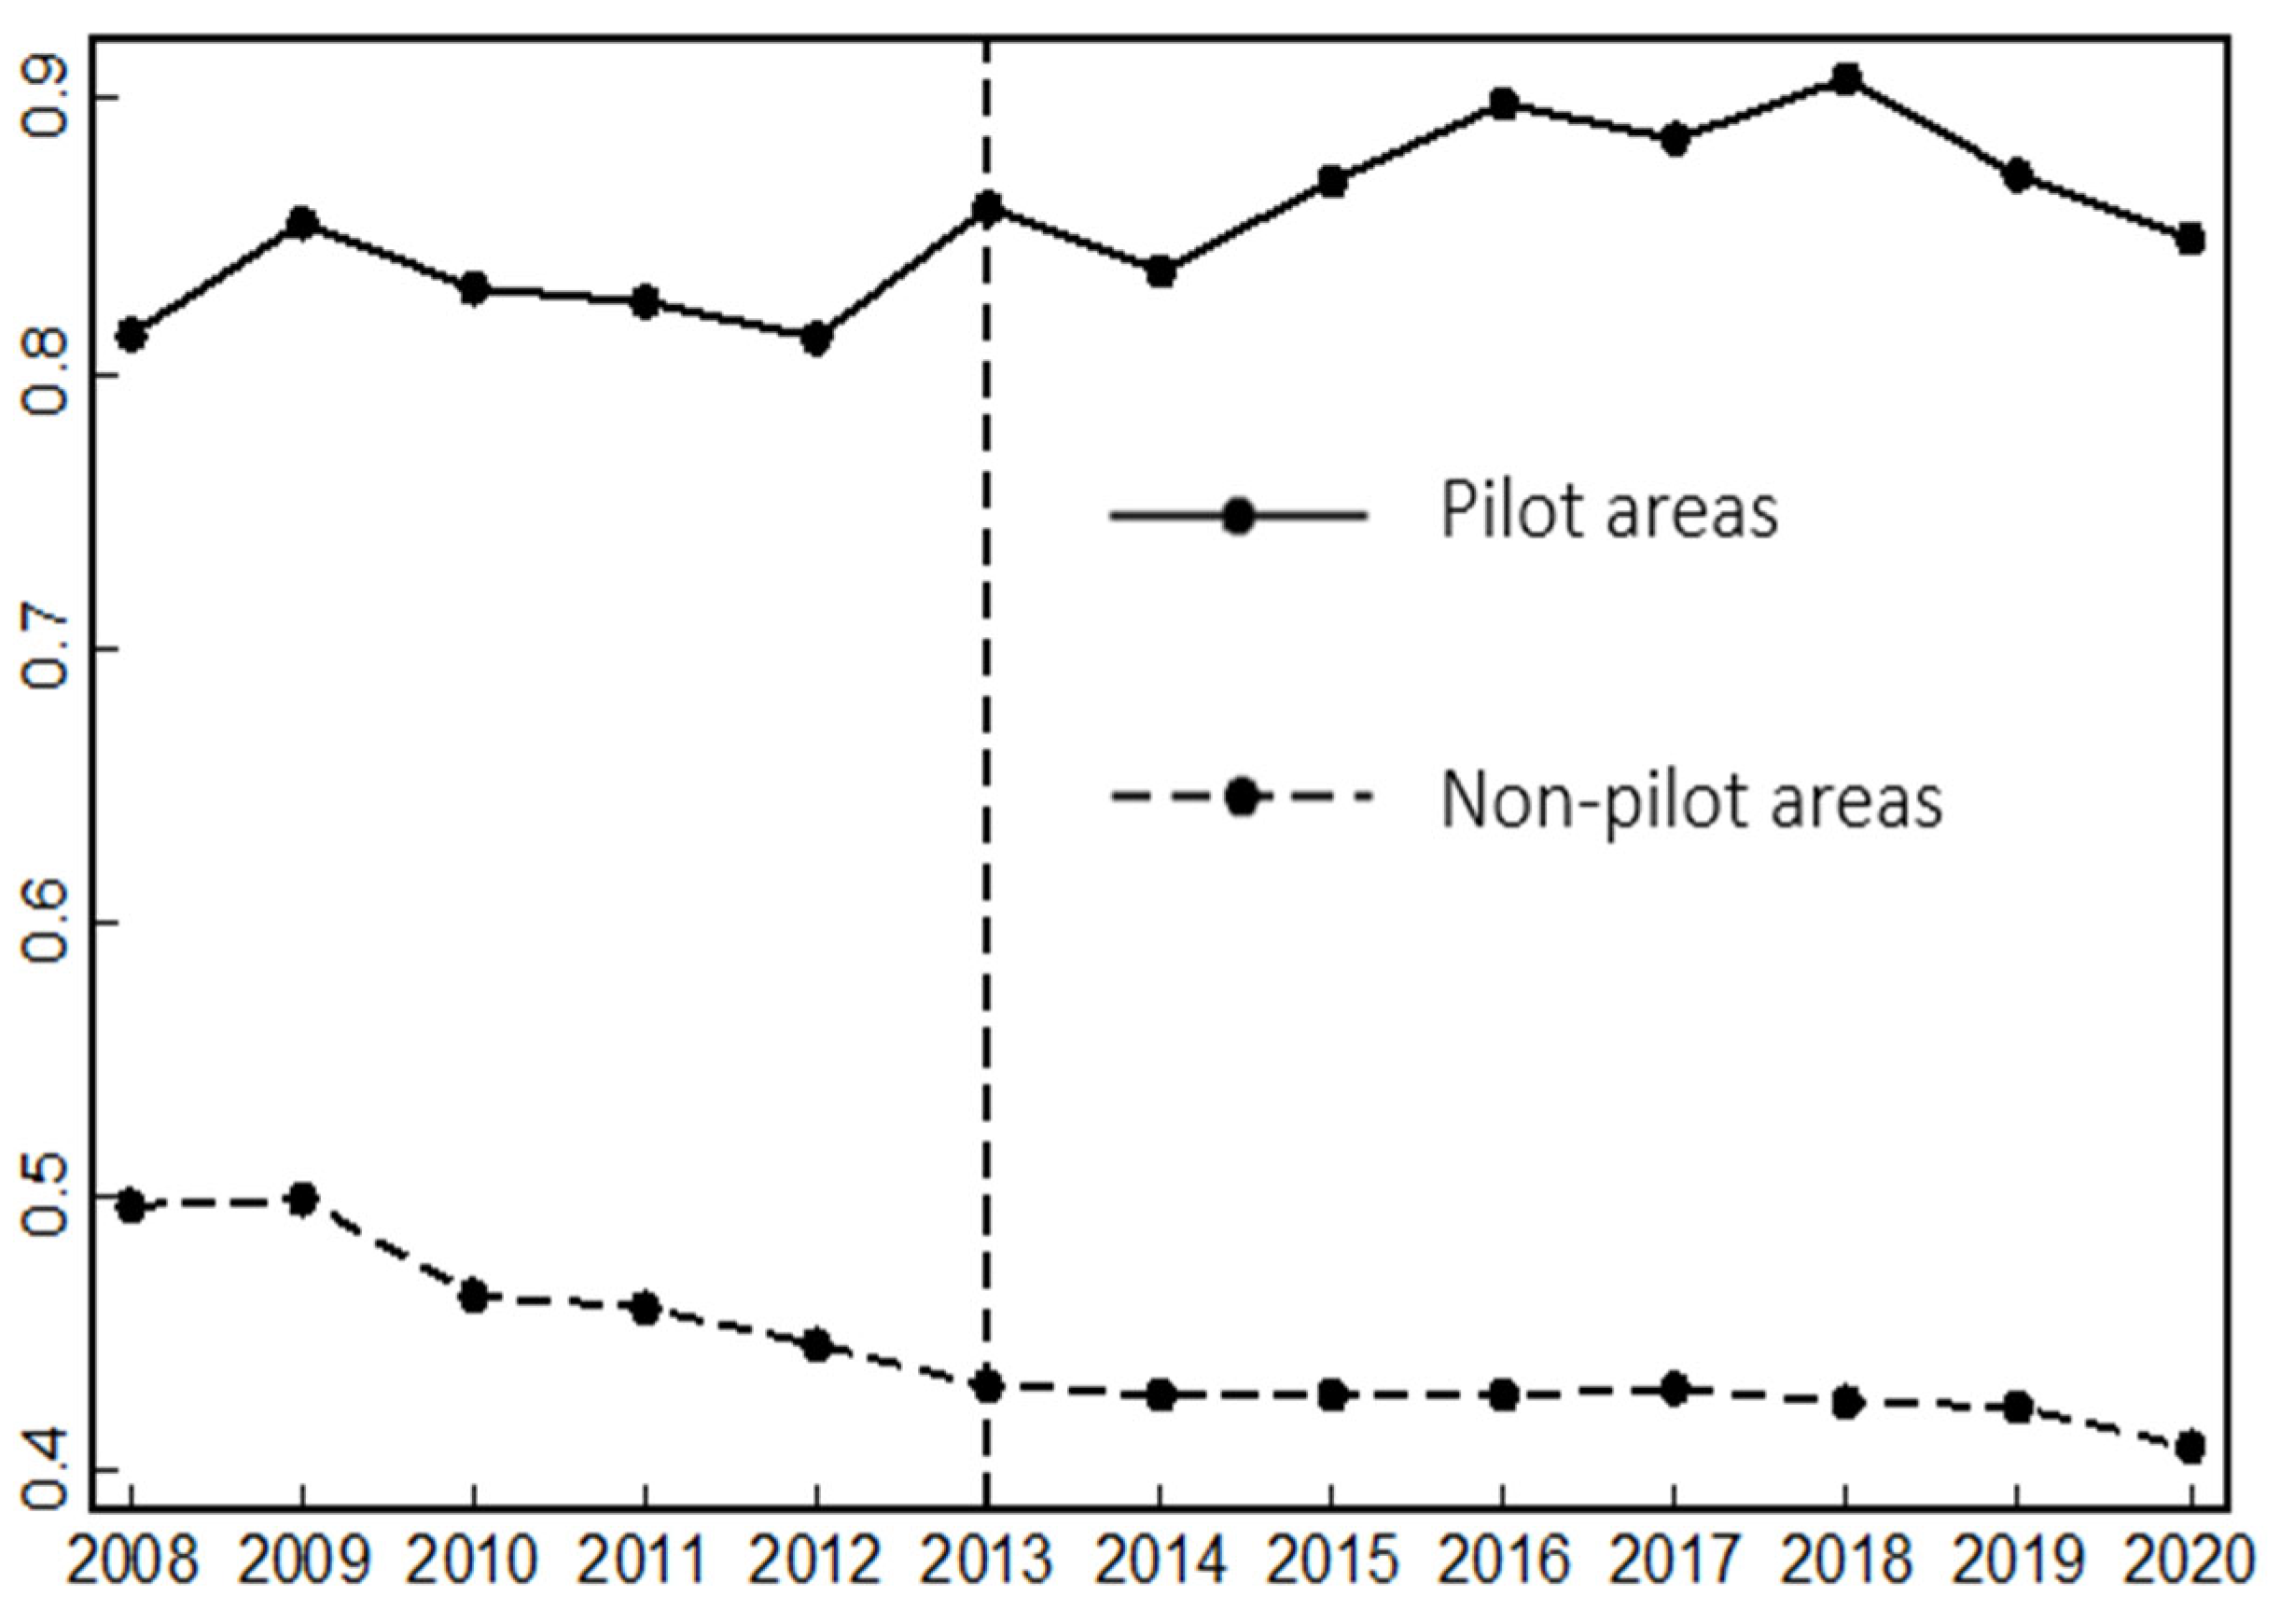
4.1. Analysis of Total-Factor Carbon Emission Efficiency

Referring to Hou et al. (2024) [1], Li et al. (2025) [43], and Peng and Gao (2025) [44], Gross Domestic Product (GDP) served as the desirable output measure in this study. In contrast, carbon dioxide emissions are designated as the undesirable output variable. Energy consumption, fixed assets investment, and employment numbers are also selected as input indicators.
The carbon dioxide emissions are calculated using Shan et al. (2018) [45]. The method of perpetual inventory, utilizing a depreciation rate set at 10.96%, aligns with conventional methodologies in the field [46] and is employed to calculate fixed assets investment. Energy consumption is determined through the summation of conversions from primary energy sources to standard coal equivalents. The employment number is derived from the count of workers in each province at year-end. Employing Equation (1), the TFCEE at China’s provincial level is computed, which is presented in Table 1. There are differences in the values among China’s provincial-level administrative regions. Generally, the eastern region demonstrates a relatively higher value, outperforming the northeastern and central regions, while the western region shows relatively lower efficiency.
A tendency chart (Figure 1) helps in comparing the values of pilot and non-pilot areas. As shown, both areas exhibited similar trends before 2013. After 2013, the pilot areas experienced an upward fluctuation, while the non-pilot areas saw a decline. The trend observed around 2013 suggests that the carbon market policy may have had anticipated effects. Further examination is necessary to confirm this hypothesis. The following sections will conduct a quantitative analysis to investigate this further.

4.2. Assessing the Impact on Total-Factor Carbon Emission Efficiency

Using Equation (2), the TFCEE is designated the dependent variable. Based on the existing literature, several control variables are selected, including the economic level, degree of openness, industrial agglomeration, foreign direct investment, population size, resource endowment, and energy intensity [23,36,47,48]. The logarithm of its GDP measures the economic level of each region. Economic openness is assessed by the ratio of total trade to GDP. Industrial agglomeration is evaluated using the logarithm of employed individuals per unit area. Foreign direct investment is quantified as a ratio to GDP, while the production-to-consumption ratio of coal is used to evaluate the resource endowment level. Year-end population figures, represented as a logarithm, reflect population size. Finally, energy intensity is calculated as energy consumed per unit of GDP.

4.2.1. Baseline Regression Results

This study categorizes regions into two categories: a treatment group encompassing pilot carbon market regions and a control group comprising the other provinces in China. Table 2 displays the baseline regression outcomes using Equation (2). Specifically, column (1) details the results without taking control variables into account, whereas column (2) presents the outcomes after including them. The standard errors, which are enclosed in parentheses, are clustered by provincial. The DID coefficient is notably positive at the 1% significance level, suggesting that carbon trading in pilot regions boosts their TFCEE.

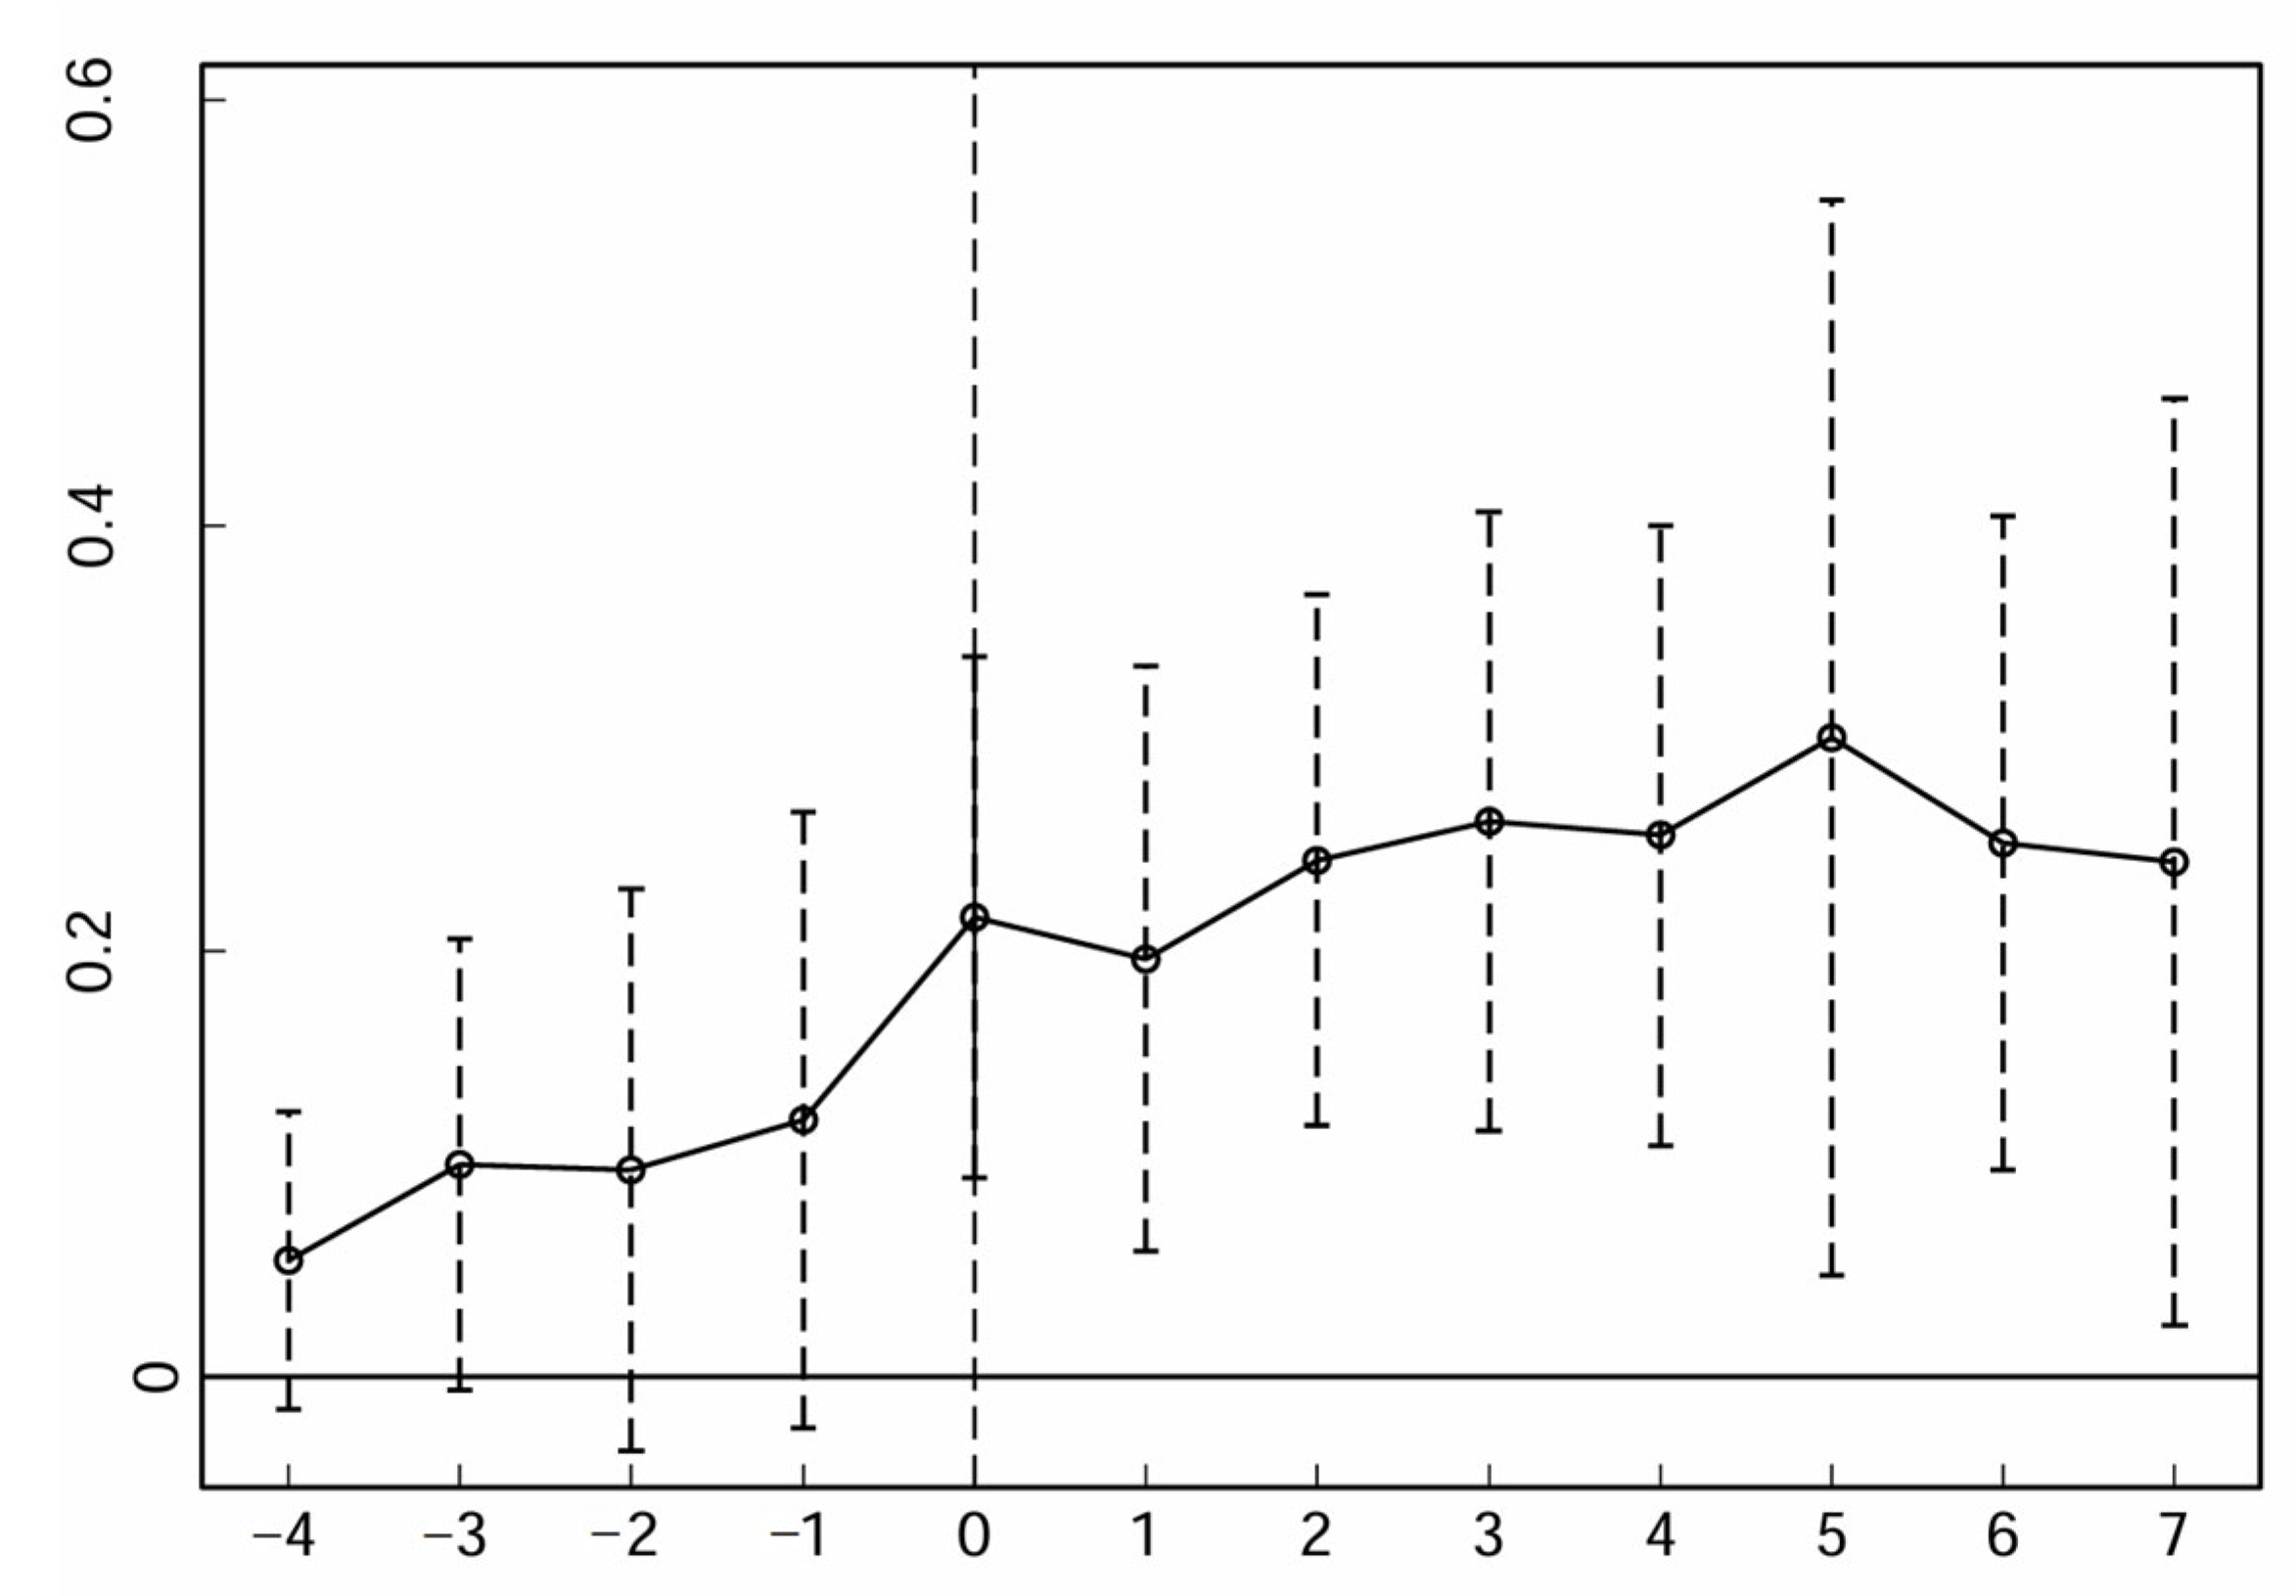
4.2.2. Parallel Trend Test
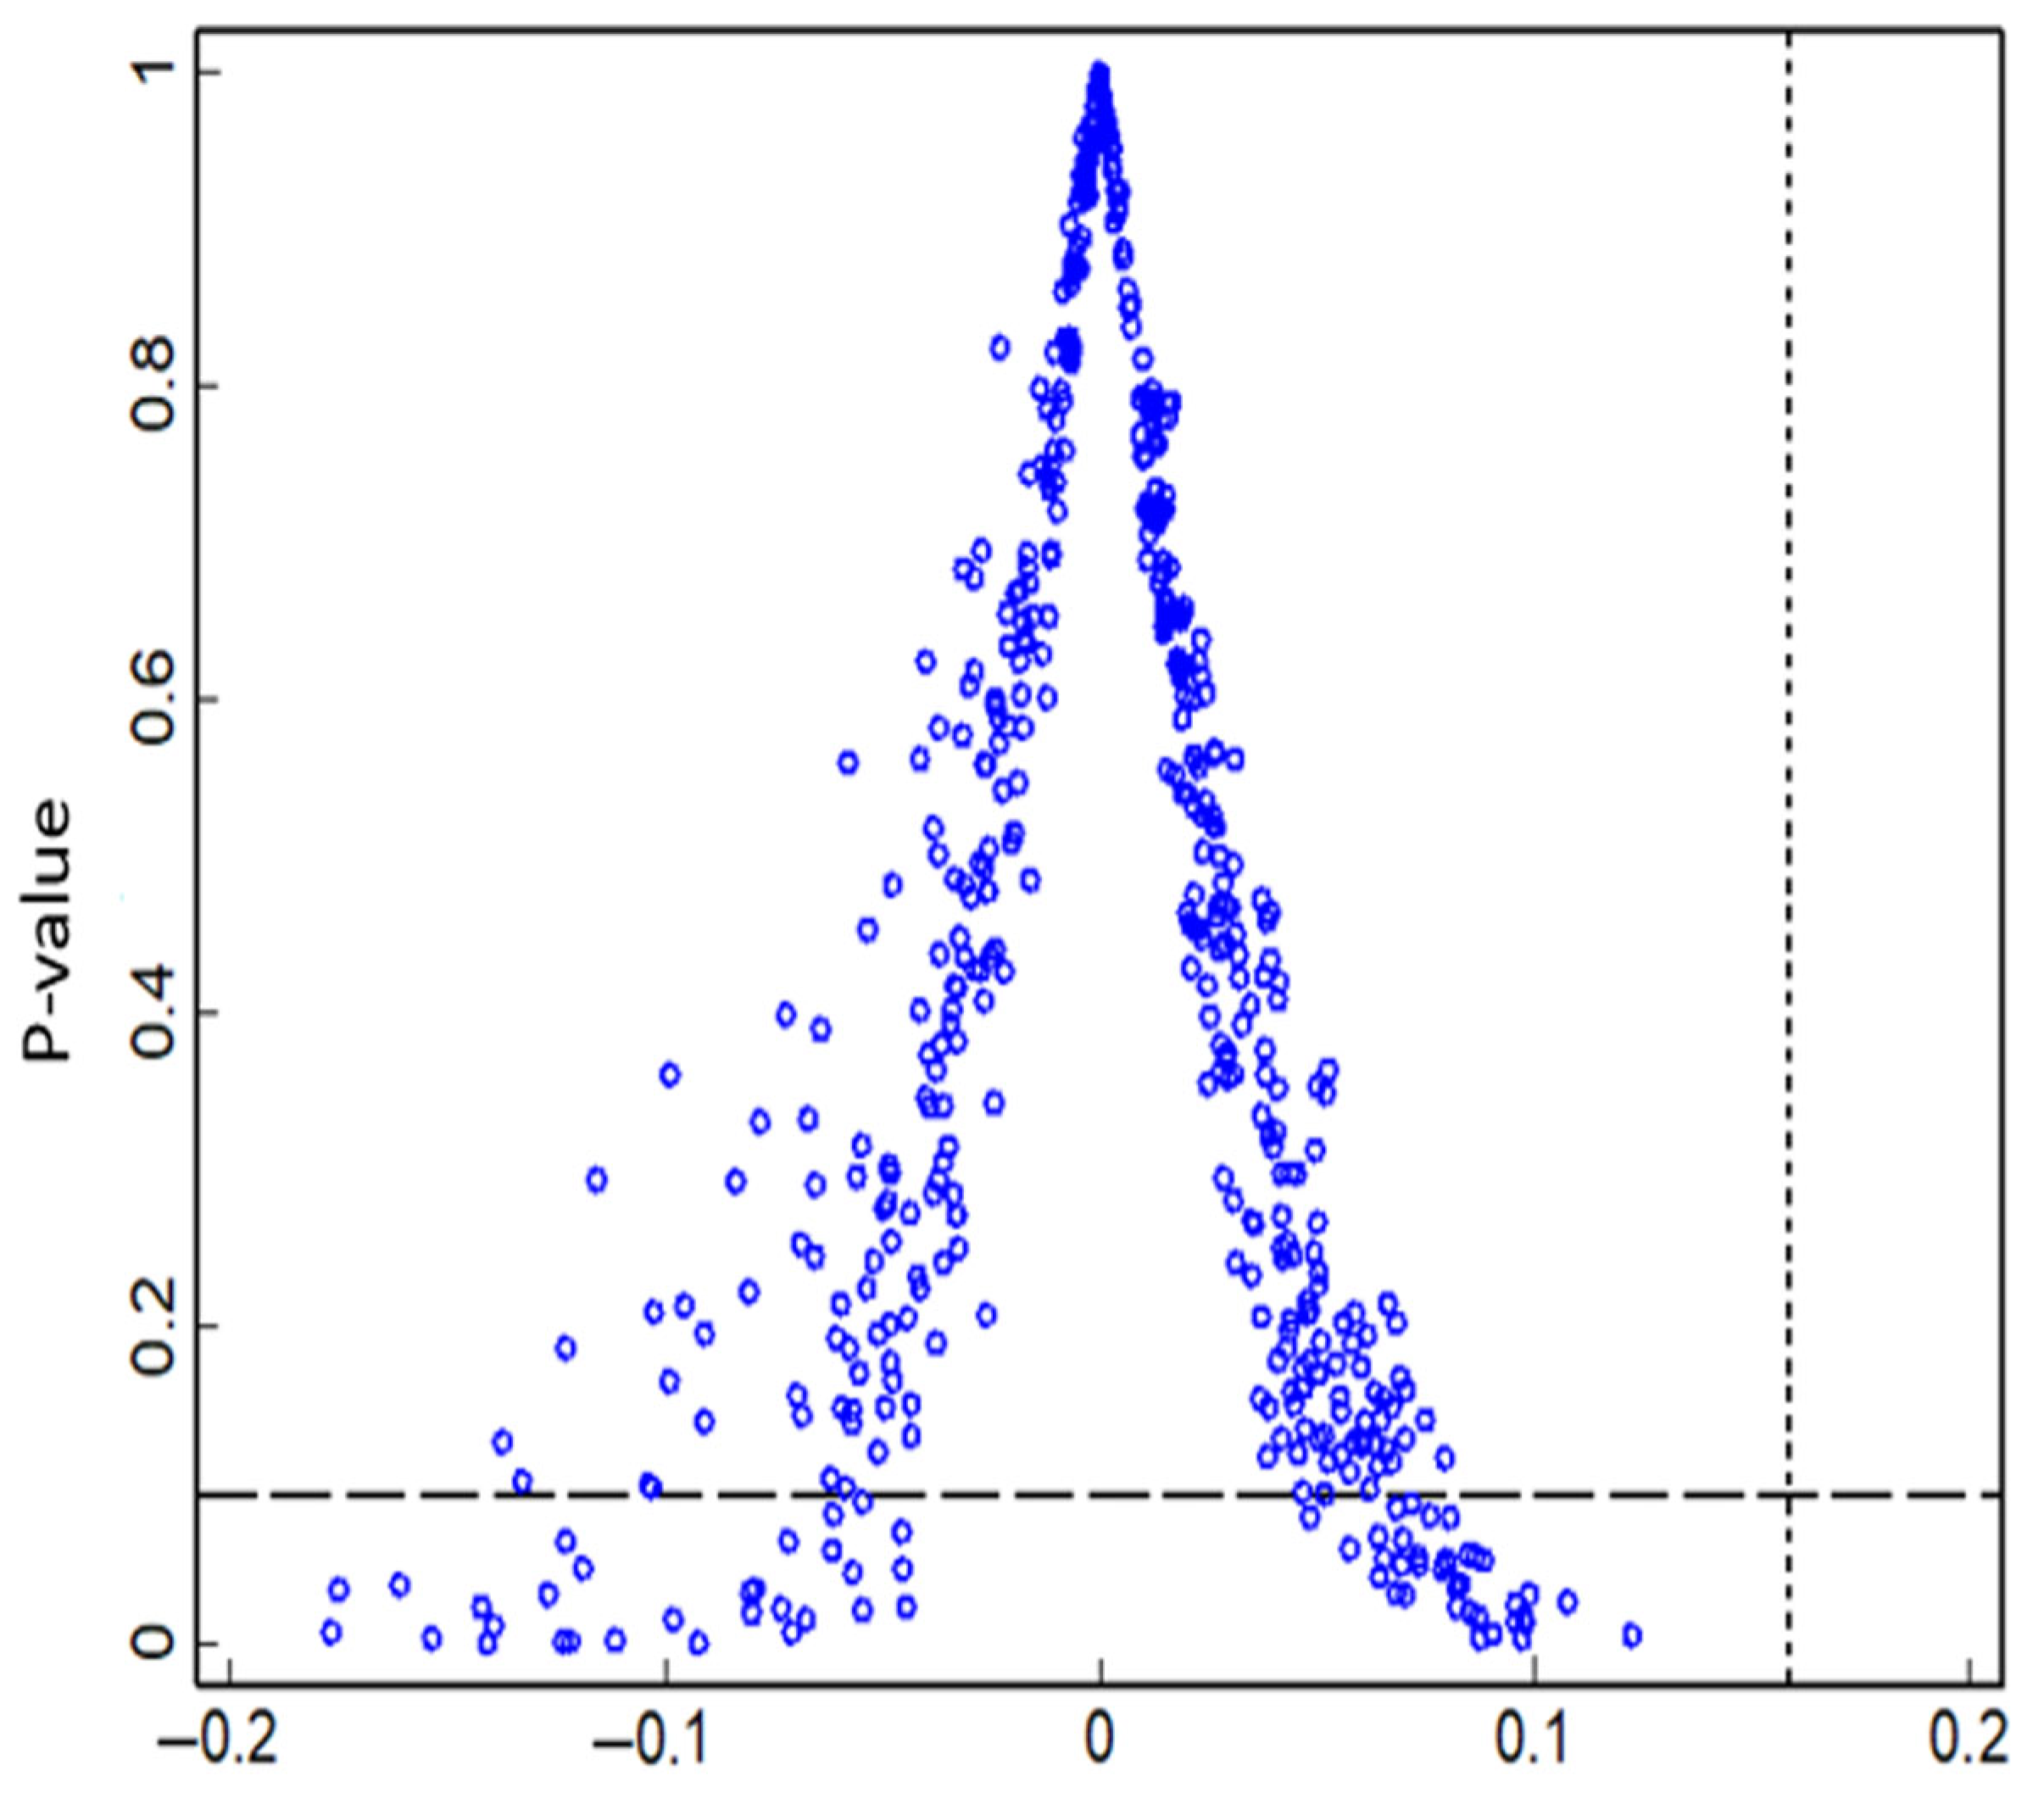
As Zeng et al. (2022) [49] demonstrated, both the control and treatment groups must comply with a comparable trend before policy enforcement when applying the DID model. Drawing on previous studies by Jacobson et al. (1993) [50], this research uses the incident research approach to perform a test for parallel trends (Du et al., 2023) [51]. Using 2008 as the base period, a model designed for parallel trend testing is conducted, as illustrated in Equation (3).
Y i t = ρ + t = 4 1 ρ t D t + ρ 0 D 0 + w = 1 7 ρ w D w + θ X i t + μ i + v t + ε i t
where Dt, D0, and Dw indicate the interactions among the dummy variables for the treatment group and the dummy years before, during, and after the start of the carbon market. ρt, ρ0, and ρw are the corresponding coefficients. This study uses 2008 as the baseline. The regression outcomes, including a 95% confidence interval, are depicted in Figure 2. ρt is not significant, which suggests that before 2013, the trends in pilot and non-pilot areas did not differ significantly. ρ0 and ρw are significantly positive, illustrating a sustained positive effect on carbon emission efficiency. These findings suggest that the parallel trend test has been passed.

4.2.3. Placebo Test

A placebo test is performed in this paper to ascertain the baseline outcomes’ reliability by Ferrara et al. (2012) [52]. Specifically, among the 30 selected provinces, 500 random samples were generated. Seven provinces were randomly assigned as the virtual treatment group in each sample, while the remaining 23 provinces comprised the virtual control group. The same regression analysis method in the previous section yielded a distribution plot of the virtual treatment group’s DID regression coefficients (Figure 3). The actual regression coefficient for the treatment group is 0.1584, situated at the tail end of the graph, whereas the DID coefficients of the virtual treatment group primarily cluster around zero. The disparity between these two values is significant. The results indicate that the placebo test has been successfully passed. Ultimately, the placebo test demonstrates that carbon trading can improve the TFCEE in the pilot regions.

4.2.4. Replacement of the Explained Variable

This part substitutes the total-factor indicator with a single-factor indicator, carbon intensity, and analyzes it to validate and confirm the baseline regression’s reliability. The associated coefficient exhibits a significant negative value (column (1) of Table 3). Unlike the positive indicator of TFCEE, carbon intensity is negative. Therefore, the negative regression coefficient indicates that China’s carbon market has significantly reduced carbon intensity in the pilot regions. This finding reinforces the fundamental regression outcome reliability.

4.2.5. Eliminating the Impact of Outliers

To reduce the influence of outliers, the dataset is winsorized at 1% at both tails. The post-winsorization regression results are shown in column (2) of Table 3. As can be seen, the DID coefficient is notably positive at the 1% significance level and aligns with the baseline findings, affirming the reliability of the regression outcomes obtained initially.

4.2.6. Exclusion of Special Samples

Firstly, Beijing, Shanghai, Guangdong, and Tianjin initiated the carbon market in 2013 and were among the first pilot regions announced by the government in 2011. These regions are geographically located in the northern, eastern, and southern parts of China, respectively. Regarding economic development, they stand out as leading regions within the country. Additionally, Shanghai, Tianjin, and Beijing are municipalities directly controlled by the central government. Policy implementation’s outcome might be affected by various factors, including location, economic standing, and administrative jurisdiction. The regression outcomes, excluding the samples originating from Beijing, Shanghai, Guangdong, and Tianjin, are displayed in column (3) of Table 3. Secondly, compared to other carbon markets, the trading scales and market activities of the Fujian carbon markets are relatively lower. Moreover, the Fujian carbon market started operations relatively late. To eliminate the influence of these specific factors, column (4) of Table 3 displays the regression results after excluding samples from Fujian. Even after removing these unique samples, the related coefficient remains significantly positive, confirming the reliability of the primary regression results.

4.2.7. Exclusion of Other Policies

Since 2007, several provinces and municipalities in China, including Jiangsu, Inner Mongolia, Hunan, Tianjin, Shaanxi, Zhejiang, Shanxi, Hubei, Chongqing, Hebei, and Henan, have implemented emissions trading systems. To mitigate the policy’s potential impact, we exclude these regions from its analysis. The related coefficient remains significantly positive, as shown in column (5) of Table 3, confirming the primary regression outcomes’ reliability.

4.3. Analysis of the Driving Mechanism

Carbon trading policy, being policy-driven, is based on market mechanisms to regulate greenhouse gas emissions by Song et al. (2019) [53]. These markets are where the government sets carbon emission caps and allocates quotas. China’s pilot carbon markets have a relatively late start compared to other countries. On the one hand, earlier research has shown that China’s carbon market has not achieved the efficiency level of a well-functioning market and suffers from weak market mechanisms [12,54]. Based on the previous research results, China’s carbon market policy has the potential to enhance the TFCEE in pilot areas, but whether this result is due to the role of the current weak market mechanism or other factors remains a subject of further debate. It should also be noted that in designing the carbon market system, the allocation of quotas establishes the initial total quota. The total emission quotas, MRV system, and punishment measures, while not directly participating in carbon trading, serve as crucial safeguards for the market’s operation and the timely compliance of abatement entities. These elements inherently possess specific “constraint’’ characteristics. The total carbon emission quotas determine the permissible limit for carbon dioxide emissions, whereas the MRV system and punishment measures influence the emission reduction decision of enterprises. Given this context, the article identifies the total quota, MRV system, and punishment measures as the self-constraint mechanism of the carbon market, believing that this internal constraint mechanism plays a significant role in improving the TFCEE. Based on this, this section introduces the constraint mechanism. Wu et al. (2021) [23] consider the market liquidity, trading scale, and carbon price generated by carbon trading as market mechanisms. From the dual perspectives of the constraint and market mechanism, the model, as shown in Equation (4), is designed to investigate how the carbon market drives improvements in TFCEE [25].
Y i t = β 0 + β 1 D I D i t + δ D I D i t × M G i t + β 2 X i t + u i + v t + ε i t
where MGit represents a set of indicators encompassing constraint and market mechanism factors. Given that it is currently impossible to quantify the MRV system, when MGit is used as a constraint mechanism indicator, it is measured using the total quota (T) and penalty value (V). For carbon market regions, depending on the severity of the penalty, Beijing and Shanghai are assigned a value of 6. In contrast, Chongqing, Hubei, Guangdong, Fujian, and Tianjin are assigned values ranging from 5 to 1 in descending order [23]. Referring to Wang and Liao (2022) [55] and Luo and Leizhu (2024) [56], When MGit represents a market mechanism indicator, it is measured by carbon price (P), market scale (S), and market liquidity (L). In this paper, the carbon price level is represented by the annual average transaction price; market size is quantified by the annual cumulative trading volume; and market liquidity is assessed using the annual count of active trading days by Xue and Zhou (2021) [57]. All variables are log-transformed. A significant variable δ indicates that the corresponding constraint or market mechanism is active. Regression results are presented in Table 4 using Equation (4).
When MGit represents the constraint mechanism, δ succeeds the significance test presented in columns (1) and (2) of Table 4, indicating that the constraint mechanism significantly affects the TFCEE in the pilot areas. On the one hand, the looser the initial total quota, the greater the amount of carbon that abatement entities are permitted to emit and the weaker the constraint mechanism. Therefore, the interaction term coefficient between the initial total quota and DID shows a negative correlation with the TFCEE; the less the total quota, the stronger the constraint, which is more conducive to improving the TFCEE. On the other hand, the greater the penalty value, the stronger the constraint mechanism. The regression results show that the interaction between the penalty value and DID has a positive effect, meaning that the stronger the constraint mechanism, the more advantageous it is for improving TFCEE. When MGit is used as a proxy for the market mechanism, δ is not significant, as seen in columns (3), (4), and (5) of Table 4. However, the DID coefficient is significant, showing that the current market mechanism has markedly failed to enhance TFCEE. In summary, the current market mechanism has failed to play a role in improving TFCEE, while the constraint mechanism has worked.

4.4. Analysis of the Action Path

To further investigate the policy transmission path of China’s carbon markets, building upon the previous multi-period DID framework, this section introduces the following mediation effect model [58]:
Y i t = α 0 + α 1 D I D i t + α 2 X i t + ν t + μ i + ε i t
M i t = η 0 + η 1 D I D i t + η 2 X i t + u i + v t + ε i t
Y i t = φ 0 + φ 1 D I D i t + φ 2 M i t + φ 3 X i t + u i + v t + ε i t
where Mit is the mediating variable; Equation (5) is based on the same principle as Equation (2). The previous parts have verified that China’s carbon market positively affects TFCEE. On this basis, the relationship between the carbon market and intermediate variables is examined using Equation (6), and its transmission path is comprehensively judged in combination with Equation (7). Regarding the existing literature, energy structure (E), technological innovation (F), and industrial structure (I), are selected as the mediating variables. Technological innovation is quantified by the count of authorized invention patents across diverse regions [59,60]. Luo and Leizhu (2024) use the ratio of the tertiary industry’s added value to that of the secondary industry as to indicate the industrial structure [56]. Carbon trading significantly reduced the energy consumption of abatement entities, while natural gas increased in its proportion [25]. Compared to coal, natural gas is a low-carbon energy source. This study measures energy structure using the ratio of natural gas consumption to total energy consumption, indicating low-carbonization levels. The regression results can be found in Table 5.
Observing the data from columns (1) to (4) in Table 5, it is evident that when Mit signifies technological innovation and industrial structure, the insignificant results of η1 and φ2 fail to confirm a mediating effect, suggesting that their transmission pathway has not emerged. From column (5) of Table 5, when Mit represents the energy structure, η1 is significant, suggesting that China’s carbon market has a significant promoting effect on the adjustment of the energy structure and promotes low-carbon energy consumption. When the DID term and energy structure are simultaneously included in the regression model, the DID coefficient is significant (column (6) of Table 5), with a value of 0.1457, smaller than the result of the benchmark model of 0.1584. At the same time, a positive and significant coefficient is observed for energy structure in the regression results. The findings suggest that the transmission path of the energy structure passes the test. Employing the Sobel test further reveals that the Z statistics for technological innovation and industrial structure are 0.3649 and −0.4794. The values are below the critical value for the 5% significance level, and consequently, they fail to pass the test. For the energy structure, the Z statistic is 2.199, more significant than the critical value, signifying its successful passage of the test.

4.5. Discussion

In 2011, China decided to launch a pilot carbon market in Beijing, Tianjin, Shanghai, Chongqing, Hubei, Guangdong, and Shenzhen. During 2013–2014, these regions officially initiated carbon trading; these regions officially initiated carbon trading. Due to the different opening years of China’s pilot carbon markets, this paper uses a multi-period DID model for empirical analysis, effectively overcoming the shortcomings of using a traditional DID model with a uniform policy implementation node. This paper focuses not only on the proof of improving TFCEE and the analysis of the intermediary mechanism but also on the reasons for the improvement in TFCEE. When discussing the driving mechanism of the emission reduction effect of China’s pilot carbon markets, most of the existing literature is based on an external perspective, arguing that government intervention is the main driver of achieving the emission reduction effect. This paper examines the constraint nature of the carbon market system design itself and verifies that under the current situation of relatively weak market mechanisms, such as low carbon prices and low liquidity in China’s pilot carbon markets, the internal constraint mechanism of the carbon market, rather than market mechanism, have played a major role in improving TFCEE. Although the market mechanism has a limited effect in the early stage of the pilot, the internal constraint mechanism of the carbon market is a powerful guarantee for the compliance of emission control enterprises. For example, institutional design elements, such as total quotas and punishment measures, directly affect the emission reduction effect [61]. This paper combines the policy design and actual operation of the carbon market to better explain the mechanism of the carbon market’s impact on TFCEE. It is worth noting that the core of carbon trading is to control greenhouse gas emissions through market mechanisms [62]. This paper does not deny the role of constraint mechanisms. Still, according to Lin and Huang (2022) [36], the market mechanism must play a leading role to achieve sustainable carbon trading and emission reduction goals.
Additionally, the results indicate that technological innovation and industrial structure did not meet the expected standards. In contrast, the energy structure passed the evaluation, suggesting that China’s carbon market can enhance TFCEE by optimizing the energy structure rather than depending on technological innovation or changes to the industrial structure. This may be due to the limited number of entities included in the pilot phase, which weakens the overall impact on the industrial structure and means that the policy has not significantly contributed to its optimization. Implementing the carbon market policy may lead to some high-carbon industries moving to other regions, so there will be no significant change in the industrial structure at the national level [63]. In addition, the carbon price affects how much businesses pay to reduce their emissions. Implementing the carbon market policy affects enterprises’ capital allocation and original production model. In the short term, the expenses related to carbon reduction can restrict innovation investment, hindering technological progress and negatively impacting businesses [64]. Nonetheless, confronted with carbon emission constraints, abatement entities can improve carbon emission efficiency by adjusting their energy consumption structure, switching from high-carbon to low-carbon energy sources, and reducing the undesirable output of carbon emissions. While empirical results suggest that the carbon market improves TFCEE primarily through adjustments in the energy structure, the channels involving technological advancement and industrial restructuring have not demonstrated significant effects. Thus, public policy should emphasize incentivizing innovation and guiding industrial transformation to activate these latent pathways.

5. Conclusions

This paper calculates China’s provincial TFCEE and then explores the influence of China’s carbon market on it. Furthermore, this paper introduces the constraint mechanism within the carbon market, which, when combined with the market mechanism, provides a novel perspective for analyzing the driving forces behind the impact of China’s carbon market on carbon emission efficiency. Additionally, the policy transmission path has also been explored. The findings are outlined below: (1) Empirical evidence indicates that the operation of China’s carbon market significantly enhances total factor carbon emission efficiency in the pilot regions. This conclusion is supported by multiple robustness checks presented in the study, demonstrating strong credibility and reliability. (2) There is a notable difference between constraint and market mechanisms in enhancing total factor carbon emission efficiency. The empirical results indicate that the constraint mechanism has a significant positive impact, while the potential of market mechanisms remains largely untapped. This finding highlights that the inherent constraint mechanism of the carbon market is the primary driver for enhancing the total factor carbon emission efficiency. In contrast, the role of market mechanisms is limited at the current stage. (3) Mediation effect analysis reveals that China’s carbon market indirectly optimizes total factor carbon emission through energy structure optimization. However, the technological innovation and industrial restructuring pathways do not show significant effects, suggesting the current carbon market has limited capacity to stimulate technological innovation and industrial upgrading. These transmission mechanisms require further strengthening.
Drawing upon the aforementioned findings, considering the challenges faced by China’s carbon markets, this research offers the following policy suggestions:
First, total quantity control for carbon emissions should be implemented. While Europe and the U.S. use absolute emission caps to reduce emissions, China primarily focuses on intensity control, which emphasizes efficiency per unit of output. To support long-term emission reduction, China should gradually introduce a total quantity control system alongside its existing framework, establish clear long-term and phased targets, and promote the coordinated management of total emissions and intensity.
Second, improve the market mechanism in China’s carbon market. China’s carbon market struggles with liquidity, trading activity, and price discovery, lacking effective market mechanisms. To improve, it should learn from international practices and optimize market functions through the following paths: Expand the range of industries covered and diversify the trading entities, varieties, and methods involved; Improve the quota management mechanism by introducing a paid allocation system, allowing for intertemporal carry-over, implementing dynamic regulations following allocation, and establishing a reserve adjustment pool; and Refine the quota settlement and offset mechanism to promote better coordination between the compulsory and voluntary markets.
Third, data support should be strengthened, and the carbon pricing mechanism should be improved. The MRV system is essential for ensuring the effective operation of the carbon market. Government oversight and enterprise data management should be enhanced, and a unified, transparent, and internationally aligned carbon emissions monitoring system should be established. Additionally, the carbon price transmission mechanism needs improvement to promote the coordinated development of electricity, energy, and carbon markets. This would facilitate a stronger connection between national and local markets, as well as domestic and international markets. Moreover, enhancing the guiding influence of carbon price signals will improve the efficiency of resource allocation.
Although this study provides meaningful insights, several areas warrant further investigation. For instance, the measurement of carbon market liquidity in China remains contested, and future research should aim to refine and standardize evaluation methods to support more robust empirical analysis.

Author Contributions

Methodology, R.F.; formal analysis, R.F.; data curation, Y.M. and L.F.; writing—original draft preparation, R.F. and Y.M.; writing—review and editing, R.F. and Y.M.; supervision, L.F. All authors have read and agreed to the published version of the manuscript.

Funding

This study was funded by the National Natural Science Foundation of China, grant number NO. 72274212.

Institutional Review Board Statement

Not applicable.

Informed Consent Statement

Not applicable.

Data Availability Statement

The data presented in this study are available on request from the corresponding author.

Conflicts of Interest

The authors declare no conflicts of interest.

References

  1. Hou, J.; Shi, C.; Fan, G.; Xu, H. Research on the impact and intermediary effect of carbon emission trading policy on carbon emission efficiency in China. Atmos. Pollut. Res. 2024, 15, 102045. [Google Scholar] [CrossRef]
  2. Wang, K.; Lyu, C. Achievements and Prospect of China’s National Carbon Market Construction (2024). J. Beijing Inst. Technol. (Soc. Sci. Ed.) 2024, 26, 16–27. [Google Scholar] [CrossRef]
  3. Jiang, H.; Sun, M. Carbon Emissions Trading, Industrial Structure and Regional Emission Reduction. Mod. Econ. Res. 2021, 11, 65–73. [Google Scholar] [CrossRef]
  4. Ma, Y.; Fang, R.; Miao, L.; Feng, L. Analysis of the Operation Status and Countermeasures Analysis of China’s Carbon Market. J. Glob. Energy Interconnect. 2024, 7, 675–683. [Google Scholar] [CrossRef]
  5. Li, K.; Gu, G. Research on Coordinated Development of Carbon Market, Economic Growth and Environmental Protection in China’s Carbon Trading Pilot Areas. For. Grassl. Resour. Res. 2021, 4, 29–37. [Google Scholar] [CrossRef]
  6. Zhou, A.; Xin, L.; Li, J. Assessing the Impact of the Carbon Market on the Improvement of China’s Energy and Carbon Emission Performance. Energy 2022, 258, 124789. [Google Scholar] [CrossRef]
  7. Xuan, D.; Ma, X.; Shang, Y. Can China’s Policy of Carbon Emission Trading Promote Carbon Emission Reduction? J. Clean. Prod. 2020, 270, 122383. [Google Scholar] [CrossRef]
  8. Feng, X.; Zhao, Y.; Yan, R. Does carbon emission trading policy have emission reduction effect? An empirical study based on quasi-natural experiment method. J. Environ. Manag. 2024, 351, 119791. [Google Scholar] [CrossRef]
  9. Wang, X.; Zhang, Q. Impact of financial agglomeration on carbon emission efficiency under the economic growth pressure. China Popul. Resour. Environ. 2022, 32, 11–20. [Google Scholar] [CrossRef]
  10. Ramanathan, R. Combining indicators of energy consumption and CO2 emissions: A cross-country comparison. Int. J. Glob. Energy Issues 2002, 17, 214. [Google Scholar] [CrossRef]
  11. Wu, R.; Tan, Z.; Lin, B. Does carbon emission trading scheme really improve the CO2 emission efficiency? Evidence from China’s iron and steel industry. Energy 2023, 277, 127743. [Google Scholar] [CrossRef]
  12. Fan, X.; Lv, X.; Yin, J.; Tian, L.; Liang, J. Multifractality and market efficiency of carbon emission trading market: Analysis using the multifractal detrended fluctuation technique. Appl. Energy 2019, 251, 113333. [Google Scholar] [CrossRef]
  13. Liu, C.; Sun, Z.; Zhang, J. Research on the effect of carbon emission reduction policy in China’s carbon emissions trading pilot. China Popul. Resour. Environ. 2019, 29, 49–58. [Google Scholar]
  14. Streimikiene, D.; Roos, I. GHG Emission Trading Implications on Energy Sector in Baltic States. Renew. Sustain. Energy Rev. 2009, 13, 854–862. [Google Scholar] [CrossRef]
  15. Song, X.; Wang, D.; Zhang, X.; He, Y.; Wang, Y. A Comparison of the Operation of China’s Carbon Trading Market and Energy Market and Their Spillover Effects. Renew. Sustain. Energy Rev. 2022, 68, 112864. [Google Scholar] [CrossRef]
  16. Yang, S.; Jahanger, A.; Hu, J.; Awan, A. Impact of China’s Carbon Emissions Trading Scheme on Firm-Level Pollution Abatement and Employment: Evidence from a National Panel Dataset. Energy Econ. 2024, 136, 107744. [Google Scholar] [CrossRef]
  17. Xian, B.; Wang, Y.; Xu, Y.; Wang, J.; Li, X. Assessment of the Co-Benefits of China’s Carbon Trading Policy on Carbon Emissions Reduction and Air Pollution Control in Multiple Sectors. Econ. Anal. Policy 2024, 81, 1322–1335. [Google Scholar] [CrossRef]
  18. Li, G.; Zhang, W. Research on industrial carbon emissions and emissions reduction mechanism in China’s ETS. China Popul. Resour. Environ. 2017, 27, 141–148. [Google Scholar]
  19. Zhang, H.; Duan, M.; Deng, Z. Have China’s Pilot Emissions Trading Schemes Promoted Carbon Emission Reductions?—The Evidence from Industrial Sub-Sectors at the Provincial Level. J. Clean. Prod. 2019, 234, 912–924. [Google Scholar] [CrossRef]
  20. Peng, H.; Qi, S.; Cui, J. The environmental and economic effects of the carbon emissions trading scheme in China: The role of alternative allowance allocation. Sustain. Prod. Consum. 2021, 28, 105–115. [Google Scholar] [CrossRef]
  21. Liu, X.; Ji, Q.; Yu, J. Sustainable development goals and firm carbon emissions: Evidence from a quasi-natural experiment in China. Energy Econ. 2021, 103, 105627. [Google Scholar] [CrossRef]
  22. Zhou, B.; Zhang, C.; Song, H.; Wang, Q. How Does Emission Trading Reduce China’s Carbon Intensity? An Exploration Using a Decomposition and Difference-in-Differences Approach. Sci. Total Environ. 2019, 676, 514–523. [Google Scholar] [CrossRef]
  23. Wu, Y.; Qi, J.; Xian, Q.; Chen, J. The Carbon Emission Reduction Effect of China’s Carbon Market—From the Perspective of the Coordination between Market Mechanism and Administrative Intervention. China’s Ind. Econ. 2021, 8, 114–132. [Google Scholar] [CrossRef]
  24. Dai, S.; Qian, Y.; He, W.; Wang, C.; Shi, T. The spatial spillover effect of China’s carbon emissions trading policy on industrial carbon intensity: Evidence from a spatial difference-in-difference method. Struct. Change Econ. Dyn. 2022, 63, 139–149. [Google Scholar] [CrossRef]
  25. Cui, J.; Wang, C.; Zhang, J.; Zheng, Y. The effectiveness of China’s regional carbon market pilots in reducing firm emissions. Proc. Natl. Acad. Sci. USA 2021, 118, e2109912118. [Google Scholar] [CrossRef]
  26. Liu, Y.; Wen, D.; Wang, Y.; Sun, Z. Assessment of impacts of Tianjin Pilot Emission Trading Schemes in China Analysis using TermCO2 Model. Clim. Change Res. 2016, 12, 561–570. [Google Scholar]
  27. Zhang, Y.; Liang, T.; Jin, Y.; Shen, B. The Impact of Carbon Trading on Economic Output and Carbon Emissions Reduction in China’s Industrial Sectors. Appl. Energy 2020, 260, 114290. [Google Scholar] [CrossRef]
  28. Zhang, F. A Study on the Economic and Environmental Effects of Regional Carbon Emission Trading Scheme in China. Macroeconomics 2021, 9, 111–124. [Google Scholar] [CrossRef]
  29. Zhang, W.; Li, J.; Li, G.; Guo, S. Emission Reduction Effect and Carbon Market Efficiency of Carbon Emissions Trading Policy in China. Energy 2020, 196, 117117. [Google Scholar] [CrossRef]
  30. Zhou, D.; Liu, Y. Impact of China’s Carbon Emission Trading Policy on the Performance of Urban Carbon Emission and Its Mechanism. China Environ. Sci. 2020, 40, 453–464. [Google Scholar] [CrossRef]
  31. Zhang, Y.; Li, S.; Luo, T.; Gao, J. The Effect of Emission Trading Policy on Carbon Emission Reduction: Evidence from an Integrated Study of Pilot Regions in China. J. Clean. Prod. 2020, 265, 121843. [Google Scholar] [CrossRef]
  32. Ji, X.; Yang, Z. Emission reduction effect and regional difference analysis of carbon trading based on PSM-DID and SCM. Stat. Decis. 2021, 37, 154–158. [Google Scholar] [CrossRef]
  33. Yang, X.; Li, J.; Guo, X. The Impact of Carbon Trading Pilots on Emission Mitigation in China: Empirical Evidence from Synthetic Control Method. J. Xi’an Jiaotong Univ. (Soc. Sci.) 2021, 41, 93–104+122. [Google Scholar] [CrossRef]
  34. Fei, R.; Lin, B. Energy efficiency and production technology heterogeneity in China’s agricultural sector: A meta-frontier approach. Technol. Forecast. Soc. Change 2016, 109, 25–34. [Google Scholar] [CrossRef]
  35. Li, J.; Cheng, Z. Study on total-factor carbon emission efficiency of China’s manufacturing industry when considering technology heterogeneity. J. Clean. Prod. 2020, 260, 121021. [Google Scholar] [CrossRef]
  36. Lin, B.; Huang, C. Analysis of emission reduction effects of carbon trading: Market mechanism or government intervention? Sustain. Prod. Consum. 2022, 33, 28–37. [Google Scholar] [CrossRef]
  37. Zhang, X.; Sun, S. Can Carbon Emission Trading Policy Promote Carbon Emission Reduction: A Study Based on Prefecture-Level City Panel Data. Nankai Econ. Stud. 2024, 2, 160–178. [Google Scholar] [CrossRef]
  38. Charnes, A.; Cooper, W.; Rhodes, E. Measuring the efficiency of decision making units. Eur. J. Oper. Res. 1978, 2, 429–444. [Google Scholar] [CrossRef]
  39. Tone, K. A Slacks-Based Measure of Efficiency in Data Envelopment Analysis. Eur. J. Oper. Res. 2001, 130, 498–509. [Google Scholar] [CrossRef]
  40. Huang, Y.; Liu, S. Efficiency evaluation of a sustainable hydrogen production scheme based on super efficiency SBM model. J. Clean. Prod. 2020, 256, 120447. [Google Scholar] [CrossRef]
  41. Tone, K. A Slacks-Based Measure of Super-Efficiency in Data Envelopment Analysis. Eur. J. Oper. Res. 2002, 143, 32–41. [Google Scholar] [CrossRef]
  42. Sun, L.; Li, W. Has the Opening of High-Speed Rail Reduced Urban Carbon Emissions? Empirical Analysis Based on Panel Data of Cities in China. J. Clean. Prod. 2021, 321, 128958. [Google Scholar] [CrossRef]
  43. Jia, L.; Zhang, J.; Li, R.; Wang, L.; Wu, H.; Wang, P. Spatial corre-lation investigation of carbon emission efficiency in the Yangtze River Delta of China: The role of low-carbon pilot cities. Ecol. Indic. 2025, 172, 113282. [Google Scholar] [CrossRef]
  44. Peng, B.; Gao, F. Crafting the perfect policy combination: Exploring the syn-ergistic effects of dual-pilot energy policies on urban carbon emission efficiency. Urban Clim. 2025, 59, 102260. [Google Scholar] [CrossRef]
  45. Shan, Y.; Guan, D.; Zheng, H.; Ou, J.; Li, Y.; Meng, J.; Mi, Z.; Liu, Z.; Zhang, Q. Data Descriptor: China CO2 Emission Accounts 1997–2015. Sci. Data 2018, 5, 170201. [Google Scholar] [CrossRef]
  46. Shan, H. Reestimating the Capital Stock of China: 1952–2006. J. Quant. Technol. Econ. 2008, 25, 17–31. [Google Scholar]
  47. Qi, S.; Cheng, S.; Cui, J. Environmental and economic effects of China’s carbon market pilots: Empirical evidence based on a DID model. J. Clean. Prod. 2020, 279, 123720. [Google Scholar] [CrossRef]
  48. Shao, S.; Cheng, S.; Jia, R. Can Low Carbon Policies Achieve Collaborative Governance of Air Pollution? Evidence from China’s Carbon Emissions Trading Scheme Pilot Policy. Environ. Impact Assess. Rev. 2023, 103, 107286. [Google Scholar] [CrossRef]
  49. Zeng, S.; Li, F.; Weng, Z.; Zhong, Z. Study on the Emission Reduction Effect of China’s Carbon Trading Pilot Policy and Regional Differences. China Environ. Sci. 2022, 42, 1922–1933. [Google Scholar] [CrossRef]
  50. Jacobson, L.; LaLonde, R.; Sullivan, D. Earnings losses of displaced workers. Am. Econ. Rev. 1993, 83, 685–709. [Google Scholar]
  51. Du, M.; Wu, F.; Ye, D.; Zhao, Y.; Liao, L. Exploring the effects of energy quota trading policy on carbon emission efficiency: Quasi-experimental evidence from China. Energy Econ. 2023, 124, 106791. [Google Scholar] [CrossRef]
  52. Ferrara, E.; Chong, A.; Duryea, S. Soap Operas and Fertility: Evidence from Brazil. Am. Econ. J. Appl. Econ. 2012, 4, 1–31. [Google Scholar] [CrossRef]
  53. Song, Y.; Liu, T.; Liang, D.; Li, Y.; Song, X. A Fuzzy Stochastic Model for Carbon Price Prediction Under the Effect of Demand-Related Policy in China’s Carbon Market. Ecol. Econ. 2019, 157, 253–265. [Google Scholar] [CrossRef]
  54. Ma, Y.; Feng, L. Analysis of the market effectiveness of pilot carbon emission trading markets in China. Oper. Res. Manag. Sci. 2022, 31, 195–202. [Google Scholar]
  55. Wang, X.; Liao, Z. Market mechanism government intervention and emission reduction effect of carbon market in China. J. Arid. Land Resour. Environ. 2022, 36, 9–17. [Google Scholar] [CrossRef]
  56. Luo, L.; Leizhu, J. Synergetic effect of China’s carbon market policies on pollution reduction and carbon reduction. Resour. Sci. 2024, 46, 53–68. [Google Scholar] [CrossRef]
  57. Xue, F.; Zhou, M. Research on the Emission Reduction Effect of the Scale of China’s Carbon Trading Market. East China Econ. Manag. 2021, 35, 11–21. [Google Scholar] [CrossRef]
  58. Tian, H.; Zhao, T.; Wu, X.; Wang, P. The Impact of Digital Economy Development on Carbon Emissions—Based on the Perspective of Carbon Trading Market. J. Clean. Prod. 2024, 434, 140126. [Google Scholar] [CrossRef]
  59. Tan, X.; Gao, J.; Zeng, A.; Xing, X. Impact of the “Pilot Zones for Green Finance Reform and Innovations” Policy on Carbon Emissions. Clim. Change Res. 2023, 19, 213–226. [Google Scholar] [CrossRef]
  60. Liu, Z.; Xu, J. The influence and mechanism of carbon trading pilot on provincial carbon emissions equity: Empirical analysis based on multi-period DID, spatial DID and intermediary effect. J. Nat. Resour. 2024, 39, 697–711. [Google Scholar] [CrossRef]
  61. Zhang, H.; Meng, J. Carbon emission abatement effect of China’s carbon market from the perspective of incentives and constraints. Resour. Sci. 2022, 44, 1759–1771. [Google Scholar] [CrossRef]
  62. Jindal, A.; Puri, S.; Shrimali, G. Designing a prospective carbon trading market in India: Key properties, denabling features and linkages. Appl. Energy 2025, 386, 125595. [Google Scholar] [CrossRef]
  63. Ding, L.; Wang, Y.; Wang, K. The synergistic effect of carbon emission trading on pollution and carbon reduction and the influence mechanism. Clim. Change Res. 2023, 19, 786–798. [Google Scholar]
  64. Ma, H.; Dong, S. Effects of Different Types of Environmental Regulations on Carbon Emission Efficiency. J. Beijing Inst. Technol. (Soc. Sci. Ed.) 2020, 22, 1–10. [Google Scholar] [CrossRef]
Figure 1. Tendency chart.
Sustainability 17 05101 g001
Figure 2. Results of the parallel trend test.
Sustainability 17 05101 g002
Figure 3. Results of the placebo test.
Sustainability 17 05101 g003
Table 1. Results of total-factor carbon emission efficiency.
20082012201520182020
Beijing0.75461.043131.05361.00571.1153
Tianjin0.72830.64650.71840.70211.0791
Hebei0.43370.38110.38260.36820.3738
Shanxi0.31440.26010.24150.24780.2472
Inner Mongolia0.35290.31620.32900.31880.2985
Liaoning0.58180.51710.52430.50000.4643
Jilin0.40320.37780.40910.44470.4048
Heilongjiang1.00401.00110.55700.58580.5496
Shanghai1.13861.16661.13881.14091.1381
Jiangsu0.80230.72680.76000.72750.7036
Zhejiang0.84460.72240.72390.70890.6434
Anhui0.56530.51330.48520.48260.4829
Fujian1.00120.80821.00931.01220.7564
Jiangxi0.54480.54760.52430.51670.5163
Shandong0.56480.52440.57240.57190.5439
Henan0.48020.43140.44350.46600.4529
Hubei0.60370.54840.63500.63730.5738
Hunan0.55350.53510.56040.57540.5924
Guangdong1.04151.02281.01570.78060.7374
Guangxi0.50500.38850.41950.40920.3701
Hainan0.65580.48810.45460.41650.4079
Chongqing0.42910.45360.51801.07110.5431
Sichuan0.54410.53560.53850.60940.5873
Guizhou0.26380.26280.25320.25130.2457
Yunnan0.40270.34540.35830.33210.3075
Shaanxi0.39170.33500.33740.33690.3140
Gansu0.35260.33050.32070.31370.3052
Qinghai0.28400.25300.22420.20840.2160
Ningxia0.19960.17360.16020.14710.1411
Xinjiang0.37480.29130.25990.23360.2243
Note: Due to space constraints, only partial data are listed, which have been rounded. The following table in this paper follows the same format.
Table 2. Baseline regression results.
(1)(2)
DID0.1689 ***
(0.0494)
0.1584 ***
(0.0329)
Control variablesNY
Province FEYY
Year FEYY
N390390
R20.27420.4542
Notes: *** indicates the significance at 1% level.
Table 3. Results of a series of tests.
(1)(2)(3)(4)(5)
DID−0.1446 ***
(0.0390)
0.1656 ***
(0.0334)
0.1422 ***
(0.0383)
0.1597 ***
(0.0363)
0.1833 ***
(0.0445)
Control variablesYYYYY
Province FEYYYYY
Year FEYYYYY
N390390351377247
R20.85450.44330.50570.45530.5234
Notes: *** indicates the significance at 1% level.
Table 4. Regression results of the constraint mechanism and market mechanism.
(1)(2)(3)(4)(5)
DID0.1881 ***
(0.0348)
0.1131 ***
(0.0252)
0.1513 ***
(0.0487)
0.1660 ***
(0.0294)
0.1232 ***
(0.0266)
DID × T−0.0680 *
(0.0351)
DID × V 0.0427 *
(0.0224)
DID × P 0.0021
(0.0129)
DID × S −0.0019
(0.0069)
DID × L 0.0096
(0.0096)
Control variablesYYYYY
Province FEYYYYY
Year FEYYYYY
N390390390390390
R20.46580.45920.45400.45430.4579
Notes: ***, and * indicate the significance at 1%, and 5% levels, respectively.
Table 5. Results of the mediation effect test.
F
(1)
TFCEE
(2)
Q
(3)
TFCEE
(4)
N
(5)
TFCEE
(6)
DID−0.0818 (0.0794)0.1578 ***
(0.0332)
0.0213
(0.1048)
0.1597 ***
(0.0356)
0.0127 *
(0.0071)
0.1457 **
(0.0299)
F −0.007
(0.0247)
I −0.0595 (0.0927)
E 0.9991 *
(0.4992)
Control variablesYYYYYY
Province FEYYYYYY
Year FEYYYYYY
N390390390390390390
R20.91570.45440.81370.46040.53400.4733
Notes: ***, **, and * indicate the significance at 1%, 5%, and 10% levels, respectively.
Disclaimer/Publisher’s Note: The statements, opinions and data contained in all publications are solely those of the individual author(s) and contributor(s) and not of MDPI and/or the editor(s). MDPI and/or the editor(s) disclaim responsibility for any injury to people or property resulting from any ideas, methods, instructions or products referred to in the content.

