

Study on the Spatial Pattern of the Carbon Footprint of China’s E-Commerce Express Packaging Considering Embodied Carbon Transfer

Abstract
1. Introduction
2. Objectives and Hypotheses
2.1. Research Objectives
2.2. Research Hypotheses
3. Materials and Methods
3.1. Data Sources
3.2. Research Methods
3.2.1. Calculating the Carbon Footprint of E-Commerce Express Packaging in China
3.2.2. Carbon Footprint Calculation of Chinese E-Commerce Express Packaging Considering Implied Carbon
4. Carbon Footprint Decomposition at Each Stage
4.1. Carbon Footprint of E-Commerce Express Packaging Raw Material Stage
4.2. Carbon Footprint of E-Commerce Courier Packaging at the Production Stage
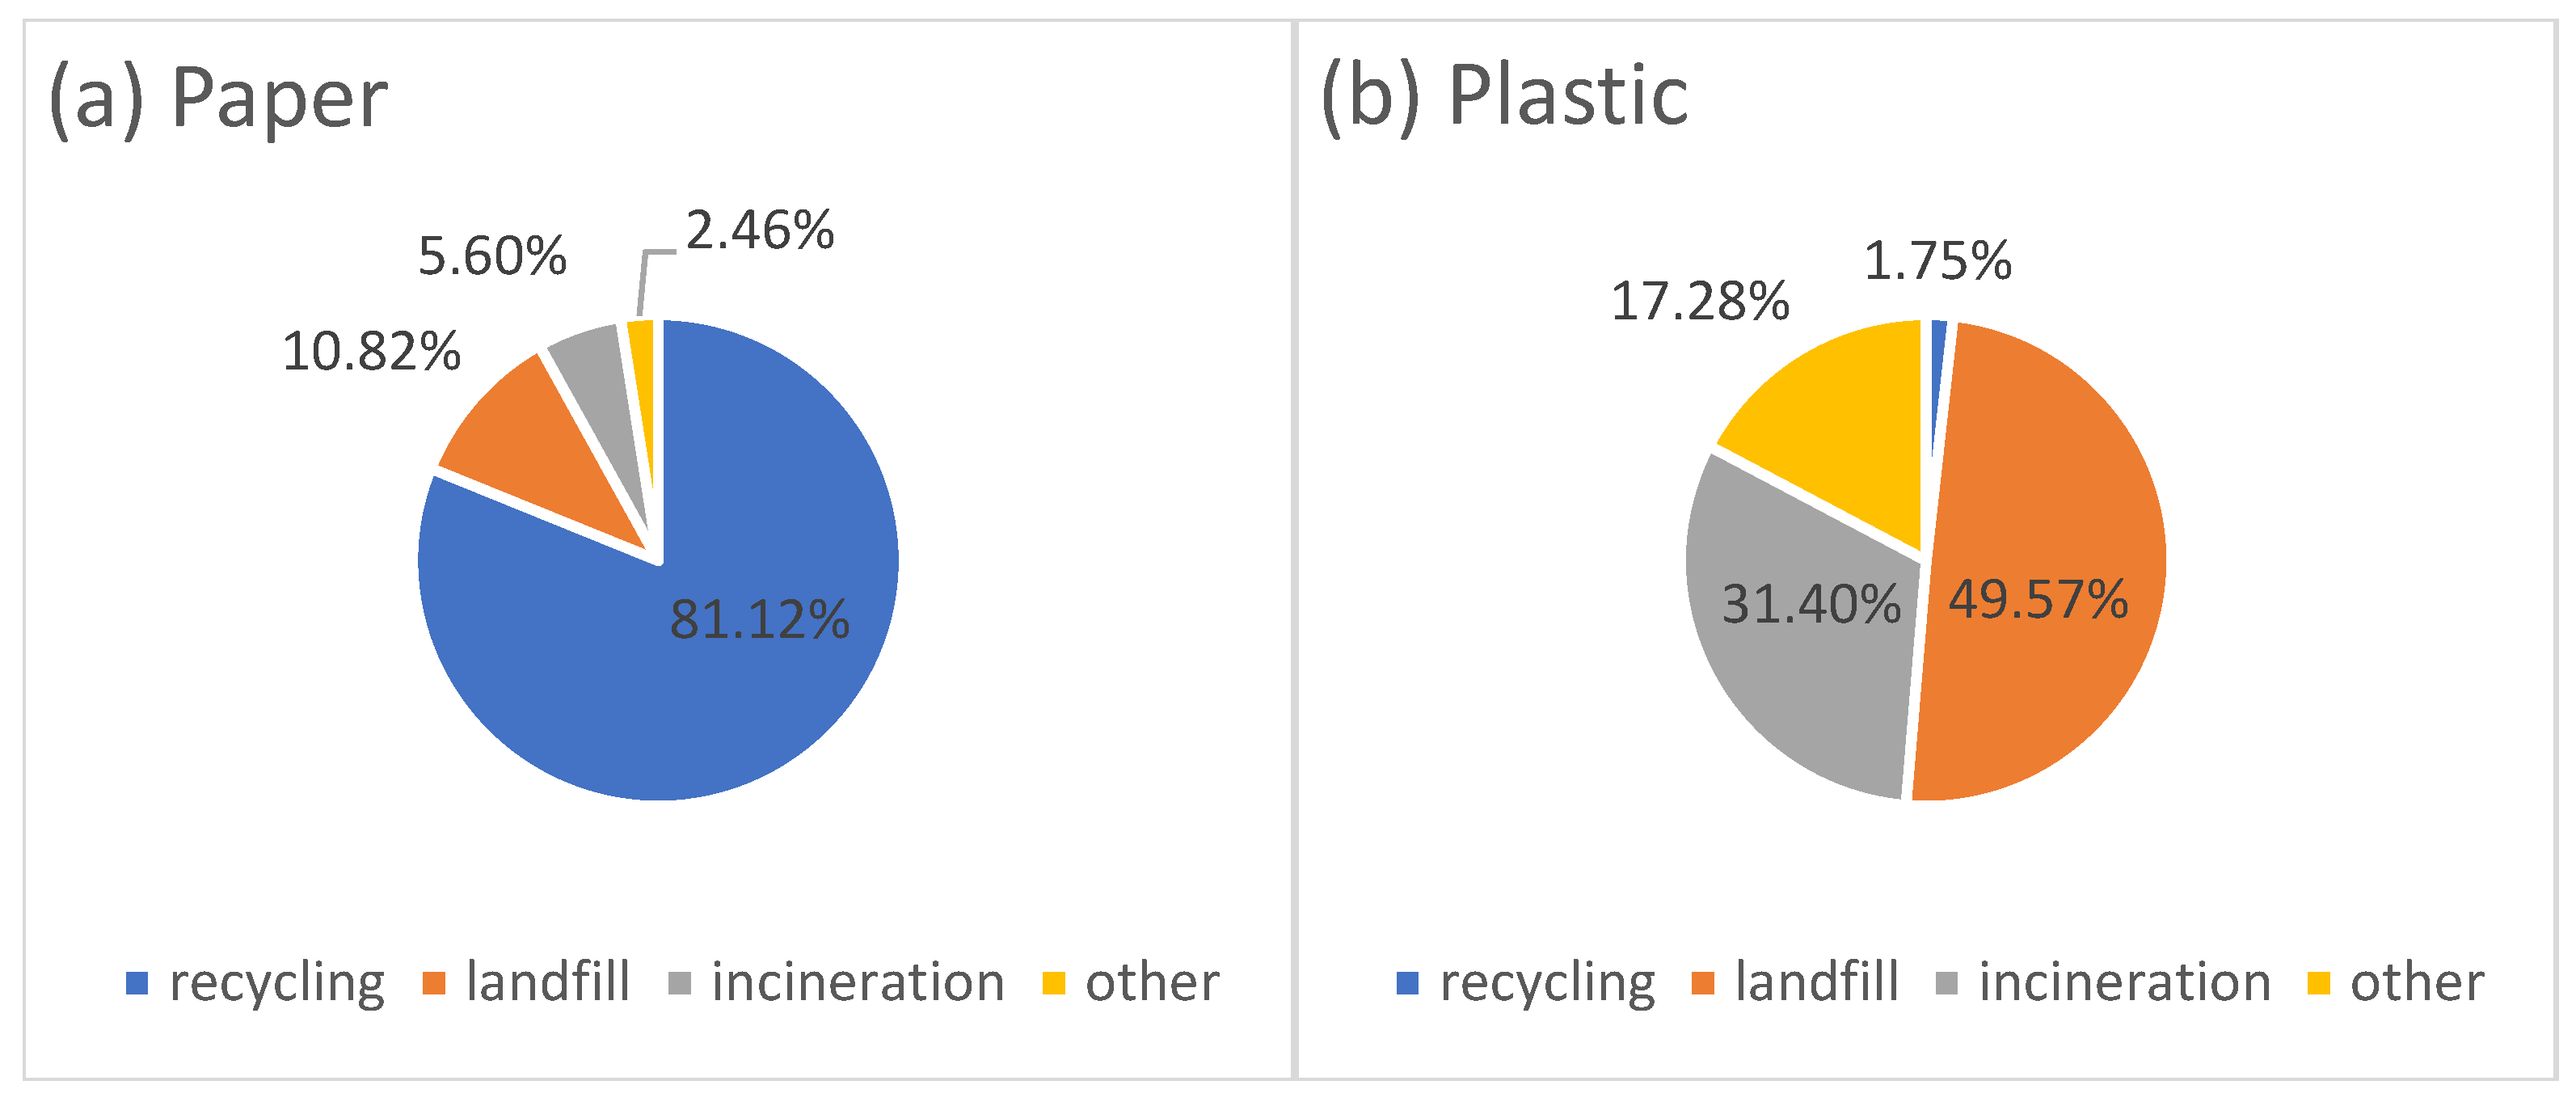
4.3. Carbon Footprint of E-Commerce Express Packaging Disposal Stage
5. Carbon Footprint of E-Commerce Courier Packaging Considering Implicit Carbon
5.1. Analysis of Total Carbon Emission
5.2. China’s E-Commerce Express Packaging Hidden Carbon
6. Conclusions and Discussion
6.1. Discussion
6.2. Conclusions
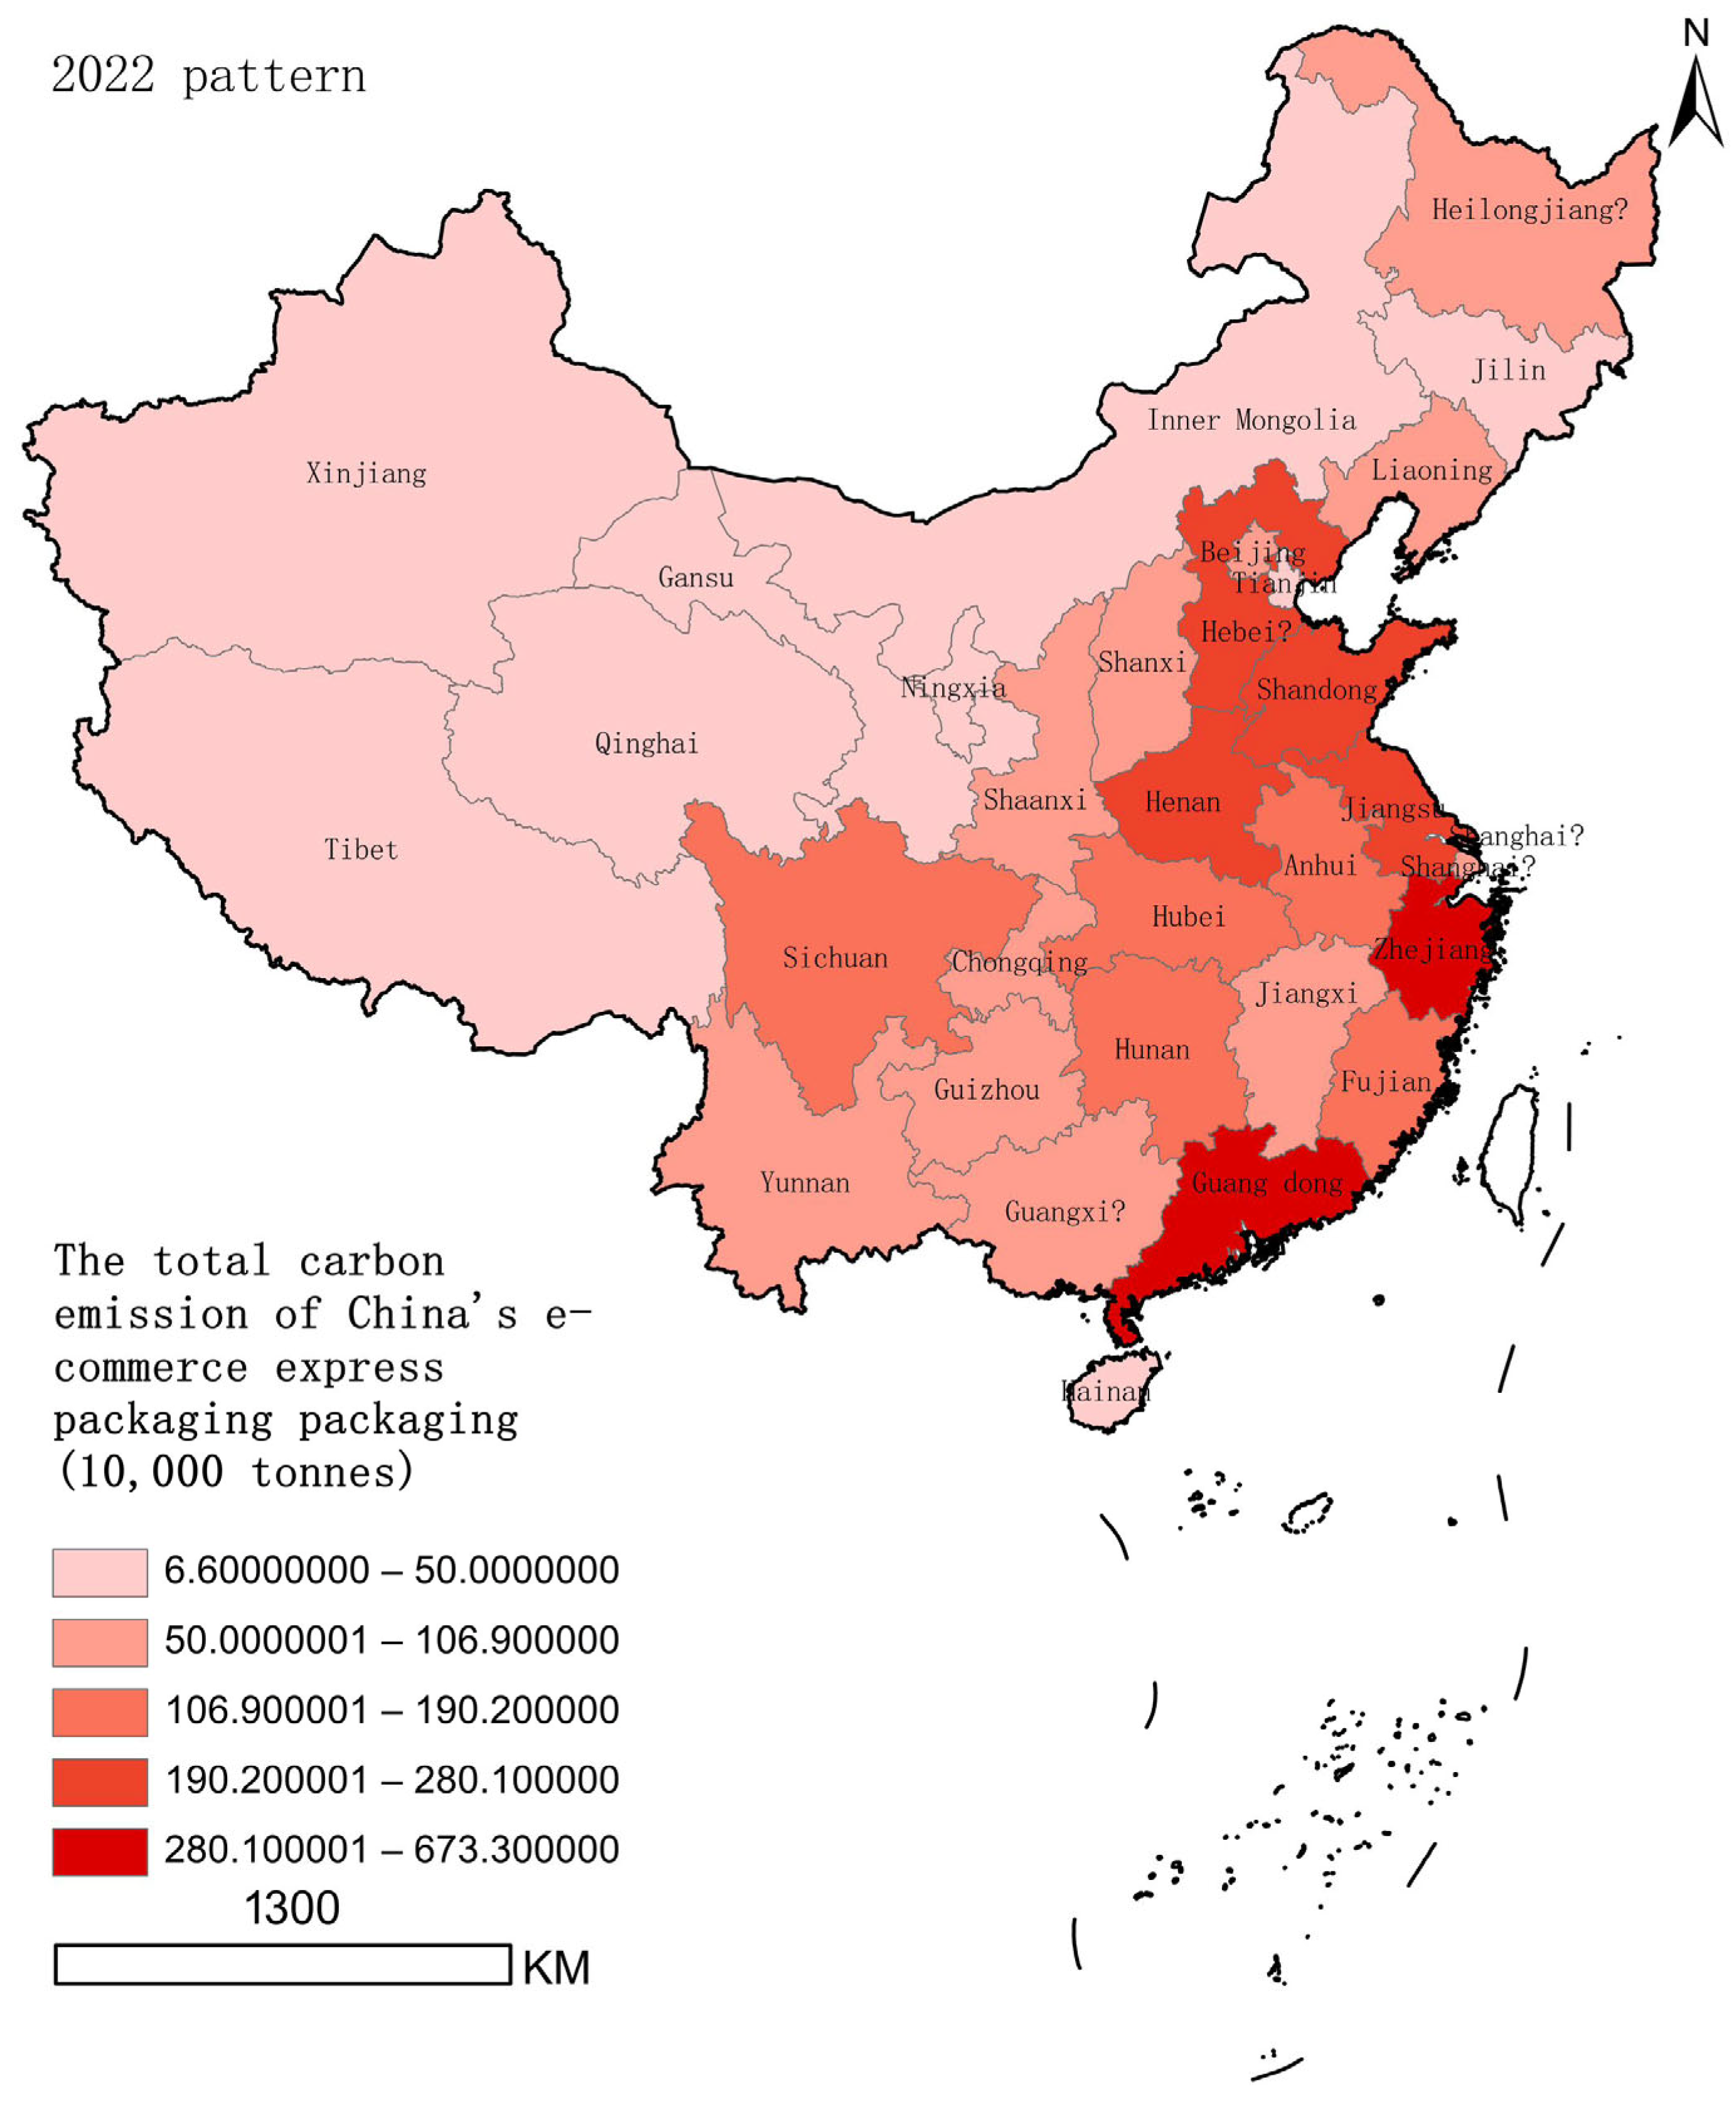
- In 2022, the carbon footprint of China’s e-commerce express packaging reached approximately 41.209 million tCO2e. Geographically, the carbon footprint shows a clear pattern of “more in the east, less in the west”, gradually decreasing from the southeast coast to the northwest inland regions. Guangdong Province, with its large volumes of shipments and receipts, recorded the highest carbon footprint, while Tibet had the lowest due to its relatively small scale of e-commerce activity.
- The carbon footprint of China’s e-commerce packaging displays distinct spatial characteristics. At the raw material stage, the emissions show a “more in the south and east, less in the north and west” pattern. During the production stage, emissions are mainly concentrated in coastal areas, forming a “coast-surrounding-inland” structure. In the disposal stage, the footprint shows a gradual decrease from the southeast to the northwest.
- Significant differences exist in the carbon footprints of different packaging materials: plastic packaging generated 29.969 million tCO2e during the raw material stage and 4.11 million tCO2e during the production stage—2.9 and 1.7 times higher than those of paper packaging (10.341 million and 2.376 million tCO2e, respectively). However, in the disposal stage, paper surpassed plastic, with emissions reaching 3.133 million tCO2e, which is 2.2 times greater than plastic’s 1.423 million tCO2e.
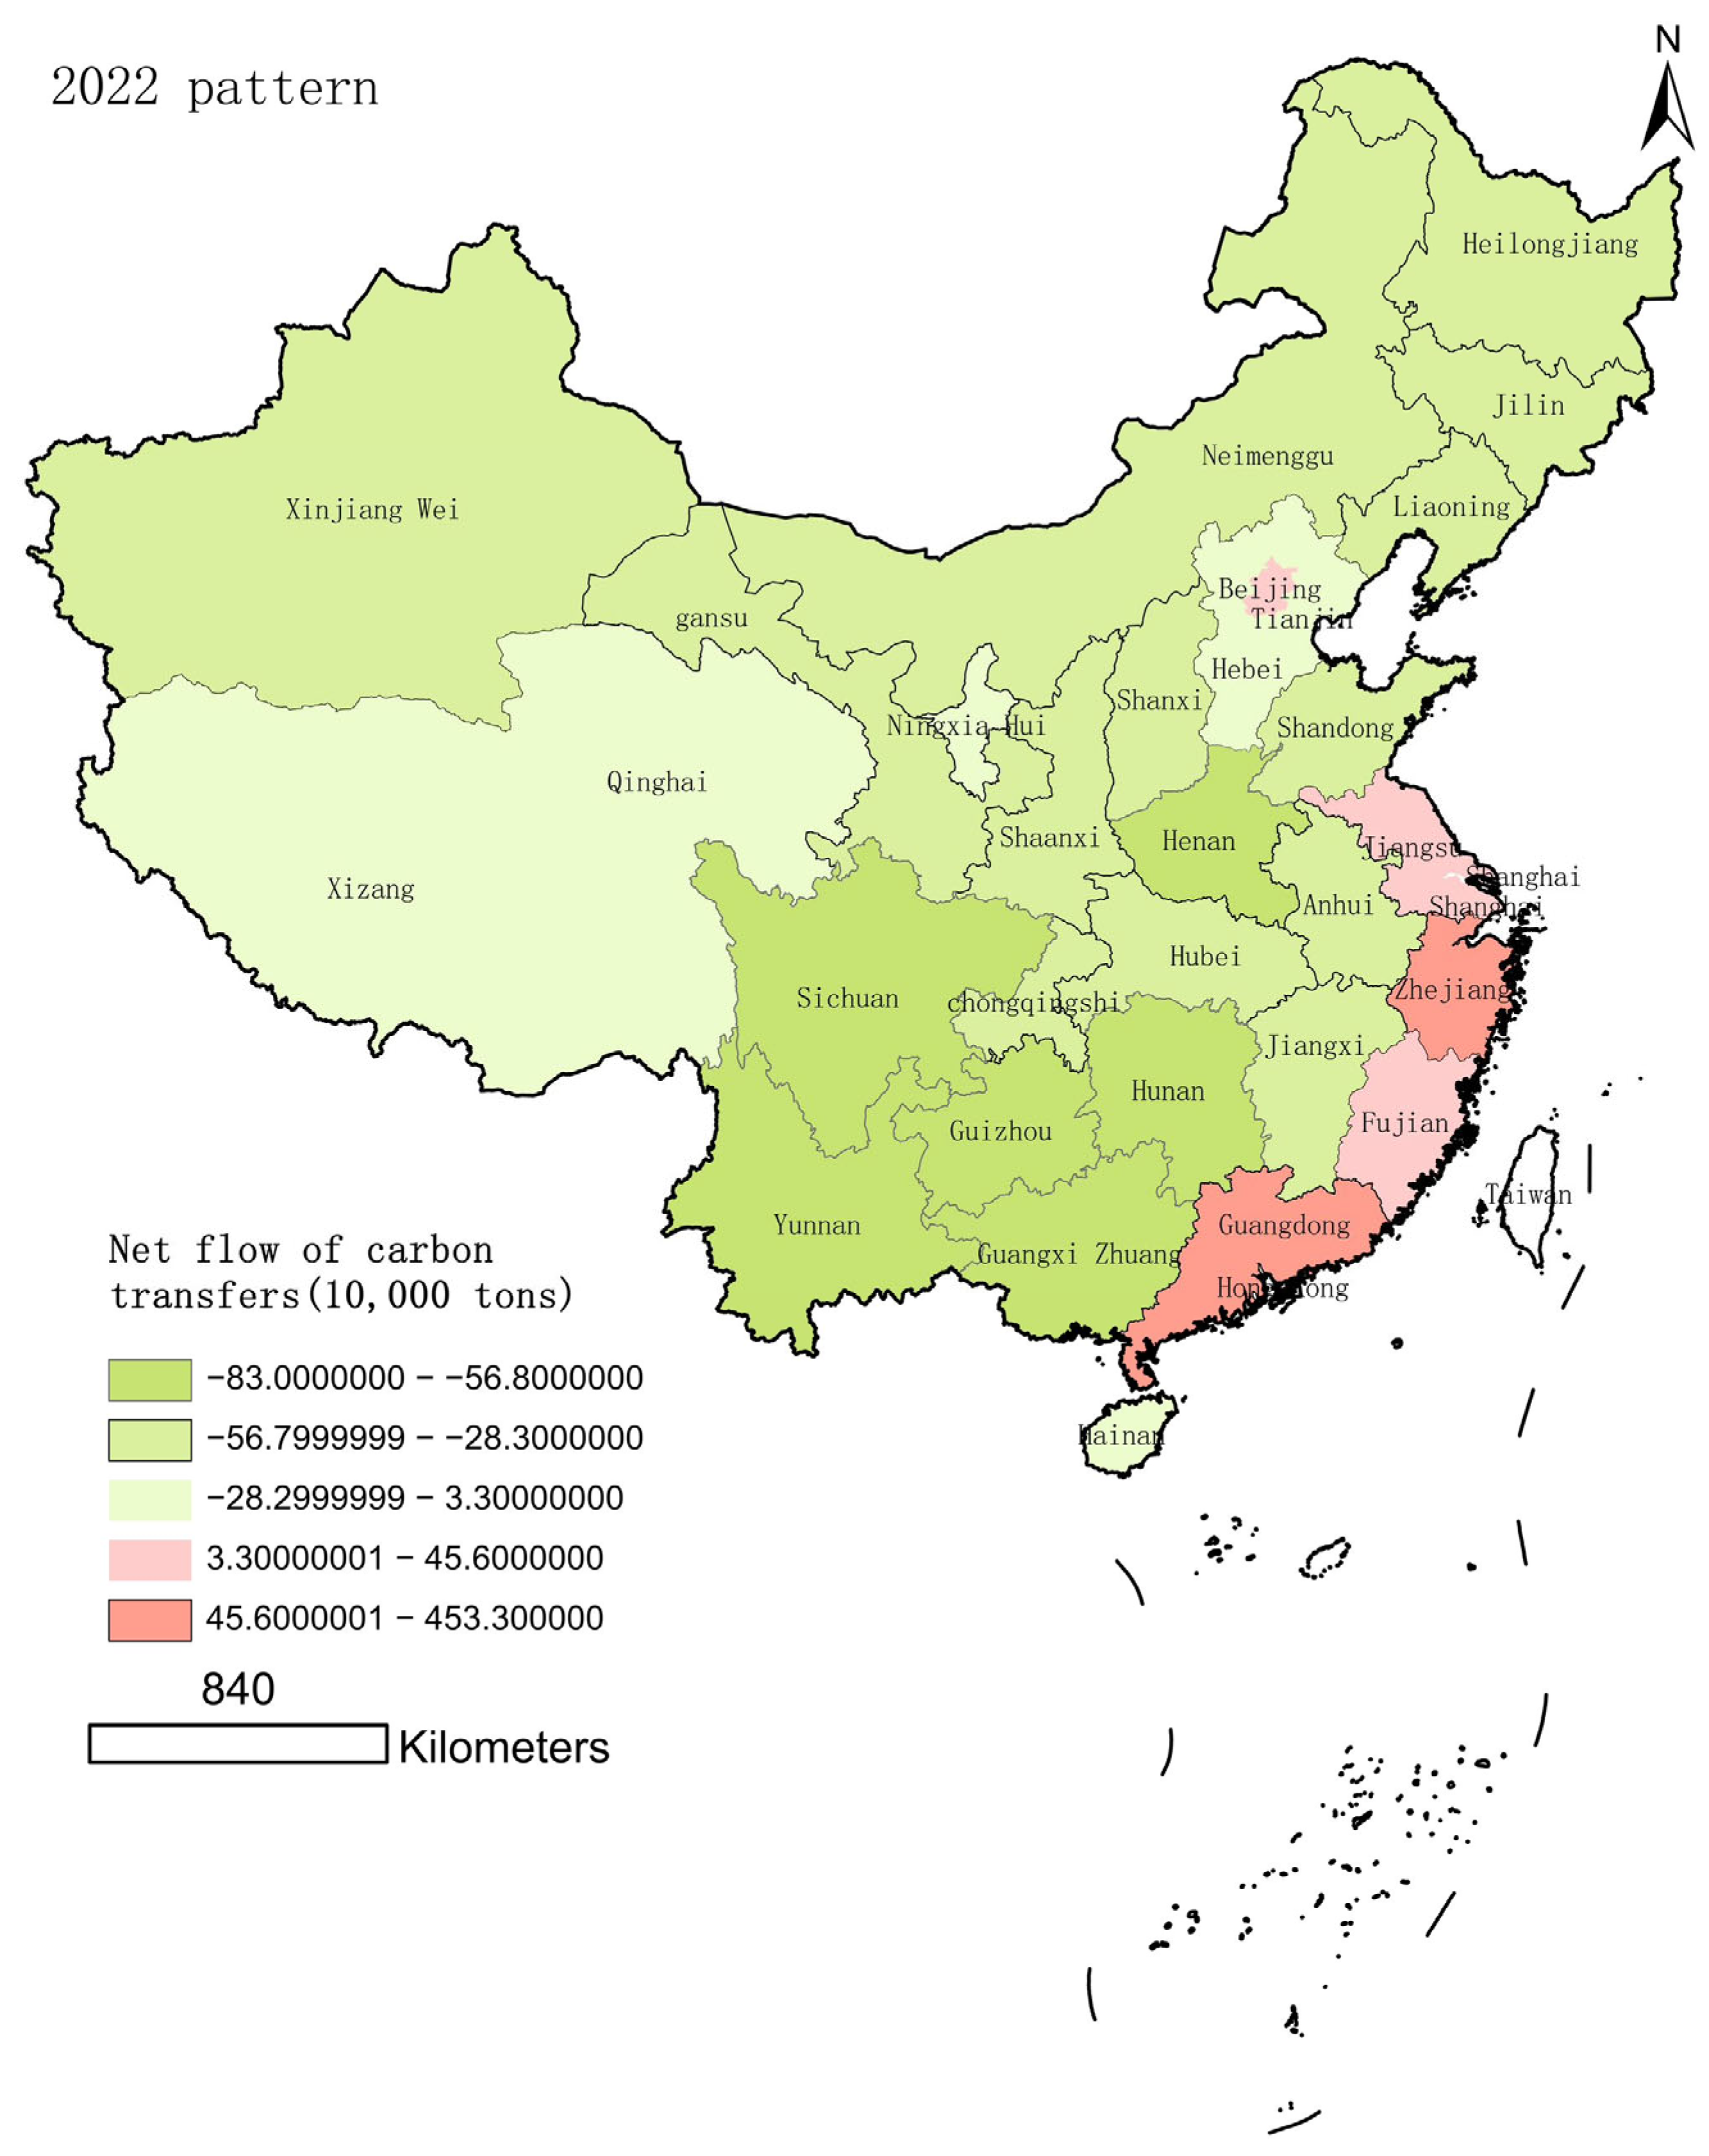
- There is a clear pattern of embodied carbon transfer between provinces in China. Net embodied carbon outflows are concentrated in seven provinces, including Guangdong and Zhejiang, while net inflows follow a “more in the east and south, less in the west and north” distribution. Embodied carbon transfers account for as much as 40% of the total. Specifically, Guangdong and Zhejiang contributed 4.533 million and 3.98 million tCO2e, respectively, accounting for 89.79% of the total net outflow.
Author Contributions
Funding
Institutional Review Board Statement
Informed Consent Statement
Data Availability Statement
Acknowledgments
Conflicts of Interest
Appendix A
Appendix A.1

| Province | Corrugated Box | Plastic Bag | Woven Bag | Plastic Bubble Bag | Plastic Foam Box | Document Pocket | The Total | Paper | Plastics |
|---|---|---|---|---|---|---|---|---|---|
| nationwide | 811.2 | 1678.6 | 97.6 | 159.8 | 26.9 | 222.9 | 2996.9 | 1034.1 | 1962.8 |
| Anhui | 25.9 | 53.6 | 3.1 | 5.1 | 0.9 | 7.1 | 95.7 | 33.0 | 62.7 |
| Beijing | 14.4 | 29.7 | 1.7 | 2.8 | 0.5 | 3.9 | 53.0 | 18.3 | 34.7 |
| Fujian | 31.3 | 64.7 | 3.8 | 6.2 | 1.0 | 8.6 | 115.6 | 39.9 | 75.7 |
| Gansu | 1.4 | 3.0 | 0.2 | 0.3 | 0.0 | 0.4 | 5.3 | 1.8 | 3.5 |
| Guangdong | 221.1 | 457.5 | 26.6 | 43.5 | 7.3 | 60.8 | 816.7 | 281.8 | 534.9 |
| Guangxi | 7.7 | 16.0 | 0.9 | 1.5 | 0.3 | 2.1 | 28.6 | 9.9 | 18.7 |
| Guizhou | 3.6 | 7.5 | 0.4 | 0.7 | 0.1 | 1.0 | 13.3 | 4.6 | 8.7 |
| Hainan | 1.2 | 2.5 | 0.1 | 0.2 | 0.0 | 0.3 | 4.5 | 1.5 | 2.9 |
| Hebei | 38.7 | 80.0 | 4.7 | 7.6 | 1.3 | 10.6 | 142.8 | 49.3 | 93.5 |
| Henan | 32.7 | 67.6 | 3.9 | 6.4 | 1.1 | 9.0 | 120.7 | 41.6 | 79.0 |
| Heilongjiang | 5.3 | 11.0 | 0.6 | 1.0 | 0.2 | 1.5 | 19.7 | 6.8 | 12.9 |
| Hubei | 23.6 | 48.8 | 2.8 | 4.6 | 0.8 | 6.5 | 87.1 | 30.0 | 57.0 |
| Hunan | 17.0 | 35.2 | 2.0 | 3.3 | 0.6 | 4.7 | 62.8 | 21.7 | 41.1 |
| Jilin | 4.3 | 8.8 | 0.5 | 0.8 | 0.1 | 1.2 | 15.8 | 5.4 | 10.3 |
| Jiangsu | 63.9 | 132.2 | 7.7 | 12.6 | 2.1 | 17.6 | 236.1 | 81.5 | 154.6 |
| Jiangxi | 13.4 | 27.7 | 1.6 | 2.6 | 0.4 | 3.7 | 49.4 | 17.0 | 32.4 |
| Liaoning | 12.6 | 26.0 | 1.5 | 2.5 | 0.4 | 3.5 | 46.4 | 16.0 | 30.4 |
| Inner Mongolia | 1.8 | 3.7 | 0.2 | 0.3 | 0.1 | 0.5 | 6.6 | 2.3 | 4.3 |
| Ningxia | 0.7 | 1.5 | 0.1 | 0.1 | 0.0 | 0.2 | 2.7 | 0.9 | 1.8 |
| Qinghai | 0.2 | 0.5 | 0.0 | 0.0 | 0.0 | 0.1 | 0.8 | 0.3 | 0.6 |
| Shandong | 42.3 | 87.6 | 5.1 | 8.3 | 1.4 | 11.6 | 156.4 | 54.0 | 102.4 |
| Shanxi | 5.2 | 10.7 | 0.6 | 1.0 | 0.2 | 1.4 | 19.1 | 6.6 | 12.5 |
| Shaanxi | 8.3 | 17.1 | 1.0 | 1.6 | 0.3 | 2.3 | 30.6 | 10.6 | 20.0 |
| Shanghai | 21.0 | 43.4 | 2.5 | 4.1 | 0.7 | 5.8 | 77.4 | 26.7 | 50.7 |
| Sichuan | 21.0 | 43.6 | 2.5 | 4.1 | 0.7 | 5.8 | 77.8 | 26.8 | 50.9 |
| Tianjin | 8.9 | 18.5 | 1.1 | 1.8 | 0.3 | 2.5 | 32.9 | 11.4 | 21.6 |
| Tibet | 0.1 | 0.2 | 0.0 | 0.0 | 0.0 | 0.0 | 0.3 | 0.1 | 0.2 |
| Xinjiang | 1.2 | 2.5 | 0.1 | 0.2 | 0.0 | 0.3 | 4.4 | 1.5 | 2.9 |
| Yunnan | 6.5 | 13.5 | 0.8 | 1.3 | 0.2 | 1.8 | 24.1 | 8.3 | 15.8 |
| chekiang | 168.0 | 347.7 | 20.2 | 33.1 | 5.6 | 46.2 | 620.7 | 214.2 | 406.5 |
| Chongqing | 8.0 | 16.6 | 1.0 | 1.6 | 0.3 | 2.2 | 29.6 | 10.2 | 19.4 |
Appendix A.2
| Province | Corrugated Box | Plastic Bag | Woven Bag | Plastic Bubble Bag | Plastic Foam Box | Document Pocket | The Total | Paper | Plastics |
|---|---|---|---|---|---|---|---|---|---|
| nationwide | 236.9 | 350.7 | 26.6 | 27.0 | 6.7 | 0.7 | 648.6 | 237.6 | 411.0 |
| Anhui | 7.6 | 11.2 | 0.8 | 0.9 | 0.2 | 0.0 | 20.7 | 7.6 | 13.1 |
| Beijing | 4.2 | 6.2 | 0.5 | 0.5 | 0.1 | 0.0 | 11.5 | 4.2 | 7.3 |
| Fujian | 9.1 | 13.5 | 1.0 | 1.0 | 0.3 | 0.0 | 25.0 | 9.2 | 15.8 |
| Gansu | 0.4 | 0.6 | 0.0 | 0.0 | 0.0 | 0.0 | 1.1 | 0.4 | 0.7 |
| Guangdong | 64.6 | 95.6 | 7.3 | 7.4 | 1.8 | 0.2 | 176.8 | 64.8 | 112.0 |
| Guangxi | 2.3 | 3.3 | 0.3 | 0.3 | 0.1 | 0.0 | 6.2 | 2.3 | 3.9 |
| Guizhou | 1.1 | 1.6 | 0.1 | 0.1 | 0.0 | 0.0 | 2.9 | 1.1 | 1.8 |
| Hainan | 0.4 | 0.5 | 0.0 | 0.0 | 0.0 | 0.0 | 1.0 | 0.4 | 0.6 |
| Hebei | 11.3 | 16.7 | 1.3 | 1.3 | 0.3 | 0.0 | 30.9 | 11.3 | 19.6 |
| Henan | 9.5 | 14.1 | 1.1 | 1.1 | 0.3 | 0.0 | 26.1 | 9.6 | 16.6 |
| Heilongjiang | 1.6 | 2.3 | 0.2 | 0.2 | 0.0 | 0.0 | 4.3 | 1.6 | 2.7 |
| Hubei | 6.9 | 10.2 | 0.8 | 0.8 | 0.2 | 0.0 | 18.8 | 6.9 | 11.9 |
| Hunan | 5.0 | 7.3 | 0.6 | 0.6 | 0.1 | 0.0 | 13.6 | 5.0 | 8.6 |
| Jilin | 1.2 | 1.8 | 0.1 | 0.1 | 0.0 | 0.0 | 3.4 | 1.3 | 2.2 |
| Jiangsu | 18.7 | 27.6 | 2.1 | 2.1 | 0.5 | 0.1 | 51.1 | 18.7 | 32.4 |
| Jiangxi | 3.9 | 5.8 | 0.4 | 0.4 | 0.1 | 0.0 | 10.7 | 3.9 | 6.8 |
| Liaoning | 3.7 | 5.4 | 0.4 | 0.4 | 0.1 | 0.0 | 10.0 | 3.7 | 6.4 |
| Inner Mongolia | 0.5 | 0.8 | 0.1 | 0.1 | 0.0 | 0.0 | 1.4 | 0.5 | 0.9 |
| Ningxia | 0.2 | 0.3 | 0.0 | 0.0 | 0.0 | 0.0 | 0.6 | 0.2 | 0.4 |
| Qinghai | 0.1 | 0.1 | 0.0 | 0.0 | 0.0 | 0.0 | 0.2 | 0.1 | 0.1 |
| Shandong | 12.4 | 18.3 | 1.4 | 1.4 | 0.4 | 0.0 | 33.9 | 12.4 | 21.5 |
| Shanxi | 1.5 | 2.2 | 0.2 | 0.2 | 0.0 | 0.0 | 4.1 | 1.5 | 2.6 |
| Shaanxi | 2.4 | 3.6 | 0.3 | 0.3 | 0.1 | 0.0 | 6.6 | 2.4 | 4.2 |
| Shanghai | 6.1 | 9.1 | 0.7 | 0.7 | 0.2 | 0.0 | 16.8 | 6.1 | 10.6 |
| Sichuan | 6.1 | 9.1 | 0.7 | 0.7 | 0.2 | 0.0 | 16.8 | 6.2 | 10.7 |
| Tianjin | 2.6 | 3.9 | 0.3 | 0.3 | 0.1 | 0.0 | 7.1 | 2.6 | 4.5 |
| Tibet | 0.0 | 0.0 | 0.0 | 0.0 | 0.0 | 0.0 | 0.1 | 0.0 | 0.0 |
| Xinjiang | 0.3 | 0.5 | 0.0 | 0.0 | 0.0 | 0.0 | 1.0 | 0.3 | 0.6 |
| Yunnan | 1.9 | 2.8 | 0.2 | 0.2 | 0.1 | 0.0 | 5.2 | 1.9 | 3.3 |
| chekiang | 49.1 | 72.6 | 5.5 | 5.6 | 1.4 | 0.1 | 134.3 | 49.2 | 85.1 |
| Chongqing | 2.3 | 3.5 | 0.3 | 0.3 | 0.1 | 0.0 | 6.4 | 2.3 | 4.1 |
Appendix A.3
| Province | Corrugated Box | Plastic Bag | Woven Bag | Plastic Bubble Bag | Plastic Foam Box | Document Pocket | The Total | Paper | Plastics |
|---|---|---|---|---|---|---|---|---|---|
| nationwide | 129.8 | 258.5 | 20.5 | 30.7 | 3.7 | 12.5 | 455.6 | 142.3 | 313.3 |
| Anhui | 2.1 | 4.1 | 0.3 | 0.5 | 0.1 | 0.2 | 7.3 | 2.3 | 5 |
| Beijing | 1.1 | 2.3 | 0.2 | 0.3 | 0 | 0.1 | 4 | 1.3 | 2.8 |
| Fujian | 2.5 | 5 | 0.4 | 0.6 | 0.1 | 0.2 | 8.8 | 2.7 | 6 |
| Gansu | 0.1 | 0.2 | 0 | 0 | 0 | 0 | 0.4 | 0.1 | 0.3 |
| Guangdong | 17.7 | 35.2 | 2.8 | 4.2 | 0.5 | 1.7 | 62.1 | 19.4 | 42.7 |
| Guangxi | 0.6 | 1.2 | 0.1 | 0.1 | 0 | 0.1 | 2.2 | 0.7 | 1.5 |
| Guizhou | 0.3 | 0.6 | 0 | 0.1 | 0 | 0 | 1 | 0.3 | 0.7 |
| Hainan | 0.1 | 0.2 | 0 | 0 | 0 | 0 | 0.3 | 0.1 | 0.2 |
| Hebei | 3.1 | 6.2 | 0.5 | 0.7 | 0.1 | 0.3 | 10.9 | 3.4 | 7.5 |
| Henan | 2.6 | 5.2 | 0.4 | 0.6 | 0.1 | 0.3 | 9.2 | 2.9 | 6.3 |
| Heilongjiang | 0.4 | 0.8 | 0.1 | 0.1 | 0 | 0 | 1.5 | 0.5 | 1 |
| Hubei | 1.9 | 3.8 | 0.3 | 0.4 | 0.1 | 0.2 | 6.6 | 2.1 | 4.6 |
| Hunan | 1.4 | 2.7 | 0.2 | 0.3 | 0 | 0.1 | 4.8 | 1.5 | 3.3 |
| Jilin | 0.3 | 0.7 | 0.1 | 0.1 | 0 | 0 | 1.2 | 0.4 | 0.8 |
| Jiangsu | 5.1 | 10.2 | 0.8 | 1.2 | 0.1 | 0.5 | 17.9 | 5.6 | 12.3 |
| Jiangxi | 1.1 | 2.1 | 0.2 | 0.3 | 0 | 0.1 | 3.8 | 1.2 | 2.6 |
| Liaoning | 1 | 2 | 0.2 | 0.2 | 0 | 0.1 | 3.5 | 1.1 | 2.4 |
| Inner Mongolia | 0.1 | 0.3 | 0 | 0 | 0 | 0 | 0.5 | 0.2 | 0.3 |
| Ningxia | 0.1 | 0.1 | 0 | 0 | 0 | 0 | 0.2 | 0.1 | 0.1 |
| Qinghai | 0 | 0 | 0 | 0 | 0 | 0 | 0.1 | 0 | 0 |
| Shandong | 3.4 | 6.7 | 0.5 | 0.8 | 0.1 | 0.3 | 11.9 | 3.7 | 8.2 |
| Shanxi | 0.4 | 0.8 | 0.1 | 0.1 | 0 | 0 | 1.5 | 0.5 | 1 |
| Shaanxi | 0.7 | 1.3 | 0.1 | 0.2 | 0 | 0.1 | 2.3 | 0.7 | 1.6 |
| Shanghai | 1.7 | 3.3 | 0.3 | 0.4 | 0 | 0.2 | 5.9 | 1.8 | 4 |
| Sichuan | 1.7 | 3.4 | 0.3 | 0.4 | 0 | 0.2 | 5.9 | 1.8 | 4.1 |
| Tianjin | 0.7 | 1.4 | 0.1 | 0.2 | 0 | 0.1 | 2.5 | 0.8 | 1.7 |
| Tibet | 0 | 0 | 0 | 0 | 0 | 0 | 0 | 0 | 0 |
| Xinjiang | 0.1 | 0.2 | 0 | 0 | 0 | 0 | 0.3 | 0.1 | 0.2 |
| Yunnan | 0.5 | 1 | 0.1 | 0.1 | 0 | 0.1 | 1.8 | 0.6 | 1.3 |
| chekiang | 13.4 | 26.8 | 2.1 | 3.2 | 0.4 | 1.3 | 47.2 | 14.7 | 32.4 |
| Chongqing | 0.6 | 1.3 | 0.1 | 0.2 | 0 | 0.1 | 2.2 | 0.7 | 1.5 |
References
- Xu, X. 2023 E-commerce market retail sales reached 15.42 trillion yuan for 11 consecutive years to become the world’s largest online retail market. China Storage Transp. 2024, 03, 22. [Google Scholar]
- Central People’s Government of the People’s Republic of China. 2024 National Express Delivery Business Volume Exceeded 170 Billion Pieces for the First Time—‘Smooth Flow of Goods’ Accelerates the Realisation of the Beautiful Vision. Available online: https://www.mot.gov.cn/tongjishuju/youzheng/202301/t20230130_3747917.html (accessed on 11 April 2025).
- Greenpeace. Carbon Emissions from China’s Courier Industry. 2023. Available online: https://www.greenpeace.org.cn/wp-content/uploads/2023/06/express-industry-emissions.pdf (accessed on 25 March 2024).
- China Petroleum & Chemical Corporation. 2021–2030 Research Report on Carbon Emission Reduction Potential of Green Packaging in China’s Express Industry. 2022. Available online: https://www.199it.com/archives/1503815.html (accessed on 25 March 2024).
- Li, F. Progress and prospects of research on transfer of carbon emissions embodied in inter-regional trade. Prog. Geogr. 2018, 37, 1303–1313. [Google Scholar]
- United Nations Framework Convention on Climate Change. Paris Agreement. 2015. Available online: https://unfccc.int/files/meetings/paris_nov_2015/application/pdf/paris_agreement_chinese.pdf (accessed on 11 April 2025).
- Ho, C.M.; Feng, W.; Li, X.; Ngien, S.K.; Yu, X.; Song, F.; Yang, F.; Liao, H. Microplastic distribution and its implications for human health through marine environments. J. Environ. Manag. 2025, 382, 125427. [Google Scholar] [CrossRef] [PubMed]
- Liu, W. Preface to the column of research on carbon peak in China. Resour. Sci. 2021, 43, 637–638. [Google Scholar]
- Fu, T.; Wu, Y.; Xue, L. Summary of Express Packaging Research Based on the Carbon Footprint. Mod. Ind. Econ. Inf. 2018, 8, 42–44. [Google Scholar]
- Zhou, Y.; Gan, L.; Han, F. Carbon footprint accounting of express delivery based on life cycle assessment. Logist. Technol. 2021, 40, 104–109. [Google Scholar]
- Ren, S.; Zhang, Y.; Zhu, L.; Liu, X.; Jiang, D. Research on the calculation method of carbon footprint of the whole life cycle of recycled packaging box. Packag. Eng. 2023, 44, 245–252. [Google Scholar]
- Zhang, H.; Wan, H.; Quan, H. Simple algorithm of e-commerce logistics outlet layout based on carbon footprint. Logist. Technol. 2018, 37, 74–78. [Google Scholar]
- Yan, J.; Li, X.; Xiong, M.; He, J.; Chen, X.; Ding, W.; Wu, K.; Yue, Z.; Li, Q. Research on the standardisation of online shopping express packaging and recycling. China Stand. 2022, S1, 211–216. [Google Scholar]
- Zhang, B.; Li, L.; Yang, C.; Wu, L. Research on the current situation of disposable plastic packaging pollution and countermeasures in express industry. Green Packag. 2023, 2023, 55–59. [Google Scholar] [CrossRef]
- Jing, X. Research on plastic rubbish bag recycling device. Eng. Technol. Appl. 2025, 28, 9–10. [Google Scholar]
- Marques, A.; Rodrigues, J.; Lenzen, M.; Domingos, T. Income-basedenvironmental responsibility. Ecol. Econ. 2012, 84, 57–65. [Google Scholar] [CrossRef]
- Ferng, J.J. Allocating the responsibility of CO2over-emissions from the perspectives of benefit principle and ecological deficit. Ecol. Econ. 2003, 46, 121–141. [Google Scholar] [CrossRef]
- Wiedmann, T. A review of recent multi-region input-output models used for consumption-based emission and resource accounting. Ecol. Econ. 2009, 69, 211–222. [Google Scholar] [CrossRef]
- Xu, Y.; He, J. Equal rights norms on climate change. World Environ. 2000, 17–21. [Google Scholar]
- Bastianoni, S.; Pulselli, F.M.; Tiezzi, E. The problem of assigning responsibility for greenhouse gas emissions. Ecol. Econ. 2004, 49, 253–257. [Google Scholar] [CrossRef]
- Lenzen, M.; Murray, J.; Sack, F.; Wiedmann, T. Shared producer and consumer responsibility-Theory and practice. Ecol. Econ. 2007, 61, 27–42. [Google Scholar] [CrossRef]
- Peters, G.P.; Hertwich, E.G. CO2 embodied in international trade with implications for global climate policy. Environ. Sci. 2008, 42, 1401. [Google Scholar] [CrossRef]
- Zhao, D.; Yang, S. Carbon Emission Sharing Mechanism for Trade under the Perspective of Shared Responsibility. China Popul.-Resour. Environ. 2013, 23, 1–6. [Google Scholar]
- Xing, Y.; Wang, Y.; Wang, X. Progress of research on implied carbon in international trade. Econ. Dyn. 2023, 2023, 141–160. [Google Scholar]
- Xing, Z. Measurement of implied carbon emissions from China’s inter-provincial trade and cross-regional compensation mechanism. Environ. Econ. Res. 2023, 8, 84–99. [Google Scholar]
- Luo, H.; Zhang, R.; Liang, Z.; Zhang, J.; Chui, X.; Zhang, H.; Li, R. Embodied carbon emissions and its spatial patterns of urban-rural flow in China’s inter-provincial trade. J. North China Univ. Water Resour. Electr. Power (Nat. Sci. Ed.) 2023, 44, 83–91. [Google Scholar]
- Yang, Z.; Fang, G.; Sun, W. Embodied carbon emissions and their transfer pathways in global aluminum trade: The value chain perspective. J. Clean. Prod. 2025, 494, 145057. [Google Scholar] [CrossRef]
- Wu, X.D.; Guo, J.L.; Li, C.; Chen, G.Q.; Ji, X. Carbon emissions embodied in the global supply chain: Intermediate and final trade imbalances. Sci. Total Environ. 2020, 707, 134670. [Google Scholar] [CrossRef]
- Liu, H.; Liu, W.; Fan, X.; Zou, W. Carbon emissions embodied in demand–supply chains in China. Energy Econ. 2015, 50, 294–305. [Google Scholar] [CrossRef]
- Dong, T.; Li, L.; Li, A.; Xu, P.; Ou, W.; Wang, Z. Structural characterisation of multi-regional implied carbon networks in China. Resour. Ind. 2023, 25, 12–25. [Google Scholar]
- Adu, T.F.; Zebilila, M.D.; Adzakey, P.; Sarkodie, W.O.; Mustapha, Z. Life cycle embodied carbon evaluation of a two-bedroom house construction in Ghana: A comparison between stabilized laterite and sancrete building. Heliyon 2025, 11, e42212. [Google Scholar] [CrossRef]
- Santos, A.K.; Ferreira, V.M.; Dias, A.C. Promoting decarbonisation in the construction of new buildings: A strategy to calculate the Embodied Carbon Footprint. J. Build. Eng. 2025, 103, 112037. [Google Scholar] [CrossRef]
- Moran, P.; Flynn, J.; Larkin, C.; Goggins, J.; Elkhayat, Y. Materials and service lives alterations impacts on reducing the whole life embodied carbon of buildings: A case study of a student accommodation development in Ireland. Case Stud. Constr. Mater. 2025, 22, e04514. [Google Scholar] [CrossRef]
- Liang, X.; He, Z. Measurement of implied carbon emissions in China’s paper industry and analysis of its influencing factors. China Pap. Ind. 2025, 44, 72–80. [Google Scholar]
- Li, Z. Analysis of Industrial Linkages and Influencing Factors of Implied Carbon Emissions in China’s Logistics Industry. Master’s Thesis, Tianjin University of Technology, Tianjin, China, 2024. [Google Scholar]
- Bai, S.; Zhang, B.; Ning, Y. Trends and drivers of China’s embodied carbon emissions in global value chains. J. Environ. Manag. 2025, 373, 123623. [Google Scholar] [CrossRef] [PubMed]
- China Internet Network Information Centre. 51st Statistical Report on the Development Status of the Internet in China. 2023. Available online: https://www3.cnnic.cn/n4/2023/0303/c88-10757.html (accessed on 11 April 2025).
- Yu, J.; Zhang, Y.; Liu, W.; Wang, Y.; Jiang, Y.; Zhang, Y. Study on the spatial decomposition of carbon foot print and the embodied carbon emission transfer of the e commerce express box. Geogr. Res. 2022, 41, 92–110. [Google Scholar]
- Ministry of Transport of the People’s Republic of China. Statistical Bulletin on Postal Industry Development in 2022. Available online: https://www.spb.gov.cn/gjyzj/c100276/202305/d5756a12b51241a9b81dc841ff2122c6.shtml (accessed on 11 April 2025).
- Chen, L.; Jing, Y. Advantages, boundaries and prospects of input-output research. Econ. Dyn. 2023, 2023, 80–93. [Google Scholar]
- Ma, Y.; Cao, D.; Luo, W.; Li, G.; Zhang, W.; Li, Y. The evaluation of the livestock and poultry production of carbon emissions in China based on life cycle assessment. China Environ. Sci. 2024, 44, 2799–2810. [Google Scholar]
- Liu, Z.; Wei, Y.; Li, Y.; Yu, F.; Wang, S.; Xue, B. Development, application and challenges of hybrid life cycle approaches. Chin. J. Ecol. 2024, 43, 2824–2833. [Google Scholar]
- Greenpeace. China’s Express Packaging Waste Generation Characteristics and Management Status. Research Report on the Characteristics and Management Status of Express Packaging Waste Generation in China-.pdf. Available online: https://www.greenpeace.org.cn/ (accessed on 11 April 2025).
- Duan, H.; Liu, X.; Zhou, Y.; Kang, P. Research on the characteristics of plastic packaging waste generation and management countermeasures for express delivery. World Environ. 2020, 28–33. [Google Scholar]
- Dong, H.; Geng, Y.; Xi, F.; Fujita, T. Carbon footprint evaluation at industrial park level: A hybrid life cycle assessment approach. Energy Policy 2013, 57, 298–307. [Google Scholar] [CrossRef]
- Wei, T.; Peng, S. Embodied energy and carbon emissions transferred in international trade using a MRIO model. Resour. Sci. 2017, 39, 94–104. [Google Scholar]
- Yang, Z.; Peng, B.; Sun, J. Spatial network of industrial chains and their embodied carbon emissions in the Beijing-Tianjin-Hebei region. Prog. Geogr. 2024, 43, 215–230. [Google Scholar] [CrossRef]
- Yang, J.; Yang, Z.; Cong, J.; Zhang, Y. Optimization of China’s provincial carbon emission responsibility sharing scheme based onthe principle of responsibility and benefit matching. Resour. Sci. 2022, 44, 1745–1758. [Google Scholar]
- Chinese Internet Data Consultancy Network. UNitar & IUT: Global E-Waste Monitor 2024. 2014. Available online: https://www.199it.com/archives/1681932.html (accessed on 11 April 2025).
- Zhang, Q.; Li, J.; Du, B. Carbon emission transfer and shared responsibility allocation in the supply chain: Evidence from the construction sector in China. Sustain. Prod. Consum. 2025, 55, 285–296. [Google Scholar] [CrossRef]
- Central People’s Government of the People’s Republic of China. Interim Regulations on the Administration of Carbon Emission Trading. 2024. Available online: https://www.gov.cn/zhengce/content/202402/content_6930137.htm (accessed on 11 April 2025).
- Chang, J. Implementation of the EU carbon border adjustment mechanism and China’s policy and legal responses. Environ. Impact Assess. Rev. 2025, 110, 107683. [Google Scholar] [CrossRef]
- Ministry of Transport of the People’s Republic of China. National Postal Administration Announces Postal Industry Operations for 2024. 2025. Available online: https://www.mot.gov.cn/tongjishuju/youzheng/202501/t20250124_4163116.html (accessed on 11 April 2025).


| Notation | Significance |
|---|---|
| E1 | Total Life Cycle Carbon Footprint of E-commerce Express Packaging Materials |
| E2 | E-commerce express packaging materials raw materials stage carbon footprint |
| E3 | Carbon footprint of e-commerce express packaging materials at the production stage |
| E4 | Carbon Footprint of E-commerce Express Packaging Material Disposal Stage |
| Ri | Express Receipts in Provincial Administrative Regions, 2022 (pieces) |
| P | Size of total resident population in provincial administrative districts (persons) |
| Pi | Size of resident population in each provincial administrative district (persons) |
| I | Internet penetration rate (uniform value of 0.756), data quoted from the 51st Statistical Report on the Development of the Internet in China by CNNIC. |
| A | Total annual business volume of national e-commerce courier (pieces) |
| N | Total annual business volume of national e-commerce courier (pieces) |
| X | Share of paper-based e-commerce express packaging materials (57.1 percent) |
| Y | Plastic packaging 42.9 percent |
| L | Consumption of packaging materials for a single piece of express delivery (0.0002 tonnes/piece), determined based on analysis of historical data for 2018–2020 |
| μi | Proportion of each type of material in China’s e-commerce express packaging in the overall packaging material |
| μm | Proportion of treatment methods used in the paper packaging waste treatment chain for each paper type of material |
| μn | Proportion of treatment methods used for each plastic material in the plastic packaging waste treatment chain |
| Fi/Fk | Carbon emission factor of a material at the raw material/production stage in China’s e-commerce express packaging |
| Fm/Fn | Carbon emission factors of a paper/plastic material in China’s e-commerce delivery at the waste disposal stage |
| Types | Raw Material | Production | Landfill | Incineration | Recycling | |||
|---|---|---|---|---|---|---|---|---|
| EFs | Data Source | Efs | Data Source | EFs | Data Source | |||
| Corrugated box | 0.88 | China express packaging standard | 0.257 | China express packaging standard | 1.084 | 0.855 | −0.03 | GaBi database |
| envelope | 2.52 | 0.008 | 1.084 | 0.855 | −0.049 | |||
| Plastic bag | 2.68 | 0.56 | 0.104 | 0.949 | −0.068 | |||
| Woven bag | 1.96 | 0.537 | 0.096 | 1.72 | −0.068 | |||
| Foam box | 3.04 | Calculation based on GaBi software | 0.758 | Calculation based on GaBi software | 0.117 | 1.652 | −0.061 | |
| Bubble pack | 2.15 | 0.363 | 0.012 | 0.563 | −0.068 | |||
| Province | E2 | E3 | E4 | Er1 | Er5 | Er13 |
|---|---|---|---|---|---|---|
| nationwide | 2996.9 | 648.6 | 455.6 | 4101.2 | 4120.9 | −19.7 |
| Anhui | 95.7 | 20.7 | 15.6 | 137.7 | 160.6 | −28.6 |
| Beijing | 53 | 11.5 | 8.6 | 72.1 | 67.7 | 5.5 |
| Fujian | 115.6 | 25 | 18.8 | 155.1 | 137.4 | 22 |
| Gansu | 5.3 | 1.1 | 0.9 | 15.1 | 46.8 | −39.5 |
| Guangdong | 816.7 | 176.8 | 133.1 | 1037.4 | 673.3 | 453.3 |
| Guangxi | 28.6 | 6.2 | 4.7 | 52.3 | 104.6 | −65.1 |
| Guizhou | 13.3 | 2.9 | 2.2 | 29.6 | 75.2 | −56.8 |
| Hainan | 4.5 | 1 | 0.7 | 9 | 20.5 | −14.4 |
| Hebei | 142.8 | 30.9 | 23.3 | 199.4 | 209.3 | −12.4 |
| Henan | 120.7 | 26.1 | 19.7 | 181 | 240.3 | −73.8 |
| Heilongjiang | 19.7 | 4.3 | 3.2 | 34.7 | 65.4 | −38.2 |
| Hubei | 87.1 | 18.8 | 14.2 | 126.2 | 150.9 | −30.8 |
| Hunan | 62.8 | 13.6 | 10.2 | 99.3 | 150.8 | −64.2 |
| Jilin | 15.8 | 3.4 | 2.6 | 27.3 | 50 | −28.3 |
| Jiangsu | 236.1 | 51.1 | 38.5 | 316.7 | 280.1 | 45.6 |
| Jiangxi | 49.4 | 10.7 | 8.1 | 75.8 | 106.9 | −38.8 |
| Liaoning | 46.4 | 10 | 7.6 | 71 | 99.4 | −35.4 |
| Inner Mongolia | 6.6 | 1.4 | 1.1 | 16.3 | 45.9 | −36.8 |
| Ningxia | 2.7 | 0.6 | 0.4 | 5.8 | 14.3 | −10.6 |
| Qinghai | 0.8 | 0.2 | 0.1 | 3.1 | 10.9 | −9.8 |
| Shandong | 156.4 | 33.9 | 25.5 | 225.5 | 265.1 | −49.3 |
| Shanxi | 19.1 | 4.1 | 3.1 | 35.3 | 71.8 | −45.4 |
| Shaanxi | 30.6 | 6.6 | 5 | 50.9 | 86.5 | −44.3 |
| Shanghai | 77.4 | 16.8 | 12.6 | 102.8 | 86.3 | 20.6 |
| Sichuan | 77.8 | 16.8 | 12.7 | 123.6 | 190.2 | −83 |
| Tianjin | 32.9 | 7.1 | 5.4 | 44.8 | 42.2 | 3.3 |
| Tibet | 0.3 | 0.1 | 0.1 | 1.7 | 6.6 | −6.1 |
| Xinjiang | 4.4 | 1 | 0.7 | 14.3 | 47.9 | −41.9 |
| Yunnan | 24.1 | 5.2 | 3.9 | 45.5 | 95.8 | −62.7 |
| Chekiang | 620.7 | 134.3 | 101.2 | 777.9 | 458.2 | 398 |
| Chongqing | 29.6 | 6.4 | 4.8 | 47.1 | 72.9 | −32 |
Disclaimer/Publisher’s Note: The statements, opinions and data contained in all publications are solely those of the individual author(s) and contributor(s) and not of MDPI and/or the editor(s). MDPI and/or the editor(s) disclaim responsibility for any injury to people or property resulting from any ideas, methods, instructions or products referred to in the content. |
© 2025 by the authors. Licensee MDPI, Basel, Switzerland. This article is an open access article distributed under the terms and conditions of the Creative Commons Attribution (CC BY) license (https://creativecommons.org/licenses/by/4.0/).
Share and Cite
Luo, Z.-H.; Zhu, C.-Z. Study on the Spatial Pattern of the Carbon Footprint of China’s E-Commerce Express Packaging Considering Embodied Carbon Transfer. Sustainability 2025, 17, 5102. https://doi.org/10.3390/su17115102
Luo Z-H, Zhu C-Z. Study on the Spatial Pattern of the Carbon Footprint of China’s E-Commerce Express Packaging Considering Embodied Carbon Transfer. Sustainability. 2025; 17(11):5102. https://doi.org/10.3390/su17115102
Chicago/Turabian StyleLuo, Zi-Han, and Chang-Zheng Zhu. 2025. "Study on the Spatial Pattern of the Carbon Footprint of China’s E-Commerce Express Packaging Considering Embodied Carbon Transfer" Sustainability 17, no. 11: 5102. https://doi.org/10.3390/su17115102
APA StyleLuo, Z.-H., & Zhu, C.-Z. (2025). Study on the Spatial Pattern of the Carbon Footprint of China’s E-Commerce Express Packaging Considering Embodied Carbon Transfer. Sustainability, 17(11), 5102. https://doi.org/10.3390/su17115102