
Adaptive Predictive Maintenance and Energy Optimization in Metro Systems Using Deep Reinforcement Learning

 , and
, and
Abstract
1. Introduction
- ○
- Resource Optimization: Metro networks are vast and inherently complex, with numerous components requiring continuous monitoring. The deployment of IoT sensors enables real-time data collection on various system parameters—ranging from train operation to energy consumption. When these data streams are analyzed through AI models, they facilitate the anticipation of failures and help in scheduling maintenance more effectively, ensuring that limited resources are optimally allocated [7].
- ○
- Cost and Risk Reduction: Predictive maintenance driven by AI can detect potential system failures before they manifest into significant issues. This proactive approach allows operators to schedule maintenance based on precise, data-informed forecasts, reducing emergency repair costs and minimizing the risk of service disruptions. In turn, this leads to a reduction in overall operational expenses and enhances system reliability [8].
- ○
- Enhanced Data Integrity and Security: Although the primary focus of this study is reinforcement learning, the reliability of the underlying data is critical. Blockchain technology offers a means of maintaining an immutable record of all maintenance data, ensuring transparency and security in data exchange among various stakeholders. This added layer of data integrity is essential for making well-informed maintenance decisions [9].
- ○
- Transition to Autonomous Systems: Integrating AI, the IoT, and blockchain technology sets the stage for developing fully autonomous maintenance systems. For example, trains equipped with IoT sensors can detect anomalies in real time, and AI algorithms can automatically analyze the data to trigger maintenance actions without human intervention. Such an autonomous approach can significantly enhance system responsiveness and efficiency [10].
- ○
- Sustainability and Energy Efficiency: Optimizing maintenance operations not only improves reliability but also extends the lifespan of critical infrastructure and reduces energy consumption. By implementing a data-driven predictive maintenance framework, metro systems can achieve more sustainable operation that minimizes waste and lowers energy costs, contributing to an eco-friendly urban transit environment [11].
2. Literature Review
2.1. Predictive Maintenance in Transportation Systems
- ○
- Data Collection: Acquiring extensive information on the present and historical conditions of the infrastructure.
- ○
- Data Visualization: Organizing data to enhance comprehension and communication.
- ○
- Development of Novel Indicators: Employing data to identify probable problems. Failure Prediction: Developing methods to forecast malfunctions through the analysis of gathered data.
- ○
- Asset Management: Enhancing maintenance operations informed by these forecasts. AI is integral at each stage by augmenting data processing skills and raising the speed and precision of forecasts.

2.2. Advanced Technologies in Predictive Maintenance for Transportation Systems
3. Materials and Methods
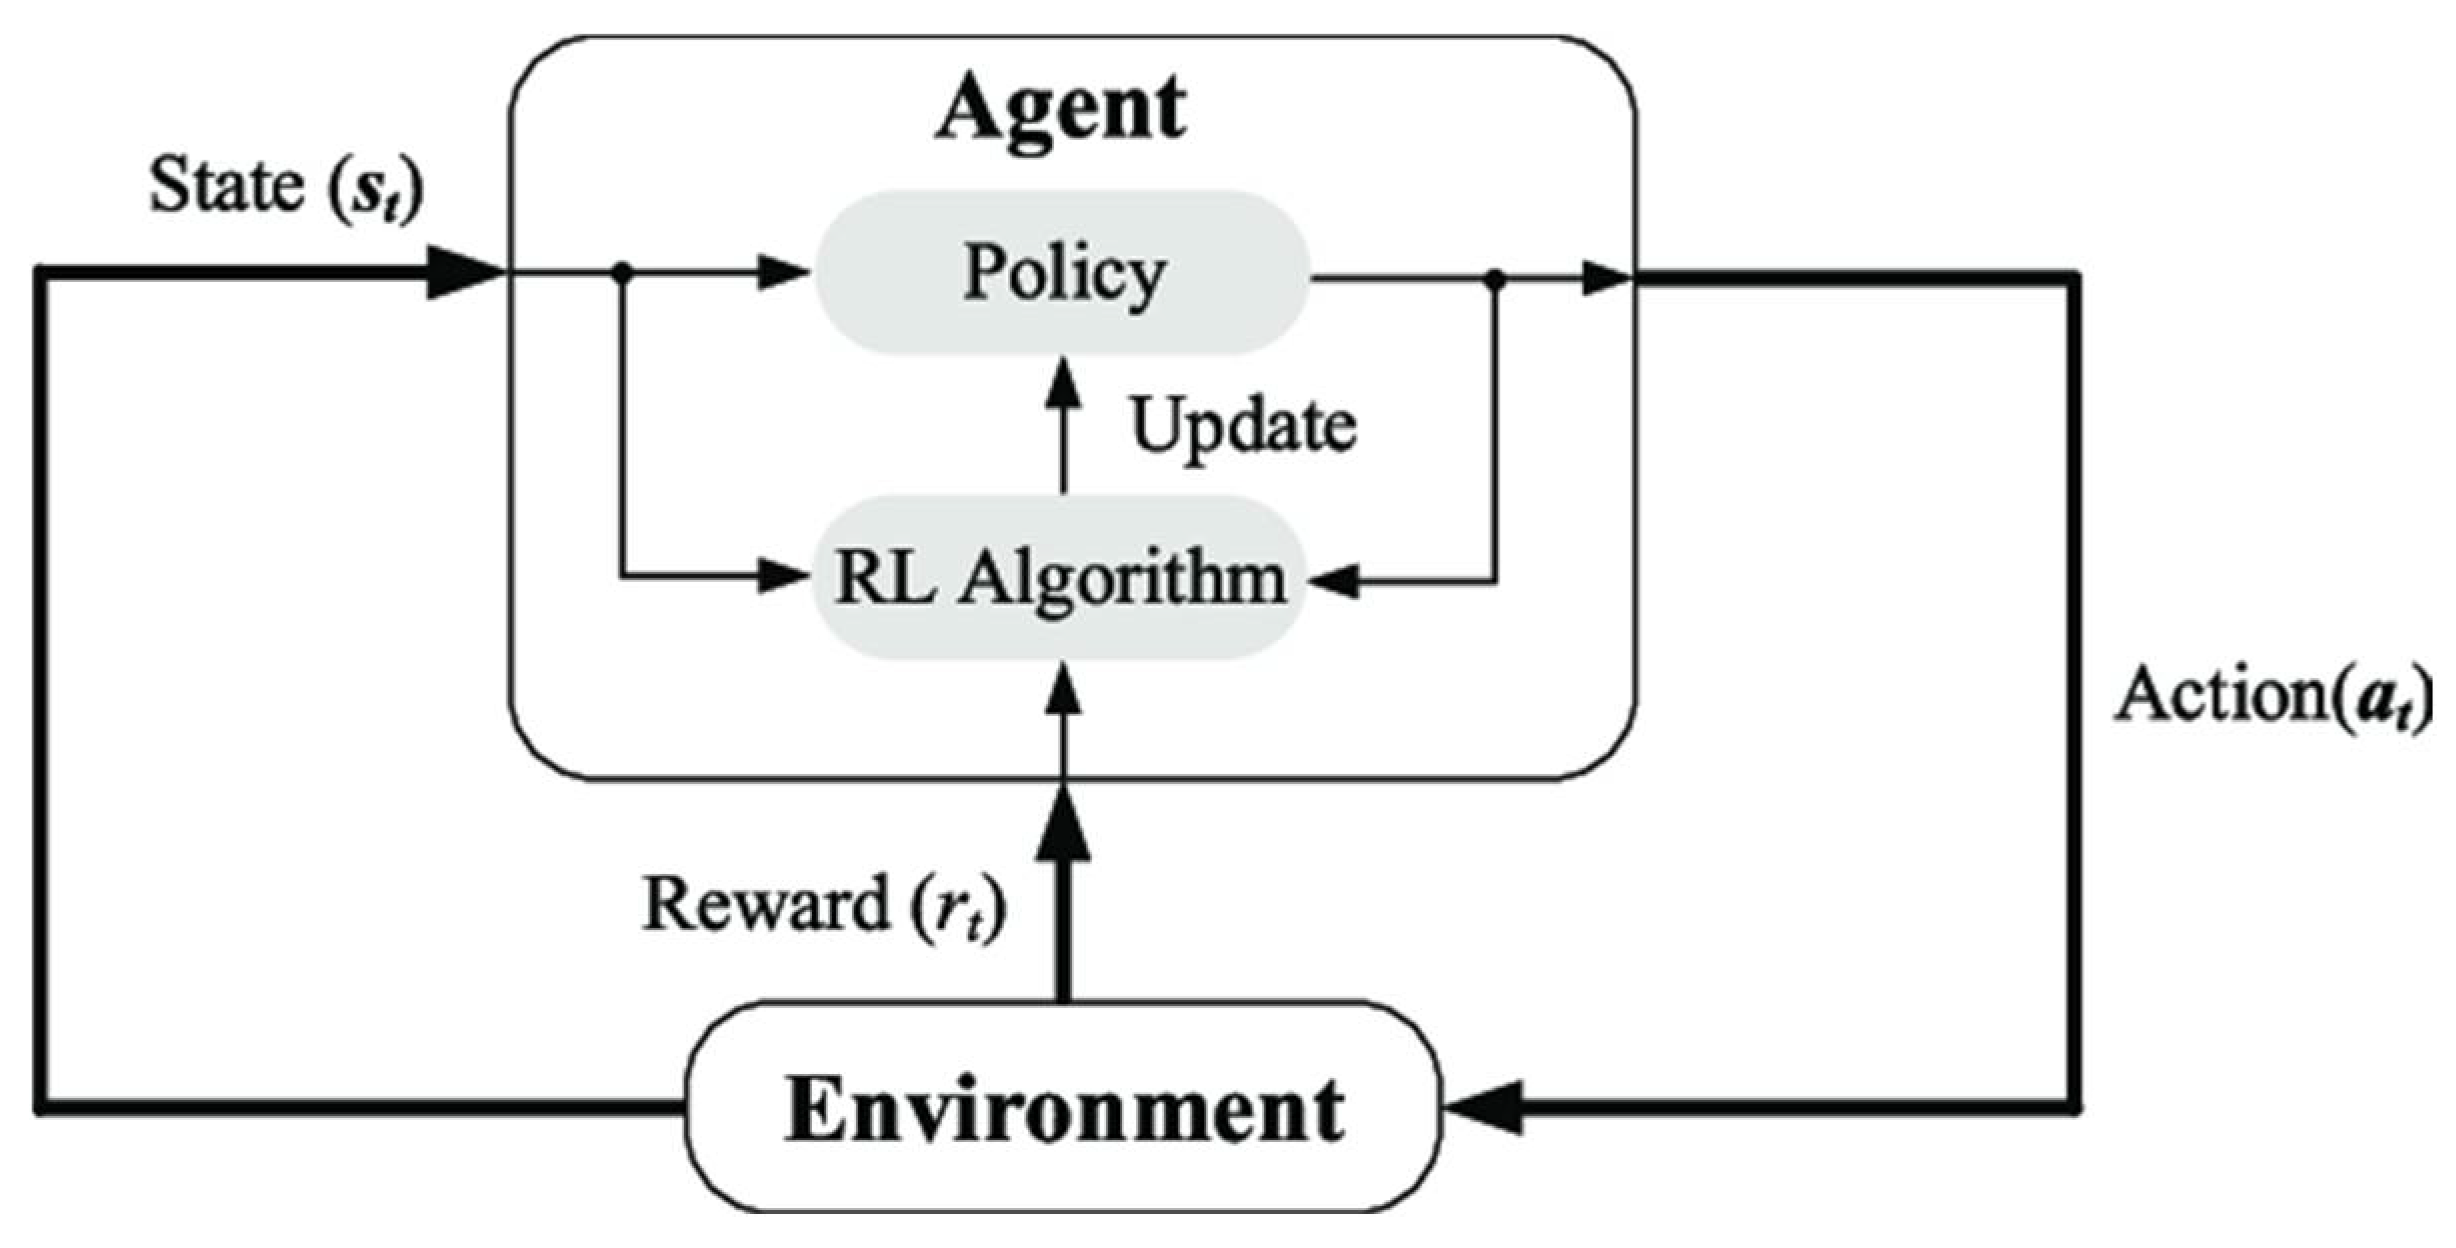
3.1. Fundamental Concepts
- ○
- Agent: The decision-maker that interacts with the environment. In our study, the agent represents the control algorithm that determines maintenance actions.
- ○
- State (S): A representation of the current situation of the environment. Our state vector includes variables such as train arrival times, stop identifiers, station coordinates, and indicators of peak hours.
- ○
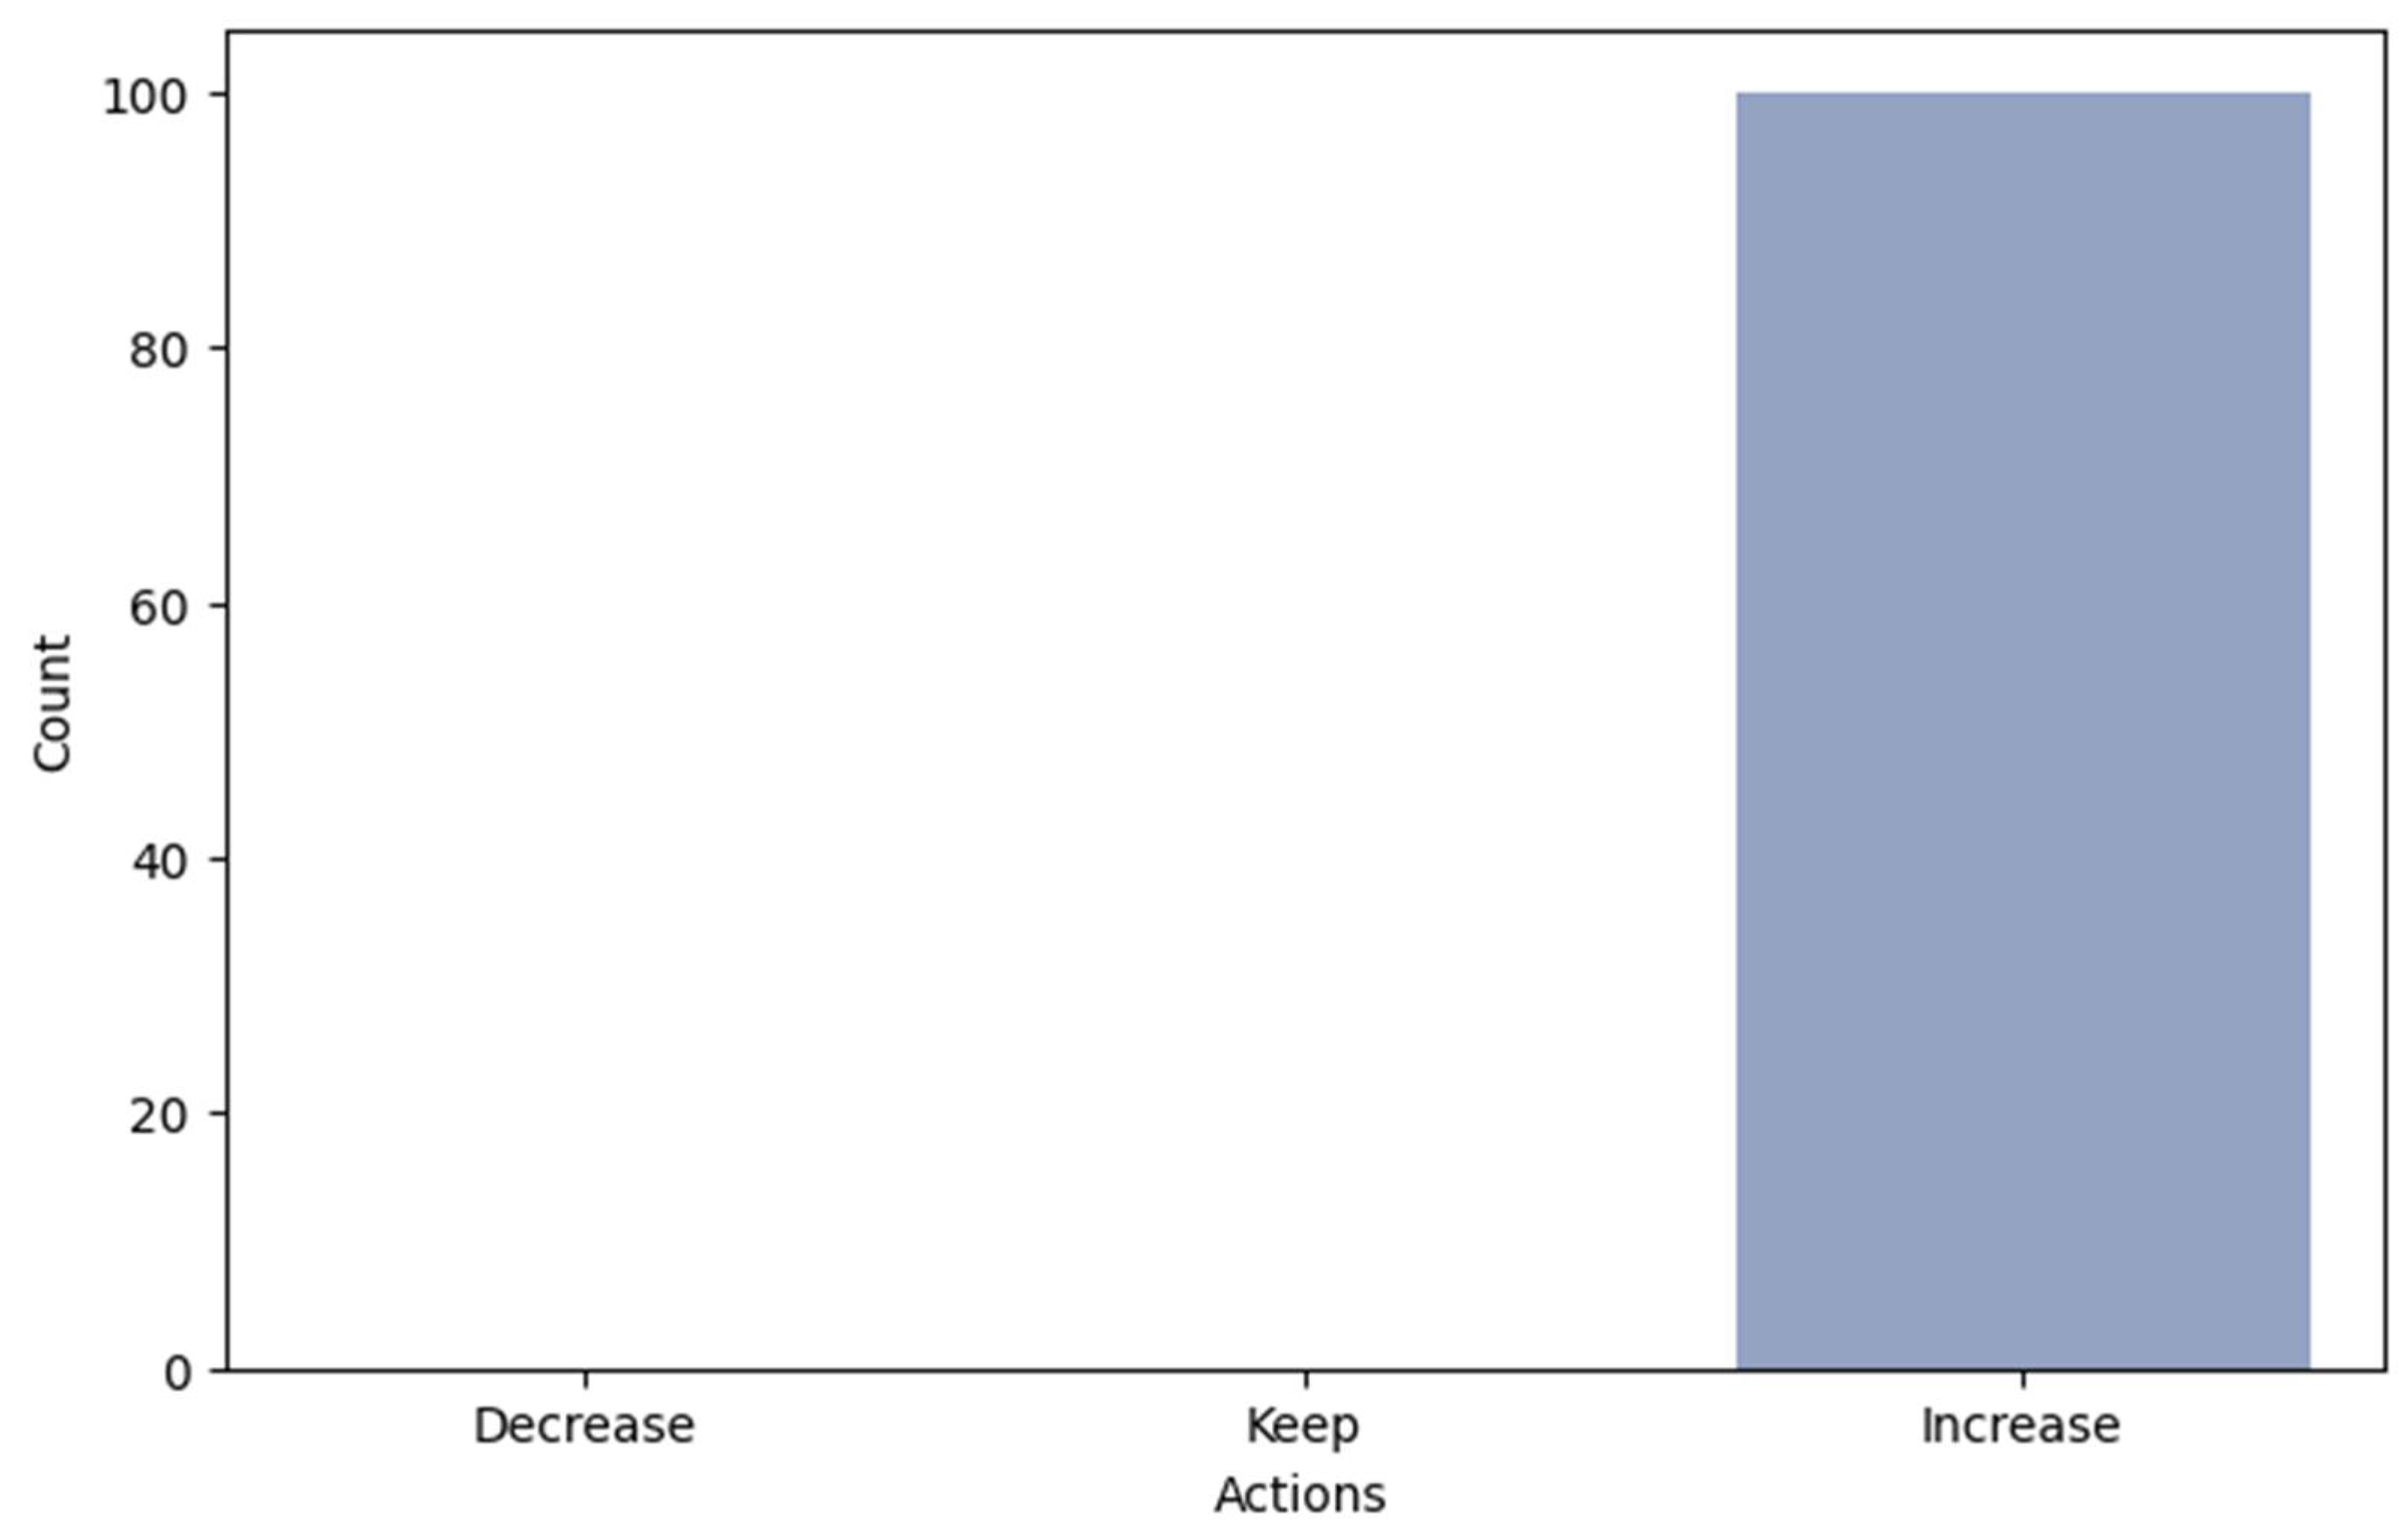
- Action (A): The set of decisions or control moves available to the agent. For instance, the agent can decide to decrease, maintain, or increase train frequency.
- ○
- Environment (E): The external system with which the agent interacts. Here, the metro system, with its dynamic operational data, constitutes the environment.
- ○
- Reward (R): A numerical signal that provides feedback on the effectiveness of the agent’s actions. The reward function in our model is designed to balance maintenance costs and energy consumption while minimizing service disruptions.
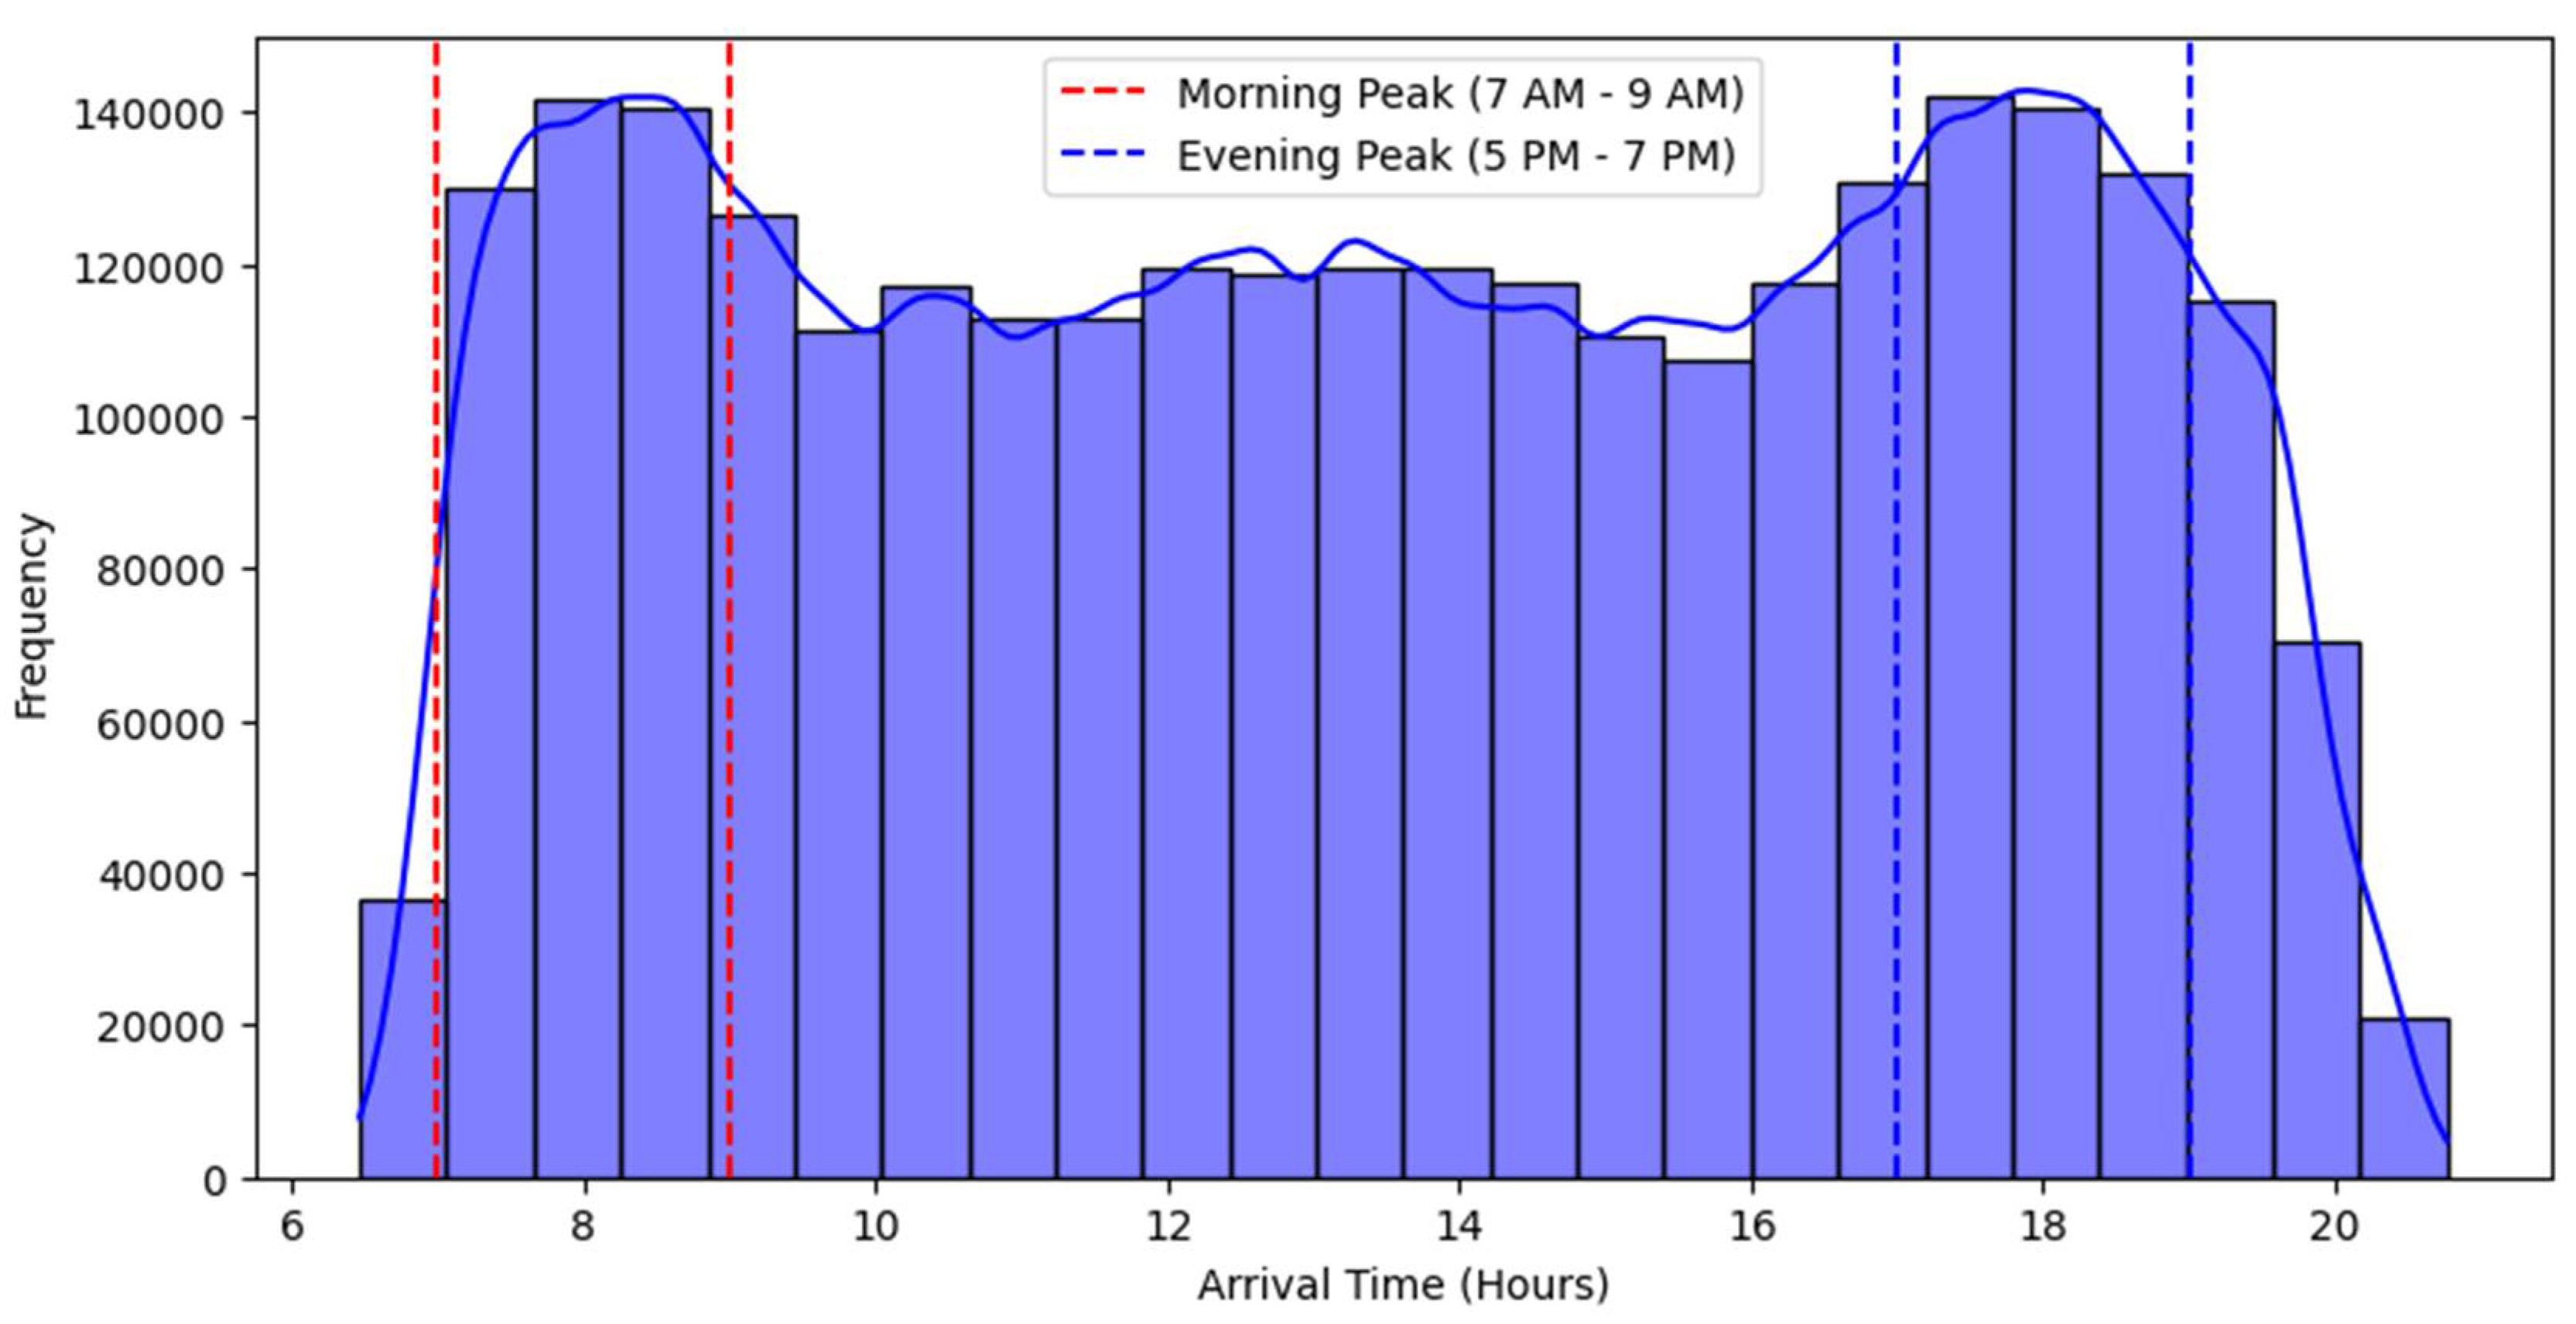
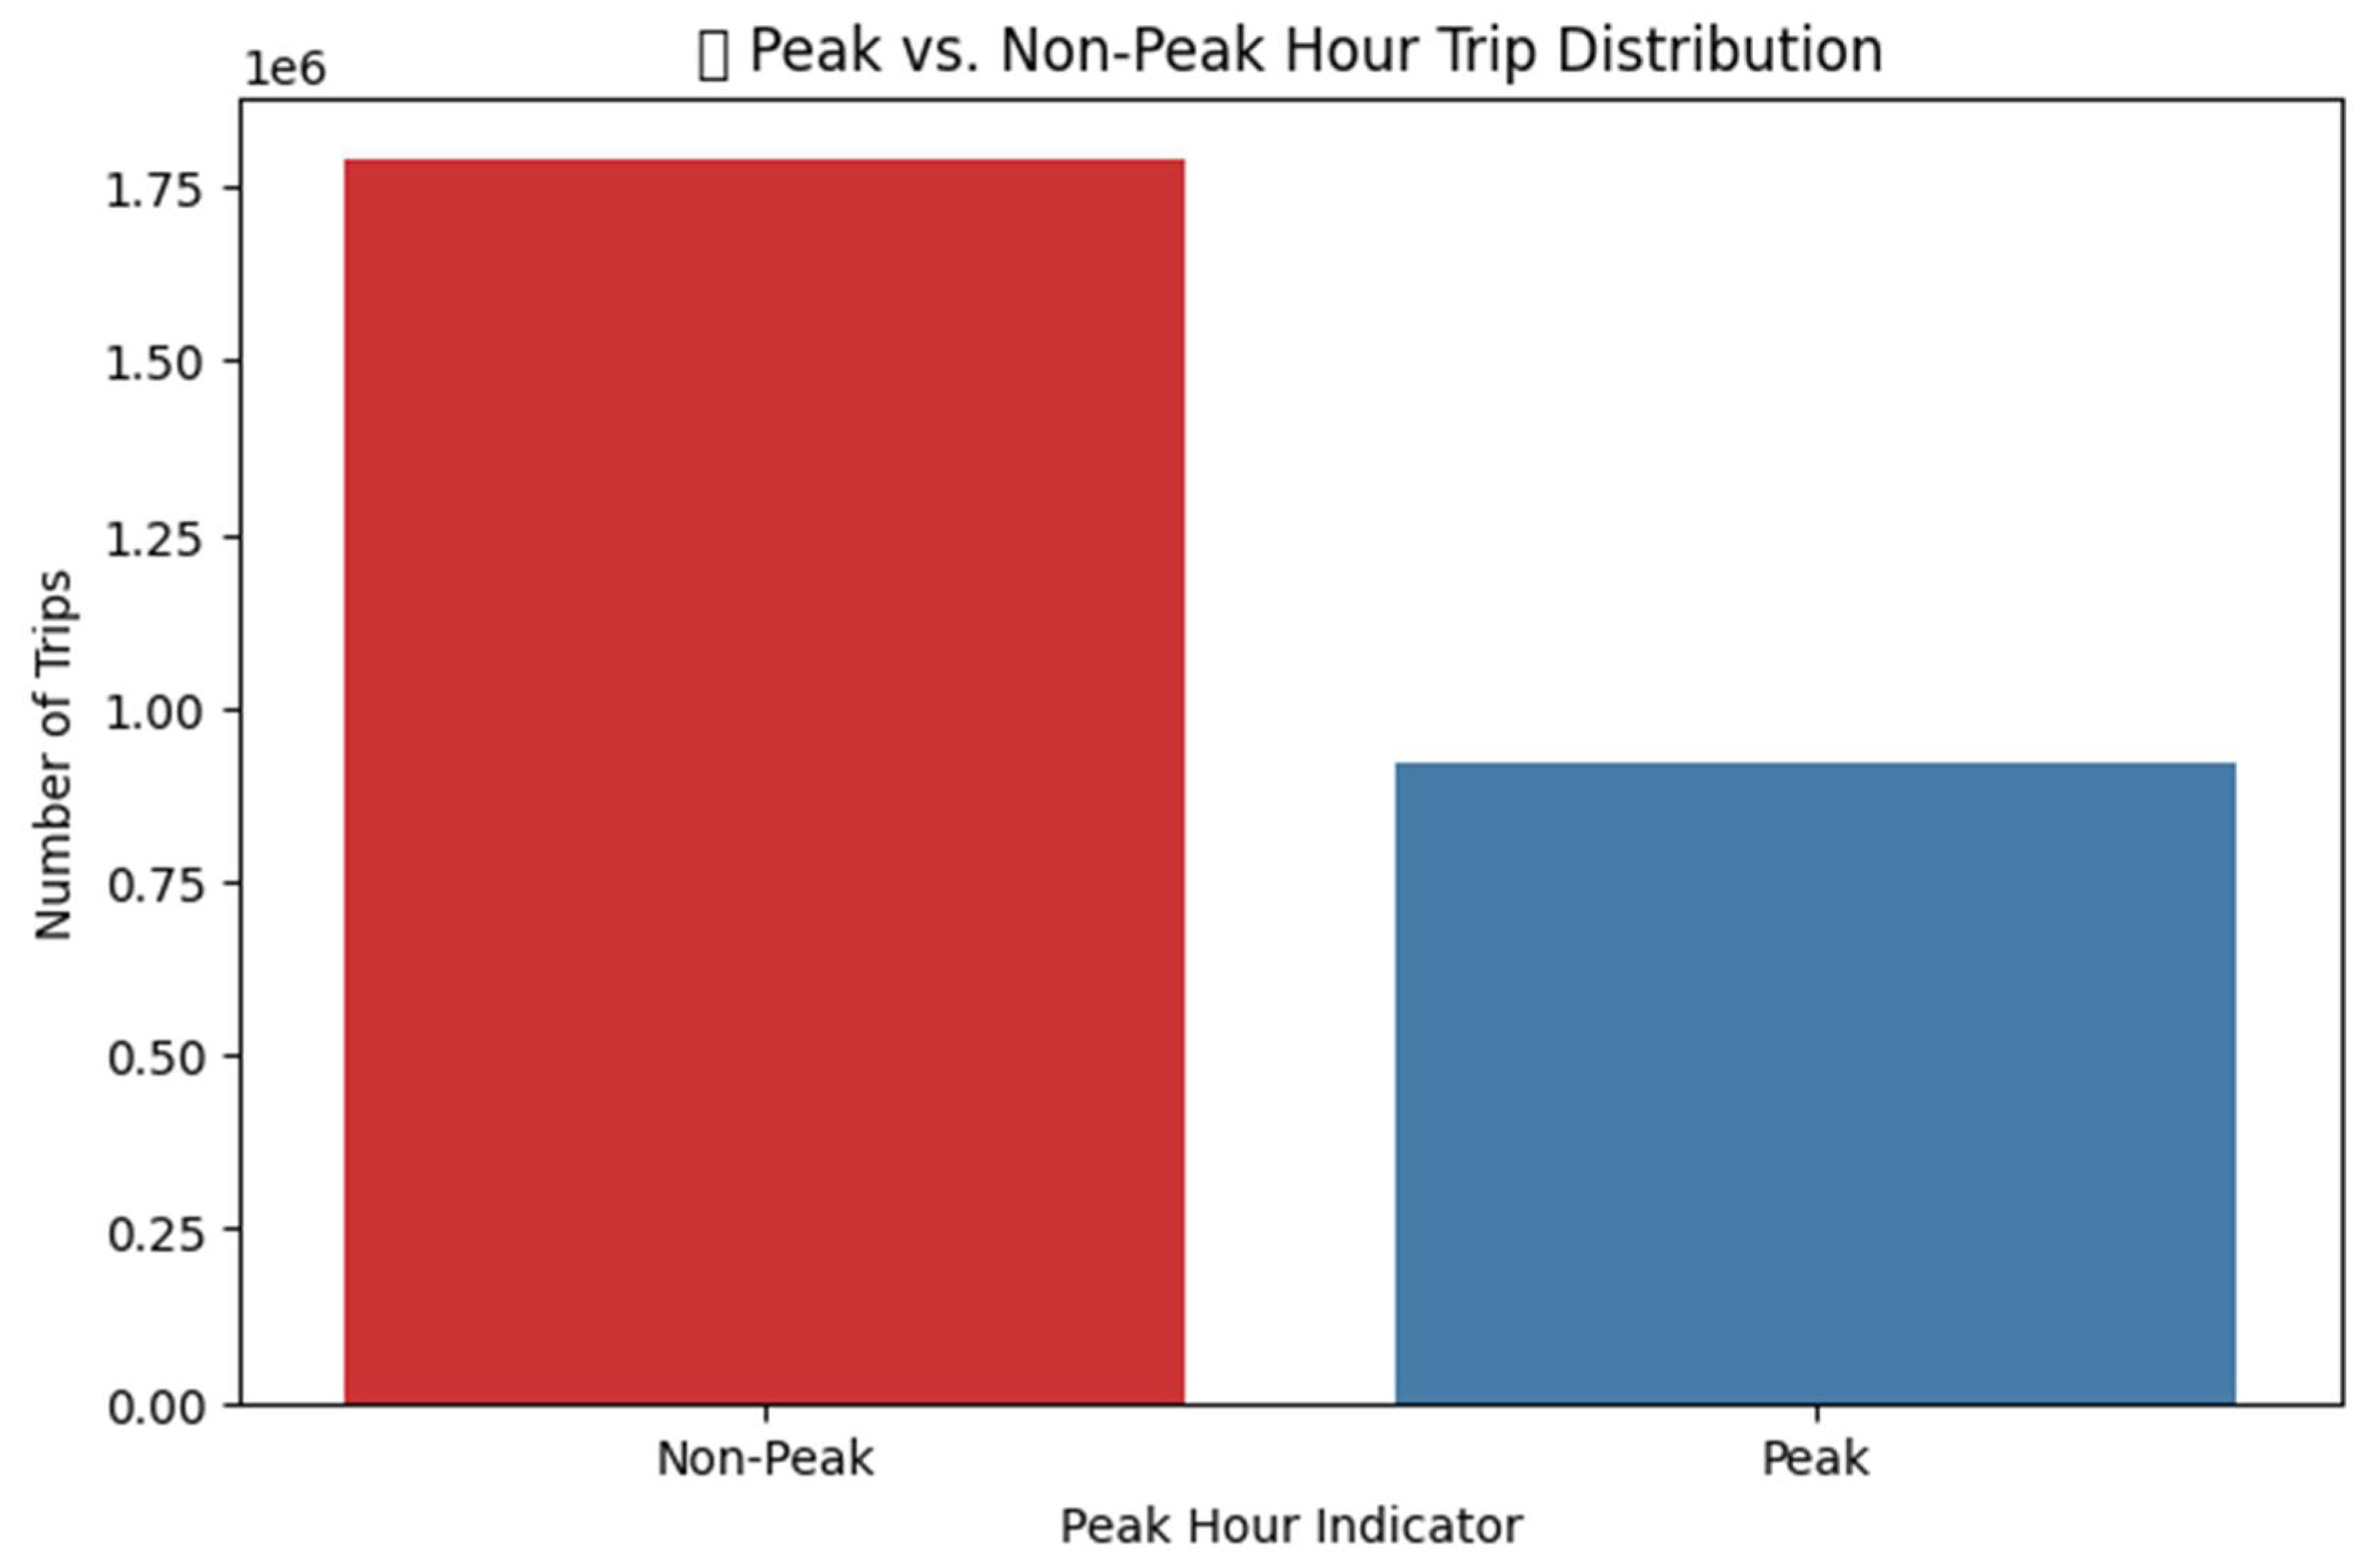
3.2. Data Used and Visualization
3.3. Detailed Environment Setup and Reinforcement Learning Implementation
- ○
- Environment Definition
- ○
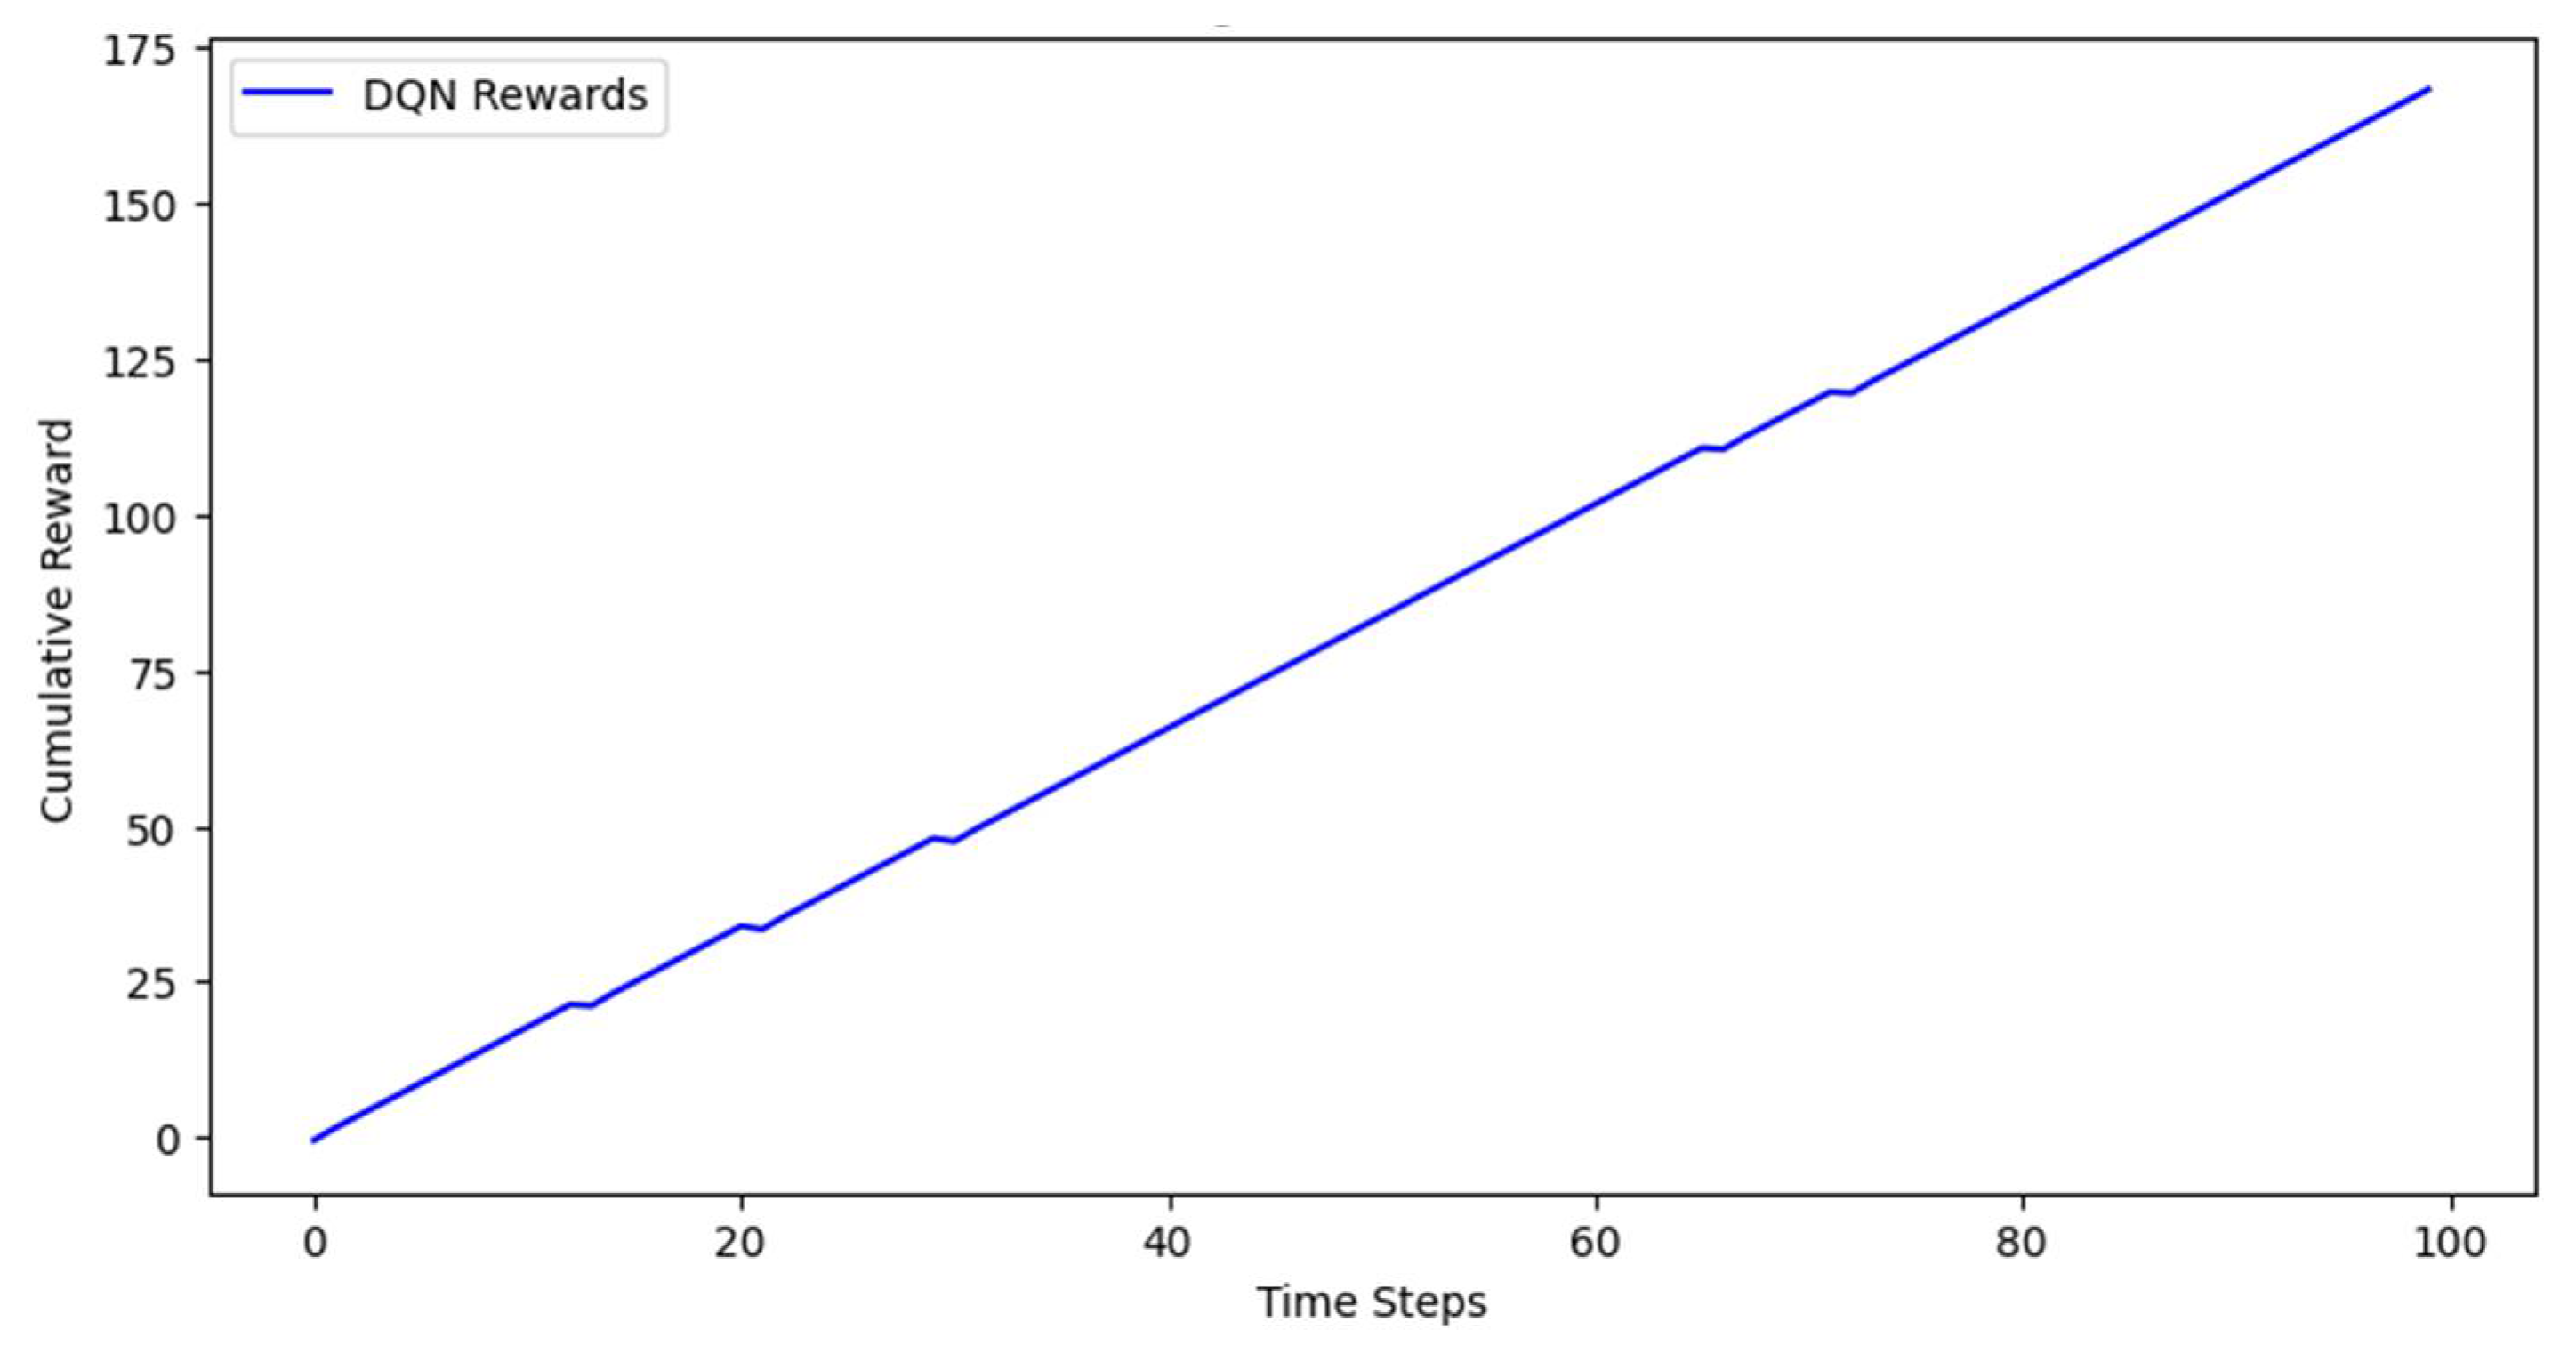
- Deep Q-Network (DQN)
- ○
- Proximal Policy Optimization (PPO):
- ○
- Optimization with Bayesian Methods (Optuna):
- ○
- Reward Function Justification and Sensitivity Analysis:
- The congestion threshold (tested between 5000 and 10,000),
- The reward magnitudes for each action class (adjusted ±50%),
- The repetition penalty term (varied from 0.0 to 0.5).
4. Results and Discussion
5. Conclusions
Author Contributions
Funding
Data Availability Statement
Acknowledgments
Conflicts of Interest
References
- Mnih, V.; Kavukcuoglu, K.; Silver, D.; Rusu, A.A.; Veness, J.; Bellemare, M.G.; Graves, A.; Riedmiller, M.; Fidjeland, A.K.; Ostrovski, G.; et al. Human-level control through deep reinforcement learning. Nature 2015, 518, 529–533. [Google Scholar] [CrossRef] [PubMed]
- Sutton, R.S.; Barto, A.G. Reinforcement Learning: An Introduction, 2nd ed.; MIT Press: Cambridge, MA, USA, 2018. [Google Scholar]
- Zhang, W.; Yang, D.; Wang, H. Predictive maintenance using machine learning: A survey. IEEE Trans. Ind. Inform. 2018. [Google Scholar]
- Akiba, T.; Sano, S.; Koyama, M. Optuna: A next-generation hyperparameter optimization framework. In Proceedings of the 25th ACM SIGKDD International Conference on Knowledge Discovery & Data Mining, Anchorage, AK, USA, 4–8 August 2019; pp. 2623–2631. [Google Scholar]
- Lee, J.; Kao, H.-A.; Yang, S. Service innovation and smart analytics for Industry 4.0 and big data environment. Procedia CIRP 2014, 16, 3–8. [Google Scholar] [CrossRef]
- Chen, C.; Li, L. Energy efficiency optimization in railway systems using data-driven methods. J. Rail Transp. 2017. [Google Scholar]
- Smith, J.; Doe, A. Real-time resource optimization in urban transit systems using IoT. J. Transp. Res. 2023, 48, 123–139. [Google Scholar]
- Johnson, L. Predictive maintenance in railway systems: A review of modern approaches. Railw. Eng. Rev. 2024, 32, 45–62. [Google Scholar]
- Williams, P.; Brown, S. Enhancing data integrity in smart transportation systems with blockchain. Int. J. Transp. Secur. 2023, 10, 77–91. [Google Scholar]
- Garcia, M. Autonomous maintenance systems in metro networks: Leveraging AI and IoT technologies. J. Intell. Transp. Syst. 2024, 29, 215–230. [Google Scholar]
- Chen, Y.; Li, X. Energy optimization strategies in urban rail systems: A data-driven approach. Energy Transp. 2023, 15, 301–317. [Google Scholar]
- Société Nationale des Chemins de fer Français. Les 5 Niveaux de Maintenance. Available online: https://www.transilien.com/fr/premieres-lignes/5-niveaux-de-maintenance (accessed on 30 January 2025).
- Groupe SNCF. Maintenance Prédictive. Available online: https://www.groupe-sncf.com/fr/innovation/digitalisation/maintenance-predictive (accessed on 28 February 2025).
- SNCF Réseau. Maintenance Prédictive: État des Lieux D’une Révolution. Available online: https://www.sncf-reseau.com/fr/a/maintenance-predictive-etat-lieux-dune-revolution-0 (accessed on 1 March 2025).
- Actility. SNCF and IoT: How LoRaWAN Improves Predictive Maintenance. Available online: https://www.actility.com/sncf-blog/ (accessed on 1 March 2025).
- Wang, T.; Reiffsteck, P.; Chevalier, C.; Chen, C.-W.; Schmidt, F. Machine learning-based predictive maintenance policy for bridges. Transp. Res. Procedia 2023, 72, 1037–1044. [Google Scholar] [CrossRef]
- Binder, M.; Mezhuyev, V.; Tschandl, M. Predictive maintenance for railway domain: A systematic literature review. IEEE Access 2023, 11, 12345–12360. [Google Scholar] [CrossRef]
- Costa, G.D.A.; Davari, N.; Veloso, B.; Pereira, P.M.; Ribeiro, R.P.; Gama, J. A survey on data-driven predictive maintenance for the railway industry. Sensors 2021, 21, 5739. [Google Scholar] [CrossRef] [PubMed]
- Wired. The New York City Subway is Using Google Pixels to Listen for Track Defects. Available online: https://www.wired.com/story/the-new-york-city-subway-is-using-google-pixels-to-sense-track-defects (accessed on 14 February 2024).
- KONUX. KONUX Switch: Predictive Maintenance System for Railways. Available online: https://www.konux.com (accessed on 19 March 2025).
- Casino, F.; Kanakaris, V.; Dasaklis, T.K.; Moschuris, S.; Rachaniotis, N.P. Blockchain-based Predictive Maintenance: Challenges and Opportunities for Industry 4.0. IEEE Trans. Eng. Manag. 2019, 66, 268–281. [Google Scholar]
- Reuters. Google Cloud partners with Air France-KLM on AI technology. Available online: https://www.reuters.com/technology/artificial-intelligence/google-cloud-partners-with-air-france-klm-ai-technology-2024-12-04/ (accessed on 1 March 2025).
- Li, Y.; Chen, J.; Zhang, Z. Deep reinforcement learning for dynamic resource allocation in complex systems. IEEE Trans. Neural Netw. Learn. Syst. 2023, 34, 1024–1037. [Google Scholar]


| File Name | Description | Key Columns |
|---|---|---|
| stop_times.txt | Details each stop along a trip, including arrival and departure times. | trip_id, arrival_time, stop_id |
| trips.txt | Provides information on trip schedules and associated routes. | trip_id, route_id |
| stops.txt | Contains geographical data for each stop, such as coordinates and names. | stop_id, stop_lat, stop_lon |
| calendar.txt & calendar_dates.txt | Defines service dates and exceptions for trips. | service_id, date, exception_type |
| routes.txt | Captures route details, including types and names. | route_id, route_name |
| Component | Definition/Details |
|---|---|
| State | Arrival time, Station ID, Latitude, Longitude, Route ID, Route type, Weekday, Peak-hour indicator, station congestion. |
| Action Space | 0: Decrease frequency, 1: maintain current frequency, 2: increase frequency |
| Reward | Action 0: −0.5 if high congestion; +0.5 if low congestion Action 1: +1.5 if optimal congestion; −0.2 otherwise Action 2: +2 if high congestion; −0.5 otherwise; penalty for repetitive actions |
Disclaimer/Publisher’s Note: The statements, opinions and data contained in all publications are solely those of the individual author(s) and contributor(s) and not of MDPI and/or the editor(s). MDPI and/or the editor(s) disclaim responsibility for any injury to people or property resulting from any ideas, methods, instructions or products referred to in the content. |
© 2025 by the authors. Licensee MDPI, Basel, Switzerland. This article is an open access article distributed under the terms and conditions of the Creative Commons Attribution (CC BY) license (https://creativecommons.org/licenses/by/4.0/).
Share and Cite
Rziki, M.H.; Hadbi, A.E.; Boutahir, M.K.; Abounaima, M.C. Adaptive Predictive Maintenance and Energy Optimization in Metro Systems Using Deep Reinforcement Learning. Sustainability 2025, 17, 5096. https://doi.org/10.3390/su17115096
Rziki MH, Hadbi AE, Boutahir MK, Abounaima MC. Adaptive Predictive Maintenance and Energy Optimization in Metro Systems Using Deep Reinforcement Learning. Sustainability. 2025; 17(11):5096. https://doi.org/10.3390/su17115096
Chicago/Turabian StyleRziki, Mohammed Hatim, Atmane E. Hadbi, Mohamed Khalifa Boutahir, and Mohammed Chaouki Abounaima. 2025. "Adaptive Predictive Maintenance and Energy Optimization in Metro Systems Using Deep Reinforcement Learning" Sustainability 17, no. 11: 5096. https://doi.org/10.3390/su17115096
APA StyleRziki, M. H., Hadbi, A. E., Boutahir, M. K., & Abounaima, M. C. (2025). Adaptive Predictive Maintenance and Energy Optimization in Metro Systems Using Deep Reinforcement Learning. Sustainability, 17(11), 5096. https://doi.org/10.3390/su17115096