Abstract
Glaciers, often regarded as “frozen reservoirs”, play a crucial role in replenishing numerous rivers in arid regions, contributing to ecological balance and managing river flow. Recently, the rapid shrinkage of the glaciers in the East Tianshan Mountains has affected the water quantity in the Karez system. However, studies on glacier changes in this region are limited, and recent data are scarce. This study utilizes annual Landsat composite images from 1990 to 2022 obtained via the Google Earth Engine (GEE). It utilizes a ratio threshold approach in conjunction with visual analysis to gather the glacier dataset specific to the Turpan–Hami region. The Open Global Glacier Model (OGGM) is used to model the flowlines and mass balance of around 300 glaciers. The study analyzes the glacier change trends, distribution characteristics, and responses to climate factors in the Turpan–Hami region over the past 30 years. Additionally, future glacier changes through the end of the century are projected using CMIP6 climate data. The findings indicate that the following: (1) From 1990 to 2022, glaciers in the research area underwent considerable retreat. The total glacier area decreased from 204.04 ± 0.887 km2 to 133.52 ± 0.742 km2, a reduction of 70.52 km2, representing a retreat rate of 34.56%. The number of glaciers also decreased from 304 in 1990 to 236 in 2022. The glacier length decreased by an average of 7.54 m·a−1, with the average mass balance at −0.34 m w.e.·a−1, indicating a long-term loss of glacier mass. (2) Future projections to 2100 indicate that under three climate scenarios, the area covered by glaciers could diminish by 89%, or 99%, or even vanish entirely. In the SSP585 scenario, glaciers are projected to nearly disappear by 2057. (3) Rising temperatures and solar radiation are the primary factors driving glacier retreat in the Turpan–Hami area. Especially under high emission scenarios, climate warming will accelerate the glacier retreat process.
1. Introduction
Glaciers, among the Earth’s largest freshwater reserves, contain 75% of the planet’s freshwater, and their feedback role in global climate change cannot be overlooked [1]. Against the backdrop of global warming, the study of the cryosphere has garnered significant attention and emerged as a crucial area in global sustainable development and climate studies [2,3]. One of the 21st century’s most urgent concerns is predicting and reducing the effects of the fast-paced global climate change [4]. Glaciers are widely retreating as a result of rising global temperatures, a trend that is expected to continue until the end of this century [5,6,7]. Within 30 years, over one billion people may face heightened risks of water scarcity and food insecurity [8]. By century’s end, an estimated 200 million individuals could be threatened by sea-level rise, driven primarily by glacier melt [9].
According to statistics, China has a total of 48,571 glaciers, with a glacier volume of nearly 4494 km3 [10,11]. Glaciers are significant in arid and semi-arid inland areas by providing essential freshwater resources for human activities. The glaciers in the Turpan and Hami regions are part of the Tianshan Mountain range, which is one of the most climate-sensitive areas in Central Asia [12]. In recent years, many scholars have focused on monitoring glacier changes in the Tianshan Mountains [13,14,15,16] and studying ice core records [17,18,19]. The results show that Tianshan Mountains’ glaciers have a retreating trend, mainly due to global climate warming. For instance, the Borokonu Glacier on the northwestern edge of the Tianshan Mountains retreated by 71.6 ± 9.2 km2 between 1977 and 2018 [20]. Since 1980, glaciers in the Tianshan Mountains have shown a pronounced negative trend, and areas with a negative mass balance encompass 80.13% [21]. In the eastern Tianshan, accelerated glacier retreat in recent years has significantly affected the water supply to the Turpan Karez system. However, prior studies on glacier changes in this area have been limited, often relying on outdated datasets. The Bogurda Mountains are among the earliest glacier systems studied by domestic and international researchers [22], and they are essential to the preservation of water resources for the Baiyanghe Basin, the Turpan region, and the Chaiwopu Basin. Between 1962 and 2006, glaciers in the Bogurda Mountains experienced a total area loss of 31.18 ± 0.31 km2, representing 21.6% of their original extent [23]. While glacier retreat in the Tianshan Mountains has long been a focal point of concern, previous research has mainly been based on typical time periods, making it difficult to reveal detailed information about glacier changes. Furthermore, glaciers often exist in complex terrains, and their surfaces may be affected by snow cover and ice lakes, which can interfere with automatic extraction methods. As a result, current glacier automatic extraction methods cannot fully replace visual interpretation, and most studies ultimately require visual correction, which undoubtedly increases the complexity and workload of the research.
Glacier length and mass balance are pivotal indicators for understanding glacier dynamics and their effects on reservoirs. Glacier length, as a direct measure of retreat or advance, provides critical insights into glacier state and serves as a fundamental parameter for inventory compilation and modeling efforts [24]. Glacier mass balance offers a more nuanced reflection of the glacier reaction to climate in three-dimensional space, directly linking glacier changes to water resource impacts [25]. As a key indicator representing the total water storage of glaciers, ice volume allows for a more comprehensive evaluation of the water resource status across an entire region.
Traditional approaches to determining glacier length often rely on extracting glacier centerlines or flowlines. However, these methods face limitations, particularly in small glaciers or in contexts requiring high precision, where accurately capturing upper and lower boundary lengths can prove challenging [26]. Similarly, traditional geodetic methods used to estimate glacier mass balance—based on repeated ground-based elevation surveys—are often constrained by limited spatial coverage, challenging terrain, and high logistical costs. These factors can introduce significant uncertainties, especially in remote and complex glacierized areas [27,28]. The Open Global Glacier Model (OGGM), utilizing a shallow-ice approximation to calculate depth-integrated glacier flux, addresses these limitations. It enables more comprehensive and precise modeling of glacier length changes while reconstructing glacier mass balance across large-scale regions, making it exceptionally well-suited for regional applications [29,30].
This study used the Google Earth Engine for data preprocessing, selecting annual Landsat data from 1990 to 2022. Glacier boundaries in the Turpan–Hami region were extracted continuously through machine recognition and visual interpretation techniques. Meanwhile, the OGGM was employed to simulate glacier length from 1990 to 2022, thereby creating a long-term glacier inventory dataset for the region. This study analyzes glacier changes in the Turpan–Hami region, uncovering historical trends and climate response patterns. Furthermore, using CMIP6 climate model (GCM) data, this study predicts the future glacier changes through the end of this century. Through this research, we provide a more accurate quantitative analysis of glacier changes in mountain glaciers in extreme arid regions, offer decision-making support for sustainable water resource management in the area, and contribute valuable scientific insight into the trends of glaciers and water resources under global climate change.
2. Study Area
The Turpan–Hami region (TH region; 86°44′55″–96°25′0″ E, 40°49′13″–45°3′21″ N) lies in eastern Xinjiang, covering approximately 211,813 km2 [31,32]. This region features predominantly west–east trending mountain ranges, extending from the Karawuchen and Bogurda mountains to the Barkol and Karlik mountains. The terrain exhibits a west-to-east gradient, with elevations averaging over 3000 m and peaking at 4881 m at Karlik Mountain. Situated deep inland, the TH region experiences a typical continental desert climate, characterized by minimal annual precipitation (0–46.5 mm) and exceptionally high potential evaporation rates (up to 3000 mm annually). This extreme aridity makes it one of the driest areas in eastern Xinjiang [31]. The glaciers are scattered across four main areas—designated as Areas I, II, III, and IV for clarity—which represent the primary zones of glacial distribution in the TH region (Figure 1).
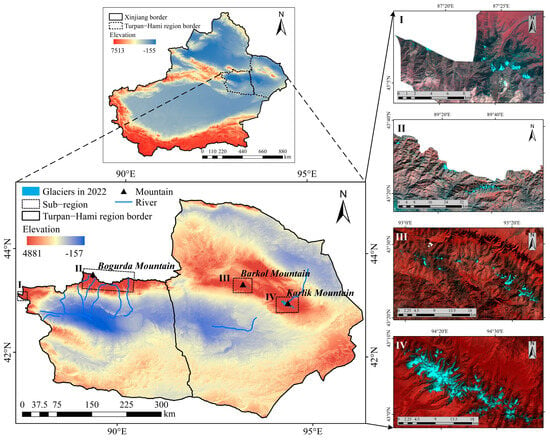
Figure 1.
Location and glacier distribution in the Turpan–Hami (TH) region. Glacier zones are categorized into four areas: I, glaciers in the easternmost Karawuchen Mountains; II, glaciers in the easternmost Bogurda Mountains; III, glaciers in the Barkol Mountains; and IV, glaciers in the Karlik Mountains. Sub-region images are derived from Landsat 5 imagery from 1994, using an RGB (6-2-1) band combination. Administrative district boundaries are based on China Map—Map Approval No. GS (2019) 1822.
3. Materials and Methods
3.1. Data Sources
3.1.1. Satellite Image Data
This study employed Landsat satellite data, which classified as a Level 1T product (Appendix A Table A1). To effectively observe perennial glaciers, imagery from June to September was prioritized, spanning the period from 1990 to 2022. Selection criteria focused on images with less than 10% cloud cover to ensure optimal clarity and accuracy. In years where high-quality imagery was difficult to obtain, the cloud cover threshold was appropriately relaxed, and multi-temporal remote sensing images from the same year were used as references. Preprocessing of the Landsat remote sensing imagery, including mosaicking, clipping, cloud removal, and stripe filling, was conducted on the GEE to generate annual synthetic imagery for 1990–2022.
The DEM data were derived from SRTM V4, accessed via Earth Explorer. This dataset was primarily employed for ridge line extraction and glacier length calculations.
3.1.2. Drone Data and Measured Data
This study employed the DJI Phantom 4 Multispectral (P4M) drone (DJI, Shenzhen, China) to perform three image acquisition missions over the ablation zones in the Karlik Glacier in July 2023 (see Table 1). In order to ensure centimeter-level positional precision, the drone incorporates a TimeSync technology that synchronizes the flight controller, camera, and RTK clock systems at the microsecond level.

Table 1.
Drone image information.
The field data were obtained based on glacier stakes, RTK, and other tools, measuring the boundaries of the Tuergan Glacier and Miaoergou Glacier in 2022 and 2023. The acquired field coordinates and drone data were primarily used for the accuracy validation of glacier boundaries.
3.1.3. Climate Data
The climate data utilized were drawn from multiple datasets, which were applied for baseline climate forcing, future climate projections, historical data supplementation, and climate change correlation analysis, as detailed below:
The GSWP3_W5E5 was used as the baseline climate dataset, which covered the years 1979–2019 [33]. This dataset was mainly utilized to simulate the historical glacier mass balance.
Predictions of future glacier changes were driven by bias-corrected climate projections from the ISIMIP3b dataset, which provides CMIP6 outputs adjusted to match the statistical characteristics of the W5E5 dataset. No additional bias correction was applied. Five representative GCMs (GFDL-ESM4, MPI-ESM1-2-HR, MRI-ESM2-0, IPSL-CM6A-LR, and UKESM1-0-LL) were selected under three emission scenarios: SSP126, SSP370, and SSP585 (Table 2). Under SSP370 and SSP585, both temperature and precipitation show increasing trends in the Turpan–Hami region over the 21st century, reflecting stronger climate forcing. The SSP126 scenario exhibits relatively stable conditions with only minor changes. These projections served as direct climate forcings for the OGGM, and all glacier forecasts in this study are conditional on the projected climate trends.

Table 2.
Summary of the 5 CMIP6 GCMs selected for this study.
Since the W5E5 dataset ends in 2019, to ensure the continuity of the time series, this study utilized a 1 km resolution monthly temperature and precipitation dataset published by Peng [34,35], processed for consistency, to fill gaps in the mass balance calculations for 2020–2022.
To investigate the connection between glacier fluctuations and climate conditions, this study employed Peng’s temperature and precipitation datasets, along with a high-resolution solar radiation dataset (10 km spatial resolution) developed by Wang [36], which was derived from daily sunshine duration and validated against in situ observations across China. Since Wang’s dataset only spans from July 1983 to June 2017, to extend the time series to 2022 and maintain consistency in the correlation analysis, this study used the surface solar radiation downwards variable from the ERA5-Land reanalysis dataset [37], extracted via Google Earth Engine. A linear regression-based bias correction was applied to the ERA5-Land data using the overlapping period (1990–2017) with Wang’s dataset. This approach preserves the spatial and temporal continuity of the radiation data while retaining the higher regional accuracy of Wang’s dataset within China.
3.1.4. Other Data
In addition, the RGI v6.0 dataset [38] and the Global Glacier Mass Loss dataset [8] were used for calculating and validating historical glacier mass balance. The mass loss dataset spans the period from 2000 to 2019. The Second Glacier Inventory of China (V1.0) [21] and Google Earth data were used as comparative datasets for glacier boundary extraction. The Second Glacier Inventory was also employed to encode the glacier dataset generated for the Turpan–Hami region.
3.2. Methods
3.2.1. Glacier Boundary Extraction Methods
This paper is based on the GEE cloud computing platform for image preprocessing, band computing, adjustment of threshold parameters, and subsequent manual correction. The specific steps are as follows:
- (1)
- Calculation of band ratios. The primary method used for extracting the glacier area involved calculating the ratio. This method effectively delineates the glacier-covered regions, including areas obscured by shadow and thin surface moraines, with a high degree of accuracy [39]. However, the method is not effective in distinguishing water bodies, so the Normalized Water Body Index (NDWI) needs to be removed subsequently. The formula is as follows:where and denote the reflectance of images in the red and short-wave infrared bands, respectively.
The Normalized Water Body Index [40] is computed using the following formula:
where and denote the reflectance of images in the green and near-infrared bands, respectively.
- (2)
- Adjusting the threshold parameters and generating binary images. The ratio data obtained in the previous step are classified using a decision tree, with appropriate thresholds selected. The threshold values vary for different regions and time periods. After repeated experiments and comparisons, this study sets the ratio threshold for TM data between 1.8 and 2.2, the ratio threshold for OLI data at 1, and the water index threshold at 0.23 to obtain the initial glacier boundaries.
- (3)
- Visual interpretation. The initial glacier boundaries, derived from remote sensing images, are subject to influences such as image quality, mountain shadows, and snow cover. To enhance boundary accuracy, these boundaries are compared with the Second Glacier Inventory dataset and visually corrected using high-resolution Google Earth imagery.
3.2.2. OGGM Model
- (1)
- Glacier Length Extraction: This study uses the flowline and catchment extraction module in the OGGM [30] to extract the maximum length of glaciers (hereinafter referred to as glacier length). Figure 2 shows the module flow chart. This module is based on the algorithm proposed by Kienholz et al. [41], which derives a set of central flowlines and branch flowlines for glaciers using the “cost grid–least-cost route approach” method [41]. Compared to other glacier length extraction methods, this module can calculate multiple central flowlines for a glacier area and define a main flowline to ensure the extraction of the maximum glacier length [30,41]. Compared to other glacier length extraction methods, this module can calculate multiple central flowlines for a glacier area and define a main flowline to ensure the extraction of the maximum glacier length.
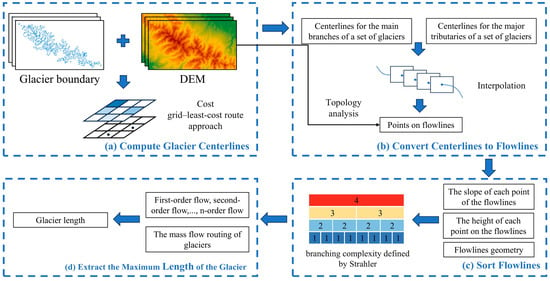 Figure 2. Flowchart of the flowline and catchment model.
 - (2)
- Calculation of Glacier Mass Balance: The mass balance for the Turpan–Hami region is calculated using the OGGM. The mass balance at a specific elevation (z) is computed using the following formula:where is the monthly mass balance (mm w.e.); z is the elevation (m); is the glacier’s temperature sensitivity to climate; is the precipitation correction factor; is the monthly solid precipitation (mm); is the monthly average temperature (°C); is the temperature threshold for glacier melting (°C); and is the residual term. Based on field surveys and comparisons with other high-mountain glacier studies, this study sets to −1 °C.
- (3)
- Glacier Geometrical Evolution: The evolution of glacier geometry is modeled using the flowline model in the OGGM framework. This model considers the changes in glacier geometry under multiple climate scenarios, primarily modeling variations in glacier width, mass balance, ice flux, and velocity [42]. The calculation of glacier velocity is based on Glen’s flow law [43]. During the simulation, the model incorporates factors such as glacier deformation and basal sliding and applies fluid dynamics principles to model these processes. The relevant formulas and their theoretical background are thoroughly detailed in the work of Maussion et al. [30].
3.2.3. Percentages of Area Changes
The Percentages of Area Changes (PAC) represents the rate of change in glacier area over a specific period, indicating the amount of area change per unit time. The average glacier area change rate is useful for comparing glacier changes across different time scales [44].
where is the glacier area change rate (%), is the average glacier area change rate (%·a−1), is the change in glacier area (km2), represents the initial glacier area (km2), and represents the number of years in the study period.
3.3. Accuracy Assessment
Field surveys and the use of higher-resolution imagery as reference data are two common methods for validating remote sensing data interpretation results [45]. In this study, the field surveys and continuous observation years for the Karlik Glacier are limited, thus the UAV imagery and field measurement coordinates are used as supplementary references.
3.3.1. Glacier Boundary Accuracy Evaluation
- (1)
- Impact of image spatial resolution
Glacier boundary extraction is influenced by image spatial resolution, cloud cover, terrain shadow, and the interpreter’s subjectivity. To minimize noise and uncertainty, this study defines the glacier boundary by connecting the diagonal lines of mixed pixels and assumes that the area error caused by manual delineation follows a Gaussian distribution [46].
Based on the approach proposed by Paul [47], the area uncertainty for an individual glacier is estimated as proportional to its perimeter and the image resolution, considering that boundary errors typically occur within approximately half a pixel width. The uncertainty for each glacier is calculated using the following equation [48,49]:
where is the area uncertainty of the i-th glacier, P is the glacier perimeter, λ is the spatial resolution of the imagery, and σ is a correction factor that standardizes the error under the assumption of a Gaussian distribution. The value σ ≈ 0.6872 corresponds to the standard deviation of a Gaussian distribution with most of the error confined within ±0.5 pixels, as suggested in prior studies [47].
Assuming that the area uncertainties of individual glaciers are independent, the total uncertainty across all glaciers is computed by the root sum of squares:
where is the total area uncertainty for n glaciers in the study region.
The calculation results indicate that the uncertainty in glacier area between 1990 and 2022 ranged from 0.4% to 0.6% (see Table 3). Specifically, the uncertainty in the interpretation of the glacier boundary for 1990 and 2022 was ±0.887 km2 and ±0.742 km2, respectively, which corresponds to 0.43% and 0.56% of the glacier area during those years. The total area uncertainty for glaciers in the study region is ±6.12 km2, approximately 3% of the glacier area in 1990.

Table 3.
Glacier area error.
- (2)
- Comparison with measured data
Figure 3 shows a comparison between Google Earth imagery, UAV imagery, and the ground-truth coordinates of the stakes at the Karlik Glacier. Due to the discontinuity of Google Earth imagery, the selected clear Google Earth base map was taken in September 2003. Figure 3a shows the glacier boundaries in 2003 and 2022, along with the UAV surveyed area, while Figure 3b illustrates the UAV flight course. As shown in Figure 3b, the 2003 Google Earth imagery aligns well with the 2003 glacier boundary results from the dataset in this study. Figure 3c displays UAV footage captured in July 2023 at a resolution of 0.1 m, and the glacier terminus in the UAV imagery is in close agreement with the 2022 glacier boundary from the dataset.
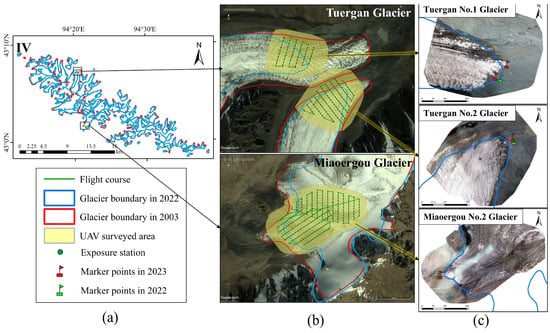
Figure 3.
Comparison between Google Earth and UAV data of the marginal retreat of Tuergan Glacier and Miaoergou Glacier in Subregion IV. (a) Glacier boundaries in 2003 and 2022; (b) Google Earth images from September 2003; (c) drone images of the terminals of Tuergan No. 1 Glacier, Tuergan No. 2 Glacier, and Miaoergou No. 2 Glacier.
Table 4 presents a comparison between the actual glacier area at the terminus of Tuergan No. 1 Glacier, Tuergan No. 2 Glacier, and Miaoergou No. 2 Glacier from the UAV imagery in 2023 and the 2022 glacier area from this dataset. The area discrepancies for the three glacier termini are all within 0.01 km2, indicating that the dataset developed in this study has high accuracy.

Table 4.
Comparison between UAV calculated glacier area and glacier area from this article.
3.3.2. OGGM Accuracy Evaluation
- (1)
- Accuracy verification of glacier length modeled
The depth of field of satellite pictures and their impact on the glacier’s top and bottom elevations are the main factors influencing the precision of glacier length estimation [50]. The specific formula for calculating length accuracy is as follows [51]:
where ε represents the theoretical length accuracy (i.e., the percentage of the length unaffected by resolution-related uncertainty), L is the glacier length, and λ is the spatial resolution of the remote sensing image used. This equation assumes that the maximum positional error is equivalent to one pixel size (λ), and thus the relative error decreases with increasing glacier length.
In this study, glacier lengths are categorized into six groups: ≤0.2 km, 0.2–0.5 km, 0.5–1 km, 1–2 km, 2–5 km, and ≥5 km. The calculated accuracies for these groups are 84.85%, 91.43%, 96.01%, 97.90%, 99.05%, and 99.48%, respectively. The results indicate a positive correlation between glacier length and accuracy, with longer glaciers exhibiting higher accuracy. Glaciers with a length of ≤0.2 km account for 6.76% of the total, while the accuracy for all other length categories exceeds 90%.
Table 5 presents the retreat lengths of the tongues of Tuergan No. 1 Glacier, Tuergan No. 2 Glacier, and Miaoergou No. 2 Glacier during 2022 to 2023. The annual retreat rates of the three glaciers are 25.44 m, 9.59 m, and 12.23 m, respectively. Compared to the average annual retreat lengths from 1990 to 2022, the maximum error is 6.78 m, which accounts for 0.14% of the total length of Tuergan No. 1 Glacier. This indicates that the glacier boundary results obtained from remote sensing imagery and visual interpretation are reliable and meet the requirements of the study.

Table 5.
Comparison of measured retreat distance and average annual retreat distance of Tuergan No. 1 Glacier, Tuergan No. 2 Glacier, and Miaoergou No. 2 Glacier.
- (2)
- Accuracy evaluation of modeled glacier mass balance
The mass balance projections for individual glaciers in the Turpan–Hami region, generated by the OGGM, were calibrated using the 2000–2020 period-averaged mass balance data from the global glacier mass balance change dataset [8], following a method similar to that of Xiao et al. [52] in the southeastern Tibetan Plateau. Validation was subsequently performed by comparing the modeled annual mass balance against the global dataset for the 2000–2010 and 2010–2020 periods (Figure 4a,b). The analysis showed the following results: Between 2000 and 2010, the correlation was 0.73, with a MAE of 0.188 m w.e. From 2010 to 2020, the correlation increased to 0.86, with a MAE of 0.189 m w.e. These results suggest that the OGGM provides dependable mass balance estimates for glaciers in the Turpan–Hami region. The increasing correlation over time suggests improved model accuracy, while the relatively low MAE values further support the model’s effectiveness in capturing interannual variations and trends in mass balance.

Figure 4.
Comparison of modeled glacier data with other datasets: (a) comparison of the glacier mass balance modeled data and geodetic data from 2000 to 2010; (b) comparison of the glacier mass balance modeled data and geodetic data from 2010 to 2020; (c) comparison of the glacier area modeled data from 2007 to 2022 with the calculated data. In each subplot, the red dashed line represents the fitted trend line of the scatter points.
- (3)
- Accuracy evaluation of glacier area modeled
Due to the significant uncertainty in the OGGM’s glacier data prior to the “inventory date” based on the RGI dataset, this study uses data after the inventory date for validation. Specifically, the OGGM results from 2007 to 2022 were compared with calculated glacier area data. The results indicate that the correlation coefficient is 0.71, with a MAE of 4.10 km2 (Figure 4c). While the accuracy metrics reveal some error between the OGGM modeled results and the calculated values, the relatively high correlation suggests that the model effectively captures the overall trend in glacier area changes. This implies that the model demonstrates a high degree of reliability when assessing the future trend of glacier area changes.
4. Results and Analysis
4.1. Glacier Historical Changes (1990–2022)
4.1.1. Glacier Area Change
Overall, glaciers in the TH region exhibited a significant retreat from 1990 to 2022 (Figure 5a). The total glacier area decreased from 204.04 ± 0.887 km2 to 133.52 ± 0.742 km2, a reduction of 70.52 km2, with an average annual decrease of approximately 2.20 km2·a−1 and a retreat rate of −34.56% (Figure 5b and Table 6). The glacier area retreat rate reached its maximum value in 2000, at −7.99%.
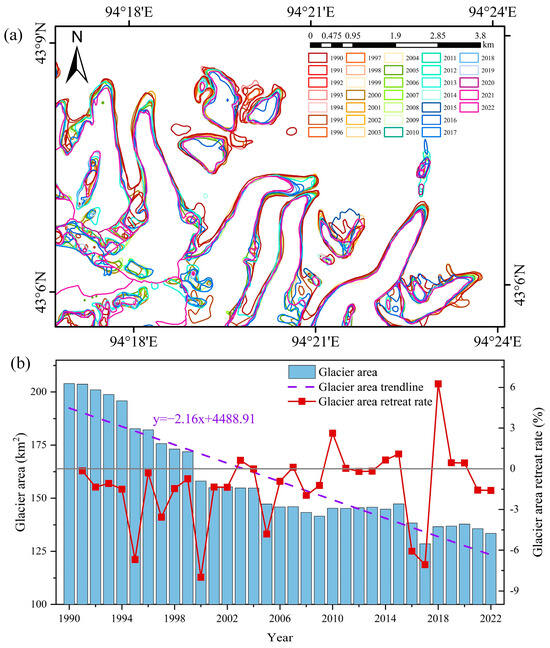
Figure 5.
Glacier changes in the TH region from 1990 to 2022. (a) Changes in glacier boundaries in some areas of TH region from 1990 to 2022 and (b) changes in glacier area and corresponding retreat rates in the TH region over the same period.

Table 6.
The number and area of glaciers that have completely disappeared at different glacier grades from 1990 to 2022.
In terms of area classification, small glaciers (area < 1 km2) have experienced a particularly significant retreat, becoming the main group of disappearing glaciers. Among the 112 glaciers that completely disappeared, 88 had an area smaller than 0.1 km2, accounting for 78.56% of the total number of glaciers lost. These small glaciers contributed to a reduction of 3.52 km2, representing 37% of the total area loss of the completely disappeared glaciers. Additionally, about 20 glaciers disintegrated into 44 smaller glaciers, highlighting how vulnerable little glaciers are to climate change. In contrast, glaciers in the 1–2 km2 size category contributed most significantly to the area reduction, losing 28.65 km2, which accounted for 40.6% of the total retreat area. This underscores the significant influence of initial glacier size on its extent of retreat.
The number of glaciers exhibited a notable decline alongside reductions in glacier area, decreasing from 304 in 1990 to 236 in 2022—a loss of 68 glaciers, or 22.37%. This trend was most pronounced among small glaciers (≤0.1 km2), which decreased from 126 to 95, a reduction of 31 glaciers. Nearly all glaciers that disappeared entirely were within these smaller size categories, underscoring their heightened vulnerability to a warming climate and their rapid rate of melting. It is worth noting that large glaciers (≥5 km2) also showed significant retreat, with their number decreasing from 7 glaciers to 1 glacier, and their area shrinking from 45.66 km2 to 7.22 km2, a decrease of 18.84%. These findings highlight that, although larger glaciers respond more gradually to climatic shifts, their accelerated retreat can lead to profound impacts.
From a watershed perspective, glaciers within the study area are distributed across 22 eighth-level watersheds (Figure 6). Watershed boundaries were delineated with high precision using data from the Second Glacier Inventory of China and DEM elevation data. The annual distribution area changes in each subregion are represented by heatmaps (Figure 7 and Figure 8), with the overall distribution and variation of glaciers from 1990 to 2022 summarized in Table 7.
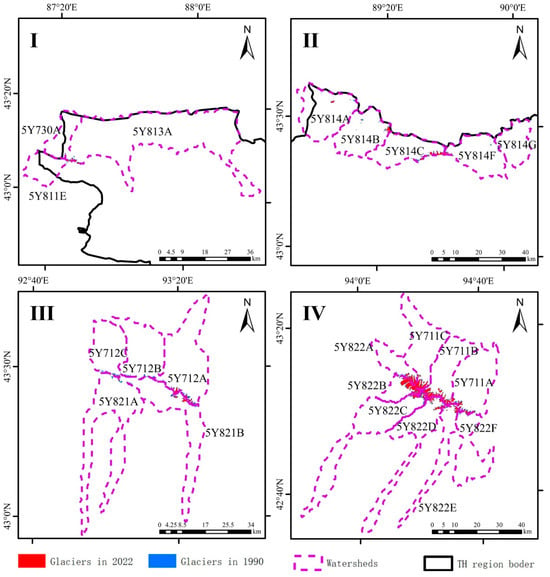
Figure 6.
Watershed distribution maps of the four sub-regions. Subplots I, II, III, and IV represent Sub-region I, Sub-region II, Sub-region III, and Sub-region IV, respectively.
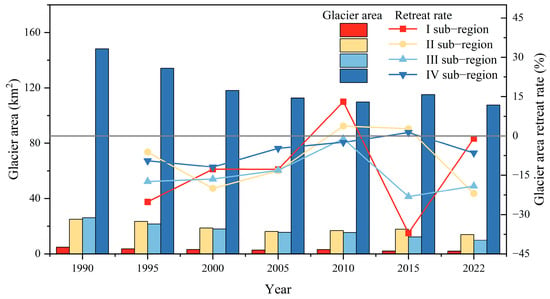
Figure 7.
Glacier area and retreat rates across four subregions from 1990 to 2022.
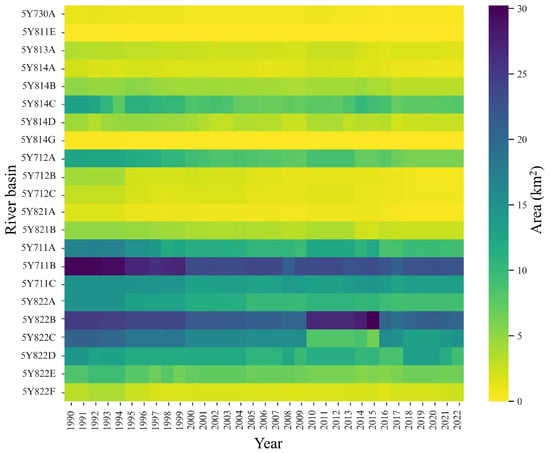
Figure 8.
Heat map of glacier area distribution in TH region from 1990 to 2022.

Table 7.
Glacier change in each subregion of the TH region.
The glacier retreat rate on the northern slopes was 36.14%, markedly higher than the 33.52% observed on the southern slopes. Spatially, glaciers are predominantly concentrated in the eastern Hami region (Areas III and IV), whereas the western Turpan region (Areas I and II) contains fewer glaciers in both number and area. Area IV exhibited the most pronounced glacier loss, with a reduction of 40.54 km2, corresponding to an average annual retreat rate of 0.83%·a−1. Area III followed, with a loss of 16.16 km2 and an average annual retreat rate of 1.87%·a−1. Areas II and I decreased by 11.01 km2 and 2.82 km2, with retreat rates of 1.21%·a−1 and 1.65%·a−1.
Quantitative assessment reveals a net glacier area reduction of 35.2 ± 0.2 km2 in the TH region during 1990–2022. While the absolute losses were comparable between the south (−35.18 km2) and north slopes (−35.34 km2), their relative change rates differed significantly at −32.80% and −36.52% per decade, respectively. This divergence primarily arises because large glacier systems like 5Y822B and 5Y822C in Zone IV (accounting for ≥22% of the regional total) buffer the south slope’s retreat rate. Furthermore, the south slope’s predominance of small-to-medium glaciers enhances its sensitivity to energy balance changes due to thinner ice thickness and lower mass accumulation rates.
Regarding glacier number changes, the glaciers that disappeared were mostly small glaciers located on the southern slopes. For example, the 5Y811E watershed in Area I completely lost its glaciers, reducing the number of glaciers by 3. In larger watersheds of Area IV and III (e.g., 5Y711B, 5Y822B, and 5Y822C), although the number of glaciers decreased less, their large areas meant that the retreat of these glaciers had a more profound impact on regional water resources and ecosystems.
4.1.2. Glacier Length Change
The annual average glacier length, presented in Figure 9, reveals a consistent decline in the TH region from 1990 to 2022, reflecting the overall retreat of glaciers during this period. Specifically, the total length of the centerlines in 1990 was 331.80 km, which decreased to 258.47 km by 2022, a reduction of 73.33 km. The average annual decrease in the centerline length also showed a yearly reduction trend, from 1.09 km in 1990 to 0.85 km in 2022, a retreat of 0.24 km. The length retreat rate was 22.10%, with each individual glacier retreating on average by 7.54 m per year.
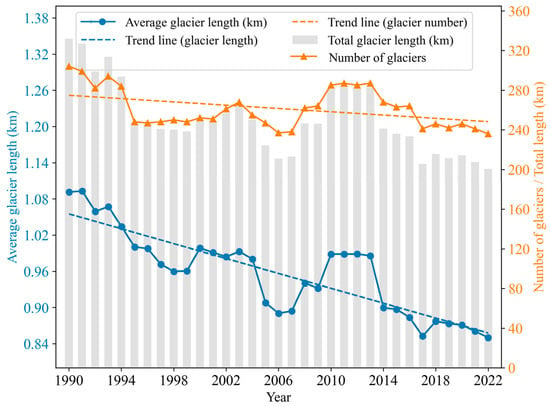
Figure 9.
Annual changes in glacier characteristics in the TH region from 1990 to 2022.
The glaciers were classified into six length categories: 0–0.2 km, 0.2–0.5 km, 0.5–1 km, 1–2 km, 2–5 km, and ≥5 km. These classifications are based on the average glacier length [24]. Heatmaps representing the distribution of glacier quantity and area for each length category are shown in Figure 10.
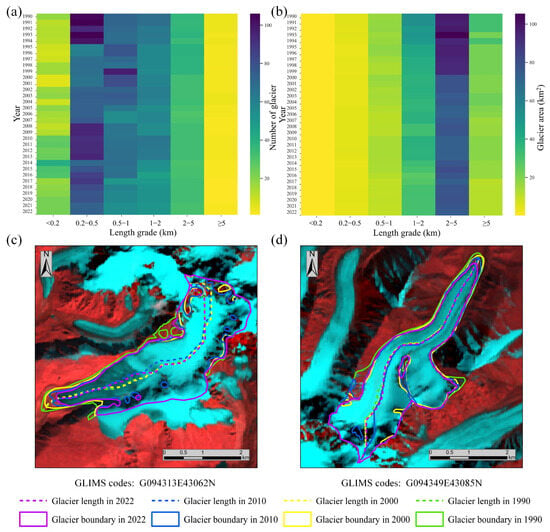
Figure 10.
Glacier length and area dynamics in the TH region from 1990 to 2022. (a) Hotspot map of glacier length grade and number of glaciers from 1990 to 2022; (b) hotspot map of glacier length grade and glacier area from 1990 to 2022; (c) the G094313E43062N glacier on the southern slope of Karlik; (d) the G094349E43085N glacier on the northern slope of Karlik.
From the distribution of glacier numbers (Figure 10a), it can be observed that glaciers with lengths in the range of 0.2–0.5 km dominate the TH region, occupying the largest proportion of the total glacier count. According to annual data, glaciers in this range account for approximately 22% to 37% of the total number. Although small glaciers (e.g., 0.2–0.5 km) are numerous, their area is relatively small, and thus their contribution to the overall glacier area is limited.
In terms of area distribution (Figure 10b), glaciers measuring 2–5 km in length constitute a disproportionately large share of the total glacier area, contributing 47% to 58% of the total glacier area in the TH region—significantly more than any other length category. However, these larger glaciers are fewer in number, making up approximately 11% to 15% of the total glacier count. This pattern reflects the typical characteristics of mountain glaciers, where larger glaciers, though fewer in number, dominate the total glacier area. Conversely, smaller glaciers are more numerous but contribute less to the overall area. These distribution characteristics are consistent with established findings on mountain glacier systems, where small glaciers predominate numerically, while larger glaciers account for a greater share of total area [53,54].
Glaciers shorter than 2 km have consistently accounted for more than 80% of the total glacier count in the TH region over the years. As the glacier length increases, the number of glaciers declines sharply. In 1990, there were five glaciers longer than 5 km, two of which exceeded 6 km in length. These glaciers had GLIMS codes G094313E43062N and G094349E43085N, with lengths of 6.68 km and 6.04 km, respectively (see Figure 10c,d). However, by 2022, only two glaciers with lengths greater than 5 km remained, with only one glacier exceeding 6 km. This glacier, with the GLIMS code G094313E43062N, had a length of 6.15 km in 2022, reduced by 0.53 km from 1990. The glacier with the GLIMS code G094349E43085N had a length of 5.83 km in 2022, reduced by 0.21 km from 1990.
4.1.3. Glacier Mass Balance Change
Through the OGGM, the overall mass balance changes were modeled. The average annual values for different periods and regions are presented in Table 8, while the interannual variation and trend-based mass loss rates are shown in Figure 11.

Table 8.
Variation of glacier mass balance during various periods.
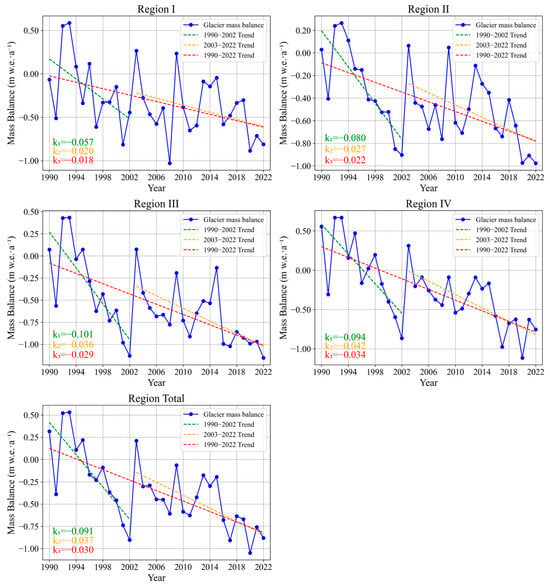
Figure 11.
Glacier mass balance in TH region from 1990 to 2022. The annual mass balance values are shown as time series, with linear trends fitted to the periods 1990–2002 (k1), 2003–2022 (k2), and the full period 1990–2022 (k3). The slopes k1, k2, and k3 represent the corresponding annual mass loss rates (m w.e.·a−1).
Over the period from 1990 to 2022, the glaciers experienced a marked negative trend in mass balance. The model simulations reveal a consistent retreat of these glaciers throughout this time. Specifically, from 1990 to 2022, the average annual mass balance was −0.35 m w.e.·a−1, while the annual mass loss rate, defined as the slope of the fitted trend line, was −0.030 m w.e.·a−1 (k3 in Figure 11). This reflects persistent mass depletion, with increasingly negative values indicating accelerating glacier loss.
When broken down into distinct time periods, the mass loss rates of glaciers between 1990 and 2002 and 2003 and 2022 exhibit notable differences. From 1990 to 2002, the mass balance transitioned from positive to negative, with an average mass balance of −0.13 m w.e.·a−1 and a mass loss rate of −0.091 m w.e.·a−1 (k1), indicating a rapid early-stage retreat. In contrast, from 2003 to 2022, although the mass balance remained negative (−0.48 m w.e.a−1), the mass loss rate slowed to −0.037 m w.e.a−1 (k2). This indicates a relative deceleration in glacier retreat during the latter period, though losses continue.
Spatially, there were notable variations across the different subregions. All four subregions exhibited a trend of declining mass balance, but the rate of decline varied. From 1990 to 2022, the average annual mass balance for subregions I to IV was −0.32 m w.e.·a−1, −0.43 m w.e.·a−1, −0.55 m w.e.·a−1, and −0.24 m w.e.·a−1, respectively. Subregion III showed the greatest mass loss, both in balance and rate, while subregion IV had the least negative balance but the highest mass loss rate at −0.034 m w.e.a−1. This implies faster thinning in subregion IV despite its overall smaller loss, likely due to extensive glacier area and high elevation enhancing accumulation potential.
In contrast, subregion III’s glaciers are more susceptible to warming, resulting in the highest total mass loss and retreat rate, making it the primary contributor to regional glacier decline.
4.2. Future Glacier Change Prediction (2020–2100)
4.2.1. Future Glacier Area Change
Based on the predictions from five global climate models (GCMs) (as shown in Figure 12), glaciers in the TH region are expected to significantly reduce over the next 80 years. Different emission scenarios (SSP126, SSP370, and SSP585) show that glacier area will rapidly decrease before 2050, and afterward, the rate of retreat will diverge under different scenarios.
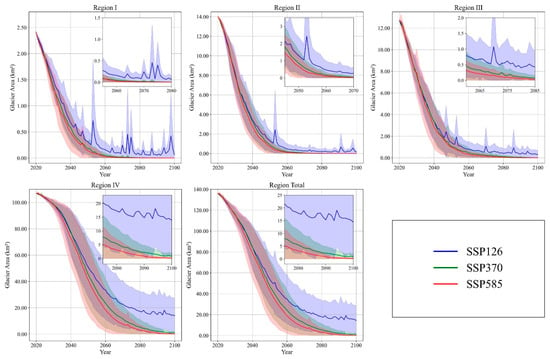
Figure 12.
Regional glacier area changes from 2020 to 2100. Solid lines represent the mean projections from five models under three scenarios, while shaded regions denote the standard deviation of model outputs for each scenario.
From the overall glacier change trend, the total Turpan–Hami’s glacier area in 2020 was 136.01 km2. Under the SSP126 scenario, it is projected to shrink to 14.42 km2 by 2100, representing an 89% reduction. In contrast, under the SSP370 scenario, the area will decrease to 0.80 km2, a reduction of up to 99%. Compared to the SSP126 scenario, the SSP585 scenario will reach the same area reduction approximately 40 years earlier. This difference highlights the significant role of emission reduction measures in slowing down glacier retreat.
Examining the changes across subregions reveals considerable differences in the trends of glacier area reduction. Subregion I has the smallest glacier area and the fastest retreat rate. Under the SSP126 scenario, the glacier area in 2100 will decrease from 2.42 km2 to 0.061 km2. In the SSP585 scenario, this level will be reached as early as 2057, and by 2100, glaciers in Subregion I will almost completely disappear under the SSP585 scenario. Subregion II has a relatively larger area, but the glacier retreat is still significant. Under the SSP126 scenario, the area will decrease from 14.01 km2 to 0.144 km2, and under the SSP585 scenario, the area will decrease by nearly 90% before 2050. Subregion III, with an initial area of 12.69 km2, will decrease to 0.308 km2 under the SSP126 scenario, and nearly disappear by 2080 under the SSP585 scenario. As the largest subregion, Subregion IV will see its glacier area decrease from 106.88 km2 to 13.91 km2 (SSP126) or 0.16 km2 (SSP585). Notably, glaciers larger than 2 km2 will contribute significantly to the reduction in area, indicating the sensitivity of large glaciers to high-emission scenarios.
In the TH region, small glaciers (less than 2 km2 in area) contribute notably to the overall reduction in glacier area. Especially before 2050, small glaciers will account for nearly half of the total area reduction. In contrast, larger glaciers (greater than 2 km2) contribute much less, approximately 15.81% of the total area reduction. This pattern stands that small glaciers are more vulnerable to climate, and their rapid retreat could have profound implications for regional ecosystems and water resources.
4.2.2. Future Glacier Volume Change
Glacier volume change serves as a critical indicator of glacier dynamics and a vital metric for assessing water resource supply potential. From 2020 to 2100, glacier volume in the TH region will continue to decrease, showing a trend similar to that of glacier area but with a more significant rate of decline (Figure 13).
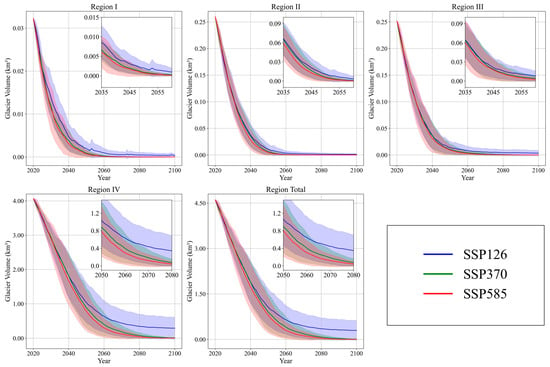
Figure 13.
Regional glacier volume changes from 2020 to 2100. Solid lines represent the mean projections from five models across three scenarios, while shaded areas indicate the standard deviation of model outputs under each scenario.
From the overall trend of glacier volume changes, the model predicts an average annual decrease of 56.32 × 10⁶ m3·a−1 in glacier volume for the TH region. By 2100, the glacier volume will experience a significant reduction. Under the SSP126 scenario, the volume will decrease from 4.61 × 10⁹ m3 to 0.29 × 10⁹ m3; under the SSP370 medium emission scenario, the volume will decrease to 8.88 × 10⁶ m3; and under the SSP585 high emission scenario, the volume will nearly disappear, leaving only 2.52 × 10⁶ m3. Over the next 15 to 20 years, the glacier volume will linearly decrease to half of its initial volume, with the rate of decline slowing thereafter. This indicates that glacier volume responds to rising temperatures in a phased manner, with the most rapid changes occurring in the early stages.
The trends in glacier volume across sub-regions closely align with those observed for glacier area. Notably, under both medium- and high-emission scenarios, the glacier volume will almost completely vanish by 2100. In contrast, under the SSP126 scenario, the decline in both the glacier area and volume slows and stabilizes after approximately 2080. Furthermore, under this low-emission scenario, glaciers with initial areas exceeding 5 km2 are expected to persist until the century’s end, albeit with substantial mass loss and ongoing shrinkage.
4.2.3. Future Glacier Mass Balance Change
Between 2020 and 2100, the glacier mass balance in the Turpan–Hami region consistently shows negative values across all scenarios, indicating a significant retreat of glaciers (Figure 14). Among these, the SSP126 scenario exhibits a relatively better mass balance compared to the SSP370 and SSP585 scenarios, reflecting a trend of reduced glacier mass loss under lower emission scenarios.
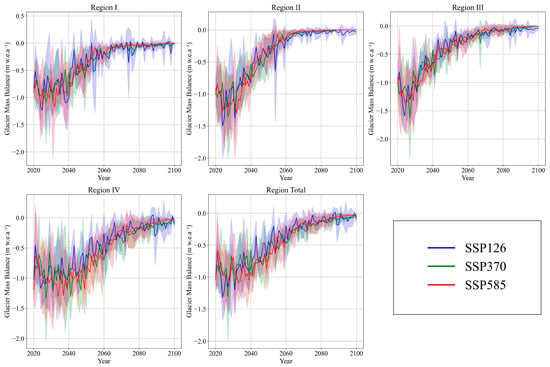
Figure 14.
Regional glacier mass balance changes from 2020 to 2100. Solid lines represent the mean projections based on simulations from five models under three scenarios, while shaded areas indicate the standard deviation of the model outputs for each scenario, highlighting the variability and uncertainty in the projections.
From 2020 to 2040, the overall mass balance values for the TH region are −0.460 m w.e.·a−1 under SSP126, −0.932 m w.e.·a−1 under SSP370, and −1.013 m w.e.·a−1 under SSP585. This period represents the greatest negative values, marking the most intense glacier retreat. In the late 21st century (2080–2100), the mass balance values show a slowdown, with SSP126 approaching −0.282 m w.e.·a−1, while the reduction in SSP370 and SSP585 scenarios remains relatively modest, maintaining values between −0.07 m w.e.·a−1 and −0.05 m w.e.·a−1.
Glacier mass balance changes exhibit pronounced spatial variability across the subregions. In Subregion I, the changes are relatively moderate, reflecting its limited initial glacier storage, which dampens mass balance fluctuations. By contrast, glaciers in Subregion II demonstrate heightened sensitivity to climate change, particularly under the SSP585 scenario from 2020 to 2040, where the mass balance reaches −1.027 m w.e.·a−1, representing the most rapid decline among all subregions and scenarios. However, by 2080–2100, the melt rate markedly slows, with the mass balance stabilizing at −0.002 m w.e.·a−1. Subregion III, characterized by more extensive glacier coverage, undergoes rapid melting under medium- and high-forcing scenarios, with mass balances of −0.946 m w.e.·a−1 and −1.017 m w.e.·a−1 under SSP370 and SSP585 scenarios, respectively, during 2020–2040. While the melt rate decreases in subsequent decades, substantial glacier loss persists. Subregion IV, with the broadest glacier distribution, exhibits a trend closely mirroring that of the entire Turpan–Hami region, with rapid early melting under SSP585 (−1.014 m w.e.·a−1 from 2020 to 2040), followed by stabilization in later periods. These patterns underscore the critical roles of glacier size, geographic setting, and climate forcing in shaping the spatial heterogeneity of glacier change, amidst an overarching trend of accelerated melting.
4.3. Glacier–Climate Response Relationship
4.3.1. Interannual Variation of Climate Factors
Glacier retreat is largely influenced by the interannual variation in local maximum temperatures and the duration of high-temperature days. In the TH region, glacier melting primarily occurs from July to September each year; thus, this period is defined as the glacier melt-season [55]. To evaluate the drivers of glacier retreat, we analyzed climate data from 1990 to 2022, including annual and melt-season mean temperatures and annual and melt-season total precipitation, as well as annual mean and maximum solar radiation. As shown in Figure 15, the 33-year record captures the interannual variability of solar radiation in the TH region and supports the robustness of the trend analysis.
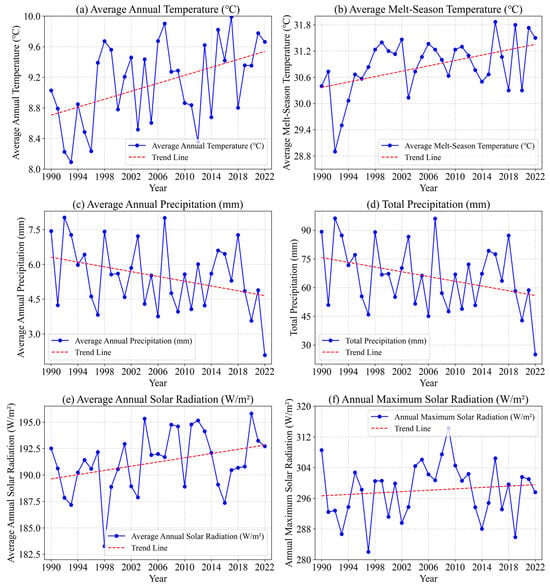
Figure 15.
Variations in temperature, precipitation, and solar radiation from 1990 to 2022.
From 1990 to 2022, the annual average temperature in the TH region exhibited a key increasing trend. Particularly in 2015–2016 and 2020–2021, the mean temperature during the melt-season rose by more than 1.2 °C. Analyzing the glacier historical data, the area change rate during 2015–2016 was −6.07%·a−1, and the length change rate for both 2015–2016 and 2020–2021 exceeded −1.2%·a−1. These trends demonstrate that the accelerated temperature rise is the primary driver of rapid glacier loss in the TH region.
The average annual precipitation between 1990 and 2022 fluctuated between 2.09 and 8.01 mm, showing a significant downward trend. The average value between 1990 and 2000 was 6.08 mm, while the average value between 2010 and 2022 was only 5.08 mm, and the lowest value in the past 30 years was 2.09 mm in 2022. Precipitation is the primary supply source for glaciers; this decline could result in reduced snow accumulation, thereby affecting glacier mass and area. Although the overall change in precipitation is relatively modest, its continuous decline remains an important factor of concern. From 1990 to 2022, both the annual maximum and average annual solar radiation in the Turpan–Hami region exhibited an increasing trend. The annual maximum solar radiation rose from 282.03 W/m2 in 1997 to a peak of 314.33 W/m2 in 2009, marking the overall upward trajectory during the observed period. Meanwhile, the average annual solar radiation increased from 187.18 W/m2 in 1993 to 195.82 W/m2 in 2020. Despite interannual fluctuations, the long-term trend in average radiation suggests a gradual but consistent increase in the background energy input to glacier surfaces. Solar radiation serves as the dominant component of the glacier surface energy balance. As solar input increases, more energy is absorbed by glacier surfaces, enhancing melt potential. Compared to maximum radiation, the average annual solar radiation reflects the sustained level of energy supply over time and is more directly linked to the net heat gain of the glacier system.
4.3.2. Glacier Change and Climate Response Analysis
- (1)
- Correlation Analysis Between Glacier Area Changes and Climatic Factors
To investigate the statistical relationships between total glacier area and key climatic factors, this study employed the Pearson correlation method to analyze the correlations between glacier area and five variables: annual mean temperature, melt-season temperature, annual total precipitation, annual mean solar radiation, and annual maximum solar radiation. The results of the correlation analysis are presented in Table 9.

Table 9.
Pearson correlation coefficients between glacier area and major climatic factors.
At the 0.01 significance level, the glacier area is significantly negatively correlated with both annual mean temperature and melt-season temperature, with correlation coefficients of –0.51 and –0.58, respectively, indicating that rising temperatures significantly accelerate glacier retreat. At the 0.05 significance level, the correlation coefficients between the glacier area and annual total precipitation and annual mean solar radiation are 0.35 and –0.36, respectively. These results suggest that increased precipitation generally contributes to glacier accumulation, while enhanced solar radiation may promote glacier melt [56]. In contrast, the correlation between glacier area and annual maximum solar radiation is relatively weak, at –0.21, and does not reach statistical significance. This is likely because this indicator only reflects extreme radiation values and fails to capture the cumulative thermal input that drives glacier melting over time. In comparison, variables such as annual mean temperature and annual mean radiation better represent long-term energy inputs and thus show stronger correlations with glacier area changes.
In addition, there is a clear linear relationship between annual total precipitation and annual mean precipitation, with a high degree of statistical correlation between the two. To avoid multicollinearity issues in the standardized regression analysis and to enhance model stability, this study retains only annual total precipitation as the representative variable for precipitation. Including both highly correlated variables in the regression model could result in unstable coefficient estimates and potentially misleading interpretations, thereby undermining the explanatory power of the model.
- (2)
- Multivariate Standardized Regression Analysis
Building upon the findings of the correlation analysis, this study further employed a ridge regression model to quantify the driving effects of multiple climatic factors on glacier area change under their combined influence. Notably, an interaction term—“annual total precipitation × melt-season temperature”—was incorporated into the model to better capture the complex regulatory role of precipitation on glacier dynamics. While the correlation analysis showed a positive relationship between annual total precipitation and glacier area, suggesting that precipitation generally contributes to glacier accumulation under average climate conditions, this relationship may shift depending on temperature variations. In warmer years, precipitation tends to fall as rain, which not only fails to contribute to glacier accumulation but may also accelerate melting. Conversely, in colder years, precipitation is more likely to fall as snow, enhancing glacier mass gain. The inclusion of the interaction term is thus intended to reflect this nonlinear response modulated by climatic conditions and to prevent the precipitation effect from being misrepresented or neutralized by a purely linear regression framework.
The ridge regression results are presented in Figure 16. Figure 16a illustrates the standardized regression coefficients, indicating both the direction and magnitude of each variable’s influence on glacier area change. Among all predictors, melt-season temperature exhibits the largest negative coefficient (–6.93), suggesting that a 1 °C increase in melt-season temperature corresponds to an average glacier area reduction of approximately 6.93 km2, making it the most influential factor in the model. Annual mean temperature and annual mean solar radiation also show substantial negative coefficients, –4.93 and –4.46, respectively, highlighting their significant roles in accelerating glacier melt. In contrast, annual total precipitation has a positive coefficient (+0.72), indicating a net accumulation effect under average climatic conditions. The interaction term also holds a positive coefficient (+0.14), reinforcing the previously discussed mechanism in which precipitation contributes to glacier growth under cooler conditions but may lose or reverse its positive impact as temperatures rise beyond a certain threshold.
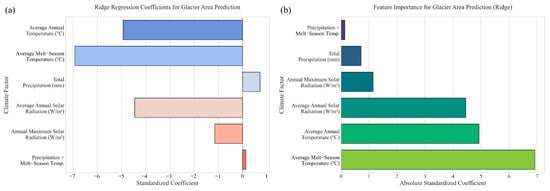
Figure 16.
Ridge regression results for identifying climatic drivers of glacier area change. (a) Ridge regression coefficients for each climatic variable, indicating their direction and magnitude of influence on glacier area. (b) Relative importance of each variable based on the absolute standardized coefficients in the ridge regression model.
Figure 16b presents the relative importance of each variable, derived from the absolute values of the standardized coefficients in the ridge regression model. This ranking reflects the contribution of each factor to the model’s predictive performance. The results indicate that glacier area change is most strongly influenced by melt-season temperature, annual mean temperature, and annual mean solar radiation. This ranking is consistent with the trends observed in the regression coefficients, suggesting that glacier dynamics in the Turpan–Hami region are primarily driven by rising temperatures and intensified solar radiation. In comparison, annual maximum solar radiation and total annual precipitation exhibit relatively weaker effects. Although the interaction term has the smallest absolute coefficient, it carries clear physical significance by capturing the synergistic effects of temperature and precipitation. This highlights the multi-factor regulation of glacier change under complex climatic conditions.
Overall, the normalized ridge regression model yields a coefficient of determination (R2) of 0.4431, indicating that the six selected variables collectively explain approximately 44.3% of the observed glacier area changes. The modeling results are broadly consistent with the preceding correlation analysis, reinforcing the high sensitivity of glaciers to temperature variations and the pivotal role of solar radiation. Furthermore, the model reveals the conditional nature of precipitation’s impact: its effect on glaciers is not static but varies dynamically with the thermal background. This underscores the need to evaluate precipitation’s role in glacier dynamics in conjunction with temperature conditions.
5. Discussion and Conclusions
5.1. Discussion
Xinjiang’s temperature has risen by 1.2 °C over the last 50 years, with a 0.32 °C temperature change rate per decade [57]. The Turpan–Hami region’s glaciers have significantly receded as a result of global warming. This study results show that the primary cause of glacier retreat is closely related to rising temperatures, which is consistent with the findings of researchers such as Huang [58], Yang [25], Wang [21], and others. From 1990 to 2022, the glacier area in the Turpan–Hami region has decreased by 70.52 km2, approximately 34.56% retreat. The average retreat rates over 32 years in four subregions were −1.33%·a−1, −1.43%·a−1, −1.93%·a−1, and −0.86%·a−1 as recorded by Li [32], Qian [59], Huang [58,60], and others. Although there are differences in the extent of change, the overall trend is consistent (Table 10).
In terms of mass balance, our simulation shows that glaciers in the Turpan–Hami region experienced an average annual mass balance of –0.35 m w.e.·a−1 from 1990 to 2022, with a mass loss rate of –0.030 m w.e.·a−1. This is consistent with regional studies in the Tianshan Mountains. For example, Wang [21] reported a mass balance decline rate of –0.022 m w.e.·a−1 in the eastern Tianshan during 1980–2016, while Yang [61] found a rate of –0.39 m w.e.·a−1 on the northern slope of the Tianshan from 2000 to 2020. From a global perspective, the Sixth Assessment Report (AR6) of the IPCC indicates that the average glacier mass balance loss worldwide was –0.28 ± 0.11 m w.e.·a−1 during 2000–2019 [62]. In comparison, the average annual mass loss of glaciers in this study area is –0.35 m w.e.·a−1, which is slightly higher than the global average, suggesting that glaciers in this arid region may be more sensitive to climate change. This difference may be related to the limited snow accumulation and the relatively high warming rate in the Turpan–Hami region.

Table 10.
Comparison of previous studies on glaciers in the East Tianshan region.
Table 10.
Comparison of previous studies on glaciers in the East Tianshan region.
| Glacier/Region | Retreat Area (km2) | Glacier Retreat Rate (%) | Average Annual Retreat Rate (%·a−1) | Period | Reference |
|---|---|---|---|---|---|
| Barkol | 4.49 | 25.67 | 1.22 | 1990–2011 | [32] |
| Bogurda | 72.46 | 33.58 | 1.60 | 1990–2011 | |
| Bogurda | 48.73 | 30.81 | 1.66 | 1990–2015 | [60] |
| Karlik | 51.08 | 32.15 | 1.46 | 1990–2015 | |
| Karlik | / | 17.78 | / | 2005–2015 | [58] |
| Karlik | 15.85 | 13.59 | / | 1992–2001 | [59] |
| Karlik | 0.22 | 0.22 | / | 2001–2006 | |
| Karlik | 21.68 | 16.08 | 0.77 | 1990–2011 | [32] |
| Glaciers in Turpan | / | / | 1.98 | 2001–2011 | [63] |
| Glaciers in Hami | / | / | 1.47 | 2001–2011 | |
| Eastern Tianshan | 98.63 | 26.80 | 1.28 | 1990–2011 | [32] |
| Eastern Tianshan | 819.00 | / | 1.58 | 2001–2021 | [63] |
Note: “/” indicates that the corresponding value was not reported in the cited literature.
Moreover, the heightened sensitivity of glaciers in this region is not only due to their small surface area but also closely linked to their relatively small ice volume. Smaller glaciers typically have thinner ice bodies and lower overall mass, which leads to shorter response times to climatic changes. As a result, even minor increases in temperature can cause substantial mass loss or even complete glacier disappearance. This mass-related vulnerability suggests that glacier volume, more than area, is a direct indicator of climate sensitivity, explaining the amplified retreat observed in the Turpan–Hami region.
It is important to note that the accuracy of glacier boundaries in this study is limited by field validation constraints. Due to challenging terrain, in situ verification was only possible for three glaciers during 2022–2023, selected from different catchments and slope aspects within subregion IV. To mitigate this, we applied a half-pixel spatial uncertainty estimate based on Landsat resolution and used UAV-based cross-validation for glacier termini in 2023. However, future studies should include broader field sampling with more glaciers and years to improve the validation accuracy. This study selects three key indicators—glacier area, length, and mass balance—during the historical data analysis, aiming to comprehensively reflect the dynamic changes and detailed characteristics of glaciers throughout historical periods. Notably, glacier length, as a crucial spatial dimension, offers a finer resolution for revealing the processes of glacier retreat or advance, along with their spatial distribution patterns. Through an in-depth analysis of glacier length, we are able to accurately capture the temporal and spatial changes of glaciers in the Turpan–Hami region, providing essential insights for understanding the glacier dynamics.
However, in future projections, the focus shifts to three indicators: glacier area, ice volume, and mass balance. This shift underscores the need for a more macroscopic assessment of the impacts of climate change on glaciers and regional water resources. Unlike the detailed, micro-level analysis of historical data, future projections emphasize the potential impact of glacier retreat on water supply. In the context of global warming, ice volume, as a critical variable representing the total water storage of glaciers, allows for a more effective evaluation of the changes in glacier contribution to regional water resources. Consequently, variations in ice volume serve as a key indicator for assessing the changes in glacier water supply under the influence of climate change. A significant body of research has established that ice volume is one of the central variables for evaluating the impacts of climate change [64,65,66], helping to predict the far-reaching effects of glacier changes on regional ecosystems and socio-economic systems.
Thus, the adjustment of indicators in this study reflects a shift from a micro to a macro perspective. While the historical data analysis focuses on the details of glacier dynamics, future projections use ice volume as a key indicator to evaluate the anticipated implications of glacier retreat on regional water supply, as well as its broader implications for the ecological environment and socio-economic systems. This adjustment aims to provide a more comprehensive scientific basis for accurately evaluating glacier changes.
In this study, 2020 is chosen as the baseline year for future projections, based on two main considerations. First, it marks the start of future simulations in the ISIMIP3b framework, which provides bias-adjusted CMIP6 climate data widely used in glacier modeling and is fully compatible with the OGGM. Second, it aligns with our validation efforts, including field surveys in 2023 and high-resolution remote sensing data from 2020 to 2022. The strong agreement between model outputs and observations during this period supports the reliability of using 2020 as the transition year, ensuring consistency between global datasets and local validation. The noteworthy of this study lies in the creation of a dataset covering 33 years of annual glacier boundaries, with each year’s glacier boundary extracted and calibrated, thus improving the precision of glacier information. Furthermore, we have projected the future changes of glaciers in the Turpan–Hami region over the coming decades, especially glacier retreat until the end of 21st century, providing essential insights for assessing the impact of climate change on glaciers.
5.2. Conclusions
This study, utilizing Landsat remote sensing and SRTM DEM data from the Turpan–Hami region (1990–2022), generated a dataset covering the glacier boundaries for each year over a 30-year period. This dataset enabled a more precise characterization of the spatial and temporal dynamics of glacier retreat and facilitated the simulation of both historical and future glacier morphological changes through the OGGM. It also revealed the complex relationships between glaciers and climate factors. Specifically,
- (1)
- Historical Glacier Changes: From 1990 to 2022, glaciers in the Turpan–Hami region experienced significant retreat. The total glacier area decreased from 204.04 ± 0.887 km2 to 133.52 ± 0.742 km2, a reduction of 70.52 km2 with an average annual reduction of 2.20 km2·a−1, corresponding to a 34.56% retreat. Meanwhile, the number of glaciers declined markedly from 304 to 236, and the total length of glacier centerlines contracted from 331.80 km to 258.47 km, with an average retreat of 7.54 m·a−1 per glacier, indicating an overall trend of glacier recession. In terms of mass balance, glaciers in the region experienced a long-term average annual loss of –0.34 m w.e.·a−1. The extent of glacier retreat was closely related to initial glacier size and geographical location. Smaller glaciers exhibited higher retreat rates, and glaciers on the northern slopes showed significantly greater area loss (36.52%) compared to those on southern slopes (32.80%), suggesting a stronger climatic sensitivity. In addition to their smaller area, the relatively low mass of small glaciers also plays a key role in this heightened sensitivity.
- (2)
- Future Glacier Change Predictions: Based on projections from GCMs, glaciers in the TH region are expected to continue retreating significantly over the next 80 years. Under the SSP126 scenario, by 2100, the total glacier area is projected to decrease by approximately 89%, from 136.01 km2 in 2020 to 14.42 km2. Under the SSP370 scenario, the total glacier area could shrink to 0.80 km2, a reduction of up to 99%. In the high-emission SSP585 scenario, the retreat rate accelerates, and glaciers are expected to nearly disappear by 2057. In all scenarios, the glacier mass balance remains consistently negative, with the retreat being most pronounced under the high-emission scenario, leading to the near-total disappearance of glacier volume. This underscores the importance of mitigation measures in slowing down glacier retreat. Regional variation reveals substantial differences in the rate of area change across subregions, with smaller glaciers experiencing more pronounced retreat, especially before 2050, when small glaciers will account for the majority of the overall area reduction.
- (3)
- Glacier Response to Climate: Glacier retreat in the Turpan–Hami region is primarily driven by long-term climate change, with temperature increase playing the dominant role. Notably, the significant rise in temperature and the increase in solar radiation have led to rapid glacier shrinkage. Ridge regression analysis (R2 = 0.4431) further confirms that melt-season temperature (–6.93), annual mean temperature (–4.93), and solar radiation (–4.46) are the strongest drivers of glacier retreat. Precipitation shows a weaker positive effect (+0.72), while its interaction with temperature (+0.14) reveals a conditional influence—contributing to glacier accumulation under cooler conditions but becoming less effective or even accelerating melting as temperatures rise. Throughout the study period, increased solar radiation also played a significant role in enhancing glacier melt. These findings highlight the high climatic sensitivity of glaciers in this region, especially to rising temperatures and intensified solar radiation.
Author Contributions
Conceptualization, Y.C. and B.H.; methodology, Y.C.; software, Y.C.; validation, Y.C.; formal analysis, Y.C. and B.H.; investigation, Y.C., B.H., X.J., G.Y. and Z.Z.; data curation, Y.C. and X.J.; writing—original draft preparation, Y.C.; writing—review and editing, Y.C. and B.H.; visualization, Y.C.; project administration, B.H.; funding acquisition, B.H. All authors have read and agreed to the published version of the manuscript.
Funding
This study was supported by the project of the National Natural Science Foundation of China (42361063); the Third Xinjiang Comprehensive Scientific Expedition (2021xjkk1000); the Natural Science Foundation of Xinjiang Uygur Autonomous Region (2019D01C024).
Institutional Review Board Statement
Not applicable.
Informed Consent Statement
Not applicable.
Data Availability Statement
The datasets generated or analyzed during the current study are not publicly available because the authors only have usage rights but not ownership. However, the data can be obtained from the corresponding author upon reasonable request.
Acknowledgments
We greatly appreciate the anonymous reviewers and editors who evaluated our article and provided insightful feedback. This work greatly benefited from open-source resources, particularly the OGGM, CMIP6 datasets. The authors also express their deep appreciation for the developers and communities that maintain these resources.
Conflicts of Interest
The authors declare no conflicts of interest.
Abbreviations
The following abbreviations are used in this manuscript:
| TH | Turpan–Hami Region |
| GEE | Google Earth Engine |
| OGGM | The Open Global Glacier Model |
| RGI | Randolph Glacier Inventory |
| GCM | Global Climate Model |
| NDWI | Normalized Difference Water Index |
| PAC | Percentages of Area Changes |
| UAV | Unmanned Aerial Vehicle |
| MB | Mass Balance |
| DEM | Digital Elevation Model |
| GSWP3 | Global Soil Wetness Project Phase 3 |
| W5E5 | WATCH-WFDEI merged with ERA5 |
| w.e. | Water Equivalent |
| MAE | Mean Absolute Error |
Appendix A

Table A1.
Detailed information of Landsat satellite images from 1990 to 2022.
Table A1.
Detailed information of Landsat satellite images from 1990 to 2022.
| Year | Region | Serial Number in GEE | Spatial Resolution |
| 1990 | I | LANDSAT/LT05/C01/T1_SR/LT05_142030_19900619 | 30 m |
| II | LANDSAT/LT05/C01/T1_SR/LT05_141030_19900511 | 30 m | |
| III | LANDSAT/LT05/C01/T1_SR/LT05_139030_19900902 | 30 m | |
| IV | LANDSAT/LT05/C01/T1_SR/LT05_138030_19900607 | 30 m | |
| 1991 | I | LANDSAT/LT05/C01/T1_SR/LT05_143030_19910901 | 30 m |
| II | LANDSAT/LT05/C01/T1_SR/LT05_141030_19910717 | 30 m | |
| III | LANDSAT/LT05/C01/T1_SR/LT05_139030_19910804 | 30 m | |
| IV | LANDSAT/LT05/C01/T1_SR/LT05_138030_19910829 | 30 m | |
| 1992 | I | LANDSAT/LT05/C01/T1_SR/LT05_143030_19920514 | 30 m |
| II | LANDSAT/LT05/C01/T1_SR/LT05_141030_19920905 | 30 m | |
| III | LANDSAT/LT05/C01/T1_SR/LT05_139030_19920907 | 30 m | |
| IV | LANDSAT/LT05/C01/T1_SR/LT05_138030_19920815 | 30 m | |
| 1993 | I | LANDSAT/LT05/C01/T1_SR/LT05_143030_19930922 | 30 m |
| II | LANDSAT/LT05/C01/T1_SR/LT05_141030_19930519 | 30 m | |
| III | LANDSAT/LT05/C01/T1_SR/LT05_139030_19930724 | 30 m | |
| IV | LANDSAT/LT05/C01/T1_SR/LT05_138030_19930919 | 30 m | |
| 1994 | I | LANDSAT/LT05/C01/T1_SR/LT05_143030_19940824 | 30 m |
| II | LANDSAT/LT05/C01/T1_SR/LT05_141030_19940826 | 30 m | |
| III | LANDSAT/LT05/C01/T1_SR/LT05_139030_19940828 | 30 m | |
| IV | LANDSAT/LT05/C01/T1_SR/LT05_138030_19940906 | 30 m | |
| 1995 | I | LANDSAT/LT05/C01/T1_SR/LT05_142030_19950921 | 30 m |
| II | LANDSAT/LT05/C01/T1_SR/LT05_141030_19950525 | 30 m | |
| III | LANDSAT/LT05/C01/T1_SR/LT05_139030_19950628 | 30 m | |
| IV | LANDSAT/LT05/C01/T1_SR/LT05_138030_19950925 | 30 m | |
| 1996 | I | LANDSAT/LT05/C01/T1_SR/LT05_143030_19960829 | 30 m |
| II | LANDSAT/LT05/C01/T1_SR/LT05_141030_19960527 | 30 m | |
| III | LANDSAT/LT05/C01/T1_SR/LT05_139030_19960918 | 30 m | |
| IV | LANDSAT/LT05/C01/T1_SR/LT05_138030_19960810 | 30 m | |
| 1997 | I | LANDSAT/LT05/C01/T1_SR/LT05_142030_19970708 | 30 m |
| II | LANDSAT/LT05/C01/T1_SR/LT05_141030_19970903 | 30 m | |
| III | LANDSAT/LT05/C01/T1_SR/LT05_139030_19970703 | 30 m | |
| IV | LANDSAT/LT05/C01/T1_SR/LT05_138030_19970509 | 30 m | |
| 1998 | I | LANDSAT/LT05/C01/T1_SR/LT05_142030_19980913 | 30 m |
| II | LANDSAT/LT05/C01/T1_SR/LT05_141030_19980805 | 30 m | |
| III | LANDSAT/LT05/C01/T1_SR/LT05_139030_19980908 | 30 m | |
| IV | LANDSAT/LT05/C01/T1_SR/LT05_138030_19980901 | 30 m | |
| 1999 | I | LANDSAT/LE07/C01/T1_SR/LE07_142030_19990823 | 30 m |
| II | LANDSAT/LE07/C01/T1_SR/LE07_141030_19990901 | 30 m | |
| III | LANDSAT/LE07/C01/T1_SR/LE07_139030_19990919 | 30 m | |
| IV | LANDSAT/LE07/C01/T1_SR/LE07_138030_19990811 | 30 m | |
| 2000 | I | LANDSAT/LT05/C01/T1_SR/LT05_142030_20000902 | 30 m |
| II | LANDSAT/LT05/C01/T1_SR/LT05_141030_20000826 | 30 m | |
| III | LANDSAT/LT05/C01/T1_SR/LT05_139030_20000727 | 30 m | |
| IV | LANDSAT/LT05/C01/T1_SR/LT05_138030_20000922 | 30 m | |
| 2001 | I | LANDSAT/LT05/C01/T1_SR/LT05_142030_20010804 | 30 m |
| II | LANDSAT/LT05/C01/T1_SR/LT05_141030_20010610 | 30 m | |
| III | LANDSAT/LE07/C01/T1_SR/LE07_139030_20010924 | 30 m | |
| IV | LANDSAT/LT05/C01/T1_SR/LT05_138030_20010824 | 30 m | |
| 2002 | I | LANDSAT/LT05/C01/T1_SR/LT05_143030_20020814 | 30 m |
| II | LANDSAT/LT05/C01/T1_SR/LT05_141030_20020629 | 30 m | |
| III | LANDSAT/LE07/C01/T1_SR/LE07_139030_20020826 | 30 m | |
| IV | LANDSAT/LT05/C01/T1_SR/LT05_138030_20020928 | 30 m | |
| 2003 | I | LANDSAT/LE07/C01/T1_SR/LE07_142030_20030802 | 30 m |
| II | LANDSAT/LT05/C01/T1_SR/LT05_138030_20030915 | 30 m | |
| III | LANDSAT/LT05/C01/T1_SR/LT05_139030_20030821 | 30 m | |
| IV | LANDSAT/LT05/C01/T1_SR/LT05_138030_20030915 | 30 m | |
| 2004 | I | LANDSAT/LT05/C01/T1_SR/LT05_142030_20040711 | 30 m |
| II | LANDSAT/LT05/C01/T1_SR/LT05_141030_20040906 | 30 m | |
| III | LANDSAT/LT05/C01/T1_SR/LT05_139030_20040620 | 30 m | |
| IV | LANDSAT/LT05/C01/T1_SR/LT05_138030_20040816 | 30 m | |
| 2005 | I | LANDSAT/LT05/C01/T1_SR/LT05_142030_20050815 | 30 m |
| II | LANDSAT/LT05/C01/T1_SR/LT05_141030_20050909 | 30 m | |
| III | LANDSAT/LE07/C01/T1_SR/LE07_139030_20050802 | 30 m | |
| IV | LANDSAT/LE07/C01/T1_SR/LE07_138030_20050811 | 30 m | |
| 2006 | I | LANDSAT/LE07/C01/T1_SR/LE07_143030_20060801 | 30 m |
| II | LANDSAT/LE07/C01/T1_SR/LE07_141030_20060803 | 30 m | |
| III | LANDSAT/LT05/C01/T1_SR/LT05_139030_20060829 | 30 m | |
| IV | LANDSAT/LE07/C01/T1_SR/LE07_138030_20060814 | 30 m | |
| 2007 | I | LANDSAT/LT05/C01/T1_SR/LT05_143030_20070727 | 30 m |
| II | LANDSAT/LE07/C01/T1_SR/LE07_141030_20070806 | 30 m | |
| III | LANDSAT/LT05/C01/T1_SR/LT05_139030_20070731 | 30 m | |
| IV | LANDSAT/LE07/C01/T1_SR/LE07_138030_20070801 | 30 m | |
| 2008 | I | LANDSAT/LT05/C01/T1_SR/LT05_142030_20080706 | 30 m |
| II | LANDSAT/LE07/C01/T1_SR/LE07_141030_20080605 | 30 m | |
| III | LANDSAT/LE07/C01/T1_SR/LE07_139030_20080709 | 30 m | |
| IV | LANDSAT/LT05/C01/T1_SR/LT05_138030_20080811 | 30 m | |
| 2009 | I | LANDSAT/LT05/C01/T1_SR/LT05_142030_20090725 | 30 m |
| II | LANDSAT/LT05/C01/T1_SR/LT05_141030_20090819 | 30 m | |
| III | LANDSAT/LT05/C01/T1_SR/LT05_139030_20090602 | 30 m | |
| IV | LANDSAT/LT05/C01/T1_SR/LT05_138030_20090713 | 30 m | |
| 2010 | I | LANDSAT/LT05/C01/T1_SR/LT05_143030_20100804 | 30 m |
| II | LANDSAT/LT05/C01/T1_SR/LT05_141030_20100721 | 30 m | |
| III | LANDSAT/LT05/C01/T1_SR/LT05_139030_20100824 | 30 m | |
| IV | LANDSAT/LT05/C01/T1_SR/LT05_138030_20100902 | 30 m | |
| 2011 | I | LANDSAT/LT05/C01/T1_SR/LT05_143030_20110807 | 30 m |
| II | LANDSAT/LE07/C01/T1_SR/LE07_141030_20110918 | 30 m | |
| III | LANDSAT/LE07/C01/T1_SR/LE07_139030_20110920 | 30 m | |
| IV | LANDSAT/LE07/C01/T1_SR/LE07_138030_20110711 | 30 m | |
| 2012 | I | LANDSAT/LE07/C01/T1_SR/LE07_143030_20120817 | 30 m |
| II | LANDSAT/LE07/C01/T1_SR/LE07_141030_20120702 | 30 m | |
| III | LANDSAT/LE07/C01/T1_SR/LE07_139030_20120821 | 30 m | |
| IV | LANDSAT/LE07/C01/T1_SR/LE07_138030_20120814 | 30 m | |
| 2013 | I | LANDSAT/LE07/C01/T1_SR/LE07_142030_20130610 | 30 m |
| II | LANDSAT/LE07/C01/T1_SR/LE07_141030_20130923 | 30 m | |
| III | LANDSAT/LE07/C01/T1_SR/LE07_139030_20130824 | 30 m | |
| IV | LANDSAT/LE07/C01/T1_SR/LE07_138030_20130902 | 30 m | |
| 2014 | I | LANDSAT/LE07/C01/T1_SR/LE07_143030_20140807 | 30 m |
| II | LANDSAT/LE07/C01/T1_SR/LE07_141030_20140825 | 30 m | |
| III | LANDSAT/LE07/C01/T1_SR/LE07_139030_20140608 | 30 m | |
| IV | LANDSAT/LE07/C01/T1_SR/LE07_138030_20140804 | 30 m | |
| 2015 | I | LANDSAT/LE07/C01/T1_SR/LE07_143030_20150826 | 30 m |
| II | LANDSAT/LE07/C01/T1_SR/LE07_141030_20150727 | 30 m | |
| III | LANDSAT/LE07/C01/T1_SR/LE07_139030_20150814 | 30 m | |
| IV | LANDSAT/LE07/C01/T1_SR/LE07_138030_20150823 | 30 m | |
| 2016 | I | LANDSAT/LE07/C01/T1_SR/LE07_142030_20160805 | 30 m |
| II | LANDSAT/LE07/C01/T1_SR/LE07_141030_20160915 | 30 m | |
| III | LANDSAT/LE07/C01/T1_SR/LE07_139030_20160715 | 30 m | |
| IV | LANDSAT/LE07/C01/T1_SR/LE07_138030_20160910 | 30 m | |
| 2017 | I | LANDSAT/LC08/C01/T1_SR/LC08_142030_20170901 | 30 m |
| II | LANDSAT/LC08/C01/T1_SR/LC08_141030_20170926 | 30 m | |
| III | LANDSAT/LC08/C01/T1_SR/LC08_139030_20170811 | 30 m | |
| IV | LANDSAT/LE07/C01/T1_SR/LE07_138030_20170812 | 30 m | |
| 2018 | I | LANDSAT/LC08/C01/T1_SR/LC08_143030_20180725 | 30 m |
| II | LANDSAT/LC08/C01/T1_SR/LC08_141030_20180727 | 30 m | |
| III | LANDSAT/LE07/C01/T1_SR/LE07_139030_20180721 | 30 m | |
| IV | LANDSAT/LC08/C01/T1_SR/LC08_138030_20180807 | 30 m | |
| 2019 | I | LANDSAT/LC08/C01/T1_SR/LC08_143030_20190813 | 30 m |
| II | LANDSAT/LC08/C01/T1_SR/LC08_141030_20190730 | 30 m | |
| III | LANDSAT/LC08/C01/T1_SR/LC08_139030_20190817 | 30 m | |
| IV | LANDSAT/LC08/C01/T1_SR/LC08_138030_20190810 | 30 m | |
| 2020 | I | LANDSAT/LE07/C01/T1_SR/LE07_142030_20200731 | 30 m |
| II | LANDSAT/LC08/C01/T1_SR/LC08_141030_20200801 | 30 m | |
| III | LANDSAT/LC08/C01/T1_SR/LC08_139030_20200718 | 30 m | |
| IV | LANDSAT/LC08/C01/T1_SR/LC08_138030_20200727 | 30 m | |
| 2021 | I | LANDSAT/LC08/C02/T1_L2/LC08_142030_20210912 | 30 m |
| II | LANDSAT/LC08/C02/T1_L2/LC08_141030_20210905 | 30 m | |
| III | LANDSAT/LC08/C02/T1_L2/LC08_139030_20210822 | 30 m | |
| IV | LANDSAT/LC08/C02/T1_L2/LC08_138030_20210916 | 30 m | |
| 2022 | I | LANDSAT/LC08/C02/T1_L2/LC08_142030_20220814 | 30 m |
| II | LANDSAT/LC08/C02/T1_L2/LC08_141030_20220908 | 30 m | |
| III | LANDSAT/LC08/C02/T1_L2/LC08_139030_20220622 | 30 m | |
| IV | LANDSAT/LC08/C02/T1_L2/LC08_138030_20220615 | 30 m |
References
- Dahe, Q.; Cunde, X.; Yongjian, D.; Tandong, Y.; Lingen, B.; Jiawen, R.; Ninglian, W.; Shiyin, L.; Lin, Z. Progress on cryospheric studies by international and Chinese communities and perspectives. J. Appl. Meteorol. Sci. 2006, 17, 649–656. [Google Scholar] [CrossRef]
- Ding, Y.; Xiao, C. Challenges in the study of cryospheric changes and their impacts. Adv. Earth Sci. 2013, 28, 1067. [Google Scholar] [CrossRef]
- Qin, D.; Ding, Y. Cryospheric changes and their impacts: Present, trends and key issues. Adv. Clim. Chang. Res. 2009, 5, 187–195. [Google Scholar] [CrossRef]
- Owen, L.A.; Thackray, G.; Anderson, R.S.; Briner, J.; Kaufman, D.; Roe, G.; Pfeffer, W.; Yi, C. Integrated research on mountain glaciers: Current status, priorities and future prospects. Geomorphology 2009, 103, 158–171. [Google Scholar] [CrossRef]
- Hock, R.; Rasul, G.; Adler, C.; Cáceres, B.; Gruber, S.; Hirabayashi, Y.; Jackson, M.; Kääb, A.; Kang, S.; Kutuzov, S. High mountain areas. In IPCC Special Report on the Ocean and Cryosphere in a Changing Climate; Pörtner, H.-O., Roberts, D.C., Masson-Delmotte, V., Zhai, P., Tignor, M., Poloczanska, E., Mintenbeck, K., Alegría, A., Nicolai, M., Okem, A., et al., Eds.; Cambridge University Press: Cambridge, UK, 2019; pp. 131–202. [Google Scholar] [CrossRef]
- Radić, V.; Bliss, A.; Beedlow, A.C.; Hock, R.; Miles, E.; Cogley, J.G. Regional and global projections of twenty-first century glacier mass changes in response to climate scenarios from global climate models. Clim. Dyn. 2014, 42, 37–58. [Google Scholar] [CrossRef]
- Han, P.; Long, D.; Zhao, F.; Slater, L.J. Response of two glaciers in different climate settings of the Tibetan plateau to climate change through year 2100 using a hybrid modeling approach. Water Resour. Res. 2023, 59, e2022WR033618. [Google Scholar] [CrossRef]
- Hugonnet, R.; McNabb, R.; Berthier, E.; Menounos, B.; Nuth, C.; Girod, L.; Farinotti, D.; Huss, M.; Dussaillant, I.; Brun, F. Accelerated global glacier mass loss in the early twenty-first century. Nature 2021, 592, 726–731. [Google Scholar] [CrossRef]
- Kulp, S.A.; Strauss, B.H. New elevation data triple estimates of global vulnerability to sea-level rise and coastal flooding. Nat. Commun. 2019, 10, 4844. [Google Scholar] [CrossRef]
- Sun, M.; Liu, S.; Yao, X.; Guo, W.; Xu, J. Glacier changes in the Qilian Mountains in the past half-century: Based on the revised First and Second Chinese Glacier Inventory. J. Geogr. Sci. 2018, 28, 206–220. [Google Scholar] [CrossRef]
- Mu, J.; Li, Z.; Zhang, H.; Liang, P. The global glacierized area: Current situation and recent change, based on the Randolph Glacier Inventory (RGI 6.0) published in 2017. J. Glaciol. Geocryol. 2018, 40, 238–248. [Google Scholar]
- Yan, L.; Gao, J.; Wang, J.; Hao, X. Glacier mapping based on GF-1 satellite remote sensing. J. Glaciol. Geocryol. 2020, 42, 1400–1406. [Google Scholar] [CrossRef]
- Wang, S.; Zhang, M.; Li, Z.; Wang, F.; Li, H.; Li, Y.; Huang, X. Glacier area variation and climate change in the Chinese Tianshan Mountains since 1960. J. Geogr. Sci. 2011, 21, 263–273. [Google Scholar] [CrossRef]
- Liu, Q.; Liu, S. Response of glacier mass balance to climate change in the Tianshan Mountains during the second half of the twentieth century. Clim. Dyn. 2016, 46, 303–316. [Google Scholar] [CrossRef]
- Ye, B.; Yang, D.; Jiao, K.; Han, T.; Jin, Z.; Yang, H.; Li, Z. The Urumqi River source glacier No. 1, Tianshan, China: Changes over the past 45 years. Geophys. Res. Lett. 2005, 32. [Google Scholar] [CrossRef]
- Wang, X.; Ding, Y.; Liu, S.; Jiang, L.; Wu, K.; Jiang, Z.; Guo, W. Changes of glacial lakes and implications in Tian Shan, central Asia, based on remote sensing data from 1990 to 2010. Environ. Res. Lett. 2013, 8, 044052. [Google Scholar] [CrossRef]
- Li, Y.; Li, Y.; Harbor, J.; Liu, G.; Yi, C.; Caffee, M.W. Cosmogenic 10Be constraints on Little Ice Age glacial advances in the eastern Tian Shan, China. Quat. Sci. Rev. 2016, 138, 105–118. [Google Scholar] [CrossRef]
- Wu, G.; Zhang, C.; Zhang, X.; Xu, T.; Yan, N.; Gao, S. The environmental implications for dust in high-alpine snow and ice cores in Asian mountains. Glob. Planet. Change 2015, 124, 22–29. [Google Scholar] [CrossRef]
- Lee, X.; Qin, D.; Jiang, G.; Duan, K.; Zhou, H. Atmospheric pollution of a remote area of Tianshan Mountain: Ice core record. J. Geophys. Res. Atmos. 2003, 108. [Google Scholar] [CrossRef]
- Li, Y. Glacier changes and their linkage to the climate-topographic context in the Borohoro Mountains, Tian Shan 1977–2018. Water 2020, 12, 1502. [Google Scholar] [CrossRef]
- Wang, H.; Xu, C.; Ying, G.; Liu, F.; Long, Y. Variations in glacier runoff contributed by the increased negative mass balance over the last forty years in the Tien Shan Mountains. Water 2022, 14, 1006. [Google Scholar] [CrossRef]
- Wu, G.; Zhang, S.; Wang, Z. Retreat and advance of modern glaciers in Bogda, Tianshan. J. Glaciol. Geocryol. 1983, 5, 143–152. [Google Scholar] [CrossRef]
- Li, K.; Li, Z.; Wang, C.; Huai, B. Shrinkage of Mt. Bogda Glaciers of Eastern Tian Shan in Central Asia during 1962–2006. J. Earth Sci. 2016, 27, 139–150. [Google Scholar] [CrossRef]
- Zhang, C.; Yao, X.; Liu, S.; Zhang, D.; Xu, J. Variation of glacier length in the Altun Mountains during 1970–2016. J. Glaciol. Geocryol. 2021, 43, 49–60. [Google Scholar] [CrossRef]
- Yang, X.; Zhao, J.; Han, H. Study on glacier mass balance in the Karlik Range, East Tianshan Mountains, 1972–2016. J. Glaciol. Geocryol. 2019, 41, 7–17. [Google Scholar] [CrossRef]
- Yang, B.; Zhang, L.; Gao, Y.; Xiang, Y.; Mou, N.; Suo, L. An integrated method of glacier length extraction based on Gaofen satellite data. J. Glaciol. Geocryol. 2016, 38, 1615–1623. [Google Scholar] [CrossRef]
- Wang, Y.; Hou, S.; Liu, Y. Glacier changes in the Karlik Shan, eastern Tien Shan, during 1971/72–2001/02. Ann. Glaciol. 2009, 50, 39–45. [Google Scholar] [CrossRef]
- Zhou, M.; Xu, S.; Wang, Y.; Wang, Y.; Hou, S. Recent 50-Year Glacier Mass Balance Changes over the Yellow River Source Region, Determined by Remote Sensing. Remote Sens. 2022, 14, 6286. [Google Scholar] [CrossRef]
- Engelhardt, M.; Schuler, T.V.; Andreassen, L.M. Glacier mass balance of Norway 1961-2010 calculated by a temperature-index model. Ann. Glaciol. 2013, 54, 32–40. [Google Scholar] [CrossRef]
- Maussion, F.; Butenko, A.; Champollion, N.; Dusch, M.; Eis, J.; Fourteau, K.; Gregor, P.; Jarosch, A.H.; Landmann, J.; Oesterle, F.; et al. The Open Global Glacier Model (OGGM) v1.1. Geosci. Model Dev. 2019, 12, 909–931. [Google Scholar] [CrossRef]
- Zhang, Q.; Yan, M.; Zhang, L.; Shao, W.; Chen, Y.; Dong, Y. Three Decades of Oasis Transition and Its Driving Factors in Turpan–Hami Basin in Xinjiang, China: A Complex Network Approach. Remote Sens. 2024, 16, 465. [Google Scholar] [CrossRef]
- Li, J.; Yang, T.; He, Y. Response of glacier retreat to climate in Eastern Tianshan from 1990–2011. Res. Soil Water Conserv. 2014, 21, 212–216. [Google Scholar] [CrossRef]
- Lange, S.; Menz, C.; Gleixner, S.; Cucchi, M.; Weedon, G.P.; Amici, A.; Bellouin, N.; Schmied, H.M.; Hersbach, H.; Buontempo, C. WFDE5 over Land Merged with ERA5 over the Ocean (W5E5 v2.0); ISIMIP Repository: Lisbon, Portugal, 2021. [Google Scholar] [CrossRef]
- Peng, S. 1-km Monthly Mean Temperature Dataset for China (1901–2022); National Tibetan Plateau Data Center: Beijing, China, 2019. [Google Scholar] [CrossRef]
- Peng, S. 1-km Monthly Precipitation Dataset for China (1901–2020); National Tibetan Plateau Data Center: Beijing, China, 2020. [Google Scholar] [CrossRef]
- Wang, K. Homogeneous Grid Dataset of Chinaese Land Surface Observation (Surface Solar Radiation, Surface Wind Speed, Relative Humidity and Land Surface Evapotranspiration); National Tibetan Plateau Data Center: Beijing, China, 2022. [Google Scholar] [CrossRef]
- Muñoz-Sabater, J.; Dutra, E.; Agustí-Panareda, A.; Albergel, C.; Arduini, G.; Balsamo, G.; Boussetta, S.; Choulga, M.; Harrigan, S.; Hersbach, H. ERA5-Land: A state-of-the-art global reanalysis dataset for land applications. Earth Syst. Sci. Data 2021, 13, 4349–4383. [Google Scholar] [CrossRef]
- Arendt, A.; Bliss, A.; Bolch, T.; Cogley, J.; Gardner, A.; Hagen, J.-O.; Hock, R.; Huss, M.; Kaser, G.; Kienholz, C. Randolph Glacier Inventory—A Dataset of Global Glacier Outlines: Version 6.0: Technical Report, Global Land Ice Measurements from Space; National Snow and Ice Data Center: Boulder, CO, USA, 2017. [Google Scholar] [CrossRef]
- Paul, F. Evaluation of different methods for glacier mapping using Landsat TM. EARSeL Eproceedings 2000, 1, 239–245. [Google Scholar]
- McFeeters, S.K. The use of the Normalized Difference Water Index (NDWI) in the delineation of open water features. Int. J. Remote Sens. 1996, 17, 1425–1432. [Google Scholar] [CrossRef]
- Kienholz, C.; Rich, J.; Arendt, A.; Hock, R. A new method for deriving glacier centerlines applied to glaciers in Alaska and northwest Canada. Cryosphere 2014, 8, 503–519. [Google Scholar] [CrossRef]
- Cuffey, K.M.; Paterson, W.S.B. The Physics of Glaciers; Academic Press: Cambridge, MA, USA, 2010. [Google Scholar]
- Glen, J.W. The creep of polycrystalline ice. Proc. R. Soc. Lond. Ser. A Math. Phys. Sci. 1955, 228, 519–538. [Google Scholar] [CrossRef]
- Wang, S.; Zhang, M.; Li, Z.; Wang, F.; Li, H.; Li, Y.; Huang, X. Response of glacier area variation to climate change in Chinese Tianshan Mountains in the past 50 years. Acta Geogr. Sin. 2011, 66, 38r46. [Google Scholar] [CrossRef]
- Ji, Q.; Dong, J.; Liu, R.; Xiao, Z.; Yang, T. Glacier changes in response to climate change in the Himalayas in 1990–2015. Sci. Geogr. Sin. 2020, 40, 486–496. [Google Scholar] [CrossRef]
- Zhao, H.; Wang, X.; Zhao, X.; Guo, W.; Liu, S.; Wei, J.; Zhang, Y. Analysis of glacier changes in China from 2008 to 2018. J. Glaciol. Geocryol. 2021, 43, 976–998. [Google Scholar] [CrossRef]
- Paul, F.; Barrand, N.E.; Baumann, S.; Berthier, E.; Bolch, T.; Casey, K.; Frey, H.; Joshi, S.; Konovalov, V.; Le Bris, R. On the accuracy of glacier outlines derived from remote-sensing data. Ann. Glaciol. 2013, 54, 171–182. [Google Scholar] [CrossRef]
- Wang, X.; Guo, X.; Yang, C.; Liu, Q.; Wei, J.; Zhang, Y.; Liu, S.; Zhang, Y.; Jiang, Z.; Tang, Z. Glacial lake inventory of high-mountain Asia in 1990 and 2018 derived from Landsat images. Earth Syst. Sci. Data 2020, 12, 2169–2182. [Google Scholar] [CrossRef]
- Hanshaw, M.N.; Bookhagen, B. Glacial areas, lake areas, and snow lines from 1975 to 2012: Status of the Cordillera Vilcanota, including the Quelccaya Ice Cap, northern central Andes, Peru. Cryosphere 2014, 8, 359–376. [Google Scholar] [CrossRef]
- Yao, X.; Liu, S.; Zhu, Y.; Gong, P.; An, L.; Li, X. Design and implementation of an automatic method for deriving glacier centerlines based on GIS. J. Glaciol. Geocryol. 2015, 37, 1563–1570. [Google Scholar]
- Zhou, S.; Yao, X.; Zhang, D.; Zhang, Y.; Liu, S.; Min, Y. Remote sensing monitoring of advancing and surging glaciers in the Tien Shan, 1990–2019. Remote Sens. 2021, 13, 1973. [Google Scholar] [CrossRef]
- Xiao, L.; Li, S.; Wu, K.; Liu, S.; Zhu, Y.; Afzal, M.M.; Zhou, J.; Yi, Y.; Wei, J.; Duan, Y. A Geodetic-Data-Calibrated Ice Flow Model to Simulate Historical and Future Response of Glaciers in Southeastern Tibetan Plateau. Remote Sens. 2024, 16, 522. [Google Scholar] [CrossRef]
- Le Bris, R.; Paul, F. An automatic method to create flow lines for determination of glacier length: A pilot study with Alaskan glaciers. Comput. Geosci. 2013, 52, 234–245. [Google Scholar] [CrossRef]
- Hagg, W.; Mayer, C.; Lambrecht, A.; Kriegel, D.; Azizov, E. Glacier changes in the big Naryn basin, Central Tian Shan. Glob. Planet. Change 2013, 110, 40–50. [Google Scholar] [CrossRef]
- Huybers, K.; Roe, G.H. Spatial patterns of glaciers in response to spatial patterns in regional climate. J. Clim. 2009, 22, 4606–4620. [Google Scholar] [CrossRef]
- Zhang, Y.; Gao, T.; Kang, S.; Shangguan, D.; Luo, X. Albedo reduction as an important driver for glacier melting in Tibetan Plateau and its surrounding areas. Earth-Sci. Rev. 2021, 220, 103735. [Google Scholar] [CrossRef]
- Li, Q.; Chen, Y.; Shen, Y.; Li, X.; Xu, J. Spatial and temporal trends of climate change in Xinjiang, China. J. Geogr. Sci. 2011, 21, 1007–1018. [Google Scholar] [CrossRef]
- Huang, X.; Bao, A.; Guo, H.; Meng, F.; Zhang, P.; Zheng, G.; Yu, T.; Qi, P.; Nzabarinda, V.; Du, W. Spatiotemporal changes of typical glaciers and their responses to climate change in Xinjiang, Northwest China. J. Arid Land 2022, 14, 502–520. [Google Scholar] [CrossRef]
- Qian, Y.; Wu, S.; Wu, Z. Changes of glacier resource in Karlik Mountain in the last 50 years and the measures of protection. Arid Land Geogr. 2011, 34, 719–725. [Google Scholar] [CrossRef]
- Huang, X.; Bao, A.; Guo, H.; Meng, F.; Zhang, P. Change of typical glaciers and its response to meteorological factors in the eastern Tianshan Mountains in China in recent 20 years. Arid Zone Res. 2017, 34, 870–880. [Google Scholar] [CrossRef]
- Xuewen, Y.; Ninglian, W.; Qian, L.; An’an, C. Glacier changes on the north slope of Tianshan Mountains in recent 60 years. Arid Land Geogr. 2023, 46, 1073–1083. [Google Scholar]
- Masson-Delmotte, V.; Zhai, P.; Pirani, A.; Connors, S.L.; Péan, C.; Berger, S.; Caud, N.; Chen, Y.; Goldfarb, L.; Gomis, M. Climate Change 2021: The Physical Science Basis; Working Group I Contribution to the Sixth Assessment Report of the Intergovernmental Panel on Climate Change; Cambridge University Press: Cambridge, UK, 2021; Volume 2. [Google Scholar] [CrossRef]
- Zhuang, L.; Ke, C.; Cai, Y.; Nourani, V. Measuring glacier changes in the Tianshan Mountains over the past 20 years using Google Earth Engine and machine learning. J. Geogr. Sci. 2023, 33, 1939–1964. [Google Scholar] [CrossRef]
- Grant, K.; Rohling, E.; Bar-Matthews, M.; Ayalon, A.; Medina-Elizalde, M.; Ramsey, C.B.; Satow, C.; Roberts, A. Rapid coupling between ice volume and polar temperature over the past 150,000 years. Nature 2012, 491, 744–747. [Google Scholar] [CrossRef]
- Armour, K.C.; Bitz, C.M.; Thompson, L.; Hunke, E.C. Controls on Arctic sea ice from first-year and multiyear ice survivability. J. Clim. 2011, 24, 2378–2390. [Google Scholar] [CrossRef]
- Zhang, J.; Steele, M.; Schweiger, A. Arctic sea ice response to atmospheric forcings with varying levels of anthropogenic warming and climate variability. Geophys. Res. Lett. 2010, 37, L20505. [Google Scholar] [CrossRef]
Disclaimer/Publisher’s Note: The statements, opinions and data contained in all publications are solely those of the individual author(s) and contributor(s) and not of MDPI and/or the editor(s). MDPI and/or the editor(s) disclaim responsibility for any injury to people or property resulting from any ideas, methods, instructions or products referred to in the content. |
© 2025 by the authors. Licensee MDPI, Basel, Switzerland. This article is an open access article distributed under the terms and conditions of the Creative Commons Attribution (CC BY) license (https://creativecommons.org/licenses/by/4.0/).