Article

Carbon Accounting in Construction Engineering: Methodology and Applications

1
Research Center of Coastal and Urban Geotechnical Engineering, Zhejiang University, Hangzhou 310058, China
2
Zhejiang University-Zhejiang Communications Construction Collaborative Innovation Joint Research Center, Hangzhou 310058, China
3
Computing Center of Geotechnical Engineering, Zhejiang University, Hangzhou 310058, China
4
Zhejiang Communications Construction Group Co., Ltd., Hangzhou 311305, China
5
Zhejiang Communications Construction Underground Engineering Co., Ltd., Hangzhou 311305, China
*
Author to whom correspondence should be addressed.
Sustainability 2025, 17(11), 5090; https://doi.org/10.3390/su17115090
Submission received: 4 March 2025 / Revised: 16 May 2025 / Accepted: 20 May 2025 / Published: 1 June 2025
(This article belongs to the Special Issue Green Building: CO2 Emissions in the Construction Industry)

Abstract

In the context of global carbon peak and carbon neutrality, this work proposes a carbon accounting method for construction project based on life-cycle assessment (LCA) and construction cost quota. By incorporating national standards, relevant databases and publications, three major global carbon accounting databases—ICE, EU-EFDB, and IPCC-EFDB—were expanded to enable each database to independently perform full life-cycle carbon accounting for specific construction projects in China. The method is capable of flexibly selecting different databases and quantifying the carbon emissions of construction projects, by directly importing bill of quantities. Finally, a web-based carbon accounting tool was developed, and three databases were used to conduct full life-cycle carbon accounting on real-world construction projects, to verify the feasibility of the proposed method and compare the carbon accounting results across different databases. Our study showed that, although there were discrepancies in carbon emission estimation across different stages and processes for the construction projects, the proportions of carbon emissions at each stage and process were relatively consistent.

1. Introduction

With the growing global challenges posed by climate change, reducing greenhouse gas emissions has become a critical priority for nations worldwide [1]. In line with the international commitments, China officially introduced the “Dual Carbon Objectives” in 2020, setting goals to reach carbon peak by 2030 and carbon neutrality by 2060 [2]. Within this framework, the construction sector, a major contributor to global energy-related emissions, faces significant pressure to transition to low-carbon practices [3]. Coherent carbon accounting systems for construction projects serve three essential functions: (1) providing empirical support for climate policy development, (2) driving industry-wide decarbonization through standardized measurement protocols, and (3) enabling organizations to assess their emission profiles, implement targeted carbon emission mitigation strategies, and enhance sustainability-driven competitiveness. These multifaceted benefits highlight the methodological and practical importance of establishing robust carbon quantification systems to meet climate targets while promoting green economic growth.
Life-cycle assessment (LCA) is a systematic environmental evaluation tool that plays a crucial role in quantifying carbon emission in construction projects [4,5,6,7,8,9]. This method is capable of evaluating environmental impacts throughout the entire life-cycle of products, processes, and services—from raw material extraction to final disposal—enabling the identification of carbon emission sources at distinct life-cycle stages and supporting targeted mitigation strategies [10,11,12]. Current studies mainly focus on LCA carbon emissions calculation for different types of building projects, covering various stages from material production, on-site construction, operation, to demolition. For example, Warrier et al. [13] classified the sources of uncertainty in building LCA based on a review of 48 global case studies. Kamali et al. [14] conducted a carbon accounting analysis of traditional and modular construction methods, and developed carbon emission impact indices through the Analytic Hierarchy Process (AHP) framework. Liu et al. [15] established energy consumption and carbon emission models for asphalt mixtures, and analyzed the impacts of environmental temperature, humidity, initial and heating temperatures, and aggregate types on energy consumption and carbon emissions. Guo et al. [16] developed a carbon emission accounting framework for the construction of subway tunnels, demonstrated that utilizing recycled materials and enhancing machinery efficiency can lead to significant emission reductions. Li et al. [17] established a carbon accounting model for prefabricated concrete stairs, and found a linear relationship between total carbon emissions and building height, prefabricated stair volume, and prefabricated stair cost. Xu et al. [18] proposed an improved carbon emission estimation method by considering the embodied carbon and incorporating factors such as load rates, human energy consumption, and construction delays, allowing for a more systematic evaluation of carbon emissions during the construction stage of prefabricated buildings. Zou et al. [19] showed that the prefabricated inverted arch construction technology reduces carbon emissions by more than 15% compared to traditional cast-in-place construction, mainly through optimizing structural design and transportation models to reduce material production and transportation emissions. Chen et al. [20] developed a systematic framework to evaluate the carbon emissions of Tunnel Boring Machines (TBM) in tunnel construction, optimizing the sustainability of underground infrastructure through digital modeling and carbon assessment standards. Li et al. [21] studied the carbon emissions precast concrete piles, finding that carbon emissions from construction machinery accounted for 73% of the total emissions, and established a linear relationship between carbon emissions and pile foundation area, cost, and amount. Although existing carbon accounting studies have been applied to various stages of building projects, they still cannot comprehensively describe the impact of construction factors such as machinery, materials, and labor on carbon emissions in the current analysis of carbon emission sources in construction engineering. Therefore, there is an urgent need for an LCA carbon accounting method that reflects the entire “construction project—sub-project—item project” hierarchical structure, incorporating the construction process, to provide a more detailed carbon emission assessment for the construction projects.
The reliability of carbon accounting results is closely tied to the quality of carbon emission factor databases. In recent years, numerous studies have used national or regional carbon emission factor databases to calculate carbon emissions for construction engineering. For example, Kaitouni et al. [22] used the Inventory of Carbon and Energy (ICE) to evaluate the 50-year carbon emission profile for a zero-carbon solar-powered earth-based building, revealing that operational emissions accounted for as much as 93% of the total. Kuru et al. [23] employed the Carbon Risk Real Estate Monitor (CRREM) database to assess the alignment between building’s energy use intensity and decarbonization pathways. Fenton et al. [24] used the Embodied Carbon of European Buildings database and machine learning method to develop a predictive model for embodied carbon emissions in early building design stages, facilitating carbon emissions analysis and targeted reduction strategies. Martin-Valmayor et al. [25] used the Emission Database for Global Atmospheric Research (EDGAR) to estimate carbon emissions across different sectors in U.S. from 1970 to 2022, identifying long-term emission trends and structural changes in construction sector. Zhang et al. [26] proposed a national-level carbon assessment workflow to demonstrate changes in embodied carbon emissions of Swiss residential buildings from 2015 to 2055, by using the Swiss national building LCA databases. However, these databases are often designed for specific building types, and cannot systematically support the complex and diverse demands of carbon accounting under varying construction conditions in different countries. Therefore, researchers have attempted to study customized carbon emission factor databases tailored to specific construction projects in specific regions. For example, Karlsson et al. [27] explored the construction of a full life-cycle carbon emission factor database for Swedish multi-family buildings, covering stages from material production to building demolition. Luo et al. [28] examined reinforced concrete residential and office buildings in southeastern China, using embodied carbon prediction models to estimate carbon emissions during material production and construction, and proposed a fundamental approach to establish carbon emission factor database for construction stage. Lasvaux et al. [29] compared product-specific Environmental Product Declaration (EPD) databases and ecoinvent generic databases in the context of French construction projects, highlighting significant differences in LCA results across countries and impact categories. However, a comprehensive carbon emission factor database, capable of encompassing all stages and components of the construction industry across different regions and countries, has not been well established yet.
Currently, various carbon accounting tools based on LCA method are widely used, including SimaPro, Umberto, Gabi, and Carbon e-Management and so on, as shown in Table 1. These tools have also been applied to carbon accounting for construction sector. For example, Arash et al. [30] used SimaPro to conduct LCA carbon emission comparisons between 3D printing and conventional construction methods in Canada, and found that the use of geo-polymer concrete in 3D printing was better than traditional approach in terms of carbon reduction. Iezzi et al. [31] used Umberto to compare the LCA carbon emissions of conventional masonry units, with those of biological concrete masonry units (BioCMU) based on microbiologically induced calcite precipitation (MICP) technology, showing better performance for BioCMU. Khan et al. [32] applied Gabi to evaluate the environmental impacts of construction and demolition waste (CDW)-based 3D printed structures, and found that these structures had lower carbon emissions than those made with ordinary cement or conventional masonry. The Carbon e-Management platform provides a SaaS-based solution suitable for small and medium-sized enterprises, but its emission factor database is relatively simple, and can only cover basic building materials [33]. However, these tools generally suffer from limitations in coverage and adaptability of their carbon emission factor databases, making them not suitable for construction projects involving complex processes or new building materials. Therefore, it is desirable to develop carbon accounting tool specifically designed for complex construction scenarios, in order to provide more systematic support for carbon emission assessment in construction sector.
Overall, current carbon accounting for construction projects exhibits significant gap in both methods and databases for software applications. In terms of methodology, although LCA is widely used, most studies cannot systematically calculate the contributions of carbon emission sources such as machinery, materials, and labor during the construction stage. In other words, there is a lack of carbon accounting methods that correspond to the construction process and can be refined to the sub-project and item project levels. In terms of database, existing carbon emission factor databases primarily focus on specific countries and building types, with limited coverage, and have yet to form a comprehensive carbon emission factor database that spans the entire lifecycle and accommodates various construction processes. Therefore, in terms of software implementation, these limitations make it difficult to meet the practical needs of carbon accounting for complex construction processes, hindering the accurate assessment of carbon reduction strategies in real-world construction projects.
To overcome those gaps, the proposed framework focuses on a systematic life-cycle carbon accounting method, following the principles of LCA in accordance with international standards of ISO 14040 [37]. It also incorporates carbon accounting analysis during the construction stage, using the Chinese Standard for Quantity Calculation of Housing Construction and Decoration Projects (GB/T 50854-2024) [38] and the Chinese Quotations for Highway Engineering Budgeting (JTG/T 3832-2018) [39]. Based on the bill of quantities, construction data related to equipment, materials, and labor are obtained and organized using a hierarchical structure, including construction project, sub-project, item project, and quota sub-item. By breaking down the project to the level of quota sub-items and referencing the corresponding quota standards, detailed carbon emission data for each specific task in the construction stage can be calculated. Combining quota data with bill of quantities enables a more systematic identification of emission sources during construction process. The methodology integrates three customized emission databases. The databases combine international references, such as the Inventory of Carbon and Energy (ICE) [40,41], European Environment Agency Emission Factor Database (EU-EFDB) [42,43] and Intergovernmental Panel on Climate Change Emission Factor Database (IPCC-EFDB) [44,45], with Chinese references, such as the Standard for Building Carbon Emission Calculation (GB/T 51366-2019) [46] and the China Products Carbon Footprint Factors Database (CPCD) [47]. This combination collectively covers a wide range of China-specific construction materials. Additionally, a web-based software for the Construction Project Carbon Accounting System (CPCAS) has been developed using PHP 8.1 and Node JS 18. This software addresses the limitations of traditional standalone systems by enabling multi-user online collaboration, data sharing, and real-time updates. This framework was then applied to three representative real-world construction projects in China, including a national highway project near Yuhang District (YH Highway), an expressway project in Zhejiang Province (ZJ Expressway), and a national highway project near Lin’an District (LA Highway). The purpose is to assess the results of automated carbon emission calculations and the feasibility of the proposed carbon accounting system in real-world construction projects. The results show that the proposed method is capable of calculating life-cycle carbon emissions for real-world construction projects.
Figure 1 summarizes the structure of the current paper, which is organized into five sections. Section 1 introduces the development of carbon accounting method, carbon emission factor databases and related software in the current literature. Section 2 details the creation of carbon accounting system including methods and databases. Section 3 covers the reconstruction of three customized carbon emission databases, integrating both Chinese and international standards. Section 4 applies the developed carbon accounting system to three construction projects, including YH Highway, ZJ Expressway and LA Highway, and analyzes their life-cycle carbon emission patterns. Section 5 presents a comparative analysis of the carbon emission results and discusses practical recommendations for reducing carbon emission.

2. Carbon Accounting Model and Database for Construction Projects

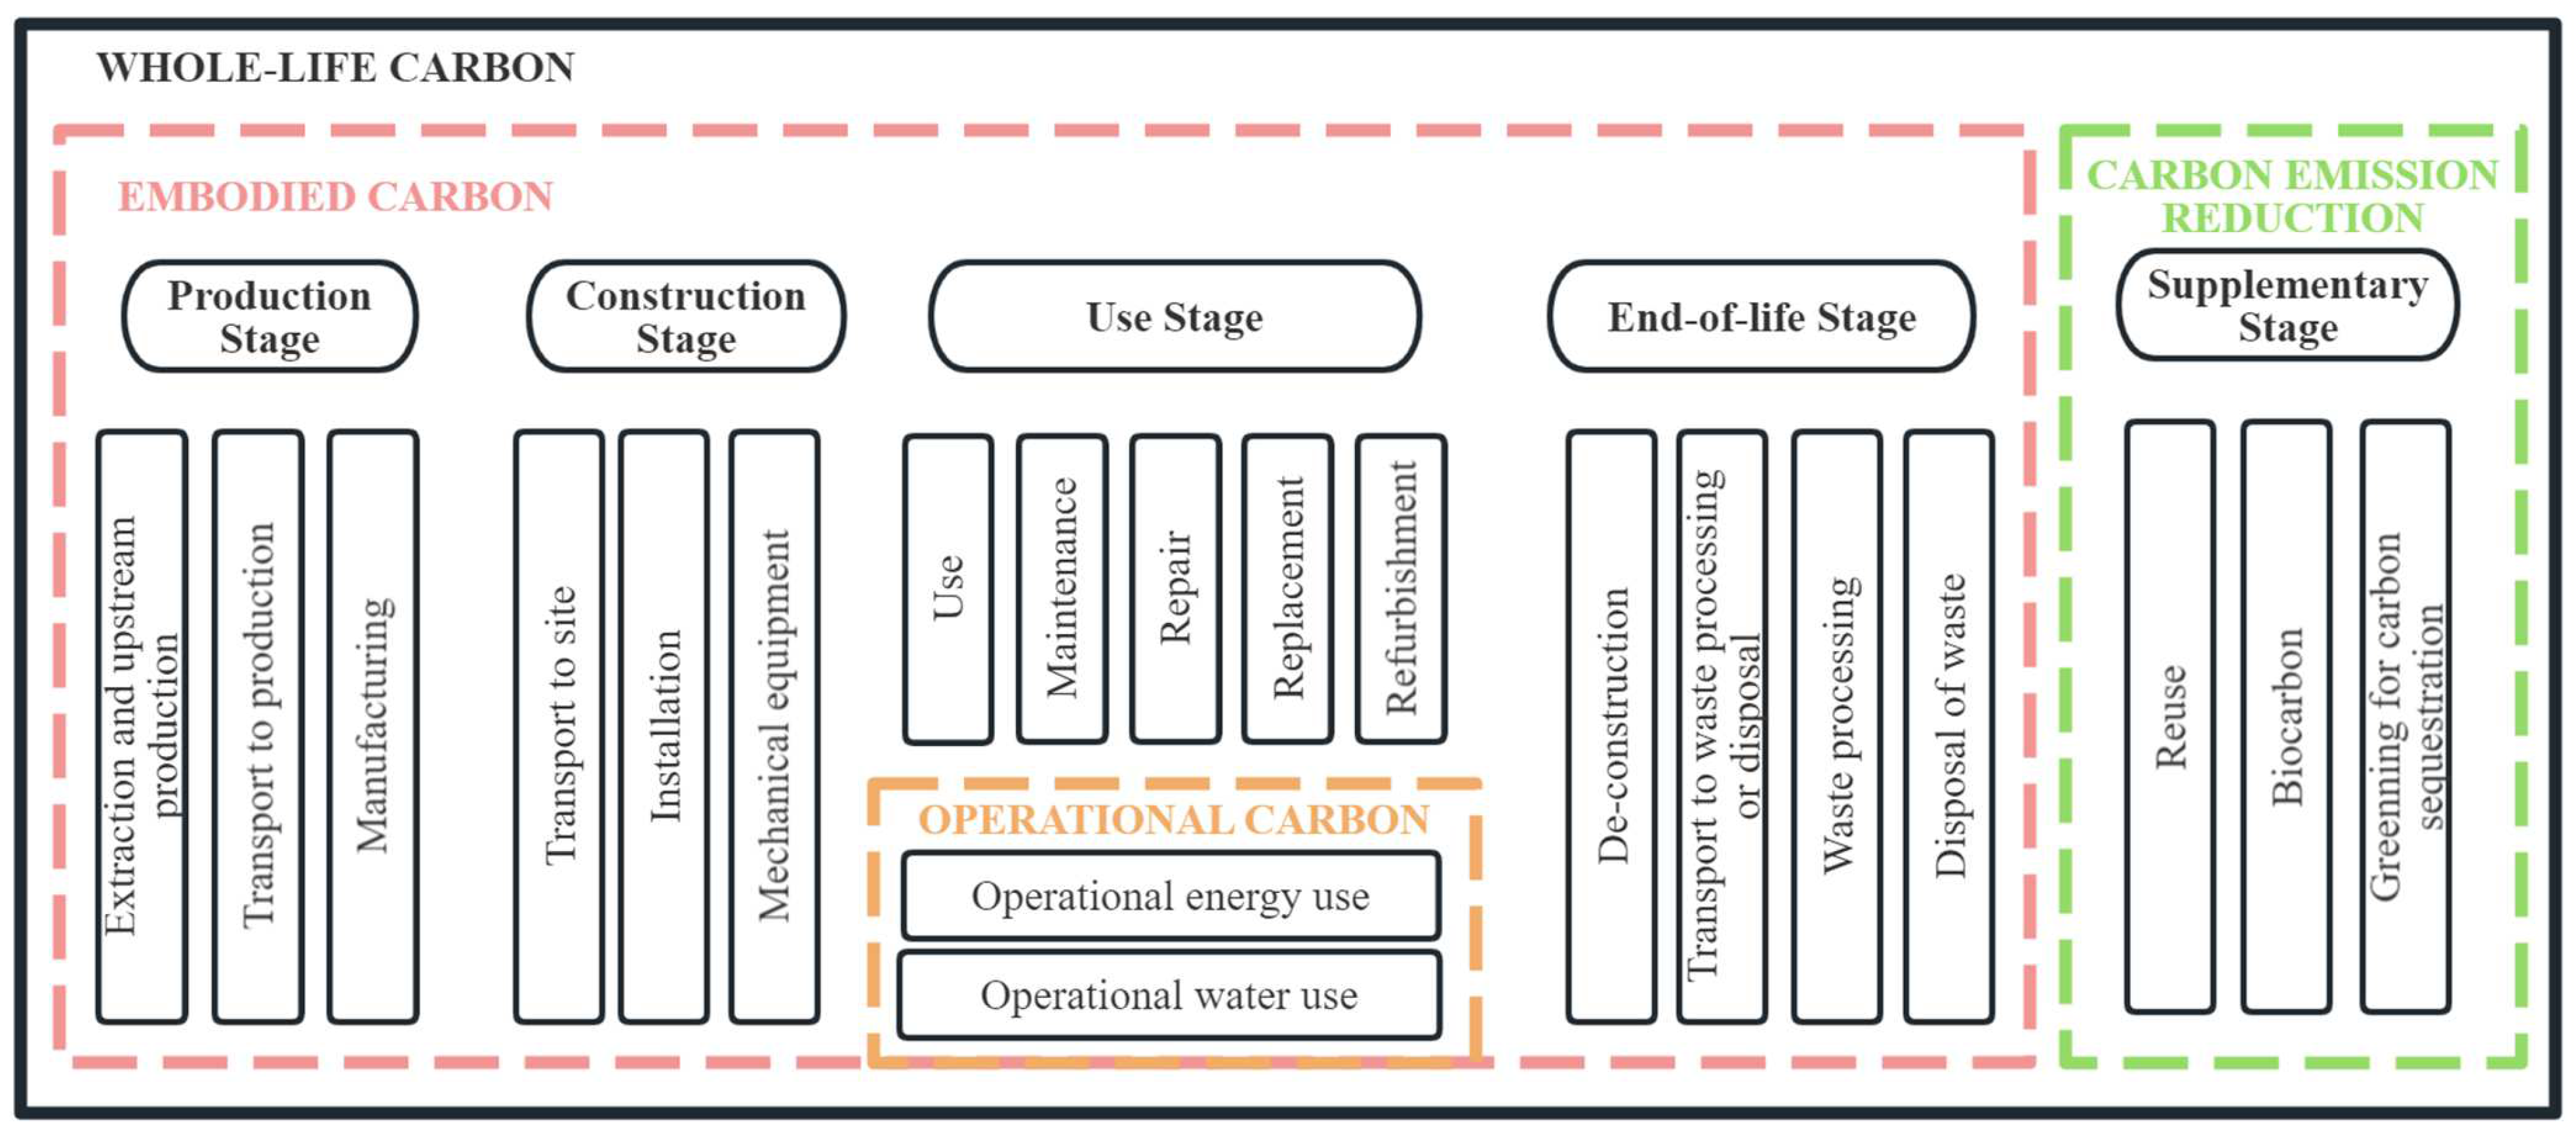
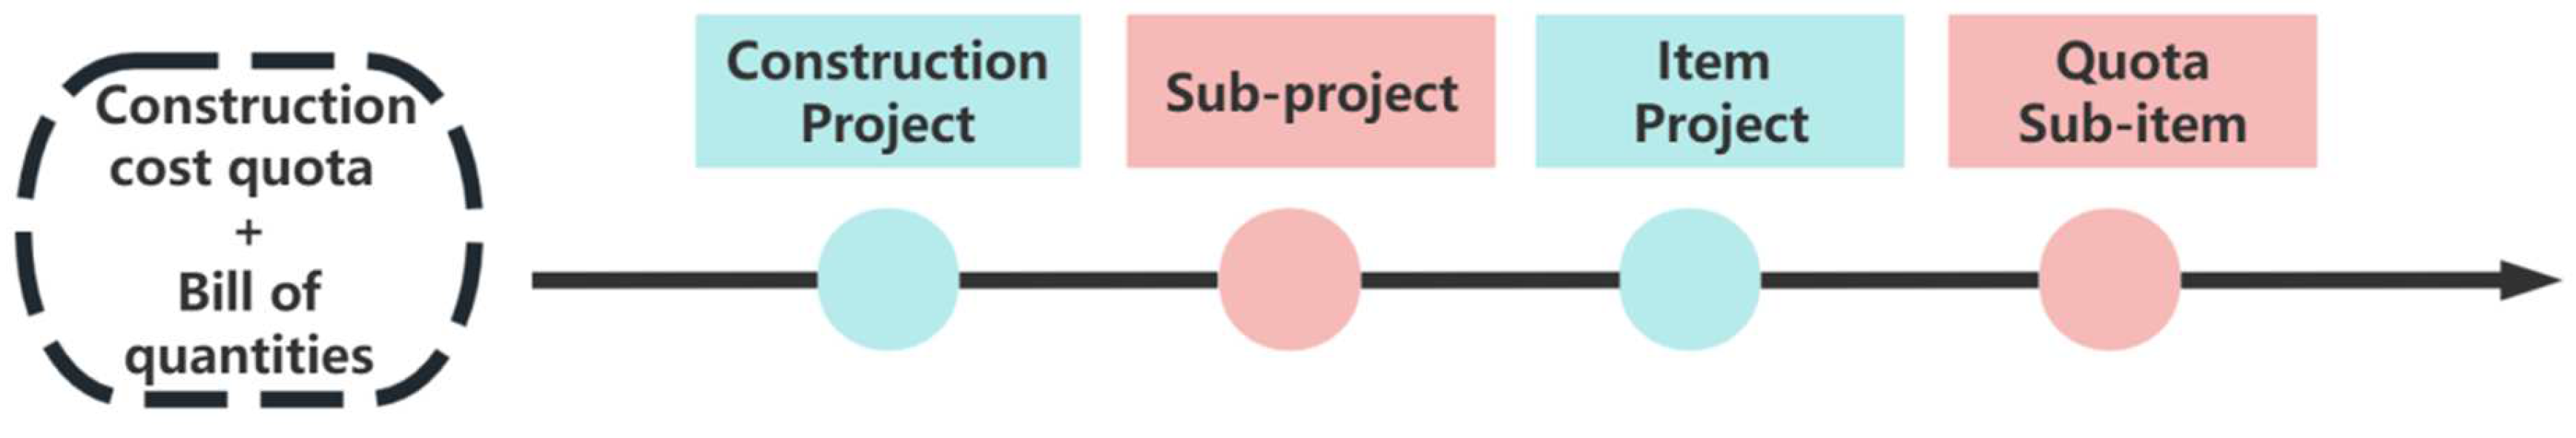
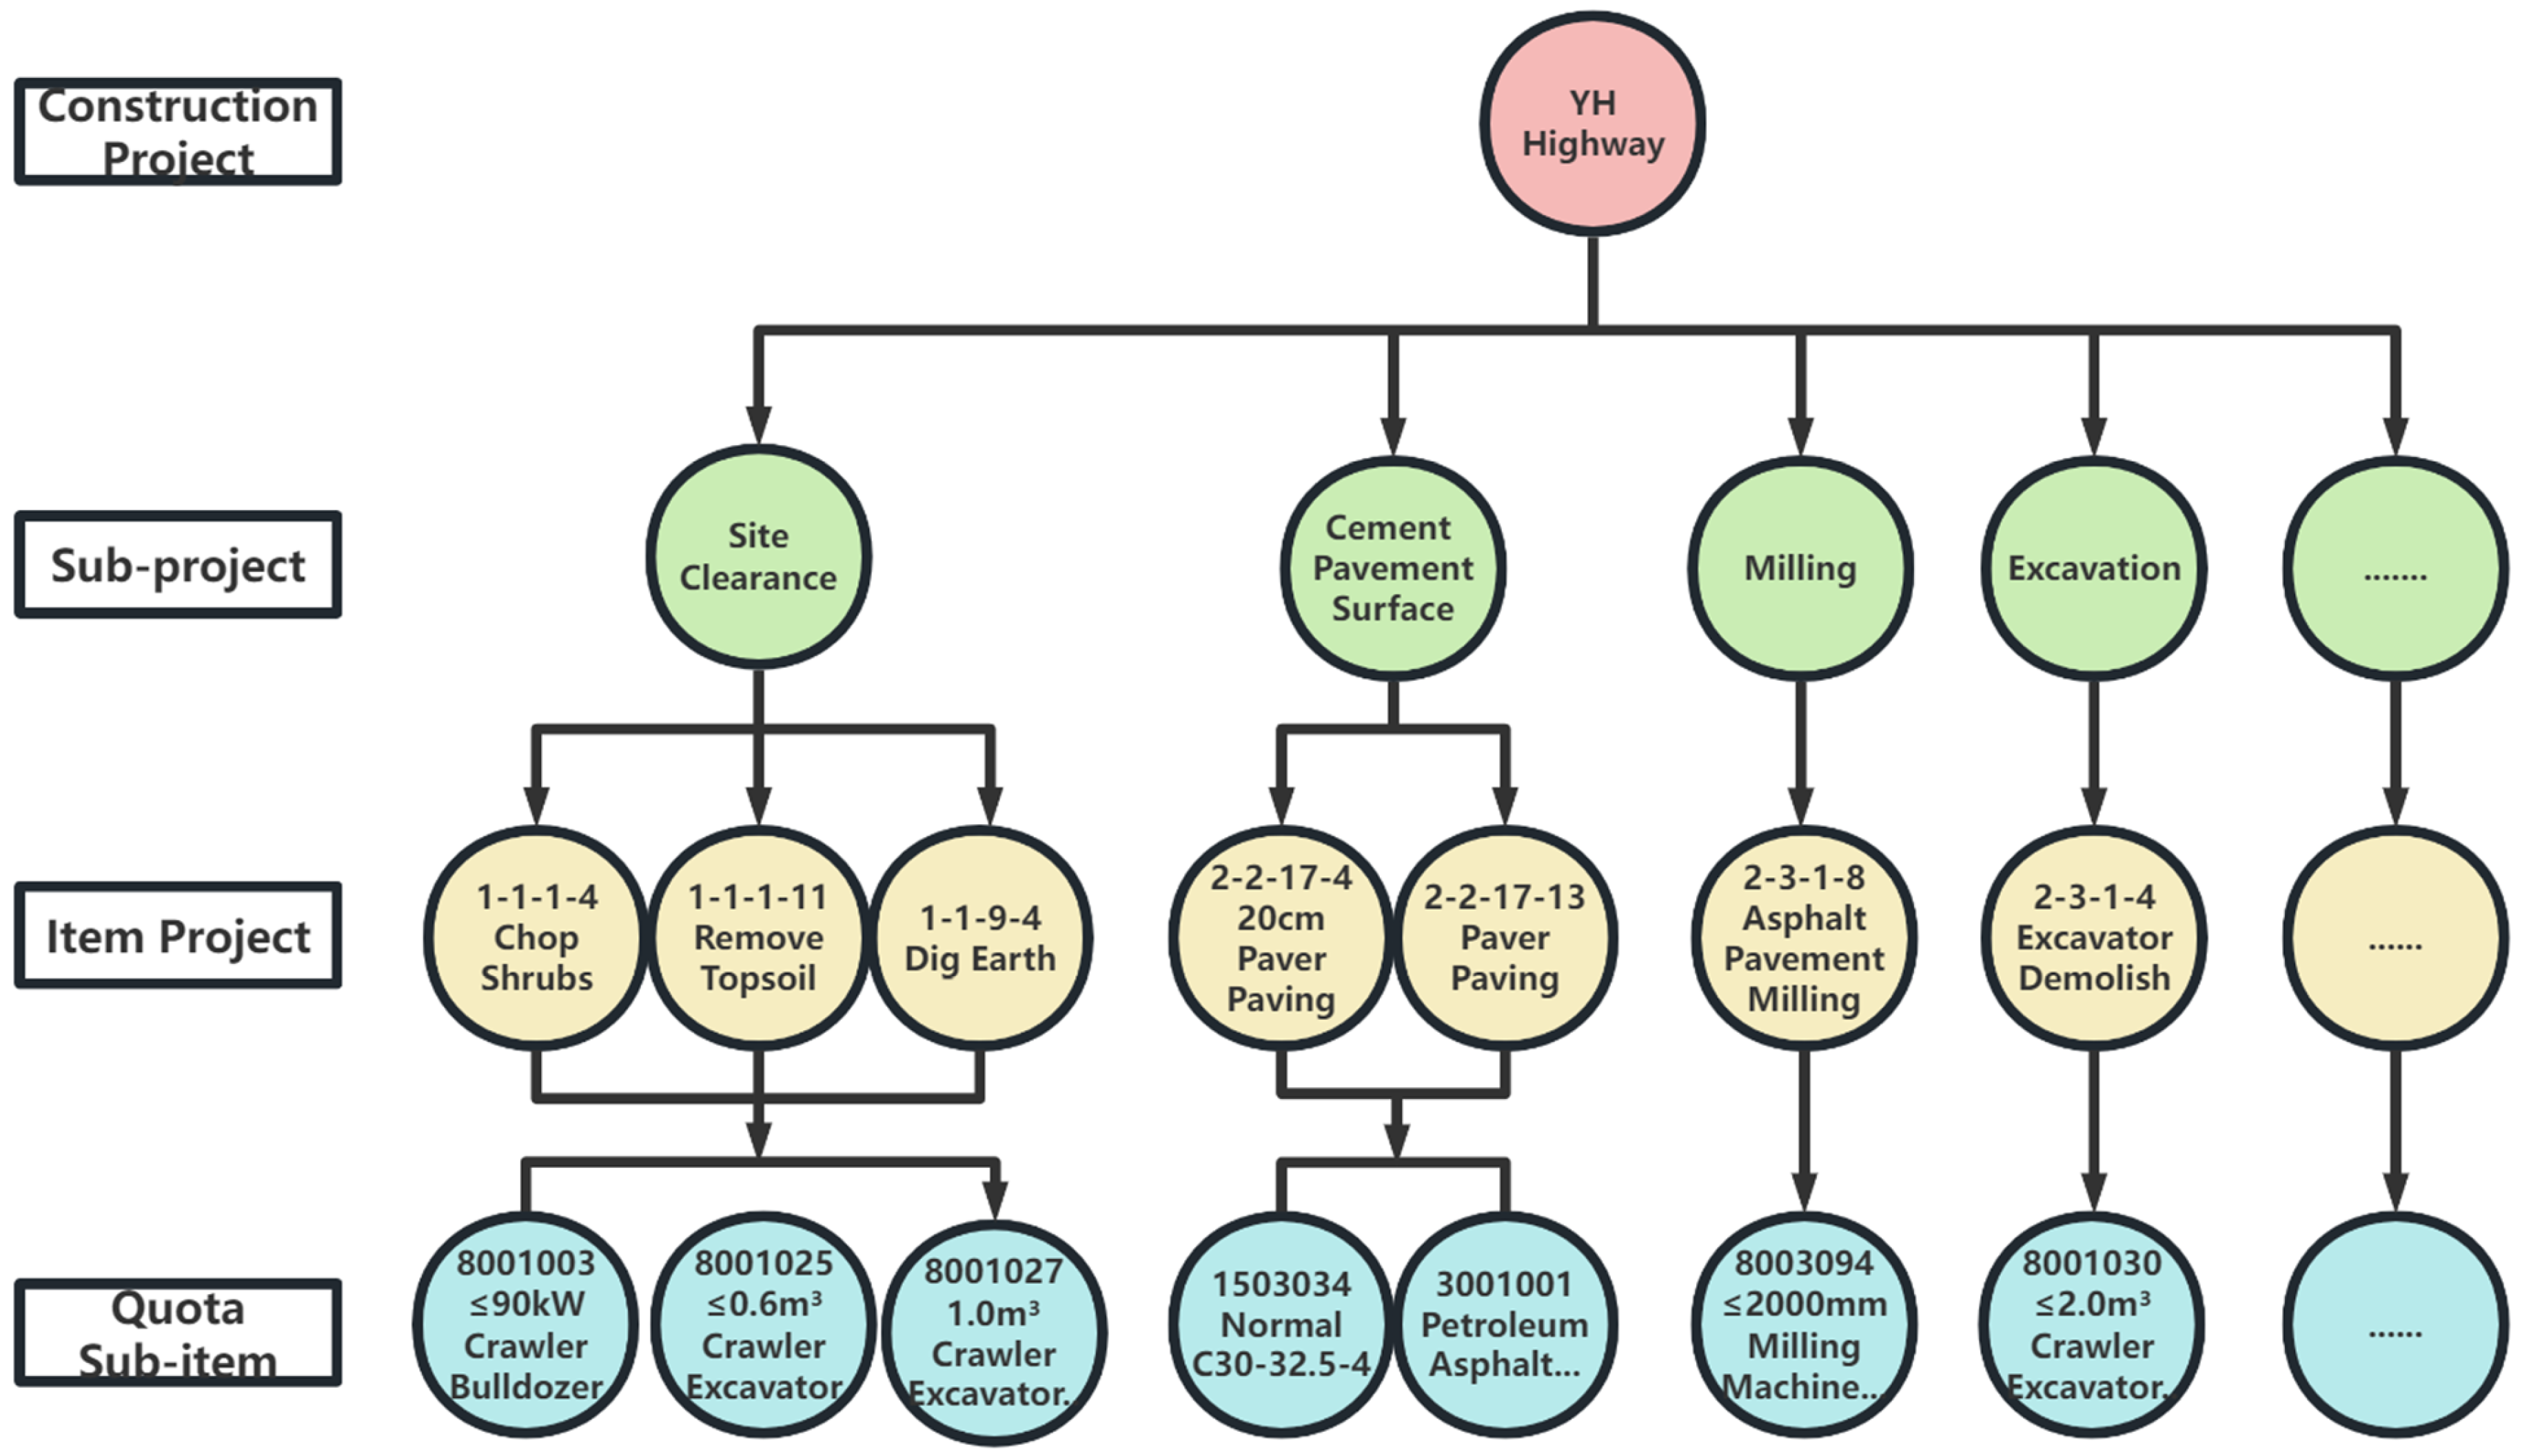
2.1. Carbon Emission Calculation Boundaries

Carbon emission calculation boundaries refer to the scope and limits defined during carbon accounting, which are essential for ensuring the coherence of carbon calculations and the comparability between different accounting objects. In carbon accounting for construction projects, the “carbon impact” is divided into two categories: operational carbon and embodied carbon. Operational carbon is attributed to the construction project and refers to the carbon emissions produced due to water supply, electricity supply, and other activities, characterized by fewer categories and easier calculation and statistical processes. In contrast, embodied carbon is attributed to building materials and refers to the carbon emissions generated during the manufacturing, production, transportation, construction, maintenance, as well as during the maintenance, replacement, demolition, deconstruction, and disposal of material components. This category is more complex, with numerous classifications, making calculation and statistical processes more difficult, and it remains one of the most critical and challenging issues in current carbon accounting for construction projects [48]. This study draws on life-cycle theory and research on carbon reduction [49], dividing the construction project carbon calculation boundaries into five stages: the production stage, construction stage, use stage, end-of-life stage, and supplementary stage, in chronological order. The carbon emission details to be considered for each stage are outlined in Table 2. Based on this framework, the carbon emission calculation boundaries of construction projects are further refined by considering the emission sources at each stage, as shown in Figure 2.
Given the high carbon emission intensity, numerous processes, and the challenges associated with quantifying emissions during the construction stage of construction projects, this study analyzes the factors influencing carbon emissions in the construction stage using construction cost quota data and bill of quantities. A top-down analysis framework for construction project, sub-project, item project, and quota sub-item, along with a construction carbon accounting sub-model, is developed, as shown in Figure 3. In this model, carbon accounting for the construction stage can be calculated based on three emission sources: material transportation, construction installation, and machinery usage, which can be naturally calculated by using the bill of quantities and the construction cost quota data. Figure 4, using YH Highway as an example, demonstrates the hierarchical calculation method applied during the construction stage of this model. The method consists of four levels, including construction project, sub-project, item project, and quota sub-item. Due to the complexity and large quantity involved, only a partial representation is shown in Figure 4.

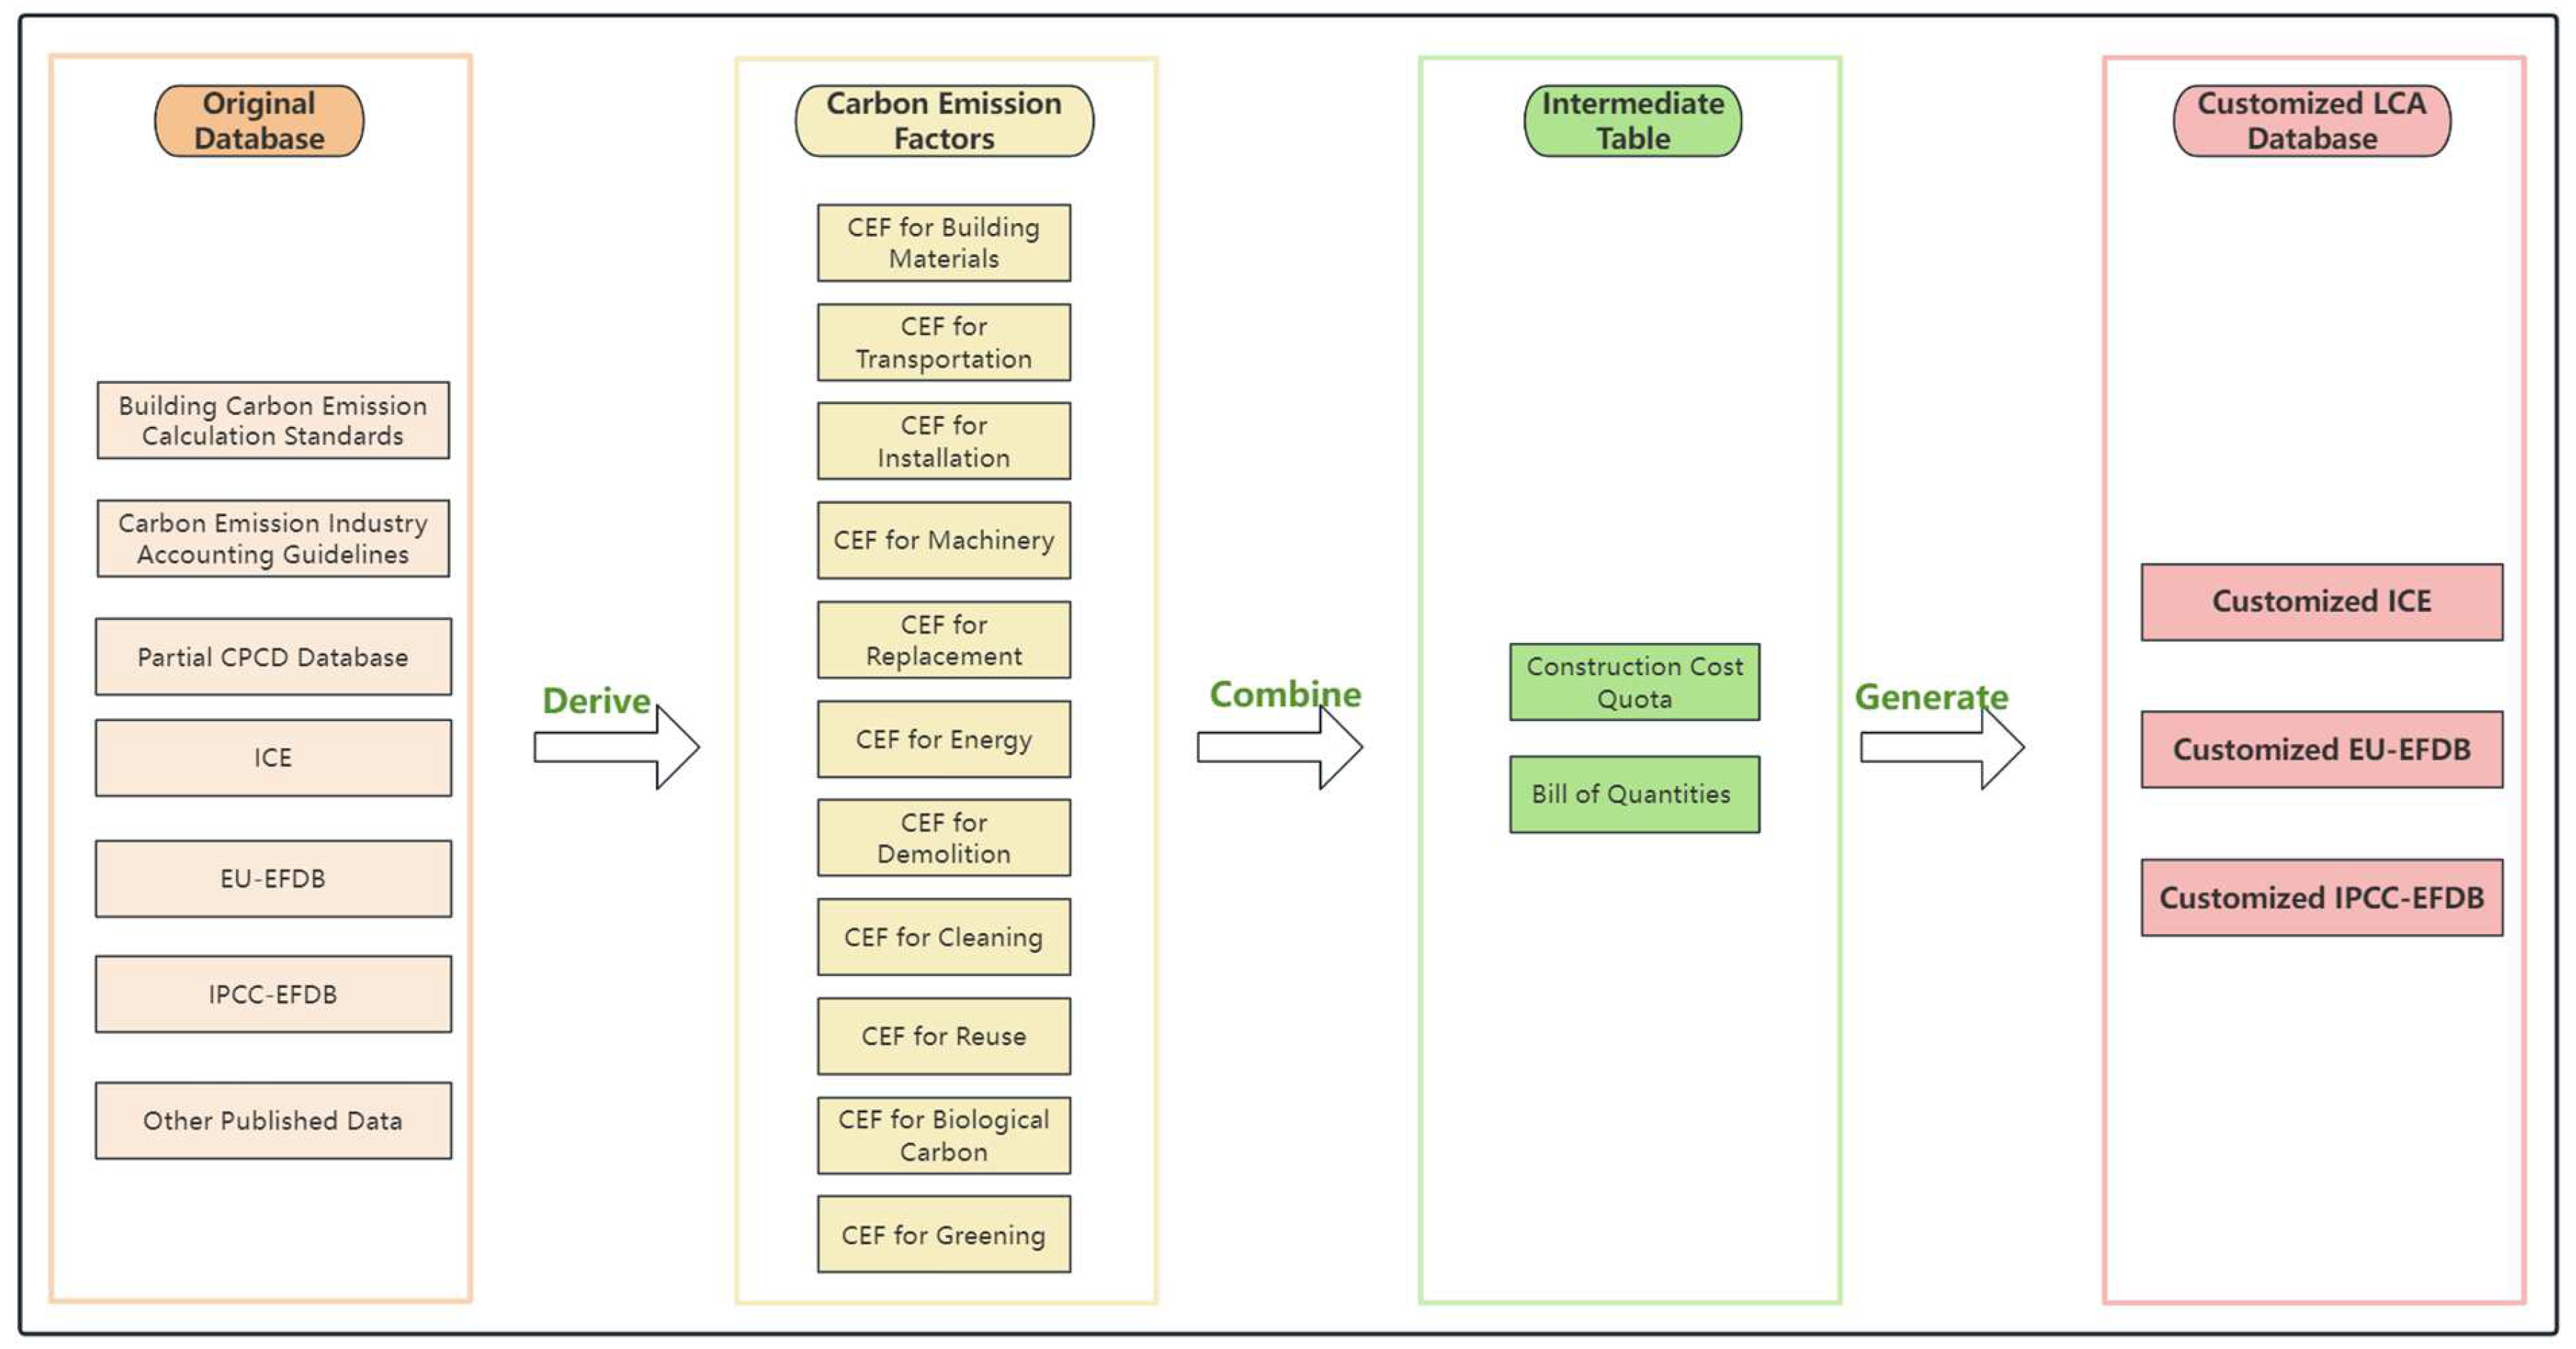
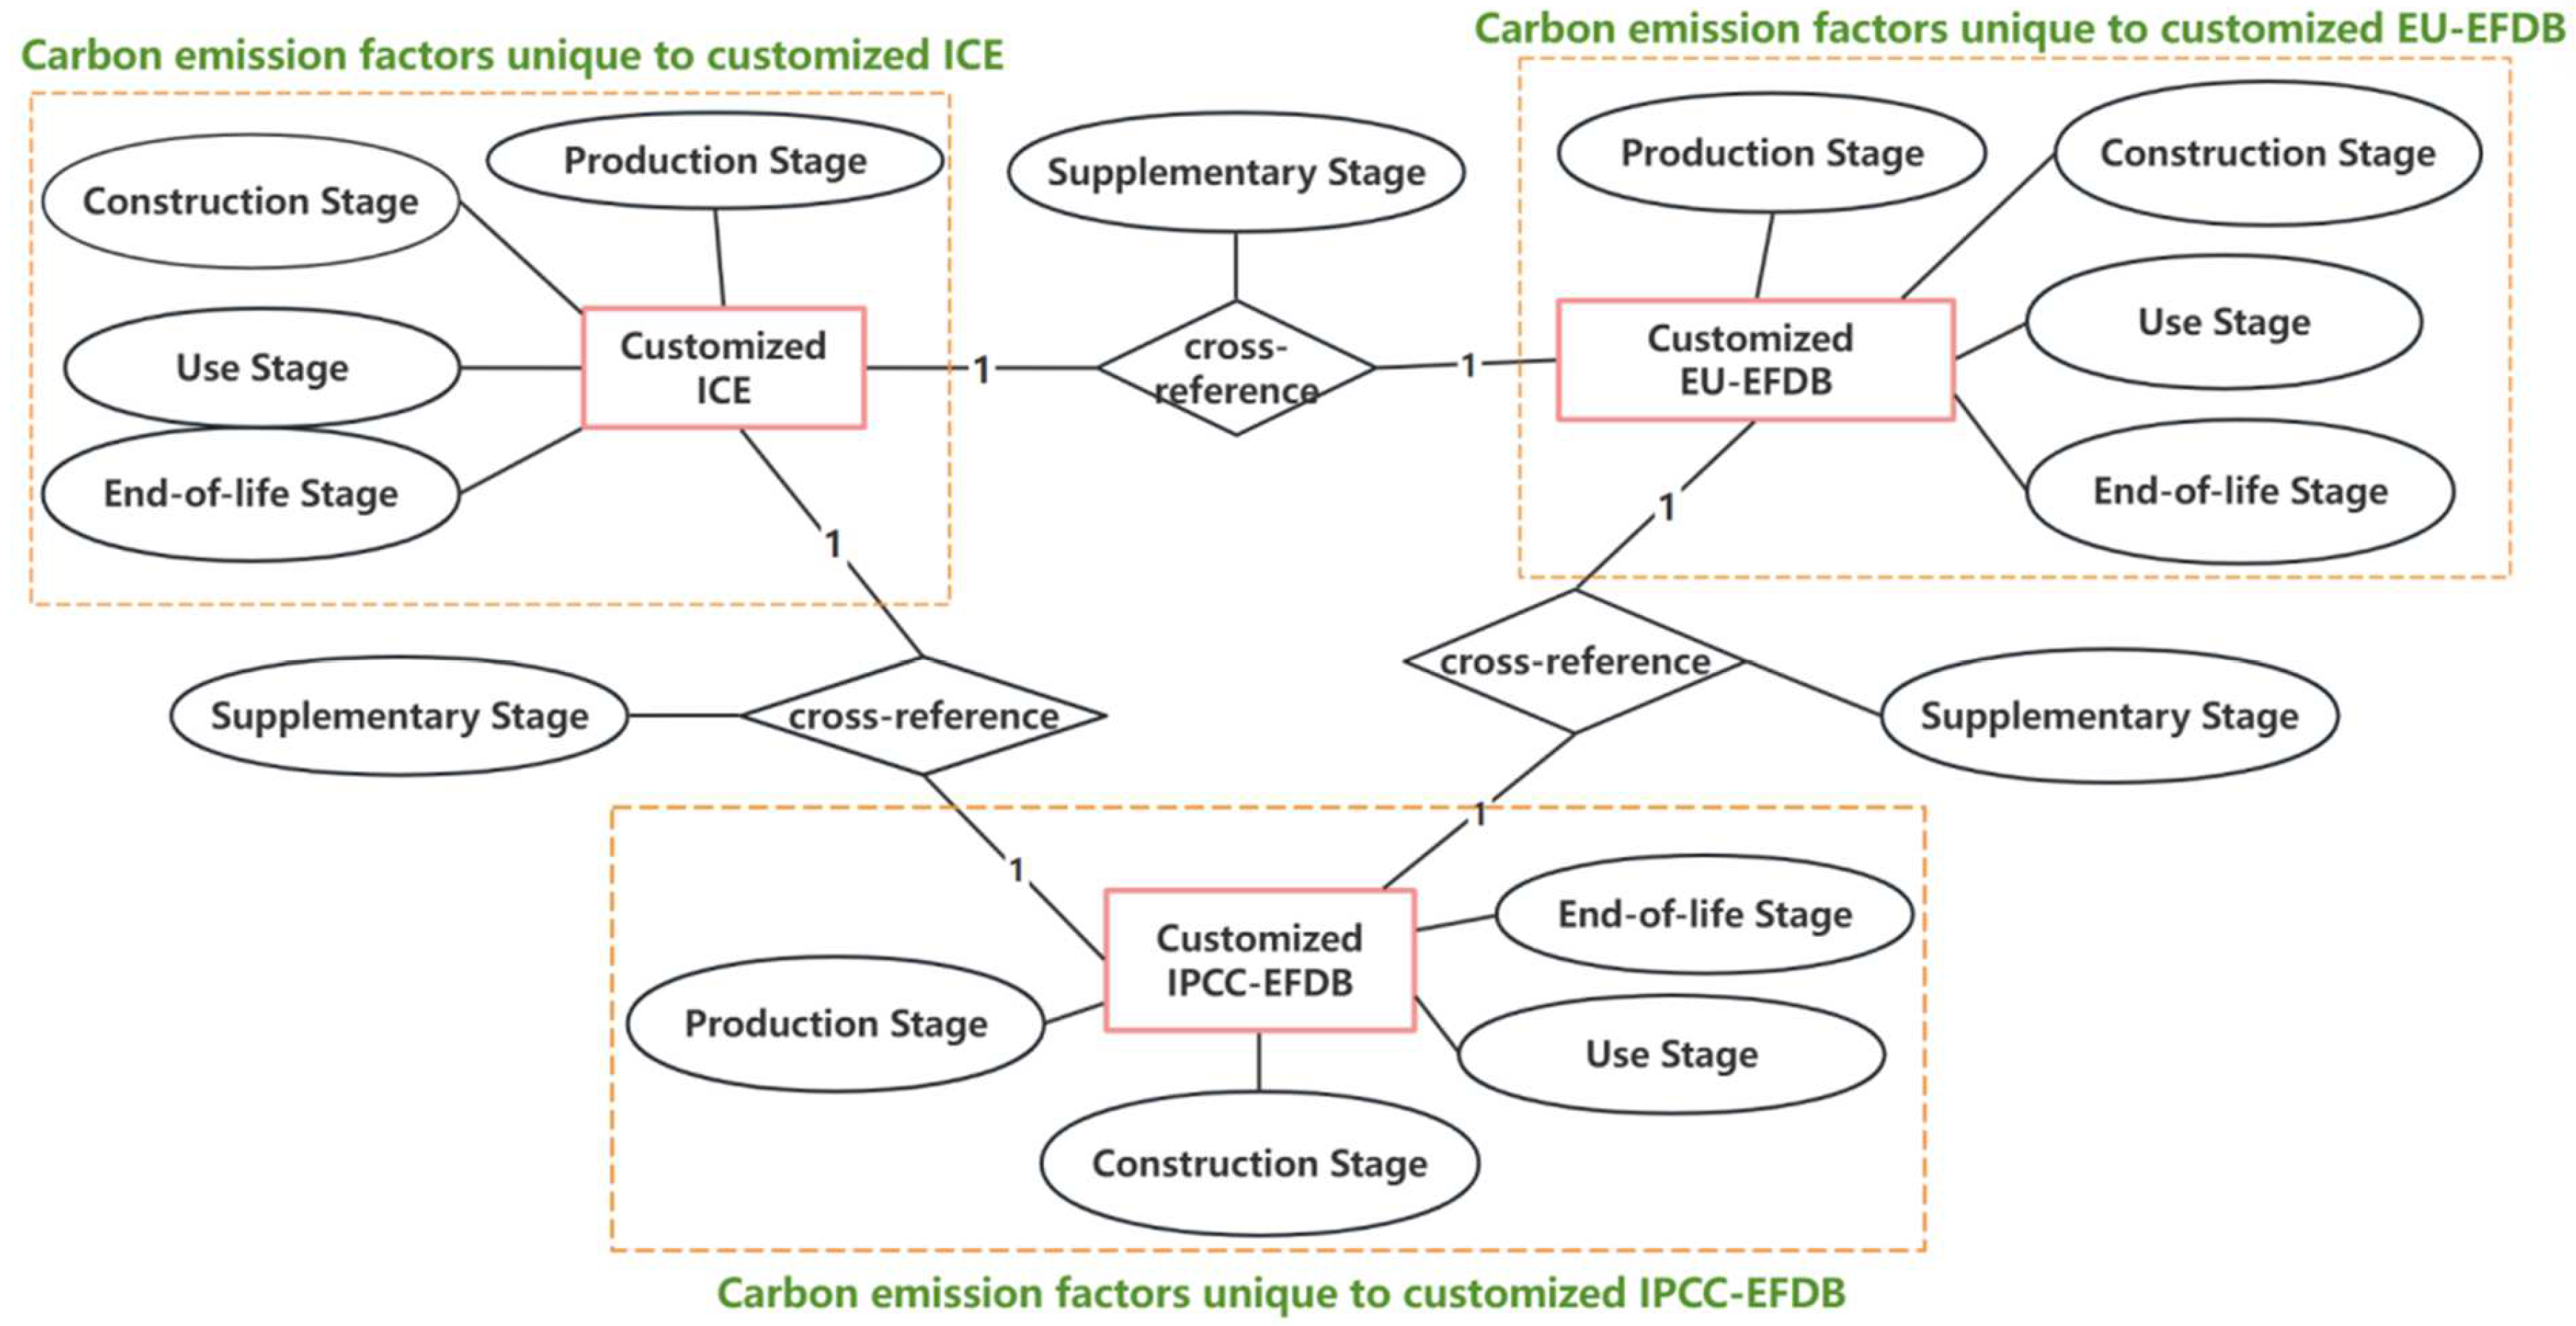
2.2. Carbon Emission Factor Database

Based on the five stages of carbon emission in construction project life cycle, the carbon emissions associated with the construction project [50], can be broadly categorized into 11 types. Each stage includes 1–3 types of carbon emissions, as shown in Table 3. Therefore, the 11 types of carbon emission factors are identified as building material carbon emission factor, transportation carbon emission factor, construction installation carbon emission factor, machinery equipment carbon emission factor, material replacement carbon emission factor, structural demolition carbon emission factor, waste disposal carbon emission factor, energy carbon emission factor, reuse carbon emission factor, biogenic carbon emission factor, and carbon sequestration from greening carbon emission factor, as shown in Figure 5. Typically, the first eight types are related to carbon emissions with positive values, while the last three types are related to the reduction of carbon emission with negative values.
When compiling the carbon emission factor database for real-world construction engineering in China, the domestic carbon emission databases are still incomplete, while the international databases are also limited to poor regional applicability and incompleteness. This study deals with the challenges from the following three considerations: the specialization of construction projects, the comprehensiveness of carbon emission factors, and the international applicability and authority of different databases. Based on the characteristics of the ICE [40,41], EU-EFDB [42,43] and IPCC-EFDB [44,45] (Table 4), and integrating the GB/T 51366-2019 [46] and CPCD [47], three customized databases applicable to the construction projects were then developed, resulting in the customized ICE, the customized EU-EFDB, and the customized IPCC-EFDB, as shown in Figure 4. Table 5 lists some of the typical items for the modified carbon emission factors based on the three databases.
Because the study on carbon emission factors for the supplementary stage is still in its early stage, with very limited data available, the same supplementary stage carbon emission factor database was used for all the three customized databases [40,41,49]. However, carbon emission factor research for the first four stages of the full life-cycle is relatively comprehensive, with most data obtainable from the original three databases. As a result, the carbon emission factors for the first four stages of the customized databases differ according to Figure 6, which presents an enhanced Entity-Relationship (E-R) diagram of the customized databases, illustrating the cross-references between the three customized databases and the integration of supplementary stage carbon emission factor data. Due to the lack of uniformity in the units used in the base databases, unit conversions or molecular weight adjustments were carried out using various national industry standards, national statistical yearbooks, and quota standards, ultimately yielding the desired results. Additionally, some building material carbon emission factors, such as those for cement, were derived by calculating the carbon dioxide emissions based on relevant chemical equations for cement (32.5 grade), as shown in Table 5. These equations were based on data from the three customized databases. For example, when calculating the carbon emission factors due to energy resources consumption for the customized IPCC-EFDB, the following steps were undertaken:
  • Unit conversion: As different fossil energy sources are measured using different units (e.g., coal is measured in tons, natural gas in cubic meters), it was necessary to convert these into a unified thermal value unit. According to “General Rules for Calculation of the Comprehensive Energy Consumption (GB/T 2589-2020)” [51], all energy sources were converted to a standard unit of Lower Heating Value (LHV) to ensure consistency across the datasets. For instance, 1 ton of coal was converted to its equivalent LHV value in megajoules per ton (MJ/ton), and the same was done for natural gas and oil, enabling a uniform comparison of carbon emissions across different types of energy resources.
  • Preliminary calculation: The carbon emission factors and carbon oxidation rates for various fossil energy sources from the IPCC-EFDB were multiplied by their respective lower heating values. This calculation is done to determine the energy content of each fossil fuel and its contribution to carbon emissions. The result was then further multiplied by 44/12 (to convert atomic carbon to molecular CO2), as this ratio represents the molecular weight conversion factor, where 44 is the molar mass of CO2 and 12 is the molar mass of carbon. This method ensures that the carbon content is properly accounted for in the form of carbon dioxide.
  • Carbon emission calculation: The carbon dioxide emissions from fossil energy encompass both combustion and production processes. Both components were summed to obtain the final emission values. The formula used for the calculation is CEF = Average Lower Heating Value × Carbon Oxidation Rate × 44/12 + production stage Carbon Emission Factor. This formula was derived from the “IPCC Guidelines for National Greenhouse Gas Inventories” [52] and has been widely adopted in carbon emission assessments for energy consumption. The production stage carbon emission factor account for emissions released during the extraction and transportation of fossil fuels, while the combustion process calculates emissions during energy use.
Table 4. Introduction to original and customized ICE, EU-EFDB, and IPCC-EFDB.
DatabaseCountry/RegionContentFeaturesModification MethodsCustomized CEF Entries
ICEUKBuilding materials, transport, construction processes, energyAuthoritative and construction-focused; limited coverage outside construction, slower updates1. Unit conversion (GB/T 51366-2019 [46] and Guidelines for Corporate Greenhouse Gas Emission Accounting and Reporting [53])
2. Enhanced construction-stage calculation methods (GB/T 50854-2024 [38], JTG/T 3832-2018 [39]).
3. Added supplementary stage data
1574
EU-EFDBEuropeBuilding materials, transport, agriculture, waste, energyBroad sector coverage, real-time updates; lacks industrial production and land-use dataSame1605
IPCC-EFDBGlobalBuilding materials, transport, industry, land-use, energyGlobal benchmark, standardized; infrequent updates, missing recent trendsSame1548
Table 5. Representative emission factor entries across project stages.
StageItem/ActivityCustomized ICECustomized
EU-EFDB
Customized
IPCC-EFDB
Production StageCement (per ton)550880530
Construction StageAxial Flow Fan
(per h)
1.371.011.06
Use StageElectricity (take the North China Region as an example, per kWh)0.884 0.901 0.841
End-of-life StageLandfill (per kg)0.012 0.009 0.011
Supplementary StageBiocarbon (per kg)−0.166 −0.66 −0.66
Figure 5. Workflow for compiling the customized carbon emission factor databases for specific construction projects.
Sustainability 17 05090 g005
Figure 6. Enhanced E-R diagram of the customized carbon emission factor databases.
Sustainability 17 05090 g006

2.3. Carbon Emission Calculation Method

This study’s carbon accounting framework is divided into five stages: the production stage, construction stage, use stage, end-of-life stage, and supplementary stage. The calculation method for the carbon sequestration in the greening process during the supplementary stage of embodied carbon is derived from the research [49]. The calculation methods for other stages of embodied carbon are sourced from the seminal work published by UK Institution of Structural Engineers [54]. The operational carbon calculation method is based on the work [55]. Figure 7 provides a schematic overview summarizing the calculation formulas employed in the development of this model, below are the specific calculation formulas.

2.3.1. Production Stage Analysis

The production stage includes three primary processes, and they are raw material supply, material transportation, and product manufacturing. Due to the challenges in obtaining precise data on transportation distances and manufacturing processes, the calculation focuses primarily on raw material inputs. The derivation of the formula depends on the material quantification methods used, including mass m, volume V, area S, and length l.
CE Prod = i   CEF i × m i + CEF j × V j + CEF k × S k + CEF l × l l
where CE Prod represents total production-stage emissions; i, j, k and l represent the material categories; CEF represents the material-specific emission factors; m i ,   V j ,     S k   and   l l represent the material consumption quantities.

2.3.2. Construction Stage Analysis

Emissions during the construction stage are calculated as follows:
CE Const = CE trans _ site + CE install + CE mech
where CE trans _ site represents carbon emissions from the TDth (transportation mode) to the site; CE install represents carbon emissions from construction installation; CE mech represents carbon emissions from mechanical equipment.
The carbon accounting formula for the goods transportation stage is as follows:
CE trans _ site = i   CEF i × TD i
where CEF i represents the carbon emission factor of the corresponding mode; TD i represents transportation distance for the TD-th mode.
The carbon accounting formula for the construction installation stage is as follows:
CE install = i   1 1 WR i 1 × CEF i × m i
where WR i represents waste factor of material i (dimensionless ratio between 0–1); 1 1 WR i 1 represents waste rate of material i (%); CEF i represents carbon emission factor for raw material supply of material i (kgCO2e/unit); mi represents mass of material i (kg). When using alternative measurement units, substitute with m3, m2, or m.
The carbon accounting formula for the machinery equipment stage is as follows:
CE mech = i   N i × B i × t i × CEF i
where CE mech represents carbon emissions from mechanical equipment; N i represents quantity of the i-th mechanical equipment type; B i represents operational quantity of the i-th equipment (unitless); t i represents operational duration (hours); CEF i represents carbon emission factor of the energy source used (kgCO2e/kWh).

2.3.3. Use Stage Analysis

The use stage of a construction project consists of seven processes: operation, maintenance, repair, replacement, renovation, operational electricity consumption, and operational water consumption. Since data for the remaining processes are difficult to obtain, this study uses “replacement” to represent the first five processes. The calculation formula is as follows:
CE Use = CE replace + CE electric + CE water
where CE replace represents carbon emissions generated during the material replacement of a construction project; CE electric represents carbon emissions generated in the operational stage of a construction project due to electricity consumption; CE water represents carbon emissions generated in the operational stage of a construction project due to water consumption.
The carbon accounting formula for the replacement stage is as follows:
CE replace = i RSP i CL i 1 × ( CE Prod , i + CE trans _ site , i + CE install , i ]
where RSP i represents the expected lifespan of material i, which is 60 years for building projects and 120 years for infrastructure; CL i represents default service life of material i, rounded up to the next integer.
The carbon accounting formula for electricity consumption in the operational stage of the construction project is as follows:
CE electric = i   1 r i × E i × CEF i
where r i represents the proportion of clean energy used; E i is measured via smart meter data in kilowatt-hours (kWh); CEF i represents the carbon emission factor associated with electric consumption in the region where the i-th part of the building project is located.
The carbon accounting formula for water consumption in the operational stage of the construction project is as follows:
CE water = i   W i × CEF i
where W i represents the water usage of the i-th part of the construction project; CEF i represents the carbon emission factor associated with water consumption in the region where the i-th part of the building project is located.

2.3.4. End-of-Life Stage Analysis

The end-of-life stage encompasses four processes: structural demolition, waste transportation, waste treatment, and waste cleanup. As data for waste treatment and cleanup are often combined in practice, these two processes are computed collectively through the following formula:
CE End = CE de const + CE trans _ waste + CE clearance
where CE de const represents the carbon emissions during the structural demolition stage of the construction project; CE trans _ waste represents the emissions from transporting materials to the site using the TD method; CE clearance represents the emissions generated during the waste disposal process.
The carbon accounting formula for structural demolition is as follows:
CE de const = CEF i · GIA
where CEF i represents kgCO2e per square meter, and GIA represents square meters.
The carbon accounting formula for waste transportation is as follows:
CE trans _ waste = i   CEF i × TD i × m i
where CEF i represents kgCO2e per kilogram per kilometer; TD i represents kilometers; m i represents kilograms.
The carbon accounting formula for waste clearance is as follows:
CE clearance = i   CEF i × m i
where CEF i represents kgCO2e per ton; m i represents tons.

2.3.5. Supplementary Stage Analysis

The supplementary stage involves three carbon sequestration processes: material reuse, biogenic carbon storage, and afforestation. The calculation methodologies for these processes are defined as follows:
CE Supple = CE reuse + CE biocarbon + CE greening
where CE reuse represents the carbon emissions reduction due to material reuse; CE biocarbon represents the carbon emissions reduction resulting from the reuse of wood products; CE greening represents the carbon emissions reduction generated by greening activities.
The carbon accounting formula for material reuse is as follows:
CE reuse = i   CEF i × Q ri Q ui
where CEF i represents kgCO2e per unit; Q ri represents units; Q ui represents units.
The carbon accounting formula for the biogenic carbon stage is as follows:
CE biocarbon = i   44 12 × c fi × 1 1 + w i × m i × p i
where c fi represents the proportion of wood; w i represents the percentage of moisture; m i represents the weight of wood; p i represents the amount of carbon per kilogram of wood.
The carbon accounting formula for the greening carbon sequestration stage is as follows:
CE greening = i j N i × C ij × [ 1 k × 1 N i 1 d i × r i × L × W ]
where N i represents the number of plants; d i represents meters; r i represents meters; L represents the length of the greening area in meters; W represents the width of the greening area in meters; C ij represents kgCO2e per plant per year; k represents the empirical density impact coefficient ranging from 0.8 to 1.2.
Finally, the carbon accounting formula for the entire life-cycle of the construction project is as follows:
CE LCA = CE Prod + CE Const + CE Use + CE End + CE Supple

3. Development of Carbon Accounting Tool for Construction Project

3.1. Software Design Framework

The establishment of the carbon accounting tool aims to enable users to conduct whole-life-cycle carbon accounting for one or more scenarios of actual construction projects, including both operational and embodied carbon, and to perform comparative studies to identify corresponding carbon reduction measures. Given the widespread use of construction cost estimation and budget software in construction projects, this software is designed with user convenience in mind. It incorporates a feature for directly importing bill of quantities, addressing practical needs. Therefore, as illustrated in Figure 8, the system is structured around the following six core functional modules,
  • Importing basic project information: This module allows users to input essential project details, including project name, type, location, and timeline (start and end dates).
  • Building the LCA model: This module enables users to create one or more LCA models based on the project details and scenarios.
  • Selecting the LCA database: This module provides users with the option to choose from different LCA databases based on the specific needs of the project scenario: the customized ICE, the customized EU-EFDB, and the customized IPCC-EFDB.
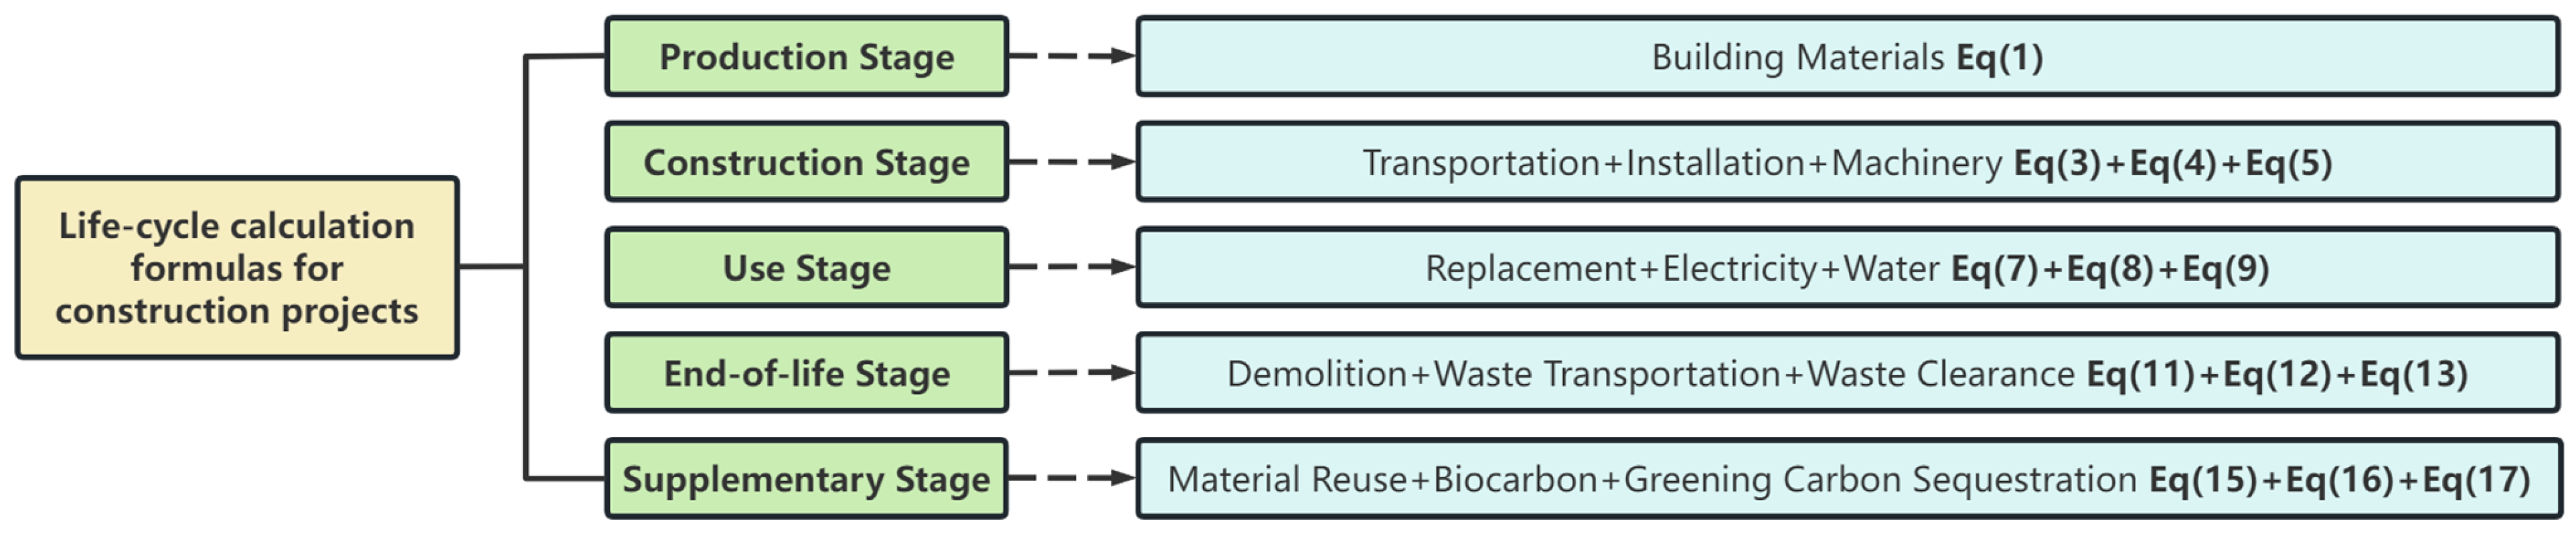
  • Whole-life-cycle carbon accounting for the construction project: This module enables users to conduct whole-life-cycle carbon accounting for multiple processes and stages of the construction project, including the production stage, construction stage, use stage, end-of-life stage, and supplementary stage.
  • Data validation: This module highlights any errors in the data within the model to improve the coherence of the LCA model.
  • LCA carbon footprint results overview: This module clearly presents the results of the LCA carbon accounting, including carbon emissions for each life-cycle stage, construction-stage statistics, bar and pie charts depicting emissions and their respective proportions across stages, and allows for comparison of multiple carbon accounting scenarios to identify potential carbon reduction measures.
Figure 8. Design framework for the web-based carbon emission accounting tool.
Sustainability 17 05090 g008

3.2. Graphic User Interface (GUI) Design

The Graphical User Interface (GUI) is one of the visible components of the software. This software was developed using the LayUI interface library (version 2.7.6), leveraging the Windows 11 22H2 operating system and coding tools such as Sublime Text (build 4192) and Visual Studio Code (version 1.100.2).
In the design of the panel menu, the software utilizes the LayUI interface library to create both the frontend and backend systems. The frontend system includes project management and member management, aiming to provide a platform for carbon accounting and carbon reduction in construction projects. The backend system includes project management, user customization, database management, and system management, aiming to provide a unified platform for editing and managing projects, models, and members. For example, in project management, when the “Project List” option is clicked on, data is asynchronously requested from the backend server (operating on CentOS 8.2.2004) using Asynchronous JavaScript and eXtensible Markup Language (AJAX) technology, and is displayed on the frontend as a dynamic table, facilitating easy viewing by the user. Additionally, the “Project Addition” feature uses LayUI’s form components, along with jQuery (JavaScript Library, version 2.5.18) for data validation, ensuring that the input data adheres to the system’s requirements.
The software operates on the CentOS (Community ENTerprise Operating System) 8.2 2004 platform, with Nginx (Engine X) 1.18 acting as the web server responsible for processing client Hypertext Transfer Protocol (HTTP) requests and forwarding them to the PHP (Hypertext Preprocessor) 7.3 engine. PHP-7.3, in conjunction with MySQL (My Structured Query Language) 5.6, collaborates to provide data support for the panel menu operations.
For permission management, the software uses LayUI’s event mechanism and Cookie technology. When the frontend sends a request, it includes user authentication information, which is validated by the backend using PHP session management mechanisms. For example, in the planEdit operation, the backend performs a detailed check on the user’s request based on their assigned permissions. Only users with the corresponding permissions are allowed to complete the operation, ensuring the security of the system and the integrity of the data.
As shown in Figure 9, the software’s user interface is depicted, highlighting its structure and GUI design in use.

3.3. Frontend-Backend System Integration

In the carbon accounting software, the frontend and backend systems work closely together to ensure the smooth operation of the software. After logging in, the user can select a model to build, choose the appropriate database, and specify the life-cycle accounting stages. The user then determines the data input method for the construction phase and clicks on the carbon accounting function to display the carbon accounting results for the selected model. If the user exits before completing the process, the data is automatically saved to the backend to prevent data loss.
The backend runs on CentOS (Community ENTerprise Operating System) 8.2 2004, with Nginx (Engine X) 1.18 serving as the web server. The PHP (Hypertext Preprocessor) 7.3 engine and MySQL (My Structured Query Language) 5.6 database handle the business logic. The frontend accepts user commands and inputs, transmitting the data to the backend through an Application Programming Interface (API). For example, after the user selects the database and accounting stages, the frontend sends a request, which is received by the backend PHP code. Using the MySQLi (MySQL Improved) extension (version 5.6.50), the backend processes the data by filtering it based on the selected stages and returns the results to the frontend for display. The seamless coordination between the frontend and backend ensures smooth operation of the software, aiming to provide users with a more efficient carbon accounting service.
As shown in Figure 10, the software’s frontend-backend workflow chart is illustrated, highlighting the interaction and data transfer between layers and data flow.

4. Engineering Case Studies

4.1. Project Overview

To assess the computational capabilities of the proposed carbon accounting system for construction projects, and analyze life-cycle carbon emission patterns for better mitigation strategies, this study applies the developed software system to three real-world infrastructure construction projects, including YH Highway, ZJ Expressway and LA Highway, as shown in Figure 11. These three projects, all located within Zhejiang Province, China, offer a unique opportunity to compare life-cycle carbon emissions in the same region, providing valuable insights into regional carbon management practices. The representativeness of these projects lies in their diversity and scale, covering a range of infrastructure types, including highways, expressways, and large-scale expressway expansions. For example, a section of the YH Highway handles over 100,000 vehicles daily, offering a valuable case for evaluating high-traffic scenarios in carbon accounting. The ZJ Expressway spans 4.560 km, serving as an important link for improving regional connectivity and providing a valuable context for carbon emission analysis in expanding transportation networks. The 62.715 km expansion of the LA Highway involves complex components like bridges and tunnels, making it an ideal case for assessing carbon emissions associated with structurally intricate infrastructure. These projects represent a diverse range of infrastructure, from highways to expressways, with varying scales and complexities, providing a diverse dataset for validating the proposed carbon accounting method. The comparison is essential for refining carbon emission factors and improving the coherence of carbon accounting in large-scale infrastructure construction projects. The three key infrastructure projects within Zhejiang Province, China are detailed as follows,
  • YH Highway
The YH Highway is an 8.673 km long road project designed as a dual six-lane, first-class highway. Located near Yuhang in Zhejiang Province, this section plays a pivotal role in enhancing the connectivity of Zhejiang’s urban centers. The construction of this road will significantly reduce travel time between major cities and boost the economic development of the surrounding areas.
2.
ZJ Expressway
The ZJ Expressway covers a segment of 4.560 km and is a vital transportation artery for the Yangtze River Delta metropolitan area. This project, located in Zhejiang Province, is designed to improve regional connectivity and support economic growth in one of China’s most developed regions. The expressway’s construction will contribute to alleviating traffic congestion, promoting regional commerce, and facilitating the implementation of national economic strategies of China.
3.
LA Highway
The expansion of LA Highway covers a length of 62.715 km. This large-scale infrastructure project involves the construction of subgrades, bridges, tunnels, interchanges, and other critical components. The LA Highway expansion is an essential project that will enhance the transportation network between Lin’an and other major cities, thereby improving logistics and supporting urban development. With its focus on modernizing infrastructure, this project also helps demonstrate the application of advanced technologies in road construction.
The geographical locations and construction site layouts of these projects are illustrated in Figure 11, with key project specifications summarized in Table 6, and related statistics of life-cycle data listed in Table 7. In the production stage, the types and quantities of materials are determined based on the materials required during the preparation stage, just before the project begins. In the construction stage, due to the large volume of data, the direct importation of the bill of quantities is employed to ensure the coherence of the calculations. In the use stage, the maintenance lists are established based on the “Technical Specifications of Maintenance for Highway (JTG H10-2009)” [56] and “Technical Specifications for Maintenance of Highway Asphalt Pavement (JTG 5142-2019)” [57]. In combination with a 25-year project operation period [58], the lists for replacement processes, electricity consumption, and water consumption are determined. The end-of-life stage is assessed by onsite surveys, information provided by the project team, and demolition data from the engineering department, which help establish the lists for waste transportation methods and distances. In the supplementary stage, data is collected through field research, project team information, and actual project conditions to determine the number of plants, the spacing between them, the types and quantities of reusable materials, and the amount of wood products used.
Figure 11. Geographic location map and construction sites: (a) YH Highway, (b) ZJ Expressway, (c) LA Highway.
Sustainability 17 05090 g011
To ensure consistency in carbon accounting results across all projects, the customized ICE was used for analysis. During the construction stage, data integration was achieved directly through the bill of quantities, while other stages (production, use, end-of-life, and supplementary) may rely on manual data entry. Due to space constraints, the paper only covers a selective subset of visuals for demonstration of software interface, where Figure 12 displays the carbon accounting interface for the construction stage of LA Highway, while Figure 13 shows the aggregated results across all stages.

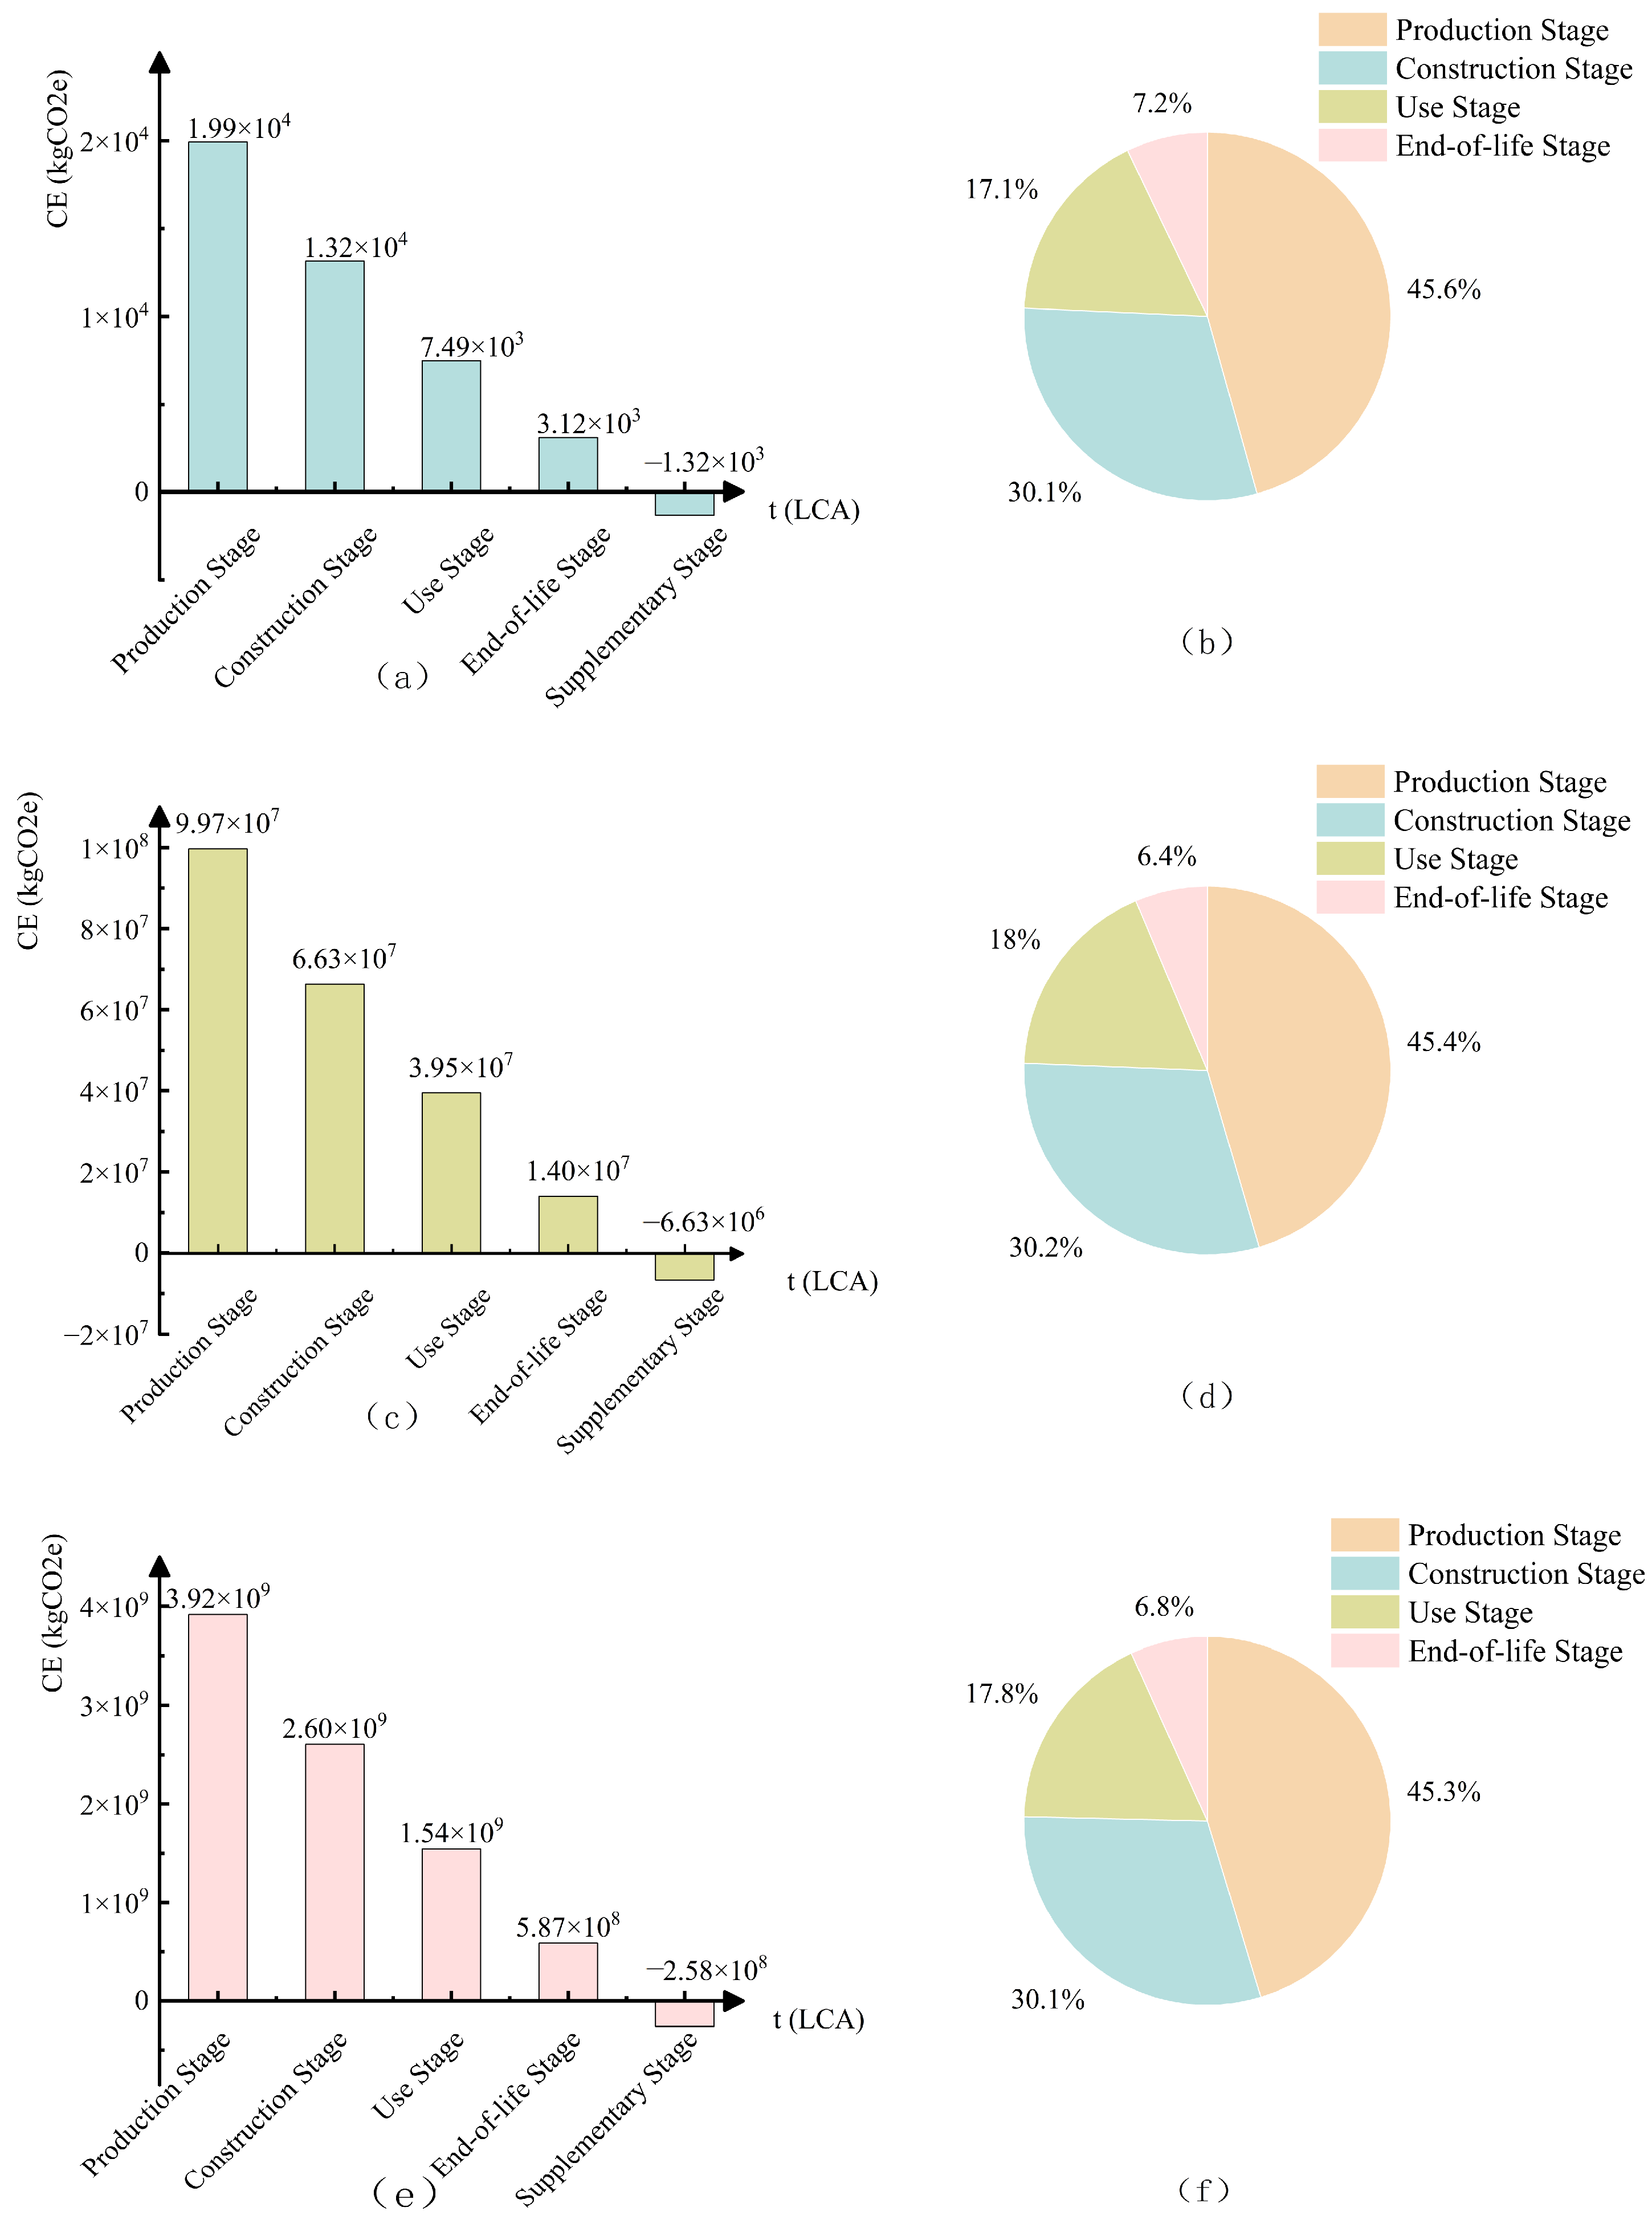
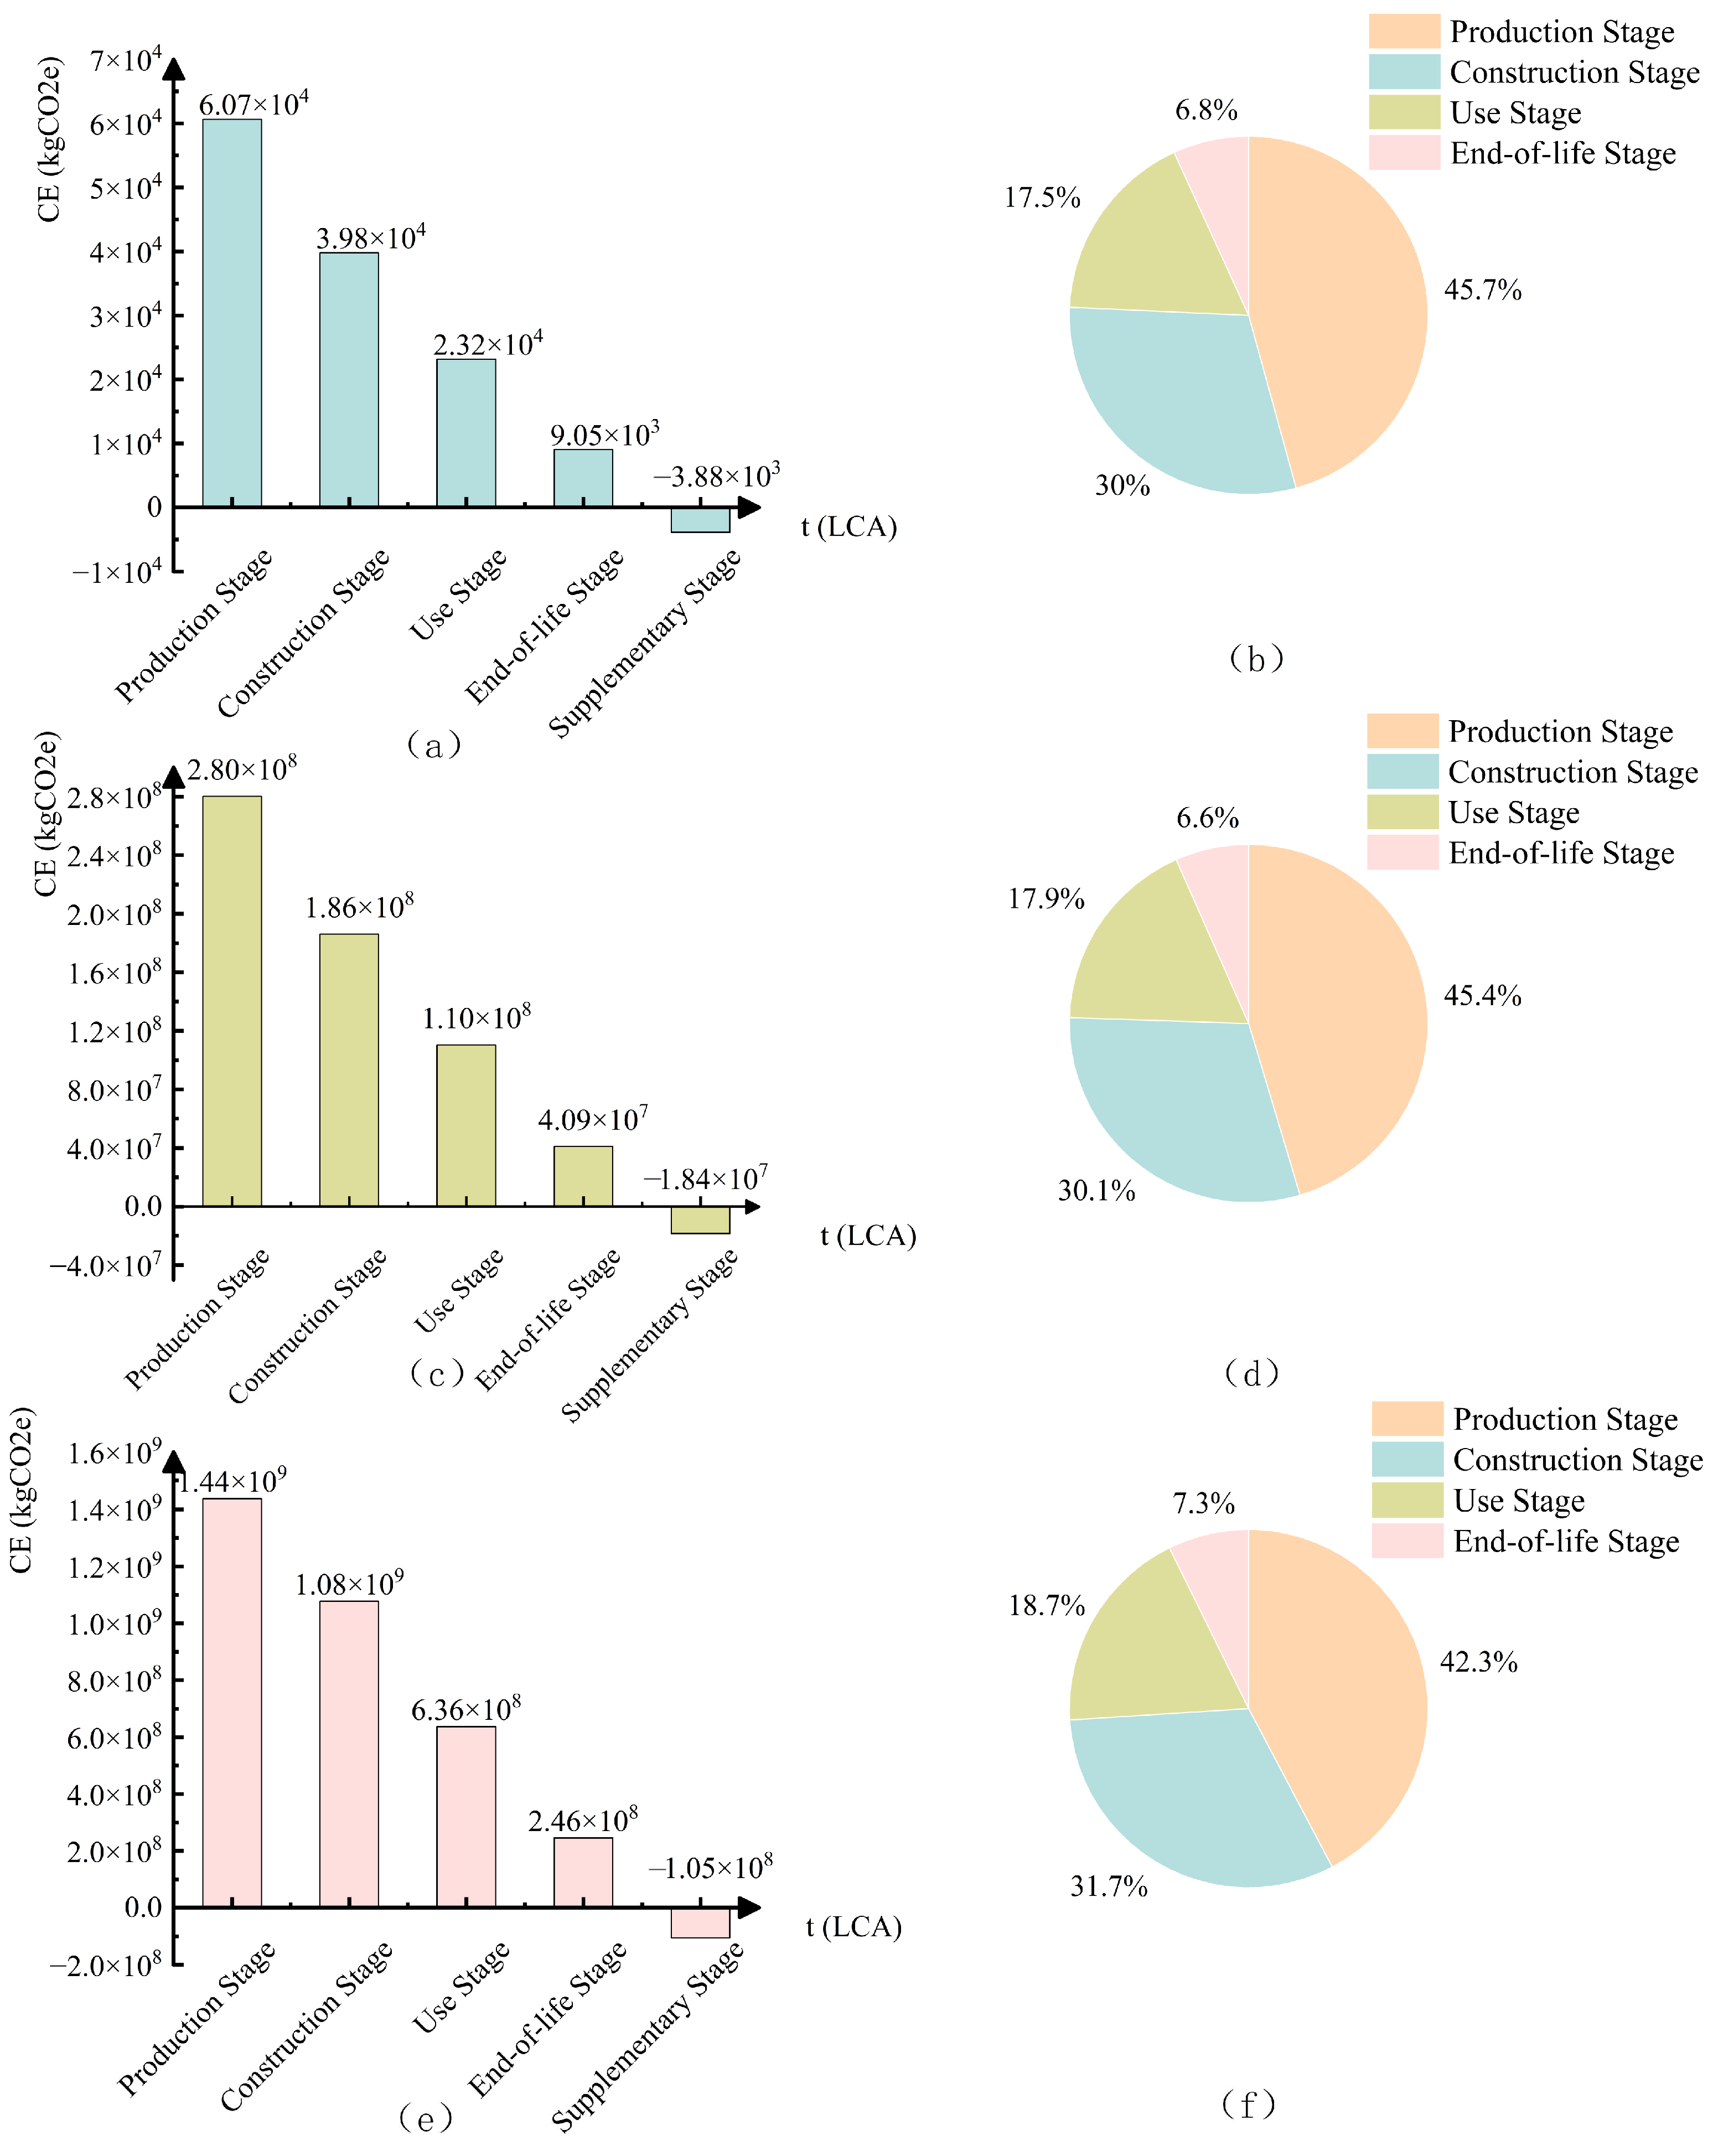
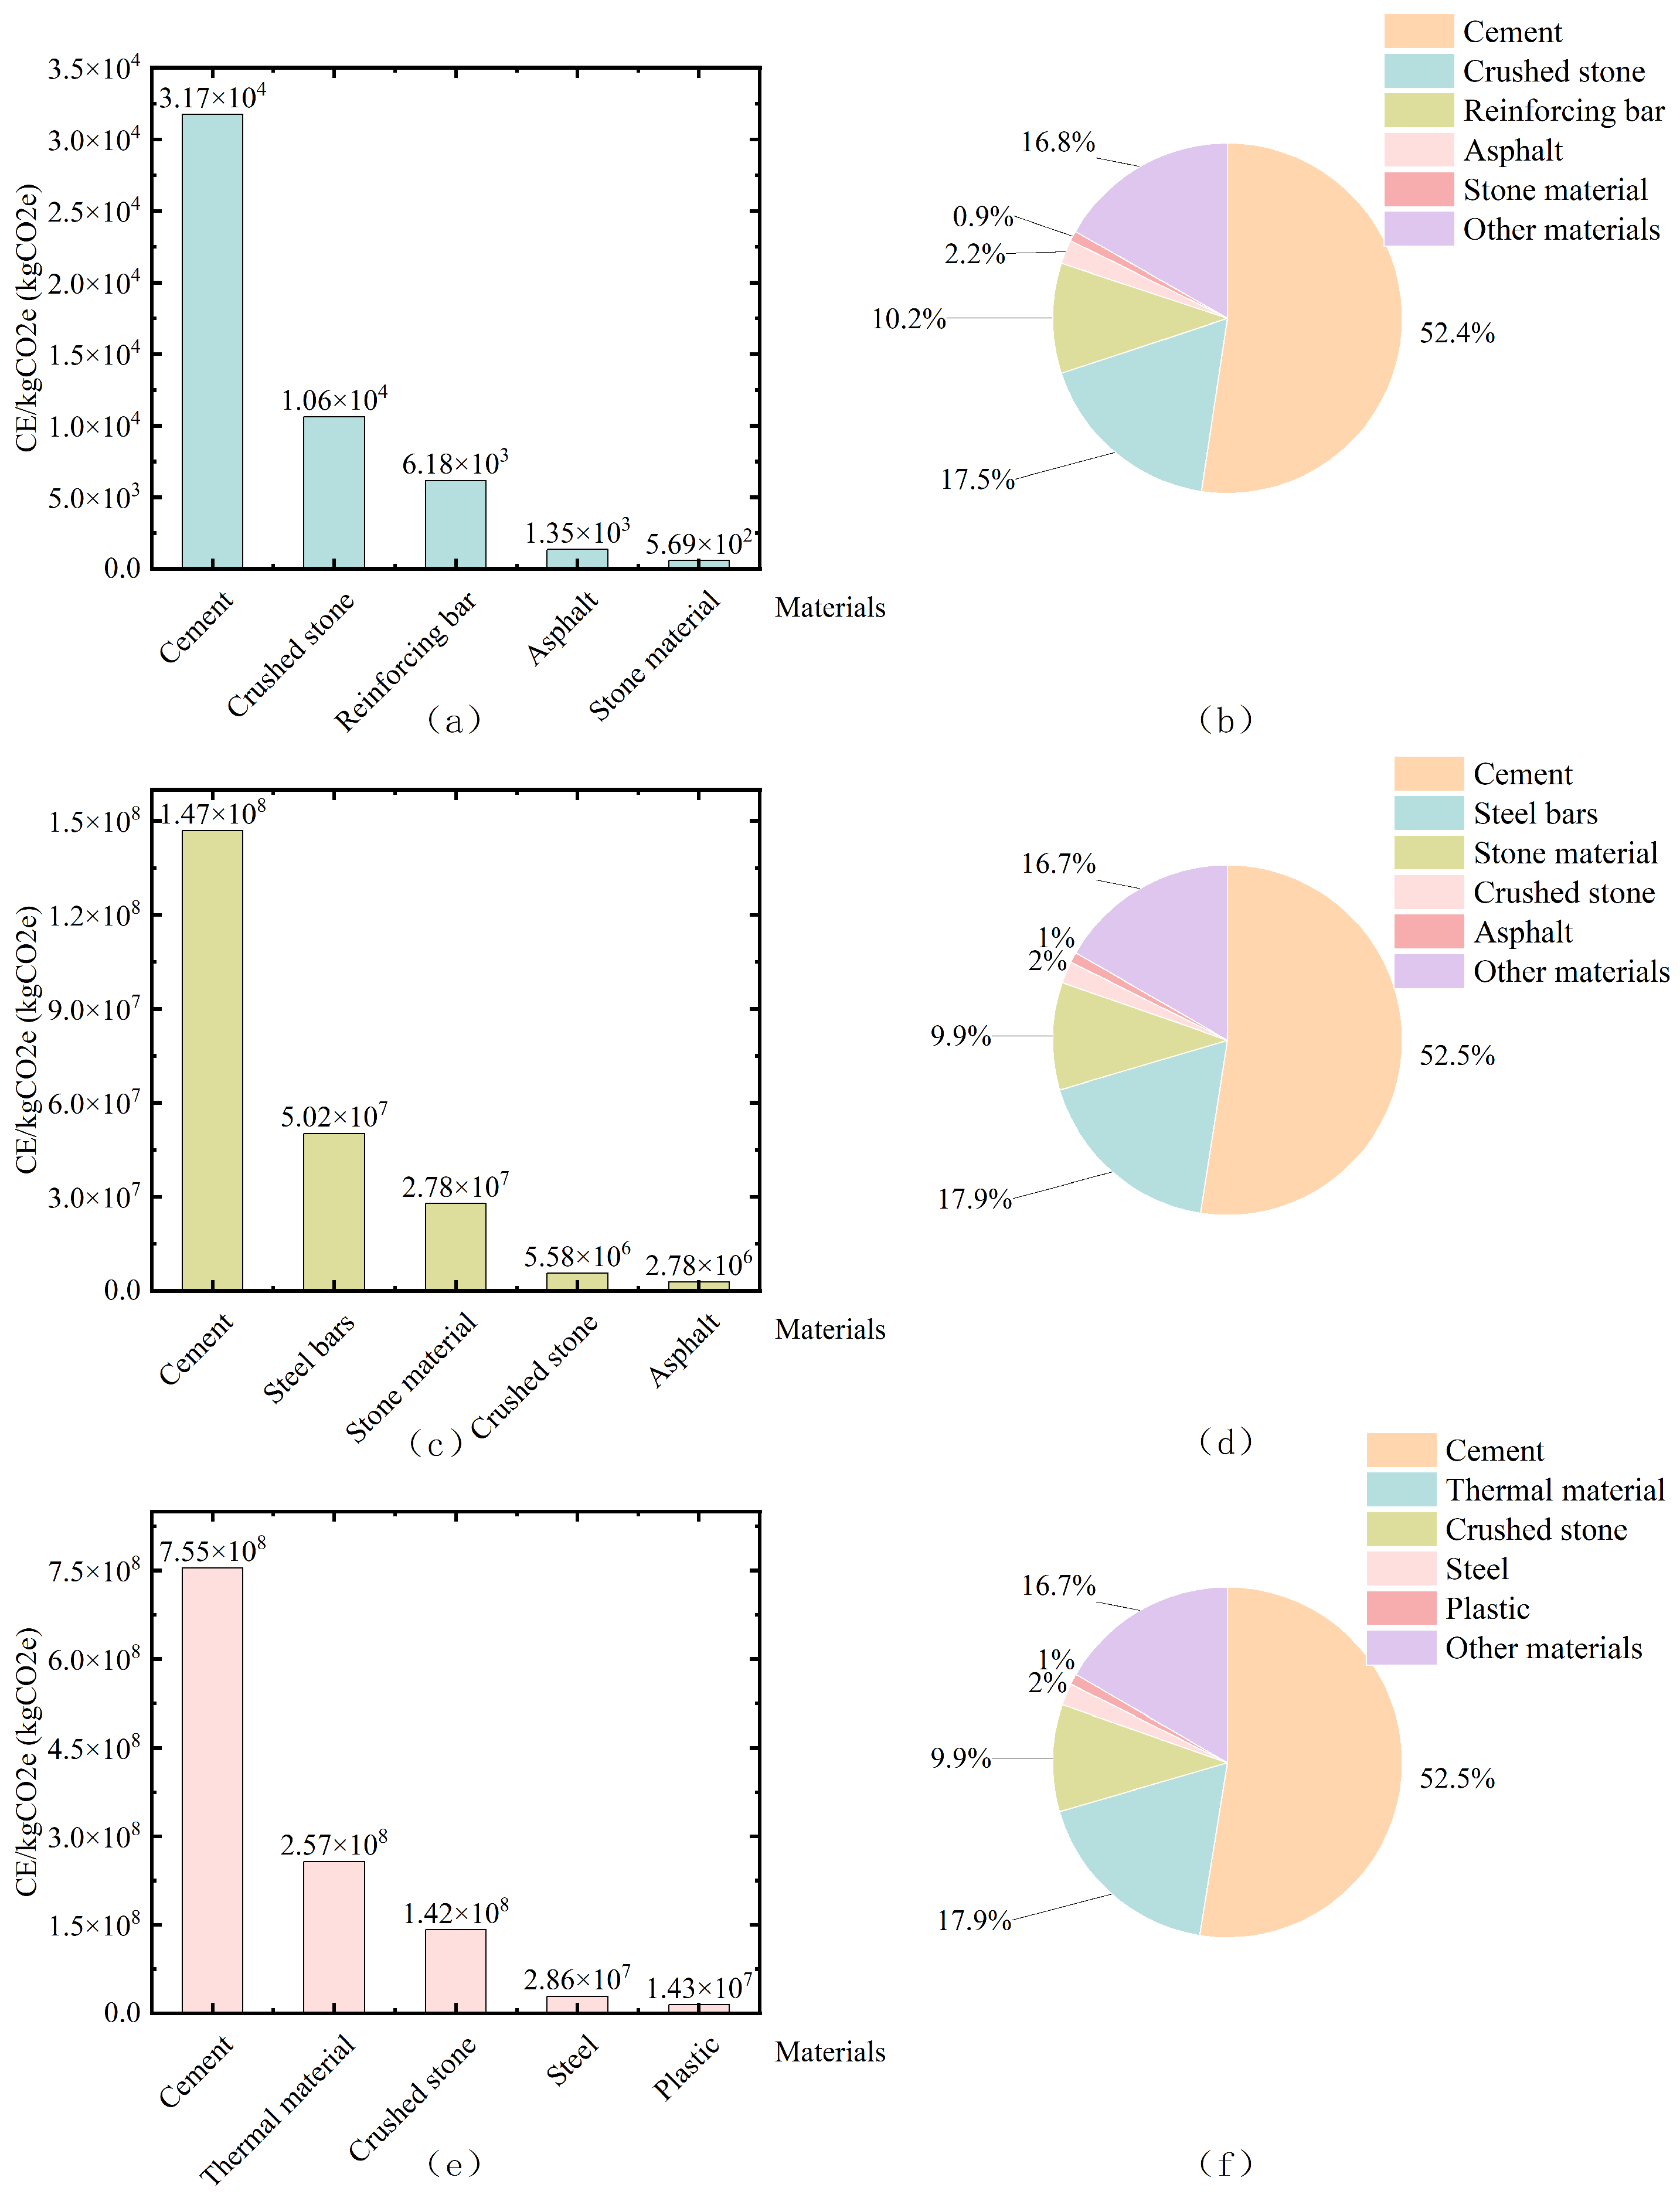
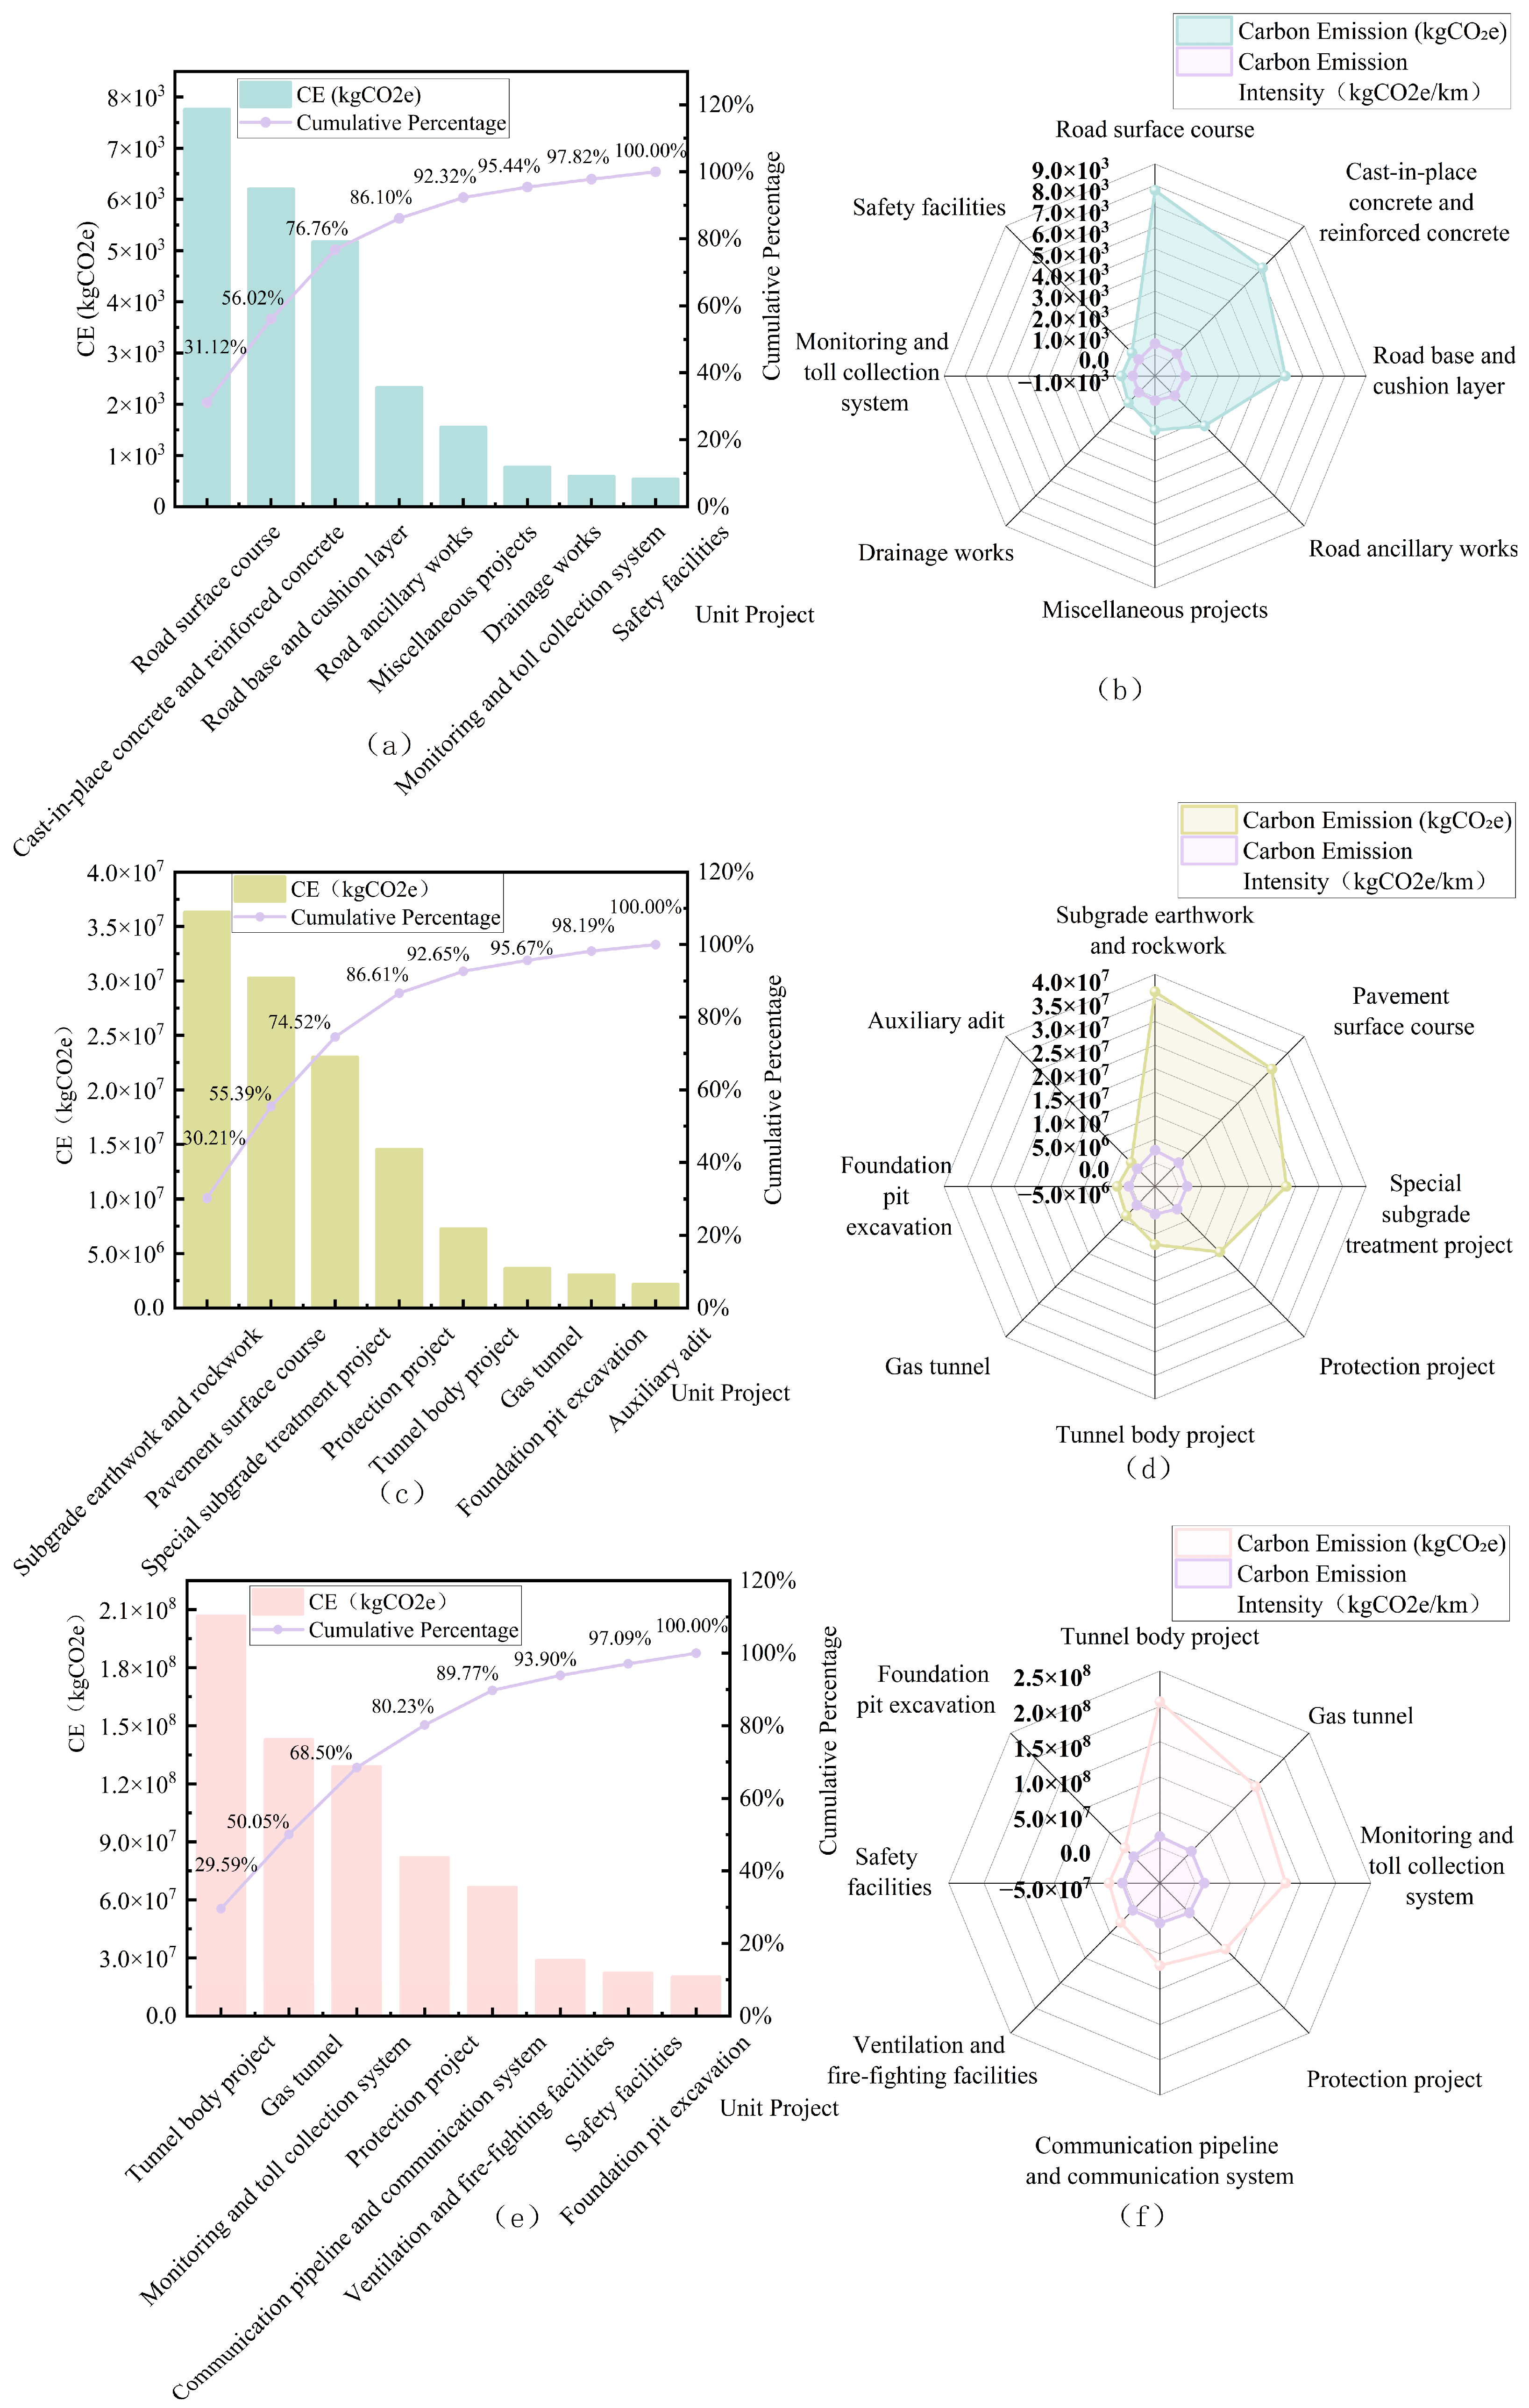
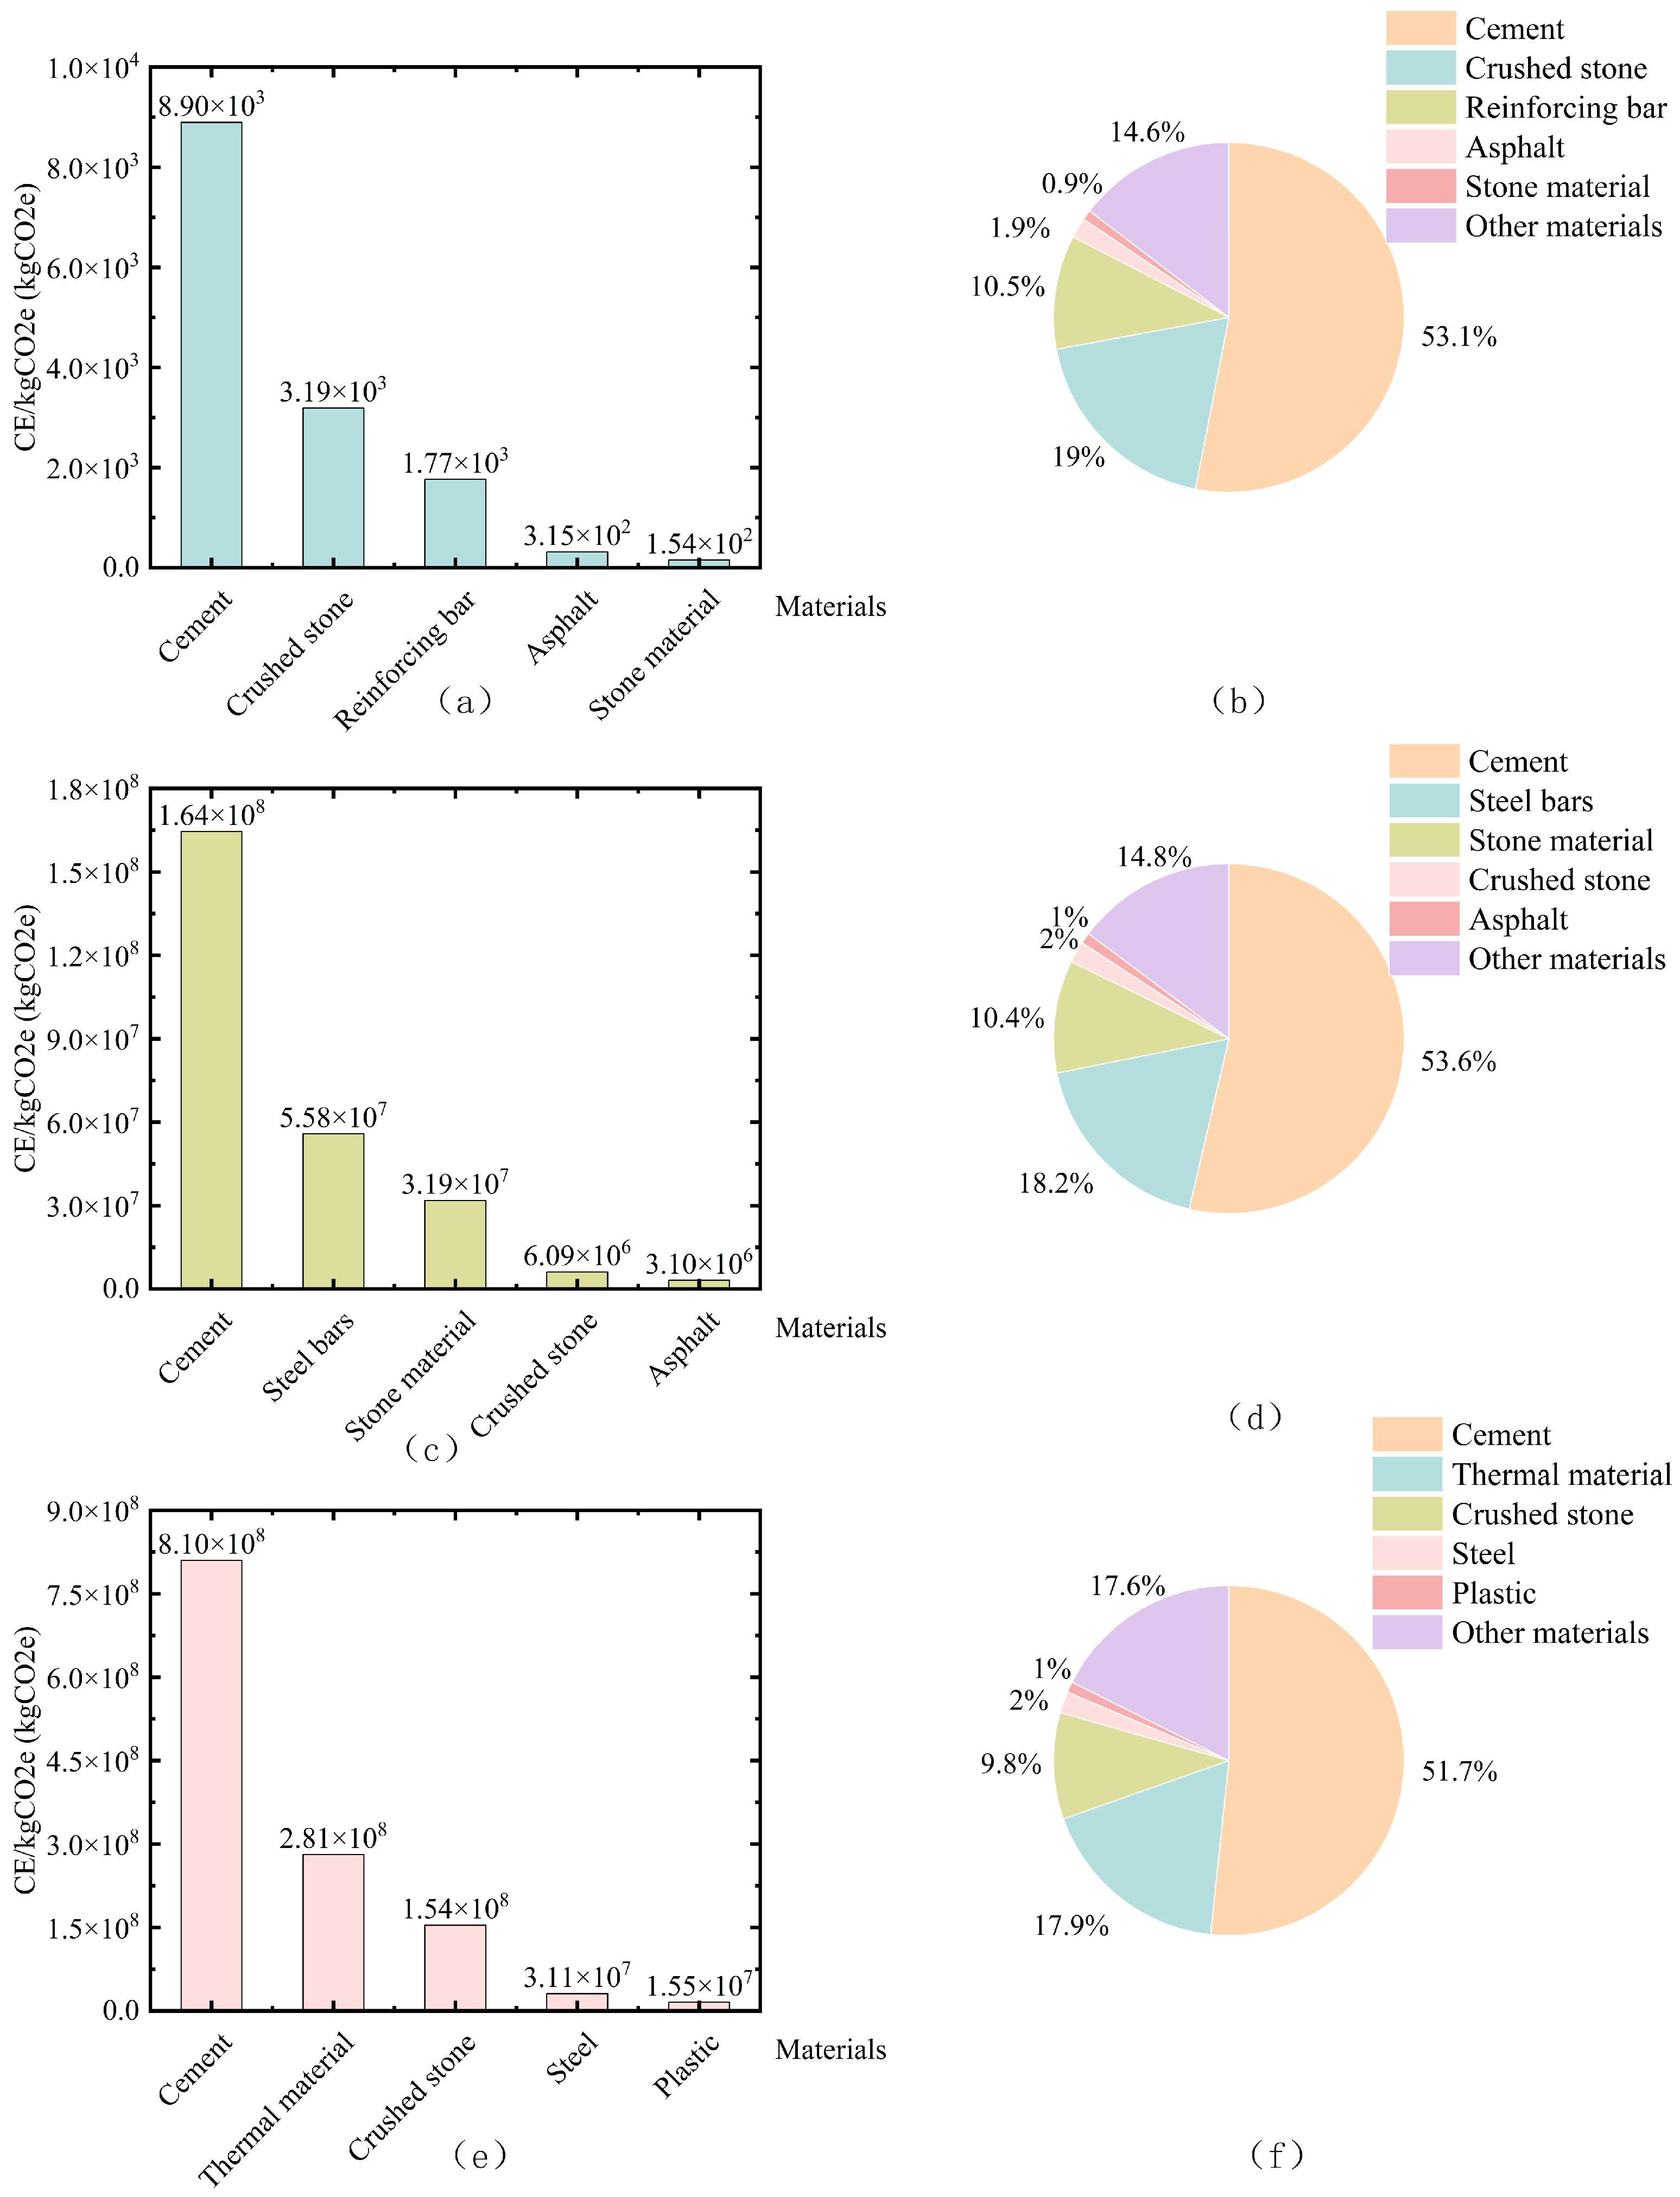
4.2. Carbon Accounting Results and Comparative Analysis

With the developed software, the life-cycle carbon emission in real-world construction engineering projects can be estimated by systematically integrating construction engineering cost data into the online carbon accounting platform, and utilizing the customized ICE for carbon emission factors. As shown in Figure 14, the bar and pie charts illustrate total emissions and the distribution of emissions across different stages, respectively. The small-scale YH Highway project emitted 4.25 × 10⁴ kgCO2e, with stage-wise contributions of 45.6% for production stage, 30.1% for construction stage, 17.1% for use stage and 7.2% for end-of-life stage. The contribution from use stage is based on the assumption of a 25-year service life, incorporating carbon emissions from the use of alternative materials, electricity consumption, and water usage during the operational stage, all of which are integrated into the platform’s calculations. The medium-scale ZJ Expressway project emitted 2.13 × 10⁸ kgCO2e, with corresponding contributions of 45.4% (production), 30.2% (construction), 18.0% (use), and 6.4% (end-of-life). Similarly, the large-scale LA Highway project recorded 8.34 × 10⁹ kgCO2e, with the following contributions: 45.3% (production), 30.1% (construction), 17.8% (use), and 6.8% (end-of-life). Cross-project analysis reveals a consistent distributional pattern for carbon emission in the construction projects: the production stage consistently dominated emissions (≈45%), followed by construction (≈30%), use (≈18%), and end-of-life stages (≈7%). The supplementary stage is the carbon reduction stage. The more materials reused, the higher the content of wood products, and the more greenery planted in the project, the greater the carbon reduction will be. In all three projects, the proportion of carbon sequestration through greening in the supplementary stage is the highest, reaching 80.1%, 79.8%, and 84.3%, respectively. In the future, the amount of green vegetation can be increased, or the material reuse rate and the proportion of wood products in materials can be increased, to achieve the goal of carbon neutrality.
The building material-level analysis (Figure 15) reveals the dominance of cement across all projects, accounting for 51.0–53.6% of emissions in the production stage. Secondary materials vary by project: crushed stone (18.1%) and steel reinforcement (10.0%) in YH Highway project; steel reinforcement (18.8%) and stone material (9.8%) in the ZJ Expressway project; thermal materials (17.9%) and crushed stone (10.1%) in LA Highway project. Notably, the top five materials collectively contribute 82.0–84.6% of emissions, with cement alone contributing over 51% in each project. This pattern suggests that optimizing cement production and exploring alternative low-carbon adhesives could yield significant emissions reductions.
In this work, particular attention is paid to the construction stage, due to its complexity in carbon quantification, substantial human activity, and significant mitigation potential. The existing research gaps in construction-stage emissions measurement also require further investigation. Our model leverages construction cost quota to enable more accurate quantitative analysis of this stage, as shown in Figure 16, the carbon emissions of the top three sub-projects in each of the three projects are significantly higher than those of the remaining sub-projects. From the fourth sub-project, there is a significant decline in carbon emissions. Therefore, a focused analysis is conducted on the top three sub-projects for each project as follows.
For YH Highway project, the carbon emissions in the construction stage are approximately 1.32 × 10⁴ kgCO2e. The top sub-projects account for 67.2% of the total emissions, with the top three sub-projects contributing 51.0% of the emissions. For the ZJ Expressway project, the carbon emissions in the construction stage are about 6.63 × 10⁷ kgCO2e. The top eight sub-projects contribute 67.53% of the total emissions, and the top three sub-projects account for 51.1%. For LA Highway project, the carbon emissions in the construction stage are approximately 2.61 × 10⁹ kgCO2e. The top eight sub-projects contribute 66.4% of the total emissions, with the top three sub-projects contributing 44.8%.
These results indicate that the top three sub-projects in each project contribute over 44% of the total carbon emissions in the construction stage, highlighting substantial carbon reduction potential. Therefore, to achieve more effective carbon mitigation, it is crucial to focus on the emissions from material transport, construction installation, and machinery usage for the top three carbon-emitting sub-projects in the construction stage of the above projects.

5. Comparison of Carbon Emission Estimation Based on Different Databases

5.1. Similarities in Carbon Emission Estimated by the Three Customized Databases

To assess the consistency and coherence of carbon accounting results across different databases, a comparison was conducted based on data from three real-world construction projects. By analyzing the carbon emissions calculated through three distinct databases, we can better understand the variations and potential causes behind these differences. Table 8 shows the total carbon emissions for the three projects calculated using the three databases, while Figure 17, Figure 18, Figure 19, Figure 20, Figure 21 and Figure 22 present life-cycle carbon accounting results for YH Highway, ZJ Expressway, and LA Highway using the customized EU-EFDB and IPCC-EFDB. These results, in conjunction with Figure 14, Figure 15 and Figure 16 (representing carbon emission accounting results with the customized ICE), reveal both differences and similarities.
Although the carbon accounting results from the three databases exhibit differences in specific values, they show a high degree of consistency in overall trends. For instance, in the case of the entire life-cycle carbon emissions of the YH Highway project, the proportion of carbon emissions across different stages exhibits similar trends across all three databases. In the production stage (as shown in Figure 14, Figure 17 and Figure 20), the carbon accounting proportion is 45.6% for the customized ICE, 45.7% for the customized EU-EFDB, and 46.5% for the customized IPCC-EFDB. The values are close, with deviations of less than 1%, demonstrating that the use stage is the primary source of carbon emissions in the LCA results for this project, a trend that remains consistent across all three databases. Additionally, the order of materials in terms of carbon emissions is also consistent across the three databases. For the LA Highway project (as shown in Figure 15, Figure 18 and Figure 21), cement, thermal materials, gravel, steel reinforcement, and plastic are consistently the top five materials contributing to carbon emissions in the production stage, with only minor differences in the specific proportions, but the ranking remains the same.
Furthermore, in the carbon emissions proportion of sub-projects, the results from the three databases also show a high degree of similarity. For example, in the ZJ Expressway project (as shown in Figure 16, Figure 19 and Figure 22), whether considering carbon accounting values or carbon emissions intensity, the top five sub-projects by proportion of emissions are consistently subgrade soil, excavation works, pavement surface layers, special subgrade treatment works, protective works, and tunnel works. The carbon emissions proportion error is within 3%, also indicating a high level of consistency.

5.2. Differences in Carbon Emission Estimated by the Three Customized Databases

Upon analyzing the carbon accounting results for the YH Highway, ZJ Expressway, and LA Highway projects, some differences were also observed in the results from the different databases. Specifically, the carbon accounting result for the YH Highway project was highest in the customized EU-EFDB, with a total carbon emission of 1.29 × 10⁵ kgCO2e, followed by 4.25 × 10⁴ kgCO2e in the customized ICE and 3.50 × 10⁴ kgCO2e in the customized IPCC-EFDB. The EU-EFDB result was 206.03% higher than that of ICE and 262.50% higher than that of IPCC-EFDB. For the ZJ Expressway project, the highest carbon accounting value was found in the customized IPCC-EFDB, with a total carbon emission of 6.54 × 10⁸ kgCO2e. This was followed by 5.99 × 10⁸ kgCO2e in the customized EU-EFDB and 2.13 × 10⁸ kgCO2e in the customized ICE. The IPCC-EFDB value was 8.54% higher than EU-EFDB and 25.94% higher than ICE. In the case of the LA Highway project, the carbon accounting result was highest in the customized ICE, with a total carbon emission of 8.39 × 10⁹ kgCO2e. This was followed by 3.35 × 10⁹ kgCO2e in the customized IPCC-EFDB and 3.29 × 10⁹ kgCO2e in the customized EU-EFDB. The ICE value was 112.14% higher than IPCC-EFDB and 111.11% higher than EU-EFDB.
These discrepancies arise from differences in carbon emission factors, calculation methods, and the estimation techniques used for different materials and construction phases across the databases. A more detailed analysis of the causes for these differences, broken down by stage, is provided as follows,
1.
YH Highway (EU-EFDB > ICE > IPCC-EFDB)
In the production stage, cement accounted for 51.4% of carbon emissions, and the carbon emission factor in the customized EU-EFDB (0.88 kgCO2e/kg) was 60.00% higher than the customized ICE (0.55 kgCO2e/kg) and 66.04% higher than the customized IPCC-EFDB (0.53 kgCO2e/kg). In the construction stage, the extensive use of cement concrete mixing stations in the road surface, cast-in-place concrete, and reinforced concrete led to the customized EU-EFDB having the highest carbon emission factor (63.96 kgCO2e/h), which was 11.20% higher than the customized ICE (57.51 kgCO2e/h) and 15.99% higher than the customized IPCC-EFDB (55.14 kgCO2e/h). In the use stage, the higher electricity consumption of the project facilities along the route caused the customized EU-EFDB to have the highest carbon accounting value. In the end-of-life stage, the project primarily used road transportation for waste disposal, and the carbon emission factor for this stage was highest in the customized EU-EFDB, at 1.12 × 10⁻⁴ kgCO2e/(kg·km), which was higher than the customized ICE (1.10 × 10⁻⁴ kgCO2e/(kg·km)) and the customized IPCC-EFDB (1.09 × 10⁻⁴ kgCO2e/(kg·km)).
2.
ZJ Expressway (IPCC-EFDB > EU-EFDB > ICE)
In the production stage, steel accounted for 18.80% of carbon emissions, and the carbon emission factor for steel in the customized IPCC-EFDB (2.67 kgCO2e/kg) was 8.54% higher than the customized EU-EFDB (2.46 kgCO2e/kg) and 25.94% higher than the customized ICE (2.12 kgCO2e/kg). In the construction stage, the heavy use of double steel wheel vibratory rollers for subgrade soil and excavation works led to a carbon emission factor of 76.46 kgCO2e/h in the customized IPCC-EFDB, which was 11.22% higher than the customized EU-EFDB (68.75 kgCO2e/h) and 15.82% higher than the customized ICE (66.02 kgCO2e/h). In the use stage, the high replacement of steel resulted in the highest carbon accounting value in the customized IPCC-EFDB. In the end-of-life stage, since waste was mainly reused on-site, the customized IPCC-EFDB had the highest carbon emission factor at 5.0 × 10⁻³ kgCO2e/kg, which was higher than the customized EU-EFDB (4.5 × 10⁻³ kgCO2e/kg) and the customized ICE (4.3 × 10⁻³ kgCO2e/kg).
3.
LA Highway (ICE > IPCC-EFDB > EU-EFDB)
In the production stage, the use of materials like rock wool boards for tunnel construction led to a higher carbon emission factor in the customized ICE (1.99 kgCO2e/kg) compared to the customized IPCC-EFDB (1.54 kgCO2e/kg), a difference of 29.22%, and compared to the customized EU-EFDB (1.49 kgCO2e/kg), a difference of 33.56%. In the construction stage, electrical equipment such as axial flow fans led to higher carbon emissions, and the customized ICE showed the highest carbon emission factor at 1.37 kgCO2e/h, which was 29.47% higher than the customized IPCC-EFDB (1.06 kgCO2e/h) and 34.90% higher than the customized EU-EFDB (1.01 kgCO2e/h). In the use stage, the project’s high water consumption caused the carbon emission factor to be highest in the customized ICE (1.41 kgCO2e/m3), which was 16.53% higher than the customized IPCC-EFDB (1.21 kgCO2e/m3) and 38.24% higher than the customized EU-EFDB (1.02 kgCO2e/m3). In the end-of-life stage, the project primarily used landfill disposal for waste, and the customized ICE had the highest carbon emission factor at 0.012 kgCO2e/kg, which was 9.09% higher than the customized IPCC-EFDB (0.011 kgCO2e/m3) and 33.33% higher than the customized EU-EFDB (0.009 kgCO2e/m3).

5.3. Length-Based Benchmarking of Carbon Emissions

For more meaningful comparisons across road infrastructure projects, the life-cycle carbon emissions of each case study were normalized based on total project length. Using the results derived from the customized ICE as an example, the emissions per kilometer provide a standardized metric that enables direct comparison among projects of varying scales. This approach highlights differences in carbon performance and offers a basis for evaluating emission efficiency in road infrastructure development. Based on the analysis conducted, Table 9 presents the life-cycle carbon emissions per kilometer for different projects.
The results in Table 9 reveal significant variation in carbon emissions per kilometer among the three infrastructure projects. The LA Highway project exhibits the highest emission intensity, with approximately 1.34 × 10⁸ kgCO2e/km. This can be primarily attributed to its extensive use of tunnels, which involve energy-intensive construction processes such as blasting, excavation, and specialized structural reinforcement. Additionally, the presence of large-scale bridges and complex interchanges further increases material and machinery usage, contributing to elevated emissions.
The ZJ Expressway project also demonstrates relatively high emissions per kilometer, estimated at 4.67 × 10⁷ kgCO2e/km. While not as carbon-intensive as LA Highway, it includes a moderate proportion of tunnels and bridges along the Hangzhou Bay area, but requiring significant structural works and marine-adjacent logistics, which increase embodied and construction-stage carbon. In contrast, the YH Highway project records the lowest emission intensity at 4.90 × 10³ kgCO2e/km. This is largely due to its simpler design and minimal tunnel or large-span bridge components. The project mainly involves surface road construction under relatively standard conditions, with fewer high-carbon-impact construction activities.

5.4. Discussions

When conducting LCA carbon accounting for construction projects using three different databases, the following two comments may be considered to help ensure the effective and rational use of the databases,
1.
Weighed average of carbon emission databases
By integrating the characteristics of each database, a weighted method of 1:1:1 can be employed for carbon accounting, giving equal weight to the three databases. For example, when calculating the weighted carbon accounting value for a specific stage, if the carbon accounting value from the customized ICE is denoted as A, the value from the customized EU-EFDB is B, and the value from the customized IPCC-EFDB is C, the final weighted carbon accounting value for this stage is calculated as (A × 1 + B × 1 + C × 1) ÷ (1 + 1 + 1) = (A + B + C) ÷ 3. Using this method, the carbon emissions for the product stage of YH Highway would be 6.88 × 10⁴ kgCO2e. This equal-weighted integration approach combines the advantages of each database, minimizing the limitations of relying on a single database. Table 10 presents the carbon emission accounting results after applying the 1:1:1 weighting of the three databases to the three different projects.
2.
Focus on the progress of carbon monitoring technologies and industry standards in construction
Currently, carbon monitoring technologies are still under development, and the construction industry has yet to establish unified, mature carbon emission monitoring standards. As a result, the coherence of carbon accounting continues to face significant uncertainty. However, with gradual technological advancements, the precision of carbon accounting methods is expected to improve substantially in the future. Emerging technologies, such as a novel blockchain-based carbon auditing tool designed to support the LCA of photovoltaic systems [59], are gradually being adopted within the construction sector. The maturation and widespread implementation of these technologies will significantly enhance the timeliness and coherence of carbon emission data. Concurrently, as industry standards within construction continue to be established and refined, the regulatory framework and consistency of carbon accounting will steadily improve [60]. Therefore, the future coherence of carbon accounting will rely heavily on these technological innovations and the advancement of construction industry standards.
3.
Similar International Projects and Standards
This study’s carbon accounting results show high consistency with international research on construction projects such as roads and tunnels. For instance, study in Norway [61] highlighted that road tunnels contribute significantly to carbon emissions due to the energy-intensive construction processes, with high emissions from materials like cement and concrete used in tunnel linings. Similarly, research in India [62] analyzed the carbon emissions of a state highway, identifying asphalt, aggregates, and steel as the primary emission materials. Assessment in Spain [63] on high-speed railway tunnels demonstrated that under various Rock Mass Rating (RMR) classes, the construction stages involving supporting, lining and tunnelling, which contributed most to carbon emissions, with concrete, diesel, and steel being the key factors. Moreover, study in Italy [64] focused on urban roads paving techniques, indicating that the combination of warm-mix asphalt and recycled materials effectively reduces carbon emissions. These studies all show that the production stage is the major source of carbon emissions and plays an impactful role over the life cycle, offering valuable insights for optimizing design and carbon emission reduction strategies. Furthermore, the life-cycle stage classification adopted in this study aligns well with internationally-recognized carbon accounting standards, such as EN 15978 [65], ISO 14040 [66], and ISO 14044 [67]. This methodological consistency improves the global comparability of carbon emission results, and therefore the proposed carbon accounting framework can be used across different regions and regulatory environments.

6. Conclusions

This study establishes a comprehensive framework of carbon emission accounting for construction projects, covering method development, database customization, and the implementation of web-based accounting software. The developed web-based carbon accounting software, based on LCA principles, has demonstrated its practical feasibility in performing complex carbon accounting tasks for real-world construction projects, especially in the construction stage, where the software can directly import the bill of quantities to calculate carbon emissions based on construction cost quotas. Carbon emission estimation is compared across five stages, including production, construction, use, end-of-life, and supplementary stages. The results show that the production stage contributes the most carbon emissions, with cement contributing a significant share in this stage. Emissions from the construction stage are the second largest, while emissions from the use stage are relatively lower, and those from the end-of-life stage are the smallest. The supplementary stage primarily deals with carbon reduction actions, such as reusing materials, greening, and increasing the use of wood products, which can help reduce the LCA carbon emissions. Furthermore, to mitigate the differences caused by using different databases in carbon accounting, a weighted-average method is proposed for more reliable results with the customized databases.
Regarding the application of this study to the construction industry, primary challenges associated with flexibility and accuracy arise. Firstly, current carbon accounting methods can only be applied to specific construction project types, and the customized carbon emission factor databases also have limited coverage, often failing to fully capture emissions from new materials and new construction techniques for different regions. Secondly, the validity of carbon accounting results critically depends on ongoing advancements in carbon monitoring technologies. At present, measurement precision and timeliness introduce inherent uncertainties in carbon emission quantification. Future efforts should focus on improving real-time monitoring of carbon emissions in construction sites, which may provide more reliable data to help calibrate carbon emission accounting results.
In this study, highway infrastructure projects were purposely selected as case studies, because these projects strictly follow standardized technical specifications and cost quota systems, making them well-suited for testing the proposed carbon accounting method that integrates emission factors with construction cost quota. Additionally, highway infrastructure projects involve complex and diverse construction processes, such as tunnel excavation, bridge construction, and large-scale earthworks, which help evaluate the method’s robustness and applicability across multiple stages of the project life cycle. However, it is important to note that the proposed method and the web-based carbon accounting tool developed in this work are designed to be adaptable to a wide range of construction project types. In future studies, the developed framework may be applied to typical building projects, such as residential and commercial buildings, to further demonstrate its general application in the broader construction sector.

Author Contributions

Methodology Conceptualization: Y.W. and F.L.; Data Curation: Y.W.; Localized Database Development: Y.W., W.D. and S.J.; Computational Methods & Software Development: F.L. and Y.W.; Data Acquisition: C.Z. and Y.L.; Manuscript Preparation: Y.W. and F.L.; Correspondence: F.L. All authors have read and agreed to the published version of the manuscript.

Funding

This research was partially supported by the ZJU-ZCCC Institute of Collaborative Innovation (Grant No. ZDJG2021005).

Institutional Review Board Statement

Not applicable.

Informed Consent Statement

Not applicable.

Data Availability Statement

The data and tools related with this research can be made accessible upon request.

Acknowledgments

We would like to express our gratitude to Zhejiang Communications Construction Group Co., Ltd. for providing the construction-related data and facilitating the field trips to the construction sites. The authors are grateful to the anonymous reviewers for their insightful comments.

Conflicts of Interest

Author Chaofeng Zhang was employed by the company Zhejiang Communications Construction Group Co., Ltd. Author Yanzhao Liu was employed by the company Zhejiang Communications Construction Underground Engineering Co., Ltd. The remaining authors declare that the research was conducted in the absence of any commercial or financial relationships that could be construed as a potential conflict of interest.

References

  1. Santos, A.K.; Ferreira, V.M.; Dias, A.C. Promoting decarbonisation in the construction of new buildings: A strategy to calculate the Embodied Carbon Footprint. J. Build. Eng. 2025, 103, 112037. [Google Scholar] [CrossRef]
  2. Zhong, Z.; Chen, Y.; Fu, M.; Li, M.; Yang, K.; Zeng, L.; Liang, J.; Ma, R.; Xie, Q. Role of CO2 geological storage in China’s pledge to carbon peak by 2030 and carbon neutrality by 2060. Energy 2023, 272, 127165. [Google Scholar] [CrossRef]
  3. Xian, Y.; Wang, H.; Zhang, Z.; Yang, Y.; Zhong, Y. Driving factors and reduction paths dynamic simulation optimization of carbon dioxide emissions in China’s construction industry under the perspective of dual carbon targets. Environ. Impact Assess. Rev. 2025, 112, 107789. [Google Scholar] [CrossRef]
  4. Ng, W.L.; Azmi, A.M.; Dahlan, N.Y.; Woon, K.S. Predicting life cycle carbon emission of green office buildings via an integrated LCA—MLR framework. Energy Build. 2024, 316, 114345. [Google Scholar] [CrossRef]
  5. Davis, A.; Quintana-Gallardo, A.; Audí, N.M.; Guillamón, I.G. The impact of lifespan assumptions in LCA: Comparing the replacement of building parts zversus building layers—A housing case study. Energy Build. 2025, 326, 115050. [Google Scholar] [CrossRef]
  6. Trabucco, D.; Perrucci, G. Steel–Timber hybrid buildings: A comparative life cycle assessment study of global warning potential impacts. Sustainability 2025, 17, 718. [Google Scholar] [CrossRef]
  7. Zhao, L.; Guo, C.; Chen, L.; Qiu, L.; Wu, W.; Wang, Q. Using BIM and LCA to calculate the life cycle carbon emissions of inpatient building: A case study in China. Sustainability 2024, 16, 5341. [Google Scholar] [CrossRef]
  8. Shaukat, M.M.; Luqman, M.; Asif, M.; Shuja, S.Z.; Qannan, M. A theoretical framework to promote LCA in the construction industry of Saudi Arabia. Sustainability 2024, 16, 3778. [Google Scholar] [CrossRef]
  9. Ma, L.; Azari, R.; Elnimeiri, M. A building information modeling-based life cycle assessment of the embodied carbon and environmental impacts of high-rise building structures: A case study. Sustainability 2024, 16, 569. [Google Scholar] [CrossRef]
  10. Ciacci, C.; Bazzocchi, F. Retrofitting of the Italian precast industrial building stock. LCA Anal. Decis. Mak. Tool J. Clean. Prod. 2024, 478, 143933. [Google Scholar]
  11. Hemmati, M.; Messadi, T.; Gu, H.; Hemmati, M. LCA operational carbon reduction based on energy strategies analysis in a mass timber building. Sustainability 2024, 16, 6579. [Google Scholar] [CrossRef]
  12. Zhan, Z.; Xia, P.; Xia, D. Study on carbon emission measurement and influencing factors for prefabricated buildings at the materialization stage based on LCA. Sustainability 2023, 15, 13648. [Google Scholar] [CrossRef]
  13. Warrier, G.A.; Palaniappan, S.; Habert, G. Classification of sources of uncertainty in building LCA. Energy Build. 2024, 305, 113892. [Google Scholar] [CrossRef]
  14. Kamali, M.; Hewage, K.; Sadiq, R. Conventional versus modular construction methods: A comparative cradle-to-gate LCA for residential buildings. Energy Build. 2019, 204, 109479. [Google Scholar] [CrossRef]
  15. Liu, Y.; Yang, J.; Wang, H.; Liu, S.; Fan, Y.; Zhou, Y.; Gong, M.; Huang, W. Energy consumption and carbon emissions of mixing plant in asphalt pavement construction with a case study in China and reduction measures. Case Stud. Constr. Mater. 2025, 22, e04165. [Google Scholar] [CrossRef]
  16. Guo, Y.; Dong, C.; Chen, Z.; Zhao, S.; Sun, W.; He, W.; Zhang, L.; Wang, Y.; Hu, N.; Guo, C. Evaluation of greenhouse gas emissions in subway tunnel construction. Undergr. Space 2025, 22, 263–279. [Google Scholar] [CrossRef]
  17. Li, X.J.; Xie, W.J.; Jim, C.Y.; Feng, F. Holistic LCA evaluation of the carbon footprint of prefabricated concrete stairs. J. Clean. Prod. 2021, 329, 129621. [Google Scholar] [CrossRef]
  18. Xu, H.; Kim, J.I.; Chen, J. Improved framework for estimating carbon emissions from prefabricated buildings during the construction stage: Life cycle assessment and case study. Build. Environ. 2025, 272, 112599. [Google Scholar] [CrossRef]
  19. Zou, Z.; Kong, C.; Gu, S.; Zhao, X.; Yang, L.; Zhou, Y.; Huang, G.; Gao, X. Research on carbon emission quantification and evaluation for prefabricated inverted arch construction in drill and blast tunnels. J. Clean. Prod. 2024, 459, 142485. [Google Scholar] [CrossRef]
  20. Chen, X.; Huang, M.; Bai, Y.; Zhang, Q.B. Sustainability of underground infrastructure—Part 1: Digitalisation-based carbon assessment and baseline for TBM tunnelling. Tunn. Undergr. Space Technol. 2024, 148, 105776. [Google Scholar] [CrossRef]
  21. Li, X.; Zheng, Y. Using LCA to research carbon footprint for precast concrete piles during the building construction stage: A China study. J. Clean. Prod. 2020, 245, 118754. [Google Scholar] [CrossRef]
  22. Kaitouni, S.I.; Gargab, F.Z.; Tabit, A.; Mabrouki, M.; Lamdouar, N.; Jamil, A.; Ahachad, M. A life cycle carbon dioxide equivalent emissions assessment of zero carbon building in hot semi-arid climate region: Case study. Results Eng. 2024, 23, 102589. [Google Scholar] [CrossRef]
  23. Kuru, A.; Lyu, K.; Gocer, O.; Brambilla, A.; Prasad, D. Climate risk assessment of buildings: An analysis of operating emissions of commercial offices in Australia. Energy Build. 2024, 315, 114336. [Google Scholar] [CrossRef]
  24. Fenton, S.K.; Munteanu, A.; De Rycke, K.; De Laet, L. Embodied greenhouse gas emissions of buildings—Machine learning approach for early stage prediction. Build. Environ. 2024, 257, 111523. [Google Scholar] [CrossRef]
  25. Martin-Valmayor, M.A.; Infante, J.; Carmona-González, N.; Gil-Alana, L.A. US CO2 emissions and IPCC components: Evidence of persistence using fractional integration. Environ. Sustain. Indic. 2025, 26, 100684. [Google Scholar] [CrossRef]
  26. Zhang, X.; Heeren, N.; Bauer, C.; Burgherr, P.; McKenna, R.; Habert, G. The impacts of future sectoral change on the greenhouse gas emissions of construction materials for Swiss residential buildings. Energy Build. 2024, 303, 113824. [Google Scholar] [CrossRef]
  27. Karlsson, I.; Rootzén, J.; Johnsson, F.; Erlandsson, M. Achieving net-zero carbon emissions in construction supply chains—A multidimensional analysis of residential building systems. Dev. Built Environ. 2021, 8, 100059. [Google Scholar] [CrossRef]
  28. Luo, X.; Zhang, Y.; Song, Z. Analysis of carbon emission characteristics and establishment of prediction models for residential and office buildings in China. Build. Environ. 2025, 267, 112208. [Google Scholar] [CrossRef]
  29. Lasvaux, S.; Habert, G.; Peuportier, B.; Chevalier, J. Comparison of generic and product-specific Life Cycle Assessment databases: Application to construction materials used in building LCA studies. Int. J. Life Cycle Assess. 2015, 20, 1473–1490. [Google Scholar] [CrossRef]
  30. Arash, M.; Hasan, K.M.A.; Golam, K. Assessing the environmental impact of building houses in remote areas: 3D printing vs. traditional construction techniques. J. Build. Eng. 2025, 102, 111968. [Google Scholar] [CrossRef]
  31. Iezzi, B.; Brady, R.; Sardag, S.; Eu, B.; Skerlos, S. Growing bricks: Assessing biocement for lower embodied carbon structures. Procedia CIRP 2019, 80, 470–475. [Google Scholar] [CrossRef]
  32. Khan, S.A.; Jassim, M.; Ilcan, H.; Sahin, O.; Bayer, İ.R.; Sahmaran, M.; Koc, M. 3D printing of circular materials: Comparative environmental analysis of materials and construction techniques. Case Stud. Constr. Mater. 2023, 18, e02059. [Google Scholar] [CrossRef]
  33. SinoCarbon Technology Co., Ltd. SinoCarbon. Available online: https://cloud.sinocarbon.cn/product/ecm/ (accessed on 4 March 2025).
  34. Starostka-Patyk, M. New Products Design Decision Making Support by SimaPro Software on the Base of Defective Products Management. Procedia Comput. Sci. 2015, 65, 1066–1074. [Google Scholar] [CrossRef]
  35. Orr, E. Sustainable Waste Management in Schools. Master Thesis, University of Rhode Island, Kingston, RI, USA, 2021. [Google Scholar]
  36. Tam, W.V.; Le, K.N.; Tran, C.N.; Wang, J.Y. A review on contemporary computational programs for Building’s life-cycle energy consumption and greenhouse-gas emissions assessment: An empirical study in Australia. J. Clean. Prod. 2018, 172, 4220–4230. [Google Scholar] [CrossRef]
  37. Tam, V.W.; Zhou, Y.; Illankoon, C.; Le, K.N. A critical review on BIM and LCA integration using the ISO 14040 framework. Build. Environ. 2022, 213, 108865. [Google Scholar] [CrossRef]
  38. GB/T 50854-2024; Standard for Quantity Calculation of Housing Construction and Decoration Projects. Ministry of Housing and Urban-Rural Development of the People’s Republic of China: Beijing, China, 2024.
  39. JTG/T 3832-2018; Quotations for Highway Engineering Budgeting. Ministry of Transport of the People’s Republic of China: Beijing, China, 2018.
  40. Symons, K. Book review: Embodied Carbon: The Inventory of Carbon and Energy (ICE). A BSRIA Guide. Proc. Inst. Civ. Eng. Energy 2011, 164, 206. [Google Scholar]
  41. Circular Ecology. Embodied Carbon—The ICE Database. Available online: https://circularecology.com/embodied-carbon-footprint-database.html (accessed on 4 March 2025).
  42. Crippa, M.; Janssens-Maenhout, G.; Dentener, F.; Guizzardi, D.; Sindelarova, K.; Muntean, M.; van Dingenen, R.; Granier, C. Forty years of improvements in European air quality: Regionalpolicy-industry interactions with global impacts. Atmos. Chemi-Stry Phys. 2016, 16, 3825–3841. [Google Scholar] [CrossRef]
  43. European Environment Agency. EMEP/EEA Air Pollutant Emission Inventory Guidebook 2023; European Environment Agency: Copenhagen, Denmark, 2023; Available online: https://www.eea.europa.eu/en/analysis/publications/emep-eea-guidebook-2023 (accessed on 4 March 2025).
  44. Muñoz, I.; Schmidt, J.; Weidema, B.P. The indirect global warming potential of methane oxida-tion in the IPCC’s sixth assessment report. Environ. Res. Lett. 2024, 19, 121002. [Google Scholar] [CrossRef]
  45. WMO; UNEP. Intergovernmental Panel on Climate Change. Available online: https://www.ipcc-nggip.iges.or.jp/efdb/find_ef.php (accessed on 4 March 2025).
  46. GB/T 51366-2019; Standard for Building Carbon Emission Calculation. Ministry of Housing and Urban-Rural Development of the People’s Republic of China: Beijing, China, 2019.
  47. China City Greenhouse Gas Working Group. China Products Carbon Footprint Factors Database. Available online: https://lca.cityghg.com/pages/article-view/60 (accessed on 4 March 2025).
  48. Yang, J.; Wang, Z.; Li, G.; Wu, C.; Liu, F.; Chen, Y. AutoBPS-carbon: A tool to estimate multi-year dynamic embodied and operational carbon emissions in the building sector. J. Build. Eng. 2025, 101, 111942. [Google Scholar] [CrossRef]
  49. Melanta, S.; Miller-Hooks, E.; Avetisyan, H.G. Carbon footprint estimation tool for transportation construction projects. J. Constr. Eng. Manag. 2013, 139, 547–555. [Google Scholar] [CrossRef]
  50. Cui, P. The Establishment of a Life-Cycle Carbon Emission Factor Database for Building and Research. Master Thesis, Southeast University, Nanjing, China, 2015. (In Chinese). [Google Scholar]
  51. GB/T 2589-2020; General Rules for Calculation of the Comprehensive Energy Consumption. State Administration for Market Regulation (SAMR) and the Standardization Administration of China (SAC): Beijing, China, 2020.
  52. Intergovernmental Panel on Climate Change. 2006 IPCC Guidelines for National Greenhouse Gas Inventories. Available online: https://www.ipcc-nggip.iges.or.jp/public/2006gl/chinese/index.html (accessed on 4 March 2025).
  53. National Development and Reform Commission (NDRC) Office. Guidelines for Corporate Greenhouse Gas Emission Accounting and Reporting (Trial Version). Available online: https://www.ndrc.gov.cn/xxgk/zcfb/tz/201311/t20131101_963960.html (accessed on 4 March 2025).
  54. The Institution of Structural Engineers. How to Calculate Embodied Carbon. Available online: https://www.istructe.org/ (accessed on 4 March 2025).
  55. Zib, L., III; Byrne, D.M.; Marston, L.T.; Chini, C.M. Operational carbon footprint of the U.S. water and wastewater sector’s energy consumption. J. Clean. Prod. 2021, 321, 128815. [Google Scholar] [CrossRef]
  56. JTG H10-2009; Technical Specifications of Maintenance for Highway. Ministry of Transport of the People’s Republic of China: Beijing, China, 2009.
  57. JTG 5142-2019; Technical Specifications for Maintenance of Highway Asphalt Pavement. Ministry of Transport of the People’s Republic of China: Beijing, China, 2019.
  58. The Central People’s Government of the People’s Republic of China. Regulations on the Administration of Toll Highways. Available online: https://www.gov.cn/zwgk/2005-05/23/content_241.htm (accessed on 4 March 2025).
  59. Luo, Y.; Shen, J.; Liang, H.; Sun, L.; Dong, L. Carbon monitoring, reporting and verification (MRV) for cleaner built environment: Developing a solar photovoltaic blockchain tool and applications in Hong Kong’s building sector. J. Clean. Prod. 2024, 471, 143456. [Google Scholar] [CrossRef]
  60. Röck, M.; Balouktsi, M.; Saade, M.R.M. Embodied carbon emissions of buildings and how to tame them. One Earth 2023, 6, 1458–1464. [Google Scholar] [CrossRef]
  61. Peñaloza, G.A.; Vignisdottir, H.R.; Kristensen, T.; Ramsnes, E. Greenhouse gas emission reduction potential in road tunnels—Can we reach the European Union goals with existing materials and technologies? Tunn. Undergr. Space Technol. Inc. Trenchless Technol. Res. 2024, 153, 106011. [Google Scholar] [CrossRef]
  62. Chaudhary, A.; Akhtar, A. A novel approach for environmental impact assessment of road construction projects in India. Environ. Impact Assess. Rev. 2024, 106, 107477. [Google Scholar] [CrossRef]
  63. Damián, R.; Zamorano, C.I. Environmental impact assessment of high-speed railway tunnel construction: A case study for five different rock mass rating classes. Transp. Geotech. 2022, 36, 100817. [Google Scholar] [CrossRef]
  64. Praticò, F.G.; Giunta, M.; Mistretta, M.; Gulotta, T.M. Energy and Environmental Life Cycle Assessment of Sustainable Pavement Materials and Technologies for Urban Roads. Sustainability 2020, 12, 704. [Google Scholar] [CrossRef]
  65. EN 15978-2011; Sustainability of Construction Works—Assessment of Environmental Performance of Buildings—Calculation Method. European Committee for Standardization: Brussels, Belgium, 2011.
  66. ISO 14040-2006; Environmental Management—Life Cycle Assessment—Principles and Framework. International Organization for Standardization: Geneva, Switzerland, 2006.
  67. ISO 14044-2006; Environmental Management—Life Cycle Assessment—Requirements and Guidelines. International Organization for Standardization: Geneva, Switzerland, 2006.
Figure 1. Summary and organization of the proposed work.
Sustainability 17 05090 g001
Figure 2. System boundaries for carbon emission in construction projects.
Sustainability 17 05090 g002
Figure 3. Integration of construction cost quota data and bill of quantities for calculating construction-stage carbon emission.
Sustainability 17 05090 g003
Figure 4. Hierarchical calculation of carbon emission in the construction stage exemplified by YH Highway project based on the structure of “construction project—sub-project—item project—quota sub-item”.
Sustainability 17 05090 g004
Figure 7. Schematic diagram of the summary of calculation formulas for this model.
Sustainability 17 05090 g007
Figure 9. Graphical User Interface for the carbon emission accounting tool.
Sustainability 17 05090 g009
Figure 10. Front-end/Back-end workflow chart for the carbon emission accounting tool.
Sustainability 17 05090 g010
Figure 12. Construction stage data interface for LA Highway with the customized ICE. The “Number” column represents the code corresponding to the sub-project’s engineering cost quota [39].
Sustainability 17 05090 g012
Figure 13. User interface shows the total carbon accounting results for LA Highway, including itemized carbon emission amount, bar chart and pie chart for different stages.
Sustainability 17 05090 g013
Figure 14. Life-cycle emission analysis using the customized ICE: (a,c,e) Bar charts representing the total emissions for YH Highway/ZJ Expressway/LA Highway project, respectively; (b,d,f) Pie charts representing the relative contribution of carbon emission for each carbon emission stage, respectively.
Sustainability 17 05090 g014
Figure 15. Production stage carbon emission analysis using ICE: (a,b) YH Highway material breakdown & percentage, (c,d) ZJ Expressway material breakdown & percentage, (e,f) LA Highway material breakdown & percentage.
Sustainability 17 05090 g015
Figure 16. Construction stage sub-projects analysis with ICE: (a,c,e) Pareto charts: Top 8 emission sources (b,d,f) Radar charts: emission intensity vs. total emissions.
Sustainability 17 05090 g016
Figure 17. Life-cycle emission analysis using customized EU-EFDB: (a,c,e) Bar charts: total emissions for YH Highway, ZJ Expressway, and LA Highway (b,d,f) Pie charts: stage contributions (excluding supplementary stage).
Sustainability 17 05090 g017
Figure 18. Production stage material analysis using customized EU-EFDB: (a,b) Material breakdown and percentages for YH Highway (c,d) Material breakdown and percentages for ZJ Expressway (e,f) Material breakdown and percentages for LA Highway.
Sustainability 17 05090 g018
Figure 19. Construction stage sub-projects analysis using customized EU-EFDB: (a,c,e) Pareto charts of top 8 emission sources (b,d,f) Radar charts of emission intensity vs. total emissions.
Sustainability 17 05090 g019
Figure 20. Life-cycle emission analysis using the customized IPCC-EFDB: (a,c,e) Bar charts: total emissions for YH Highway, ZJ Expressway, and LA Highway (b,d,f) Pie charts: stage contributions (excluding supplementary stage).
Sustainability 17 05090 g020
Figure 21. Production stage material analysis using customized IPCC-EFDB: (a,b) Material breakdown and percentages for YH Highway (c,d) Material breakdown and percentages for ZJ Expressway (e,f) Material breakdown and percentages for LA Highway.
Sustainability 17 05090 g021
Figure 22. Construction stage sub-projects analysis using customized IPCC-EFDB: (a,c,e) Pareto charts of top 8 emission sources (b,d,f) Radar charts of carbon emission intensity vs. total emissions.
Sustainability 17 05090 g022
Table 1. Comparison of typical carbon accounting software.
Software NameFunctionalitiesReference
SimaPro1. Enhance multi-product carbon accounting across diverse impact categories.
2. Support detailed life-cycle analysis for environmental decision-making.
Starostka-Patyk et al. [34]
Umberto1. Focuse on comprehensive product system life-cycle evaluations.
2. Identify sustainability improvements for optimized system performance.
Orr et al. [35]
Gabi1. LCA calculations with detailed process breakdown.
2. Comprehensive database with efficient data retrieval.
Tam et al. [36]
Carbon
e-Management
1. Cloud-based SaaS model with low implementation cost.
2. One-stop solution for Small and Medium Enterprises (SME) carbon management.
SinoCarbon [33]
Table 2. Life-cycle stages in the proposed model.
No.StagesContentCategory
1ProductionCarbon emissions during material extraction, processing, and manufacturing of construction componentsTraditional
Life-cycle Stages
2ConstructionCarbon emissions during the transportation of construction materials to the site, the installation of components, and the use of machinery
3Use Carbon emissions generated through building usage, maintenance, repair, renovation, and operational electricity/water consumption
4End-of-lifeCarbon emissions from building demolition, deconstruction, waste material transportation, and waste disposal
5SupplementaryCarbon benefits from material recycling (e.g., scrap steel substitution), reuse, and biogenic carbon sequestration through greening initiativesAdditional Life-cycle Stage
Table 3. Carbon emission types across life-cycle stages, where symbol √ indicates inclusion. The table explains which types of carbon emission factors are encompassed within each stage.
No.Emission TypeProduction StageConstruction StageUse StageEnd-of-Life StageSupplementary Stage
1Material Production
2Transportation
3Construction Installation
4Machinery Equipment
5Material Replacement
6Structural Demolition
7Waste Management
8Operational Energy Use
9Reuse Sequestration
10Biogenic Carbon Sequestration
11Afforestation Sequestration
Table 6. Project profiles and key specifications.
Project Title YH HighwayZJ ExpresswayLA Highway
Site Location Yuhang DistrictZhejiang ProvinceLin’an District
Length8.673 km4.560 km62.715 km
Project TypeRoad & Bridge & Tunnel
Project
Overview
The 8.673 km dual six-lane first-class highway, including surface roads and bridges, serves as a representative case for carbon accounting in highway construction.The 4.560 km expressway in Zhejiang Province enhances regional connectivity in the Yangtze River Delta and is key for infrastructure carbon assessment.The 62.715 km expressway expansion involves subgrades, bridges, tunnels, and interchanges, making it suitable for validating carbon accounting in large-scale projects.
Table 7. Some key real-world engineering data related with carbon emission.
StageMetricYH HighwayZJ ExpresswayLA Highway
ProductionMaterial types involved49 types101 types117 types
Most consumed material & quantity32.5 Cement
(5398.42 t)
32.5 Cement
(24,589.23 t)
C25 Cast-in-place Concrete
(26,578.12 m3)
ConstructionSub-project 9153285
Item project11216314
UseMost frequent replacement material & quantityPetroleum Asphalt
(16.78 kg)
Rubble
(89.11 m3)
Gravel
(97.46 m3)
Electricity consumption1.99 × 107 kWh1.09 × 1011 kWh4.84 × 1011 kWh
Water consumption4.67 × 106 m39.79 × 107 m38.97 × 108 m3
End-of-lifePredominant waste transport & distanceRoad Transport
(87 km)
Road Transport
(169 km)
Rail Transport
(187 km)
SupplementaryPrimary carbon-sequestration plants & spacingCamphor Tree
(3–5 m)
London Planetree
(2–4 m)
Huanshan Katsura Tree
(5–6 m)
Table 8. Life-cycle carbon emissions estimated using three databases.
ProjectCustomized ICE
(kgCO2e)
Customized EU-EFDB (kgCO2e)Customized IPCC-EFDB (kgCO2e)
YH Highway4.25 × 1041.29 × 1053.50 × 104
ZJ Expressway2.13 × 1085.99 × 1086.54 × 108
LA Highway8.39 × 1093.29 × 1093.35 × 109
Table 9. Life-cycle carbon emissions per kilometer for different projects.
ProjectTotal Length (km)Total Emissions (kgCO2e)Emissions per km (kgCO2e/km)
YH Highway8.6734.25 × 1044.90 × 103
ZJ Expressway4.5602.13 × 1084.67 × 107
LA Highway62.7158.39 × 1091.34 × 108
Table 10. Carbon emissions values for different construction projects using 1:1:1 weighting of the three databases.
Project NameWeighted Carbon Emission Value (kgCO2e)
YH Highway6.88 × 104
ZJ Expressway2.71 × 108
LA Highway5.01 × 109
Disclaimer/Publisher’s Note: The statements, opinions and data contained in all publications are solely those of the individual author(s) and contributor(s) and not of MDPI and/or the editor(s). MDPI and/or the editor(s) disclaim responsibility for any injury to people or property resulting from any ideas, methods, instructions or products referred to in the content.

