Article

Research on Carbon Emission Reduction and Benefit Pathways for Chinese Urban Renewal Market Players Based on a Tripartite Evolutionary Game: A Carbon Trading Perspective

by
Han Zou
1,2,
Yuqing Li
1,
Cong Sun
3,* and
Ting Wu
1
1
School of Civil Engineering Architecture and Environment, Hubei University of Technology, Wuhan 430068, China
2
Key Laboratory of Intelligent Health Perception and Ecological Restoration of Rivers and Lakes, Ministry of Education, Hubei University of Technology, Wuhan 430068, China
3
School of Architecture and Urban Planning, Shenzhen University, Shenzhen 518060, China
*
Author to whom correspondence should be addressed.
Sustainability 2025, 17(11), 5089; https://doi.org/10.3390/su17115089
Submission received: 19 April 2025 / Revised: 26 May 2025 / Accepted: 30 May 2025 / Published: 1 June 2025

Abstract

As the largest carbon emitter globally, China has formally adopted dual-carbon targets of achieving a carbon peak by 2030 and carbon neutrality by 2060. Urban renewal, as an essential approach to promoting sustainable urban development, plays a critical role in realizing dual-carbon targets. However, carbon emission reduction in urban renewal involves multiple stakeholders with divergent interests, significantly hindering the effective achievement of emission reduction goals. In this context, this paper innovatively selects the government, developers, and construction enterprises as game subjects and constructs an evolutionary game model of the three parties’ participation in carbon emission reduction from the perspective of carbon trading. Through simulation analysis, it explores the impacts of government subsidies, penalty mechanisms, additional benefits, and carbon trading on stakeholder decision-making. The findings indicate the following: (1) The emission reduction process in urban renewal follows an evolutionary pattern of the initial, growth, and mature stages. (2) Sensitivity analysis demonstrates that government subsidies and penalty mechanisms play important roles. (3) Additional benefits serve as intrinsic motivation for developers and construction enterprises to reduce emissions, while a well-developed carbon trading market provides additional incentives and benefit pathways for stakeholders. By integrating urban renewal with carbon trading for the first time, this study aims to enhance stakeholders’ engagement in emission reduction and provide practical reference suggestions, thereby contributing to sustainable urban development.

1. Introduction

With carbon emissions increasingly limiting urban development [1,2], China accounted for 31.5% of global carbon emissions in 2023 according to official data from Carbon Monitor, facing enormous pressure to reduce emissions [3]. At the 75th session of the United Nations General Assembly, to address this challenge, China formally proposed the dual-carbon goals of achieving a carbon peak by 2030 and carbon neutrality by 2060 [4], and it formulated a series of policy measures at the national level. Cities are important vehicles for economic development and are the most significant sites of resource consumption and carbon emissions [5]. The report to the 20th National Congress of the Communist Party of China clearly highlights the implementation of urban renewal actions. ‘Urban renewal’ in China does not have a unified definition, but it generally refers to a metabolic process of urban development [6]. It includes stages such as construction, operation, and demolition, which can emit large amounts of carbon dioxide [7]. Urban renewal not only involves the rebuilding of spatial forms but is also a key component in achieving dual-carbon goals [8]. Thus, integrating carbon reduction strategies into urban regeneration is crucial for achieving dual-carbon targets and promoting sustainable urban development.
In this context, current research is focused on how to promote carbon reduction in urban renewal, and several scholars have studied this topic from different perspectives. Liu et al. identified the key elements and strategies of carbon emission reduction in urban renewal through bibliometric analysis, emphasizing the comprehensive benefits of starting from multiple elements such as buildings and energy and adopting strategies for optimizing space, improving energy efficiency, and increasing carbon sinks to achieve carbon emission reduction targets [9]. Cheng et al. utilized carbon accounting methods and efficiency assessment models to quantify carbon emission potentials and proposed a sustainable regeneration decision-making framework to promote low-carbon concepts in urban renewal [10]. Zhang et al. constructed an estimation model oriented to the design of renewal strategies from the perspective of the entire life cycle of a building and proposed that low-carbon design strategies such as rational construction and demolition, low-carbon materials, and plant carbon sequestration should be adopted to significantly reduce the carbon emissions of urban renewal [11]. However, previous studies focused on the assessment of carbon emission reduction potential, carbon emission estimation, and specific strategy design while ignoring the wide range of stakeholders involved in urban renewal [12], including the government, developers, construction enterprises, etc., whose decision-making discrepancies influence the implementation of emission reduction strategies in urban renewal, thus hindering the achievement of carbon emission reduction targets. Therefore, this study aims to investigate how to effectively reduce the conflict of interest between subjects and enhance stakeholder engagement in emission reduction efforts within urban renewal.
Game theory is widely applied to study the strategic choices of different stakeholders and is an effective way to resolve conflicts of interest [13]. When making carbon reduction decisions, governments, developers, and construction enterprises engage in a strategic game. Unlike traditional games, evolutionary game theory is closer to reality [14]. Its participants do not need to be completely rational; they gradually adjust their strategies through continuous learning to improve their benefits [15]. In recent years, there have been very extensive studies on the evolutionary game of carbon emission reduction. Wei et al. constructed a three-party game evolution model among the government, high-carbon emission manufacturers, and carbon allowance suppliers, aiming to provide a reference for the decarbonization paths of supply chain member enterprises [16]. Xia et al. proposed the idea that energy-intensive enterprises cannot realize low-carbon transition without government decision-making during the evolutionary game [17]. Wang et al. reported that government subsidies largely influence the decision-making processes of construction enterprises, which helps to promote sustainable urban development [18]. Current research mainly focuses on industries with high carbon emissions and high energy consumption, while limited attention has been given to the construction field, and there remains a research gap in the field of urban renewal, which is currently being actively promoted by the state and has not been explored enough.
In addition, some studies have shown that carbon trading can provide market incentives for multiple stakeholders to adopt more proactive carbon reduction strategies [19], but its specific operational mechanisms within urban renewal processes remain unclear. Therefore, building on existing studies, this study establishes a tripartite evolutionary game model from a carbon trading perspective, which explores the game strategies of governments, developers, and construction enterprises at different stages. The main contributions of this study are as follows:
(1)
By constructing a model from the perspective of carbon trading and fully considering the key role of the market mechanism in promoting carbon emission reduction, it more accurately reflects the strategic choices and game process of each party at different stages.
(2)
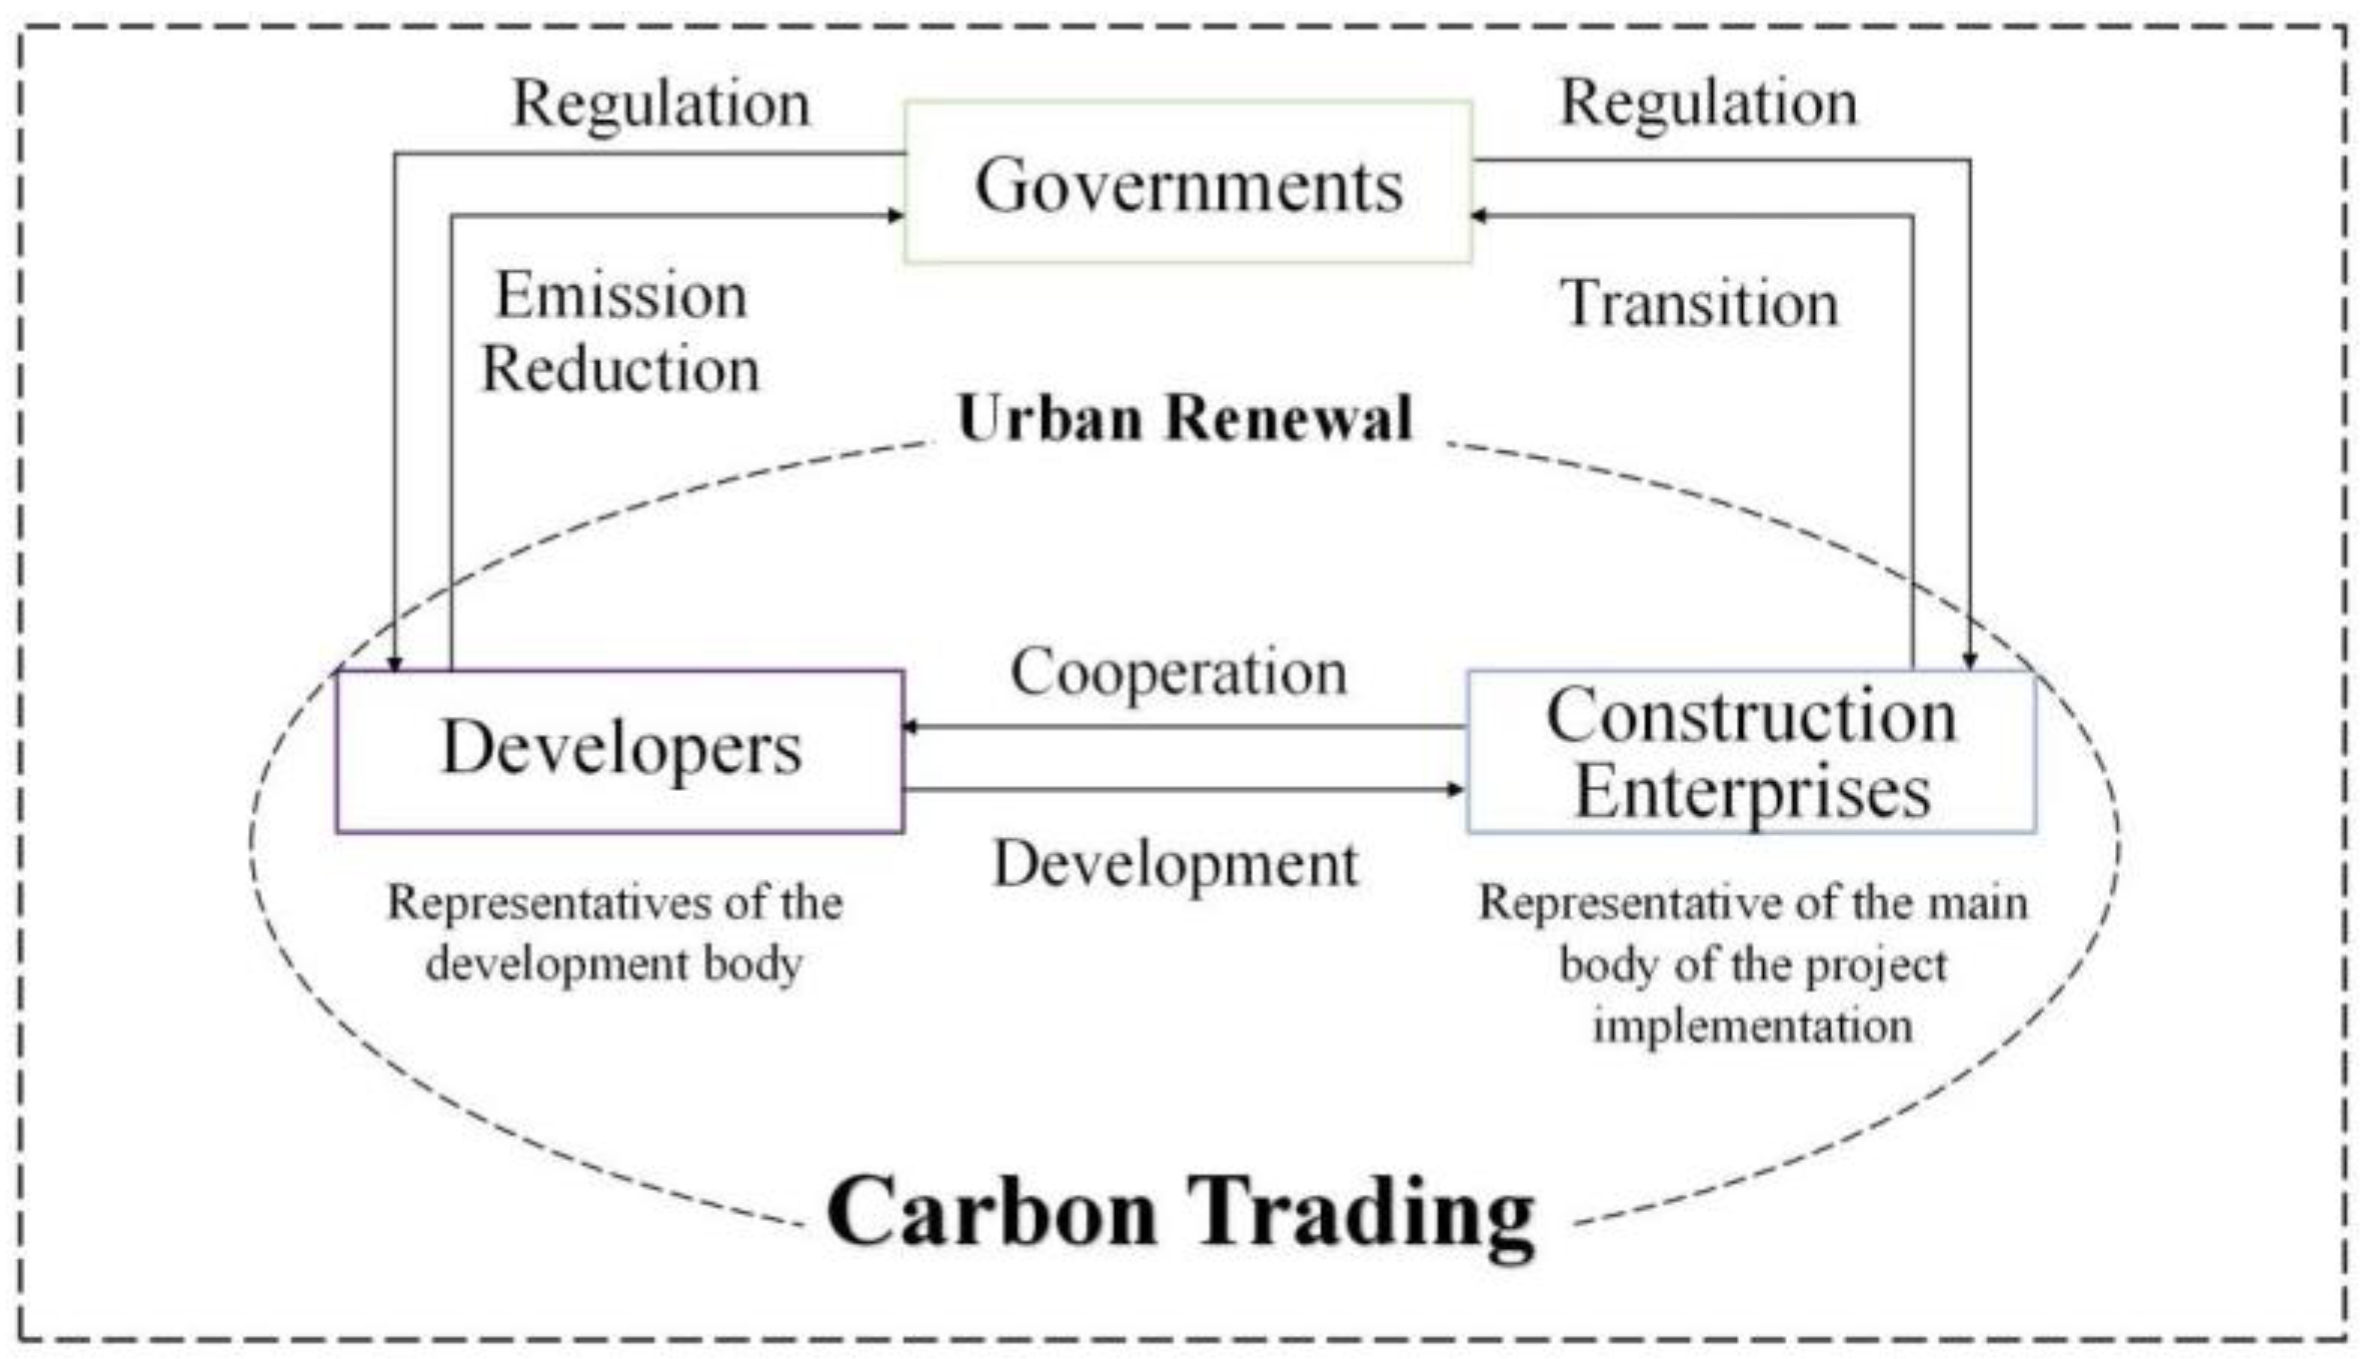
With a particular focus on the field of urban renewal, this study analyses the roles of the government, developers, and construction enterprises and their interactions in carbon emission reduction.
(3)
On the basis of theoretical analyses, urban renewal is combined with carbon trading and simulating practical situations to explore new benefit possibilities for future enterprises in urban renewal, which is important for promoting sustainable urban development and achieving the dual-carbon target.
The rest of the article is presented as follows: Section 2 provides a literature review. Section 3 presents the model construction. Section 4 conducts a numerical analysis and investigates the impact of potential influences on these strategies through simulation. Finally, Section 5 summarizes the results of this study and proposes relevant recommendations.

2. Literature Review

2.1. Stakeholders in Carbon Emission Reduction in Urban Renewal

In the process of urban renewal, the realization of carbon reduction targets is jointly determined by market participants. Existing studies have shown that urban renewal involves multiple stakeholders [20], which increases the difficulty of coordinating their interests in carbon emission reduction efforts. Therefore, it is necessary to analyze the stakeholders involved.
Stakeholders can be regarded as any group or individual who interacts with organizations [21]. Usually, the key stakeholders [22] of urban renewal refer to those who can intervene in the project and have a certain influence on the results. Typical stakeholders include, but are not limited to, governments, developers, residents, and construction enterprises. In urban renewal aimed at reducing carbon emissions, particular attention should be paid to entities with direct decision-making authority over carbon emissions. The government, which has the leading role in urban renewal, promotes emission reduction through the formulation of appropriate policies to ensure the coordinated development of social, economic, and environmental interests, but policy efficacy is often compromised by fiscal pressures [23]. Developers, as representative urban renewal development entities, pursue private economic interests, value corporate brand image, and make decisions on the basis of their own investment preferences, but their short-term profit orientation leads to projects that are less likely to proactively adopt high-cost, low-carbon solutions [24]. Construction enterprises are mainly responsible for the project construction process, providing necessary engineering support for urban renewal, with the goals of obtaining considerable income, enhancing competitiveness in their traditional core businesses, and pursuing innovative transformation and development, but there is a lack of voice in the design program [25]. Residents, as direct beneficiaries of urban renewal, typically provide feedback and suggestions during initial decision-making stages [26]. However, their participation in emission reduction remains limited due to stronger prioritization of their own survival and development interests [27].
At present, urban renewal policies in China mainly adopt the method of retaining alterations [28]. Consequently, the carbon emissions of urban renewal projects primarily stem from both the construction and operational phases, with the operational phase accounting for 70–90% of total life cycle emissions [29,30]. This characteristic determines that the preliminary design decisions of developers and the technical implementation of construction enterprises directly affect the carbon emissions of urban renewal projects. Other stakeholders, such as local residents, may influence operational emissions through usage behaviors [31], but this impact is often indirect and lagging. In addition, most analyses usually focus on the game between the government and a single subject, either developers or construction enterprises, while ignoring the complex and subtle interactions that exist between the developer and the construction enterprise. Therefore, the government, developers, and construction enterprises, as the decisive market players in decision-making regarding carbon emission reduction behavior in urban renewal [12], are the game subjects selected for analysis in this paper.
After clarifying the key roles of the government, developers, and construction enterprises as the core decision-makers for carbon emission reduction in urban renewal, it is also necessary to introduce market mechanisms to harmonize the objectives of multiple parties, so the next section will elaborate on the impacts of carbon trading market mechanisms.

2.2. Impact of Carbon Trading on Carbon Emission Reduction

In the past two decades, the severe challenge of global climate change has driven the rapid development of carbon trading markets, making them an important mechanism for reducing carbon emissions [32]. In 2005, the EU ETS was established, and as the world’s first carbon trading market [33], its impact on carbon emission reduction is of significant reference. Several studies have shown that the EU ETS has played a positive role in promoting carbon emission reduction. Dechezleprêtre et al. found through a matching method that approximately 10% of the carbon emission reduction was related to the EU ETS during the period from 2005 to 2012 [34]. Biancalani et al. analyzed the data for the period of 2005–2020 using a matrix completion approach and further reported that the total CO2 emissions in most EU countries decreased by approximately 15.4% compared with those in countries without an ETS [33]. In addition, Jafari et al. highlighted the impact of behavioral changes in the price of CO2 allowances in the EU ETS on carbon emissions [35]. After the establishment of China’s carbon trading market, many scholars have also extensively explored its impact on carbon emission reduction [36]. By using difference-in-differences, Dong et al. concluded that carbon trading is able to significantly reduce the intensity of emissions and that this contribution is stable and sustainable [37]. Zhang et al. similarly demonstrated this phenomenon and reported that the extent of carbon emission reductions varies based on the maturity of the carbon trading systems in different regions [38]. Lai et al. demonstrated that the impact of the policy can be extended to various industries and that it can promote industrial innovation while improving energy efficiency and reducing emissions [39]. Li et al. argued that emissions can be indirectly reduced by adjusting the industrial structure, energy composition, and development technology, in addition to directly affecting emissions [40]. Li et al. found that changes in carbon trading prices can cause differences in emission reduction among enterprises and that peer incentives are more effective than punishments [41,42]. Bai et al. proposed that the carbon market had the dual constraints of cost and market incentives for enterprises, which can promote low-carbon technological innovation and autonomous emission reduction through reasonable costs and carbon trading benefits [43].
Carbon trading is internationally recognized as the most cost-effective way to achieve the dual-carbon target [44]. Its essence is to achieve emission reduction targets through market mechanisms [45,46]. Therefore, it is clear that carbon trading influences carbon emissions and promotes enterprises’ independent emission reduction, but its specific influencing mechanism has not been fully elucidated. In this paper, carbon trading is incorporated into the model, fully considering the promoting effects of the carbon trading mechanism and clarifying its specific influencing factors.

2.3. Application of Evolutionary Games in Carbon Emission Reduction

Mimicry dynamics is the origin of evolutionary game theory, where an evolutionary stable strategy is the process by which evolutionary games converge to equilibrium stable states [47]. In recent years, evolutionary game theory has been used in the field of carbon emission reduction by many researchers. Meng et al. constructed a model of emission reduction in the shipping industry around the government and enterprises and analyzed tripartite strategy choices and the mechanism influencing the choice of the main body [48]. Jiang et al. performed a study on the same topic and added the consumer perspective shipper as a new game subject [16]. Fang Li et al. used an evolutionary game model to analyze the conflict of interest relationship in the process of emission reduction and clarified the major role of the government in the process of enterprise emission reduction [19]. The continuous development of carbon trading mechanisms has led some scholars to pay attention to their impact on the behaviors and strategies of game players in reducing emissions. Yang et al. constructed a model using a carbon trading mechanism and, through evolutionary game theory, found that it is an effective driving force to promote both parties’ participation in carbon reduction in the game [47]. Zhu et al. suggested that appropriately increasing carbon trading prices can reduce the emission reduction cost for enterprises, thereby more effectively reducing carbon emissions from the results of evolutionary game theory [32]. Na et al. suggested that the activity of carbon market trading should be increased to achieve rational carbon quota pricing [49].
Many scholars have explored carbon emission reduction by using evolutionary games, which provides a theoretical basis; however, few studies have focused on emission reduction behavior in the field of urban renewal, and relevant studies that consider urban renewal stakeholders as the main players of the game are lacking. This study not only enriches the application of evolutionary game theory but also combines urban renewal with carbon trading to explore new revenue possibilities for enterprises in urban renewal in the future.

3. Model Building

Carbon emission reduction in urban renewal is a multiparty game. This process requires not only the active participation of developers and construction enterprises, who represent private interests, but also effective guidance from the government, which represents public interests [50]. Urban regeneration cannot be achieved without government oversight, and its strength lies in achieving multiparty cooperation through strong government support to promote sustainable urban development [51]. Carbon trading, as the most cost-effective market mechanism, has a profound effect on the behaviors of all parties. Therefore, this study presents the logical relationships among game players, as illustrated in Figure 1.

3.1. Basic Assumptions

In the process of urban renewal, the government, developers, and construction enterprises, as the main participants in the market, jointly promote the realization of carbon reduction targets. The tripartite relationship involves both conflict and cooperation, with certain barriers to information exchange. Prior to model construction, this study adopts classical evolutionary game theoretic assumptions by positing bounded rationality among decision-making agents. In contrast to classical game theory’s omniscient and omnipotent agents, these boundedly rational actors face inherent information asymmetries and cognitive constraints, rendering them incapable of achieving instantaneously optimal outcomes in economic decision-making. Therefore, each participant needs to continuously adjust their strategy selection in the dynamic game process and finally converge to the equilibrium stable state through multiple iterations and learning. Based on this, the following hypotheses are proposed:
Hypothesis 1.
The government is participant I, the developer is participant II, and the construction enterprise is participant III. All parties are bounded rational participants, and each party’s strategic choice is based on its own behavioral logic. Due to the existence of information asymmetry and cognitive–informational constraints, initial strategy selection often fails to achieve fully rational optimal responses. However, under bounded rationality, participants gradually acquire market information over time and engage in continuous simulation and social learning, asymptotically approaching their optimal strategies and higher payoffs.
Hypothesis 2.
In the process of urban renewal, each subject makes decisions related to carbon emission reduction under the condition of limited rationality in which the government’s behavioral decision set is D1 = {proactive regulation, passive regulation}. ‘Proactive regulation’ refers to the establishment of relevant departments by the government to supervise and manage construction enterprises and developers, implementing regulatory measures—such as subsidies or penalties—based on their adoption of positive or negative emission reduction strategies. ‘Passive regulation’ means that the government withholds any regulatory initiatives to intervene in whether developers and construction enterprises make positive carbon emission reduction decisions. The developer’s behavioral decision set is D2 = {proactive carbon emission reduction, passive CER}. ‘Proactive CER’ means that developers actively respond to national and local policy requirements by adopting energy-efficient technologies, green building standards, and other carbon emission reduction measures. Conversely, ‘passive CER’ means that developers ignore the requirements of emission reduction, choose to continue the traditional construction methods of investment programs, and pursue only short-term economic benefits. The behavioral decision set of construction enterprises is D3 = {proactive transition, passive transition}, where ‘proactive transition’ refers to their active promotion of green transformation in response to regulatory pressures and market demand, optimizing construction processes to achieve emission reduction, and ‘passive transition’ denotes that construction enterprises lack the awareness to actively promote green transformation, maintaining conventional construction methods without implementing carbon mitigation measures.
Hypothesis 3.
Under bounded rationality constraints, let x denote the proportion of governments adopting ‘proactive regulation’, with (1 − x) representing those employing ‘passive regulation’. The proportion of developers choosing ‘proactive CER’ is represented by y, while the proportion of developers opting for ‘passive CER’ is represented by (1 − y), and the proportion of construction enterprises choosing ‘proactive transition’ is represented by z, while the proportion of construction enterprises selecting ‘passive transition’ is represented by (1 − z), where 0 ≤ x ≤ 1, 0 ≤ y ≤ 1, and 0 ≤ z ≤ 1.
Hypothesis 4.
The government’s revenues from adopting ‘proactive regulation’ and ‘passive regulation’ are represented by R1 and R2 respectively, and the government pays an additional regulatory cost, C1, for adopting ‘proactive regulation’.
Hypothesis 5.
When developers adopt ‘proactive CER’ and ‘passive CER’ strategies, the benefits are R3 and R4, respectively. And when the developers adopt ‘proactive CER’, the developers need to pay the corresponding additional costs, C2.
Hypothesis 6.
When construction enterprises adopt ‘proactive transition’ and ‘passive transition’, the benefits are R5 and R6, respectively. When construction enterprises adopt proactive transition, they must also bear an additional green transformation cost, C3.
Hypothesis 7.
When the government adopts ‘proactive regulation’, it will provide corresponding subsidies, S1 and S2, when developers and construction enterprises choose positive strategies. When developers and construction enterprises choose negative strategies, the government will penalize them with F1 and F2, and environmental pollution can cause government losses, L1 and L2.
Hypothesis 8.
In urban renewal projects, developers and construction enterprises establish partnerships through voluntary cooperation mechanisms. If both adopt positive strategies, they will share the cost of green transformation, C3, with the developer bearing a proportion, α. This voluntary cooperation generates non-monetary benefits: developers gain potential advantages, R7, such as enhanced reputation and strengthened market competitiveness, while construction enterprises acquire additional market opportunities and transformational benefits, R8. If the choices of both parties are the opposite, the benefits of co-operation will also be affected. This benefit adjustment mechanism reflects the dynamic impact of partners’ strategic choices on synergistic effects under voluntary cooperation models. If the developer is positive and the construction enterprise is negative, the developer will not be able to obtain the potential benefits of R7, and the actual benefits obtained by the developer may be reduced to βR7; conversely, the actual benefits obtained by the construction enterprise may be reduced toγR8, where β and γ, represent the proportion of benefits reduced due to the partner’s negative strategy, 0 < β ≤ 1, 0 < γ ≤ 1.
Hypothesis 9.
The carbon trading market will become increasingly active over time. When developers and construction enterprises choose active strategies, they can choose to participate in carbon trading depending on their achieved emission reductions, thus gaining additional economic benefits. E1 and E2 represent carbon emissions when the urban renewal project reduces emissions and does not reduce emissions, respectively, and the cost required to enter the carbon trading market is C4, which includes expenses such as registration and transaction fees. In addition, the costs and benefits of carbon trading for developers and construction enterprises will be shared in a certain proportion, where 0 < η ≤ 1 and 0 < τ ≤ 1.
Hypothesis 10.
The government manages carbon market operations. The government is responsible for setting the carbon trading price, P, and regulating it accordingly on the basis of the demand for emission reductions and the market trading situation. When developers and construction enterprises engage in carbon trading, this enhances market activity and creates additional benefits for the government, such as carbon tax revenue R9, which is directly affected by the total amount of carbon traded. At the same time, the government will also reward them with S3. With the improvement in market activity and the optimization of the trading process, the government will strategically reduce carbon market entry costs, C4, to incentivize more developers and construction enterprises to engage in carbon trading, thus maintaining a healthy carbon trading environment.
Based on the above assumptions, the specific symbols and parameter settings are shown in Table 1.

3.2. Tripartite Evolutionary Game

3.2.1. Analysis of Payoff Matrix

When the government, developers, and construction enterprises all adopt proactive strategies, an ideal state is achieved. Under this scenario, the government obtains long-term environmental benefits through subsidies, punitive measures, and policy support, with a total payoff of R1 − C1 − S1 − S2 − S3 + R9, where R9 represents the incremental benefits derived from promoting the carbon market. Developers closely collaborate with construction enterprises. After bearing a portion of the green transition costs αC3 for construction enterprises, developers gain potential benefits such as enhanced corporate reputation and increased market competitiveness (R7), as well as revenue from carbon trading. Their total payoff is R3 − C2 + S1 − αC3 + R7 − η(C4−S3) + τP(E2 − E1). With support from both the government and developers, construction enterprises achieve a payoff of R5 − (1 − α)C3 − (1 − η)(C4 − S3) + (1 − τ)P(E2 − E1) + S2 + R8. In this case, none of the three parties incur environmental penalties or miss out on additional benefits.
If the government actively regulates while developers adopt proactive emission reduction measures but construction enterprises choose passive transformation, the following outcomes arise: Since construction enterprises fail to meet green transition requirements, the government must bear environmental pollution losses (L2), reducing its payoff to R1 − C1 + F2 − L2 − S1. Developers lose synergistic emission reduction effects due to non-compliance by construction enterprises, resulting in intangible benefits of only βR7, thereby lowering their total payoff to R3 − C2 + S1 + βR7. Meanwhile, construction enterprises incur penalties for inadequate emission reduction efforts, yielding a net payoff of R6 − F2.
When the government actively regulates while developers adopt a passive emission reduction strategy, yet construction enterprises remain committed to proactive transformation, the following outcomes emerge: The government incurs additional environmental governance costs (L1), reducing its total payoff to R1 − C1 + F1 − L1 − S2. Developers face a penalty (F1), resulting in a diminished payoff of R4-F1. Due to the lack of developer cooperation, construction enterprises must independently bear the full transition costs, yielding a net payoff of R5 − C3 + S2 + γR8.
If the government actively regulates but both developers and construction enterprises adopt passive strategies, the government will bear dual environmental losses, reducing its payoff to R1-C1 + F1 + F2 − L1 − L2. Developers and construction enterprises incur respective penalties, resulting in payoffs of R4 − F1 and R6 − F2, respectively.
Under passive government regulation with proactive emission reduction efforts from both developers and construction enterprises, the government obtains only the baseline payoff R2. Although developers and construction enterprises achieve cooperation, the absence of government subsidies constrains their benefits, yielding payoffs of R3C2αC3 + R7ηC4 + τP(E2E1) and R5(1α)C3 + R8(1η)C4 + (1τ)P(E2E1) for them, respectively.
Under passive government regulation with only developers actively reducing emissions, the government’s payoff further declines to R2L2. Developers obtain βR7 due to reputational enhancement, resulting in a payoff of R3C2 + βR7. Although construction enterprises avoid administrative penalties, they forfeit emission reduction opportunities, maintaining their payoff at R6.
When the government adopts passive regulation and developers implement passive emission reduction measures, while construction enterprises undergo self-driven transformation, the government’s payoff diminishes to R1L1, whereas developers only obtain their baseline payoff of R4. For construction enterprises, due to the absence of policy support and cooperative partners for cost-sharing, their net payoff becomes R5C3 + γR8.
When all three parties adopt passive strategies, their respective payoffs are R2L1L2 for the government, R4 for developers, and R6 for construction enterprises.
The tripartite payoff matrix is shown in Table 2.

3.2.2. Replication Dynamic Equation

Through continuous learning, the government, developers, and construction enterprises can acquire asymmetric external information and dynamically adjust their strategies. Consequently, their respective payoffs will evolve correspondingly, enabling them to adopt optimal strategies in this evolutionary game-theoretic framework. This process is characterized by replicator dynamics, representing the evolutionary game-theoretic replication mechanism [52]. Specifically, an evolutionary game strategy will exhibit higher selection probability when its realized payoff surpasses the player’s average payoff, thus becoming the dominant choice in the strategic equilibrium. According to the matrix of benefit combinations in the above table, the expected benefits of different subjects and average expected benefits can be determined, and the replicator dynamic equation is derived as follows:
(1) Expected return to the government
The expected return values for the government’s proactive and passive regulation strategies are denoted as ED11 and ED12 respectively, with ĒD1 representing the average expected return.
ED11 = R1C1yzS3 + yzR9yS1zS2 + (1 − y)F1 + (1 − z)F2 − (1 − y)L1 − (1 − z)
ED12 = R2 − (1 − y)L1 − (1 − z)L2
ĒD1 = xED11 + (1 − x)ED12
Thus, the equation for the government’s replication dynamics can be obtained as follows:
F(x) = dx/dt = x(ED11ĒD1) = x(1 − x)[R1C1R2yzS3 + yzR9yS1zS2 + (1 − y)F1 + (1 − z)F2]
(2) Expected return to developers
Let ED21 and ED22 represent developers’ expected returns under proactive and passive CER strategies, respectively, with E D2 representing their average return.
ED21 = R3C2 + xS1 + xzηS3 − zαC3 + zR7 − zηC4 + zτP(E2E1) + (1 − z)βR7
ED22 = R4xF1
ĒD2 = yED21 + (1 − y)ED22
The resulting evolutionary dynamics for developers take the following form:
F(y) = dy/dt = y(ED21ĒD2) = y(1 − y)[R3C2 + xS1 + xzηS3 − zαC3 + zR7 − zηC4 + zτP(E2E1) + (1 − z)βR7R4 + xF1]
(3) Expected return to construction enterprises
For construction enterprises, both the expected returns and their average returns for choosing ‘proactive transition’ and ‘passive transition’ are denoted as ED31, ED32, respectively and ĒD3, respectively.
ED31 = R5C3 + yαC3 + xy(1 − η)S3 + xS2y(1 − η)C4 + y(1 − τ)P(E2E1) + (1 − y)γR8 + yR8
ED32 = R6xF2
ĒD3 = zED31 + (1 − z)ED32
Consequently, the replicator dynamics equation for construction enterprises can be derived as follows:
F(z) = dz/dt = z(ED31ĒD3) = z(1 − z)[R5C3 + yαC3 + xy(1 − η)S3 + xS2y(1 − η)C4 + y(1 − τ)P(E2E1) + (1 − y)γR8 + yR8R6 + xF2]

3.3. Stability Analysis of Single Subject Evolutionary Game

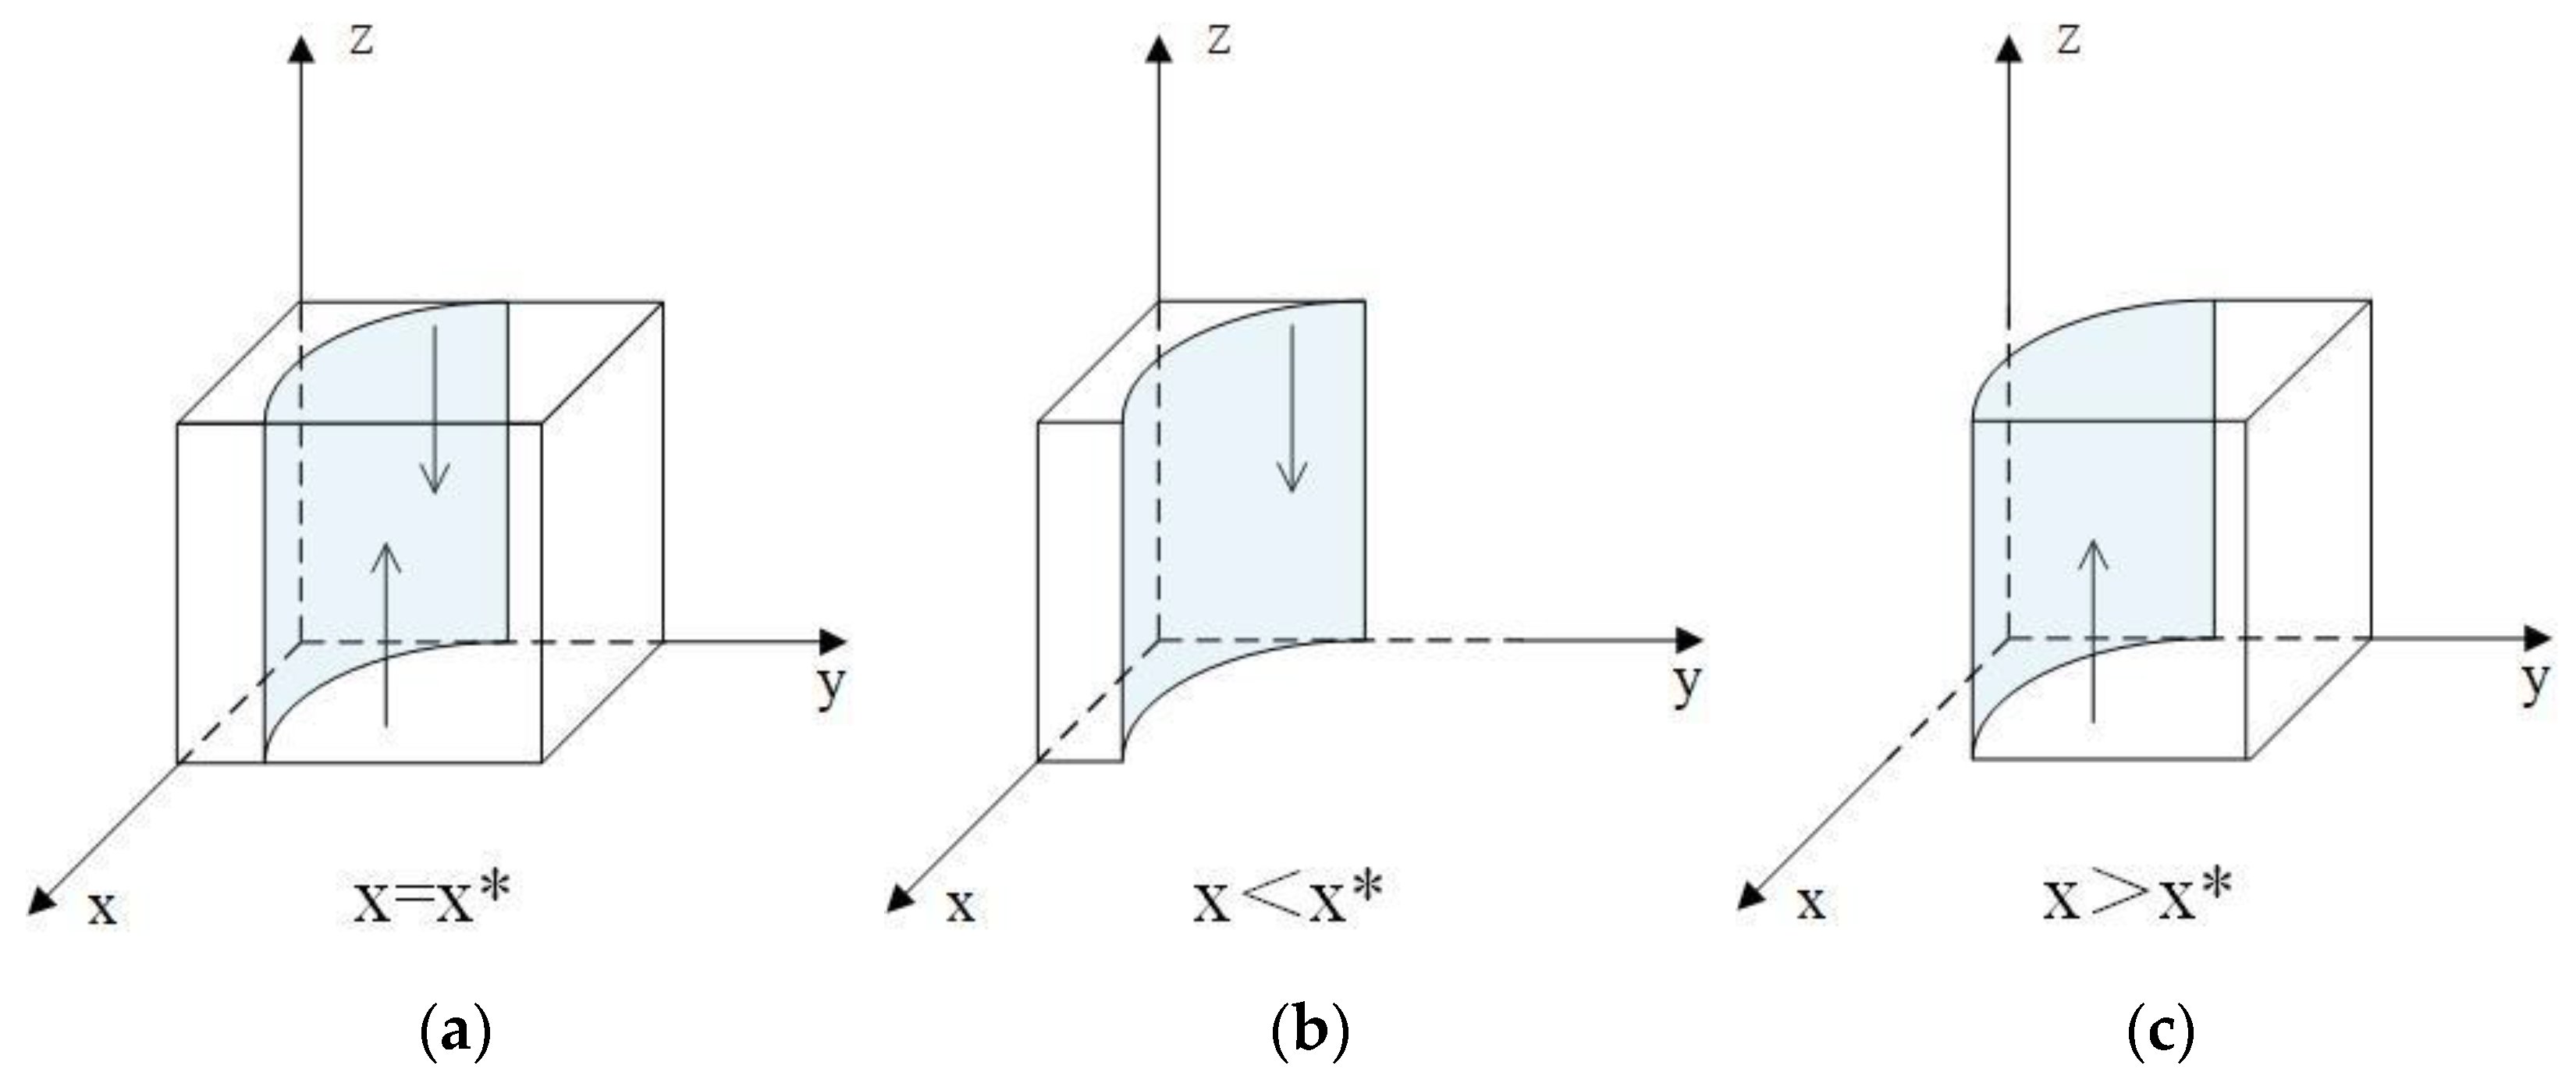
3.3.1. Analysis of Governments’ Strategy Stability

From the established government dynamics in Equation (4), G(y) = R1C1R2yzS3 + yzR9yS1zS2 + (1 − y)F1 + (1 − z)F2. We derive dF(x)/dx = (1 − 2x)G(y).
Following [48]’s stability criteria for differential equations, governmental active regulation reaches equilibrium when F(x) = 0 and dF(x)/dx < 0. Given dG(y)/dy < 0, the function G(y) exhibits monotonically decreasing behavior in y. The condition y = y* = R 1 C 1 R 2 z S 2 + F 1 + 1 z F 2 z S 3 z R 9 + S 1 + F 1 induces G(y) ≡ 0, causing the evolutionary derivative dF(x)/dx≡0 to vanish identically. Consequently, governmental strategies achieve stability for arbitrary x values, as visualized in Figure 2a. For y < y*, the condition G(y) > 0 holds, yielding dF(x)/dx < 0. This establishes x = 1 as the evolutionarily stable strategy (ESS), indicating exclusive government preference for proactive regulation (Figure 2b). When y > y*, G(y) < 0 induces dF(x)/dx < 0, and the system evolves to the ESS at x = 0, that is, the governments choose the passive regulation strategy (Figure 2c).

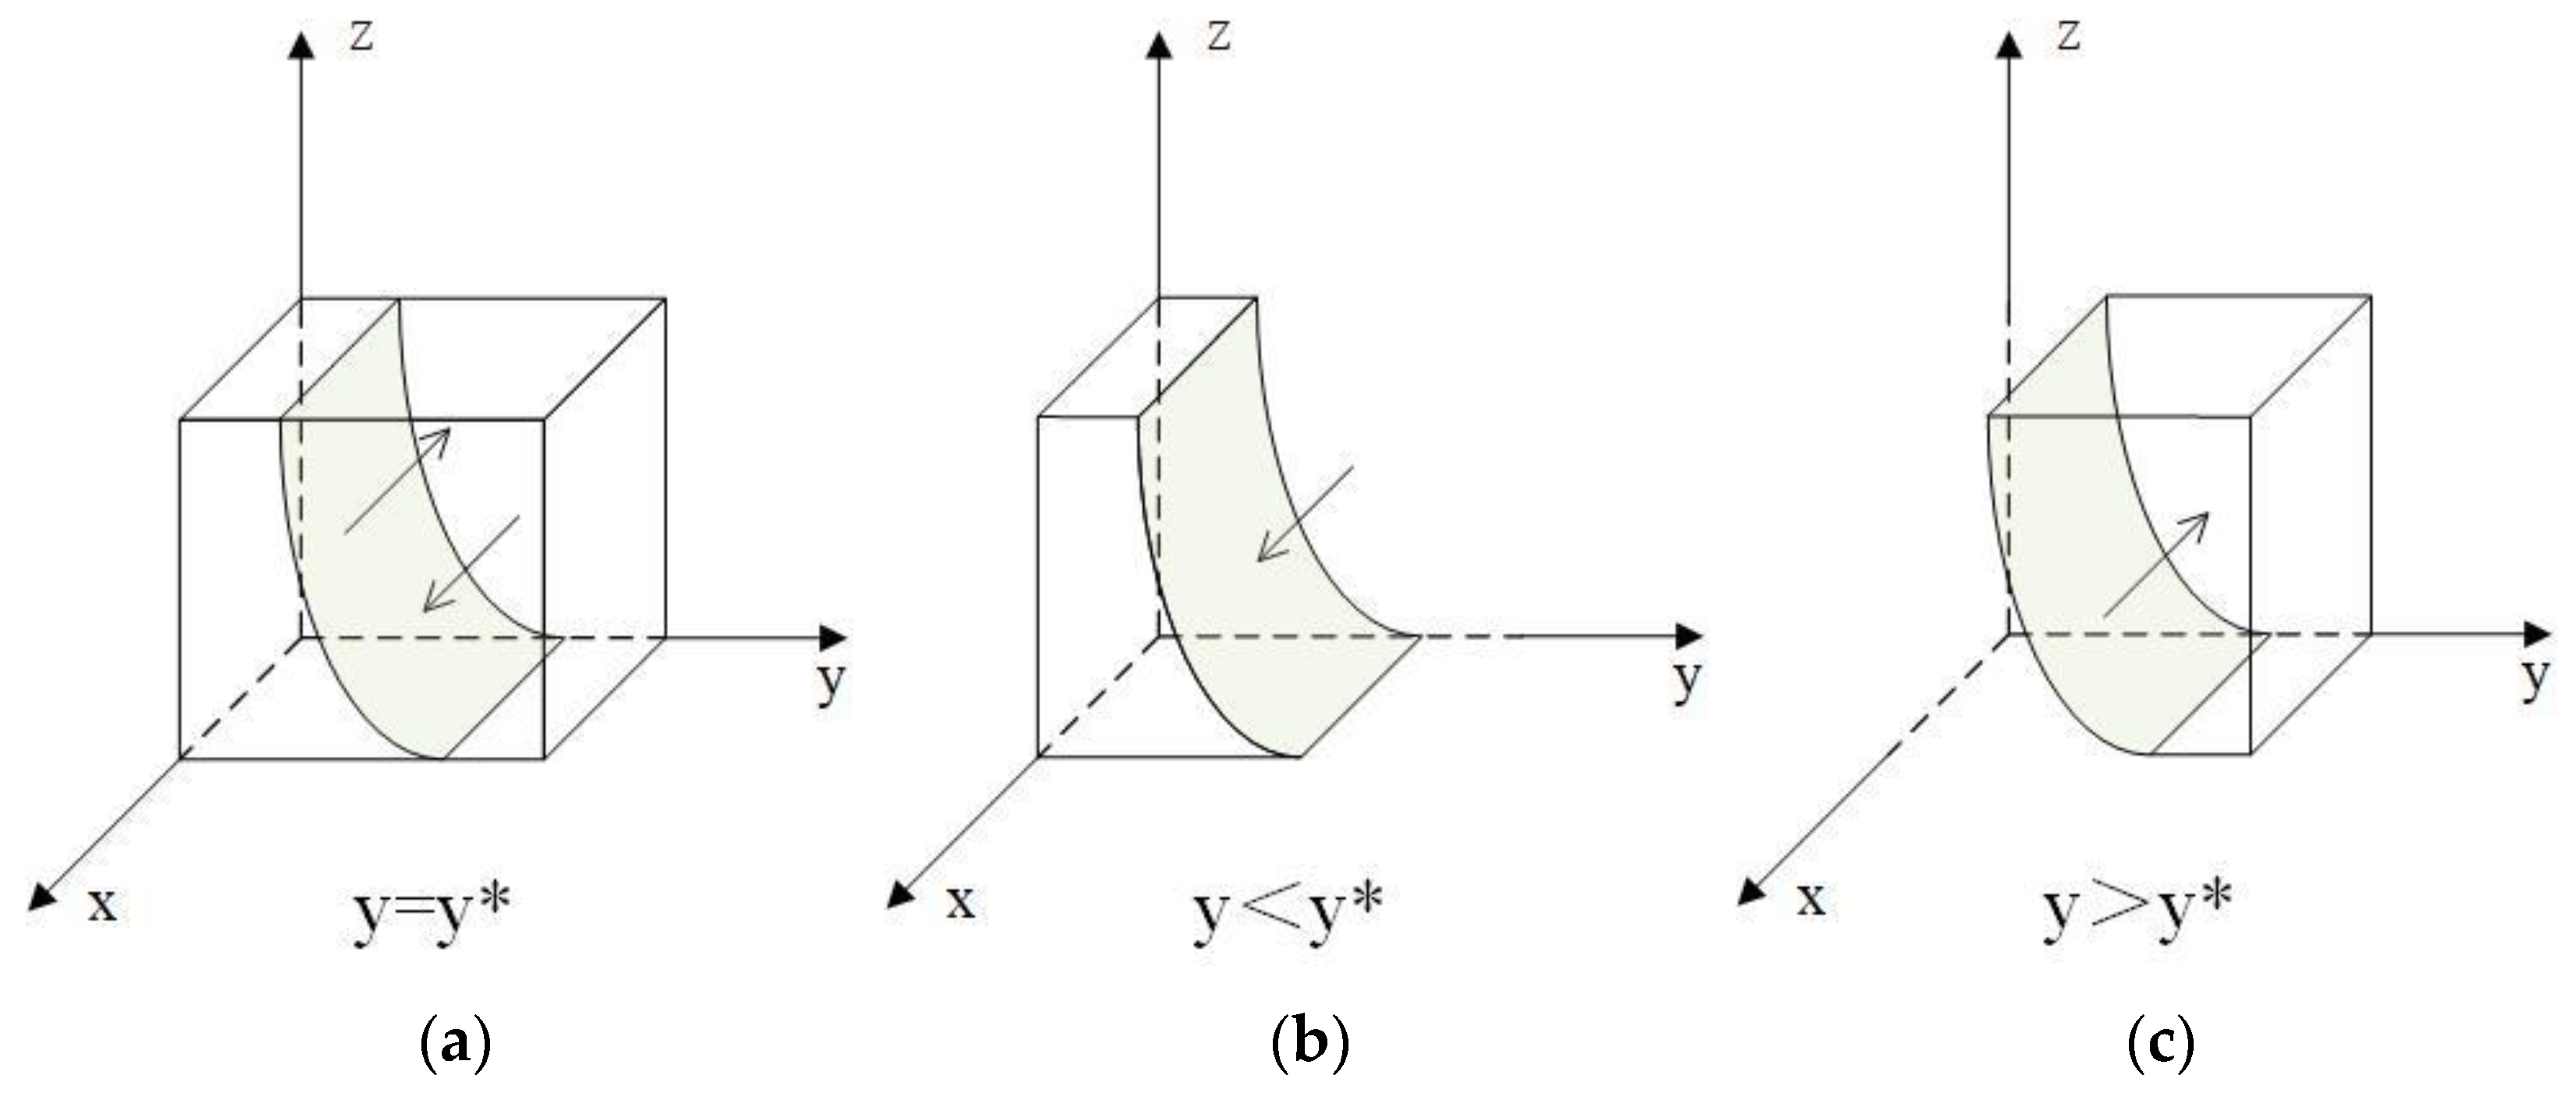
3.3.2. Analysis of Developers’ Strategy Stability

The known replication dynamic equation of the developer is shown in Equation (8), where we get G(z) = R3C2 + xS1 + xzηS3 − zαC3 + zR7 − zηC4 + zτP(E2E1) + (1 − z)βR7R4 + xF1. At this time, dF(y)/dy = (1 − 2y)G(z).
Similarly to [48], the probability that the developers choose to actively reduce emissions reaches a steady state when F(y) = 0 and dF(y)/dy < 0. As evidenced by dG(z)/dz > 0, G(z) demonstrates a strict positive correlation with z. When z = z* = R 3 C 2 + x S 1 + β R 7 R 4 + x F 1 x η S 3 + α C 3 R 7 + η C 4 τ P E 2 E 1 + β R 7 , it can obtain G(z) ≡ 0, and dF(y)/dy ≡ 0. Regardless of the value of z, developers’ strategy tends to stabilize (as in Figure 3a). For z < z*, G(z) < 0 induces dF(y)/dy < 0, yielding y = 0 as the ESS where developers exclusively adopt the passive strategy (Figure 3b). Conversely, when z > z*, G(z) > 0 produces dF(y)/dy < 0, making y = 1 the ESS with proactive CER (Figure 3c).

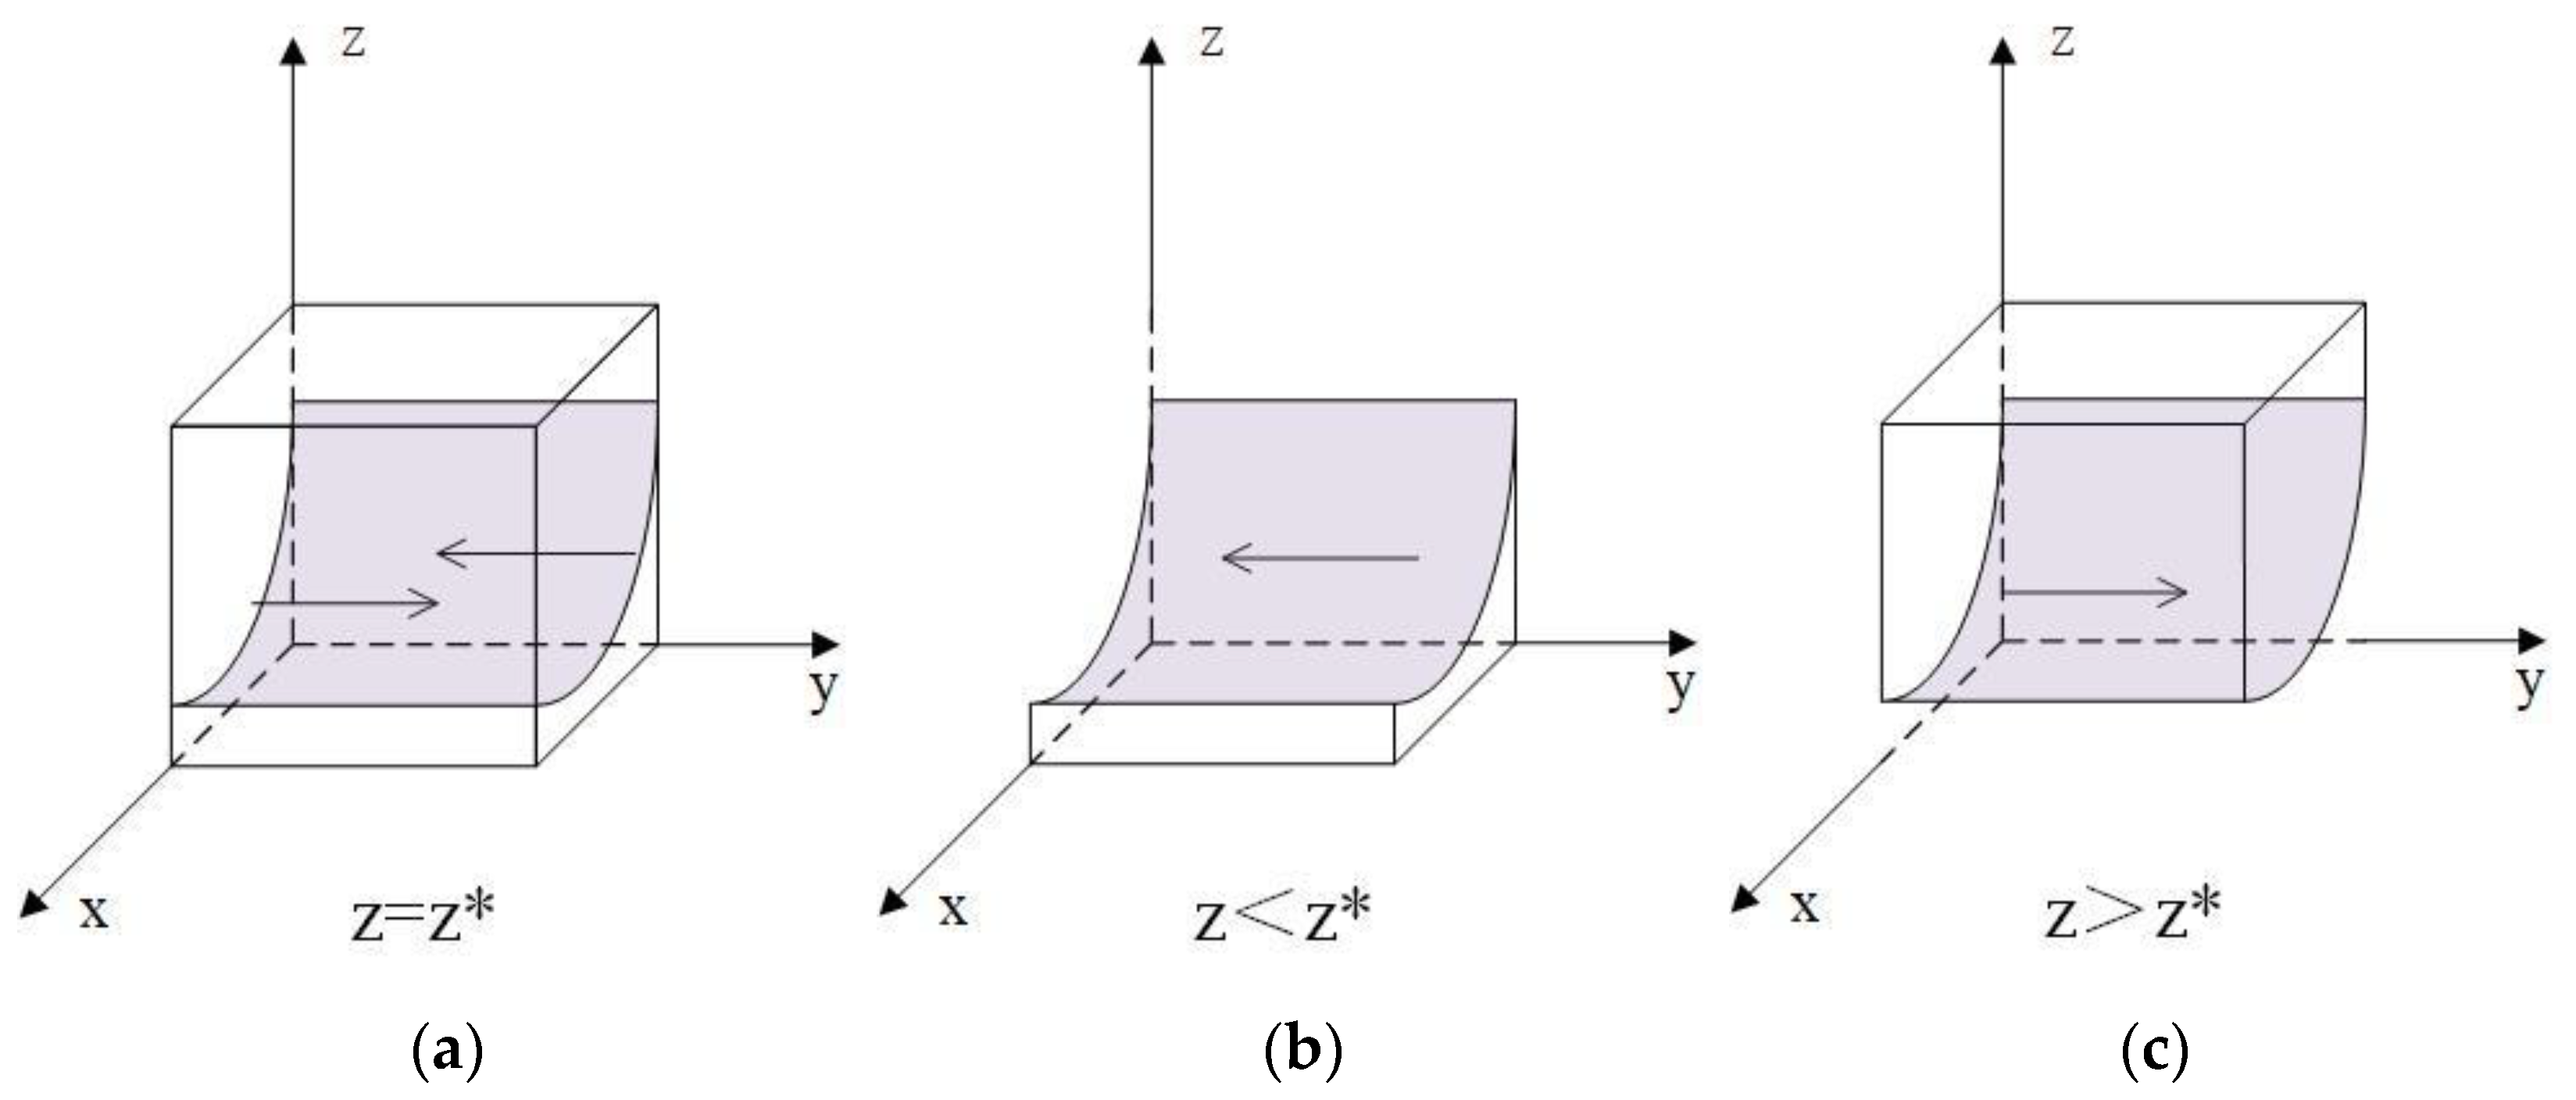
3.3.3. Analysis of Construction Enterprises’ Strategy Stability

The known replication dynamic equation of the construction enterprises is shown in Equation (12), from which we obtain the following: G(x) = R5C3 + yαC3 + xy(1 − η)S3 + xS2y(1 − η)C4 + y(1 − τ)P(E2E1) + (1 − y)γR8 + yR8R6 + xF2. At this time, dF(z)/dz = (1 − 2z)G(x).
Similarly to [48], the probability that the construction enterprises choose to actively transition reaches a steady state when F(z) = 0 and dF(z)/dz < 0 are satisfied. Since dG(x)/dx > 0, G(x) is a decreasing function with respect to x. When x = x* = R 5 C 3 + y α C 3 y 1 η C 4 + y 1 τ P E 2 E 1 + 1 y γ R 8 + y R 8 R 6 y 1 η S 3 S 2 F 2 , we can obtain G(x) ≡ 0, and at this point, dF(z)/dz0. Regardless of the value of x, the construction enterprise’s strategy tends to stabilize (as in Figure 4a). When x < x*, we can obtain G(x) < 0, and at this point, dF(z)/dz < 0, where z = 0 is the construction enterprise’s evolutionary stabilization strategy, that is, construction enterprises choose passive transition as the only evolutionary stabilization strategy (Figure 4b). When x > x*, we can obtain G(x) > 0, and at this point, dF(z)/dz < 0, where z = 1 is construction enterprises’ evolutionary stabilization strategy, that is, construction enterprises choose proactive transition as the only ESS (Figure 4c).

3.4. Stability Analysis of Tripartite Evolutionary Game System

Adopting a single game subject framework, the equilibrium conditions for each game subject to reach a stable strategy were analyzed. However, fundamentally, the emergence of final stability is fundamentally co-determined by the three parties’ interactions [53]. The above replicated dynamic equations form the dynamical game system, and we set F(x) = F(y) = F(z) = 0; among them, the strategy selection probabilities are [0,1]. The equilibrium strategies in this system include E1(0,0,0), E2(0,0,1), E3(0,1,0), E4(0,1,1), E5(1,0,0), E6(1,0,1), E7(1,1,0), E8(1,1,1), and E9(x*,y*,z*). As the asymptotically stable solutions in multi-group evolutionary games necessarily correspond to strict Nash equilibrium [15], this paper focuses on assessing the asymptotic stability of the eight pure-strategy Nash equilibrium points. According to Lyapunov’s stability condition, an equilibrium point attains evolutionary stability (ESS) [54] when all eigenvalues of the Jacobi matrix satisfy λ < 0. By computing the first-order partial derivatives of F(x), F(y), and F(z) with respect to each variable, we obtain the corresponding Jacobi matrix:
J = J 1 J 2 J 3 J 4 J 5 J 6 J 7 J 8 J 9 = F x x F x y F x z F y x F y y F y z F z x F z y F z z
Among them,
F x x = 1 2 x R 1 C 1 R 2 y z S 3 + y z R 9 y S 1 z S 2 + 1 y F 1 + 1 z F 2
F x y = x 1 x z S 3 + y R 9 S 1 F 1
F x z = x 1 x y S 3 + y R 9 S 2 F 2
F y x = y 1 y S 1 + z η S 3 + F 1
F y y = 1 2 y R 3 C 2 + x S 1 + x z η S 3 z α C 3 + z R 7 z η C 4 + z τ P E 2 E 1 + 1 z β R 7 R 4 + x F 1
F y z = y 1 y x η S 3 α C 3 + R 7 η C 4 + τ P E 2 E 1 β R 7
F z x = z 1 z y 1 η S 3 + S 2 + F 2
F z y = z 1 z α C 3 + x 1 η S 3 1 η C 4 + 1 τ P E 2 E 1 γ R 8 + R 8
F z z = 1 2 z R 5 C 3 + y α C 3 + x y 1 η S 3 + x S 2 y 1 η C 4 + y 1 τ P E 2 E 1 + 1 y γ R 8 + y R 8 R 6 + x F 2
The eigenvalues associated with the eight equilibria are shown in Table 3.
This study considers the strategic choices and game results under different scenarios at various stages to determine the stability point in the evolutionary game. Focusing on the dual forces of market-driven and government regulation, the dynamic evolution process between the main players is divided into three stages:
(1)
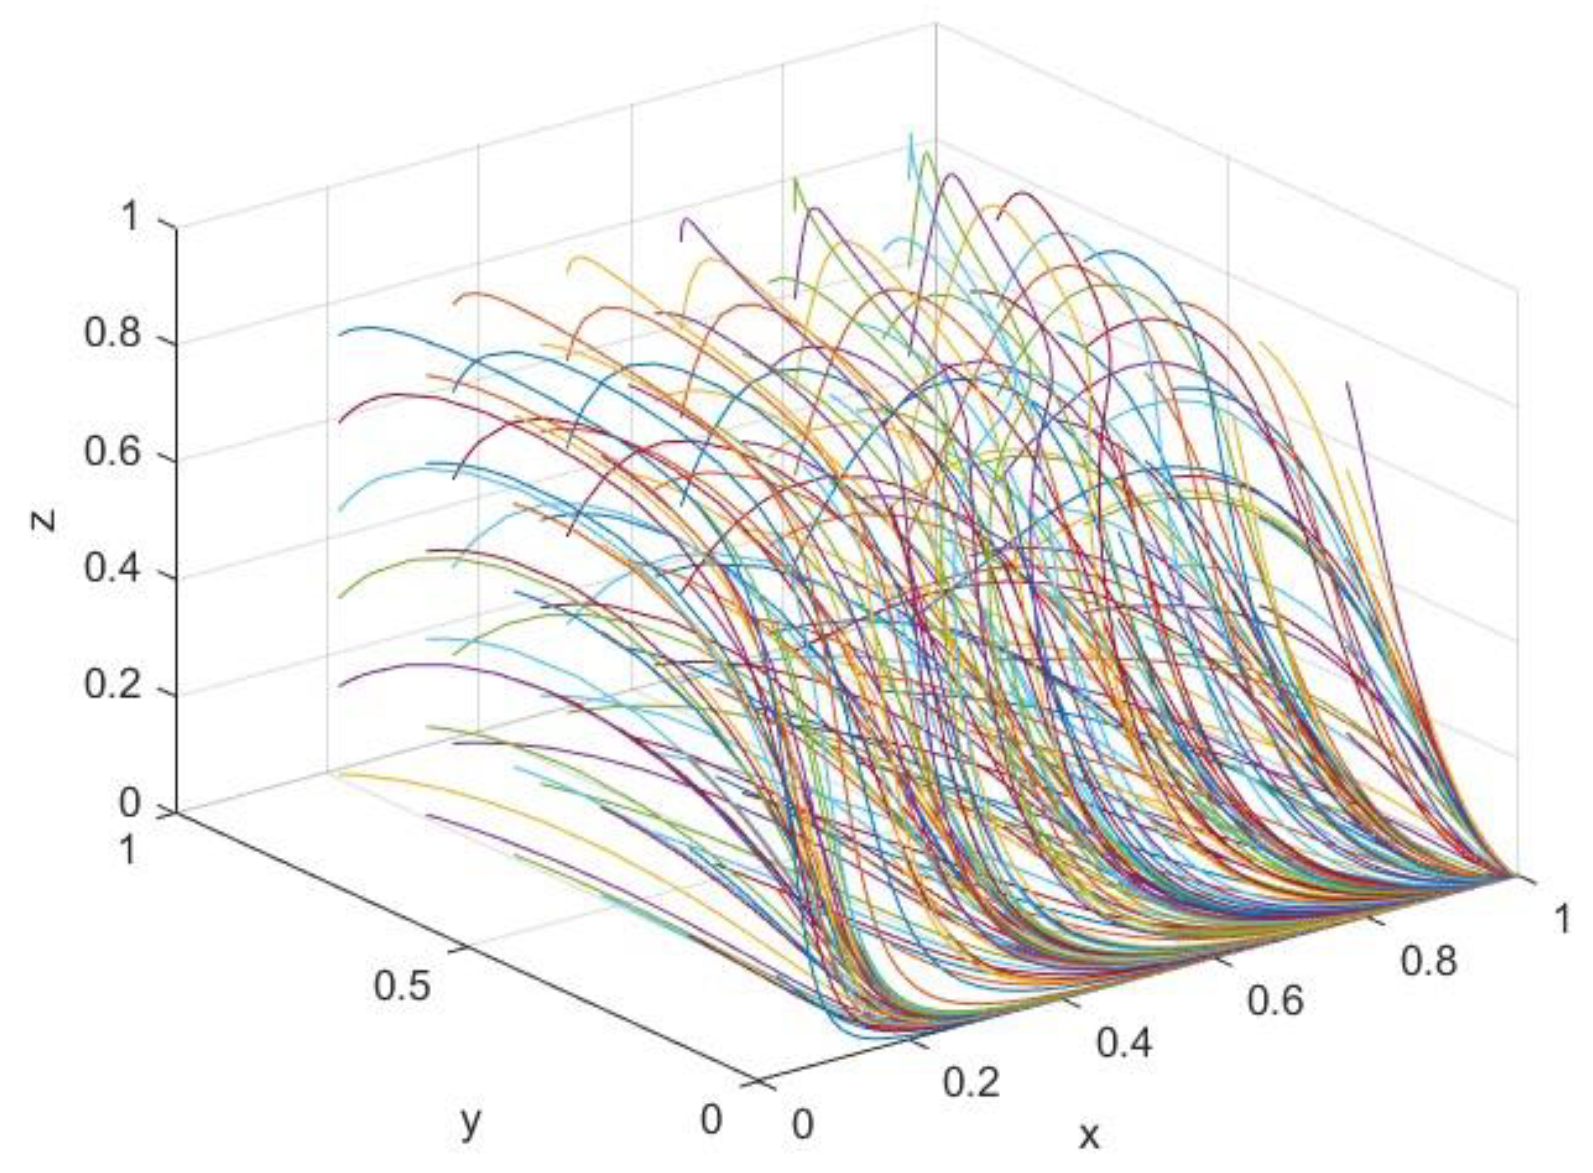
Initial stage: Due to weak awareness of emission reduction and the reliance on traditional paths and economic interests, developers and construction enterprises often lack motivation to actively and positively reduce emissions, instead adopting negative strategies in urban renewal projects. Although the government recognizes the importance of active regulation and attempts to supervise market players to reduce emissions through subsidies, the initial incremental gains cannot offset their costly inputs; in other words, R1R2 < C1. Moreover, developers and construction enterprises face high costs in adopting active strategies, with returns being significantly lower than traditional methods, that is, C2 > R3R4 + S1, C3 > R5R6 + S2. Given limited subsidies and weak penalties in the initial stage, governments cannot effectively motivate developers and construction enterprises, leading to inaction on their part. Therefore, the tripartite evolutionary stabilization strategy in the initial phase is E5(1,0,0). Developers and construction enterprises have adopted negative emission reduction strategies, while the government has endeavored to actively regulate but with little effect.
(2)
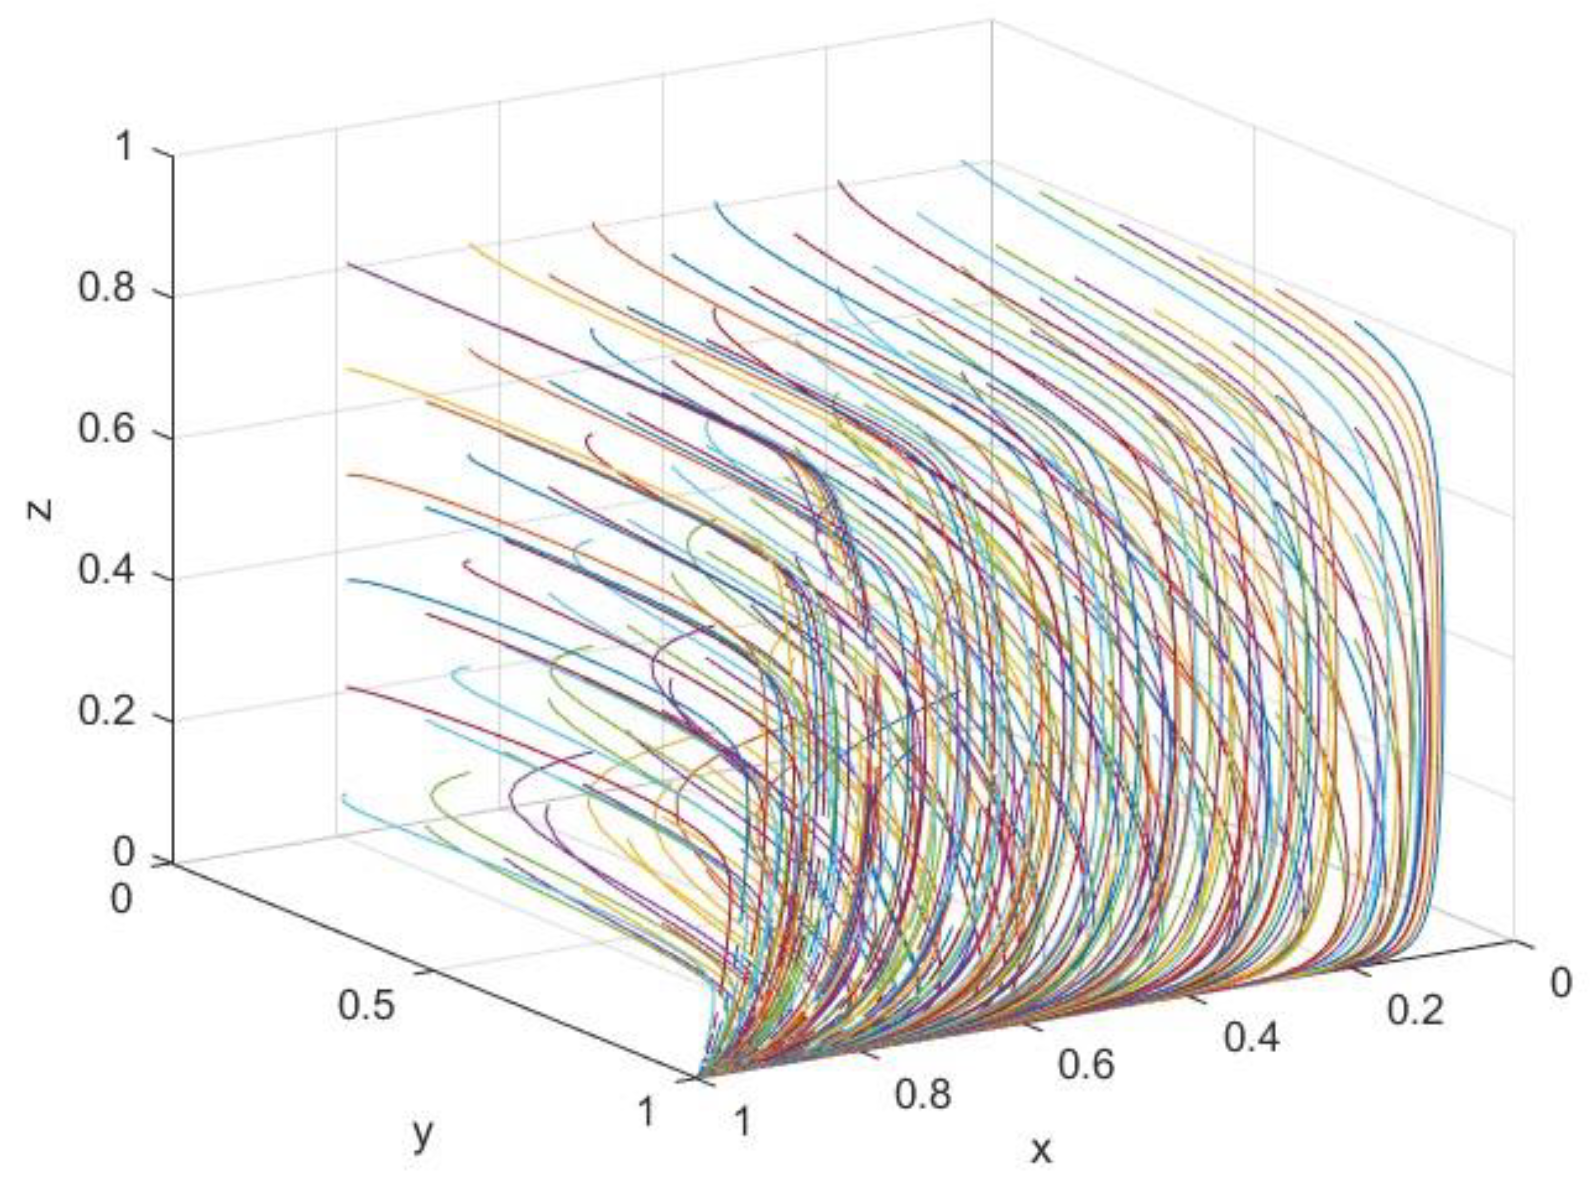
Growth stage: As government regulation intensifies, some forward-looking developers and construction enterprises may take the lead by actively investing in emission reduction and green transformation. The government typically prioritizes supporting developers who actively reduce emissions, thus creating a market demonstration effect that encourages the participation of more enterprises and guiding developers to cooperate with actively transforming construction enterprises, leading to carbon trading in urban renewal projects. At this point, R3 > R4. Developers benefit from active strategies, with subsidies and additional revenues offsetting costs, and S1 + βR7 > C2. Construction enterprises face the burden of prohibitive costs of green transformation, and they need support and assistance from the government and developers; however, limited government subsidies due to budget constraints leave them insufficiently incentivized to change, and C3 > R5R6 + S2. Therefore, the tripartite evolutionary stabilization strategy in the growth phase is E7(1,1,0). Developers tend to reduce emissions aggressively, while construction companies tend to take a wait-and-see approach, and governments continue to strengthen regulations and incentives.
(3)
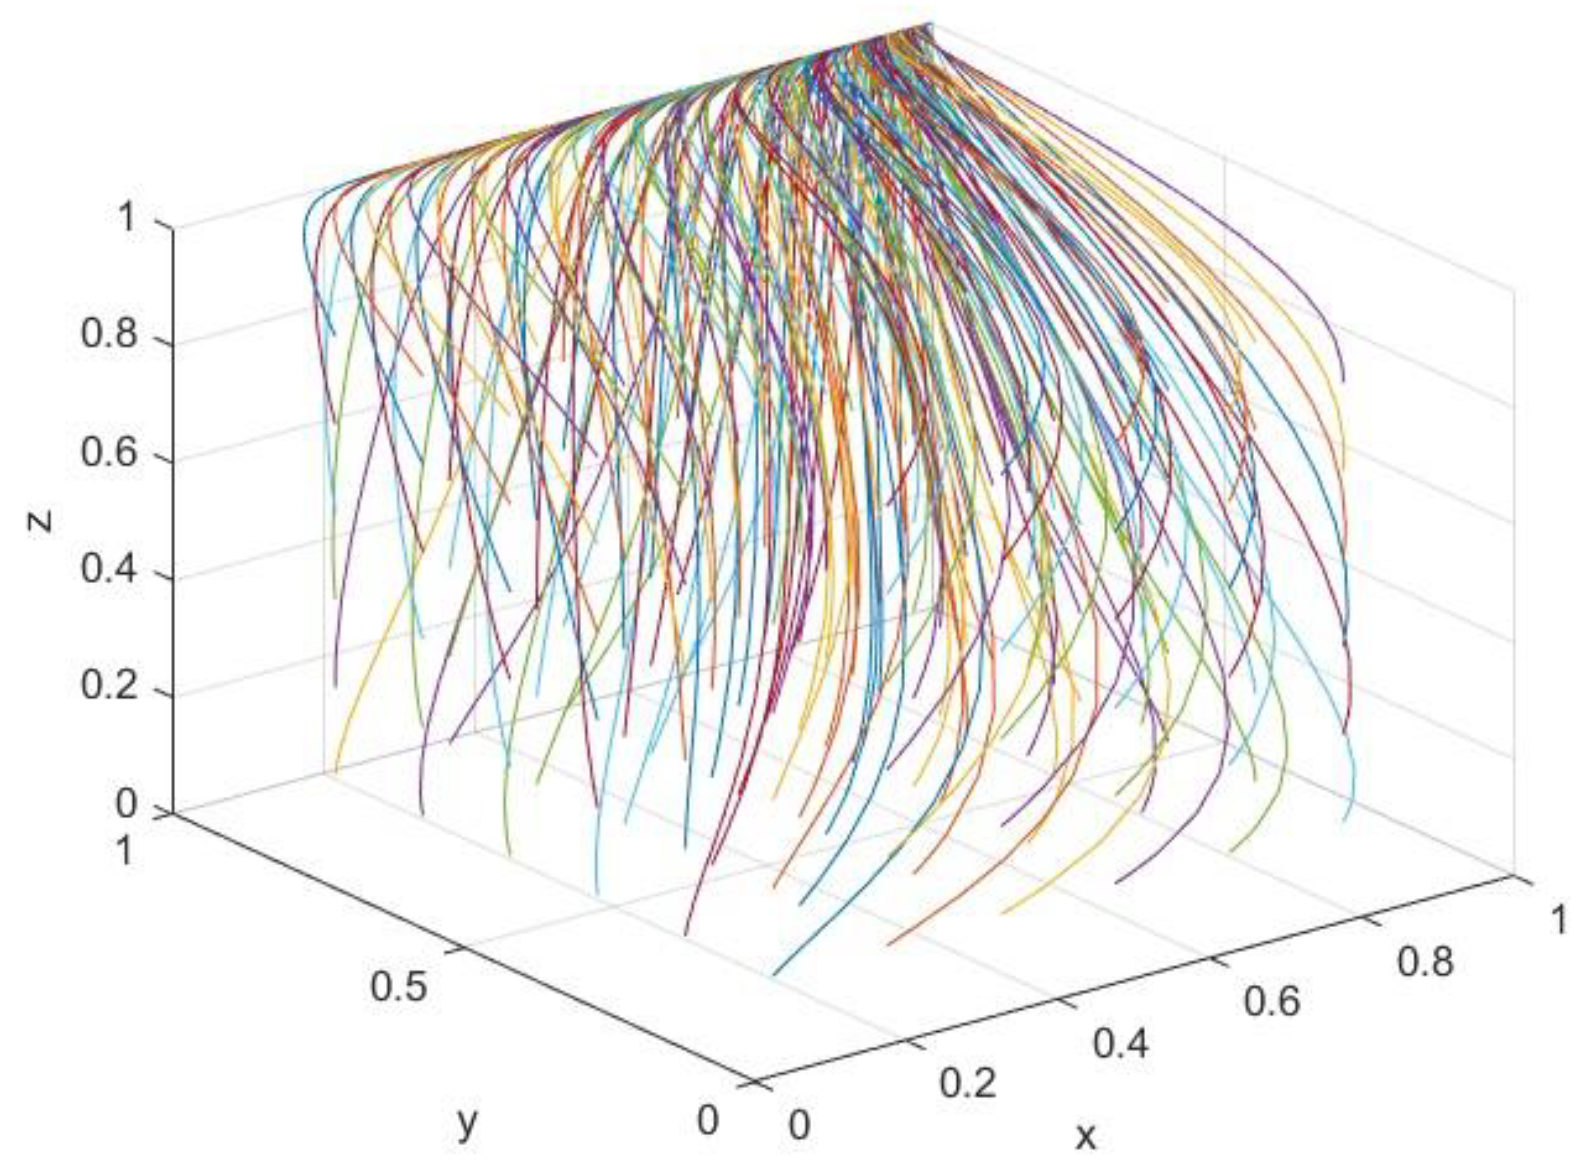
Mature stage: With the increasing maturity of carbon trading policies, governments positively supervise and promote participation in carbon trading through policy guidance and financial support, and R1R2 > C1. Technological advancements simultaneously lower the costs to meeting carbon reduction targets, making proactive emission reduction strategies more profitable for both developers and construction enterprises; therefore, R3C2 + S1 > R4, R5C3 + S2 > R6. Their collaborative efforts create mutual benefits, with developers being able to subsidize construction enterprises’ transition costs through shared gains. At this stage, the emission reduction effectiveness of urban renewal projects is significantly improved, leading to three scenarios regarding the decision to enter the carbon trading market: First, the emission reduction volumes fall below the carbon market access standard, so it is not possible to obtain additional revenue directly through carbon trading. Second, the amount of emission reduction meets the standard; however, government incentives are insufficient to offset trading costs, and C4 > P(E2E1) + S3. Third, emission reductions are sufficient and profitable, and C4 < P(E2E1). Therefore, the tripartite evolutionary stabilization strategy at the mature phrase is E8(1,1,1), the governments regulate actively, and both developers and construction enterprises are adopting proactive emission reduction strategies and selectively participating in carbon trading.

4. Numerical Analysis

To empirically verify the analytical results, this study employs MATLAB R2023a software for numerical simulation. A numerical simulation, as an experimental method, with its powerful iterative and interactive analysis capability, can effectively compensate for the deficiency of pertinent empirical data, which are challenging to acquire rapidly and have been extensively employed to resolve numerous complex issues related to multisubject games [18]. Therefore, based on the results of the simulation analysis, this study more intuitively demonstrates the influence of relevant factors in the game dynamic system on the strategic behavior of each subject.

4.1. Data Source

At present, there are two main trading mechanisms in China: the mandatory emission reduction trading mechanism and the voluntary emission reduction trading mechanism [55]. As non-emission-control enterprises, developers and construction enterprises follow the voluntary emission reduction trading mechanism to take part in carbon trading. Following the Fudan Carbon Price Index 2024, the highest national selling price since the restart of CCERs is CNY 90.17 per tonne, the lowest is CNY 65.46 per tonne, and the average selling price of national CCER trading is CNY 77.82 per tonne. Considering that the selling price of CCERs tends to be in a state of growth, this section sets the initial value of P as CNY 80 per tonne. According to current carbon market regulations, the trading fee is CNY 2000 for the account opening fee and CNY 1000 for the annual fee; thus, the starting value of C4 is fixed at CNY 3000. Moreover, the government can obtain additional revenue from carbon trading activities, which is set at 20% of the turnover [56], and certain incentives are given to enterprises engaging in the carbon market, which is initially configured at 10% of the transaction cost [19].
In addition, following the research conducted by Liang et al. [57] and Dwaikat et al. [58], under China’s current carbon trading mechanism, the cost of carbon abatement for developers is approximately CNY 60 per tonne, and the government subsidy given to developers who actively reduce emissions is approximately 40% of the enterprise’s abatement input, which is approximately 20% higher than the developer’s cost of carbon abatement for construction firms choosing to transition to a greener environment. Moreover, when the government implements a proactive regulatory approach, its supervision expense is usually slightly lower than that of enterprises, assuming that the additional regulatory cost is CNY 40 and that the penalty ranges from one to three times the subsidy. Using the Suzhou renovation project as a case study, the carbon emissions from urban renewal projects are expected to decrease by approximately 72 tonnes when rational building and demolition, low-carbon materials, plant sequestration, and other mitigation designs are adopted [11].
Moreover, the initial parameter values are determined according to the asymptotic stability condition and the numerical experiment setup guidelines of existing studies [59,60], with reference to the research design of Liu et al. [61] and He et al. [62], and the remaining parameters are set in conjunction with the research assumptions. The parameters are set to satisfy the economic assumptions and empirical judgment, and the guideline advises adjusting the specific parameters rather than changing the simulation results [63]. The details are shown in Table 4.

4.2. Multi-Stage Dynamic Evolution Results

4.2.1. Evolutionary Results for Stakeholders in the Initial Phase

The parameter values shown in Table 4 satisfy the initial stage stability conditions: R1R2 < C1, C2 > R3R4 + S1, and C3 > R5R6 + S2. In order to prevent the initial intention from influencing the results, MATLAB was further used to carry out 216 loop iterations for different initial strategy combinations, and the simulation results are shown in Figure 5. The different colored trajectory lines represent the dynamic evolution paths of the strategic choices of the game subjects under different initial strategies, which intuitively demonstrate the evolution of the system from different initial states to a common stable state. Although there are differences in the strategic choices of game players at the initial stage, after many iterations, they all converge to the stable state E5(1,0,0). This proves the validity of the previous theoretical analysis. At this time, the evolutionary stabilization strategy is {governments proactive regulation, developers passive CER, construction enterprises transition}.

4.2.2. Evolutionary Results for Stakeholders in the Growth Phase

The parameter values during the growth stage satisfy the conditions in Table 4: R3 > R4, S1 + βR7 > C2, and C3 > R5R6 + S2. Similarly, 216 loop iterations are performed using MATLAB, and the simulation results are shown in Figure 6. After iterations, the final strategy selection converges to a stable state, E7(1,1,0). Specifically, during the growth phase, the evolutionary strategies of governments, developers, and construction enterprises are proactive regulation, proactive emission reduction, and passive transition.

4.2.3. Evolutionary Results for Stakeholders in the Mature Phase

Similarly, the parameter values of the mature stage meet the requirements in Table 4: R1R2 > C1, R3C2 + S1 > R4, and R5C3 + S2 > R6. A total of 216 loop iterations are performed using MATLAB again, and the simulation results are shown in Figure 7. At this stage, regardless of the scenario, whether C4 > P(E2E1) or C4 < P(E2E1), the final strategy choices converge to a steady state, E8(1,1,1). In this mature stage, the evolutionary stable strategies are governments’ proactive regulation, developers’ proactive emission reduction, and construction enterprises’ passive transition.

4.3. Sensitivity Analysis

Focusing on the mature stage, this section uses the initial parameters in Table 4 as the baseline and sets the initial willingness to x0 = y0 = z0 = 0.5. Different parameter variations are set up and the main factors that influence the behavior of the three parties are analyzed. The specific analyses are presented below.

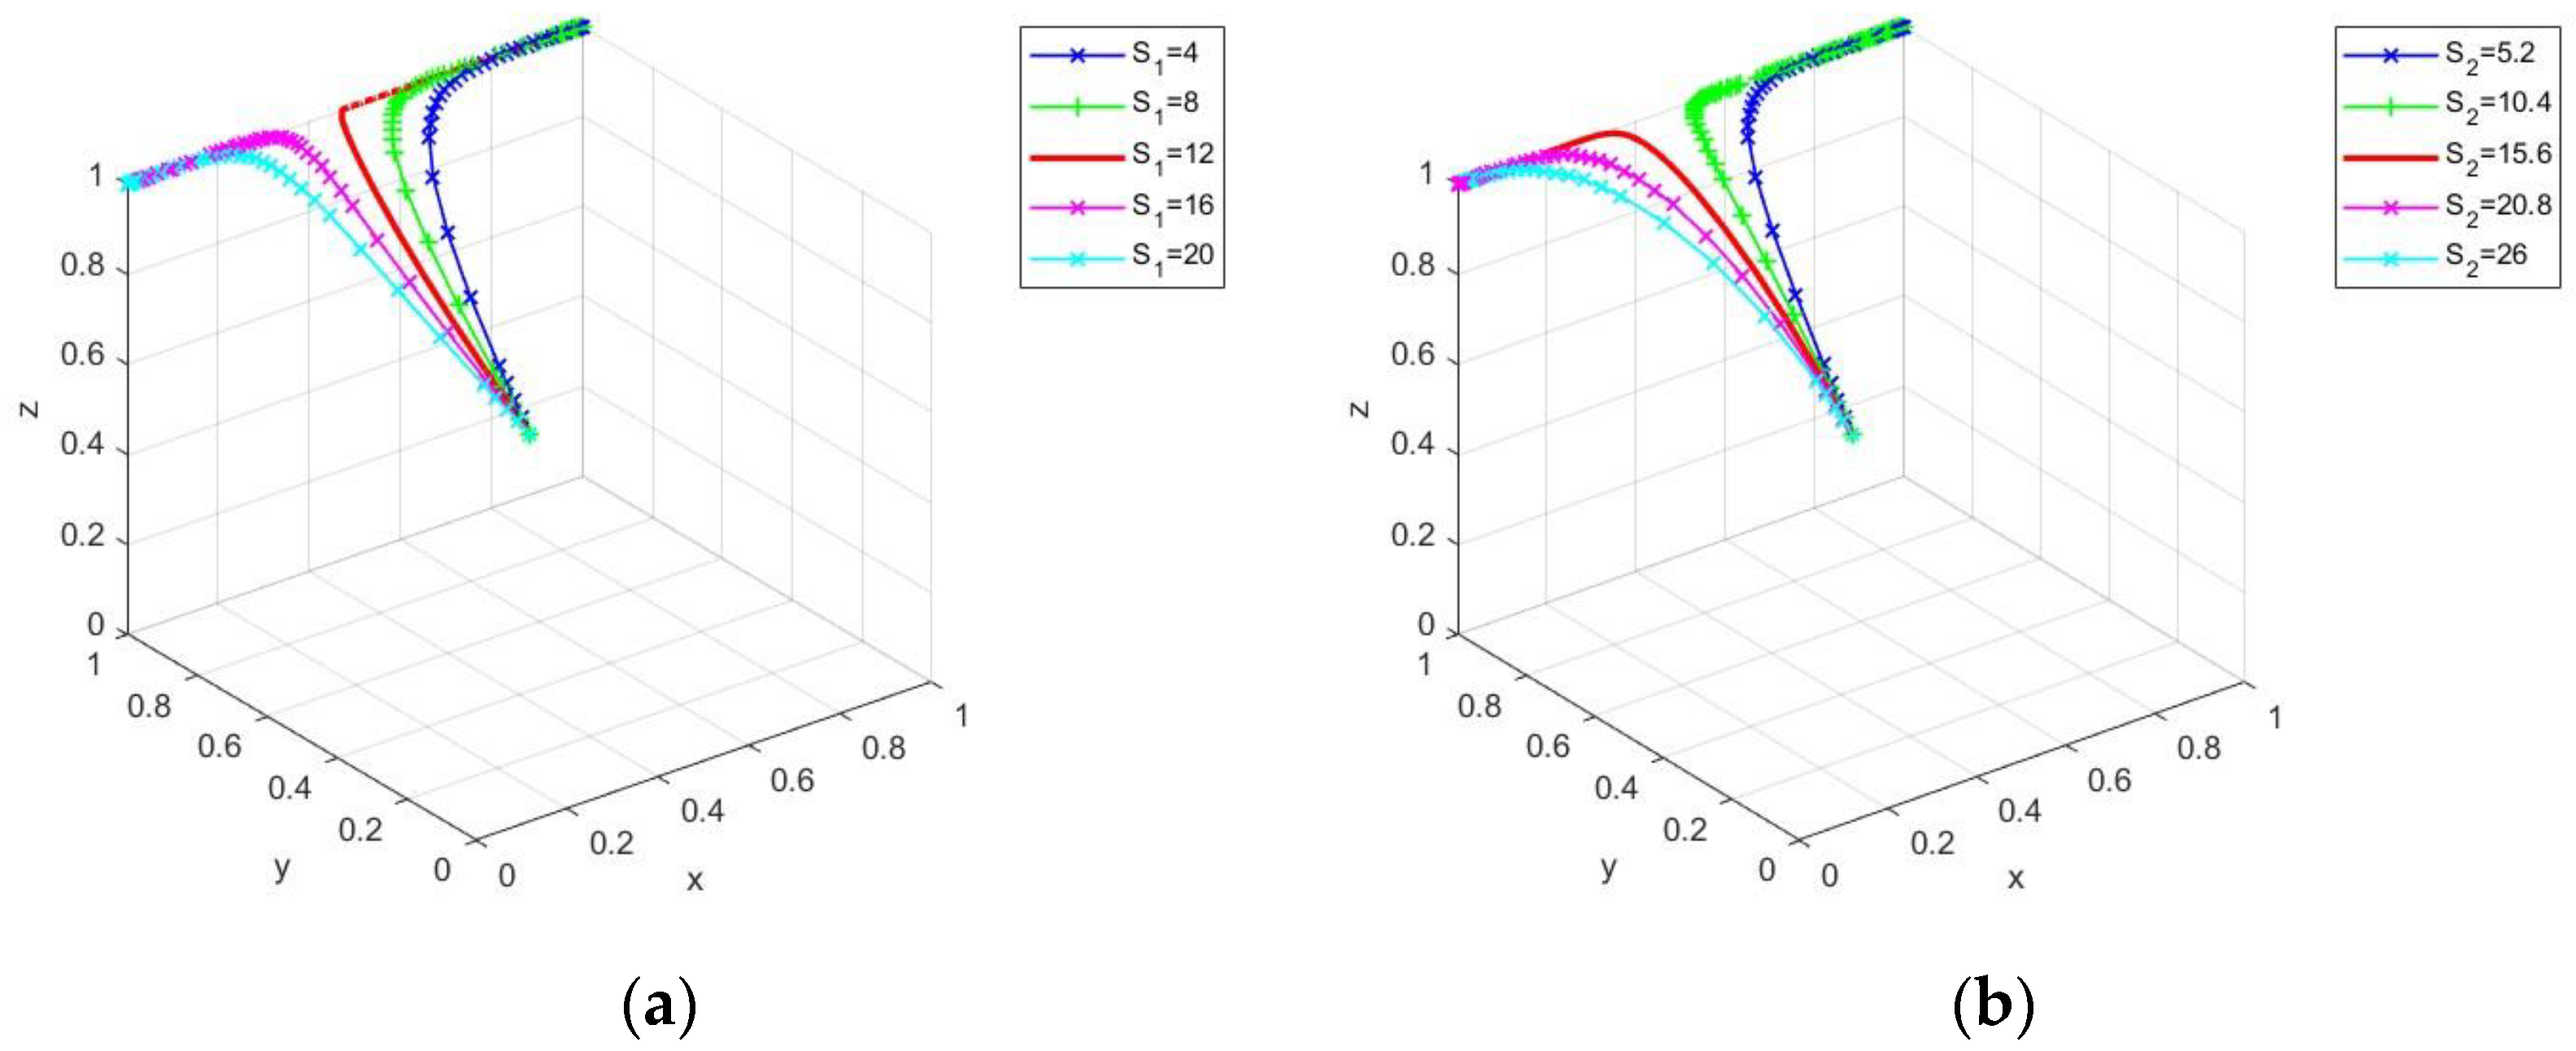
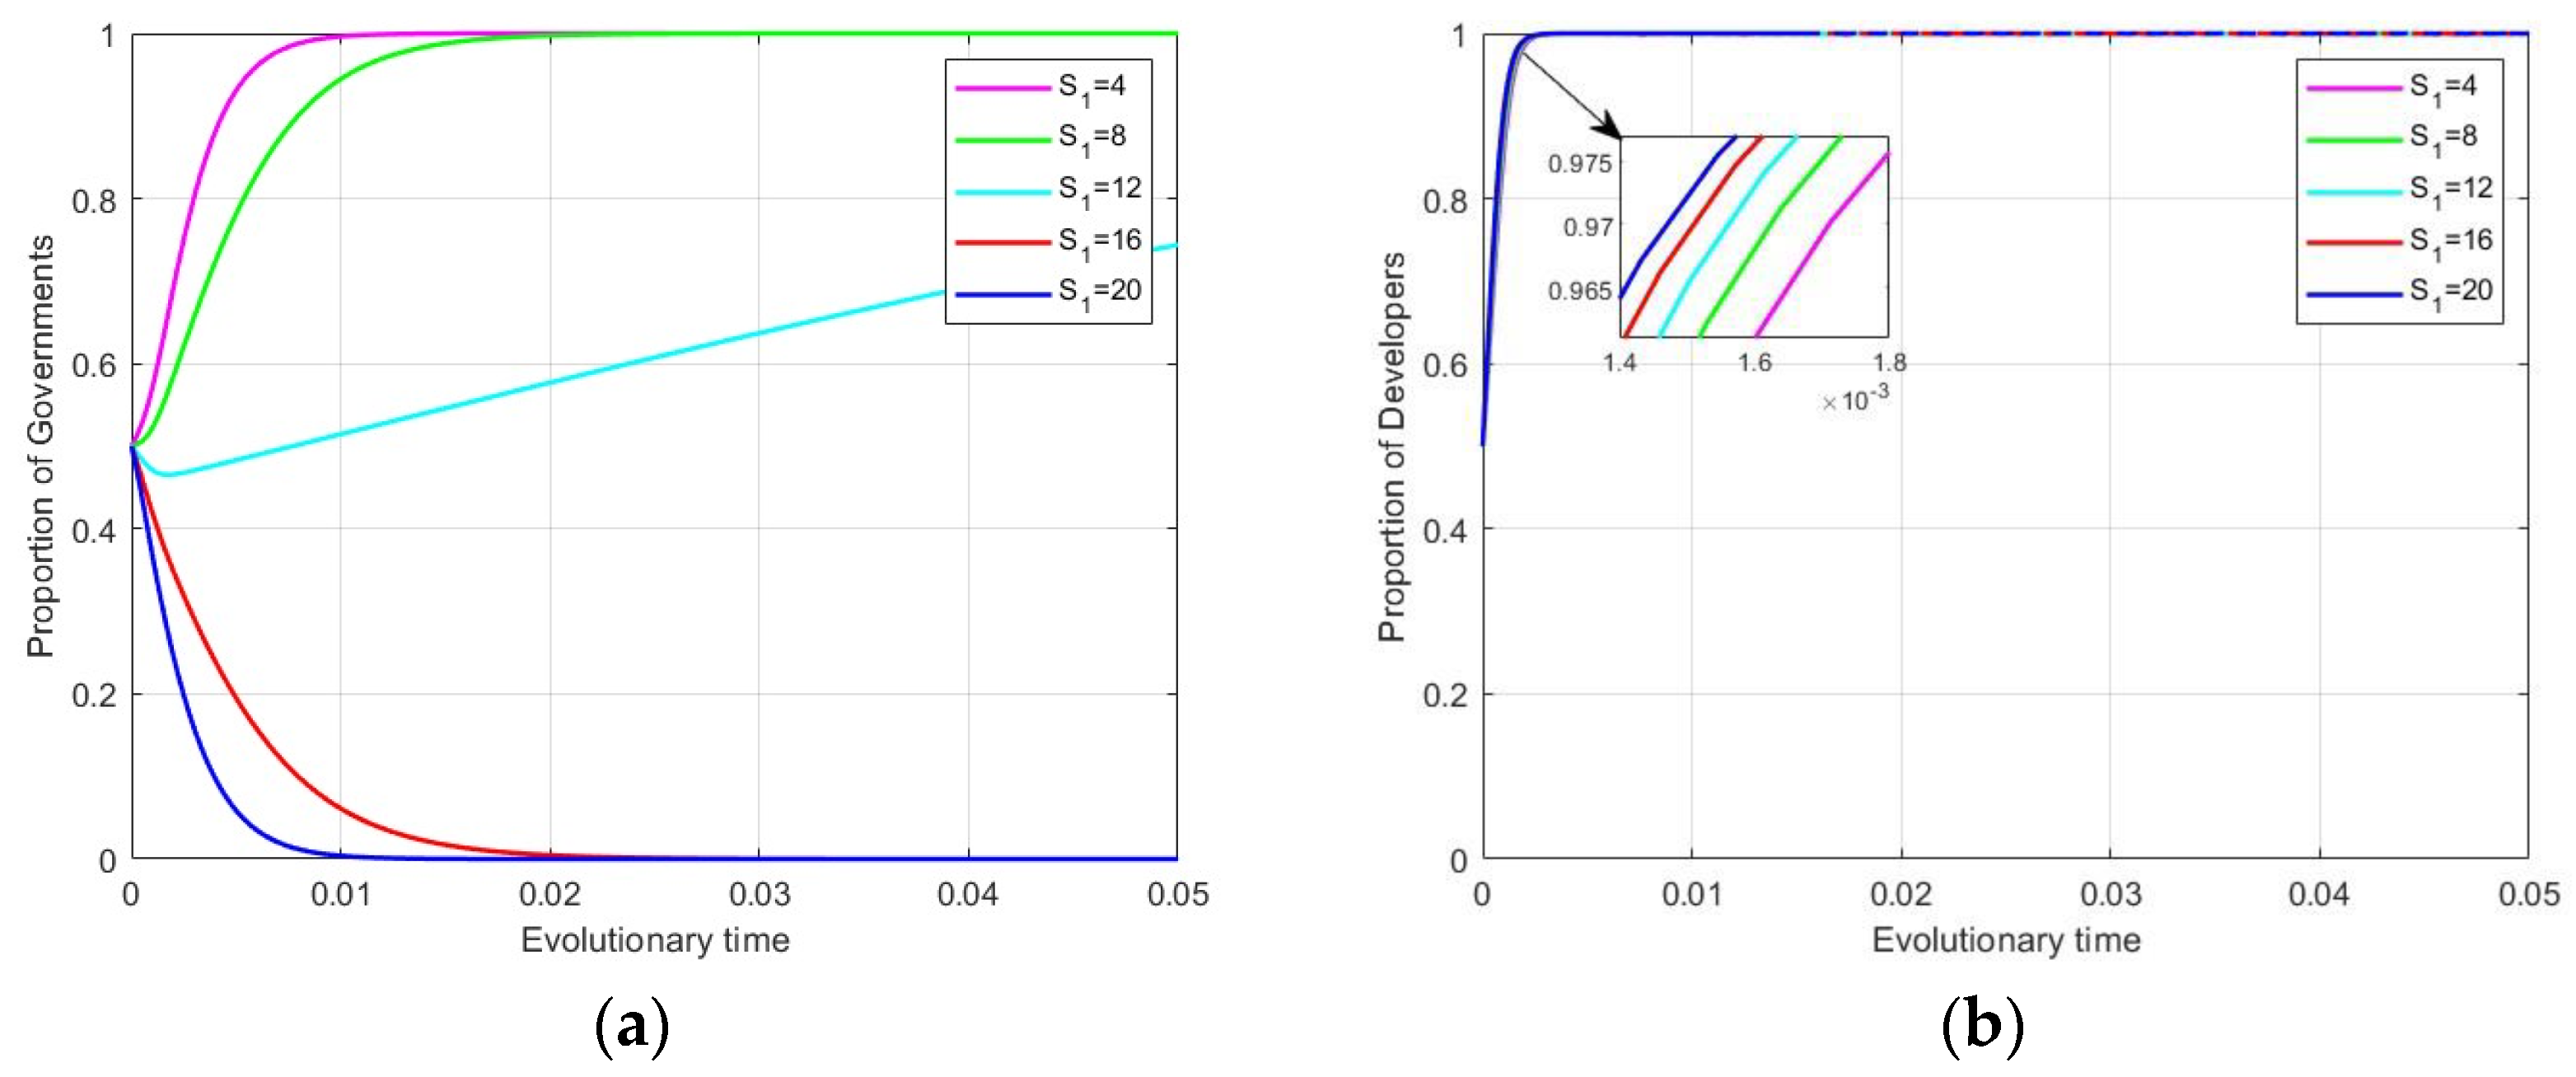
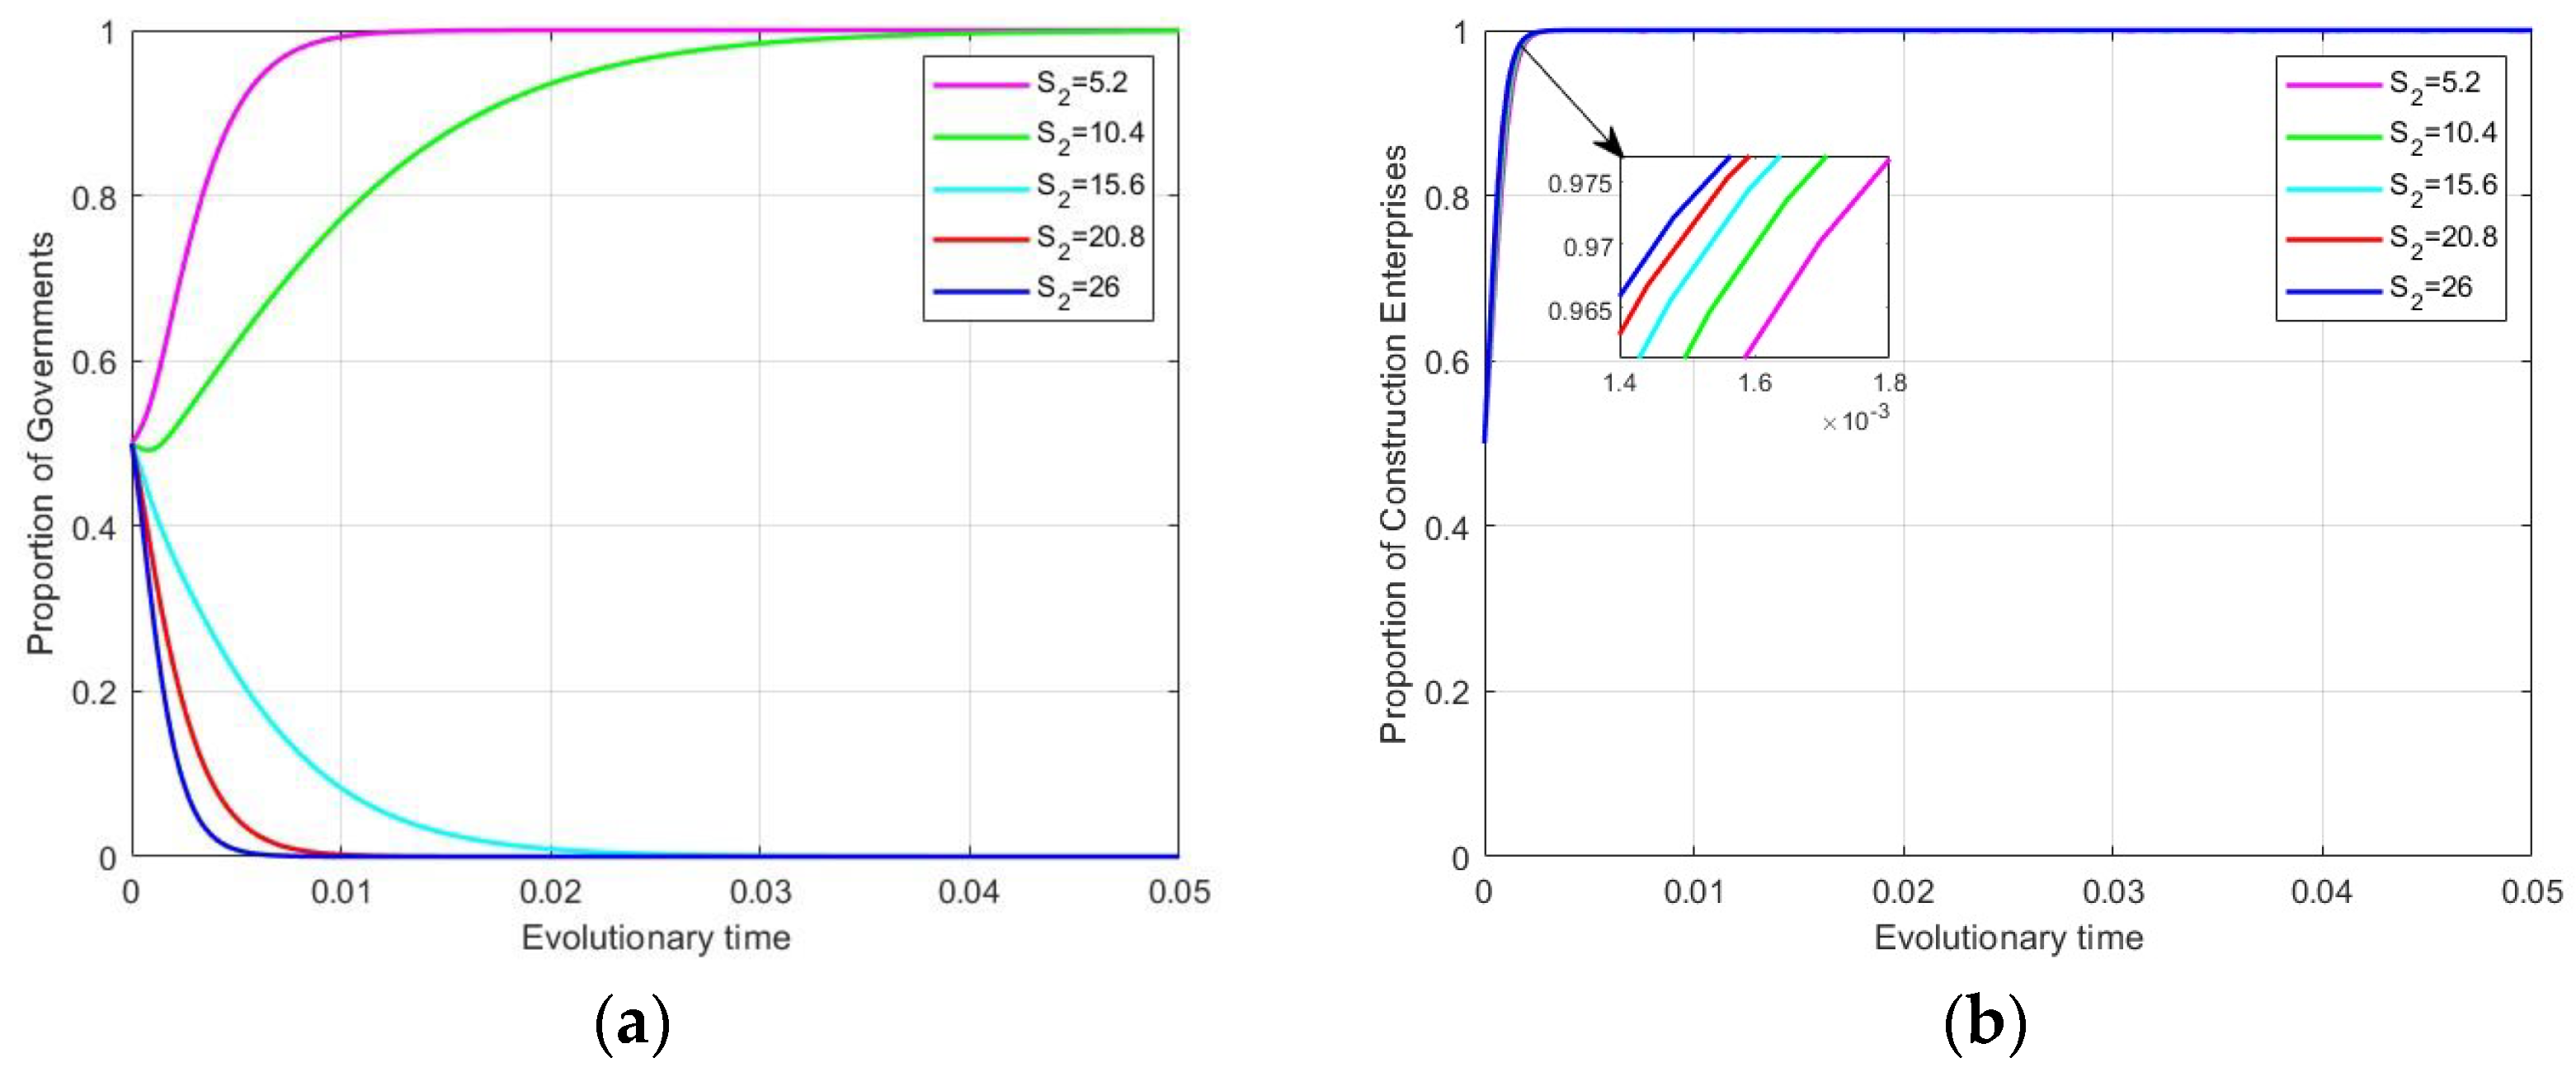
4.3.1. Impact of Government Subsidies on Evolutionary Stabilization Strategies

Government subsidies can reduce the costs incurred for green transformation and emission reduction measures, thereby compelling developers and construction enterprises to adopt more proactive emission reduction strategies [62,63,64]. Government subsidies are independent of each other and are not related to each other. On this basis, the influence of government subsidies on strategies is further discussed. Under the premise of ensuring that the other parameters remain unchanged, this paper sets the subsidy strength at 10% to 50% of the abatement input cost of developers and enterprises, i.e., S1 = {4 8 12 16 20} and S2 = {5.2 10.4 15.6 20.8 26}, and the evolution results are shown in Figure 8, Figure 9 and Figure 10. Figure 8 illustrates variations in government subsidies, demonstrating a pronounced linear correlation with the strategic evolution of all stakeholders. Specifically, when the subsidy ratio exceeds a critical threshold, the system undergoes a phase transition from positive to negative. Figure 9 and Figure 10 clearly show that changes in this parameter are most sensitive to the government’s behavior. This is due to the fact that a continuous increase in subsidies will lead to an increase in the government’s financial burden, making the cost of subsidies an important factor that the government must consider. When the cost of the subsidy exceeds what the government can afford, i.e., S1 > 12 (subsidy rate of 30%, Figure 9a) and S2 > 10.4 (subsidy rate of 20%, Figure 10a), the government will reduce the subsidy or stop subsidizing to reduce financial burden. As shown in Figure 9b and Figure 10b, in the mature stage, the strategic evolution rate of both developers and construction enterprises exhibits a positive correlation with increasing subsidy ratios, indicating a pronounced trend toward adopting proactive emission reduction strategies. Subsidy policies embody the strategic orientation of low-carbon urban renewal, providing developers and construction enterprises with both clear transformational pathways and tangible emission reduction incentives. Moreover, government subsidies, as important economic incentives, demonstrate enhanced emission reduction efficacy with increasing subsidy ratios. Higher subsidy ratios prove to be more effective than lower ones in mitigating the cost pressures faced by developers and construction enterprises during green transition and emission reduction implementation, thereby significantly strengthening their willingness to reduce emissions and enhancing the initiative for emission mitigation practices.

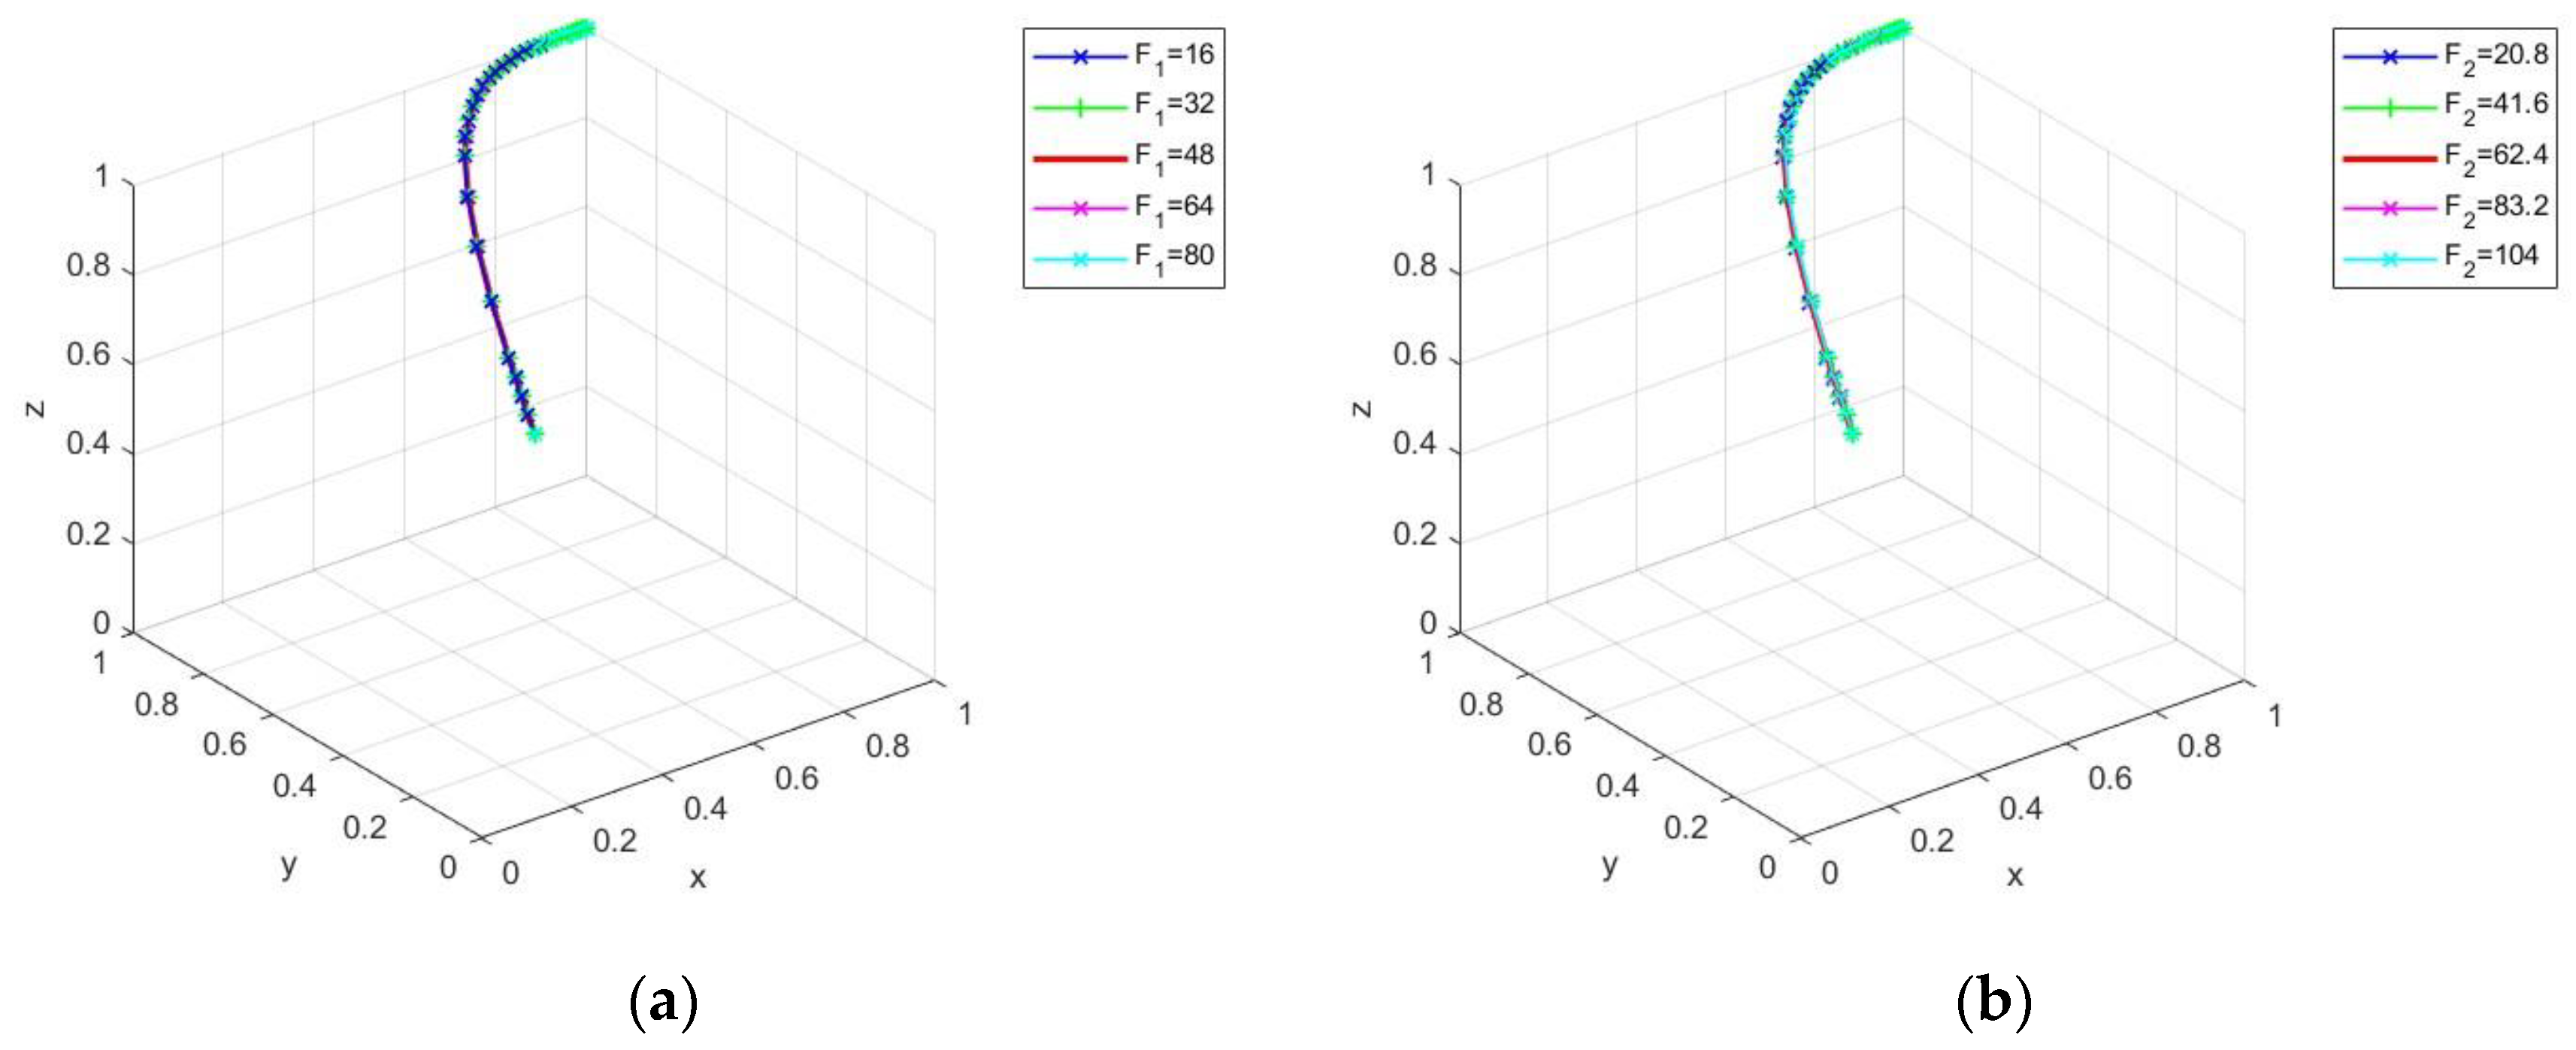
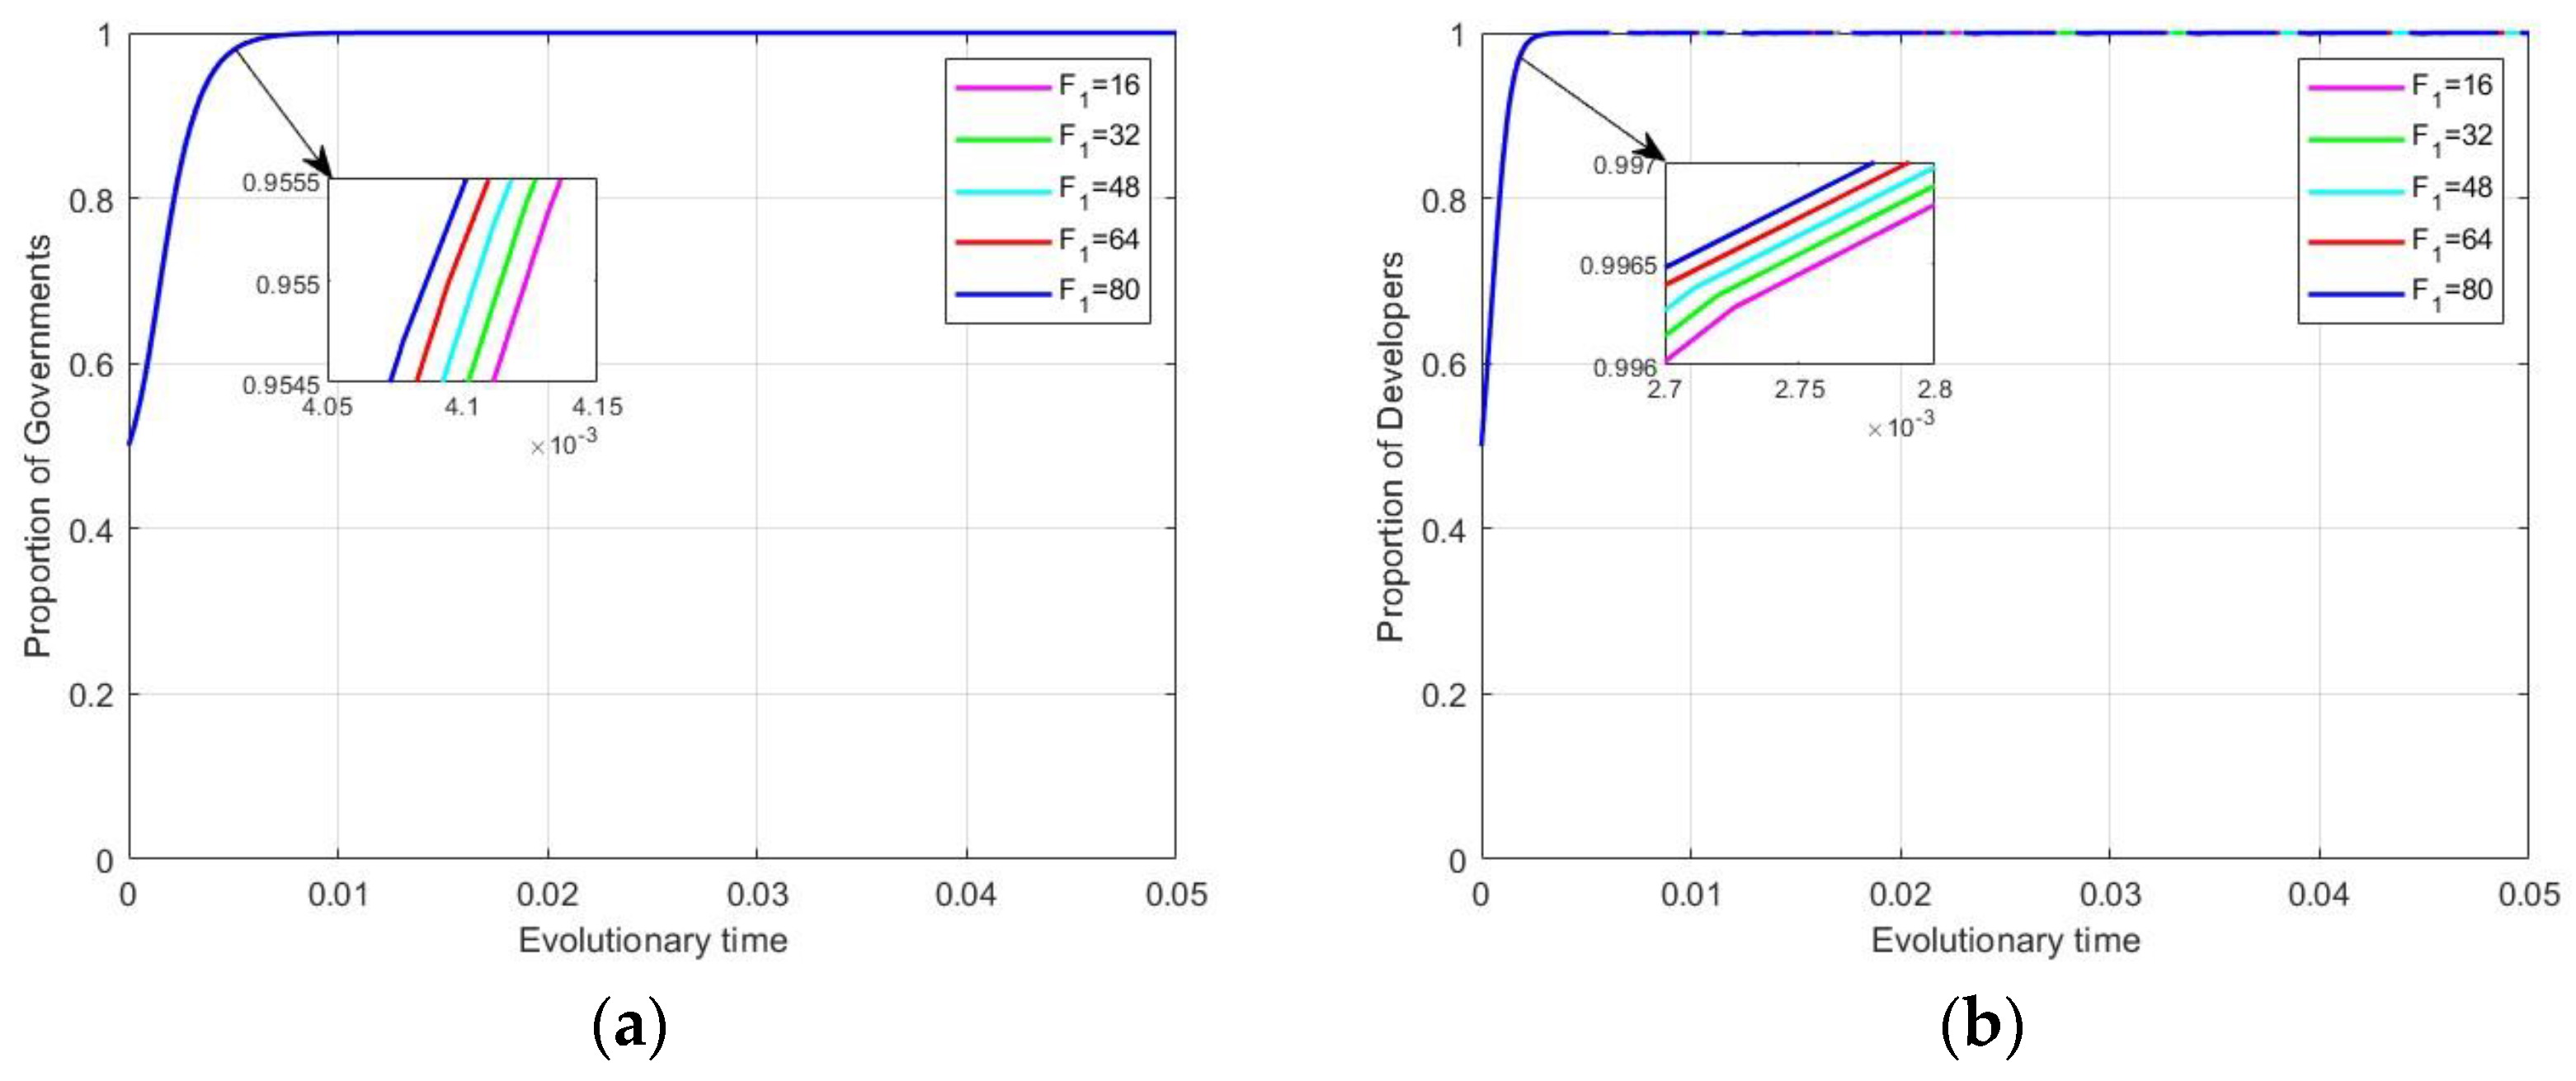
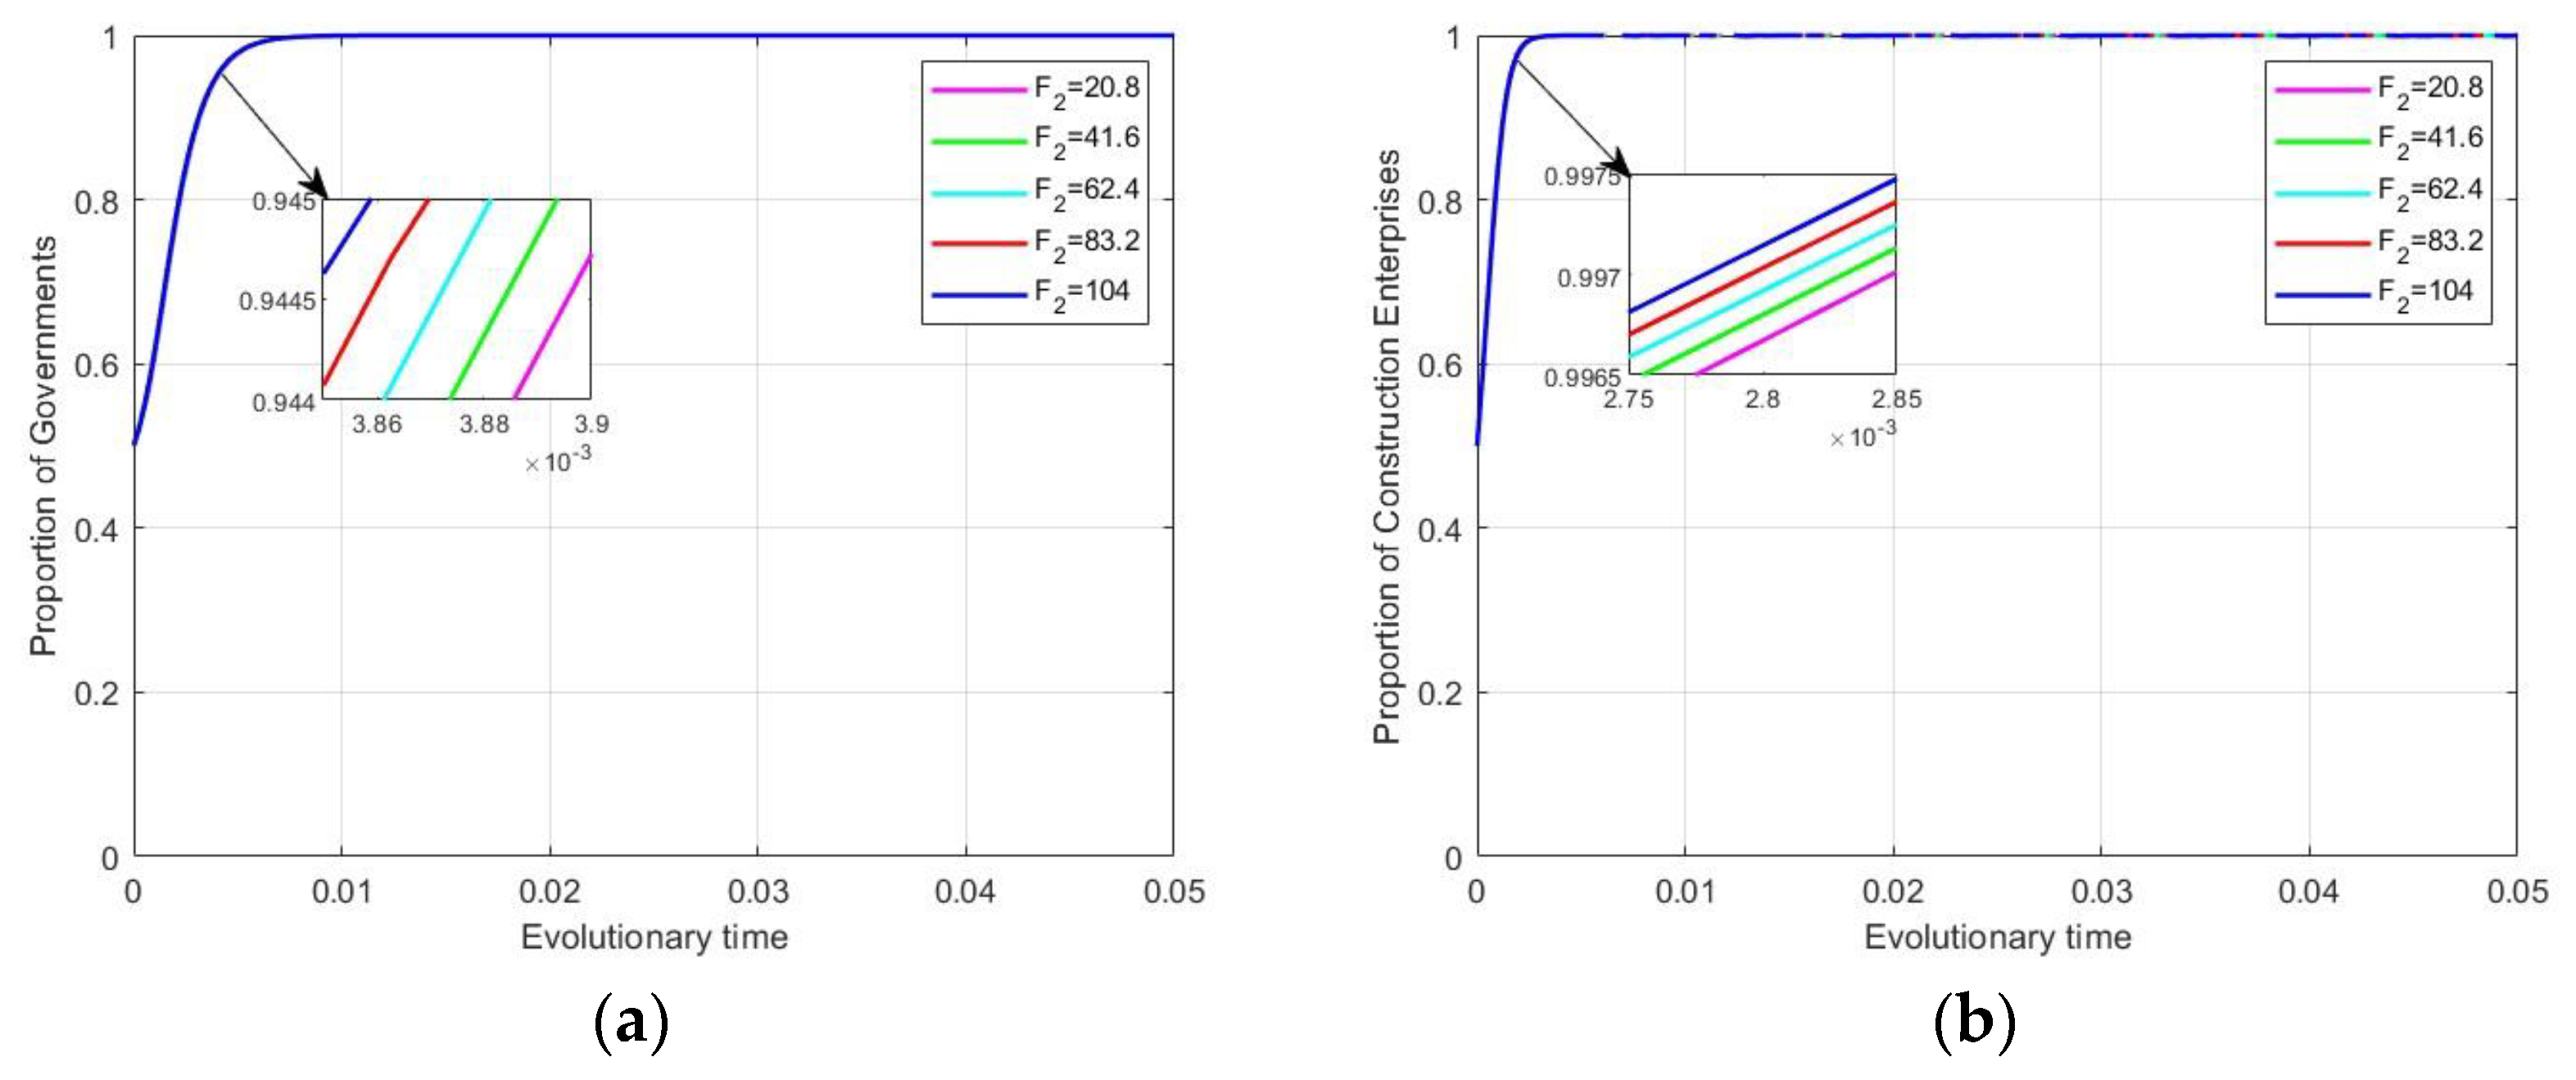
4.3.2. Impact of Government Punishments on Evolutionary Stabilization Strategies

Government penalties are considered important factors that can efficiently motivate enterprises to proactively lower emissions, and the severity of government penalties has an important effect on carbon emission behavior [47]. In this work, the penalty strength is set as the corresponding multiple of the subsidy strength, ranging from 1 to 5 times, i.e., F1 = {16 32 48 64 80} and F2 = {20.8 41.6 62.4 83.2 104}, and the values of the parameters other than the penalties are kept constant to avoid interference from other influencing factors. As shown in Figure 11, Figure 12 and Figure 13, the effect of changes in the level of penalties on the evolution of the strategies is consistently positive. The existence of a penalty mechanism acts as a constraint on developers and construction enterprises, who are trying to avoid fines or other negative impacts so that they are forced to re-examine their carbon emission behaviors and tend to adopt more proactive emission reduction strategies. This trend is particularly evident in the mature stage (Figure 12b and Figure 13b), where developers and construction enterprises tend to favor aggressive strategies regardless of changes in penalty levels. Compared to subsidies, it demonstrates superior efficacy in regulating the carbon emission behaviors of developers and construction enterprises during urban renewal processes. For the government, the penalty mechanism is a clearer signal from the government to the market to reduce emissions. An increase in penalties, to a certain extent, can compensate for the financial pressure faced by the government in promoting carbon emission reduction in urban renewal and can provide the government with more financial support for further increasing the intensity of subsidies and regulation.

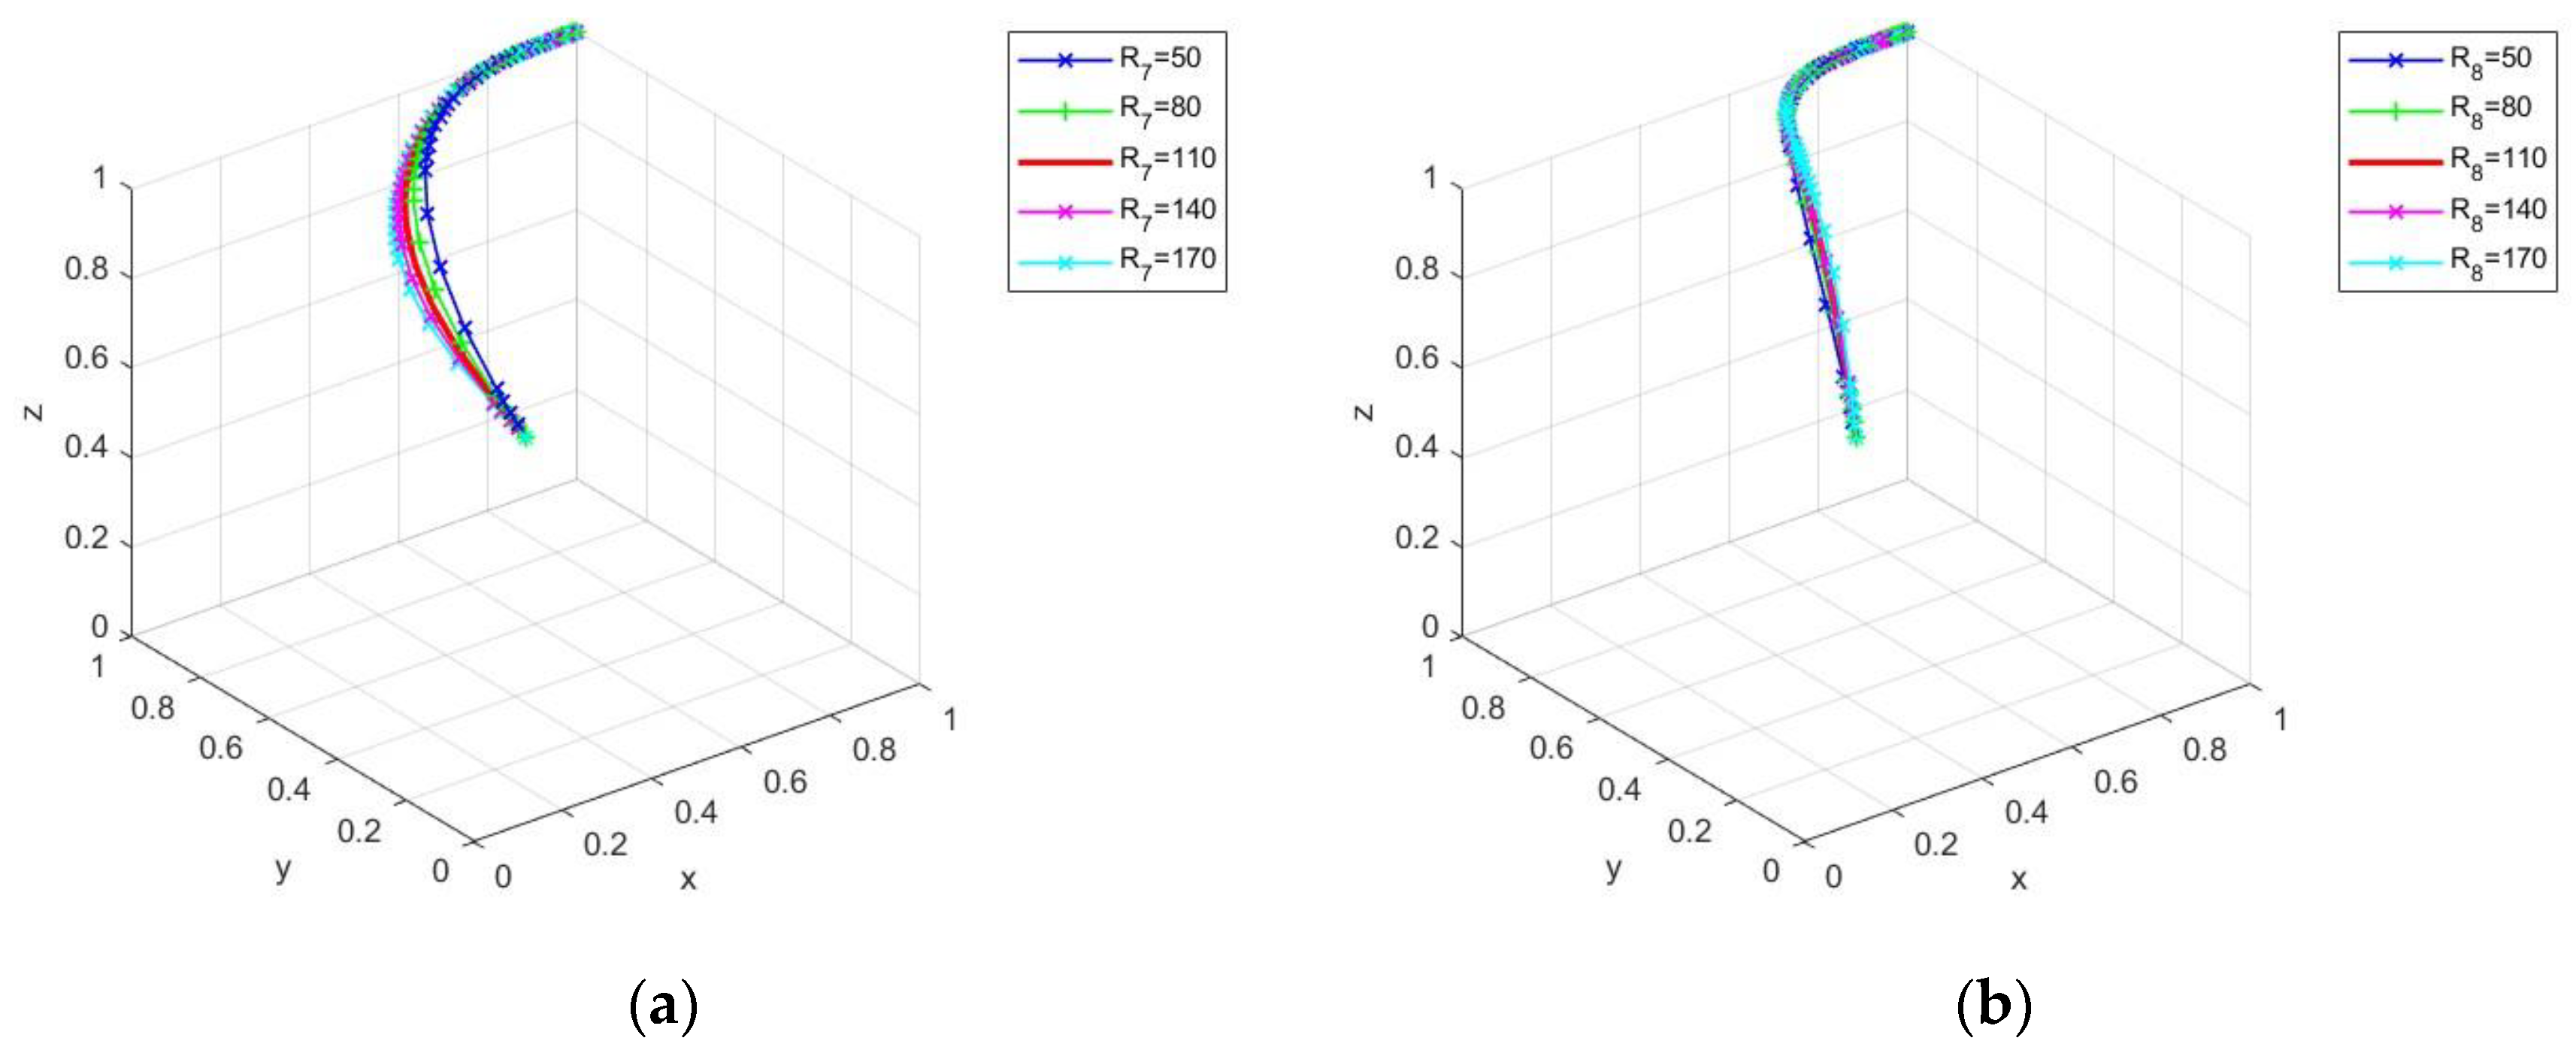
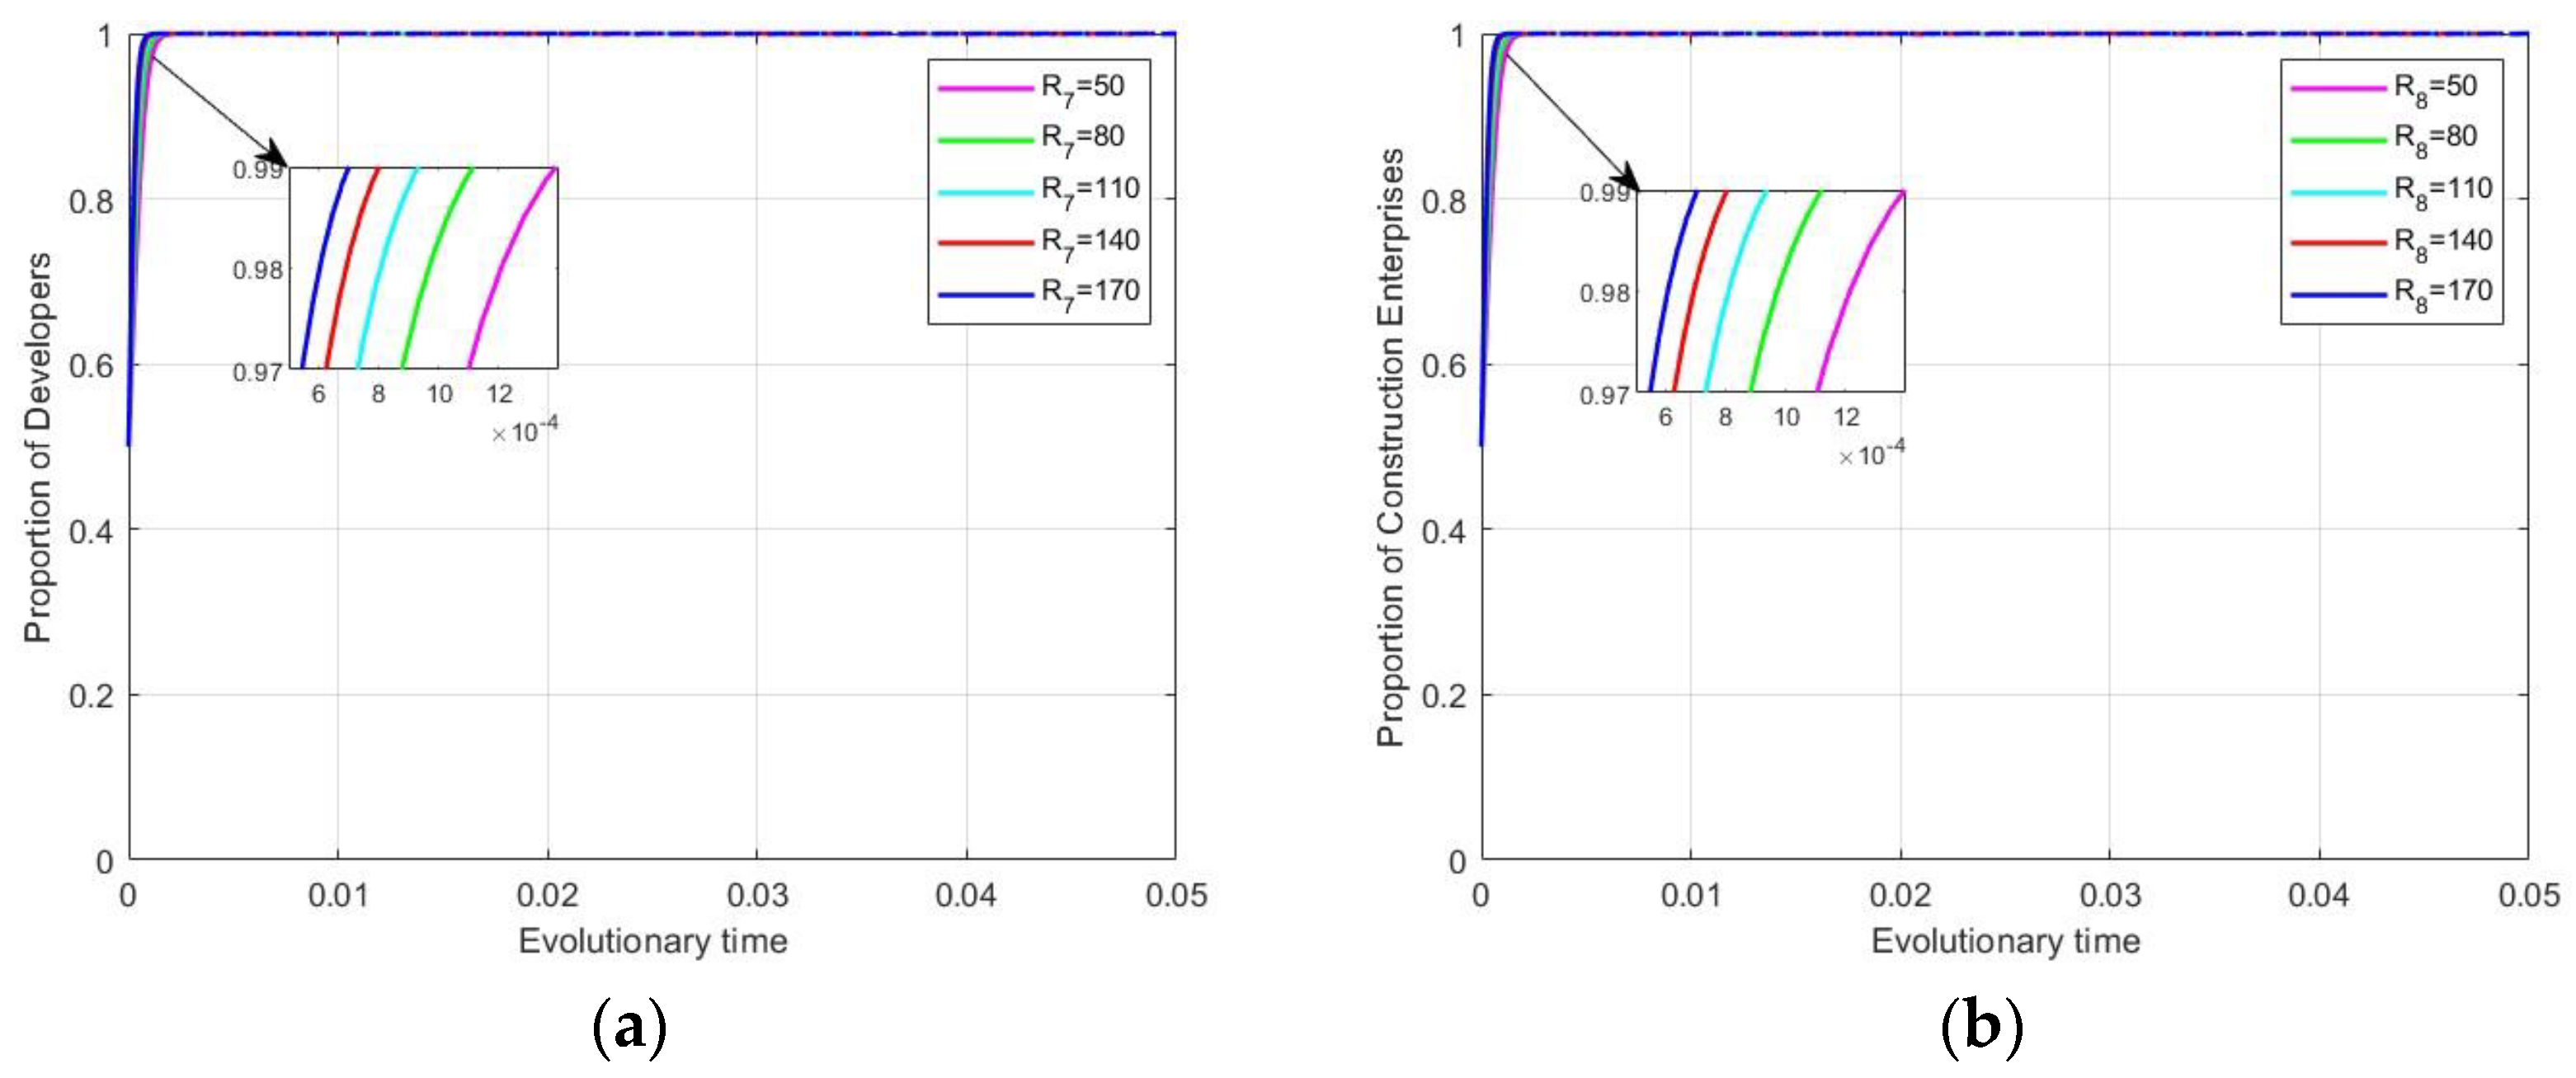
4.3.3. Impact of Additional Benefits on Evolutionary Stabilization Strategies

As China continues to accelerate its comprehensive green development, new opportunities are being created for developers and construction enterprises. By adopting energy-efficient technologies and green construction methods in urban renewal projects, vigorously developing green and low-carbon buildings, developers and construction enterprises can achieve non-monetary benefits such as enhanced brand image and increased corporate competitiveness, which have become important incentives for them to adopt proactive emission reduction strategies [65]. Although reputation and social capital may evolve dynamically over extended interactions, project-specific collaborations are typically contract-bound and oriented toward defined short-term objectives. Consequently, our analysis primarily examines how trends in non-monetary benefits influence strategic decision-making rather than their long-term accumulation processes. While ensuring that the other parameters remain constant, this paper sets the value of additional benefits for developers and construction enterprises to R7,R8 = {50 80 110 140 170} and observes its impact. As shown in Figure 14 and Figure 15, with the increase in additional benefits, developers and construction enterprises gradually realize that through green transformation and emission reduction behaviors, they can enhance their brand image, improve the status of the industry, and indirectly obtain additional economic benefits; therefore, they are more willing to invest in resources to promote urban renewal to achieve carbon emission reduction targets and then evolve to a positive strategy at a faster rate (Figure 14). Moreover, since the adoption of proactive emission reduction strategies by developers and construction enterprises has not increased their financial burden at this stage but has instead helped them achieve emission reduction targets and promote economic and social development, the government has maintained a more proactive regulatory stance and provided strong policy support and safeguards for them.

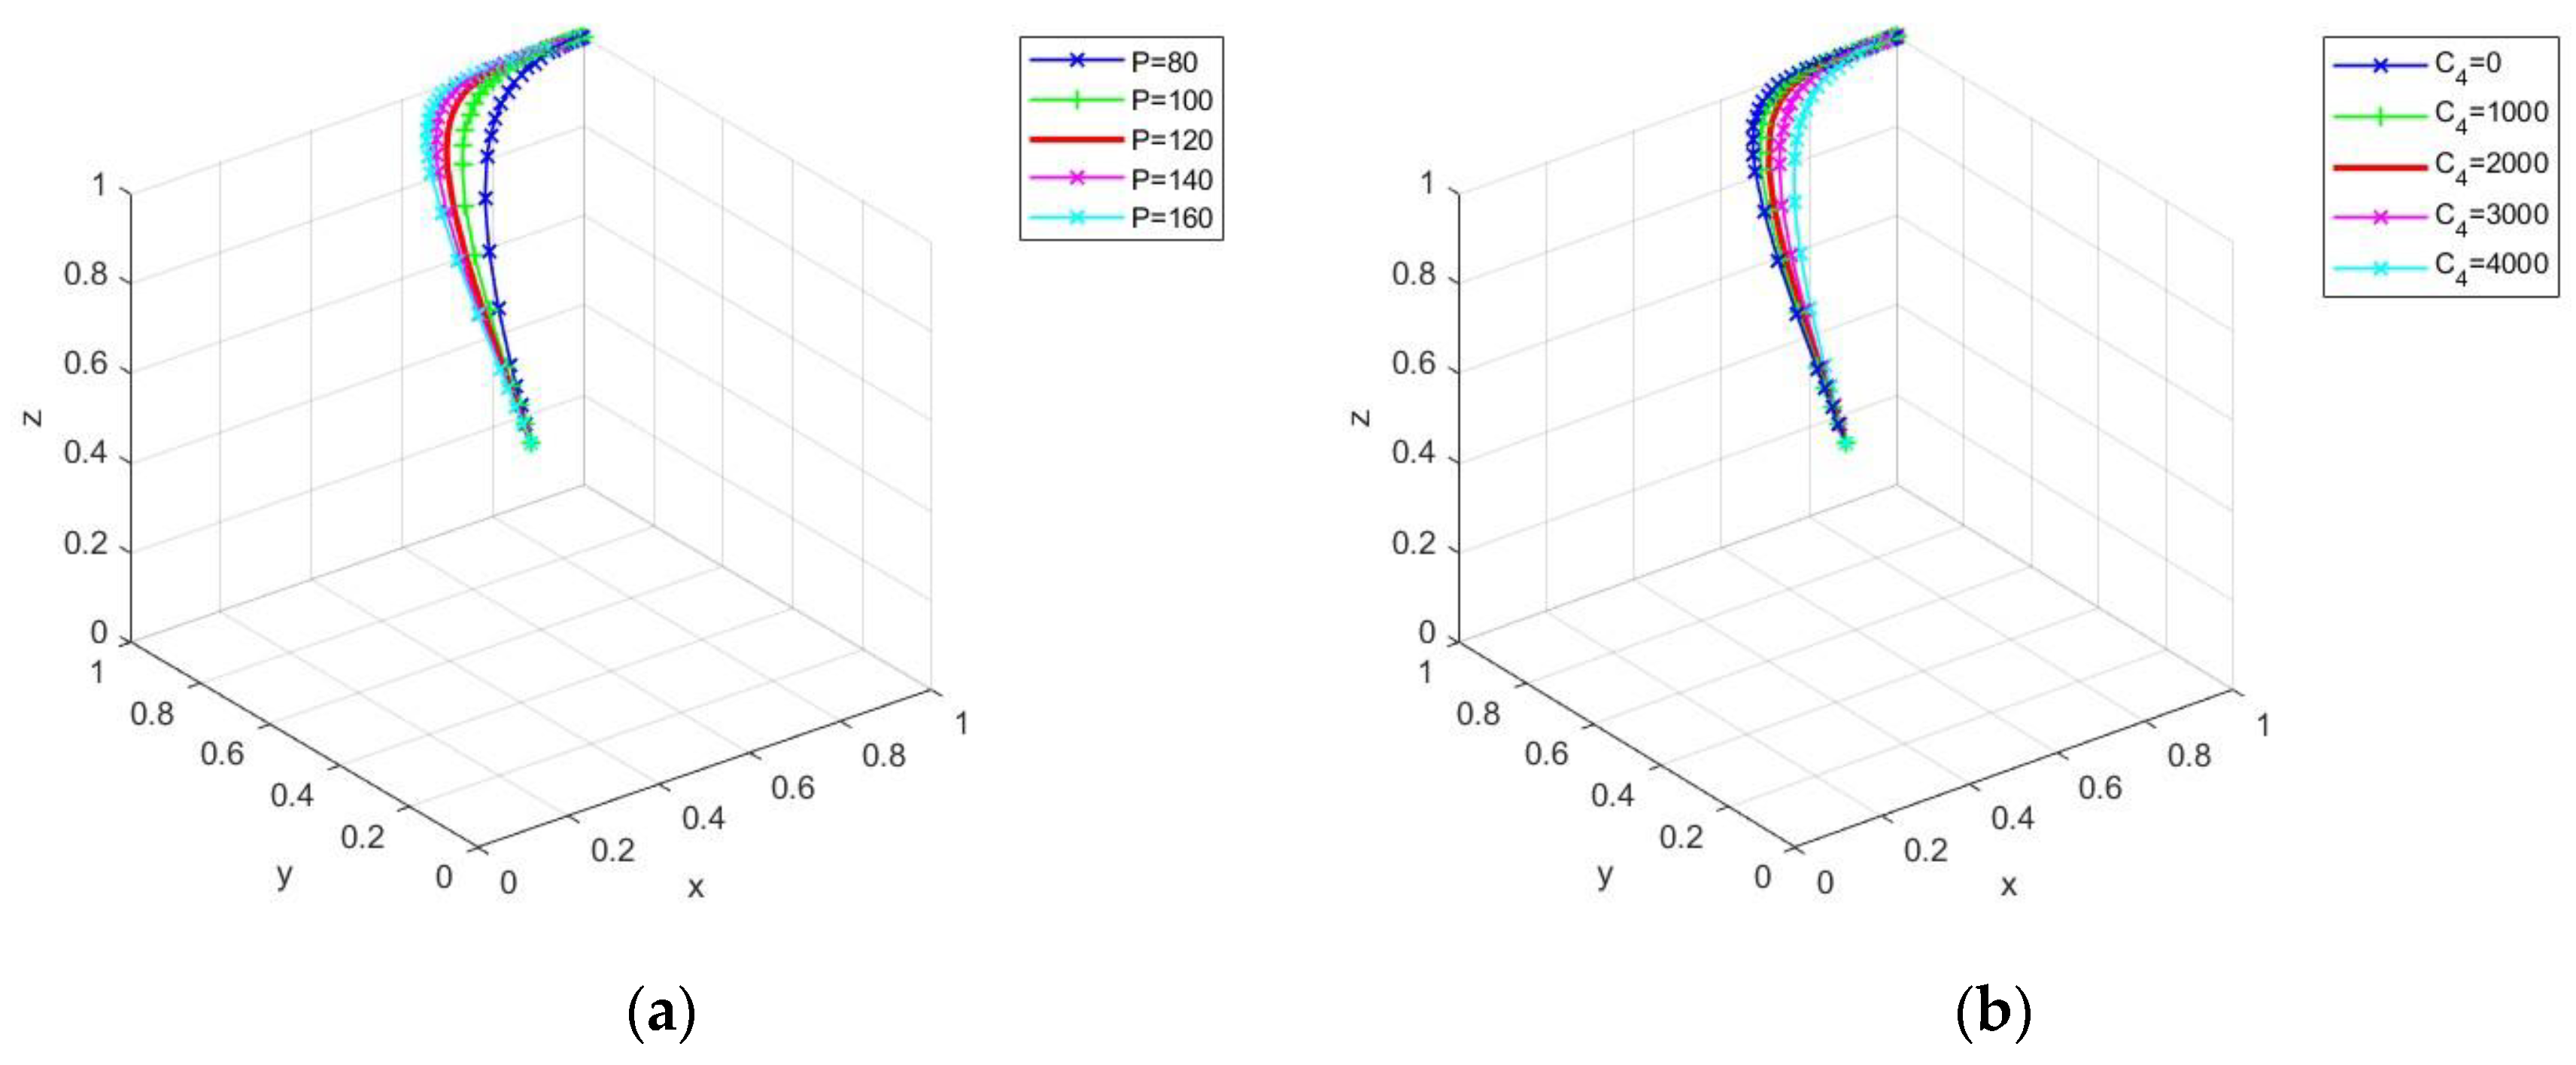
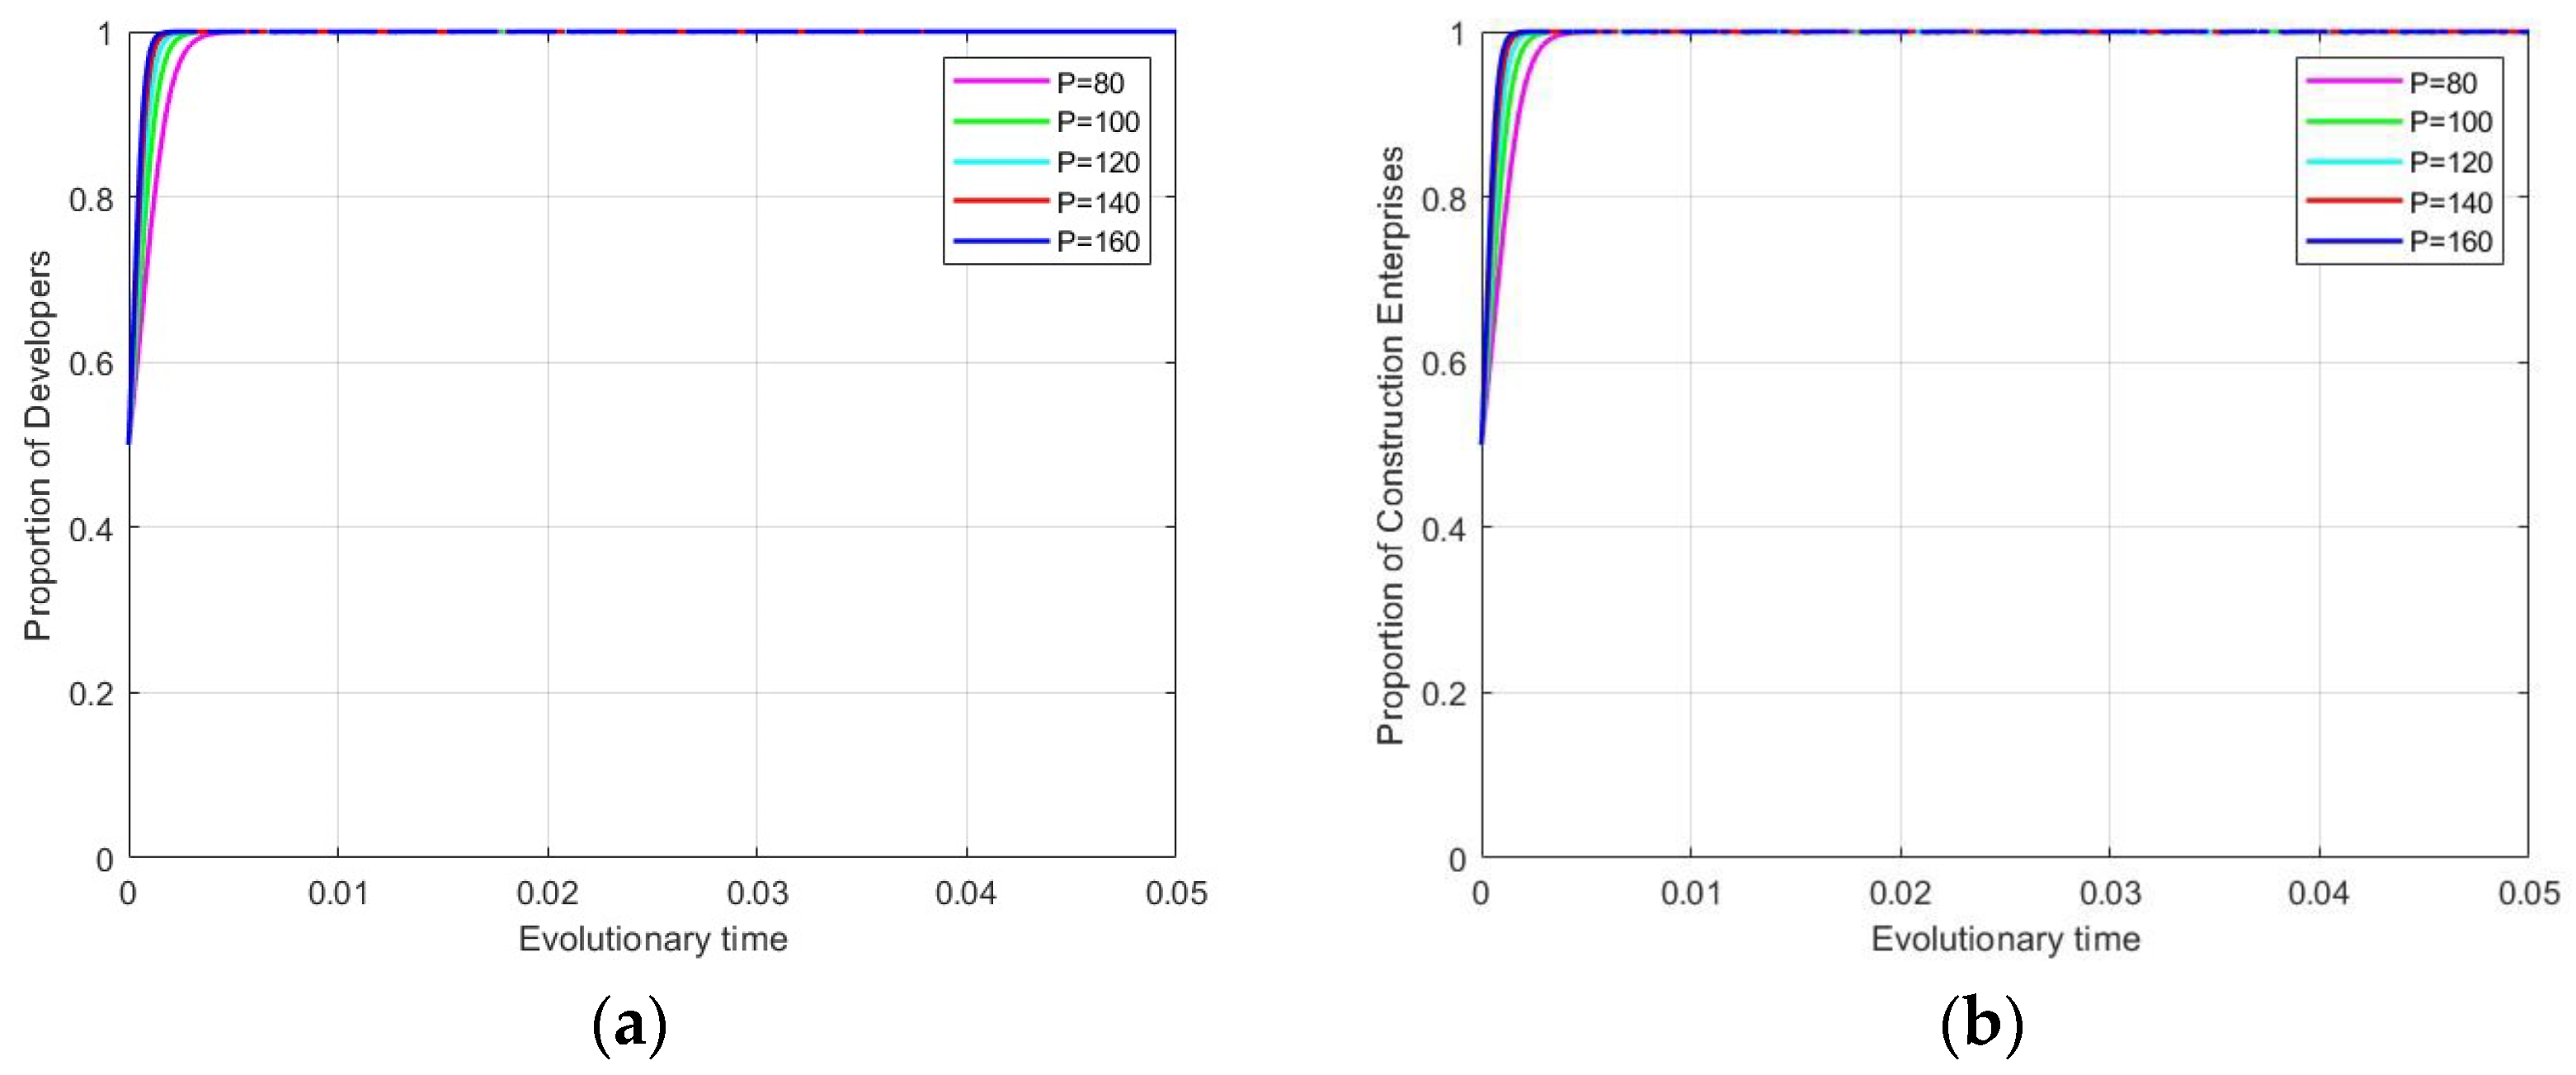
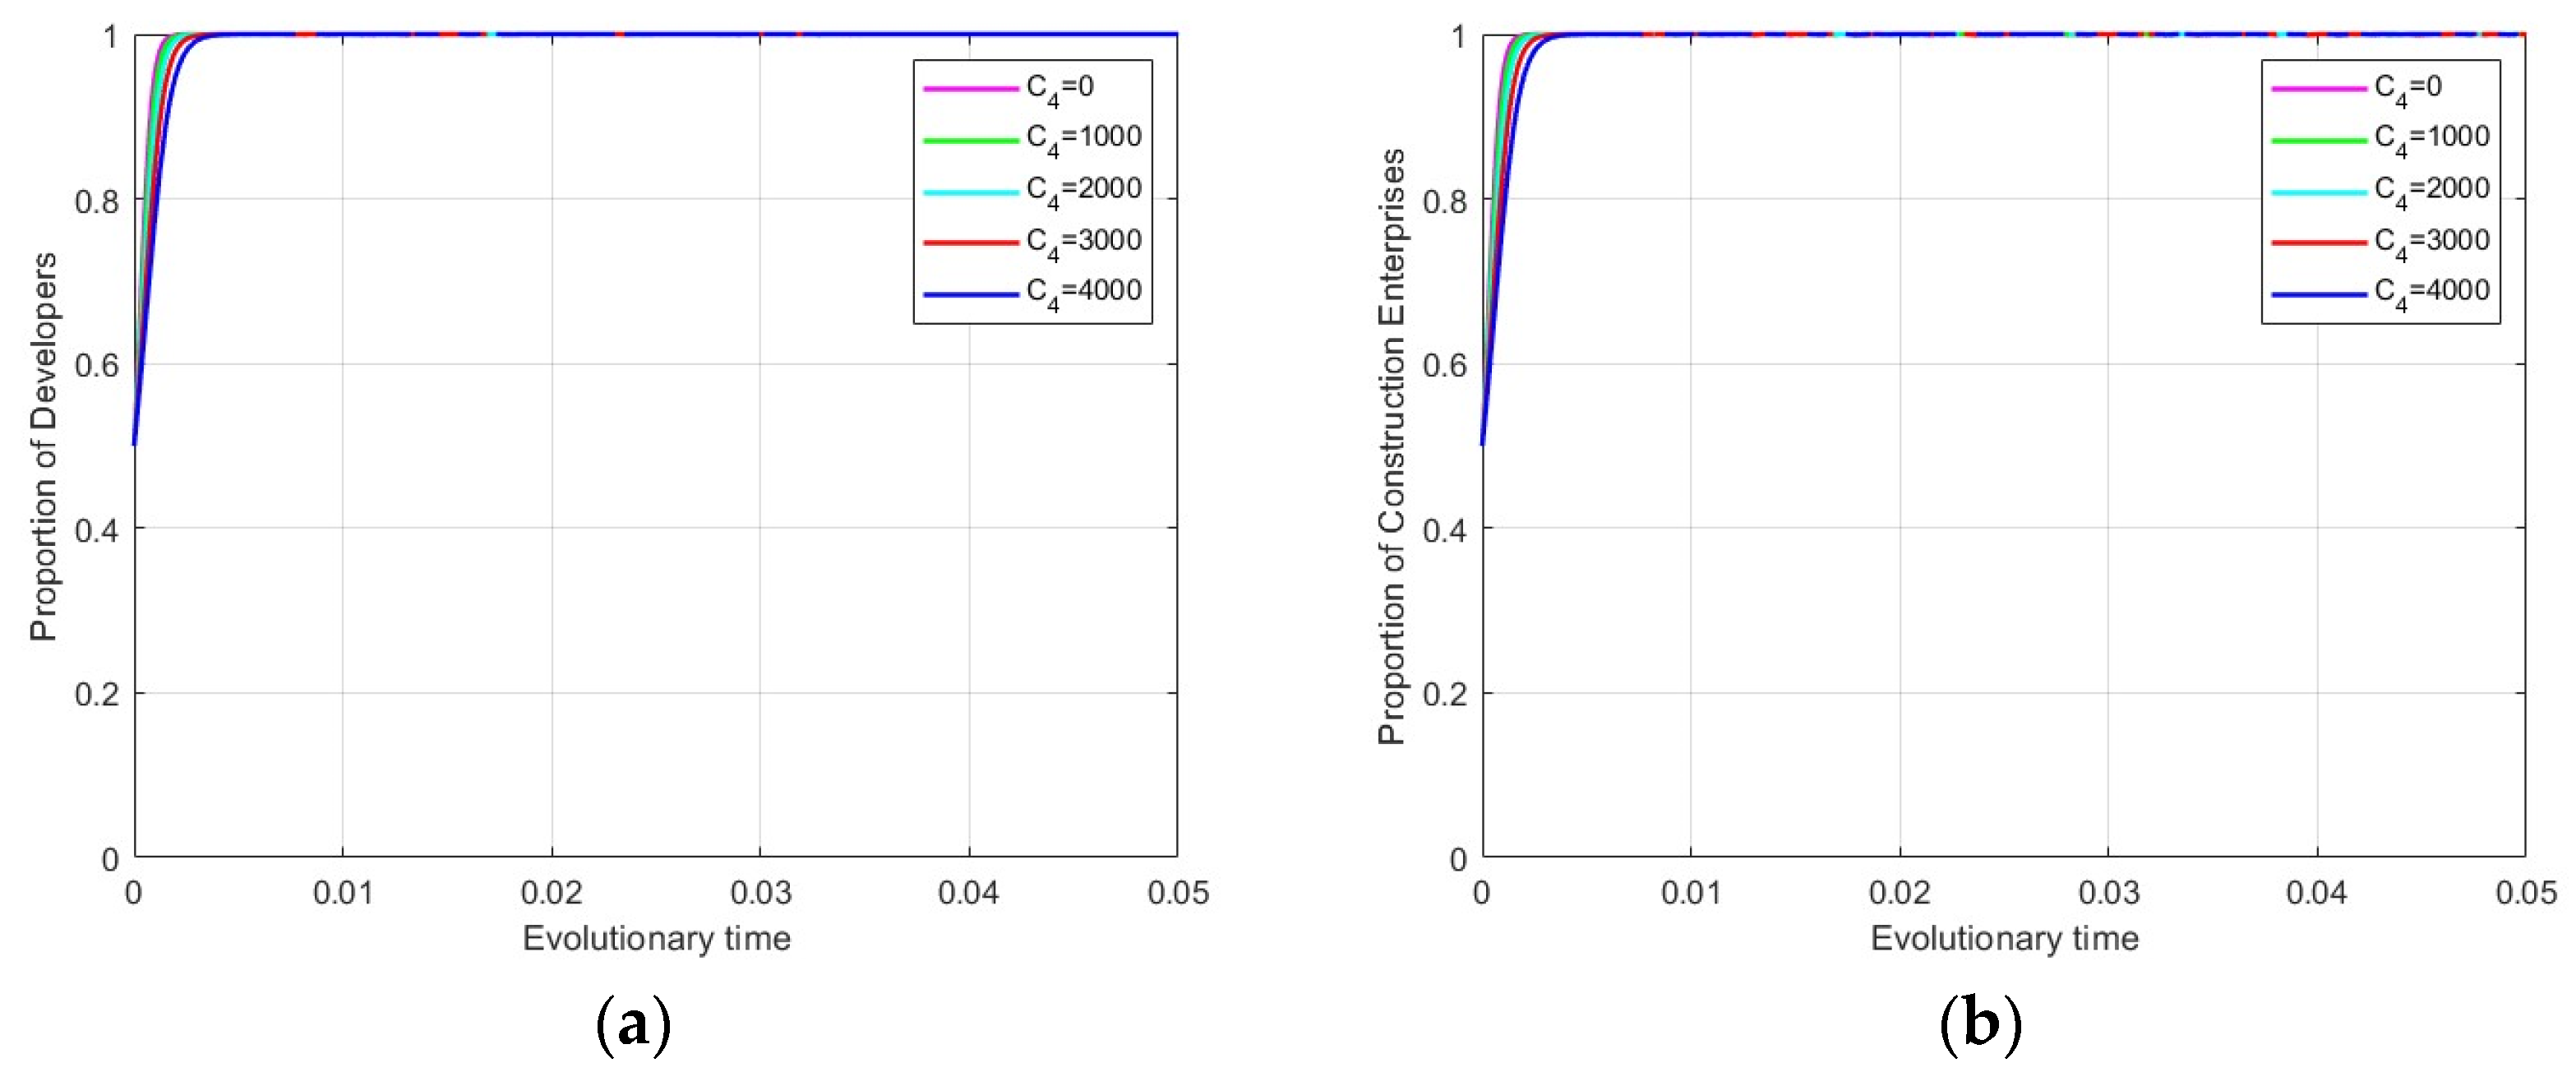
4.3.4. Impact of Carbon Trading on Evolutionary Stabilization Strategies

Carbon trading can be seen as an economic incentive to shift from a policy-driven approach to a market-oriented approach used to encourage active emission reduction, which is important for China’s dual-carbon targets [66]. In the stage of increasing awareness of emission reduction, developers and construction enterprises are actively pursuing effective emission reduction in urban renewal projects, seeking to explore new revenue opportunities through their emission reduction actions. At this point, carbon trading has emerged as a critical avenue for generating additional revenue, thereby providing stronger incentives for adopting more proactive emission reduction measures. However, given the current price characteristics observed in China’s carbon trading market, the fluctuations remain relatively constrained in magnitude. Moreover, market participants’ decision-making process is predominantly influenced by long-term price trajectories rather than short-term fluctuations. In addition, through carbon trading platforms, participation in carbon trading requires the payment of account opening fees, annual fees, and other related fees. These costs primarily follow a uniform pricing mechanism and maintain relative stability in the short term. Therefore, recognizing that excessive market entry costs may hinder participation, we explicitly incorporate both the carbon trading price, P, and the carbon trading cost, C4, as key determinants in our market behavior analysis to better model real-world market dynamics. In this paper, the price and cost are set as P = {80 100 120 140 160} and C4 = {0 1000 2000 3000 4000}, respectively. Figure 16 demonstrates the dynamic impacts of the carbon trading price, P, and transaction costs, C4, on system evolution, revealing that market volatility in carbon trading mechanisms effectively drives all participating entities toward proactive emission reduction strategies. As the carbon trading price increases, the revenue that developers and construction enterprises can gain by reducing emissions also increases, and this economic incentive drives them to be more inclined to adopt aggressive emission reduction strategies and maximize carbon trading revenue (Figure 17). When P reaches high levels, the economic returns from carbon trading are sufficient to adequately cover or even exceed the cost of abatement, thus accelerating the evolution of developers and construction enterprises toward a proactive strategy. As shown in Figure 18, lower carbon transaction costs C4 accelerate strategic evolution toward proactive mitigation approaches because the decrease in C4 lowers the threshold for market players to participate in carbon trading, and market players are more likely to accept and participate in carbon trading and thus seek emission reduction opportunities more actively. For the government, the implementation of a carbon market helps reduce its economic burden to a certain extent.

5. Discussion

The above sensitivity analysis shows that government subsidies, penalty mechanisms, additional benefits, and carbon trading, as key variables, have an important impact on the emission reduction decisions of the government, developers, and construction enterprises. Among them, changes in government subsidy parameters have the most significant sensitivity to government behavior. Through tripartite equilibrium simulations, we demonstrated that governments consistently exhibit a tendency toward active regulation strategies across all phases; this finding aligns with observed policy persistence in real-world practice. With the increase in subsidies, the behavioral decision-making process of each subject is gradually shifted from conservative to positive, which promotes the formation of more effective emission reduction strategies, but it should be noted that there exists a fiscal sustainability threshold for subsidy policies (S1 > 30% or S2 > 20%), and exceeding this threshold will lead to the reverse evolution of government strategies. In contrast, the implementation of the penalty mechanism does not increase the financial burden of the government but rather makes the government show a more positive attitude in the regulatory process. Variations in the government’s subsidy and punishment parameters precisely manifest the external expression of regulatory intensity, essentially reflecting impacts under different regulatory environments. An increase in both subsidy and penalty intensities leads to a synergistic enhancement in the emission reduction performance of developers and construction enterprises within urban renewal projects. The additional benefits, R7 and R8, accrued by developers and construction enterprises through emission reduction activities confer enhanced socioeconomic value to these stakeholders. Carbon market volatility exerts dual influences through price fluctuations and participation costs. The government can influence the carbon price and regulate the transaction cost by regulating the supply and demand in the carbon trading market, thus guiding market participants to reduce emissions more effectively. Moreover, the healthy development of the carbon trading market can also bring tax revenue to the government, making the government more proactive in supervision. Based on these results, we conclude that exclusive reliance on government regulation would impose excessive fiscal burdens. Consequently, a dual mechanism combining regulatory oversight and market-driven incentives emerges as the optimal long-term solution.
Based on these findings, the simulation results are further discussed in this study. First, the phased characterization of carbon emission reduction in urban renewal is consistent with the current path of policy evolution. China’s carbon emission reduction policy is in a transition period from the growth stage to the mature stage, which is manifested in supporting the construction of the carbon trading market while actively exploring mechanisms to incentivize the participation of multiple subjects. Because the trend toward maturity is inevitable, this study focuses on the mature stage for simulation analysis. There are differences in the evolutionary paths under different policy orientations. In a mandatory policy scenario, carbon reduction pathways are led by the government, developers, and construction enterprises, where they passively respond to policy requirements. Under such circumstances, developers and construction enterprises can reach an agreement to cooperate and sign a document including written emission reduction requirements, and failure to meet the government’s requirements will result in the party bearing the consequences of penalties. In contrast, under a market-driven scenario, developers and construction enterprises, driven by market signals and economic interests, can spontaneously cooperate to reduce emissions without the need for strict terms and conditions and actively seek carbon trading opportunities.
This study primarily focuses on strategic decision-making among urban renewal stakeholders within the carbon trading market framework, with the current research emphasis placed on effectively incentivizing multi-agent participation in carbon trading. However, as the market continues to evolve and mature, privacy-preserving and secure information exchange will emerge as critical issues requiring urgent attention. The study by Morteza and Chou provides foundational insights into the privacy–efficiency trade-off in multi-agent systems [67], with methodological implications for fostering trusted collaboration between governments and enterprises in emission data sharing and related domains.
Evolutionary games are uniquely suited for analyzing long-term strategy interactions and policy intervention effects compared to AI methods, which are better at performing short-term data processing. To validate the robustness of our methodology and findings, we conducted comparative analyses with prior research. As shown in Li’s study [42], although different subjects are affected by carbon trading prices to different degrees, carbon trading market fluctuations are all important factors in enhancing the effectiveness of emission reduction. Furthermore, the parameter values used in the above sensitivity analysis were derived through a comprehensive methodology that combines real data with theoretical analysis. The data sources comprise both actual data from domestic carbon trading platforms and empirically verified data from typical cases in the literature. Compared to conventional approaches relying solely on stability analysis for parameter assignment, the advantage of this method is that it can effectively avoid the model’s deviation from the real problem caused by the oversimplification of theoretical assumptions so as to improve the reliability of the analysis results. Nevertheless, there are still some limitations in the current data, primarily characterized by predominant macro-level coverage with insufficient micro-level empirical substantiation. Future studies could further expand data sources to include more diverse market data to enhance both the applicability of the parameter and the generalizability of analytical conclusions.

6. Conclusions and Recommendations

This study innovatively constructs an evolutionary game model from the perspective of carbon trading; focuses on the dual forces of market-driven incentives and regulation; deeply analyzes the dynamic strategy choices and game results of the government, developers, and construction enterprises; and explores the impacts of government subsidies, penalty mechanisms, extra benefits, and carbon-trading-related factors on the evolutionary stabilization strategies, which contribute to carbon emission reduction in urban renewal. The conclusions are as follows:
(1)
Carbon emission reduction in urban renewal will follow the evolutionary law of the initial, growth, and mature stages, and emission reduction decisions will be made sequentially according to the order of the government, developers, and construction enterprises, which is consistent with the actual situation. Ideally, the government will actively supervise, while developers and construction enterprises will adopt active emission reduction strategies and selectively participate in carbon trading according to the amount of emission reduction required.
(2)
Government regulation always plays an important role. Subsidy policies and penalty mechanisms are key factors influencing decisions on carbon emission reduction in urban renewal, with the optimal subsidy rate that the government should not exceed being in the range of 20% to 30%.
(3)
Economic benefits are the core motivation for developers and construction enterprises to participate in carbon reduction, and continuous improvement in the carbon trading market provides a new revenue path, whose main influence mechanism is determined by the carbon market transaction participation cost and carbon market price together.
Based on these findings, the following recommendations are made for governments, developers, and construction enterprises:
(1)
For governments, a dual regulatory mechanism of differentiated subsidies and stepped penalties should be established. According to the different degrees of negative emission reduction for developers and construction enterprises to set the proportion of subsidies, when the more negative party moderately increases the subsidy, the maximum subsidy ratio is no more than 30%. Regarding the emission reduction potential, there is a large difference in the emissions of the project, and the situation may need to be rectified within a specified period of time and according to the degree of its bad graded penalties. Punishment for certain factors may be needed to eliminate developers’ and construction industry enterprises’ fluky psychology, prompting them to actively take emission reduction initiatives to achieve technological transformation.
(2)
Developers and construction enterprises should actively respond to government incentives and seek additional benefits. Developers should prioritize investing in the research and development of technologies, such as assembled buildings and photovoltaic integration, and apply them to renovation projects with carbon reduction potential. Construction enterprises should actively innovate low-carbon construction technologies and establish real-time monitoring systems for carbon emissions to keep track of project emission reductions. Both parties should jointly sign an agreement on emission reductions to form a cooperation model of risk-sharing and benefit-sharing.
(3)
Carbon trading will gradually give full play to the decisive role of the market mechanism in resource allocation, improve the carbon trading rules for urban renewal projects, dynamically regulate market costs and prices, create a demonstration effect, attract more market players to participate in carbon trading, and promote the smooth operation of the market.
This study innovatively combines urban renewal with carbon trading, adopting a macro-market perspective to provide useful insights for Chinese urban renewal market players. Compared with existing studies, it shifts the research focus on carbon emission reduction to the field of urban renewal, which is being actively promoted by the state but is ignored by current studies. This study takes urban renewal stakeholders as the game subjects to study carbon emission reduction behaviors in the field of urban renewal, which fills the research gap in the specific field of urban renewal and enriches the application of evolutionary game theory in the field of carbon emission reduction. In addition, the simulation parameter values in this study were determined by adopting a comprehensive assignment method that combines real data and theory, which makes up for the limitation of previous studies that rely only on the results of stability analyses and deviate from reality.
Although this study has made some progress in exploring carbon emission reduction in urban regeneration, several limitations remain. First, this study only considers the government, developers, and construction enterprises as the main subjects of the game. Future research could expand the scope of analysis by including additional participants, such as residents, communities, and investors. Second, the simulation parameter values in this study were determined by adopting a comprehensive assignment method that combines reality and theory, and subsequent research can further validate this method to improve its authenticity and accuracy. Third, future studies should continue to explore emission reduction in urban renewal, which will further promote sustainable urban development and contribute to achieving the dual-carbon goal.

Author Contributions

Conceptualization, H.Z.; methodology, H.Z. and Y.L.; validation, Y.L. and H.Z.; formal analysis, Y.L.; investigation, Y.L.; writing—original draft preparation, Y.L.; writing—review and editing, C.S., H.Z., Y.L. and T.W.; visualization, Y.L.; supervision, H.Z.; project administration, C.S. and H.Z. All authors have read and agreed to the published version of the manuscript.

Funding

This research was funded by the National Natural Science Foundation of China (grant number: 52378052), the China Scholarship Council (grant number: 202308420087), the 2024 Guangdong Philosophy and Social Science Foundation Regular Project (grant number: GD24CYS15), the Innovation Demonstration Base of Ecological Environment Geotechnical and Ecological Restoration of Rivers and Lakes (2020EJB004), Hubei University of Technology Green Industry Science and Technology Leading Program (grant number: XJ2021005501), and Research Start-up Funds for Newly Introduced Highly Accurate and Shortage Talents of Shenzhen University.

Institutional Review Board Statement

Not applicable.

Informed Consent Statement

Not applicable.

Data Availability Statement

The original contributions presented in this study are included in the article; further inquiries can be directed to the corresponding author.

Conflicts of Interest

The authors declare no conflicts of interest.

References

  1. Li, M.; Feng, C. Implementation path of dual-carbon in Xiguan historical and cultural district of Guangzhou: A case study on Changhua street. Heliyon 2023, 9, e19552. [Google Scholar] [CrossRef] [PubMed]
  2. Hao, J.L.; Ma, W. Evaluating carbon emissions of construction and demolition waste in building energy retrofit projects. Energy 2023, 281, 128201. [Google Scholar] [CrossRef]
  3. Liu, J.; Huang, Z.; Wang, X. Economic and environmental assessment of carbon emissions from demolition waste based on LCA and LCC. Sustainability 2020, 12, 6683. [Google Scholar] [CrossRef]
  4. Feng, T.; Gong, X.; Yang, Y. Carbon Emission Trading Market in China: Operation Mechanism and Development Path. Ekoloji Derg. 2019, 107, 3417–3427. [Google Scholar]
  5. Zhou, J.; Gu, Y.; Xiao, S. Establishing the High-quality Urban Renewal System Towards the Vision of “Carbon Peak and Carbon Neutrality”: Changde, Hunan Province. Planners 2022, 38, 96–101. [Google Scholar]
  6. Zheng, L.; Zheng, Y.; Fu, Z. The Impact of Urban Renewal on Spatial–Temporal Changes in the Human Settlement Environment in the Yangtze River Delta, China. Land 2024, 13, 841. [Google Scholar] [CrossRef]
  7. Huang, Z.; Zhou, H.; Miao, Z. Life-cycle carbon emissions (LCCE) of buildings: Implications, calculations, and reductions. Engineering 2024, 35, 115–139. [Google Scholar] [CrossRef]
  8. Cao, K.; Deng, Y. Spatio-temporal evolution path and driving mechanisms of sustainable urban renewal: Progress and perspective. Prog. Geogr. 2021, 40, 1942–1955. [Google Scholar] [CrossRef]
  9. Liu, Y.; Sang, M.; Xu, X. How can urban regeneration reduce carbon emissions? A bibliometric review. Land 2023, 12, 1328. [Google Scholar] [CrossRef]
  10. Cheng, J.; Mao, C.; Huang, Z. Implementation strategies for sustainable renewal at the neighborhood level with the goal of reducing carbon emission. Sustain. Cities Soc. 2022, 85, 104047. [Google Scholar] [CrossRef]
  11. Zhang, L.; Cai, Y.; Song, S. An Urban Renewal Design Method Based on Carbon Emissions and Carbon Sink Calculations: A Case Study on an Environmental Improvement Project in the Suzhou Industrial Investment Science and Technology Park. Buildings 2024, 14, 2962. [Google Scholar] [CrossRef]
  12. Rădulescu, C.M.; Ştefan, O.; Rădulescu, G.M. Management of stakeholders in urban regeneration projects. Case study: Baia-Mare, Transylvania. Sustainability 2016, 8, 238. [Google Scholar] [CrossRef]
  13. Yao, Q.; Shao, L. Research on emission reduction strategies of building materials manufacturers and real estate developers in the context of carbon trading. Front. Environ. Sci. 2022, 10, 848260. [Google Scholar] [CrossRef]
  14. Li, H.; Liu, D.; Han, Z.J.; Sun, Y.P. Simulation analysis of the three-party evolutionary game of green building market players under carbon trading policy. Environ. Sci. Pollut. Res. 2023, 30, 117591–117608. [Google Scholar] [CrossRef]
  15. Liu, M.; Zhang, S. Research on Environmental Protection Strategy of Urban Construction Subject Based on Evolutionary Game. Sustainability 2022, 14, 1034. [Google Scholar] [CrossRef]
  16. Wei, J.; Li, Y.; Liu, Y. Tripartite evolutionary game analysis of carbon emission reduction behavior strategies under government regulation. Environ. Dev. Sustain. 2024. [Google Scholar] [CrossRef]
  17. Xia, X.; Zeng, X.; Wang, W. Carbon constraints and carbon emission reduction: An evolutionary game model within the energy-intensive sector. Expert Syst. Appl. 2024, 244, 122916. [Google Scholar] [CrossRef]
  18. Wang, W.; Hao, S.; Zhong, H.; Sun, Z. How to promote carbon emission reduction in buildings? Evolutionary analysis of government regulation and financial investment. J. Build. Eng. 2024, 89, 109279. [Google Scholar] [CrossRef]
  19. Li, F.; Guo, Y.; Dong, T.; Liu, B. Tripartite evolutionary game analysis on corporate carbon reduction decisions considering dual supervision under carbon trading. Comput. Ind. Eng. 2024, 187, 109786. [Google Scholar] [CrossRef]
  20. Wang, J.; Yang, Y.; Huang, H.; Wang, F. Stakeholder management in government-led urban regeneration: A case study of the eastern suburbs in Chengdu, China. Sustainability 2022, 14, 4357. [Google Scholar] [CrossRef]
  21. Hörisch, J.; Schaltegger, S.; Freeman, R.E. Integrating stakeholder theory and sustainability accounting: A conceptual synthesis. J. Clean. Prod. 2020, 275, 124097. [Google Scholar] [CrossRef]
  22. Xiahou, X.; Li, Z.; Zuo, J.; Wang, Z.; Li, K.; Li, Q. Critical success factors for the implementation of urban regeneration REITs in China: A TISM–MICMAC based approach. Eng. Constr. Archit. Manag. 2024, 31, 363–385. [Google Scholar] [CrossRef]
  23. Qian, Y.; Ren, H.; Tang, J. A Framework for Assessing the Sustainability of Industrial Sites Protection and Reuse Under Stakeholders Analysis. Urban Stud. 2019, 26, 72–81. [Google Scholar]
  24. Qin, B.; Miao, F. Evolutional Development of Public Participation in Urban Renewal: A Review of Yantian Case in Shenzhen. Urban Stud. 2015, 6, 58–62+79. [Google Scholar] [CrossRef]
  25. Li, J. Urban regeneration promotes high quality development of construction companies. Constr. Enterp. Manag. 2024, 35–36. (In Chinese) [Google Scholar] [CrossRef]
  26. Wang, Y.; Li, J.; Zhang, G.; Li, Y.; Asare, M.H. Fuzzy evaluation of comprehensive benefit in urban renewal based on the perspective of core stakeholders. Habitat Int. 2017, 66, 163–170. [Google Scholar] [CrossRef]
  27. Li, Y.; Tao, Y.; Qian, Q.K.; Mlecnik, E.; Visscher, H.J. Critical factors for effective resident participation in neighborhood rehabilitation in Wuhan, China: From the perspectives of diverse stakeholders. Landsc. Urban Plan. 2024, 244, 105000. [Google Scholar] [CrossRef]
  28. Zhu, Y.; Song, J.; Bai, Y. China’s Urban Regeneration Evolution from 1949 to 2022: From the Perspective of Governance Mode. Land 2024, 13, 1806. [Google Scholar] [CrossRef]
  29. Wang, G.; Luo, T.; Luo, H.; Luo, H.; Liu, R.; Liu, Y. A comprehensive review of building lifecycle carbon emissions and reduction approaches. City Built Environ. 2024, 2, 12. [Google Scholar] [CrossRef]
  30. Mao, T.; Liu, Y.; Liu, Y.; Hao, M.; Chen, W.Q. Towards sustainable building landscapes: A spatially explicit life-cycle analysis of carbon emissions and mitigation strategies. Landsc. Ecol. 2024, 39, 167. [Google Scholar] [CrossRef]
  31. Zheng, L.; Luo, K.; Zhao, L. An Operational Carbon Emission Prediction Model Based on Machine Learning Methods for Urban Residential Buildings in Guangzhou. Buildings 2024, 14, 3699. [Google Scholar] [CrossRef]
  32. Zhu, Z.; Cheng, L.; Shen, T. Spontaneous Formation of Evolutionary Game Strategies for Long-Term Carbon Emission Reduction Based on Low-Carbon Trading Mechanism. Mathematics 2024, 12, 3109. [Google Scholar] [CrossRef]
  33. Biancalani, F.; Gnecco, G.; Metulini, R. The impact of the European Union emissions trading system on carbon dioxide emissions: A matrix completion analysis. Sci. Rep. 2024, 14, 19676. [Google Scholar] [CrossRef]
  34. Dechezleprêtre, A.; Nachtigall, D.; Venmans, F. The joint impact of the European Union emissions trading system on carbon emissions and economic performance. J. Environ. Econ. Manag. 2023, 118, 102758. [Google Scholar] [CrossRef]
  35. Mirzaee, G.M.; Jafari, M.A. The efficiency of CO2 market in the phase III EU ETS: Analyzing in the context of a dynamic approach. Environ. Sci. Pollut. Res. 2021, 28, 61080–61095. [Google Scholar] [CrossRef]
  36. Wang, H.; Tan, Z.; Zhang, A.; Pu, L.; Zhang, J.; Zhang, Z. Carbon market price prediction based on sequence decomposition-reconstruction-dimensionality reduction and improved deep learning model. J. Clean. Prod. 2023, 425, 139063. [Google Scholar] [CrossRef]
  37. Xuan, D.; Ma, X.; Shang, Y. Can China’s policy of carbon emission trading promote carbon emission reduction? J. Clean. Prod. 2020, 270, 122383. [Google Scholar] [CrossRef]
  38. Zhang, Y.; Li, S.; Luo, T.; Gao, J. The effect of emission trading policy on carbon emission reduction: Evidence from an integrated study of pilot regions in China. J. Clean. Prod. 2020, 265, 121843. [Google Scholar] [CrossRef]
  39. Lai, J.; Chen, Y. Innovation spillover effect of the pilot carbon emission trading policy in China. Heliyon 2023, 9, e20062. [Google Scholar] [CrossRef]
  40. Li, L.; Dong, J.; Song, Y. Impact and acting path of carbon emission trading on carbon emission intensity of construction land: Evidence from pilot areas in China. Sustainability 2020, 12, 7843. [Google Scholar] [CrossRef]
  41. Li, J.; Gao, L.; Tu, J. Evolutionary Game Analysis of Governments’ and Enterprises’ Carbon-Emission Reduction. Sustainability 2024, 16, 4216. [Google Scholar] [CrossRef]
  42. Li, S.; Dong, C.; Yang, L.; Gao, X.; Wei, W.; Zhao, M.; Xia, W. Research on evolutionary game strategy selection and simulation research of carbon emission reduction of government and enterprises under the “dual carbon” goal. Sustainability 2020, 14, 12647. [Google Scholar] [CrossRef]
  43. Lyu, B.; Ni, W.; Ostic, D. Can carbon trading policy promote China’s decoupling of carbon emission from the perspective of technology-driven innovation? Front. Environ. Sci. 2022, 10, 893947. [Google Scholar] [CrossRef]
  44. Li, Y.P.; Huang, G.H.; Li, M.W. An integrated optimization modeling approach for planning emission trading and clean-energy development under uncertainty. Renew. Energy 2014, 62, 31–46. [Google Scholar] [CrossRef]
  45. Cheng, X.; Yu, Z.; Gao, J.; Liu, Y.; Jiang, S. Governance effects of pollution reduction and carbon mitigation of carbon emission trading policy in China. Environ. Res. 2024, 252, 119074. [Google Scholar] [CrossRef]
  46. Tian, J.; Liu, Y.; Li, A. The Policy Impact of Carbon Emission Trading on Building Enterprises’ Total Factor Productivity in China. Buildings 2023, 13, 1493. [Google Scholar] [CrossRef]
  47. Yang, X.; He, G.; Wu, C.; Wang, X. Carbon emission reduction between government and heavily polluting enterprises under carbon trading mechanism based on evolutionary game analysis. J. Saf. Environ. 2023, 23, 4097–4107. (In Chinese) [Google Scholar] [CrossRef]
  48. Meng, L.; Liu, K.; He, J.; Han, C.; Liu, P. Carbon emission reduction behavior strategies in the shipping industry under government regulation: A tripartite evolutionary game analysis. J. Clean. Prod. 2022, 378, 134556. [Google Scholar] [CrossRef]
  49. Yu, N.; Chen, J.; Cheng, L. Evolutionary game analysis of carbon emission reduction between government and enterprises under carbon quota trading policy. Int. J. Environ. Res. Public Health 2022, 19, 8565. [Google Scholar] [CrossRef]
  50. Chu, X.; Shi, Z.; Yang, L.; Guo, S. Evolutionary game analysis on improving collaboration in sustainable urban regeneration: A multiple-stakeholder perspective. J. Urban Plan. Dev. 2020, 146, 04020046. [Google Scholar] [CrossRef]
  51. Chen, F.; Chen, Y. Urban metabolism and spontaneous architectural growth: A sustainable strategy featuring participatory co-construction by multiple stakeholders. Buildings 2022, 12, 352. [Google Scholar] [CrossRef]
  52. Prentiss, A.M.; Foor, T.A.; Hampton, A. Testing the malthusian model: Population and storage at Housepit 54, Bridge River, British Columbia. J. Archaeol. Sci. Rep. 2018, 18, 535–550. [Google Scholar] [CrossRef]
  53. Ran, W.; He, D.; Li, Z.; Xue, Y.; He, Z. Research on distribution strategy of logistics enterprise alliance based on three-party evolution game. Sci. Rep. 2024, 14, 14894. [Google Scholar] [CrossRef] [PubMed]
  54. Lu, W.; Du, L.; Tam, V.W.; Yang, Z.; Lin, C.; Peng, C. Evolutionary game strategy of stakeholders under the sustainable and innovative business model: A case study of green building. J. Clean. Prod. 2020, 333, 130136. [Google Scholar] [CrossRef]
  55. Li, Y.; Gou, L.; Zhang, H.; Guo, J.; Wang, M. Research on the Connection Market Trading Issues of Green Certificates and CCER Based on Contribution Degree and Social Welfare. Sustainability 2024, 16, 10572. [Google Scholar] [CrossRef]
  56. Zhang, S.; Feng, C. Evolutionary game model for decarbonization of shipping under green shipping corridor. Int. J. Low-Carbon Technol. 2024, 19, 2502–2511. [Google Scholar] [CrossRef]
  57. Liang, P.; Lv, Y.; Zhao, Y. Incentive-compatible mechanism for manufacturing carbon emission supervision under carbon control policies in China. PLoS ONE 2024, 19, e0299086. [Google Scholar] [CrossRef]
  58. Dwaikat, L.N.; Ali, K.N. Green buildings cost premium: A review of empirical evidence. Energy Build. 2016, 110, 396–403. [Google Scholar] [CrossRef]
  59. Gu, Q.; Hang, L.; Jiang, Y. Compound carbon policy for promoting low-carbon technology innovation in enterprises considering government supervision. Environ. Dev. Sustain. 2024. [Google Scholar] [CrossRef]
  60. Zhang, Y.; Zhang, T. Optimal decisions and coordination of low-carbon supply chain under cap-and-trade regulation and government subsidy. J. Technol. Econ. 2024, 43, 159–176. [Google Scholar]
  61. Liu, D.; Feng, M.; Liu, Y.; Wang, L.; Hu, J.; Wang, G.; Zhang, J. A tripartite evolutionary game study of low-carbon innovation system from the perspective of dynamic subsidies and taxes. J. Environ. Manag. 2024, 356, 120651. [Google Scholar] [CrossRef] [PubMed]
  62. He, Q.; Wu, J.; Wu, Z.; Zhang, J.; Chen, X. Evolutionary game analysis of prefabricated buildings adoption under carbon emission trading scheme. Build. Environ. 2024, 249, 111121. [Google Scholar] [CrossRef]
  63. Zhang, Z.H.; Ling, D.; Yang, Q.X.; Feng, Y.C.; Xiu, J. Central environmental protection inspection and carbon emission reduction: A tripartite evolutionary game model from the perspective of carbon neutrality. Pet. Sci. 2024, 21, 2139–2153. [Google Scholar] [CrossRef]
  64. Zhang, Y.; Zeng, C. Research on Building Carbon Emission Reduction under Differential Game. Oper. Res. Fuzziology 2024, 14, 1353–1366. [Google Scholar] [CrossRef]
  65. Wang, J.; Xie, Q.; Shi, D. Research on the Impact of Green Technology Innovation on Energy Efficiency. Financ. Trade Econ. 2024, 45, 143–159. (In Chinese) [Google Scholar] [CrossRef]
  66. Luo, W.; Zhang, Y.; Gao, Y.; Liu, Y.; Shi, C.; Wang, Y. Life cycle carbon cost of buildings under carbon trading and carbon tax system in China. Sustain. Cities Soc. 2021, 66, 102509. [Google Scholar] [CrossRef]
  67. Morteza, A.; Chou, R.A. Distributed Matrix Multiplication: Download Rate, Randomness and Privacy Trade-Offs. In Proceedings of the 2024 60th Annual Allerton Conference on Communication, Control, and Computing, Urbana, IL, USA, 24–27 September 2024. [Google Scholar] [CrossRef]
Figure 1. Logical relationship.
Sustainability 17 05089 g001
Figure 2. Phase diagram of replication dynamics for governments. (a) the phase diagram of governments when y = y*; (b) the phase diagram of governments when y < y*; (c) the phase diagram of governments when y > y*.
Sustainability 17 05089 g002
Figure 3. Phase diagram of replication dynamics for developers. (a) the phase diagram of developers when z = z*; (b) the phase diagram of developers when z < z*; (c) the phase diagram of developers when z > z*.
Sustainability 17 05089 g003
Figure 4. Phase diagram of replication dynamics for construction enterprises. (a) the phase diagram of construction enterprises when x = x*; (b) the phase diagram of construction enterprises when x < x*; (c) the phase diagram of construction enterprises when x > x*.
Sustainability 17 05089 g004
Figure 5. The evolutionary process in the initial stage.
Sustainability 17 05089 g005
Figure 6. The evolutionary process in the growth stage.
Sustainability 17 05089 g006
Figure 7. The evolutionary process in the mature stage.
Sustainability 17 05089 g007
Figure 8. Sensitivity of S1 and S2 to evolutionary process of tripartite strategy. (a) sensitivity of S1 to evolutionary process of tripartite strategy; (b) sensitivity of S2 to evolutionary process of tripartite strategy.
Sustainability 17 05089 g008
Figure 9. Sensitivity of S1 to governments’ and developers’ behaviors. (a) sensitivity of S1 to governments’ behaviors; (b) sensitivity of S1 to developers’ behaviors.
Sustainability 17 05089 g009
Figure 10. Sensitivity of S2 to governments’ and construction enterprises’ behaviors. (a) sensitivity of S2 to governments’ behaviors; (b) sensitivity of S2 to construction enterprises’ behaviors.
Sustainability 17 05089 g010
Figure 11. Sensitivity of F1 and F2 to evolutionary process of tripartite strategy. (a) sensitivity of F1 to evolutionary process of tripartite strategy; (b) sensitivity of F2 to evolutionary process of tripartite strategy.
Sustainability 17 05089 g011
Figure 12. Sensitivity of F1 to governments’ and developers’ behaviors. (a) sensitivity of F1 to governments’ behaviors; (b) sensitivity of F1 to developers’ behaviors.
Sustainability 17 05089 g012
Figure 13. Sensitivity of F2 to governments’ and construction enterprises’ behaviors. (a) sensitivity of F2 to governments’ behaviors; (b) sensitivity of F2 to construction enterprises’ behaviors.
Sustainability 17 05089 g013
Figure 14. Sensitivity of R7 and R8 to evolutionary process of tripartite strategy. (a) sensitivity of R7 to evolutionary process of tripartite strategy; (b) sensitivity of R8 to evolutionary process of tripartite strategy.
Sustainability 17 05089 g014
Figure 15. Sensitivity of R7 and R8 to developers’ and construction enterprises’ behaviors. (a) sensitivity of R7 to developers’ behaviors; (b) sensitivity of R8 to construction enterprises’ behaviors.
Sustainability 17 05089 g015
Figure 16. Sensitivity of P and C4 to evolutionary process of tripartite strategy. (a) sensitivity of P to evolutionary process of tripartite strategy; (b) sensitivity of C4 to evolutionary process of tripartite strategy.
Sustainability 17 05089 g016
Figure 17. Sensitivity of P to developers’ and construction enterprises’ behaviors. (a) sensitivity of P to developers’ behaviors; (b) sensitivity of P to construction enterprises’ behaviors.
Sustainability 17 05089 g017
Figure 18. Sensitivity of C4 to developers’ and construction enterprises’ behaviors. (a) sensitivity of C4 to developers’ behaviors; (b) sensitivity of C4 to construction enterprises’ behaviors.
Sustainability 17 05089 g018
Table 1. Parameter descriptions.
ParameterDefinitionValues
C1Additional regulatory costs to governments in adopting ‘proactive regulation’above zero
C2Additional costs to developers adopting ‘proactive CER’ measuresabove zero
C3Additional green transition costs for construction enterprises adopting ‘proactive transition’above zero
C4Costs to developers and construction enterprises accessing carbon marketabove zero
R1, R2Corresponding revenues when government adopts ‘proactive regulation’ and ‘passive regulation’ strategy, respectivelyabove zero
R3, R4Benefits when developers adopt ‘proactive CER’ and ‘passive CER’ strategiesabove zero
R5, R6Benefits of adopting ‘proactive transition’ and ‘passive transition’ strategies in construction enterprisesabove zero
R7, R8Potential benefits that may exist for developers and construction enterprisesabove zero
R9Additional benefits to government when developers and construction enterprises take initiative to participate in carbon tradingabove zero
S1, S2Subsidies for developers and construction enterprises that choose proactive strategy when government adopts ‘proactive regulation’above zero
S3Government incentives for developers and construction enterprises to participate in carbon tradingabove zero
F1, F2Penalties for developers and construction enterprises that choose negative strategy when government adopts ‘proactive regulation’above zero
L1, L2Losses incurred by government due to environmental pollution caused by inaction of developers and construction enterprisesabove zero
E1, E2Carbon emissions with and without emission reductions in urban renewal projectsabove zero
PCarbon trading priceabove zero
αCoefficient of proportional sharing of green transition costs between developers and construction enterprises0 < α ≤ 1
β, γProportion of benefit reductions due to negative tactics of one party0 < β ≤ 1
0 < γ ≤ 1
ηCost-sharing coefficients for developers and construction enterprises to access carbon markets0 < η ≤ 1
τProportionate share factor of benefits from carbon trading for developers and construction enterprises0 < τ ≤ 1
Table 2. The tripartite payoff matrix.
Governments (I)Developers
(II)
Construction Enterprises (III)
Proactive Transition (z)Passive Transition (1 − z)
Proactive regulation
(x)
Proactive
CER
(y)
I: R1C1S1S2S3 + R9
II: R3C2 + S1αC3 + R7η(C4S3) + τP(E2E1)
III: R5 − (1 − α)C3 − (1 − η)(C4S3) + (1 − τ)P(E2E1) + S2 + R8
I: R1C1 + F2L2S1
II: R3C2 + S1 + βR7
III: R6F2
Passive
CER
(1 − y)
I: R1C1 + F1L1S2
II: R4F1
III: R5C3 + S2 + γR8
I: R1C1 + F1 + F2L1L2
II: R4F1
III: R6F2
Passive regulation
(1 − x)
Proactive
CER
(y)
I: R2
II: R3C2αC3 + R7ηC4 + τP(E2E1)
III: R5 − (1 − α)C3 + R8 − (1 − η)C4 + (1 − τ)P(E2E1)
I: R2L2
II: R3C2 + βR7
III: R6
Passive
CER
(1 − y)
I: R1L1
II: R4
III: R5C3 + γR8
I: R2L1L2
II: R4
III: R6
Table 3. Eigenvalues of each equilibrium point.
Equilibrium PointsEigenvalues
λ 1 λ 2 λ 3
E1(0,0,0)R1C1R2 + F1 + F2R3C2R4 + βR7R5C3R6 + γR8
E2(0,0,1)R1C1R2S2 + F1R3C2R4αC3 + R7ηC4 + τP(E2E1)−R5 + C3 + R6γR8
E3(0,1,0)R1C1R2S1 + F2−R3 + C2 + R4βR7R5 + R8R6 − (1 − α)C3 − (1 − η)C4 + (1 − τ)P(E2E1)
E4(0,1,1)R1C1R2S3 + R9S1S2−R3 + C2 + R4 + αC3 + ηC4τP(E2E1)−R5R8 + R6 + (1 − α)C3 + (1 − η)C4 − (1 − τ)P(E2E1)
E5(1,0,0)−R1 + C1 + R2F1F2R3C2R4 + S1 + βR7 + F1R5C3R6 + S2 + γR8 + F2
E6(1,0,1)−R1 + C1 + R2F1 + S2R3C2R4 + S1αC3 + R7 + ηS3ηC4 + τP(E2E1) + F1−R5 + C3 + R6S2γR8F2
E7(1,1,0)−R1 + C1 + R2F2 + S1−R3 + C2 + R4S1βR7F1R5 + R8R6 + S2 + F2 + (1 − η)S3 − (1 − η)C4 + (1 − τ)P(E2E1) − (1 − α)C3
E8(1,1,1)−R1 + C1 + R2 + S3R9 + S1 + S2−R3 + C2 + R4S1 + αC3R7ηS3 + ηC4τP(E2E1) − F1−R5R8 + R6S2F2 − (1 − η)S3 + (1 − η)C4 − (1 − τ)P(E2E1) + (1 − α)C3
Table 4. Parameter values for each stage in tripartite game model.
StageInitial StageGrowth StageMature Stage
Parameters
C1405060
C2605040
C3726252
C4300030003000
R15090130
R2623212
R370130160
R4967550
R575100125
R6826242
R74075110
R84075110
R91927561152
S1242016
S228.824.820.8
S3300300300
F1244048
F228.849.662.4
E1955515
E21079787
P8090100
α0.50.50.5
β0.50.50.5
γ 0.50.50.5
η 0.50.50.5
τ 0.50.80.5
Disclaimer/Publisher’s Note: The statements, opinions and data contained in all publications are solely those of the individual author(s) and contributor(s) and not of MDPI and/or the editor(s). MDPI and/or the editor(s) disclaim responsibility for any injury to people or property resulting from any ideas, methods, instructions or products referred to in the content.

