Article

Research on the Optimization of Key Parameters for Heterotrophic Bacteria Assimilation Nitrogen Removal Technology in Aquaculture Tailwater

1
School of Marine Science and Engineering, Qingdao Agricultural University, Qingdao 266109, China
2
Laboratory for Marine Biology and Biotechnology, Qingdao Marine Science and Technology Center, Qingdao 266237, China
3
CAS and Shandong Province Key Laboratory of Experimental Marine Biology, Institute of Oceanology, Chinese Academy of Sciences, Qingdao 266000, China
4
State Key Laboratory of Breeding Biotechnology and Sustainable Aquaculture, Institute of Oceanology, Chinese Academy of Sciences, Qingdao 266000, China
*
Author to whom correspondence should be addressed.
Sustainability 2025, 17(11), 5069; https://doi.org/10.3390/su17115069
Submission received: 28 April 2025 / Revised: 18 May 2025 / Accepted: 21 May 2025 / Published: 1 June 2025

Abstract

:
With the rapid development of the global aquaculture industry, the issue of effluent pollution from aquaculture has become increasingly severe. Effective management of aquaculture effluent is an urgent requirement for the sustainable development of the aquaculture industry, with a key focus on the efficient removal of nitrogen. Heterotrophic bacteria assimilation technology offers advantages such as high efficiency and resource recovery; however, its application in effluent treatment remains limited. Therefore, this study aimed to identify the optimal carbon source for the heterotrophic bacteria assimilation process and to optimize its operating parameters using response surface methodology (RSM). The results revealed that the sucrose group achieved the highest total ammonia nitrogen (TAN) removal rate of 85.1%, significantly outperforming molasses (77.0%) and glucose (62.9%), with microbial biomass also significantly higher than in the other groups. Metagenomic analysis indicated that sucrose promotes the formation of efficient denitrifying microbial communities by enriching the phylum Bacteroidota and the denitrifying functional bacteria Xanthomarina, thereby significantly enhancing denitrification efficiency. The optimal carbon source was determined to be sucrose. Using the optimal parameters of microbial biomass at 1.7 g/L, a hydraulic retention time of 36 h, and a chemical oxygen demand-to-total nitrogen (COD/TN) ratio of 26, the removal rates of total nitrogen (TN), TAN, and nitrite nitrogen (NO2-N) exceeded 85%, while the removal rate of nitrate nitrogen (NO3-N) surpassed 60%. A significant interaction was observed between microbial biomass and hydraulic retention time, which notably affected denitrification efficiency (p < 0.05). This study provides theoretical support for the harmless and resourceful treatment of aquaculture effluent, contributing to the green and sustainable development of the aquaculture industry.

1. Introduction

In aquaculture, high-protein feeds are typically used to enhance the growth rates of the cultivated species. Research indicates that over 70% of the nitrogen in these feeds is not effectively utilized by organisms, ultimately remaining in the aquaculture water as pollutants such as leftover feed, feces, TAN, and NO2-N [1,2,3]. Organic particles like leftover feed and feces undergo mineralization and decomposition through microbial activity, converting into harmful substances such as TAN, NO2-N, and NO3-N, which pose a threat to the health of the cultivated species.
Recirculating aquaculture systems (RASs) represent a major direction for the future development of aquaculture, characterized by their green, controllable, and high-yield efficiency. RASs can effectively control the concentrations of total suspended solids (TSS), TAN, NO2-N, and other pollutants in the water using equipment such as microfiltration units, biofilters, and protein separators, achieving a water recycling rate of >95% [4]. While RASs significantly reduce the volume of effluent discharge, the continuous accumulation of pollutants such as NO3-N during water recirculation increases the difficulty of effluent treatment [5]. RASs tend to concentrate nutrients and organic matter in the effluent. Compared to traditional aquaculture methods, the high concentration of pollutants in RAS effluent makes it an ideal candidate for developing waste resource recovery technologies.
The primary strategy for the resource utilization of RAS effluent is to implement differentiated treatment. By separating solid suspended solids and some dissolved organic matter from the effluent, it is possible to create organic-rich sludge. With appropriate treatment and processing, this sludge can be transformed into high-value products, such as biofertilizers or energy raw materials [6,7]. However, the separated supernatant still contains a certain amount of dissolved organic matter and nutrients, and its direct discharge can easily lead to water eutrophication.
Heterotrophic bacteria assimilation technology is a denitrification method based on the metabolic activity of heterotrophic microorganisms. Its core principle involves the conversion of nitrogen pollutants in water (such as TAN and NO3-N) into microbial biomass components (such as proteins and nucleic acids) through the assimilation process of heterotrophic bacteria [8,9]. When TAN levels are high, heterotrophic microorganisms can directly utilize ammonia as a nitrogen source, rapidly increasing biomass by combining it with organic carbon to form microbial protein. Conversely, when TAN levels are low, these microorganisms switch to nitrate nitrogen as an alternative nitrogen source, converting it to ammonium through the action of reductase systems and subsequently transforming it into biomass components via the glutamine synthetase–glutamate synthase (GS-GOGAT) pathway [10,11].
In aquaculture tailwater treatment, heterotrophic bacteria assimilation technology has unique advantages compared with autotrophic denitrification and anaerobic ammonia oxidation technology. Heterotrophic bacterial assimilation technology can promote the rapid value-added of heterotrophic microorganisms in a short time by adding additional carbon sources, convert TAN and NO3-N into bacterial proteins, and realize the resource removal of nitrogen-containing pollutants. In contrast, autotrophic denitrification relies on S2 or H2 as an electron donor, which has the risk of toxicity and the accumulation of SO42− by-products [12,13], and the disadvantages of anaerobic ammonia oxidation include a long microbial multiplication cycle, which makes it difficult to adapt to water quality fluctuations, and the treatment process will produce the greenhouse gas N2O [14]. HAD technology provides an optimal solution for the treatment of aquaculture tailwater with high nitrogen load and variable water quality by regulating the rapid bacterial synthesis mechanism under DO and adding carbon sources and has the characteristics of denitrification effects, impact resistance, and by-product recycling.
Currently, while heterotrophic bacteria assimilation technology has been shown to effectively remove nitrogen pollutants [15], its denitrification performance during actual treatment processes is influenced by multiple factors, including the type of carbon source (such as monosaccharides, polysaccharides, or complex carbon sources), microbial biomass, hydraulic retention time (HRT), carbon-to-nitrogen ratio (C/N), and dissolved oxygen levels [16,17,18,19].
As an important factor affecting the treatment effect, the type of carbon source has been widely studied in recent years. At present, the primary source of organic carbon used in production is mainly used. There are two main types of organic carbon sources: one is carbon sources that are easily degraded, such as sucrose, glucose, and molasses [20,21,22]; these simple carbohydrates, dissolved in water, can be broken down by bacteria and quickly assimilated. Second, carbon sources that need to be degraded from large molecules to small molecules before being used by microorganisms, such as cellulose and starch grains, polyhydroxyalkanoate (PHA), polybutylene succinate (PBS), poly3-hydroxybutyrate (PHB), etc. [23,24,25]. These complex carbohydrates take a certain amount of time to be slowly degraded and utilized by bacteria, but they can provide a stable source of carbon, and the reaction time is slower and does not need to be added continuously. In order to apply heterotrophic bacterium assimilation technology in actual production processes in the future, in this study, we selected sucrose, glucose, and molasses, which are widely used and cost-effective carbon sources in production.
In this study, heterotrophic bacterial assimilation technology was used to treat the filtrate of circulating aquaculture wastewater. The key parameters of the assimilation process of heterotrophic bacteria were studied by using the response surface method (RSM) to provide theoretical support for the harmless and resource-efficient treatment of aquaculture wastewater.

2. Materials and Methods

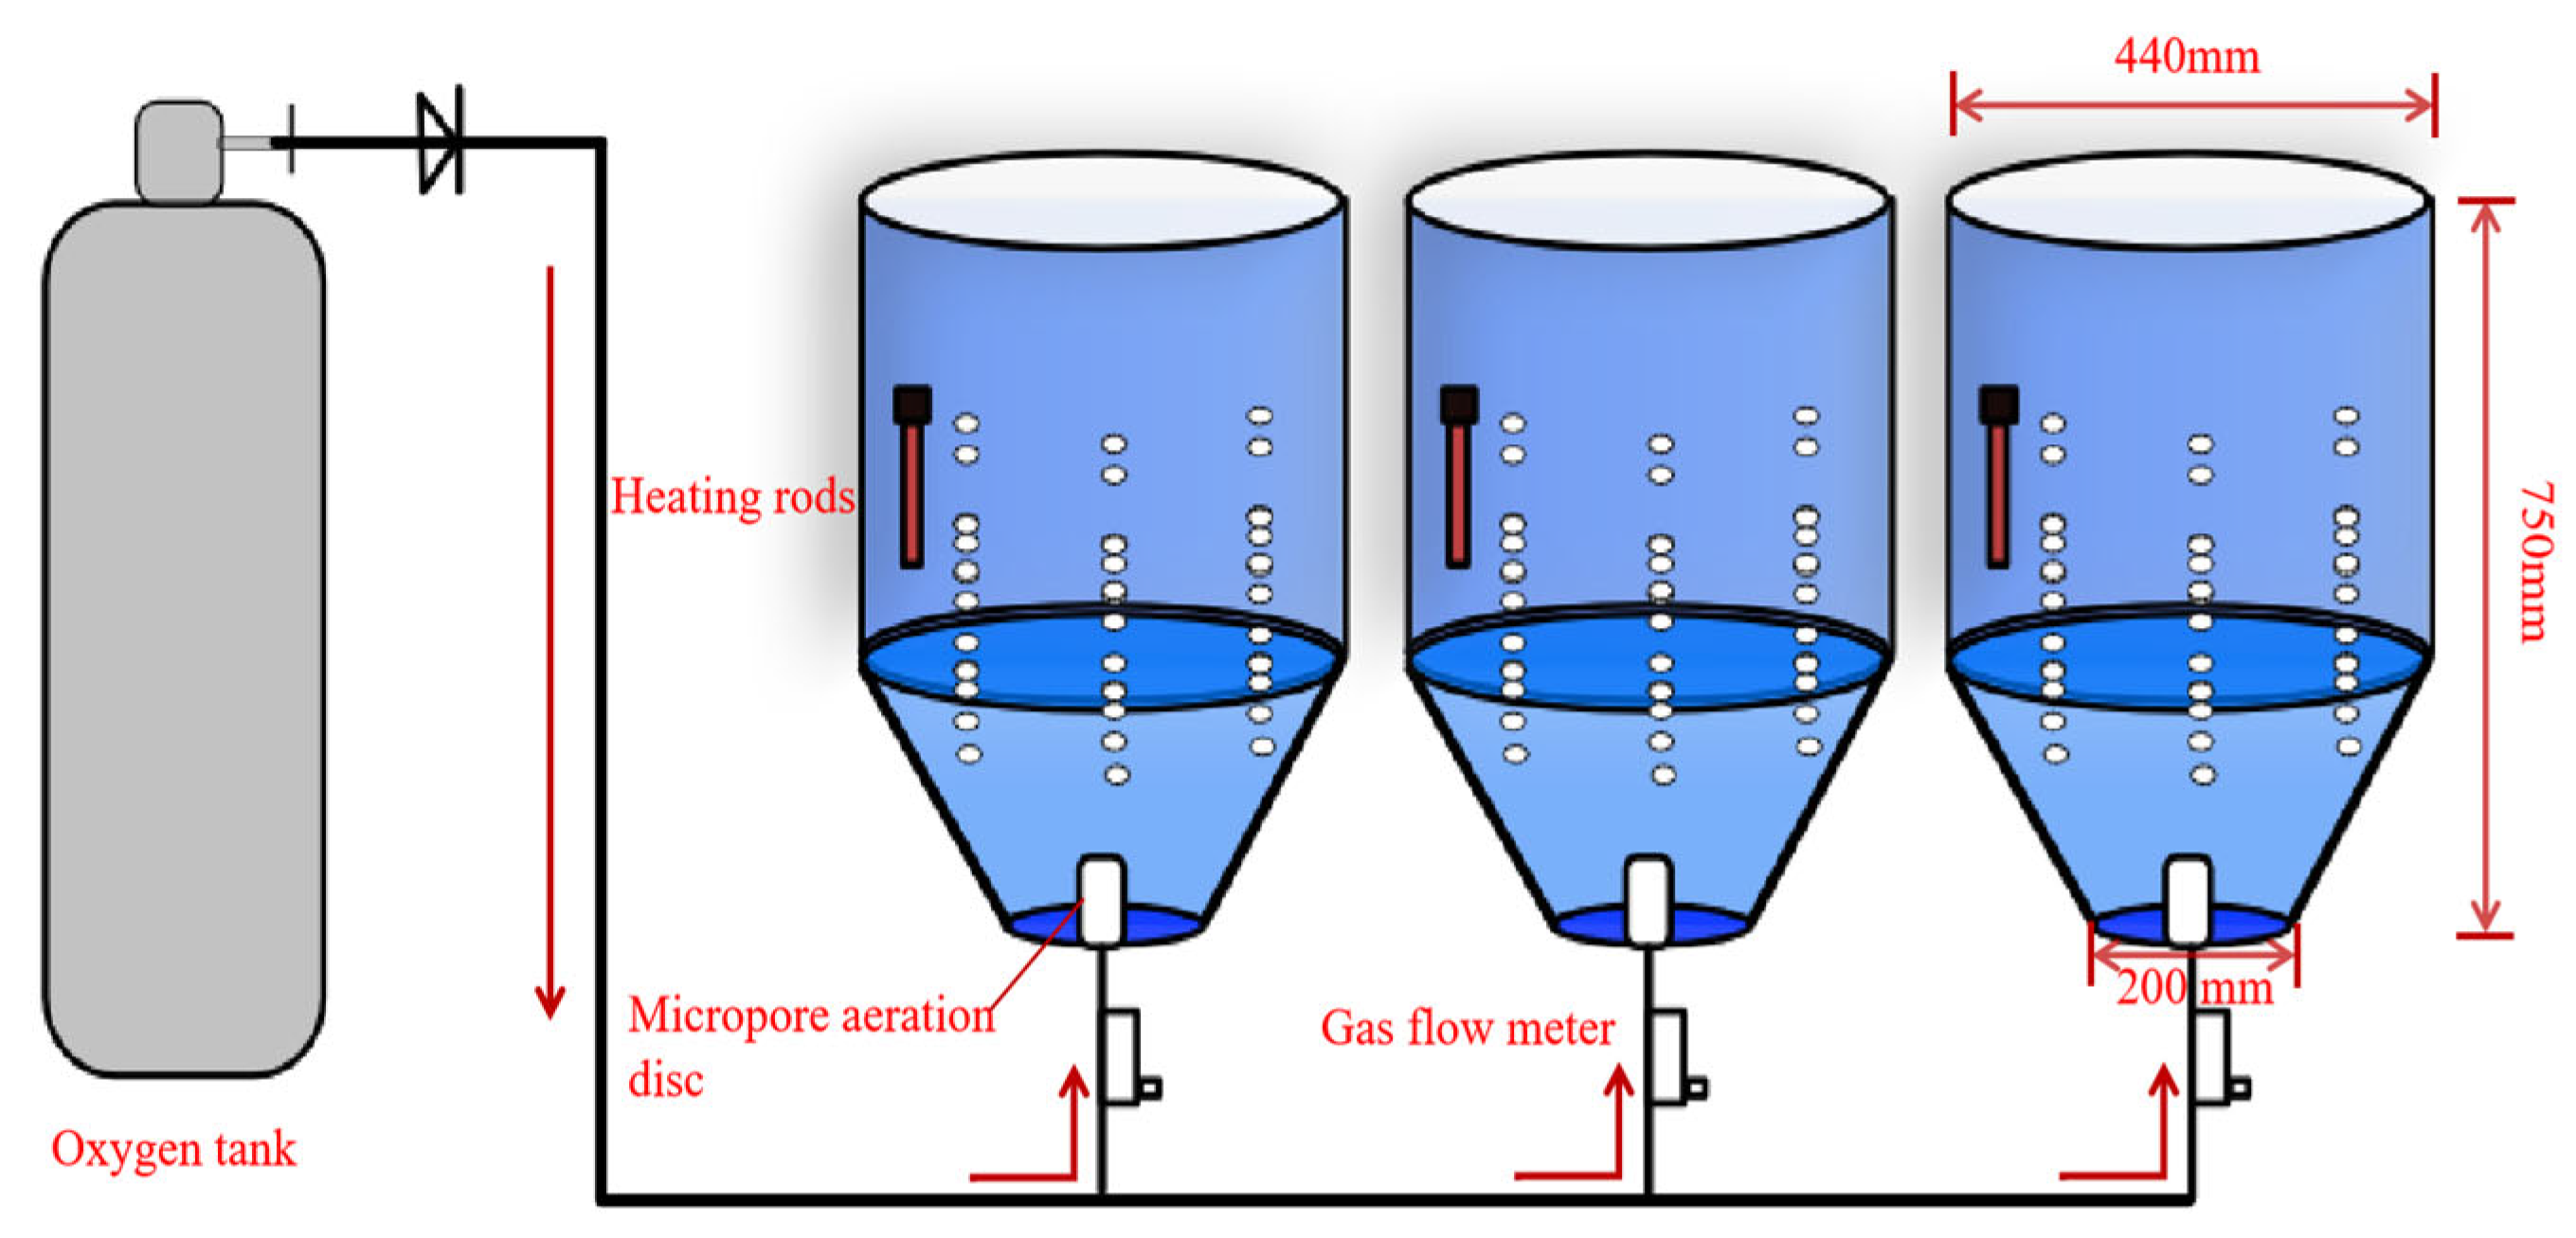
2.1. Experimental Setup

In this study, each experimental unit consists of three 100 L round plastic tanks (diameter and height as shown in Figure 1). During the experiment, each treatment group is supplied with 60 L of filtered aquaculture effluent. Each unit is equipped with a separate gas flow meter and a Micropore Aeration Disc (CW300-30, Keyuan Fishery Equipment Co., Ltd., Guangzhou, China), connected to a liquid oxygen tank via gas tubing. The entire experiment utilizes pure oxygen for aeration, ensuring that the heterotrophic microbial community remains fully suspended in the water. The gas flow meter is used to control the flow rate of pure oxygen. Additionally, a heating rod (300 W, Ribo Electric Co., Ltd., Guangzhou, China) is installed on the side of the experimental unit to maintain the water temperature at 27 ± 1 °C.

2.2. Experimental Design

2.2.1. Selection of Optimal Carbon Source

In this study, three carbon sources—sucrose, molasses, and glucose—were selected to cultivate heterotrophic bacteria for investigating the denitrification performance of aquaculture effluent. The best carbon source was identified through the analysis of water quality changes and microbial community structure. The bacterial strain used was a composite of Bacillus species (Nanhua Qianmu Biotechnology Co., Ltd., Zhengzhou, China). During the experiment, the COD/TN ratio was maintained at approximately 15. Daily samples were taken to measure the concentrations of TAN, NO2-N, NO3-N, CODMn, and TN. Additionally, every two days, the biomass of heterotrophic microorganisms (expressed as biomass volume fraction, BFV) and TSS concentration were measured. At the end of the experiment, metagenomic analysis was performed on the heterotrophic microbial communities from each treatment group. Samples were sent to Shanghai Meiji Biomedical Co., Ltd. (Shanghai, China), for sequencing.
The aquaculture effluent was sourced from the RAS for Litopenaeus vannamei at Shandong Yantai San Shili Bay Fishery Technology Co., Ltd. (Yantai, China). The L. vannamei RAS (500 m3) consisted of 12 aquaculture ponds (APs), 1 MDF, 1 buffer pool, 1 foam separator (FS), 3 moving bed biofilm reactors (MBBR), 1 U-tube oxygenator, and 1 piece of disinfection equipment. The tailwater sedimentation tank is the collection tank for the backwash water of the microfilter of the circulating water shrimp farming system. The effluent in the sedimentation tank contained a significant amount of suspended solids, such as leftover feed, feces, and shrimp shells. After allowing the aquaculture effluent to settle, it was filtered three times using a 300-mesh filter to obtain the supernatant for the experiment. Before starting the experiment, various water quality parameters of the filtered aquaculture effluent were measured and recorded.

2.2.2. Optimization Using Response Surface Methodology

This study utilizes RSM with a Central Composite Design (CCD) to optimize the key operating parameters in the heterotrophic bacteria assimilation process. The independent variables selected are the amount of microbial addition (X1), the hydraulic retention time (X2), and the COD/TN ratio (X3), while the removal efficiencies of TAN, NO2-N, NO3-N, and TN serve as the response variables (Y1~Y4) as shown in Table 1. The experiments were designed using Design-Expert V.13 software, resulting in the experimental setup detailed in Table 2. Each experimental group consisted of three parallel trials, and the average response values were calculated and fed back into Design-Expert V.13 software to obtain the corresponding RSM model and its data analysis results.

2.3. Analytical Methods

2.3.1. Water Quality Analysis Methods

The dissolved oxygen (DO), temperature, and pH of the water were measured using a portable multiparameter water quality analyzer (YSI-556, YSI Inc., Yellow Springs, OH, USA). The determination of water quality parameters followed standard protocols [26]. Water samples were filtered through a 0.45 μm membrane before analysis, which was conducted using an EU-2000A UV-visible spectrophotometer (ONLAB, Shanghai, China). TAN was measured using the Nessler’s reagent spectrophotometric method, NO2-N was determined using the N-1-(naphthyl) ethylenediamine spectrophotometric method, NO3-N was measured using UV spectrophotometry, TN was analyzed using alkaline potassium persulfate digestion followed by UV spectrophotometry, and CODMN was assessed using the alkaline potassium permanganate method.

2.3.2. Microbial Analysis Methods

The total DNA of the bacterial mass stored at −80 °C was extracted using a E.Z.N.A.® Soil DNA Kit (Omega Bio-tek, Norcross, GA, USA), and the integrity of the extracted DNA was detected using 1% agarose gel electrophoresis. After detection, the DNA was stored in a refrigerator at −20 °C. The construction of the paired-end library was carried out by fragmenting the extracted DNA to an average size of about 350 bp using a Covaris M220 (Gene Company Limited, Shanghai, China). The pairing of the end library was performed using NEXTFLEX® Rapid DNA Seq (Bio Scientific, Austin, TX, USA). Bridge PCR and sequencing were performed using Illumina NovaSeq Reagent Kits (Illumina, CA, USA).
To determine the nitrogen metabolism pathway of the microorganisms, the predicted gene sequences in each bacterial sample were mapped to the Kyoto Encyclopedia of Genes and Genomes (KEGG, https://www.genome.jp/kegg/ accessed on 17 November 2023), and the bioinformatics pathway of nitrogen metabolism was obtained using the “KEGG Viewer” module in MEGAN. To compare the non-redundant gene set sequences with the KEGG gene database (GENES), BLASTP (BLAST Version 2.2.28+, http://blast.ncbi.nlm.nih.gov/Blast.cgi accessed on 20 July 2023) was used, and the expected value of BLAST comparison was 1 × 10⁻⁵. KOBAS 2.0 (KEGG Orthology Based Annotation System) was used to perform functional annotation based on the comparison results. The relative abundance of the functional category was calculated using the gene abundance value corresponding to the KO and the sum of gene abundance.

2.3.3. Data Analysis Methods

The removal rate of nitrogen-containing pollutants was calculated using Formula (1):
R ( % ) = C i C f C i × 100 %
where R is the removal efficiency and Ci and Cf are the initial and final concentrations of the target parameter, respectively.
In the response surface method optimization experiment, in order to reflect the relationship between the independent variable and the dependent variable, a quadratic polynomial equation was used for fitting:
Y = β 0 + i = 1 n β i X i + i = 1 n β i i X i 2 + i = 1 n 1 j = i + 1 n β i j X i X j
In Formula (2), Y is the predicted target response, Xi and Xj are input factors, β0 is a constant coefficient, and βi, βii, and βij are the coefficients of the linear term, quadratic term, and interaction term, respectively.
Design-Expert 13 was used to evaluate data regression and generate response surface plots to fully describe the interaction results. The statistical validity of the obtained response surface model was evaluated through fitting summary analysis, model summary statistics, fitting statistics, and variance analysis. Finally, the optimal water treatment conditions were obtained according to the software recommendations and verified to further examine the validity of the model.

3. Results

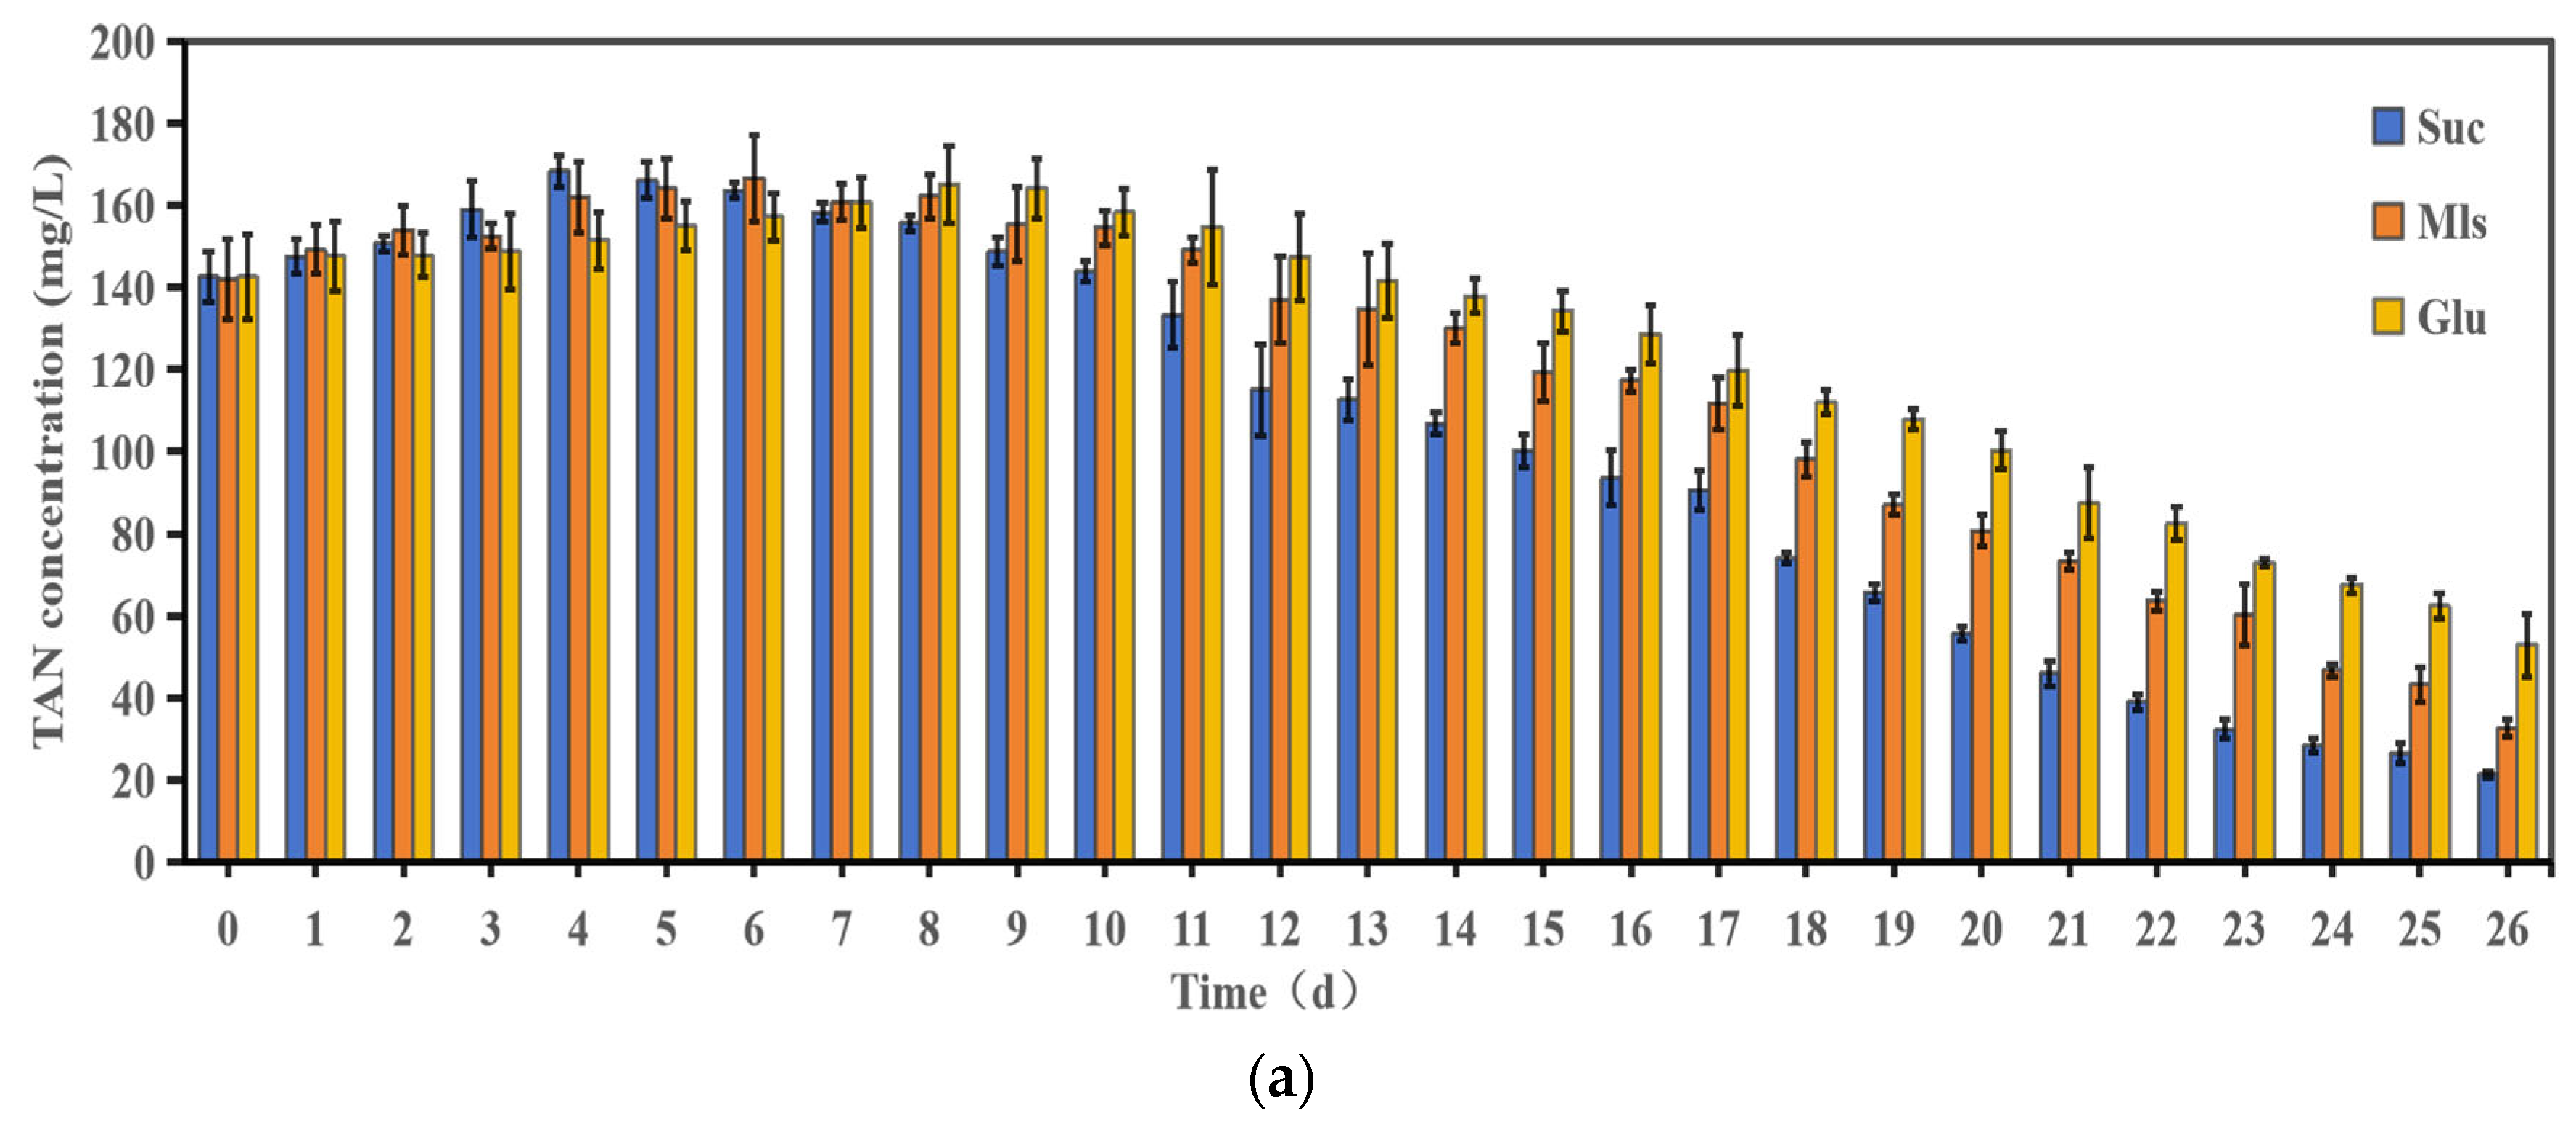
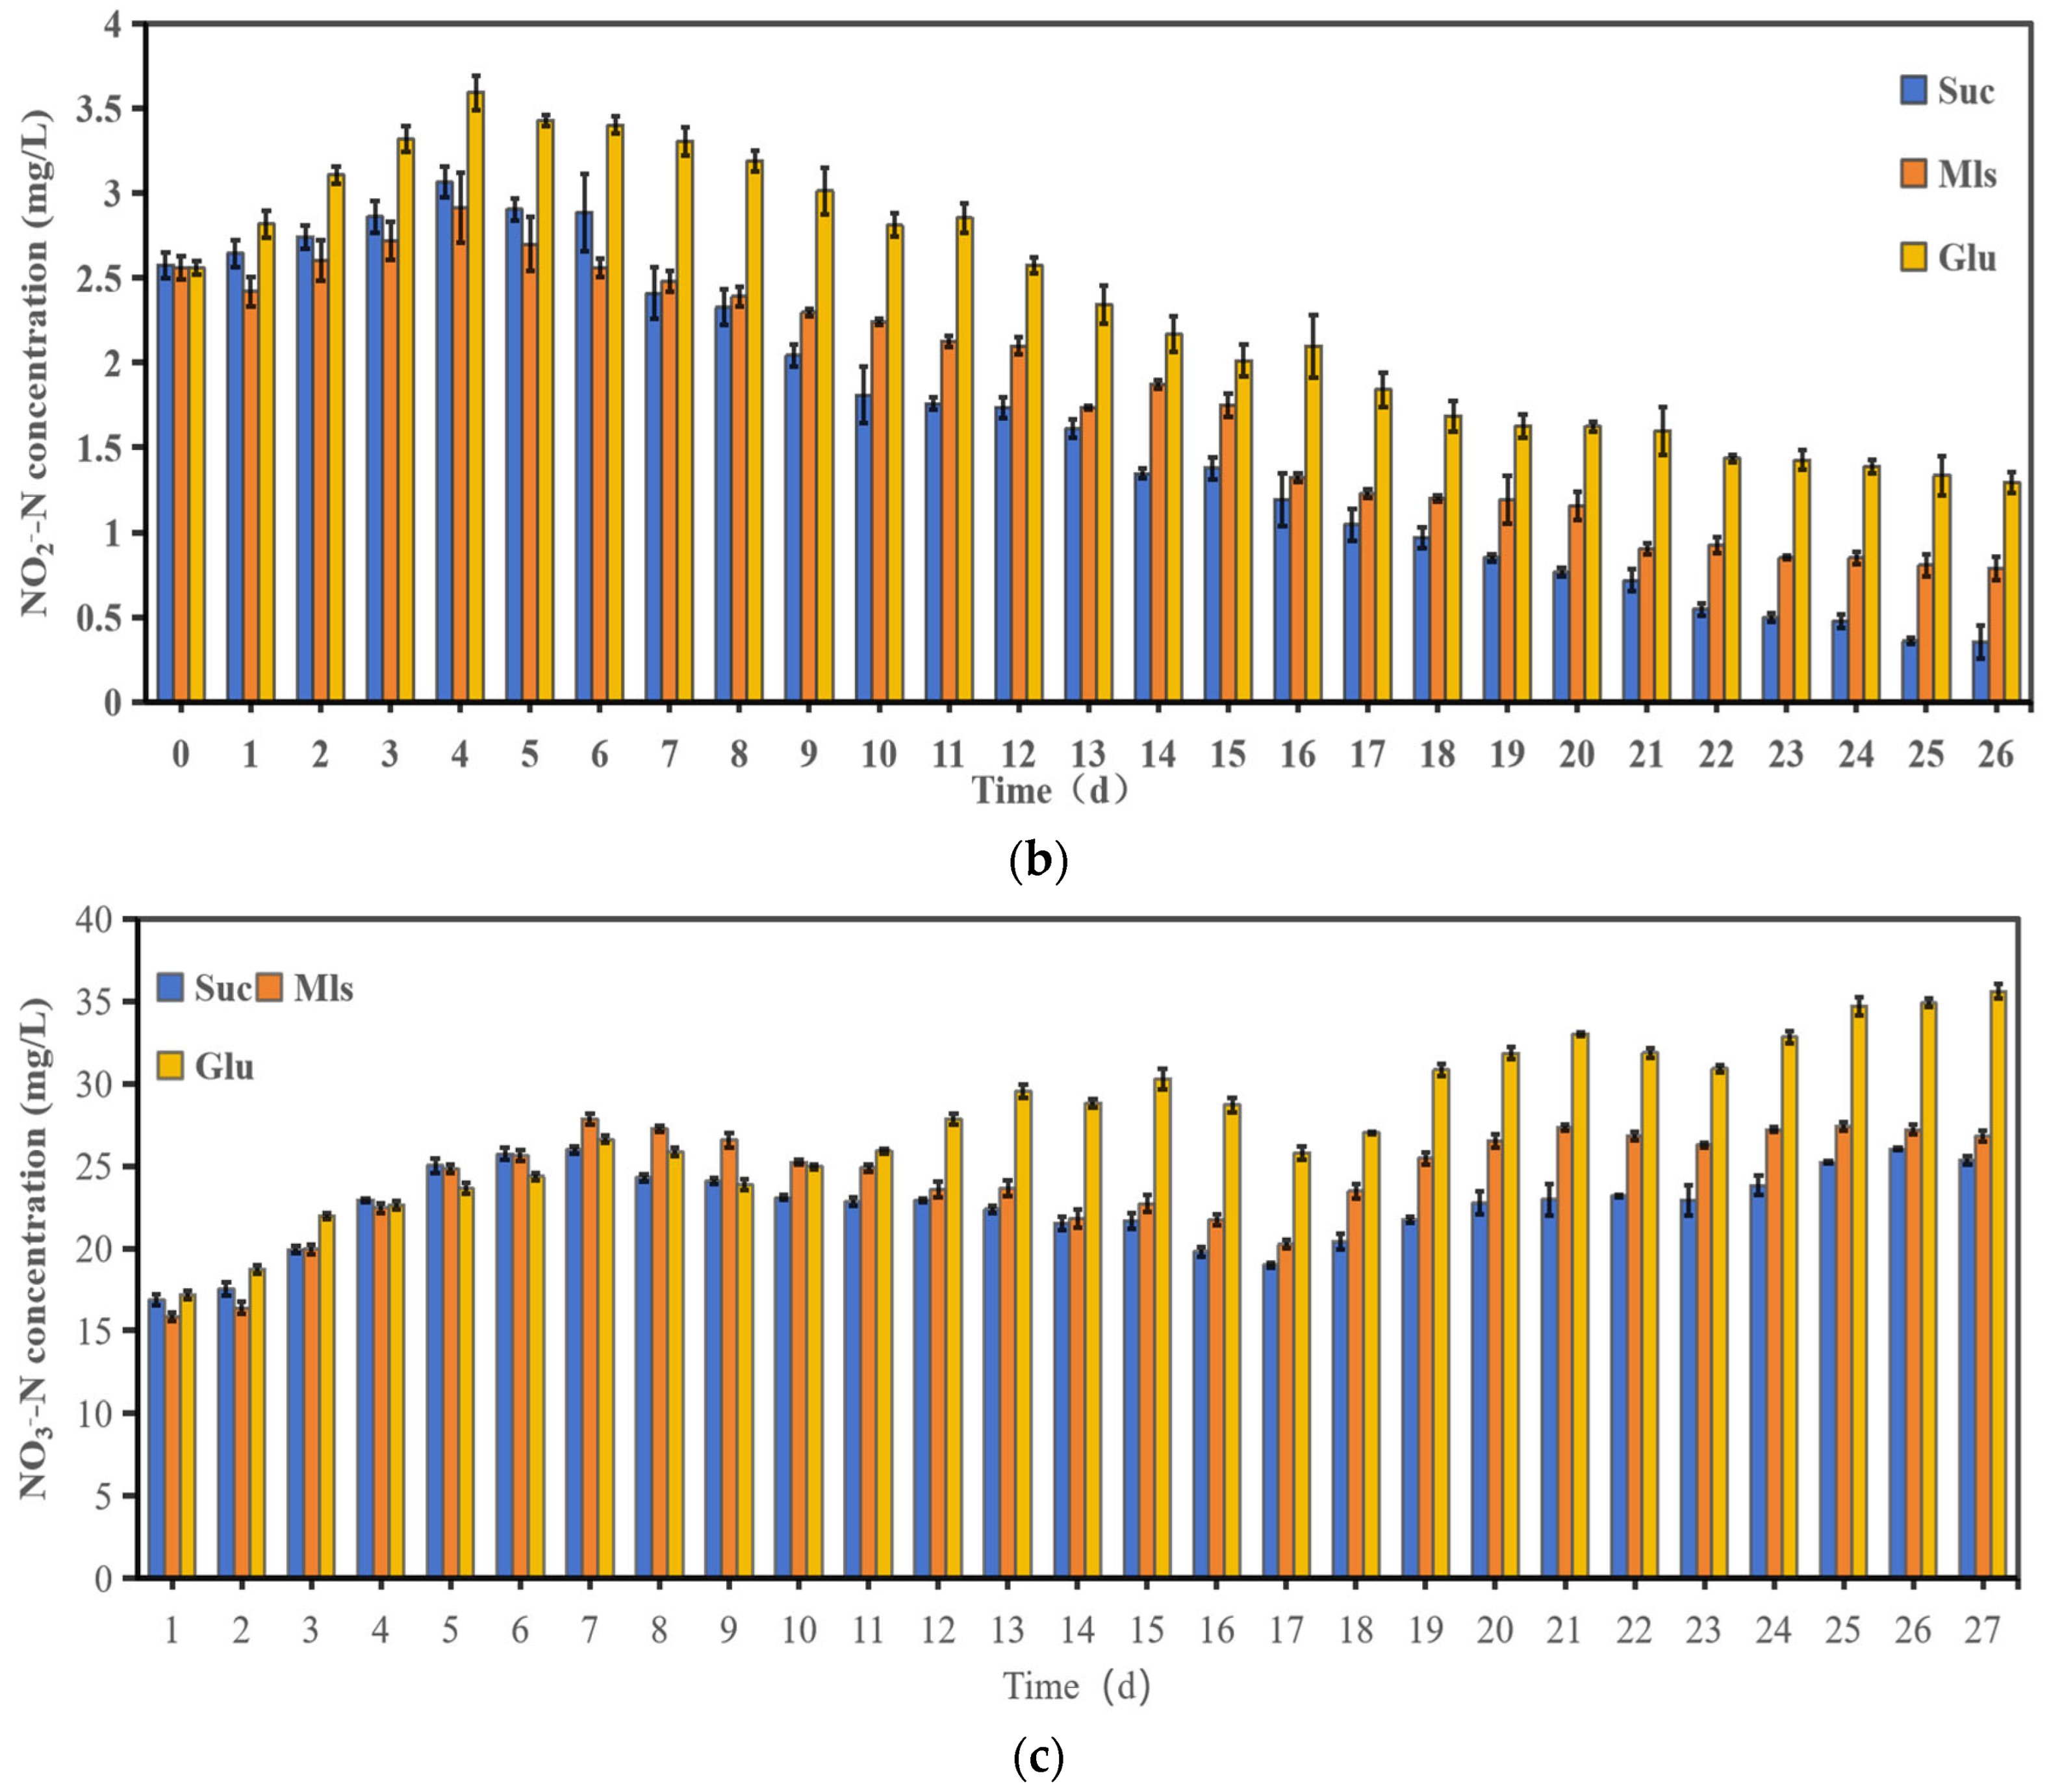
3.1. Water Quality Changes

Table 3 shows the water quality of the circulating aquaculture system and the tailwater sedimentation pool. The tailwater filtrate is collected from the tailwater sedimentation pool of the circulating aquaculture system. A large amount of organic matter, such as residual bait and feces, accumulated in the sedimentation pool for a long period. The mineralization and decomposition of organic matter significantly increased the concentration of TAN and NO2-N in the water body compared with the circulating aquaculture system (p < 0.05), from 1.165 ± 0.47 mg/L and 0.4607 ± 0.14 mg/L to 14.7 ± 6.35 mg/L and 2.1 ± 0.56 mg/L respectively; the NO3-N concentration in the tailwater sedimentation pool significantly decreased under anaerobic conditions (p < 0.05), from 97.163 ± 14.38 mg/L to 16.63 ± 0.64 mg/L.
Figure 2 illustrates the changes in nitrogen concentrations under different carbon sources in the heterotrophic microbial cultivation system. As can be seen from the figure, the TAN of the water body of the microbial culture system shows obvious differences under different carbon source conditions. The TAN concentration in the sucrose group increased within 0–4 days and reached a peak of 168.3 ± 3.82 mg/L on the 4th day. The TAN concentration in the heterotrophic microbial culture system of the molasses group and the glucose group increased within 0–8 days and reached a peak of 162.23 ± 5.28 mg/L and 165.07 ± 9.352 mg/L on the 8th day, respectively, and then stabilized and gradually decreased. The TAN concentration in the sucrose group gradually decreased within 4–26 days. There were significant differences in the removal rates of ammonia nitrogen among the groups (p < 0.05). The final TAN removal rates of the sucrose group were 85.1%, 77.0% and 62.9% in the molasses group and the glucose group. In general, the sucrose group and the molasses group had a higher removal rate of TAN in the water, and the treatment effect of the glucose group was poor.
Figure 2b shows that the concentration of NO2-N in the heterotrophic microbial culture system under different carbon sources showed a trend of first increasing slightly and then decreasing. Each group reached a peak on the 4th day, which was 3.06 ± 0.09 mg/L, 2.91 ± 0.21 mg/L, and 3.59 ± 0.10 mg/L, respectively. The NO2-N removal rate was as follows: sucrose group > molasses group > glucose group; the slow decrease rate in the glucose group was significantly different from the other two groups (p < 0.05).
Figure 2c shows that the NO3-N concentration of the three groups of microbial culture systems finally increased slightly. The NO3-N concentration in the glucose group showed an increasing trend, and the NO3-N concentration in the sucrose group and molasses group decreased from 6 to 16 days, and the NO3-N concentration remained basically stable from 16 to 26 days. The increase in NO3-N concentration in the glucose group was significantly greater than that in the sucrose group and molasses group (p < 0.05).

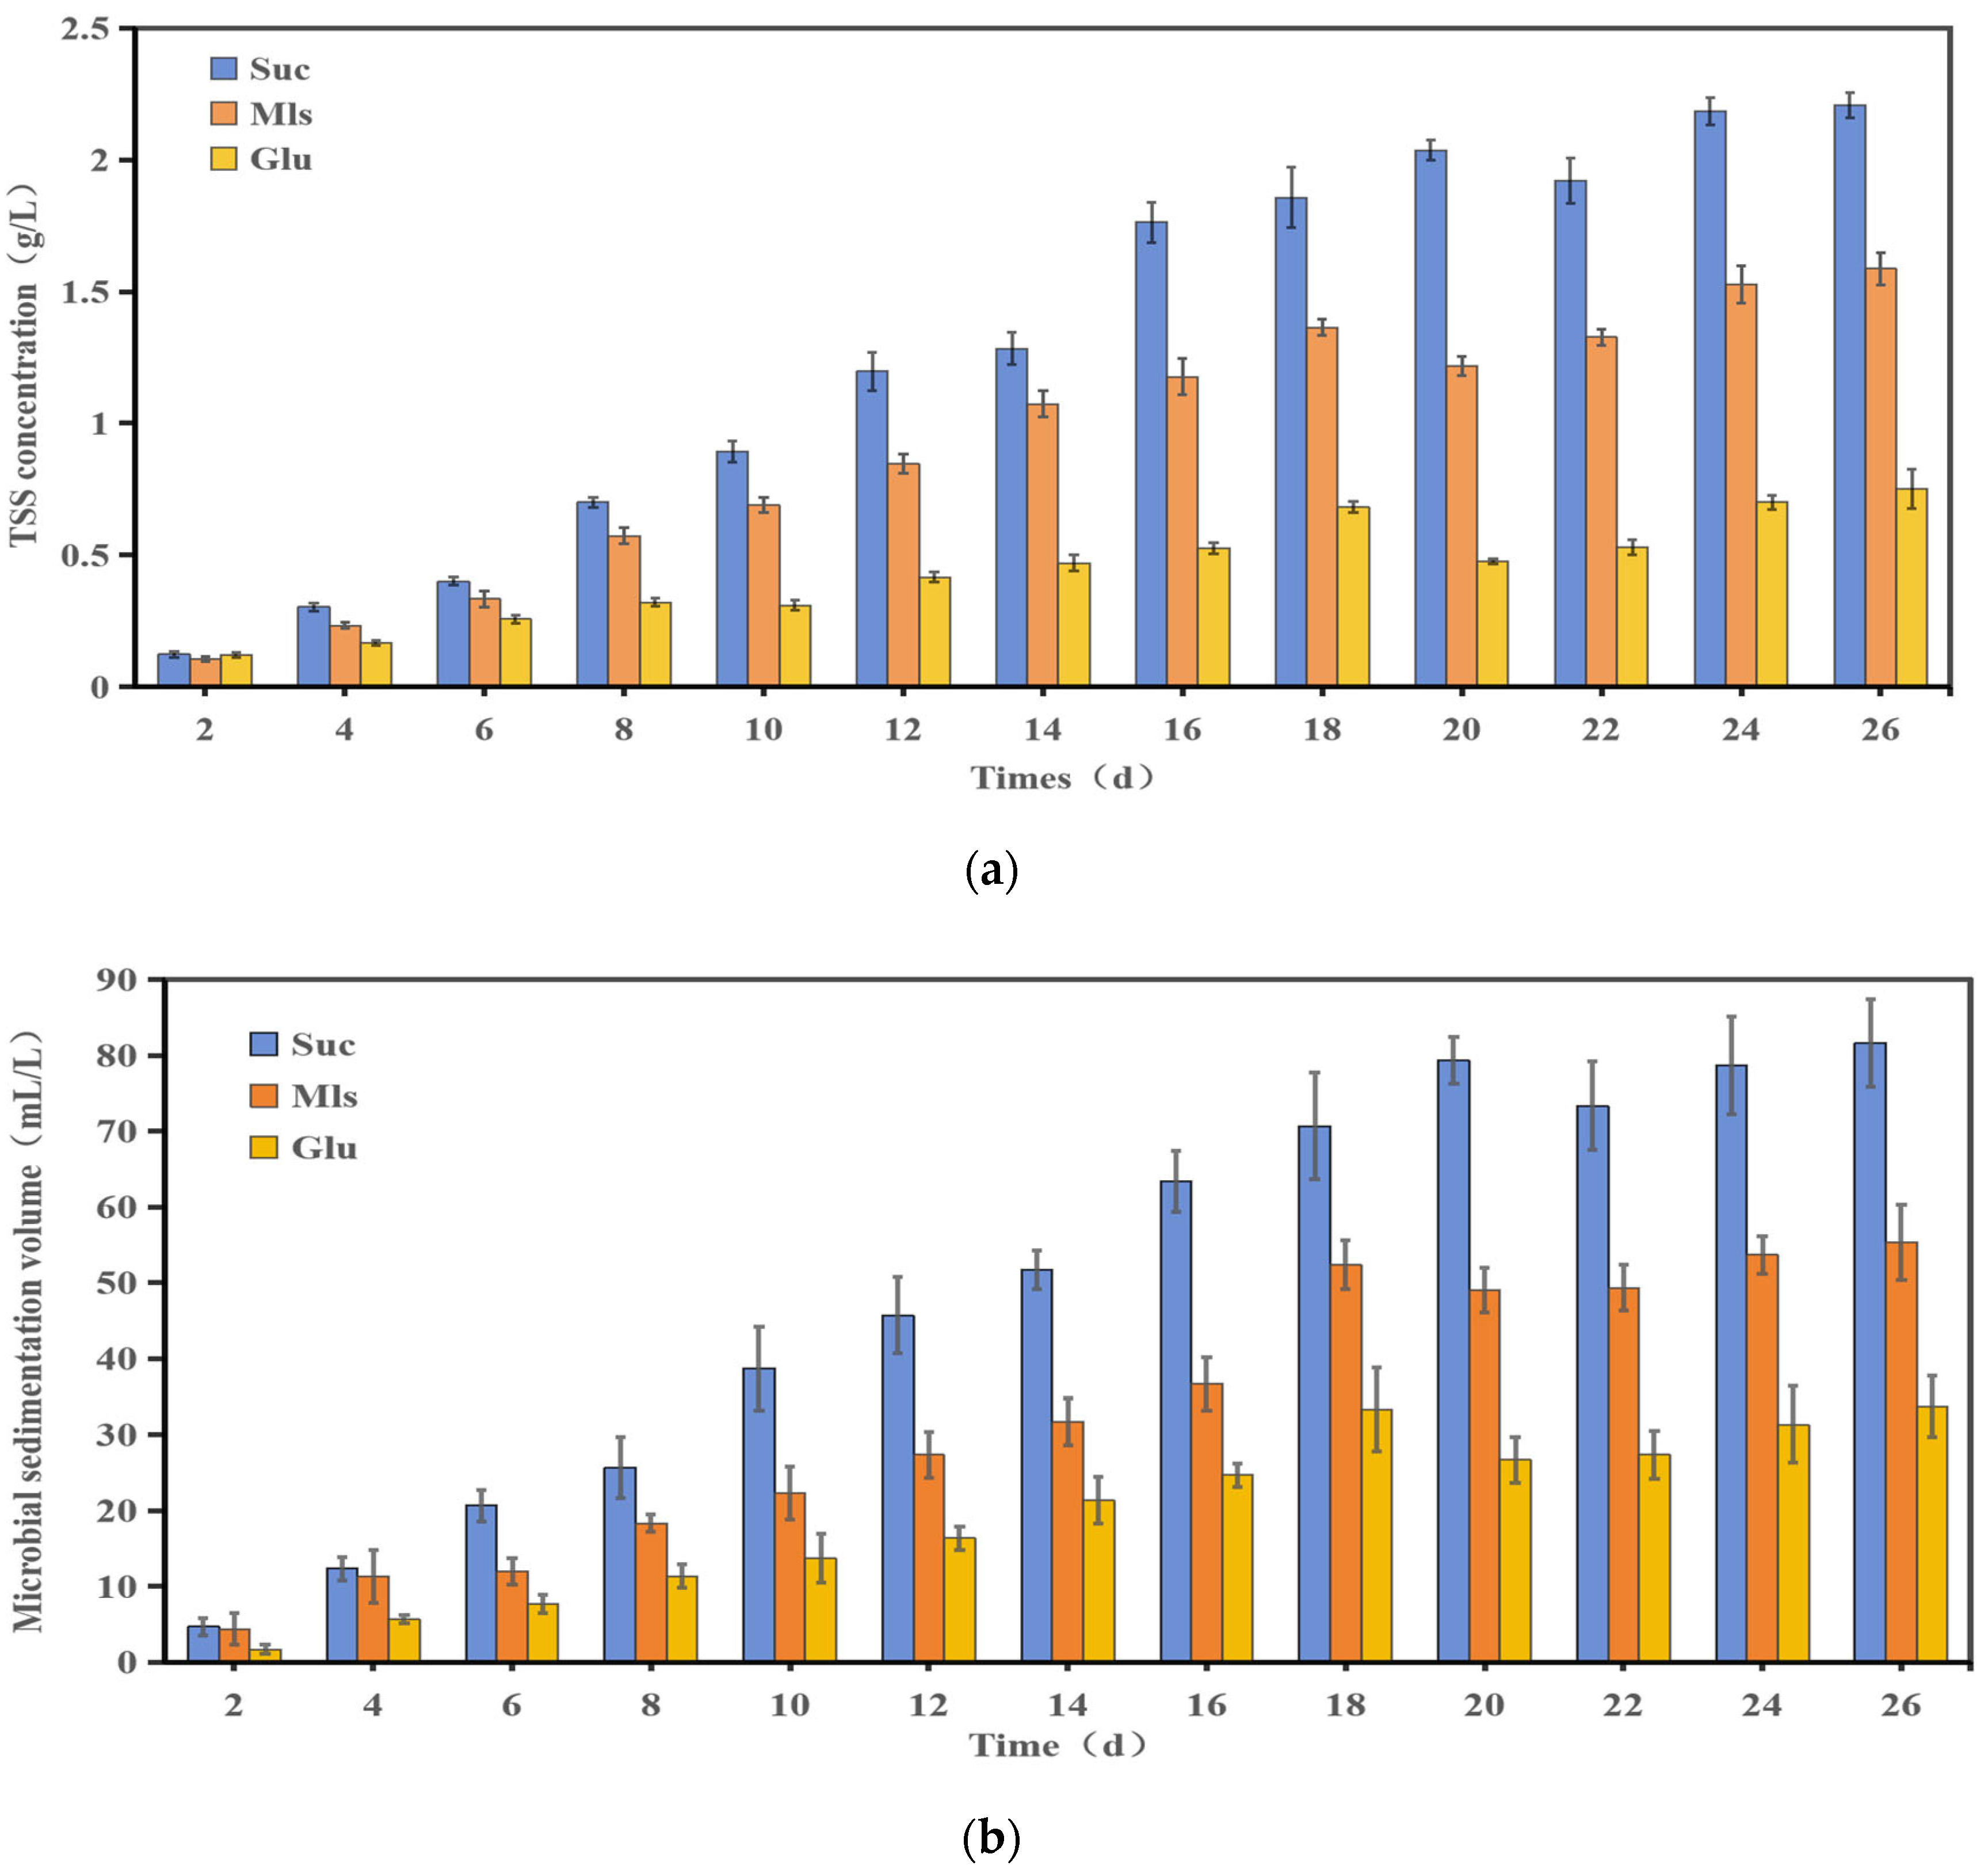
3.2. Microbial Production and Characteristics

During the experiment, TSS and microbial sedimentation volume in the reactor were measured every 2 days, and each culture system was sampled 3 times. As shown in Figure 3a, the TSS change pattern of the water body in each experimental group was similar. The TSS of the water body increased rapidly in the initial stage of the experiment. The TSS values of the molasses group and the glucose group reached the highest values on the 18th day; those of the sucrose group reached the highest value on the 20th day, which was 2.03 g/L. After the TSS in each experimental group reached the highest value at the inflection point, the concentration of TSS in the water gradually approached stability after a certain degree of decrease. On the 26th day, the TSS value of the sucrose group was 2.21 g/L, which was significantly higher than that of the other two experimental groups (p < 0.05).
As shown in Figure 3b, the trend of the change in the microbial BFV value of each culture system is basically the same as that of TSS. The microbial sedimentation volumes of the molasses group and the glucose group reached their highest values at 18 days; the sucrose group reached its highest value at 21 days, which was 79.33 mL/L; after that, the microbial sedimentation volume of each experimental group decreased slightly and then slowly increased. At 26 days, the microbial sedimentation volume of the sucrose group was 81.67 mL/L, which was significantly higher than that of other experimental groups (p < 0.05).
After the experiment, the results of crude protein, crude fat and crude ash of heterotrophic microorganisms are shown in Table 4. The crude protein content of the sucrose group in the heterotrophic microorganisms of each experimental group was the highest at 33.47%, which was significantly different from the molasses group and the glucose group (p < 0.05). The crude fat content of each experimental group in the sucrose group was significantly higher than that in the molasses group and the glucose group (p < 0.05).

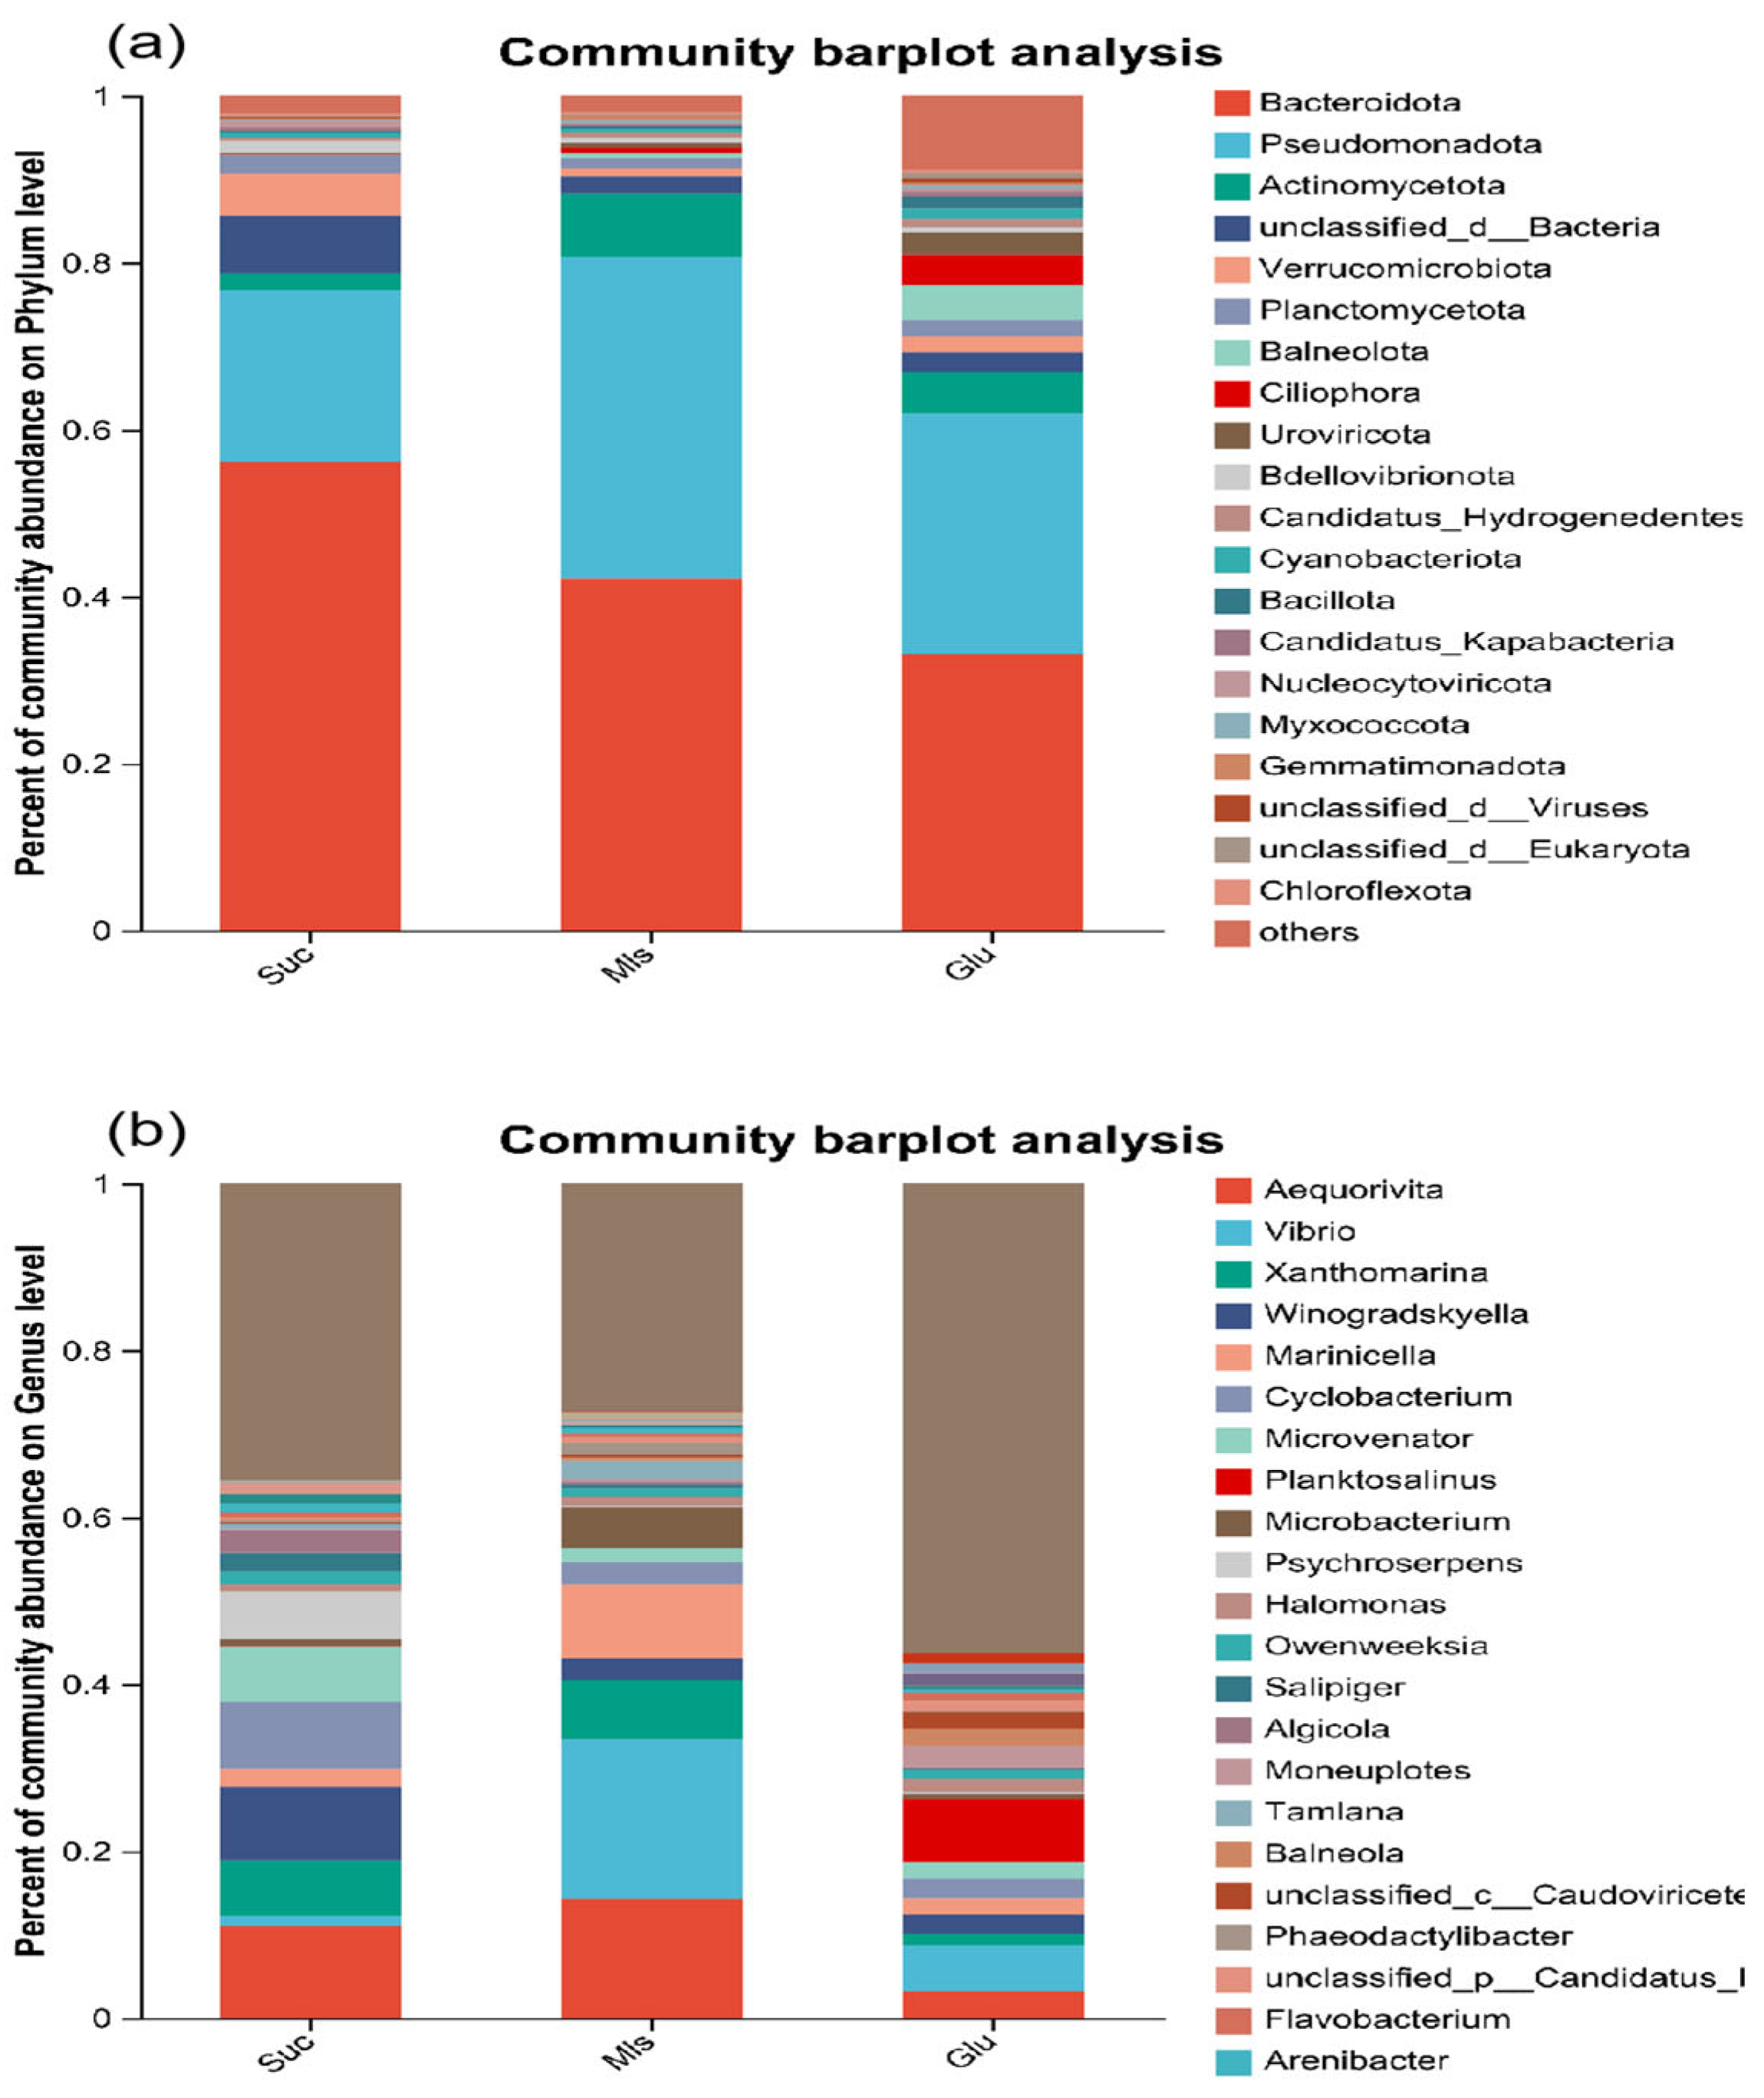
3.3. Microbial Community Structure and Abundance

Figure 4a shows the microbial community structure at the phylum level of microorganisms cultured with different carbon sources. Bacteroidota and Pseudomonadota were dominant in the microbial community composition under different carbon sources, but the proportions were different. In Suc, Bacteroidota and Pseudomonadota accounted for 56.08% and 20.64%; in Mls, Bacteroidota and Pseudomonadota accounted for 42.15% and 38.62%; in Glu, Bacteroidota and Pseudomonadota accounted for 33.05% and 28.95%. Compared with Mls and Glu, the Suc group significantly increased the relative abundance of Bacteroidota (p < 0.05) and significantly reduced the relative abundance of Pseudomonadota (p < 0.05).
At the genus level (Figure 4b), the dominant genera in Suc were Aequorivita, Xanthomarina, Winogradskyella, Cyclobacterium, Microvenator, and Psychroserpens. In Mls, Aequorivita, Vibrio, Xanthomarina, and Marinicella were dominant. In Glu, Aequorivita, Vibrio and Planktosalinus were dominant. Compared with Mls, the proportion of Winogradskyella, Cyclobacterium, Psychroserpens, and Marinicella increased significantly (p < 0.05) and that of Microvenator decreased significantly (p < 0.05).

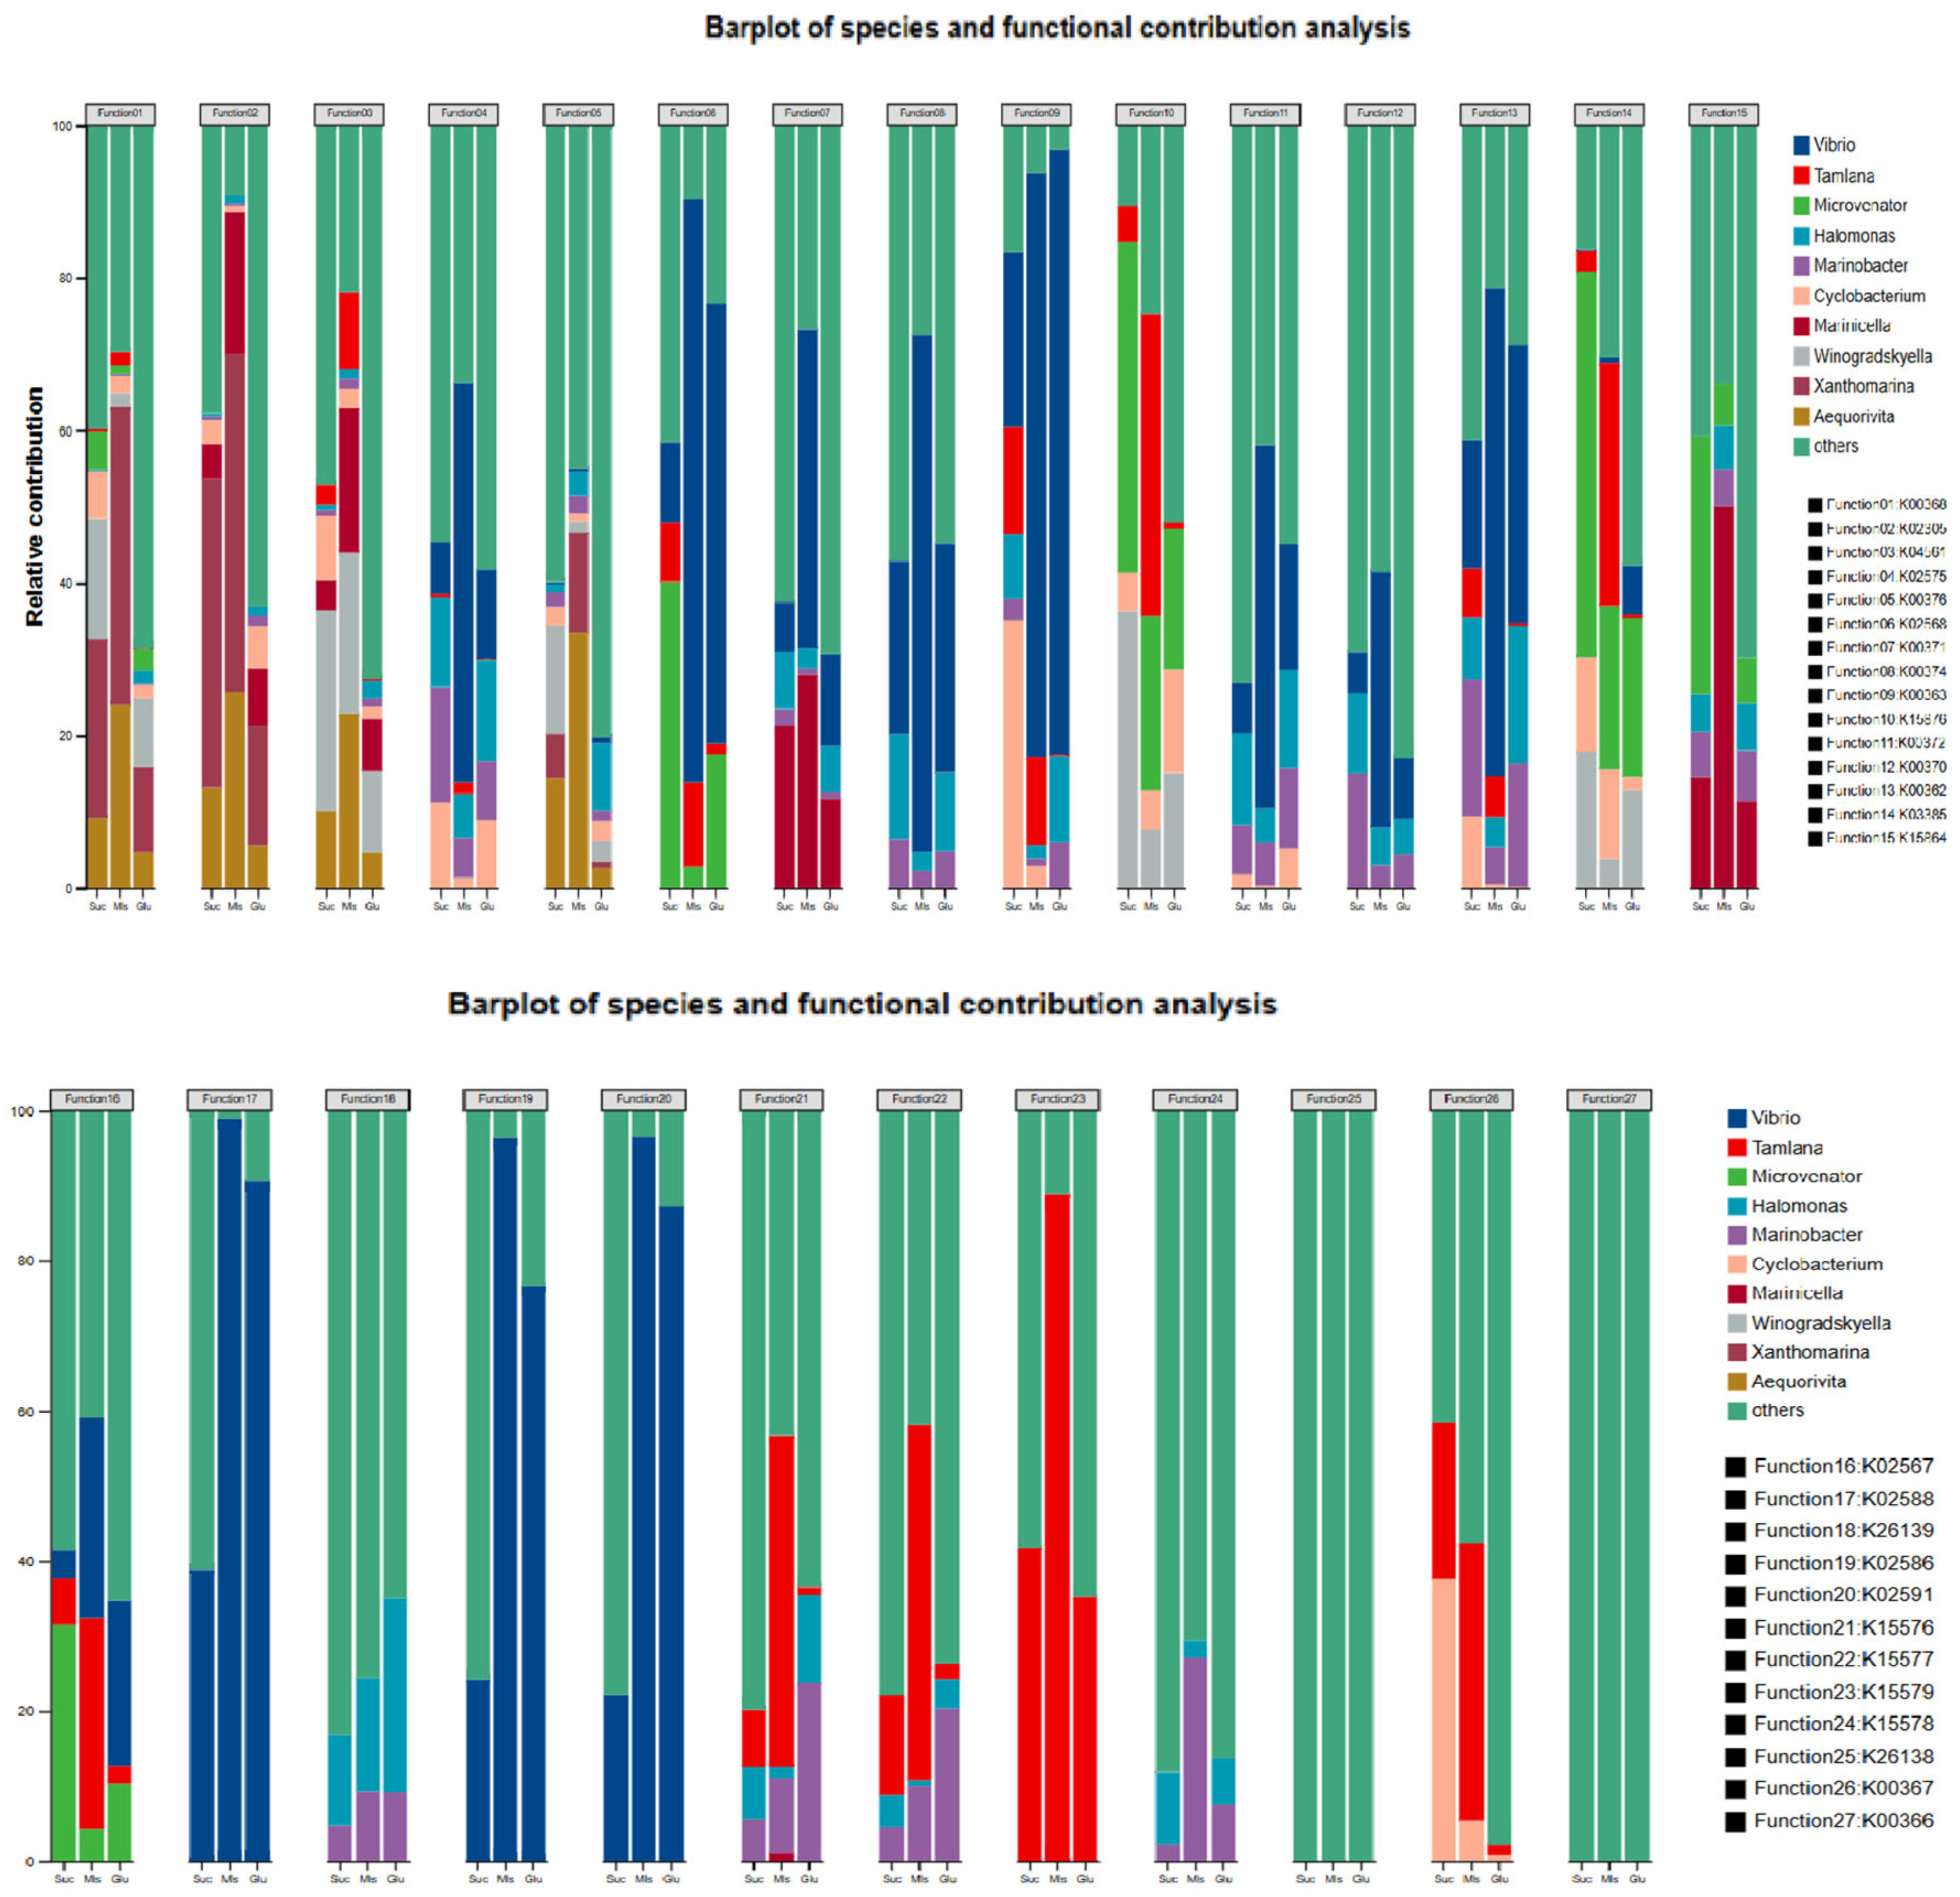
3.4. Metagenomic Metabolic Analysis

In screening nitrogen metabolism genes in microbial community samples of different carbon source groups, the relative abundance of all genes exceeded 0.1% (Figure 5). In the process of heterotrophic bacteria assimilation, denitrification, dissimilatory nitrate reduction to ammonium (DNRA), and assimilatory nitrate reduction to ammonium (ANRA) are the main nitrogen metabolism processes. Denitrification functional genes account for a relatively high proportion of the main nitrogen metabolism genes, and the abundance of nirK, norB, and norC genes is relatively high.
From the perspective of contribution at the genus level (Figure 5), in the process of anaerobic nitrate reduction (narGHL), Vibrio contributes more, followed by Marinicella. In the process of aerobic denitrification (napAB), Microvenator and Marinicella. Xanthomarina and Aequorivita play a major role in the process of nitrite nitrogen reduction (nirSK) and nitric oxide (norBC) in denitrification. Analysis of the contribution table showed that Vibrio played a major role in nitrogen fixation (nifDKH), and Tamlana contributed more to nitrate transmembrane transport.

3.5. Response Surface Model Related Data

Response surface model-related data analysis: The variance analysis results of the RSM data are shown in the table (Table 5). The correlation coefficient R2 and the adjusted determination coefficient adjusted R2 (R2Adj) can be used to test the quality of the regression model. R2 is a value between 0 and 1, which describes the degree of fit of the response surface. The closer the value is to 1, the smaller the impact of the error, that is, the more accurate the regression equation. However, R2 increases with the increase in the number of independent variables in the regression equation. In order to overcome this shortcoming, R2Adj is used for correction. R2Adj takes into account the influence of the number of parameters. When the number of parameters increases, R2Adj does not necessarily increase, so it can be used to compare the approximation of regression equations with different parameters. When R2 is greater than 0.9, it indicates that the empirical model fits the actual data well [27]. The R2, R2Adj, and Pred-R2 values of the TN removal model were 0.9424, 0.8906, and 0.8732, respectively; the R2, R2Adj, and Pred-R2 values of the TAN removal model were 0.979, 0.9601, and 0.8395, respectively; the R2, R2Adj, and Pred-R2 values of the NO2-N removal model were 0.9717, 0.9463, and 0.8554, respectively; and the R2, R2Adj, and Pred-R2 values of the NO3-N removal model were 0.9287, 0.8645, and 0.8752, respectively. The results showed that the R2, R2Adj, and Pred-R2 values were high, but the differences were small, indicating that the model and the data had good accuracy and applicability, and RSMs could effectively predict the effect of heterotrophic microorganisms in removing various nitrogenous pollutants. The ratio of the standard error to the experimental data, that is, the coefficient of variation (CV), is a standardized measure of the dispersion of the probability distribution. CV < 10% is considered satisfactory. In this study, the CV values of the TN, TAN, and NO2-N removal model data were 9.39%, 6.42%, and 8.25%, respectively, and the CV value of the NO3-N removal model was 12.88%, indicating that non-experimental factors had little effect on the results, and the experimental credibility and accuracy were good [28]. Generally speaking, a model with a signal-to-noise ratio (Adeq Precision) greater than 4.0 is considered reasonable [29]. In this study, the AP value was large enough, and the AP values of each nitrogen-containing pollutant removal model were 9.39, 6.42, 8.25, and 12.88, respectively. Therefore, this model can be used to test and analyze the results of nitrogen-containing pollutant removal.

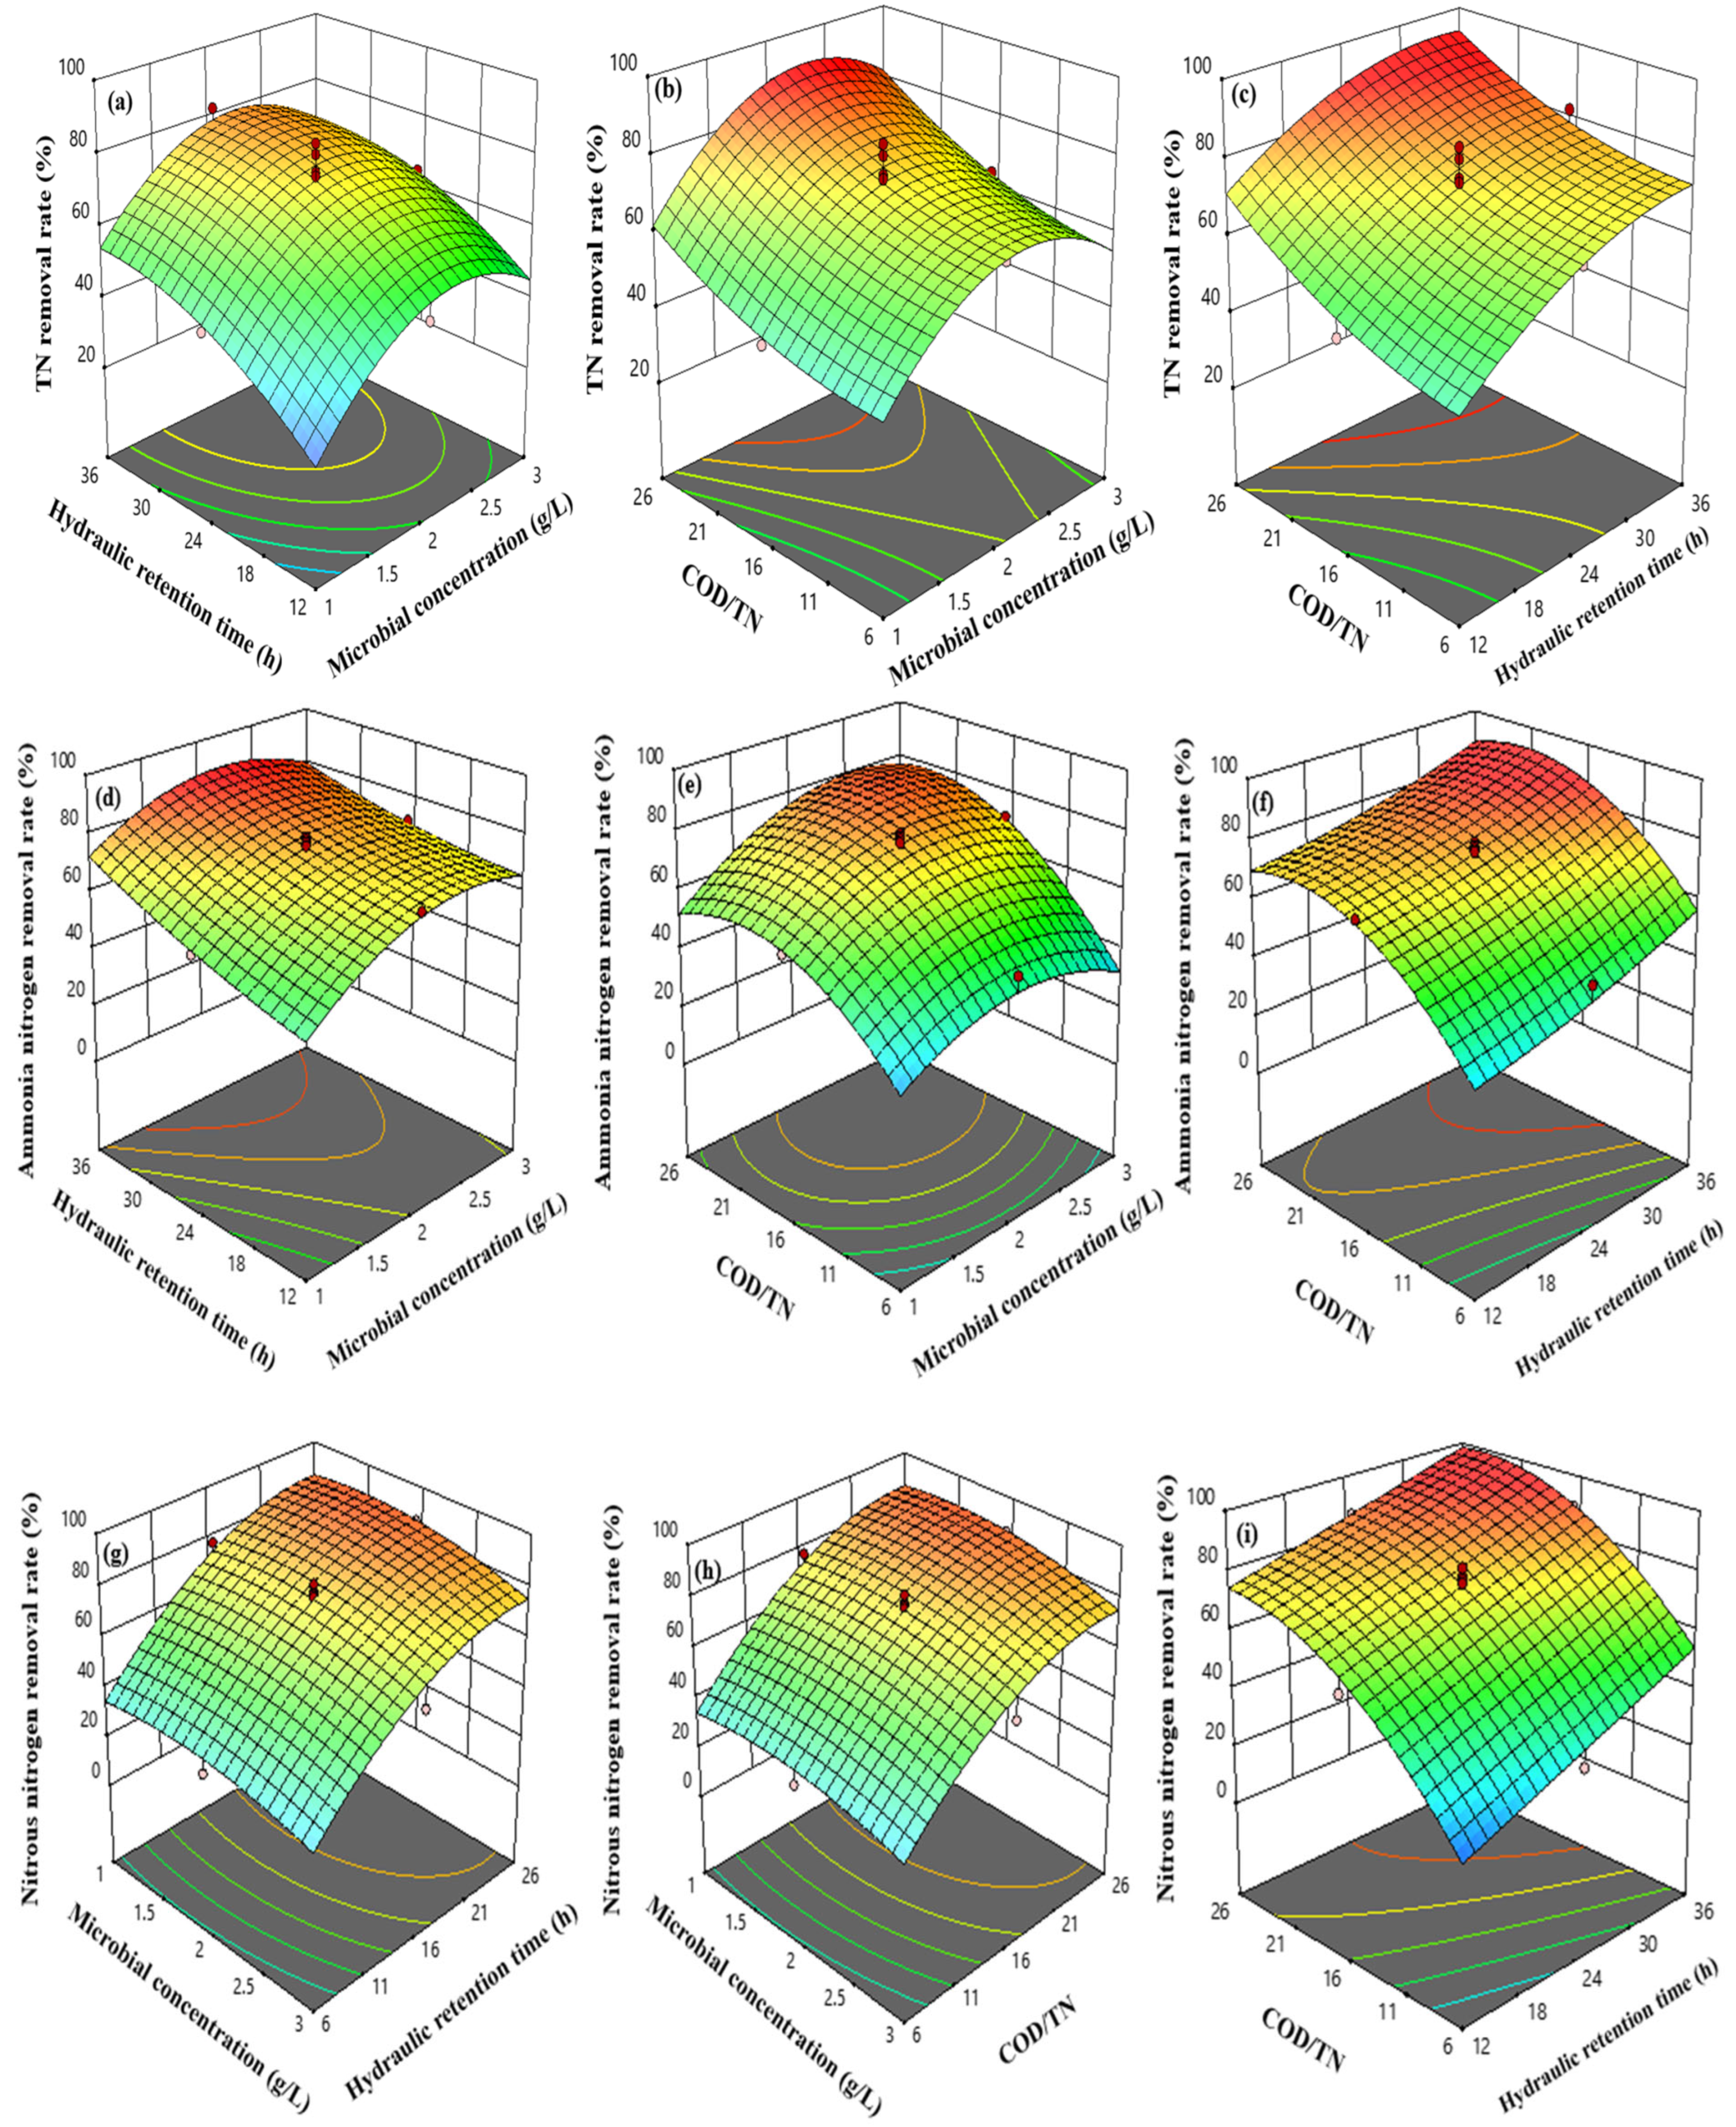
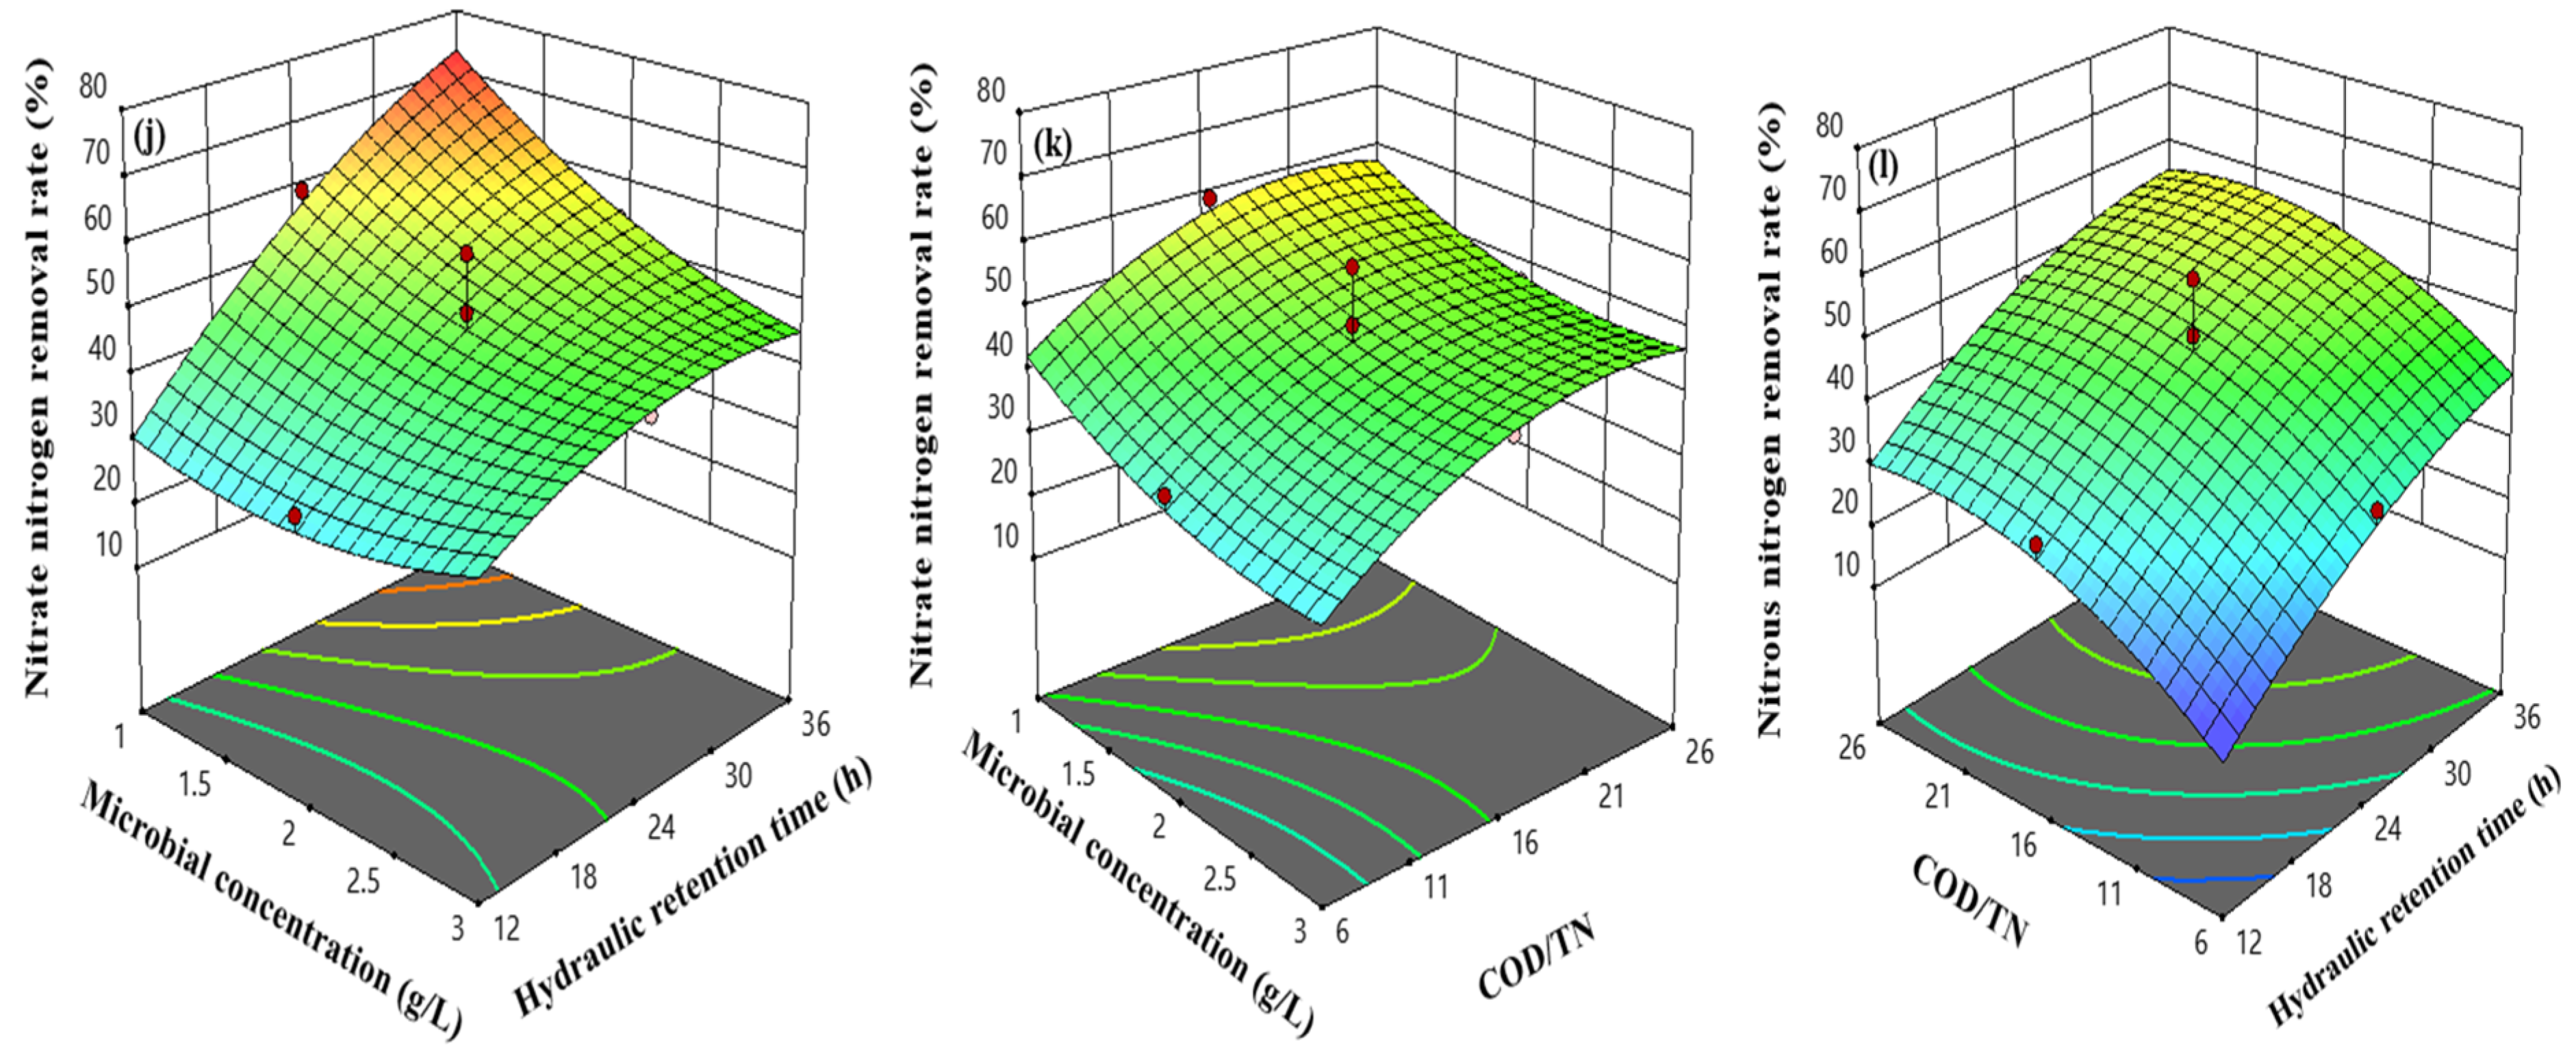
3.6. Response Surface Interaction Analysis

Based on the regression model (Table 6), a response surface diagram was drawn for microbial biomass, hydraulic retention time, and COD/TN using Design Expert 13 software. While keeping the other conditions unchanged, the response was plotted on the z-axis, and the coded variables were plotted on the x-axis and y-axis to obtain a three-dimensional response surface for the removal rate of nitrogen-containing pollutants. By observing the steepness of the response surface, the effect of the interaction between the factors on the removal rate of nitrogen-containing pollutants can be intuitively reflected. The greater the slope, the more significant the effect of the corresponding factor [30].
The effects of microbial biomass, hydraulic retention time, and their interactions on the removal rate of nitrogen-containing pollutants were studied when COD/TN was 16. For TN removal rate and TAN removal rate, the removal rate of related nitrogen-containing pollutants increased with the increase in microbial biomass and hydraulic retention time. However, for NO2-N removal rate, when the hydraulic retention time was constant, the NO2-N removal rate decreased with the increase of microbial biomass. Under the conditions of low microbial biomass and long reaction time, the removal rate of NO3-N was high. The response surface of the TAN removal model AC was steeper, indicating that there was a significant interaction between microbial biomass and hydraulic retention time, a finding consistent with the results of the variance analysis of the AC interaction term of the TAN removal model.
When the hydraulic retention time was 24 h, the effects of microbial biomass, COD/TN, and their interactions on the removal rate of nitrogen-containing pollutants were studied. When COD/TN was constant, the TN removal rate first increased and then decreased with the increase of microbial biomass. When the microbial biomass was 2 g/L and COD/TN was 26, the removal rates of various nitrogen-containing pollutants were at a high level.
When the microbial biomass was 2 g/L, the effects of COD/TN, hydraulic retention time, and their interactions on the removal rate of nitrogen-containing pollutants were studied. The results showed that increasing the COD/TN ratio and hydraulic retention time could improve the removal rate of various nitrogen-containing pollutants by heterotrophic microbial reactors (Figure 6).

4. Discussion

4.1. Effects of Different Carbon Sources on Water Quality Indicators of Microbial Culture Systems

Different carbon sources have significant effects on water quality indicators of heterotrophic microbial culture systems. This study showed that when sucrose, molasses, and glucose were used as carbon sources, the TAN concentration in the water body showed significant differences. The TAN peak in the sucrose group (168.3 ± 3.82 mg/L) first appeared on the 4th day, significantly earlier than the molasses group (6th day) and the glucose group (8th day), and the final removal rate was the highest (85.1%). This may be related to the molecular structure and metabolic rate of the carbon source: sucrose, as a disaccharide, needs to be hydrolyzed into monosaccharides outside the cell before being utilized, which prolongs the carbon source supply cycle and supports the continuous assimilation of TAN by heterotrophic bacteria [31,32,33], while glucose, as a monosaccharide, can be directly absorbed, and the rapid consumption in the early stage leads to an insufficient carbon source in the later stage, prolonging the TAN accumulation period and reducing the removal efficiency (Figure 3a).
The dynamic changes in NO2-N further confirm the influence of the carbon source (Figure 2b). In this study, the peak of NO2-N in each group was on the 4th day, but the NO2-N concentration in the sucrose group was lower than that in the other two experimental groups. One possible reason is that the growth rate of the bacteria that convert nitrite is lower than that of the bacteria that directly utilize TAN, and sucrose is more conducive to the growth of these bacteria, so the sucrose group obtained a better NO2-N treatment effect.
The fluctuation in NO3-N concentration reveals the regulation of carbon source on microbial nitrification and assimilation (Figure 2c). In the early stage of the experiment, TAN in the water was partially converted into NO3-N through nitrification, but its concentration did not continue to rise in the later stage of cultivation, but instead tended to stabilize or even decrease. This shows that the assimilation of heterotrophic microorganisms is dominant, especially under the condition of a sufficient carbon source (C/N = 15), the assimilation rate of heterotrophic bacteria to nitrogen exceeds the oxidation rate of nitrifying bacteria [34]. The type of carbon source can regulate the metabolic pathways of microorganisms (such as assimilation, denitrification, and DNRA), directly affecting the conversion and removal efficiency of nitrogen forms, which provides an important basis for the optimization of carbon source selection in aquaculture tailwater treatment.

4.2. Effect of Carbon Source on the Composition and Distribution of Microbial Communities

The type of carbon source has a significant effect on the composition and function of heterotrophic microbial communities. In this study, sucrose, molasses, and glucose were used as carbon sources to form different microbial community structures (Figure 4). At the phylum level, the relative abundance of Bacteroidota in the sucrose group and molasses group was significantly higher than that in the glucose group, while the abundance of Pseudomonadota in the molasses and glucose groups increased to 38.62% and 28.95%, respectively (Figure 4a). This difference may be related to the chemical properties and metabolic pathways of the added carbon source. Bacteroidota usually has complex polysaccharide degradation capabilities, and its increase in abundance may be due to the fact that the decomposition of polysaccharides requires a specific enzyme system, thereby screening out bacterial communities with efficient polysaccharide metabolism capabilities. The enrichment of Pseudomonadota (such as Proteobacteria) may be related to the rapid utilization of monosaccharides or simple carbon sources in molasses and glucose. Such carbon sources are more easily absorbed directly by facultative anaerobic or aerobic bacteria, supporting their rapid proliferation.
At the genus level, the dominant bacterial community in the sucrose group included Aequorivita, Xanthomarina, Winogradskyella, etc. (Figure 4b), which are known to be closely related to the degradation of complex organic matter and denitrification processes [35,36]. Xanthomarina has been reported to play a key role in denitrification, and its abundance is consistent with the efficient removal of nitrite nitrogen in the sucrose group [37]. In contrast, the abundance of Vibrio and Marinicella increased significantly in the molasses group, while Vibrio and Planktosalinus dominated in the glucose group. As a typical facultative anaerobe, Vibrio may have a competitive advantage in the rapid utilization of glucose, but its contribution to denitrification functional genes (such as nirK and norB) is low (Figure 5), which may lead to the relatively poor nitrogen removal efficiency of the glucose group.
Metagenomic analysis further revealed the effect of carbon source on nitrogen metabolic pathways (Figure 7). The abundance of denitrification and assimilative nitrate reduction genes (such as nirS and napAB) in the sucrose group was high, which is consistent with the functional characteristics of its dominant bacteria Aequorivita and Xanthomarina. In the molasses group, Vibrio contribution to anaerobic nitrate reduction (narGHL) was more prominent, indicating that it may convert nitrate into ammonium through the DNRA pathway rather than completely denitrifying, which explains the phenomenon of smaller fluctuations in nitrate nitrogen concentration in the molasses group (Figure 2c). These results are consistent with the results of the study by Avnimelech [38], that is, the type of carbon source directly affects the transformation pathway of nitrogen pollutants by regulating the metabolic preferences of functional bacterial communities.
The type of carbon source significantly affects the composition and denitrification performance of heterotrophic microbial communities by selecting specific functional bacterial communities and regulating their metabolic pathways. Optimizing carbon source selection (such as sucrose) can promote the enrichment of efficient denitrification bacterial communities and provide a theoretical basis for the resource-based treatment of aquaculture tailwater.

4.3. Effect of Heterotrophic Bacteria Assimilation Reactor Operating Parameters on Nitrogen-Containing Pollutant Removal

The operating parameters of a heterotrophic bacteria assimilation reactor can directly affect the removal effect of nitrogen-containing pollutants. This study showed through response surface methodology (RSM) analysis that there are complex interactions between the parameters, and their optimization needs to be comprehensively weighed in combination with synergistic and antagonistic effects.
Microbial biomass is a key factor in determining the denitrification effect. When the microbial biomass increases from 1 g/L to 2 g/L, the total nitrogen removal rate of the heterotrophic bacteria assimilation reactor is significantly improved (p < 0.05). However, when the microbial biomass continues to increase, the TN removal rate decreases instead. These results indicate that the increase in microbial biomass in a certain range is conducive to the efficient and stable operation of heterotrophic bacteria assimilation technology. However, when the microbial biomass continued to increase, the TN removal rate decreased. This phenomenon may be due to the synergistic effect of matrix confinement and quorum sensing. From the perspective of substrate limitation, with the increasing microbial biomass, the nitrogen-containing pollutants in the water body are limited as the substrate for microbial growth, and when the microbial biomass exceeds 2 g/L, it may not be able to meet the needs of microbial growth and metabolism, and the growth of microorganisms will be limited due to the lack of matrix. From the perspective of quorum sensing, microorganisms can sense crowd density and regulate their physiological behaviors through the quorum sensing mechanism. When the microbial biomass is too high, quorum sensing may change the metabolic mode and synergistic relationship of the microbial community, intensify the competition between microbial communities, and, at the same time, the dissolved oxygen consumption will become uneven, which will further affect the normal metabolic function of microorganisms, lead to the death of some microorganisms and release nitrogen-containing substances, and finally reduce the TN removal rate.
This indicates that excessive microbial biomass will lead to competition between bacterial communities and uneven consumption of dissolved oxygen. Nitrogen-containing pollutants in the water body cannot meet the needs of microbial growth, and some microorganisms die, which will release nitrogen-containing pollutants into the water body and reduce water treatment efficiency.
The interaction between hydraulic retention time and COD/TN has a nonlinear effect on denitrification efficiency. When COD/TN = 16, extending the hydraulic retention time (12 h to 36 h) significantly increased the removal rates of TAN and TN, indicating that sufficient reaction time is conducive to the full absorption and utilization of nitrogen-containing pollutants by microorganisms. However, at low COD/TN (<10), the extension of hydraulic retention time leads to a decrease in TN removal rate, indicating that under low C/N conditions, the carbon source becomes the limiting factor for denitrification. Extending HRT cannot make up for the shortage of carbon source, but instead aggravates bacterial decay and nitrogen release.
There is a threshold effect on the effect of the COD/TN ratio on denitrification efficiency. When COD/TN increases from 10 to 16, the TN removal rate increases significantly (p < 0.05); but when COD/TN > 16, the removal rate tends to stabilize. When the C/N ratio is low, the removal efficiency of TAN is limited due to the treatment system’s dependence on carbon, but as the C/N ratio increases, the TAN concentration in the influent becomes a limiting factor. Through quadratic polynomial modeling analysis, it was found that the interaction between microbial biomass and hydraulic retention time had a significant effect on the removal efficiency of nitrogen-containing pollutants (p < 0.05). The removal rate of nitrogen-containing pollutants in the high microbial biomass and high COD/TN groups was significantly higher than that in the single condition control group, indicating that the synergistic optimization of the two can break through the limitation of a single parameter. On the contrary, hydraulic retention time and COD/TN showed antagonistic effects when the carbon source was insufficient. Under low COD/TN conditions, the removal rate of nitrogen-containing pollutants remained at a low level. In order to maintain a high treatment effect of the heterotrophic bacteria assimilation reactor, the COD/TN of the water body needs to be maintained at a high level.

4.4. Resource Utilization of Bacterial Clusters

Heterotrophic bacteria assimilation technology not only effectively treats aquaculture wastewater but also shows significant potential for resource utilization, especially in the field of feed raw materials, and its application value is particularly prominent. The results showed that the crude protein content of microbial flora cultivated from different carbon sources was more than 31%, which provided a high-quality protein source for animal feed, which could be used as a feed supplement to reduce the cost of breeding. In addition, the microbial flora was found to contain a variety of active compounds, such as bromophenol, carotenoids, chlorophyll, poly-β-hydroxybutyrate (PHB), and plant sterols [39,40,41], some of which have antimicrobial properties. These active ingredients not only provide rich nutrients to the animals but also enhance their immunity and promote their healthy growth. At the same time, the probiotic components in the microbial biome can inhibit the growth of pathogenic bacteria, improve the intestinal microecological environment of animals, and improve the digestion and absorption rate of feed.

5. Conclusions

The scientific treatment of aquaculture tailwater is related to the green and sustainable development of recirculating aquaculture. In this study, heterotrophic bacteria assimilation technology was used to purify aquaculture tailwater, the optimal carbon source of heterotrophic bacteria assimilation technology was explored, and key parameters were optimized using RSM. The results showed that sucrose as a carbon source can enrich Bacteroidota and denitrifying functional bacteria (such as Xanthomarina), significantly improving the removal efficiency of ammonia nitrogen and nitrite nitrogen, which is better than molasses and glucose groups. Response surface model optimization showed that the synergistic effect of microbial biomass (2 g/L), hydraulic retention time (24 h), and COD/TN ratio (16–26) can maximize the total nitrogen removal rate (>85%). Heterotrophic bacteria assimilation technology simplifies the complex ecological network of traditional bioflocs by leading the denitrification pathway with a single functional bacterium, and the generated microbial cells (crude protein > 33%) have resource potential. This study provides theoretical support and technical paths for the green transformation of aquaculture, helping to achieve the dual goals of environmental benefits and resource recycling. To promote the application of this technology in aquaculture effluent treatment, future research needs to focus on large-scale verification of the process economy and stability of heterotrophic bacteria assimilation technology and the development of low-cost carbon sources and coupled photocatalysis or membrane separation technology.

Author Contributions

Conceptualization, T.Q. and J.S.; formal analysis, G.S. and J.X.; investigation, G.S. and H.W.; resources, H.T., T.Q. and L.Z.; data curation, G.S.; writing—original draft preparation, G.S.; writing—review and editing, G.S., J.X., Y.D., Y.W. and T.Q. All authors have read and agreed to the published version of the manuscript.

Funding

Shandong Provincial Natural Science Foundation (ZR2023QC263); the Key R&D Program of Shandong Province (2023CXGC010412); and Hainan seed industry laboratory (B23H10003).

Institutional Review Board Statement

All treatments in this study were undertaken strictly in accordance with the guidelines of the Animal Experiment Ethics Committee of Qingdao Agriculture University, which also approved the protocol in May 2020 (Approval Code: 2020-026).

Informed Consent Statement

Not applicable.

Data Availability Statement

Data are contained within the article.

Acknowledgments

The authors thank the Yantai Sanshiliwan Fishery Technology Co., Ltd., for supporting this study.

Conflicts of Interest

The authors declare no conflicts of interest.

References

  1. Audelo-Naranjo, J.M.; Martínez-Córdova, L.R.; Voltolina, D. Nitrogen budget in intensive cultures of Litopenaeus vannamei in mesocosms, with zero water exchange and artificial substrates. Rev. Biol. Mar. Oceanogr. 2010, 45, 519–524. [Google Scholar] [CrossRef]
  2. Chen, Z.; Ge, H.; Chang, Z.; Song, X.; Zhao, F.; Li, J. Nitrogen budget in recirculating aquaculture and water exchange systems for culturing Litopenaeus vannamei. J. Ocean. Univ. China 2018, 17, 905–912. [Google Scholar] [CrossRef]
  3. Xu, J.; Qiu, T.; Chen, F.; Zhou, L.; Du, Y.; Sun, J. Nitrogen migration law and recycling strategy in an innovative recirculating aquaculture system: Enhancing performance through electrocoagulation. J. Water Process Eng. 2022, 50, 103275. [Google Scholar] [CrossRef]
  4. Van Rijn, J. Waste treatment in recirculating aquaculture systems. Aquac. Eng. 2013, 53, 49–56. [Google Scholar] [CrossRef]
  5. Khudyia, O.; Marchenkob, M.; Chebanc, L.; Khudad, L.; Kushniryke, O.; Malishchuk, I. Recirculating aquaculture systems waste water as a medium for increase of phytoplankton and zooplankton biomass. Int. Lett. Nat. Sci. 2016, 54, 1–7. [Google Scholar] [CrossRef]
  6. Wu, Y.; Song, K. Source, treatment, and disposal of aquaculture solid waste: A review. J. Environ. Eng. 2021, 147, 03120012. [Google Scholar] [CrossRef]
  7. Smol, M. Circular economy in wastewater treatment plant—Water, energy and raw materials recovery. Energies 2023, 16, 3911. [Google Scholar] [CrossRef]
  8. Areniello, M.; Matassa, S.; Esposito, G.; Lens, P.N. Biowaste upcycling into second-generation microbial protein through mixed-culture fermentation. Trends Biotechnol. 2023, 41, 197–213. [Google Scholar] [CrossRef]
  9. Rahimi, S.; Modin, O.; Mijakovic, I. Technologies for biological removal and recovery of nitrogen from wastewater. Biotechnol. Adv. 2020, 43, 107570. [Google Scholar] [CrossRef]
  10. Gouzy, A.; Poquet, Y.; Neyrolles, O. Nitrogen metabolism in Mycobacterium tuberculosis physiology and virulence. Nat. Rev. Microbiol. 2014, 12, 729–737. [Google Scholar] [CrossRef]
  11. Kumar, R.; Shimizu, K. Transcriptional regulation of main metabolic pathways of cyoA, cydB, fnr, and fur gene knockout Escherichia coli in C-limited and N-limited aerobic continuous cultures. Microb. Cell Factories 2011, 10, 3. [Google Scholar] [CrossRef]
  12. Di Capua, F.; Pirozzi, F.; Lens, P.N.; Esposito, G. Electron donors for autotrophic denitrification. Chem. Eng. J. 2019, 362, 922–937. [Google Scholar] [CrossRef]
  13. Wang, T.; Li, X.; Wang, H.; Xue, G.; Zhou, M.; Ran, X.; Wang, Y. Sulfur autotrophic denitrification as an efficient nitrogen removals method for wastewater treatment towards lower organic requirement: A review. Water Res. 2023, 245, 120569. [Google Scholar] [CrossRef]
  14. Francis, C.A.; Beman, J.M.; Kuypers, M.M. New processes and players in the nitrogen cycle: The microbial ecology of anaerobic and archaeal ammonia oxidation. ISME J. 2007, 1, 19–27. [Google Scholar] [CrossRef]
  15. Winkler, M.K.; Straka, L. New directions in biological nitrogen removal and recovery from wastewater. Curr. Opin. Biotechnol. 2019, 57, 50–55. [Google Scholar] [CrossRef]
  16. Panigrahi, A.; Sundaram, M.; Chakrapani, S.; Rajasekar, S.; Syama Dayal, J.; Chavali, G. Effect of carbon and nitrogen ratio (C:N) manipulation on the production performance and immunity of Pacific white shrimpLitopenaeus vannamei(Boone, 1931) in a biofloc-based rearing system. Aquac. Res. 2018, 50, 29–41. [Google Scholar] [CrossRef]
  17. Ray, S.; Scholz, M.; Haritash, A. Kinetics of carbon and nitrogen assimilation by heterotrophic microorganisms during wastewater treatment. Environ. Monit. Assess. 2019, 191, 1–11. [Google Scholar] [CrossRef] [PubMed]
  18. Zhao, C.; Jiao, T.; Zhang, W.; Guo, Y.; Han, F.; Lei, J.; Zhou, W. Carbon sources influence on heterotrophic ammonia assimilation: Performance and mechanism. Chem. Eng. J. 2024, 497, 154545. [Google Scholar] [CrossRef]
  19. Xie, Y.; Zhang, W.; Jiang, J.; Li, Y.; Tong, L.; Yang, G. A Continuous Plug-Flow Anaerobic-Multistage Anoxic/Aerobic Process Treating Low-C/N Domestic Sewage: Nutrient Removal, Greenhouse Gas Emissions, and Microbial Community Analysis. Sustainability 2024, 16, 3993. [Google Scholar] [CrossRef]
  20. Fugimura, M.M.S.; dos Reis Flor, H.; de Melo, E.P.; da Costa, T.V.; Wasielesky, W.; Oshiro, L.M.Y. Brewery residues as a source of organic carbon in Litopenaeus schmitti white shrimp farms with BFT systems. Aquac. Int. 2015, 23, 509–522. [Google Scholar] [CrossRef]
  21. Khanjani, M.H.; Sajjadi, M.M.; Alizadeh, M.; Sourinejad, I. Nursery performance of Pacific white shrimp (Litopenaeus vannamei Boone, 1931) cultivated in a biofloc system: The effect of adding different carbon sources. Aquac. Res. 2017, 48, 1491–1501. [Google Scholar] [CrossRef]
  22. Verma, A.; Rani, A.B.; Rathore, G.; Saharan, N.; Gora, A.H. Growth, non-specific immunity and disease resistance of Labeo rohita against Aeromonas hydrophila in biofloc systems using different carbon sources. Aquaculture 2016, 457, 61–67. [Google Scholar] [CrossRef]
  23. Abakari, G.; Luo, G.; Kombat, E.O.; Alhassan, E.H. Supplemental carbon sources applied in biofloc technology aquaculture systems: Types, effects and future research. Rev. Aquac. 2020, 13, 1193–1222. [Google Scholar] [CrossRef]
  24. Emerenciano, M.; Gaxiola, G.; Cuzon, G. Biofloc Technology (BFT): A Review for Aquaculture Application and Animal Food Industry; IntechOpen: London, UK, 2013. [Google Scholar]
  25. Zhang, N.; Luo, G.; Tan, H.; Liu, W.; Hou, Z. Growth, digestive enzyme activity and welfare of tilapia (Oreochromis niloticus) reared in a biofloc-based system with poly-β-hydroxybutyric as a carbon source. Aquaculture 2016, 464, 710–717. [Google Scholar] [CrossRef]
  26. AOAC. Official Methods of Analysis of the Association of Official Analytical Chemists; AOAC: Washington, DC, USA, 2019. [Google Scholar]
  27. Bezerra, M.A.; Santelli, R.E.; Oliveira, E.P.; Villar, L.S.; Escaleira, L.A. Response surface methodology (RSM) as a tool for optimization in analytical chemistry. Talanta 2008, 76, 965–977. [Google Scholar] [CrossRef]
  28. Bhatt, P.; Huang, J.-Y.; Brown, P.; Shivaram, K.B.; Yakamercan, E.; Simsek, H. Electrochemical treatment of aquaculture wastewater effluent and optimization of the parameters using response surface methodology. Environ. Pollut. 2023, 331, 121864. [Google Scholar] [CrossRef] [PubMed]
  29. Xu, J.; Du, Y.; Su, G.; Wang, H.; Zhang, J.; Tian, H.; Zhou, L.; Qiu, T.; Sun, J. Application of a U-Tube Oxygenator in a Litopenaeus vannamei Recirculating Aquaculture System: Efficiency and Management Models. Water 2023, 15, 4019. [Google Scholar] [CrossRef]
  30. Mirzoyan, N.; Parnes, S.; Singer, A.; Tal, Y.; Sowers, K.; Gross, A. Quality of brackish aquaculture sludge and its suitability for anaerobic digestion and methane production in an upflow anaerobic sludge blanket (UASB) reactor. Aquaculture 2008, 279, 35–41. [Google Scholar] [CrossRef]
  31. Lu, J.; Tan, Y.; Tian, S.; Qin, Y.; Zhou, M.; Hu, H.; Zhao, X.; Wang, Z.; Hu, B. Effect of carbon source on carbon and nitrogen metabolism of common heterotrophic nitrification-aerobic denitrification pathway. Chemosphere 2024, 361, 142525. [Google Scholar] [CrossRef]
  32. Fu, W.; Song, G.; Wang, Y.; Wang, Q.; Duan, P.; Liu, C.; Zhang, X.; Rao, Z. Advances in research into and applications of heterotrophic nitrifying and aerobic denitrifying microorganisms. Front. Environ. Sci. 2022, 10, 887093. [Google Scholar] [CrossRef]
  33. Ma, S.; Huang, S.; Tian, Y.; Lu, X. Heterotrophic ammonium assimilation: An important driving force for aerobic denitrification of Rhodococcus erythropolis strain Y10. Chemosphere 2022, 291, 132910. [Google Scholar] [CrossRef] [PubMed]
  34. Martikainen, P.J. Heterotrophic nitrification–An eternal mystery in the nitrogen cycle. Soil Biol. Biochem. 2022, 168, 108611. [Google Scholar] [CrossRef]
  35. Yao, J.; Li, W.; Ou, D.; Lei, L.; Asif, M.; Liu, Y. Performance and granular characteristics of salt-tolerant aerobic granular reactors response to multiple hypersaline wastewater. Chemosphere 2021, 265, 129170. [Google Scholar] [CrossRef] [PubMed]
  36. Kurilenko, V.V.; Romanenko, L.A.; Isaeva, M.P.; Svetashev, V.I.; Mikhailov, V.V. Winogradskyella algae sp. nov., a marine bacterium isolated from the brown alga. Antonie Leeuwenhoek 2019, 112, 731–739. [Google Scholar] [CrossRef]
  37. Li, Z.; Wang, Z.; Cai, S.; Lin, L.; Huang, G.; Hu, Z.; Jin, W.; Zheng, Y. Effects of light intensity and salinity on formation and performance of microalgal-bacterial granular sludge. Bioresour. Technol. 2023, 386, 129534. [Google Scholar] [CrossRef]
  38. Avnimelech, Y. Carbon/nitrogen ratio as a control element in aquaculture systems. Aquaculture 1999, 176, 227–235. [Google Scholar] [CrossRef]
  39. Zhang, K.; Pan, L.; Chen, W.; Wang, C. Effect of using sodium bicarbonate to adjust the pH to different levels on water quality, the growth and the immune response of shrimp Litopenaeus vannamei reared in zero-water exchange biofloc-based culture tanks. Aquac. Res. 2017, 48, 1194–1208. [Google Scholar] [CrossRef]
  40. Ju, Z.Y.; Forster, I.; Conquest, L.; Dominy, W.; Kuo, W.C.; David Horgen, F. Determination of microbial community structures of shrimp floc cultures by biomarkers and analysis of floc amino acid profiles. Aquac. Res. 2008, 39, 118–133. [Google Scholar] [CrossRef]
  41. Ahmad, I.; Babitha Rani, A.; Verma, A.; Maqsood, M. Biofloc technology: An emerging avenue in aquatic animal healthcare and nutrition. Aquac. Int. 2017, 25, 1215–1226. [Google Scholar] [CrossRef]
Figure 1. Heterotrophic microbial assimilation treatment device.
Sustainability 17 05069 g001
Figure 2. Changes in water quality of heterotrophic microbial culture systems under different carbon sources: (a) TAN; (b) NO2-N; (c) NO3-N. Note: The line indicates the mean value ± error.
Sustainability 17 05069 g002aSustainability 17 05069 g002b
Figure 3. Dynamic changes in total suspended solids concentration (a) and floc sedimentation volume (b) under different carbon source species. Note: The line indicates the mean value ± error.
Sustainability 17 05069 g003
Figure 4. The horizontal community structure of heterotrophic microorganisms at the phylum (a) and genus (b) levels.
Sustainability 17 05069 g004
Figure 5. The contribution of heterotrophic microorganisms at the species level to nitrogen functional genes.
Sustainability 17 05069 g005
Figure 6. Response surface of the nitrogen-containing pollution removal model, (ac) the relationship between TN removal rate and factors, (df) the relationship between TAN removal rate and factors, (gi) the relationship between NO2-N removal rate and factors, and (jl) the relationship between NO3-N removal rate and factors.
Sustainability 17 05069 g006aSustainability 17 05069 g006b
Figure 7. Nitrogen metabolism pathway.
Sustainability 17 05069 g007
Table 1. Response surface experiment factors and level values.
FactorsLevels
−10+1
X1: Microbial concentration, g/L123
X2: Hydraulic retention time, h122436
X3: COD/TN61626
Table 2. Design and experimental results of response surface-centered combinations.
RunFactorsResponse
X1X2X3Y1Y2Y3Y4
12241664797149
23241664715644
31241645557759
42241680778158
52361682868954
62241683747738
7336660435230
82241665767642
9112620172213
10312636231115
112241675708140
122121648695530
13136650444760
14224666483133
153122666766237
162241674787849
171362667719373
181122644417732
193362684869248
202242688718647
Table 3. Water quality of the recirculating aquaculture system and tailwater sedimentation tank.
IndexesTailwater Sedimentation TankRAS
TAN (mg/L)147 ± 6.35 a1.165 ± 0.47 b
NO2-N (mg/L)2.1 ± 0.56 a0.4607 ± 0.14 b
NO3-N (mg/L)16.63 ± 0.64 a97.163 ± 14.38 b
TN (mg/L)217.47 ± 11.52 a175.37 ± 9.63 b
DO (mg/L)0.43 ± 0.16 a10.47 ± 1.32 b
pH7.15 ± 0.2 a7.34 ± 0.3 a
Note: Different letters in the same column indicate significant differences between groups (p < 0.05), and the same letters indicate no significant differences between groups (p > 0.05).
Table 4. Crude protein, crude fat, and crude ash content of microorganisms in the different treatment groups.
IndexesSucMlsGlu
Crude protein (%)33.47 ± 0.31 a32.71 ± 0.23 b31.53 ± 0.45 c
Crude fat (%)3.95 ± 0.18 a3.57 ± 0.13 b3.35 ± 0.22 b
Crude ash (%)23.53 ± 0.14 a22.15 ± 0.17 b21.37 ± 0.57 c
Note: Different letters in the same column indicate significant differences between groups (p < 0.05), and the same letters indicate no significant differences between groups (p > 0.05).
Table 5. Results of the ANOVA of the response surface method.
Response ValueR2R2AdjPred-R2CV (%)Prob > FAP
Y10.94240.89060.87329.39<0.000116.9032
Y20.9790.96010.83956.42<0.000125.0467
Y30.97170.94630.85348.25<0.000122.7513
Y40.92870.86450.875212.880.000115.0398
Table 6. The equations of nitrogen contaminant removal.
ParametersNitrogen Contaminant Removal Equation
(mg/L)
TN=−80.04364 + 78.91364X1 + 3.88447 X2 − 0.400909 X3
−0.114583X1X2 + 0.162500X1X3 − 0.013542X2X3
−17.59091X12 − 0.049242X22 + 0.049091X32
TAN=−64.16545 + 53.39545X1 + 0.757955X2 + 5.75364X3
−0.28125X1X2 + 0.5625X1X3 − 0.007292X2X3
−12.13636X12 + 0.016414X22 − 0.156364X32
NO2-N=−38.48000 + 12.20000X1 + 0.92500X2 + 7.54000X3
+0.31250X1X2 − 0.12500X1X3 − 0.020833X2X3
−5.50000X12 + 7.85369 × 10−17X22 − 0.13500X32
NO3-N=−35.00364 − 10.03636X1 + 4.30530X2 + 3.17909X3
−0.645833X1X2 + 0.10000X1X3 − 0.010417X2X3
+4.40909X12 − 0.035354X22 − 0.070909X32
Note: X1, X2, and X3 represent microbial biomass (g/L), HRT (h), and COD/TN, respectively. Positive values produce synergistic effects, while negative values produce antagonistic effects.
Disclaimer/Publisher’s Note: The statements, opinions and data contained in all publications are solely those of the individual author(s) and contributor(s) and not of MDPI and/or the editor(s). MDPI and/or the editor(s) disclaim responsibility for any injury to people or property resulting from any ideas, methods, instructions or products referred to in the content.

