Article

Study on the Coupling Degree of Urban Virtual and Substantive Vitality from the Perspective of “Scale-Vitality”—Taking the Changsha-Zhuzhou-Xiangtan Metropolitan Area as an Example

School of Architecture and Urban Planning, Hunan City University, Yiyang 413000, China
*
Author to whom correspondence should be addressed.
Sustainability 2025, 17(11), 5059; https://doi.org/10.3390/su17115059
Submission received: 6 April 2025 / Revised: 19 May 2025 / Accepted: 27 May 2025 / Published: 30 May 2025
(This article belongs to the Section Sustainable Urban and Rural Development)

Abstract

Investigating the coupling coordination between urban scale and vitality is critical for enhancing holistic urban development quality and advancing sustainability. Taking the Changsha-Zhuzhou-Xiangtan (ChangZhuTtan) metropolitan area as a case study, this research integrates multi-source raster and vector data to: (1) analyze spatial patterns of urban scale and virtual–substantive vitality; (2) delineate a “scale-vitality” hierarchical zonal structure; (3) quantify coupling relationships across subzones; and (4) propose synergistic spatial optimization strategies. Key findings reveal that, distinct core-periphery structure characterizes urban scale and vitality, with Changsha’s central districts dominating population, land use, and economic metrics, while Zhuzhou and Xiangtan exhibit moderate concentrations. Significant positive correlations exist between urban scale and dual vitality types, with scale-driven vitality enhancement being most pronounced in core agglomeration zones. Furthermore, in the metropolitan core, where both urban scale and vitality values are high, they exhibit a high-value coupling state. As they expanded outward, both metrics gradually decreased, resulting in a low-value coupling state. However, zonal comparisons (core agglomeration circle–peripheral expansion circle) reveal that the proportion of spatially coupled units progressively increases. By elucidating scale-vitality coupling in the ChangZhuTtan metropolitan area, this study provides actionable insights for spatial planning and sustainable urban transition. The methodology framework is replicable for similar metropolitan regions globally.

1. Introduction

The term “vitality” originates from biology, referring broadly to the capacity of an organism to survive and develop. It was later introduced into urban planning to denote the endogenous driving force of urban development [1]. Academic definitions of urban vitality are diverse [2,3,4] but can generally be summarized as the endogenous capacity for urban survival and development. In 2022, to advance new people-oriented urbanization, China’s National Development and Reform Commission (NDRC) issued the *Implementation Plan for New Urbanization During the 14th Five-Year Plan Period* [5]. However, rapid urbanization has also led to challenges such as “ghost cities”, decaying historic districts, traffic congestion, job-housing spatial mismatch, social segregation, and insufficient inclusivity [6], which have raised national concerns. As a spatial manifestation of high-quality urban development and residents’ quality of life, urban vitality has garnered significant societal attention [7,8]. Tong M. research demonstrated that higher urban vitality enhances attractiveness to talent and capital, thereby strengthening urban competitiveness [9]. Consequently, analyzing the coupling relationship between urban scale and spatial vitality is critical for rational urban spatial planning and holistic vitality enhancement.
The spatial distribution characteristics and influencing factors of urban vitality remain key research foci. Following critiques of modernist functional zoning [10], Jane Jacobs (1961) pioneered the integration of ’vitality’ into urban planning [11]. Subsequent studies explored relationships between urban vitality and cultural, policy, and morphological factors: Jacobs J. identified cultural diversity as a catalyst for vitality [12]; Still et al. found parking restrictions detrimental to urban attractiveness [13]; and Ye et al. demonstrated the vitality-enhancing effects of linear urban forms (e.g., street blocks) [14]. With urbanization and economic transitions, research on urban vitality has increasingly adopted interdisciplinary approaches spanning sociology, urban-rural planning, geography, and sub-disciplines. Methodologically, hybrid frameworks integrating geographically weighted regression, and fuzzy matter–element methods have emerged [1,15]. Thematically, studies primarily focus on the three following aspects: assessment and measurement of urban vitality; strategies for enhancing spatial vitality quality; and influencing factors of spatial vitality [16]. Researchers have developed evaluation frameworks from the perspectives of crowd sentiment, talent innovation, and population vitality cores [17,18,19], proposed spatial vitality enhancement strategies through urban morphology, material–virtual vitality integration, and human–environment interactions [20,21,22], and investigated influencing factors through built environment elements like urban morphogenesis, urban road networks, and service facilities [23,24,25]. Current research predominantly concentrates on analyzing characteristics and determinants of physical urban vitality. However, in the post-consumption era marked by rapid digital flow development, digital media has emerged as a crucial vitality generator. The rise in social platforms like TikTok and Xiaohongshu has partially redefined traditional spatial location values and accessibility. Consequently, the “information flow”-driven virtual vitality exerts significant catalytic effects on physical urban vitality, becoming an essential component of spatial vitality evaluation. This necessitates simultaneous consideration of both physical vitality in material space and virtual vitality under digital influence.
Existing literature demonstrates substantial progress in measuring physical vitality, its spatial patterns, and influencing factors. Nevertheless, research on virtual vitality remains insufficiently explored. Although some scholars (e.g., Yang M. et al. Jiang H. et al.) have examined spatial differentiation of virtual vitality and developed integrated evaluation frameworks combining physical–virtual dimensions [26,27], the coupling relationship between virtual–physical vitality and urban scale requires further investigation. Urban scale refers to the quantitative differentiation and hierarchical organization of aggregated materials and elements within urban spatial domains. Drawing on the conceptual frameworks of Liu L. et al. and Li Y. et al., urban scale is generally regarded as an organic composition of population scale, land use scale, and economic scale [28,29]. These are specifically manifested in three aspects: population density, land use value, and economic agglomeration.
Population Density: As a fundamental metric reflecting the concentration of human capital, higher density indicates greater efficiency in resource allocation and functional diversity within the area.
Land Use Value: Representing the density of spatial capital, high land use value signifies concentrated infrastructure investment and diversified functional layouts.
Economic Agglomeration: Reflecting the density of economic activities, stronger agglomeration demonstrates higher frequency of urban economic interactions.
It is well known that appropriate scale promotes urban development. Therefore, investigating the coupling relationship between urban virtual–substantive vitality and urban scale is essential for enhancing holistic urban development quality.
This study focuses on the Changsha-Zhuzhou-Xiangtan metropolitan area (hereinafter referred to as ChangZhuTan), encompassing three cities: Changsha (28.228° N, 112.939° E), Zhuzhou (27.830° N, 113.133° E), and Xiangtan (27.853° N, 112.944° E). It aims to address four key research questions:
  • What spatial distribution patterns characterize virtual–physical vitality in the ChangZhuTan metropolitan area?
  • Does urban scale correlate with virtual–physical vitality, and do these correlations differ between the two vitality types?
  • How does the coupling relationship manifest between urban scale and urban vitality?
  • What spatial variations exist in the scale-vitality coupling degree across different subregions of the metropolitan area?
Potential academic contributions of this research include:
  • Addressing the knowledge gap in scale-vitality coupling mechanisms within metropolitan contexts.
  • Advancing urban virtual space studies by integrating urban scale with both virtual and physical vitality dimensions.
  • Filling the research void regarding virtual–physical vitality interactions in the ChangZhuTan metropolitan area.
Situated within the context of digital economic development and grounded in the dual realities of synchronous urban virtual–physical vitality growth, this investigation employs the ChangZhuTan metropolitan area as a representative case. Through analyzing spatial patterns of urban vitality under digital transformation and measuring their coupling degree with urban scale, the study ultimately proposes effective strategies for sustainable development in metropolitan regions.

2. Overview of the Study Area and Data Sources

2.1. Overview of the Study Area

As a regional spatial organization characterized by a core metropolis supplemented by multiple medium-small cities, metropolitan areas typically feature a crucial “one-hour transportation radius” [30]. Situated in central-eastern Hunan Province, south of China’s Yangtze River, the ChangZhuTan metropolitan area spans 18,900 square kilometers. Since Hunan Province initially proposed its development in 2006, ChangZhuTan has evolved into a regional growth pole, recording a permanent population of 14.84 million and a GDP of CNY 1.79 trillion in 2021, accounting for approximately 40% of Hunan’s provincial total. Following the National Development and Reform Commission’s official approval of its development plan in 2022, ChangZhuTan became central China’s first national-level metropolitan area [31]. Recent scholarship emphasizes the critical role of revitalizing metropolitan vitality for advancing late-stage urbanization [32].
Nevertheless, existing research inadequately addresses virtual–physical vitality dynamics in ChangZhuTan. Given its strategic importance in national economic development and policy integration under China’s high-quality urbanization paradigm, systematic investigation of ChangZhuTan’s urban vitality becomes imperative for fostering regional coordinated development. The study scope aligns with the ChangZhuTan metropolitan area development plan [33], covering: Changsha’s entire administrative area, Zhuzhou’s central urban districts and Liling City, Xiangtan’s central urban districts, Shaoshan City, and Xiangtan County (as delineated in Figure 1).

2.2. Data Sources

This study utilizes multi-source datasets comprising:
Social media engagement data: Browse counts and check-in records from Douyin (China’s predominant short-video platform), obtained via the NewRank Platform (https://xd.newrank.cn), December 2024. These metrics, respectively, reflect virtual attention and physical visitation intensities.
POI data: 14-category point-of-interest information (life services, leisure entertainment, cultural education, etc.) sourced from Amap Open Platform (https://lbs.amap.com (accessed on 27 December 2024)), 2024.
Nighttime light data: NPP-VIIRS satellite imagery (500-m resolution) from Harvard Dataverse (https://dataverse.harvard.edu (accessed on 15 February 2025)), 2024.
Socioeconomic grids: 1 km resolution population and GDP spatial data from Geospatial Data Cloud (http://www.gisrs.cn (accessed on 15 February 2025)), 2024.
Built environment data: Building footprints extracted through Google Earth imagery analysis (https://www.google.cn/intl/zh-en/earth (accessed on 15 February 2025)) [34], 2024.
All datasets were projected into the WGS 1984 UTM Zone 49N coordinate system for spatial consistency.

3. Research Methodology and Framework Construction

3.1. Variable Selection

Urban vitality is conceptualized through virtual and substantive dimensions:
(1)
Virtual Vitality Measurement
Virtual vitality can be regarded as the information vitality generated by the population’s use of data resources and virtual interaction in Cyberspace (non-real space). In the digital era, spatial proximity no longer constrains vitality generation. Online interactions are fundamentally reshaping traditional physical social engagements, necessitating innovative metrics for virtual vitality assessment. Following Jiang H. et al.’s methodology in Guangzhou’s vitality studies [29], virtual vitality is quantified through a weighted composite index (7:3 ratio) of Douyin check-ins and view counts. Elevated values within a spatial unit indicate stronger public engagement and higher virtual vitality.
(2)
Substantive Vitality Measurement
Substantive vitality can be regarded as the degree of activity and sustainability of the economic and social activities of the population in the physical world. Building on Shan R. et al.’s framework [35], substantive vitality comprises three components:
-
Social vitality: Measured by shopping facility density (POI data), where higher concentrations signify active human flows [36].
-
Economic vitality: Represented by NPP-VIIRS night-time light intensity, with brighter pixels indicating stronger economic activity [25].
-
Cultural vitality: Evaluated through cultural facility density (POI data), where greater spatial clustering reflects enhanced cultural engagement [37].
Following Wang N. et al.’s normalization protocol [37], these three dimensions are standardized (eliminating unit disparities) and averaged to derive comprehensive substantive vitality scores.
(3)
Urban Scale Quantification
Consistent with established metrics [29], urban scale is operationalized through:
-
Population scale: Population density (persons/km2)
-
Land use scale: Total built-up area (m2)
-
Economic scale: GDP grid values (CNY 10,000/km2)
All parameters undergo min–max normalization before being aggregated into a composite urban scale index through equal-weighted averaging (see Table 1).

3.2. Research Methods

3.2.1. GIS Spatial Analysis Method

The study employed spatial analysis tools in ArcGIS 10.2.2, including grid analysis and Natural Breaks classification, for data preprocessing. Grid size selection critically influenced analytical outcomes, prompting systematic comparisons across the following four resolutions (500 m, 1000 m, 1500 m, 3000 m): 500 m grids: delineated clear spatial patterns but introduced raster data fragmentation; 1000 m grids: balanced spatial detail preservation with coherent regional representation; 1500 m grids: exhibited over-smoothed boundary transitions despite acceptable clarity; 3000 m grids: overgeneralized spatial heterogeneity, obscuring localized features.
Comparative analysis revealed that 1 km × 1 km grids optimally reconciled data precision (original raster resolution: 500 m–1 km) with analytical requirements. This resolution generated 19,542 valid grids that effectively captured the study area’s spatial characteristics while maintaining computational efficiency.

3.2.2. Correlation Analysis

Pearson correlation coefficient method is a common parametric statistical method, mostly used to analyze the correlation relationship between variables, and then accurately reflect the degree of linear correlation between variables through the correlation coefficient. The correlation coefficient r ranges between −1 and 1, when the absolute value of r is closer to 1, it indicates that the correlation between the two variables is stronger; conversely, when it is weaker, the method is more common. The specific steps will not be repeated.

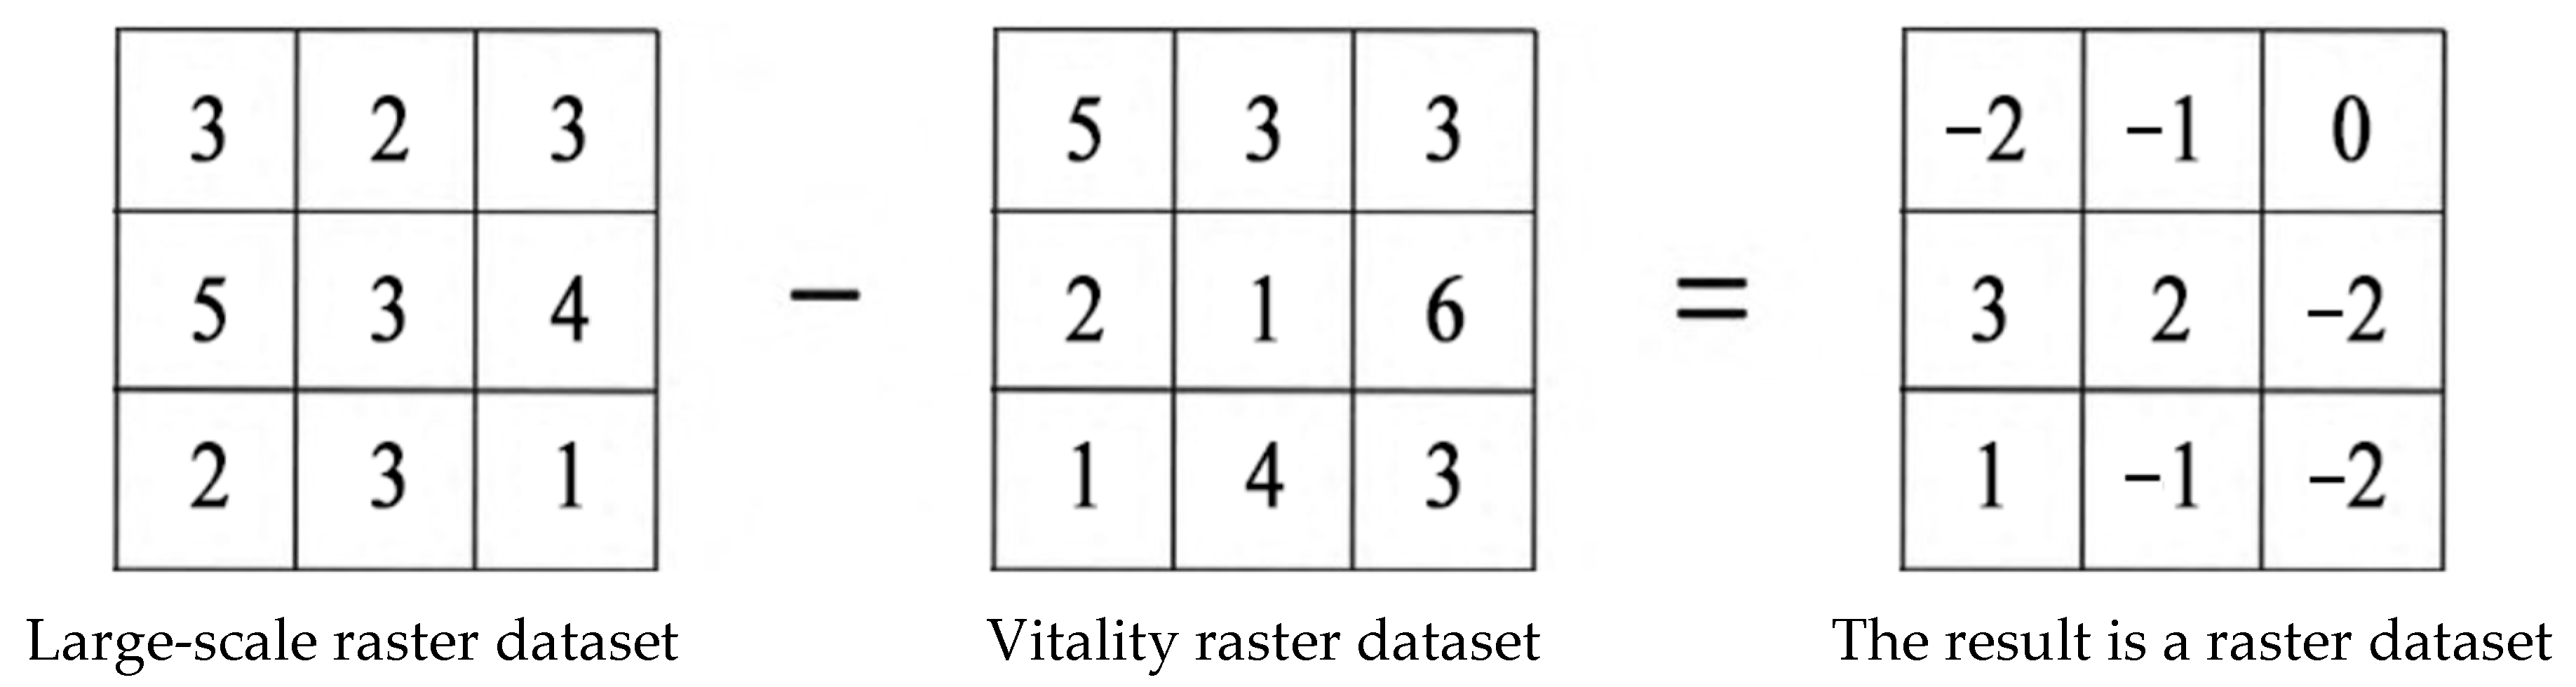
3.2.3. Coupling Co-Ordination Degree Model Construction

The difference between the grid of scale and the grid of active kernel density is measured by using the map algebra method to reflect the coupling relationship of spatial elements [38]. To eliminate the influence of dimensions on the data coupling results, dimensionless normalization processing is performed on the data before calculation. The formula is as follows:
C i = U i V i
U i = u u m i n u m a x u m i n
V i = ν ν m i n ν m a x ν m i n
In the formula: C i represents the spatial matching degree between the city’s scale and its vitality; U i is the normalized value of the kernel density of the city size within the region; V i is the normalized value of the kernel density of urban vitality within the region. The closer the absolute value of C i is to 0, the higher the coupling degree between the two is (Figure 2).

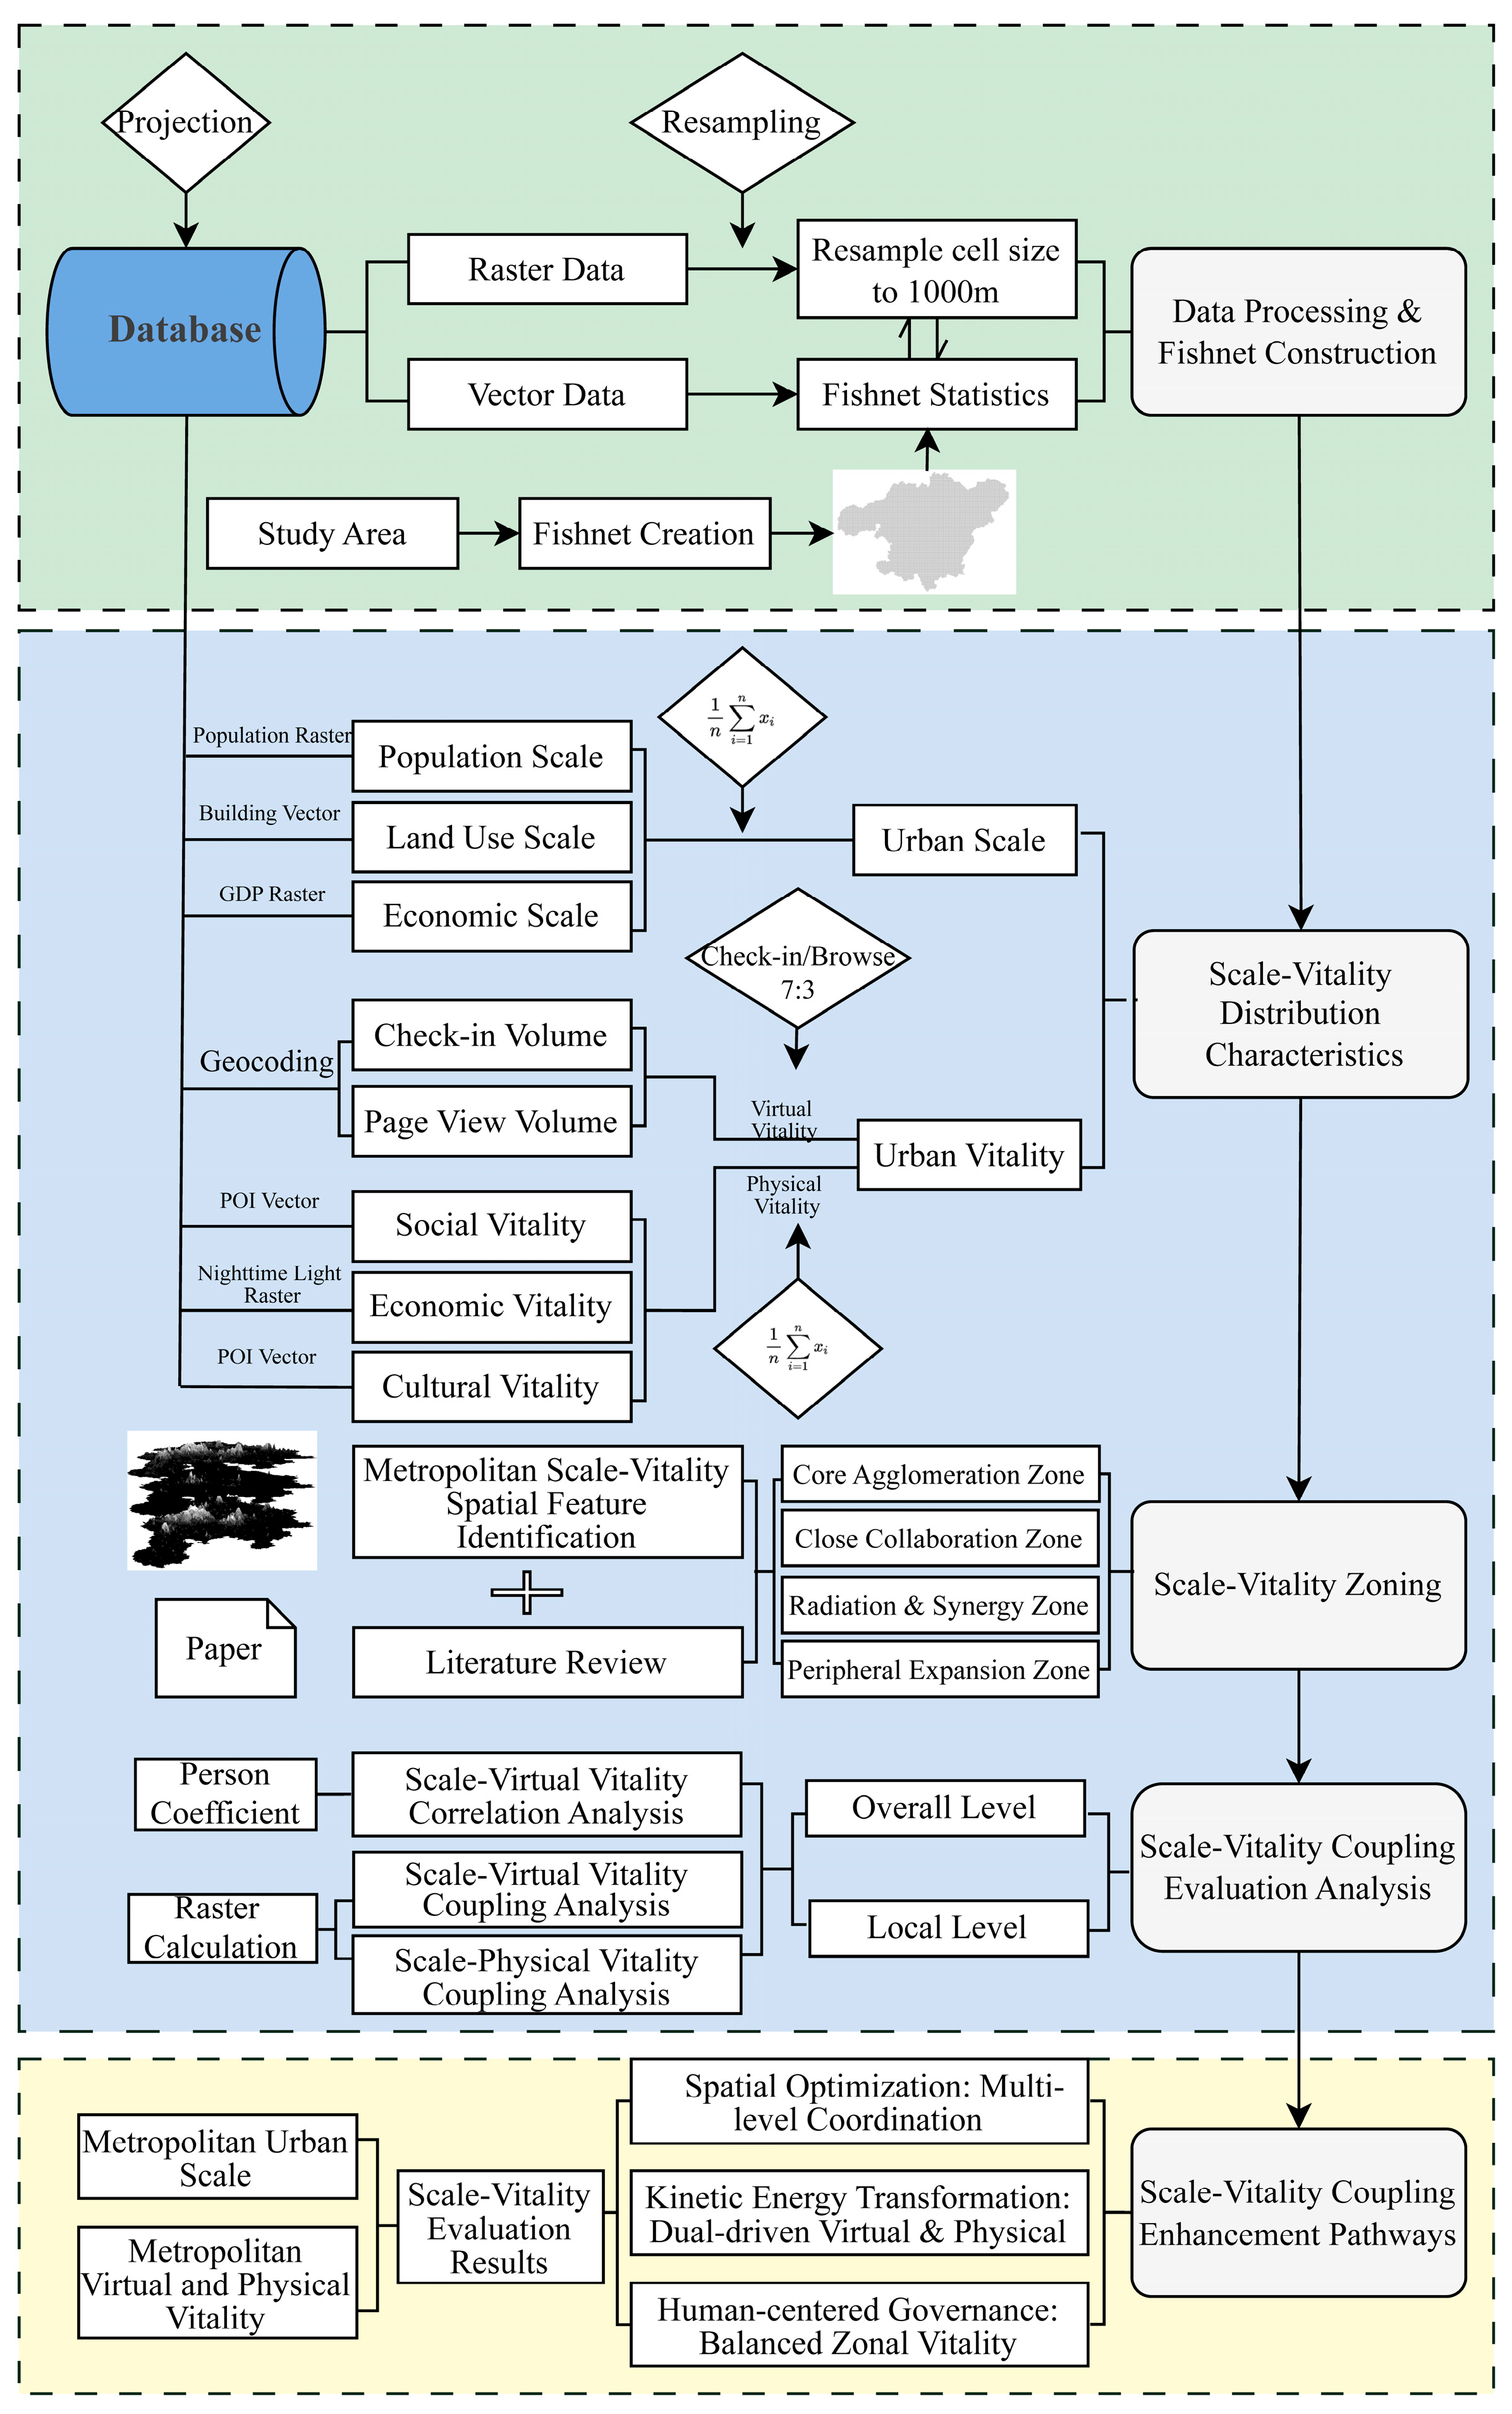
3.3. Research Framework

Based on the dual-system coupling framework of “scale-vitality”, this study adopts multi-source spatial, temporal data, and spatial measurement methods to analyze the spatial pattern of urban scale and vitality characteristics of ChangZhuTan metropolitan area. Firstly, a standardized database is constructed with the help of population raster and building vector data. Secondly, the natural breakpoint method is used to classify the scale and vitality levels, reveal the spatial differentiation characteristics of “core-edge”, and delineate the four major circles in accordance with the ChangZhuTan metropolitan area development plan. By calculating Person’s correlation coefficient, the correlation strength between scale and real and virtual vitality is investigated, in general and local areas. The spatial coupling is visualized by ArcGIS raster calculation to identify the areas of “scale ahead vitality lagging” or “vitality ahead scale shortage”. Finally, based on the results of the coupling analysis, the optimization path of metropolitan area coupling is proposed (Figure 3).

4. Analysis of Empirical Results

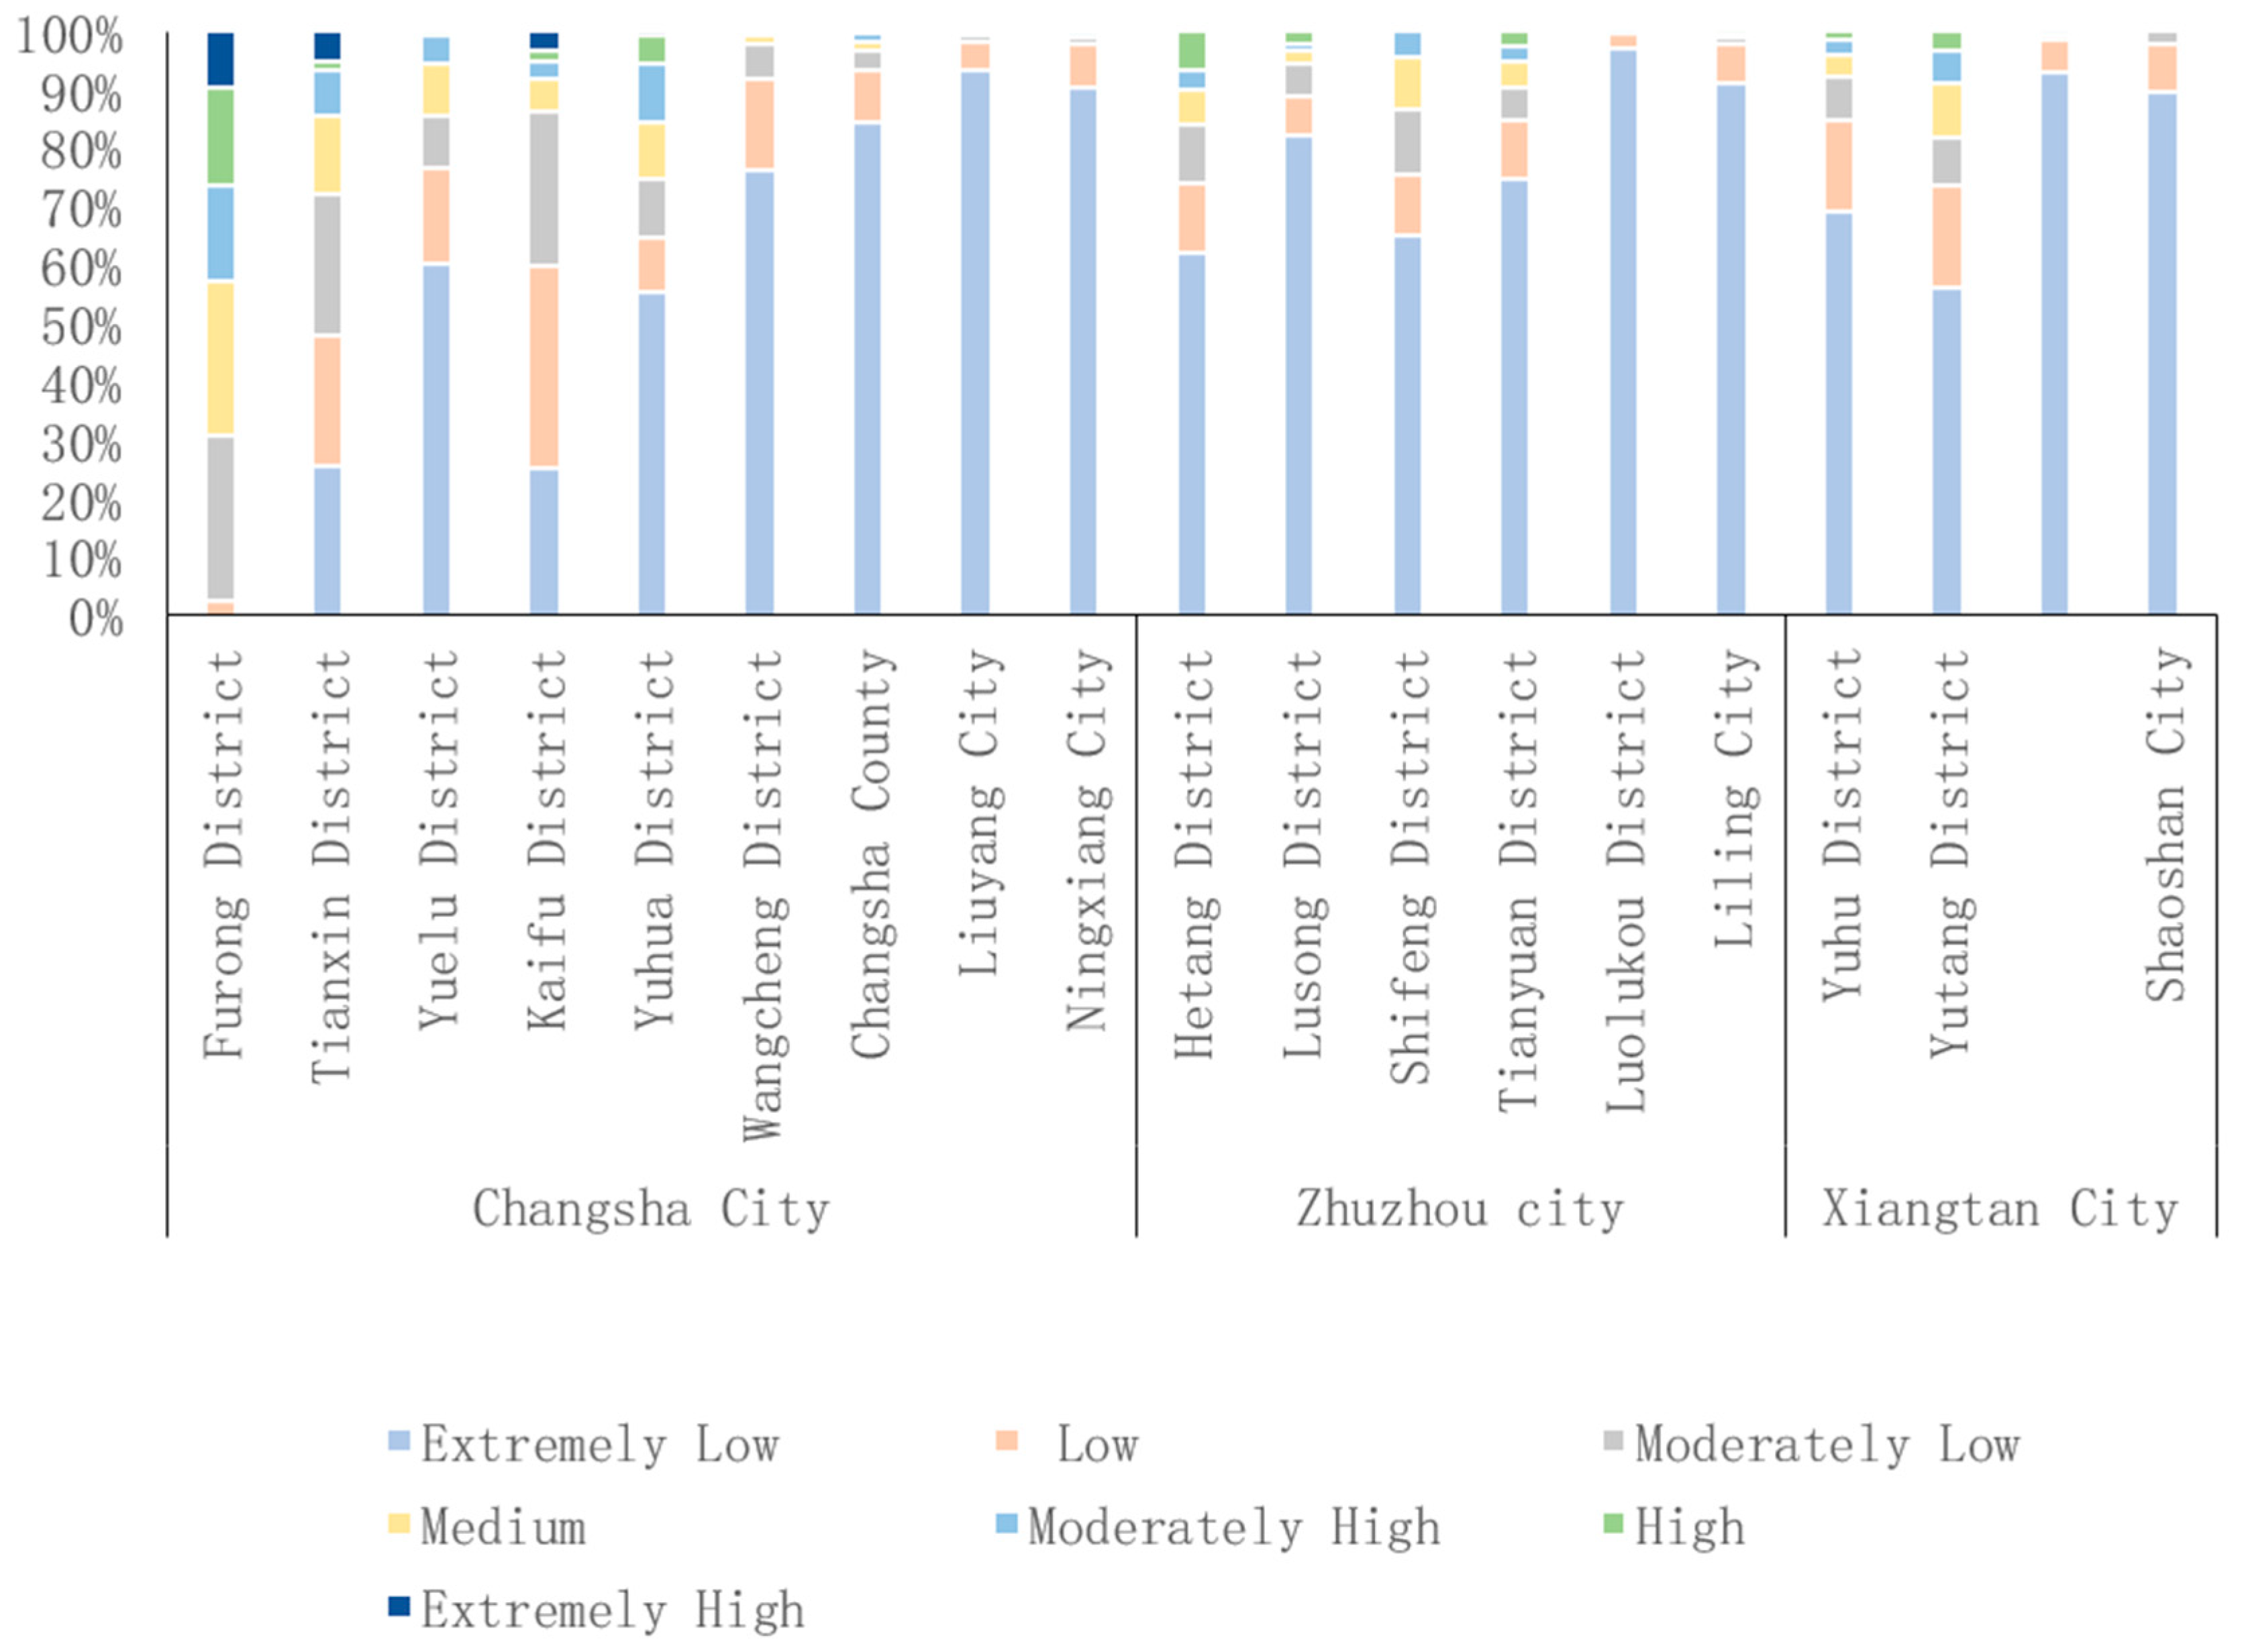
4.1. Characteristics of City Scale in the Metropolitan Area
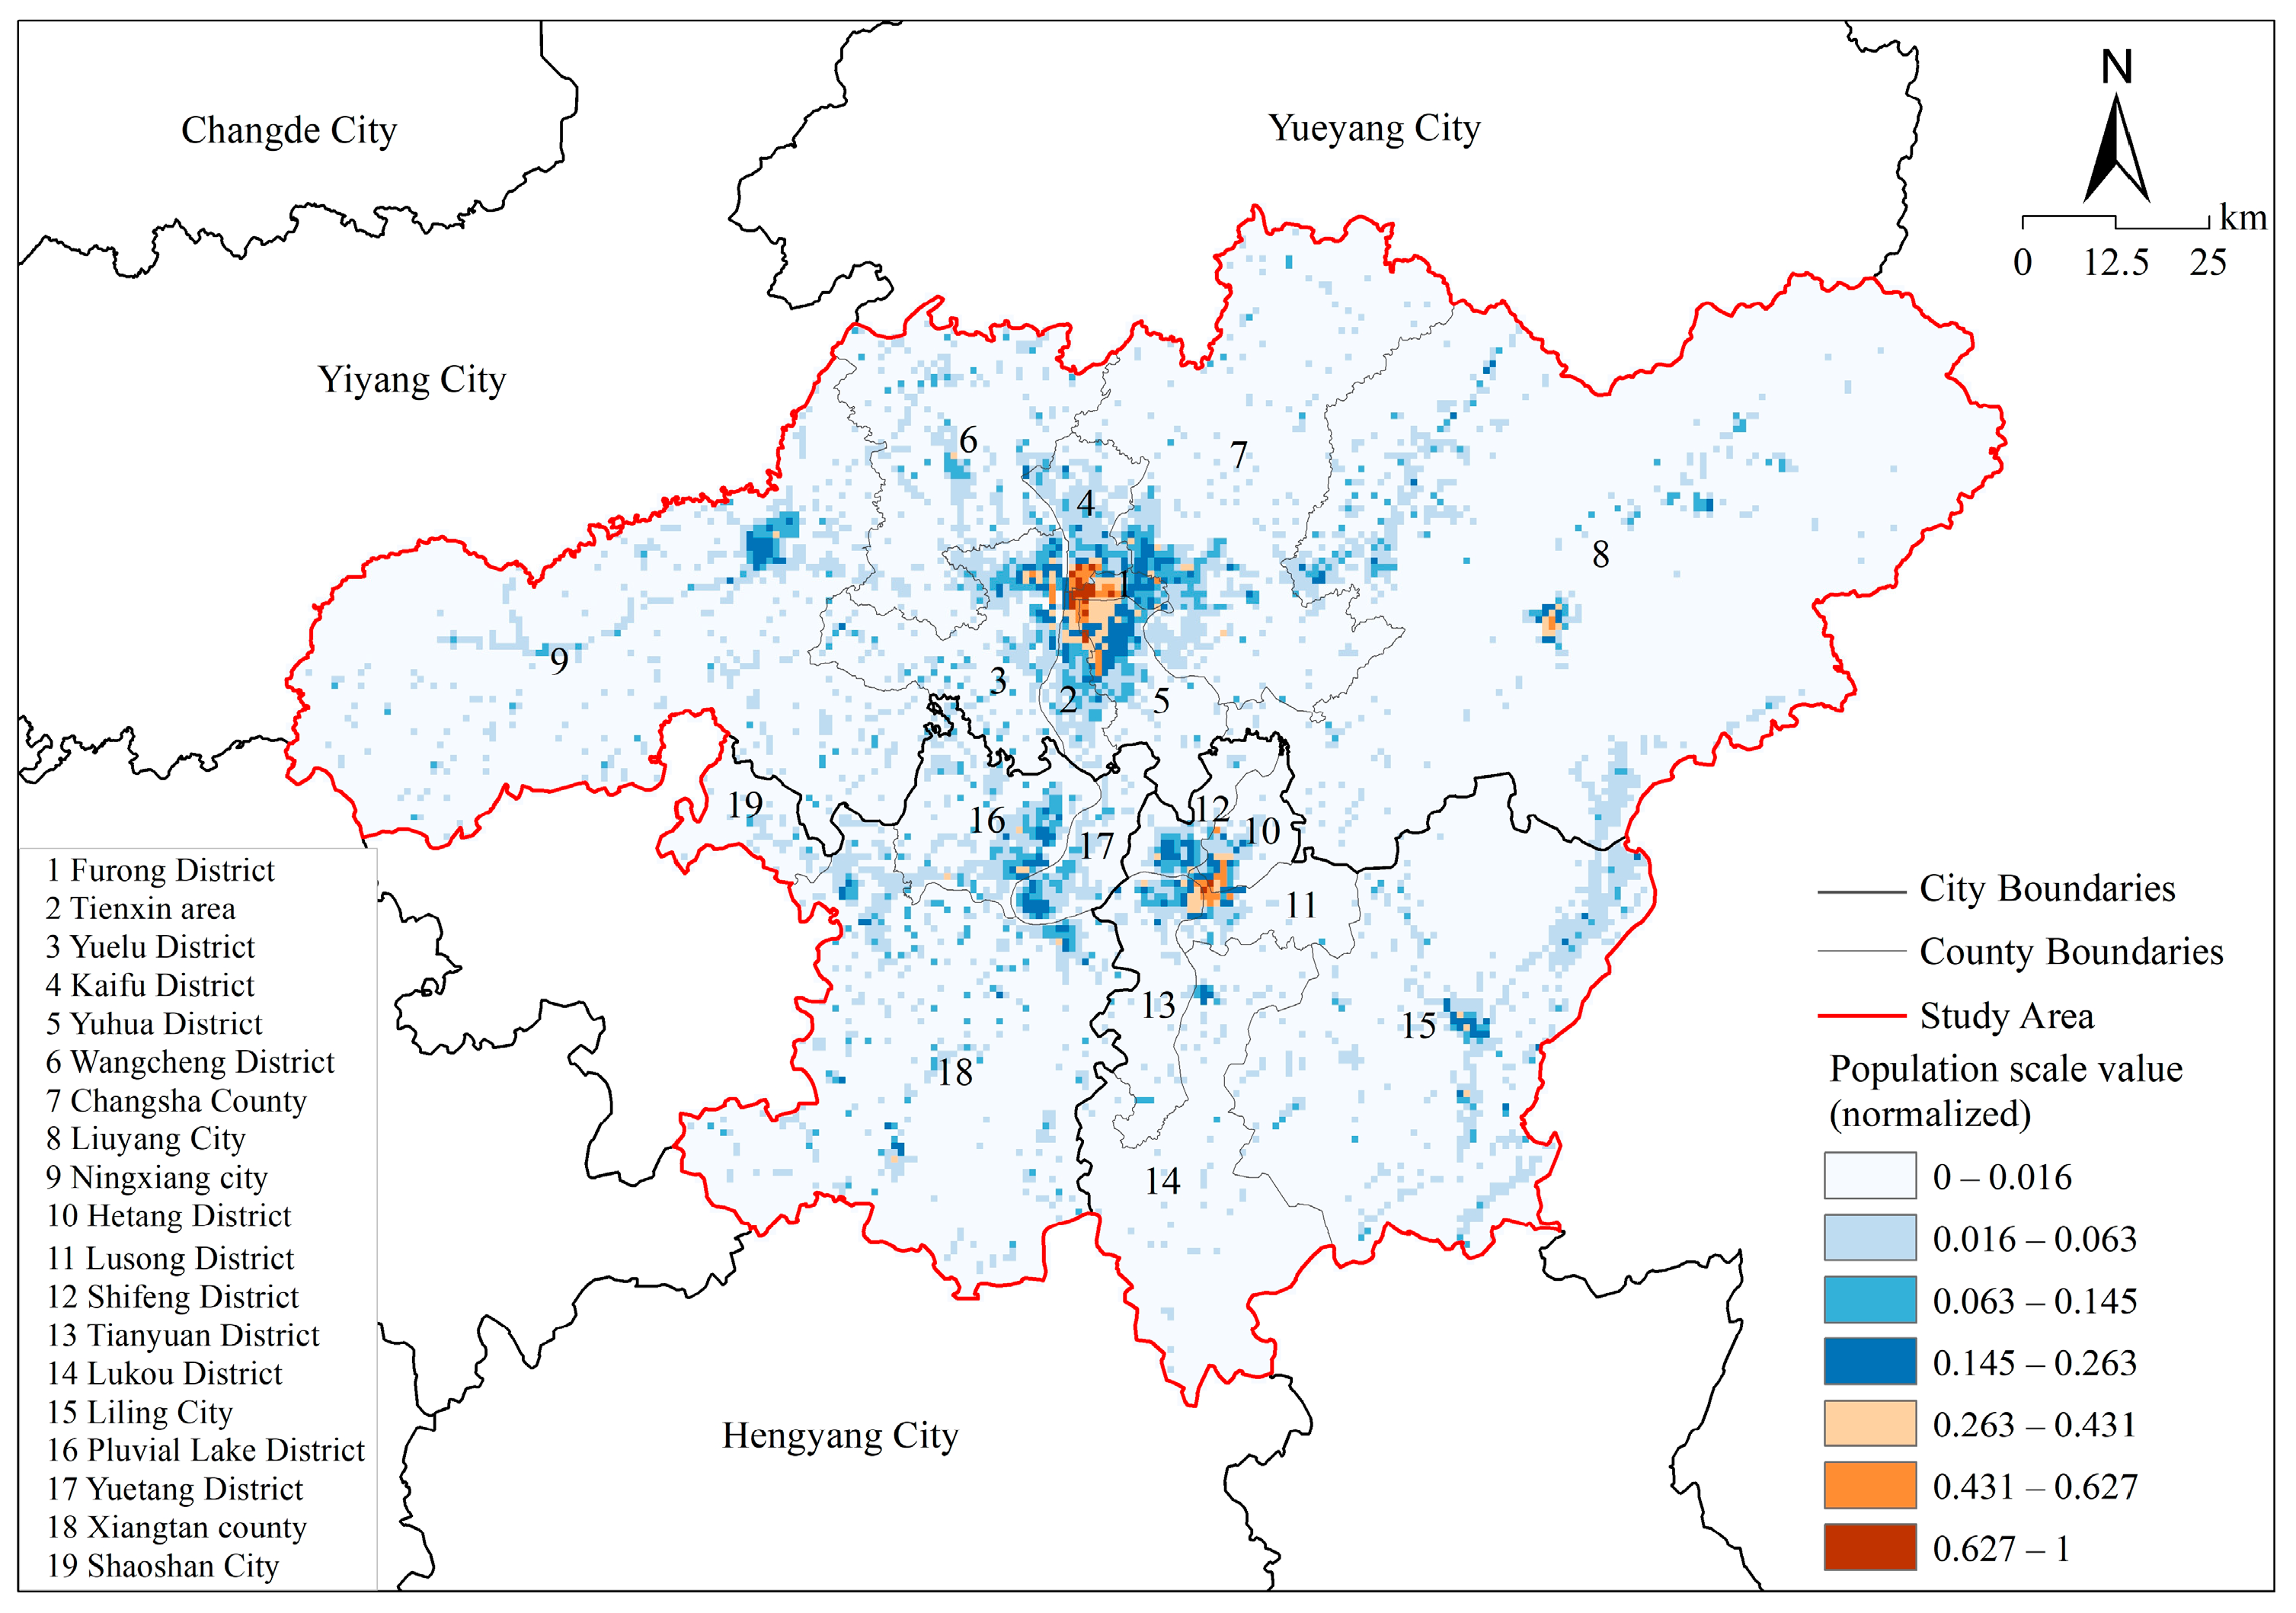
The distribution of city scale in ChangZhuTan metropolitan area shows obvious spatial differentiation, with a high concentration of population in the core urban area and a low population density in the peripheral areas, showing a “core-periphery” structure. Specifically:
(1)
Population Scale Distribution
Spatial analysis of population density reveals pronounced concentration patterns. High-density clusters predominantly occupy central Changsha districts (Furong, Tianxin, Yuhua) and partial zones in Zhuzhou (Hetang, Lusong). Secondary high-density areas emerge in peripheral urban sectors: Liuyang and Ningxiang (Changsha), Tianyuan, Liling, Shifeng (Zhuzhou), alongside Yuetang and Yuhu districts (Xiangtan). Low-density regions primarily cluster along the metropolitan periphery, notably encompassing extensive areas of Liuyang, Ningxiang, and Lukou District (Figure 4).
(2)
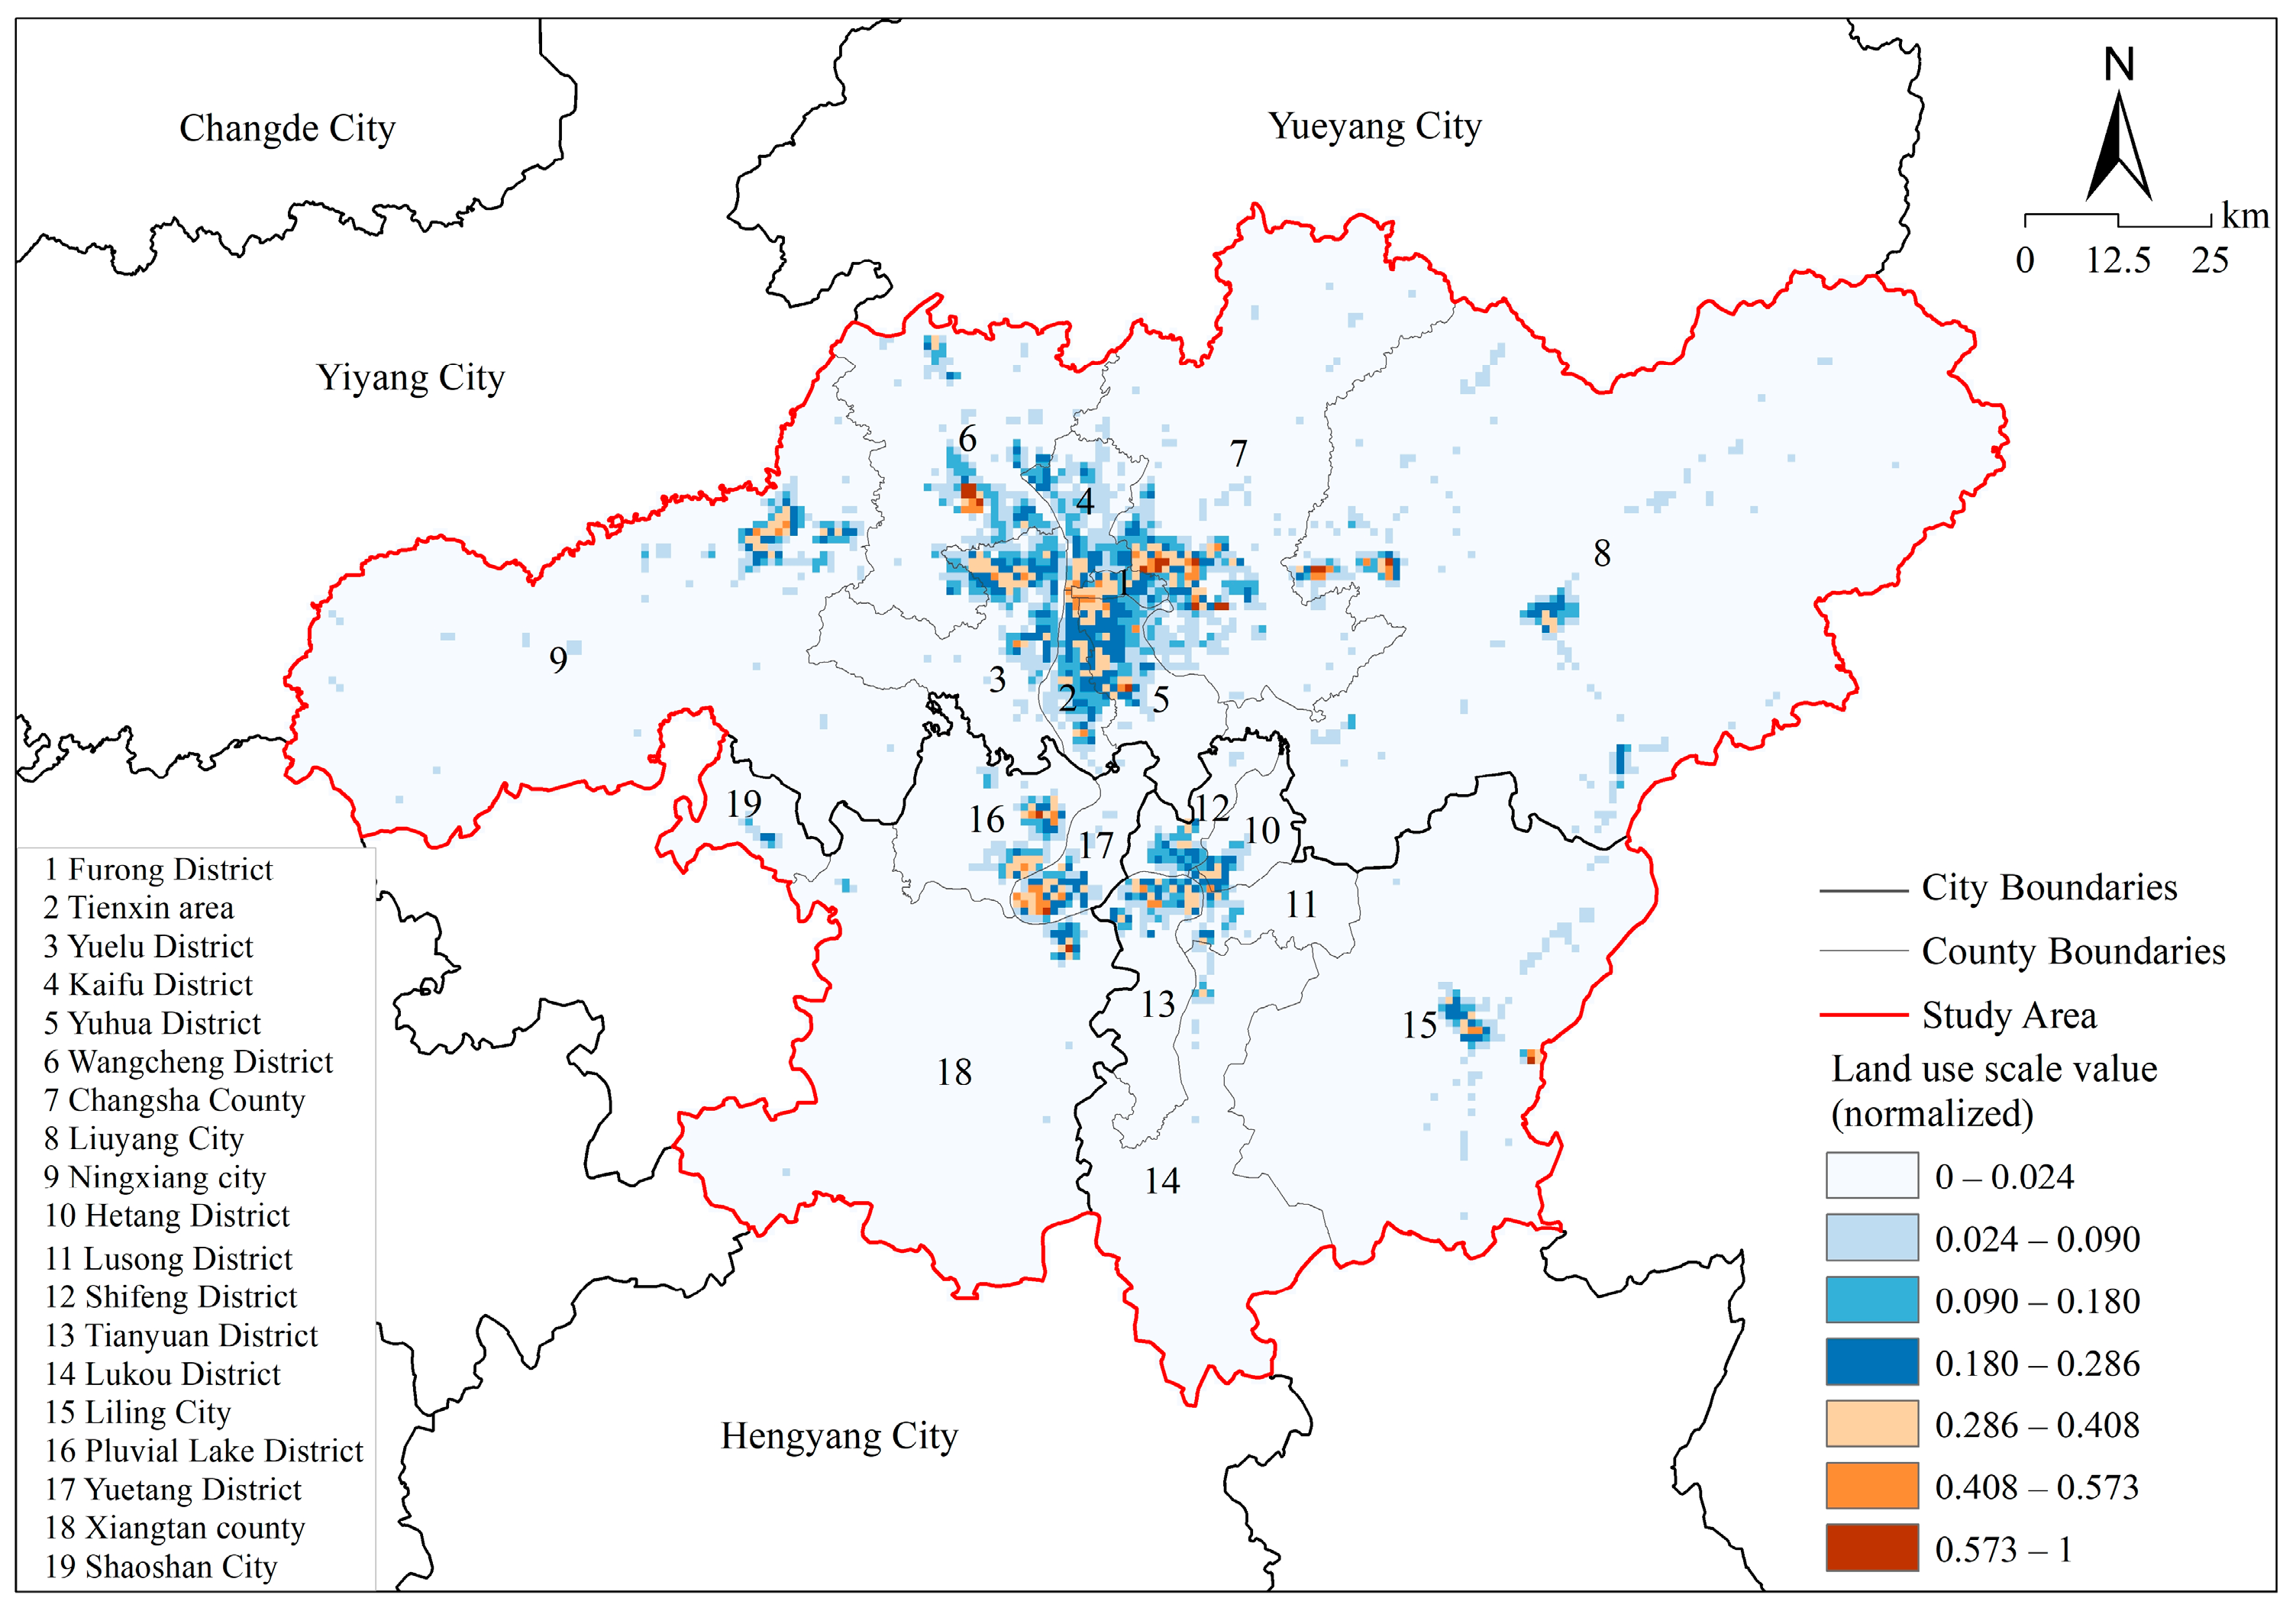
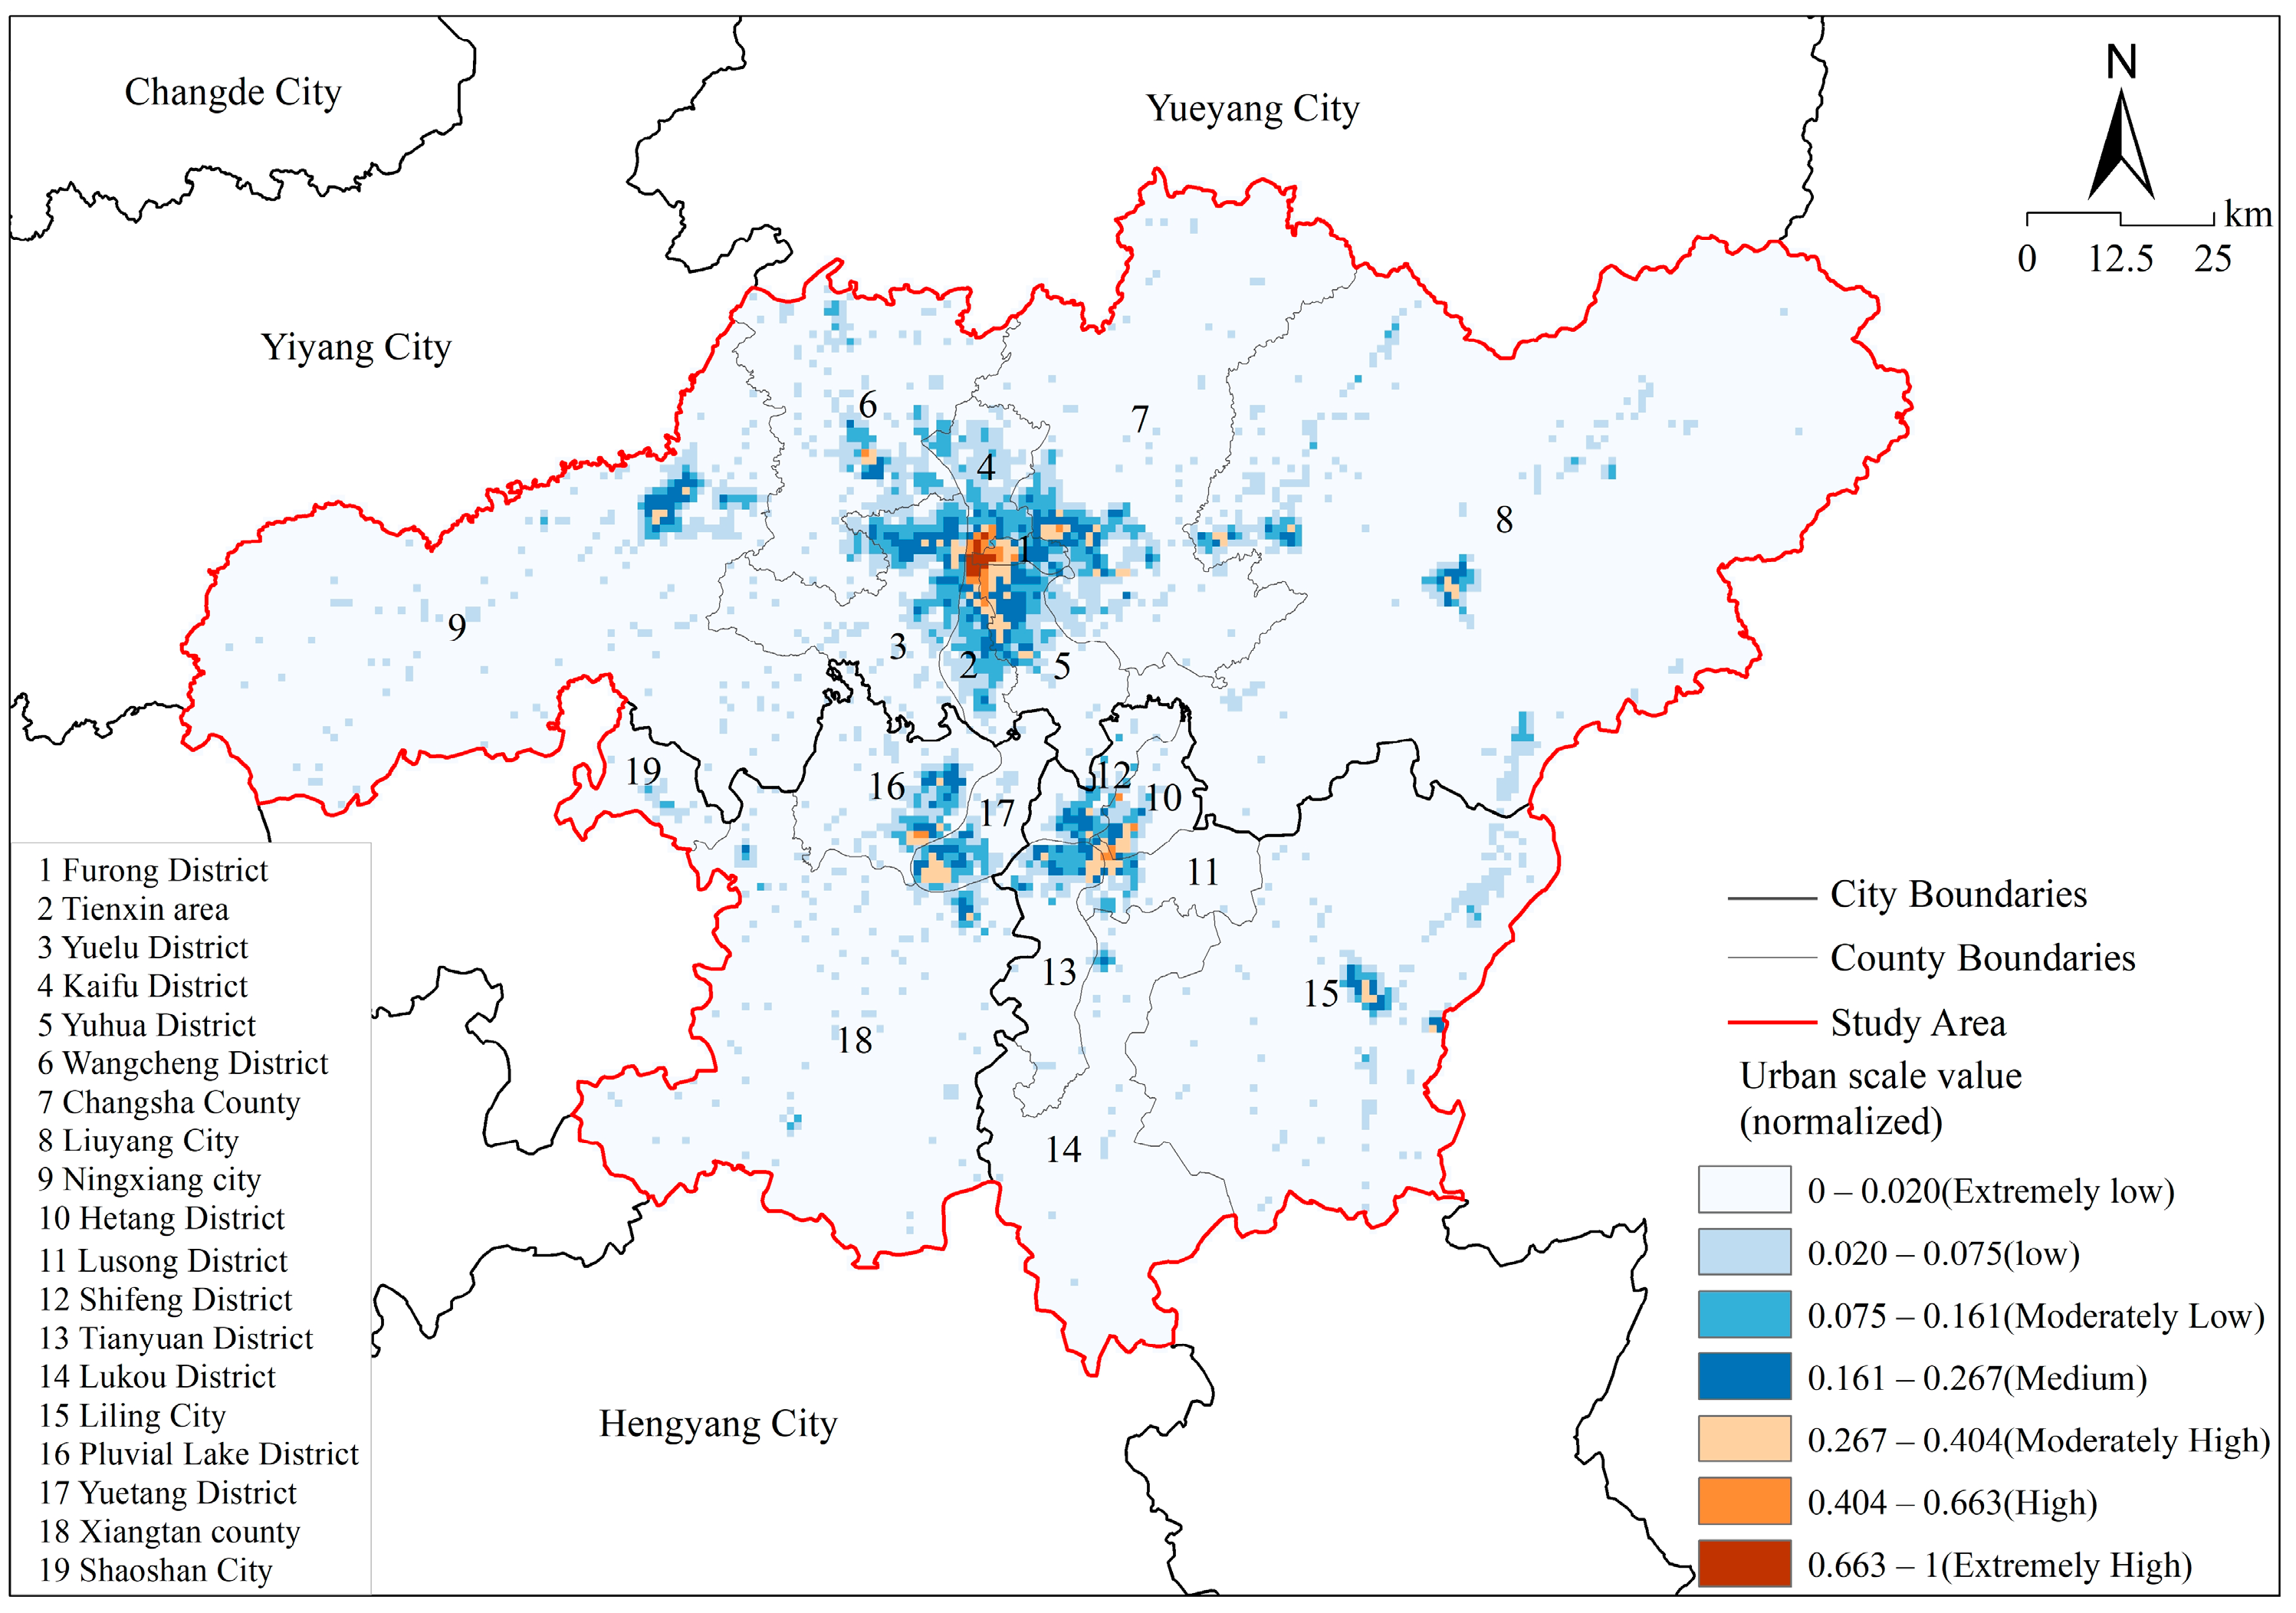
Land Use Scale Characteristics
The metropolitan area exhibits marked spatial heterogeneity in built-up development intensity. Changsha’s core districts (Furong, Kaifu, Tianxin) demonstrate concentrated high land use values, reflecting their dual roles as economic and cultural nuclei. Suburban high-intensity zones in Changsha primarily localize in Ningxiang, Wangcheng, Changsha County, and Liuyang. Comparatively, Zhuzhou displays limited high-value clusters, while Xiangtan’s elevated land use indices concentrate in Yuhu and Yuetang districts (Figure 5).
(3)
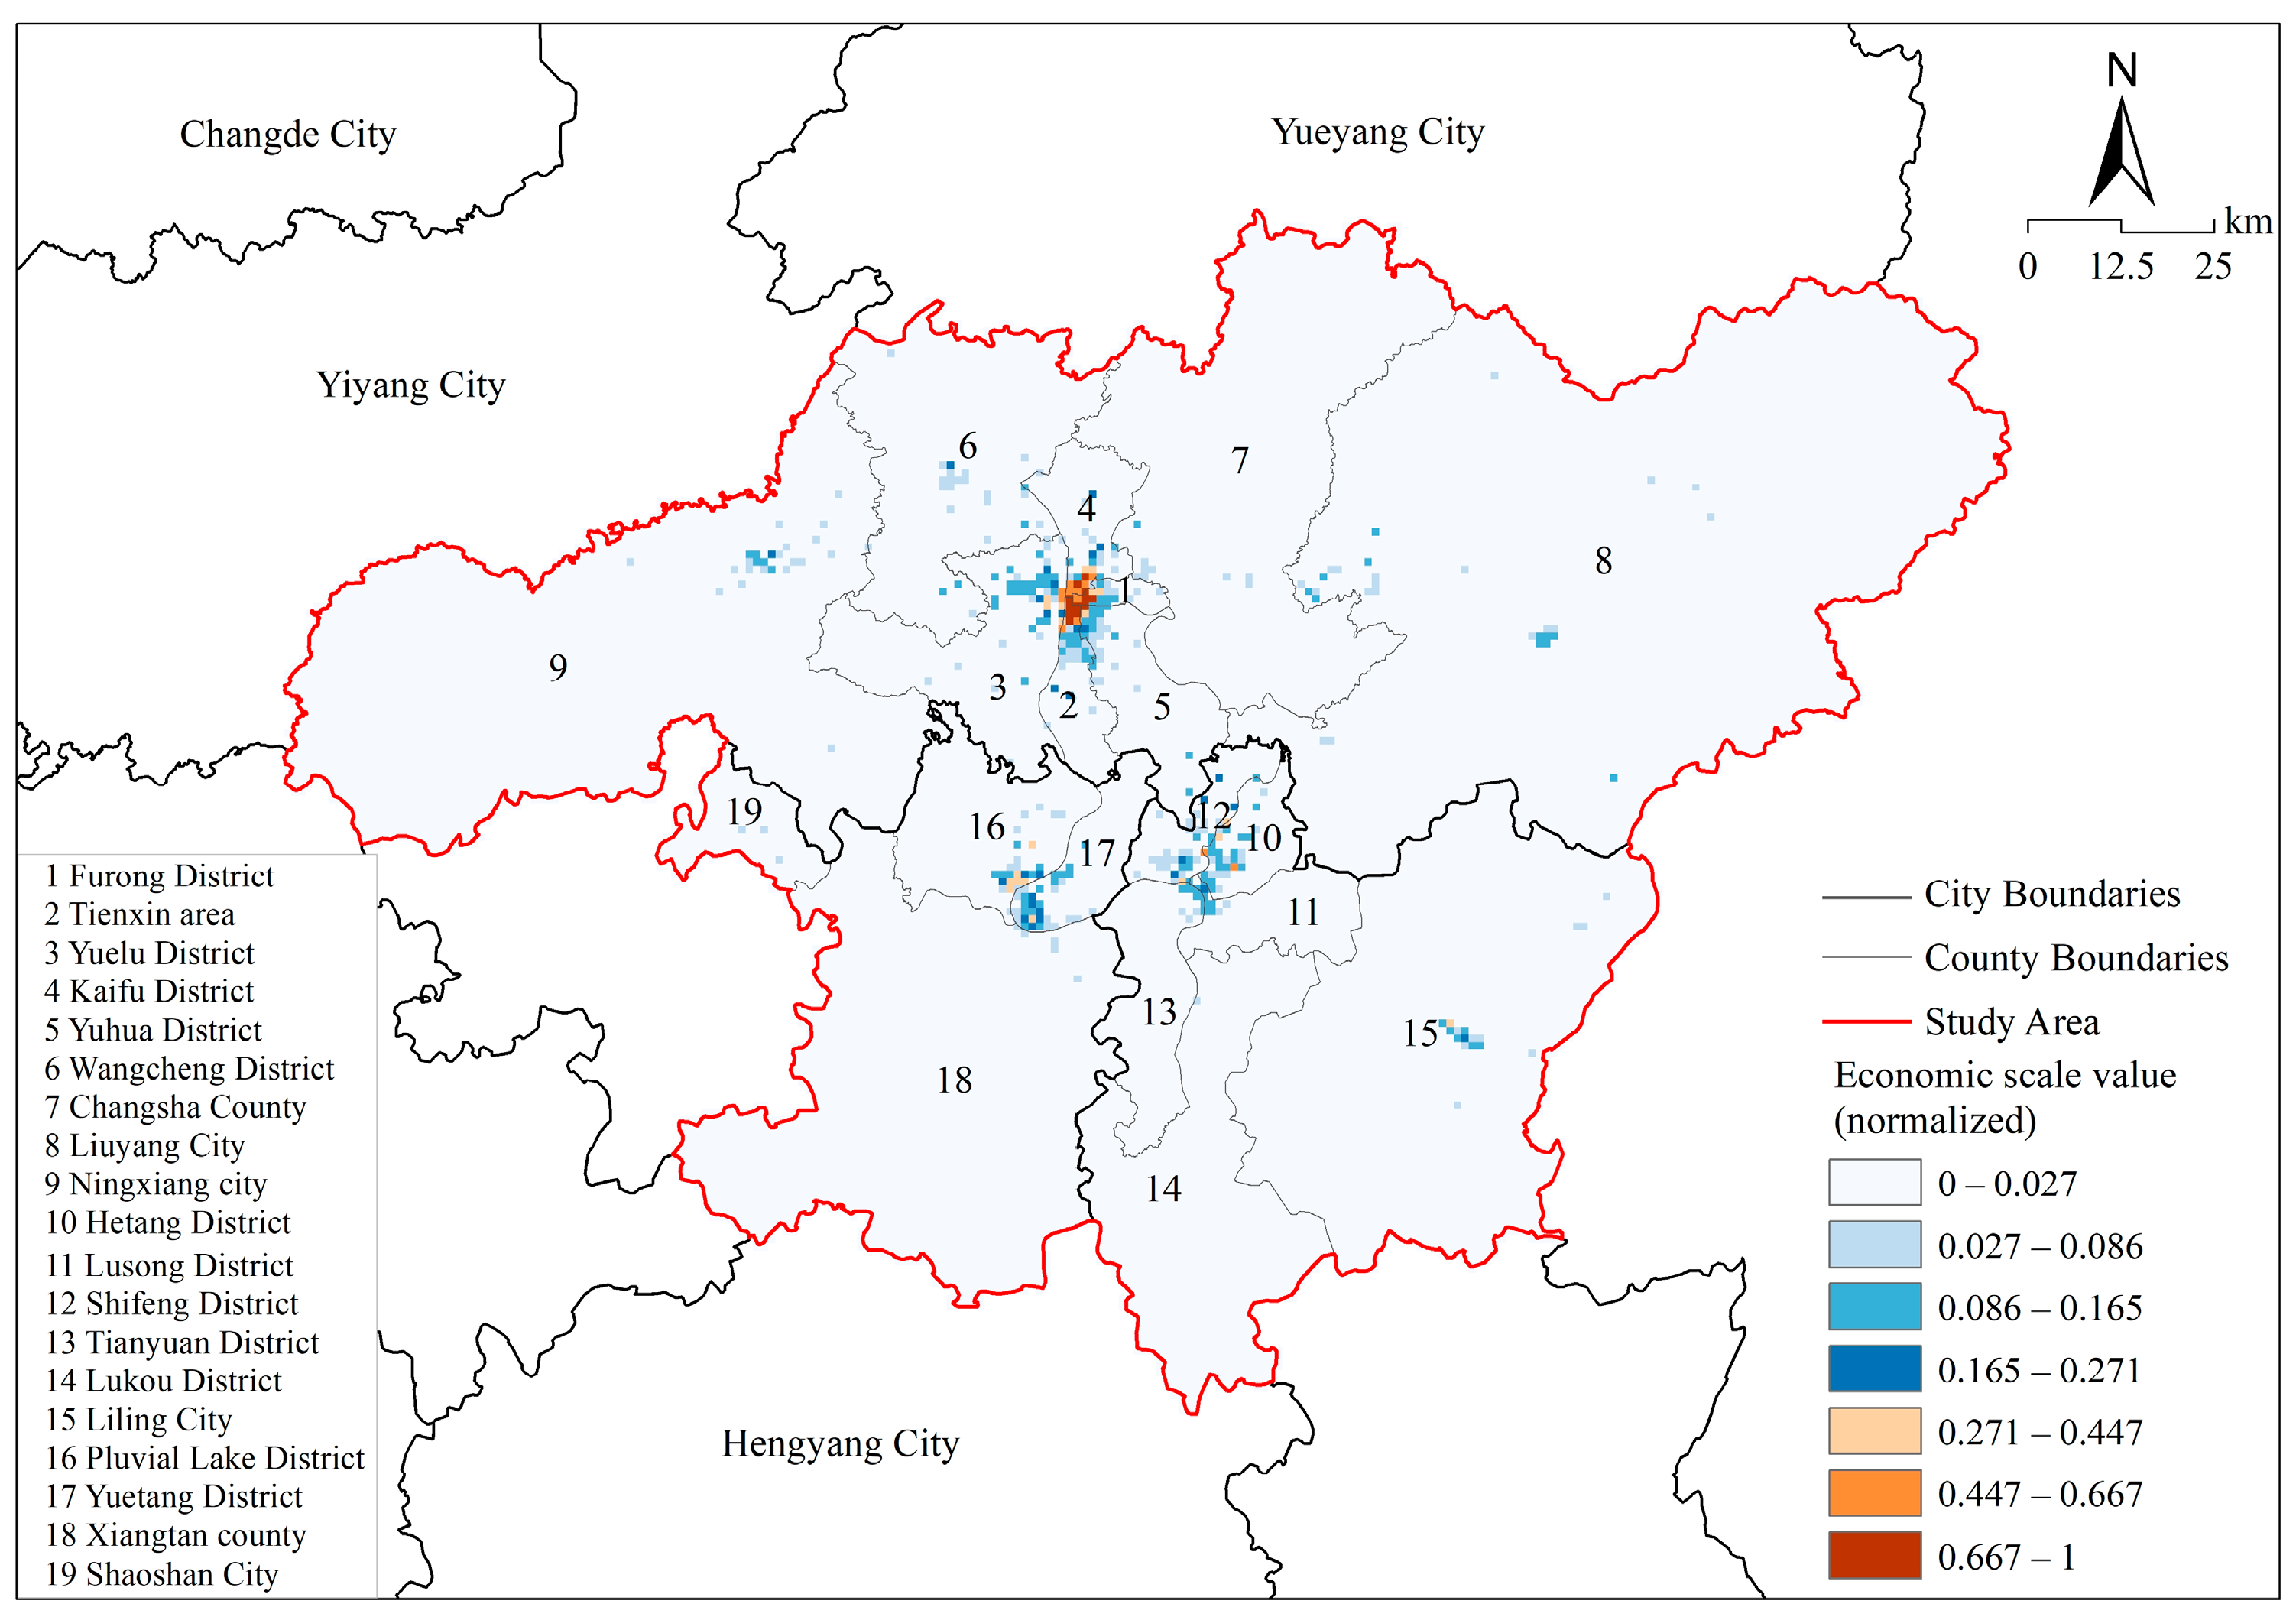
Economic Scale Spatial Disparities
Economic magnitude demonstrates sharper spatial differentiation than demographic and land use parameters. Core Changsha districts (Tianxin, Furong, Kaifu) exhibit intensive economic agglomeration (index range: 0.165–1.000), contrasting with progressively declining values towards peripheral counties and neighboring cities. Though Zhuzhou and Xiangtan’s urban cores show economic clustering tendencies (index range: 0.027–0.447), their scale values remain substantially lower than Changsha’s central areas. This spatial structure visually manifests imbalanced economic development across the metropolitan area (Figure 6).
Synthesizing population, land use, and economic scale evaluations, the ChangZhuTan metropolitan area demonstrates a distinctive “one-core, two-center, multi-node” spatial configuration (Figure 7). The core zone concentrates in central Changsha (Tianxin, Furong, and Kaifu districts), while the subsidiary centers encompass Shifeng District in Zhuzhou and the transitional zone between Yuhu and Yuetang districts in Xiangtan. Satellite nodes primarily distribute across Wangcheng, Ningxiang, and Liuyang in Changsha, as well as Liling in Zhuzhou. Spatially, central urban areas across Changsha, Zhuzhou, and Xiangtan exhibit significantly higher scale indices than peripheral counties, with Changsha’s core region displaying both the highest values and the most extensive geographical coverage, reflecting its dominant role in metropolitan development.
Through ArcGIS-based natural breaks classification, urban scale was categorized into seven tiers (from extremely low to extremely high). Extremely high-value grids (0.10%) cluster exclusively in Changsha’s Furong, Tianxin, and Kaifu districts. High-value grids (0.42%) extend to Changsha’s suburban counties, Zhuzhou’s Hetang, Lusong, and Tianyuan districts, and Xiangtan’s Yuetang District. Medium-high (0.99%), medium (1.56%), and medium-low tiers (2.75%) exhibit relatively uniform distributions across peri-urban expansion zones, whereas low (7.72%) and extremely low tiers (86.47%) dominate peripheral territories (Table 2, Figure 8).

4.2. Urban Vitality Characteristics

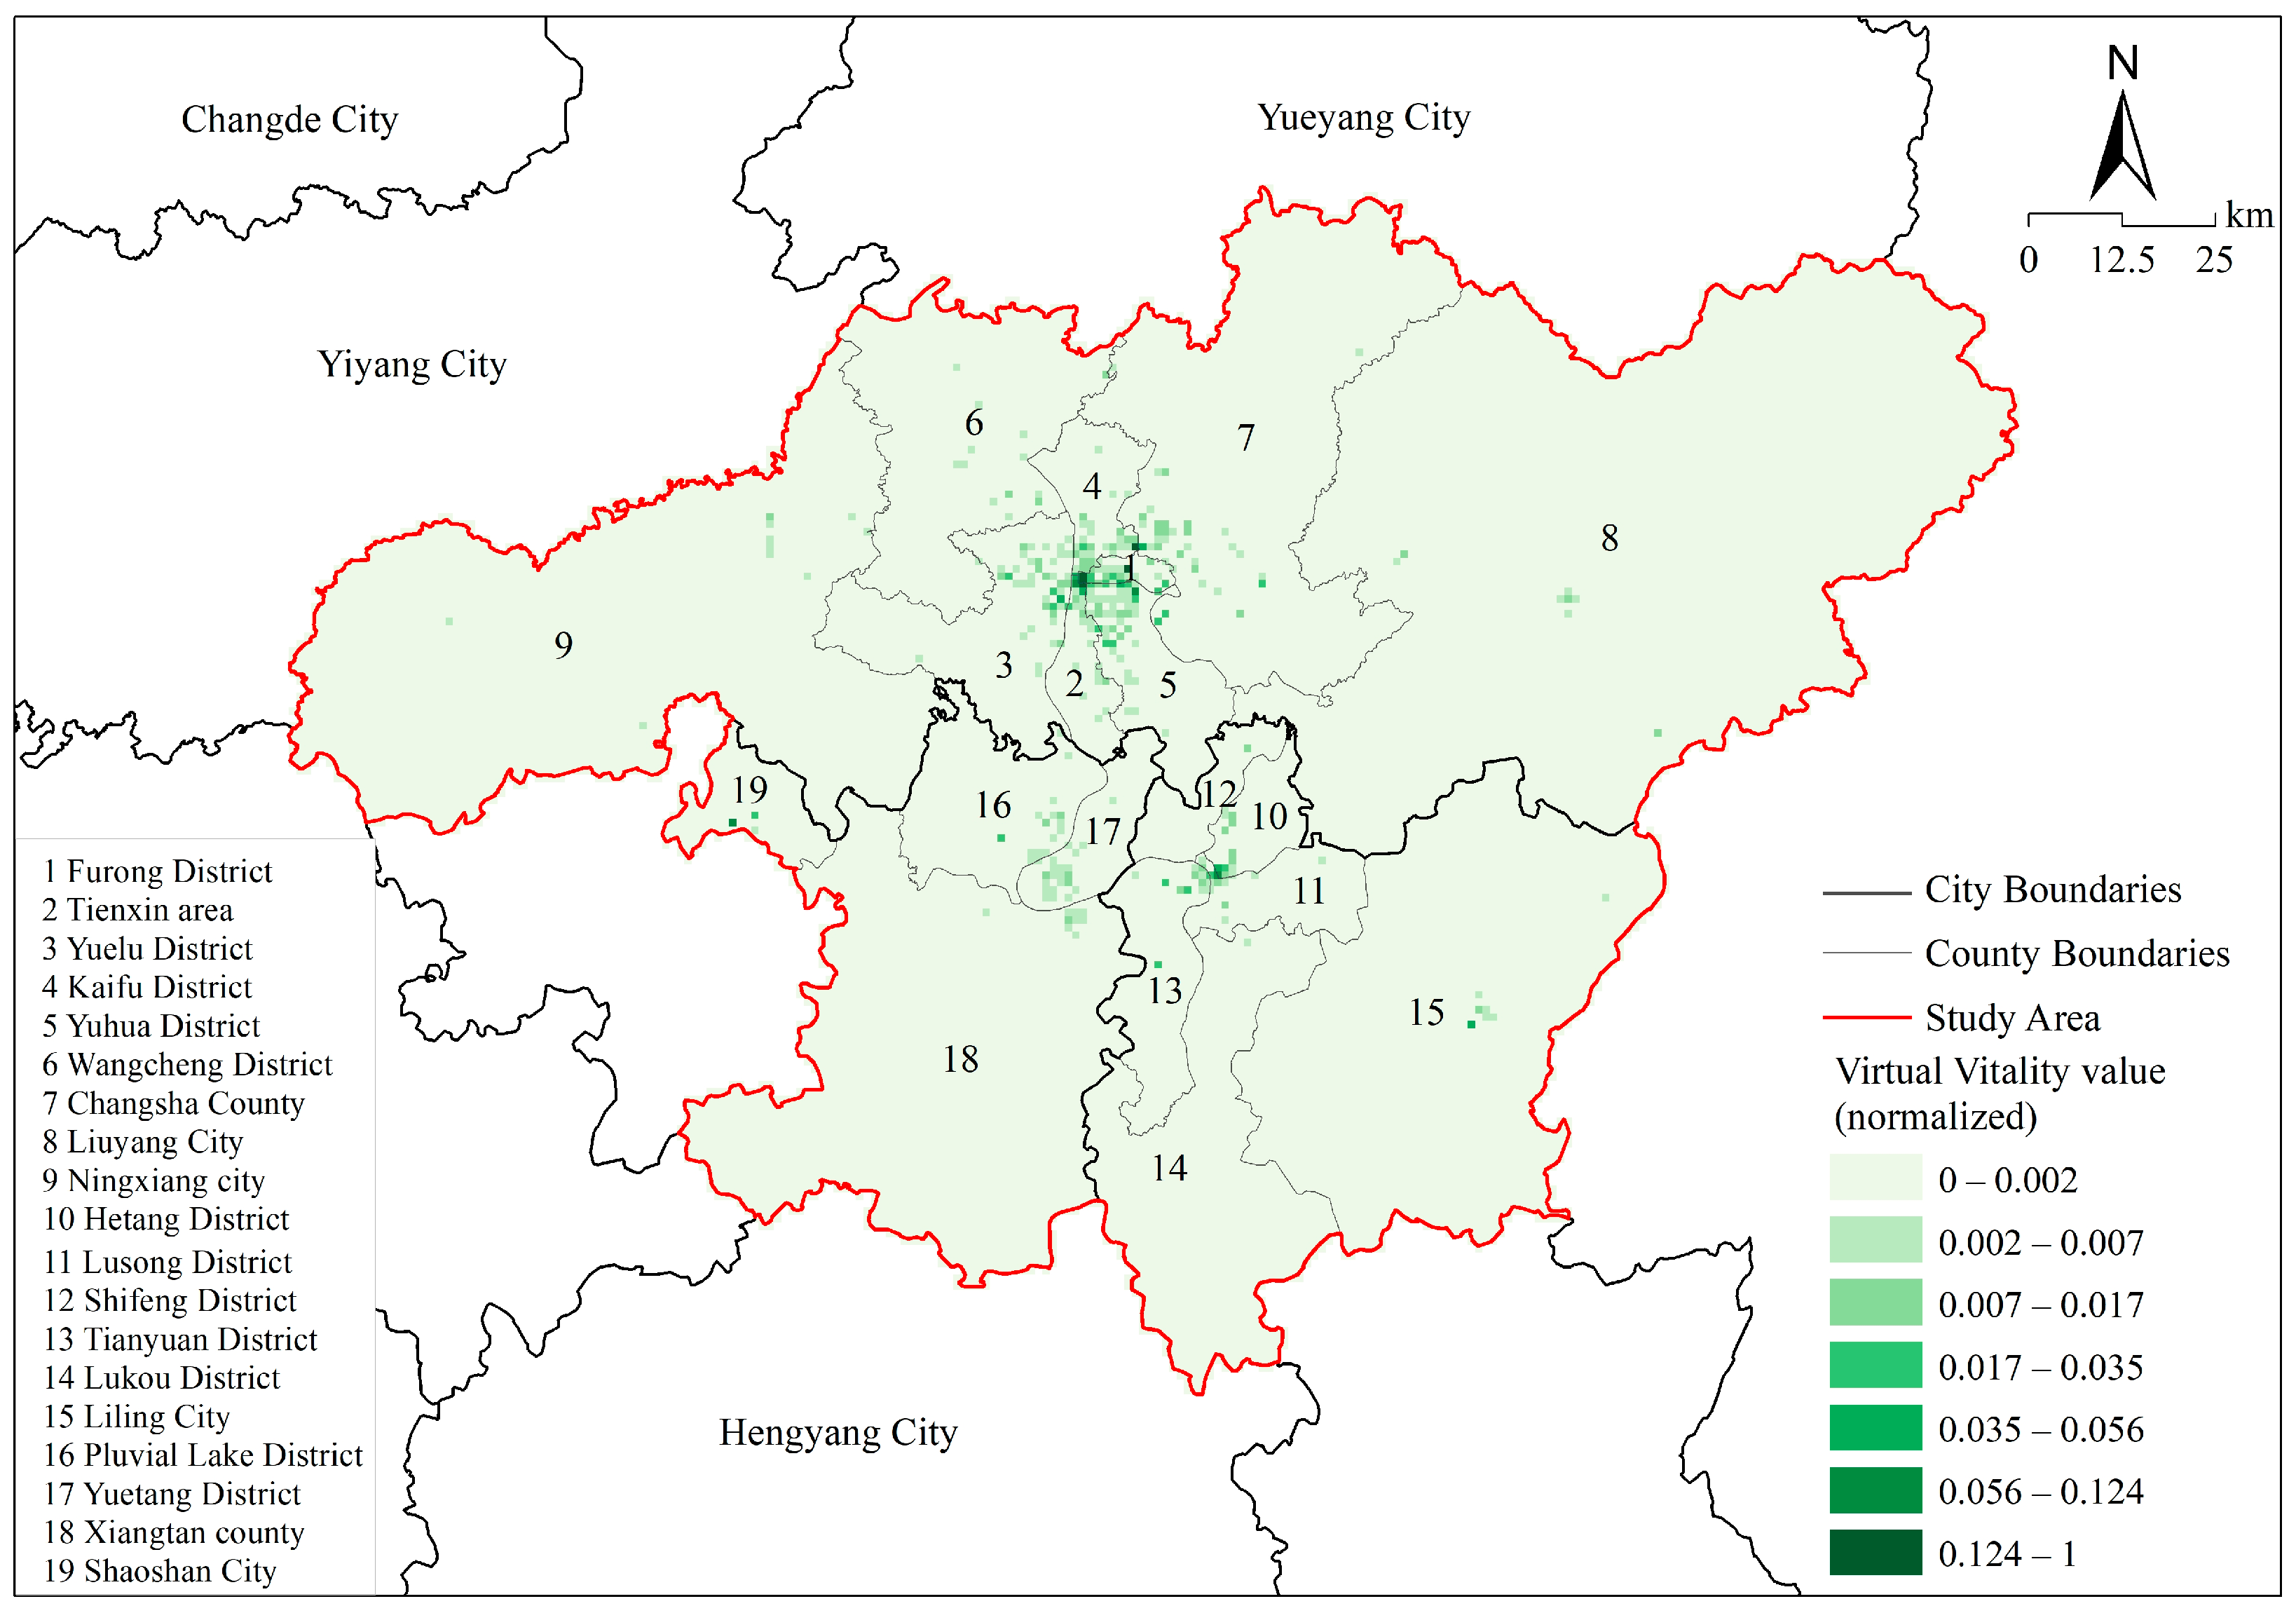
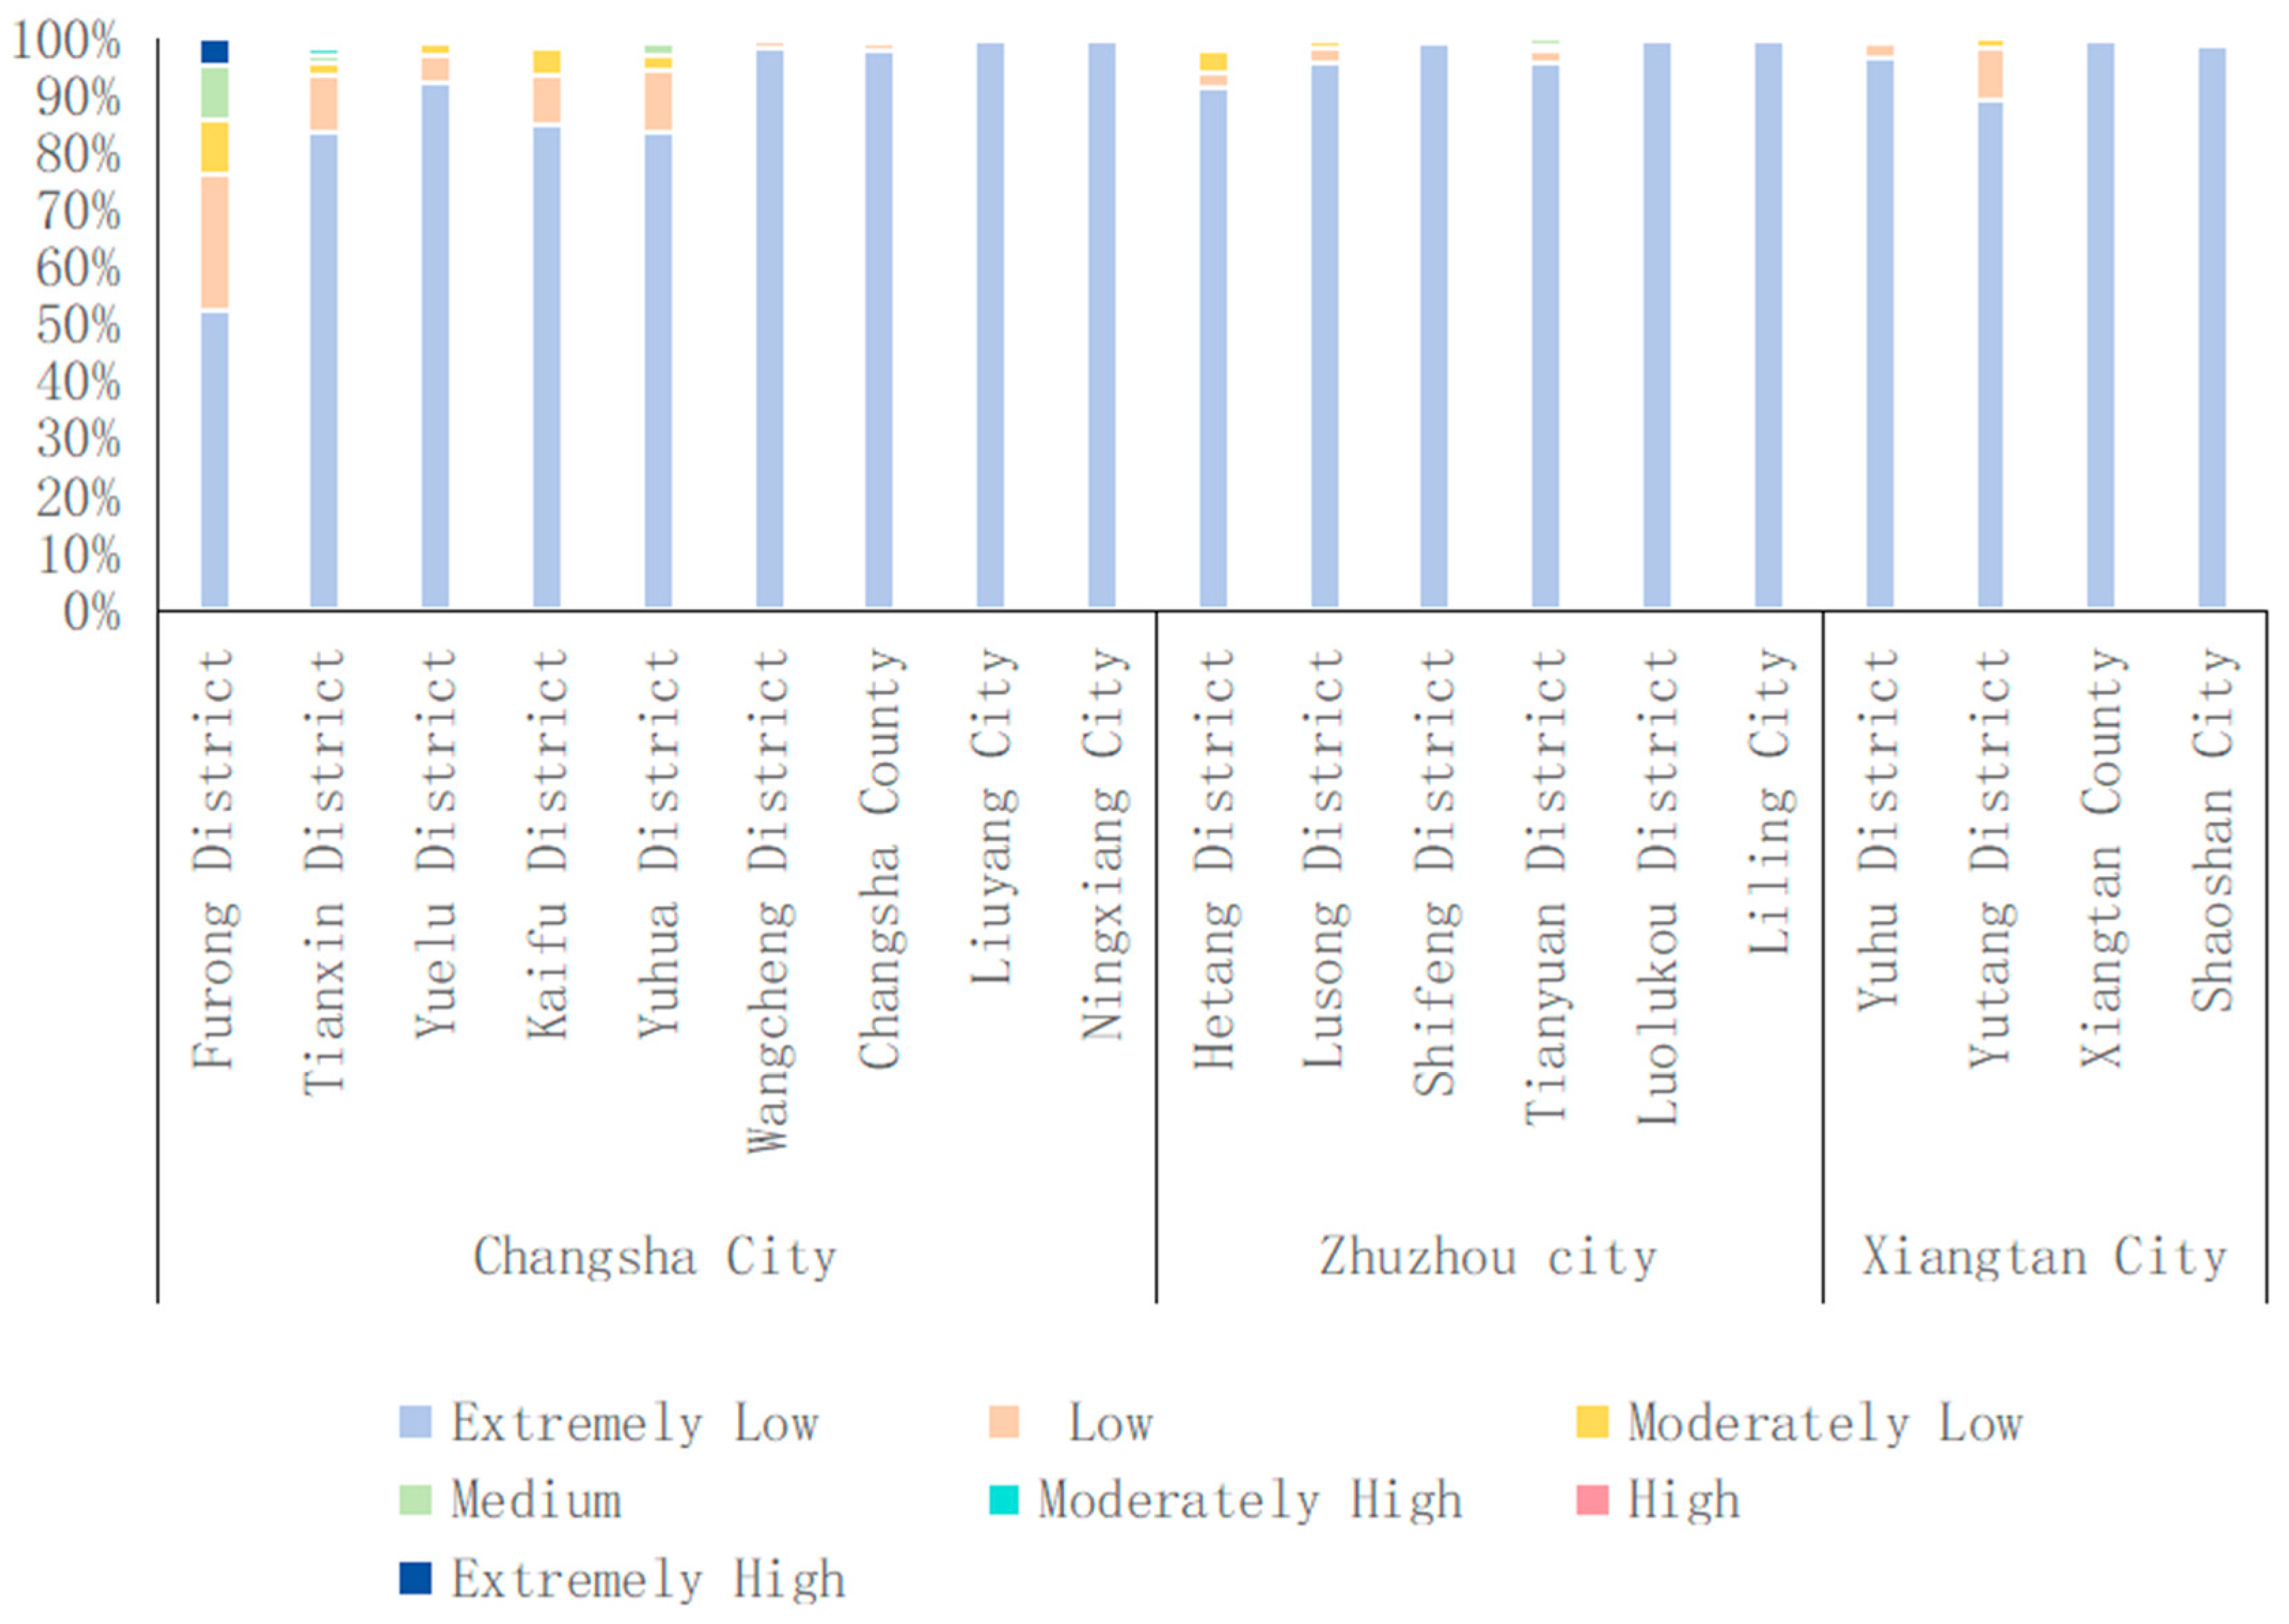
4.2.1. Characterizing the Virtual Vitality Distribution of Metropolitan Areas Based on Web Punch Cards

Applying natural breaks classification, the virtual vitality across the ChangZhuTan metropolitan area exhibits pronounced spatial heterogeneity (Figure 9). Core urban districts of Changsha, Zhuzhou, and Xiangtan dominate virtual vitality distribution, with Changsha’s central districts (Furong, Tianxin, Kaifu) attaining the highest intensities, followed by Zhuzhou’s urban core and Xiangtan’s central areas. Notably, secondary vitality clusters emerge in suburban zones: Changsha County and Liuyang (Changsha), Liling (Zhuzhou), and Xiangtan County (Xiangtan), forming discontinuous “hotspots” beyond municipal cores.
Grid-based statistical analysis reveals a seven-tier virtual vitality structure. Extremely high-value grids (0.03%) concentrate exclusively in Changsha’s Furong, Tianxin, Kaifu, and Yuhua districts. High (0.02%), medium-high (0.04%), medium (0.14%), and medium-low tiers (0.38%) primarily cluster within central urban zones of all three cities. Low-value grids (1.03%) predominantly occupy urban-rural transitional areas, while extremely low-value grids (98.38%) dominate peripheral territories, indicating uniformly subdued virtual vitality levels across most metropolitan regions (Table 3, Figure 10). This stratified pattern underscores the persistent “core-concentrated, periphery-depressed” characteristics of digital engagement.

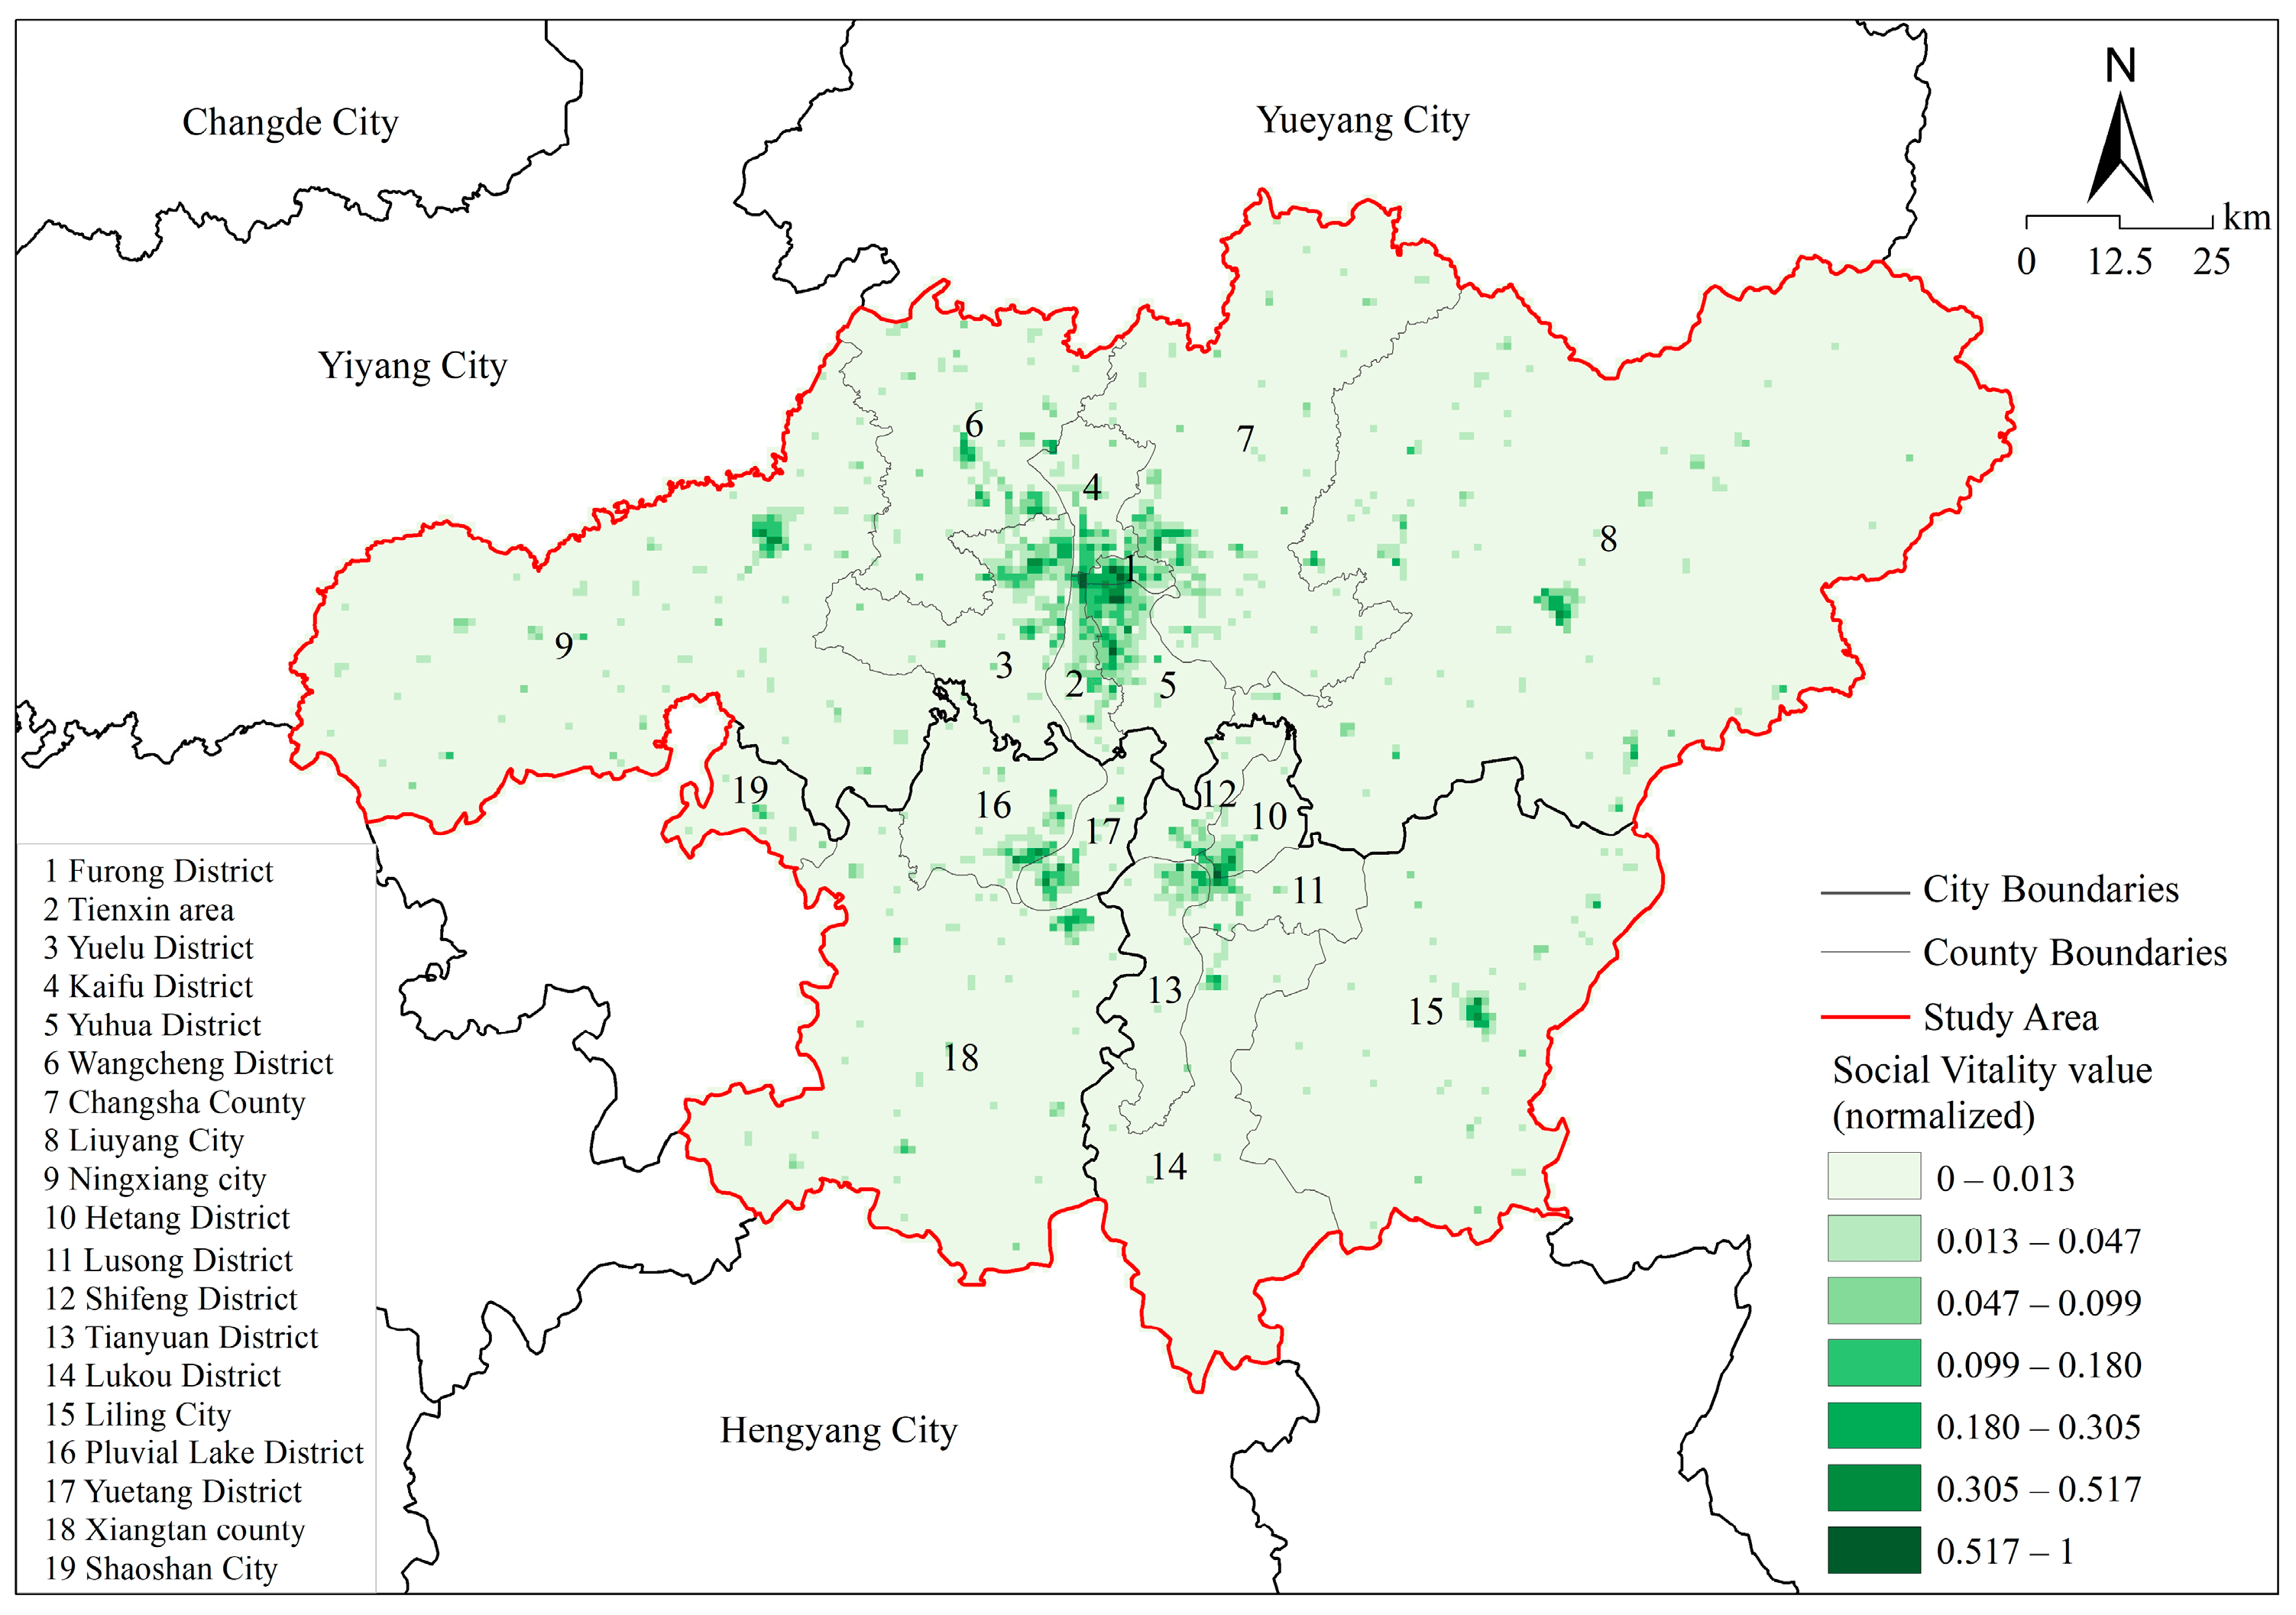
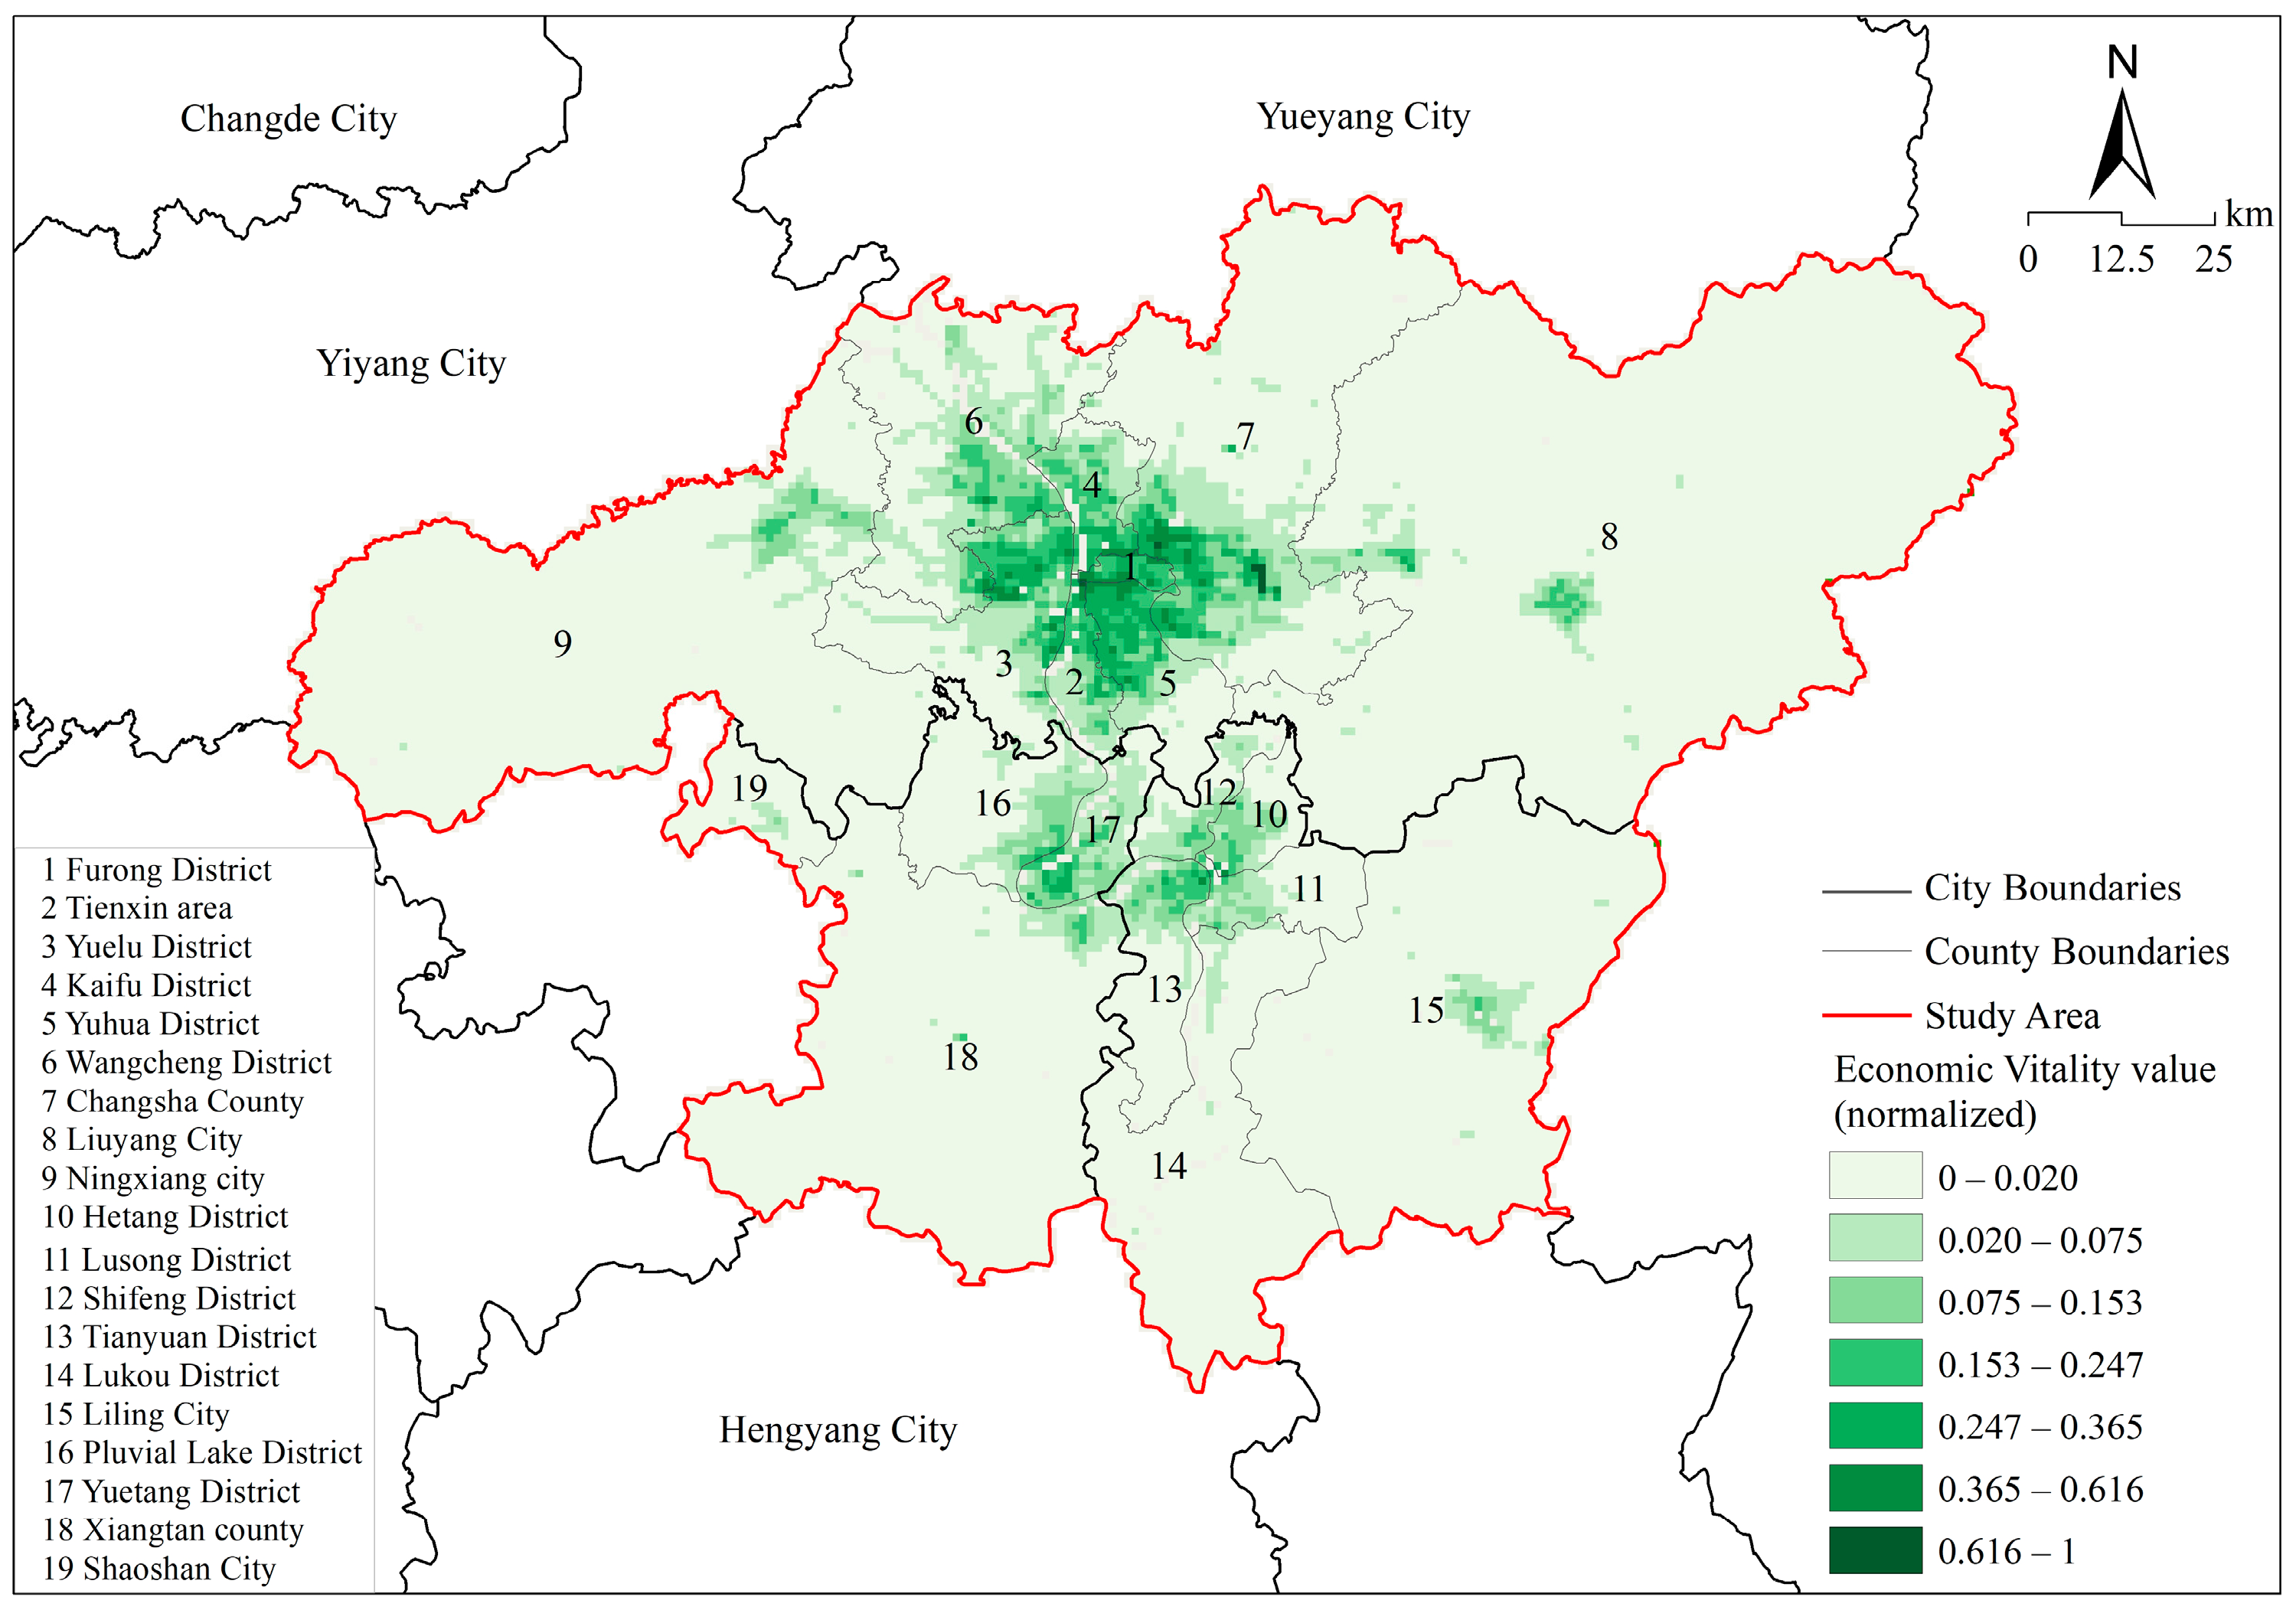
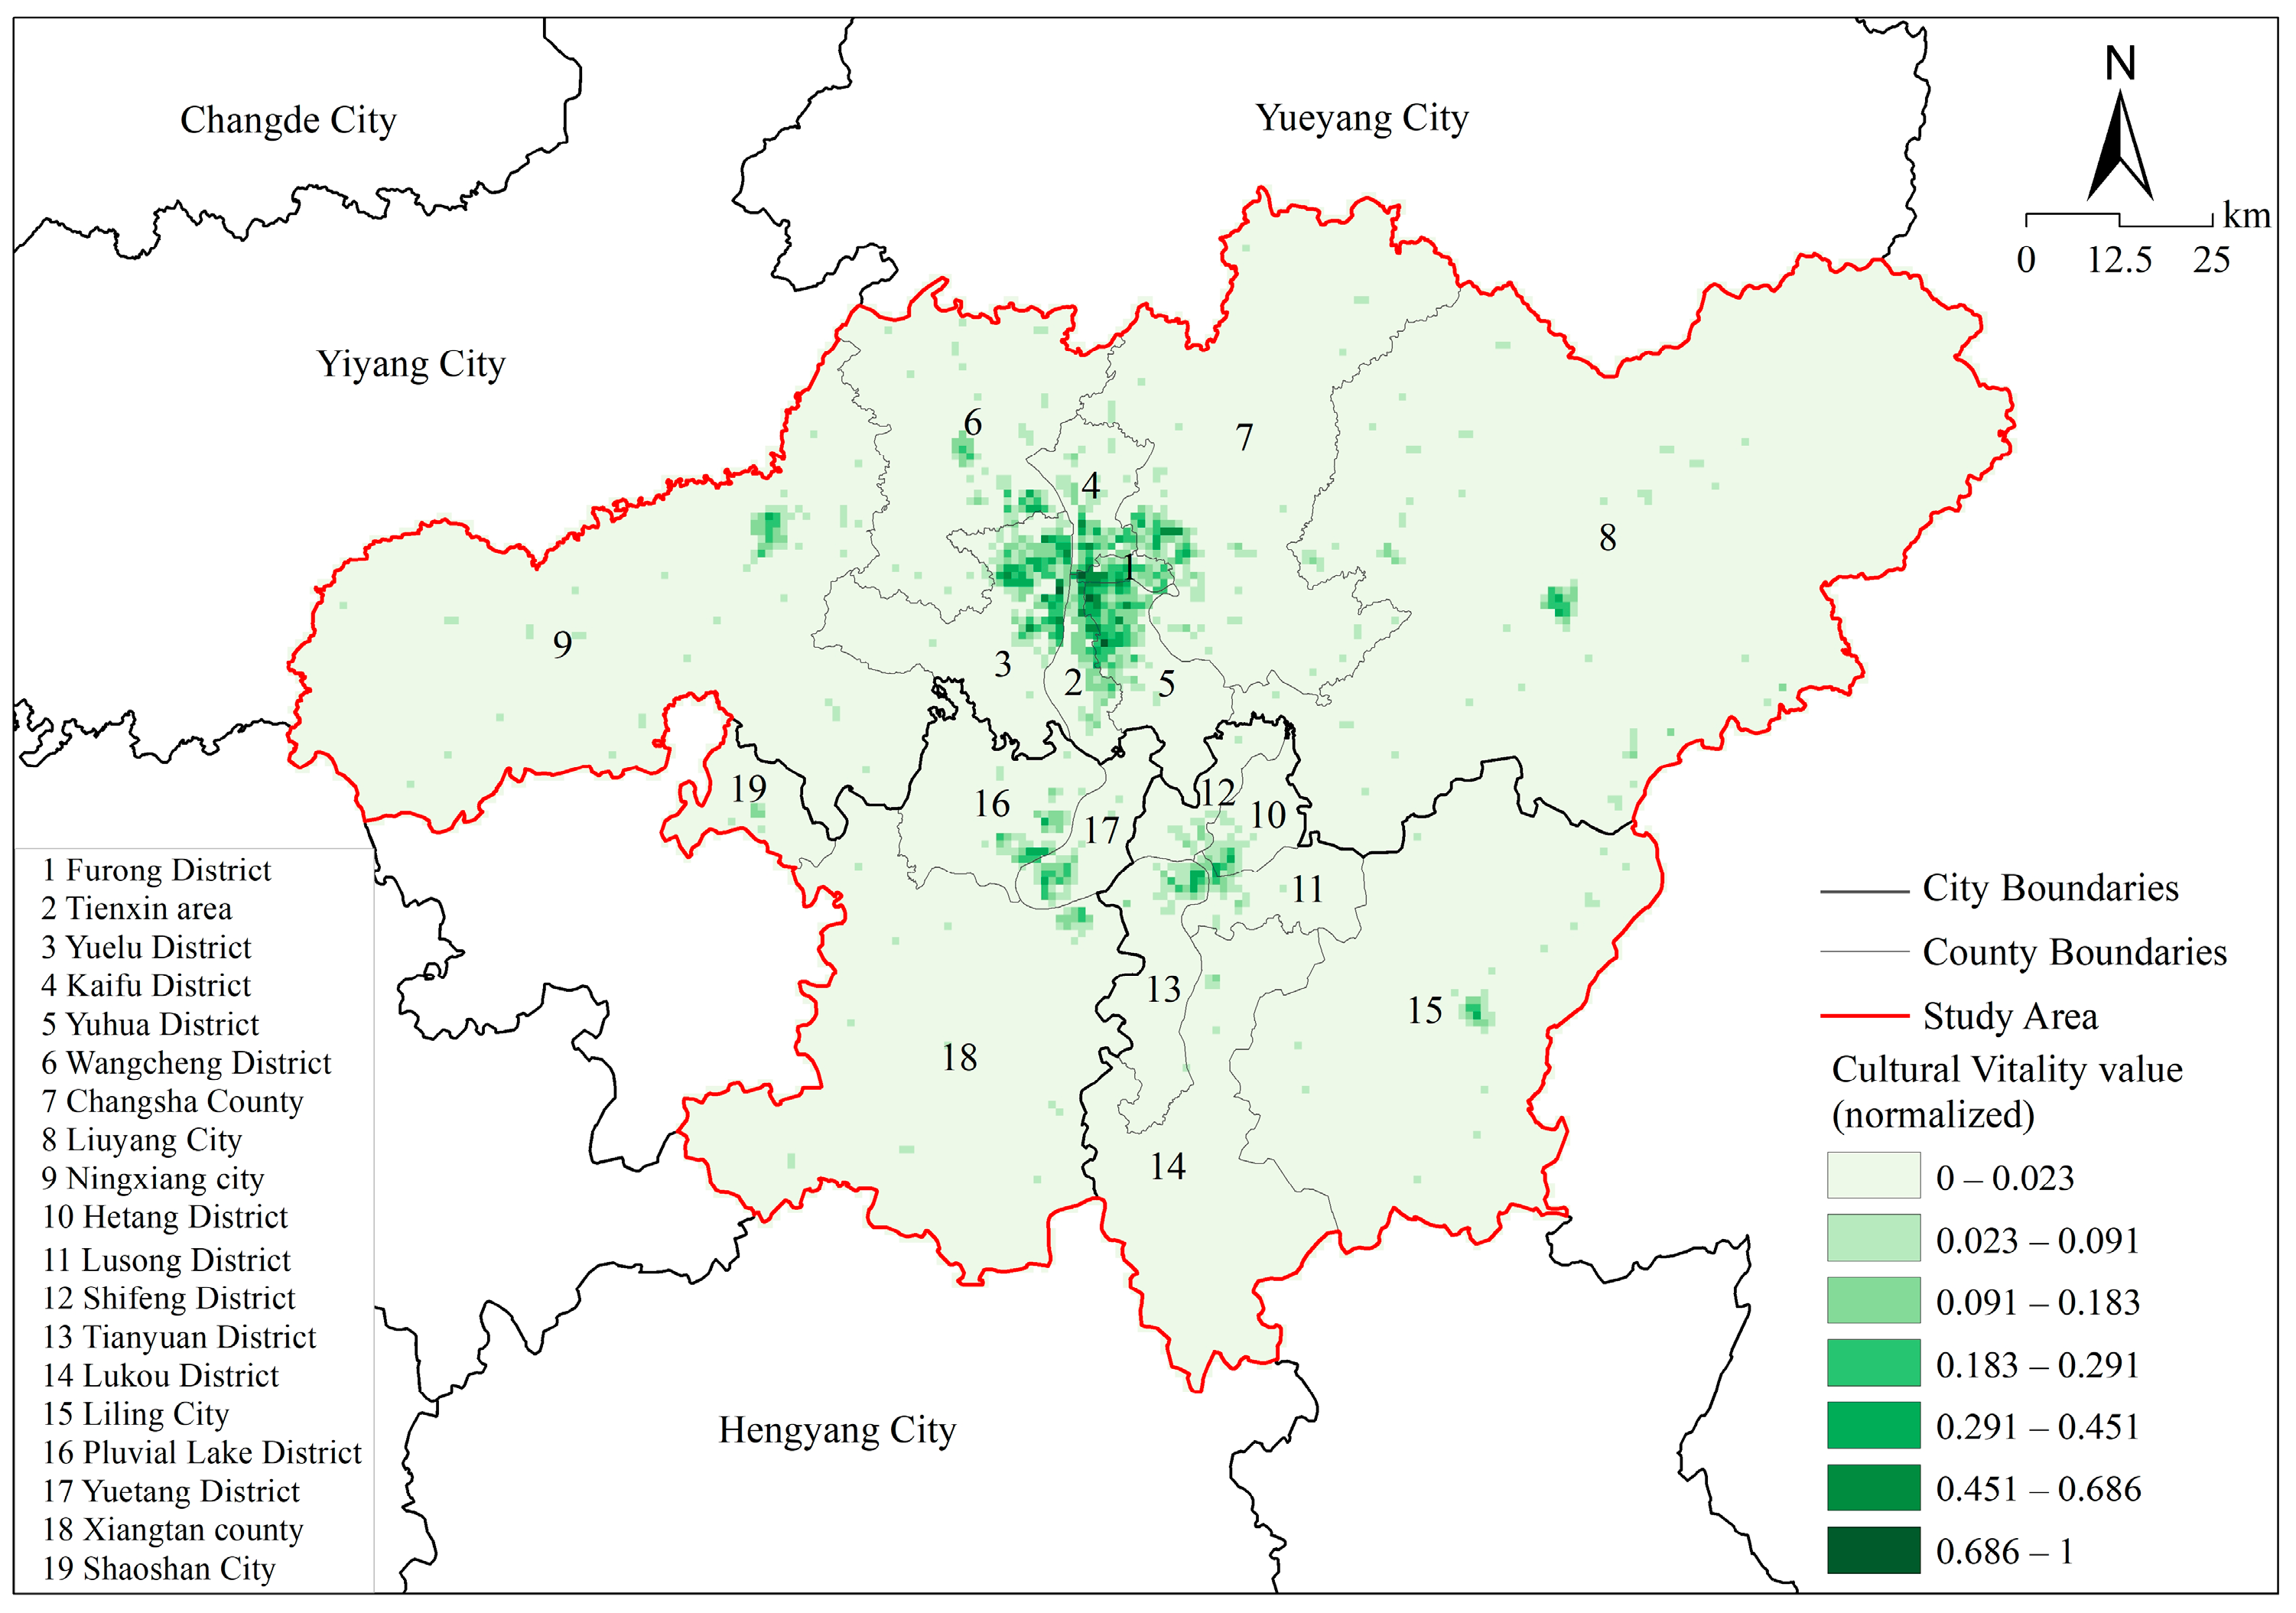
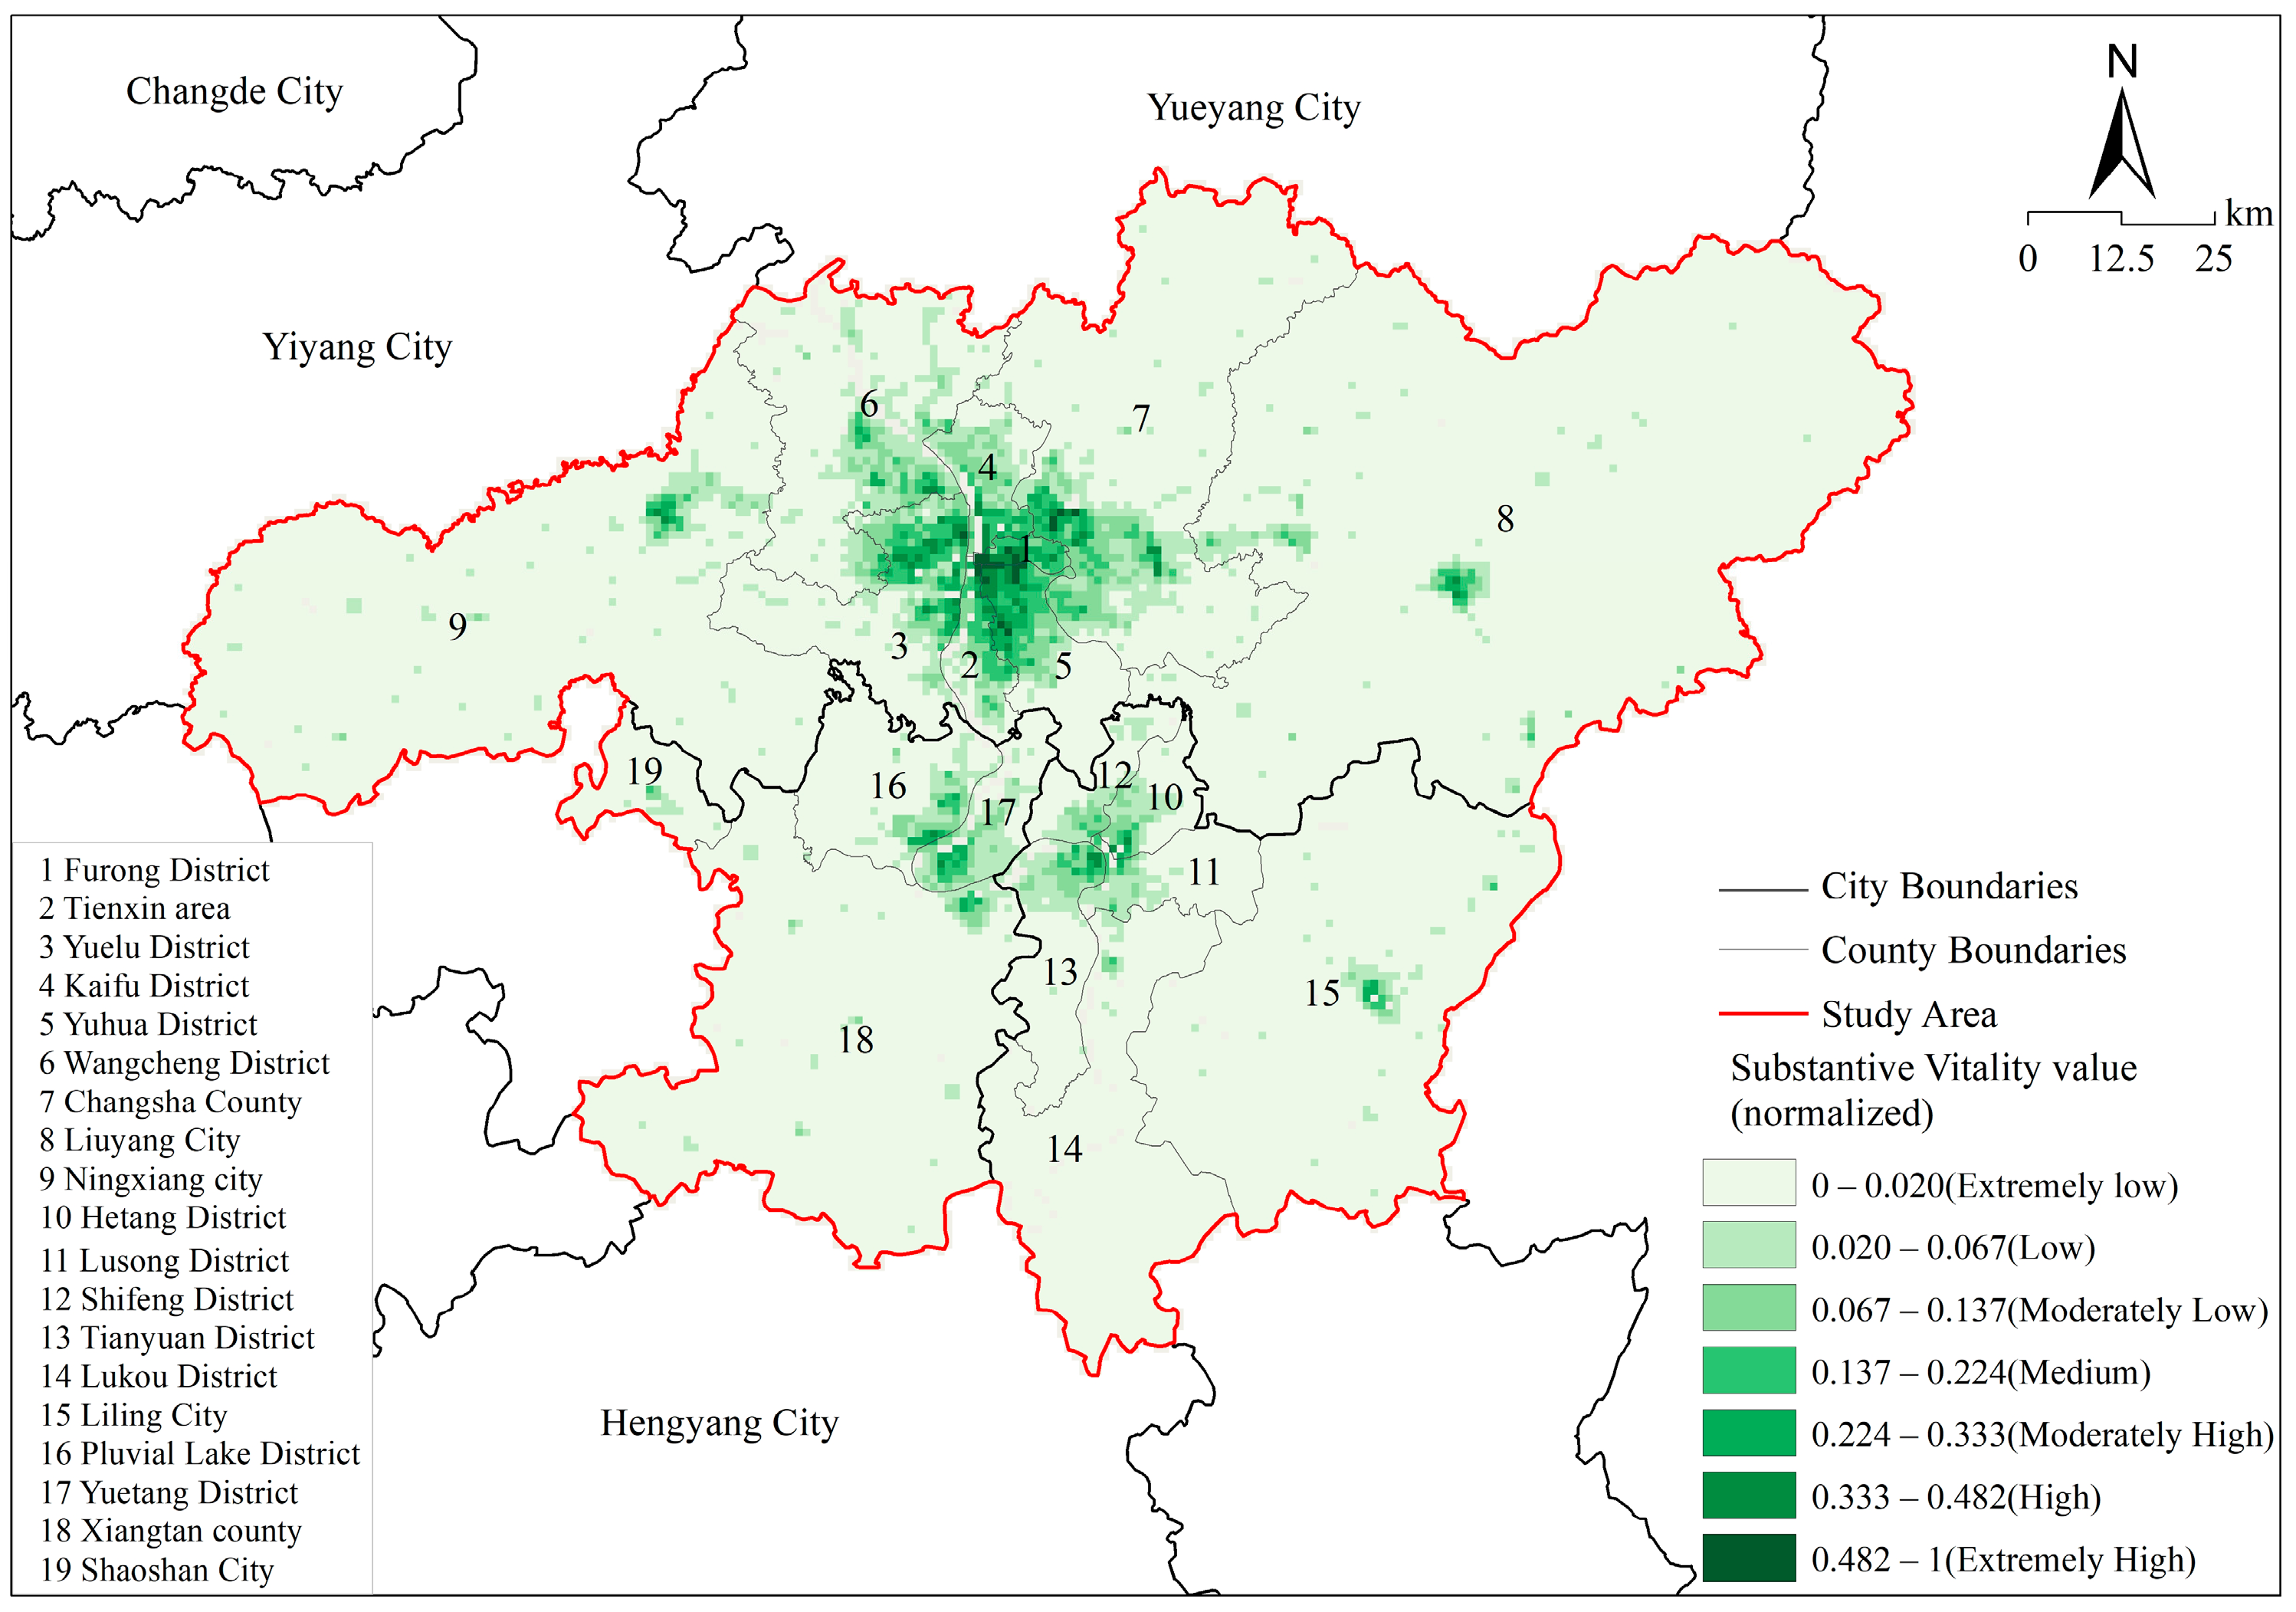
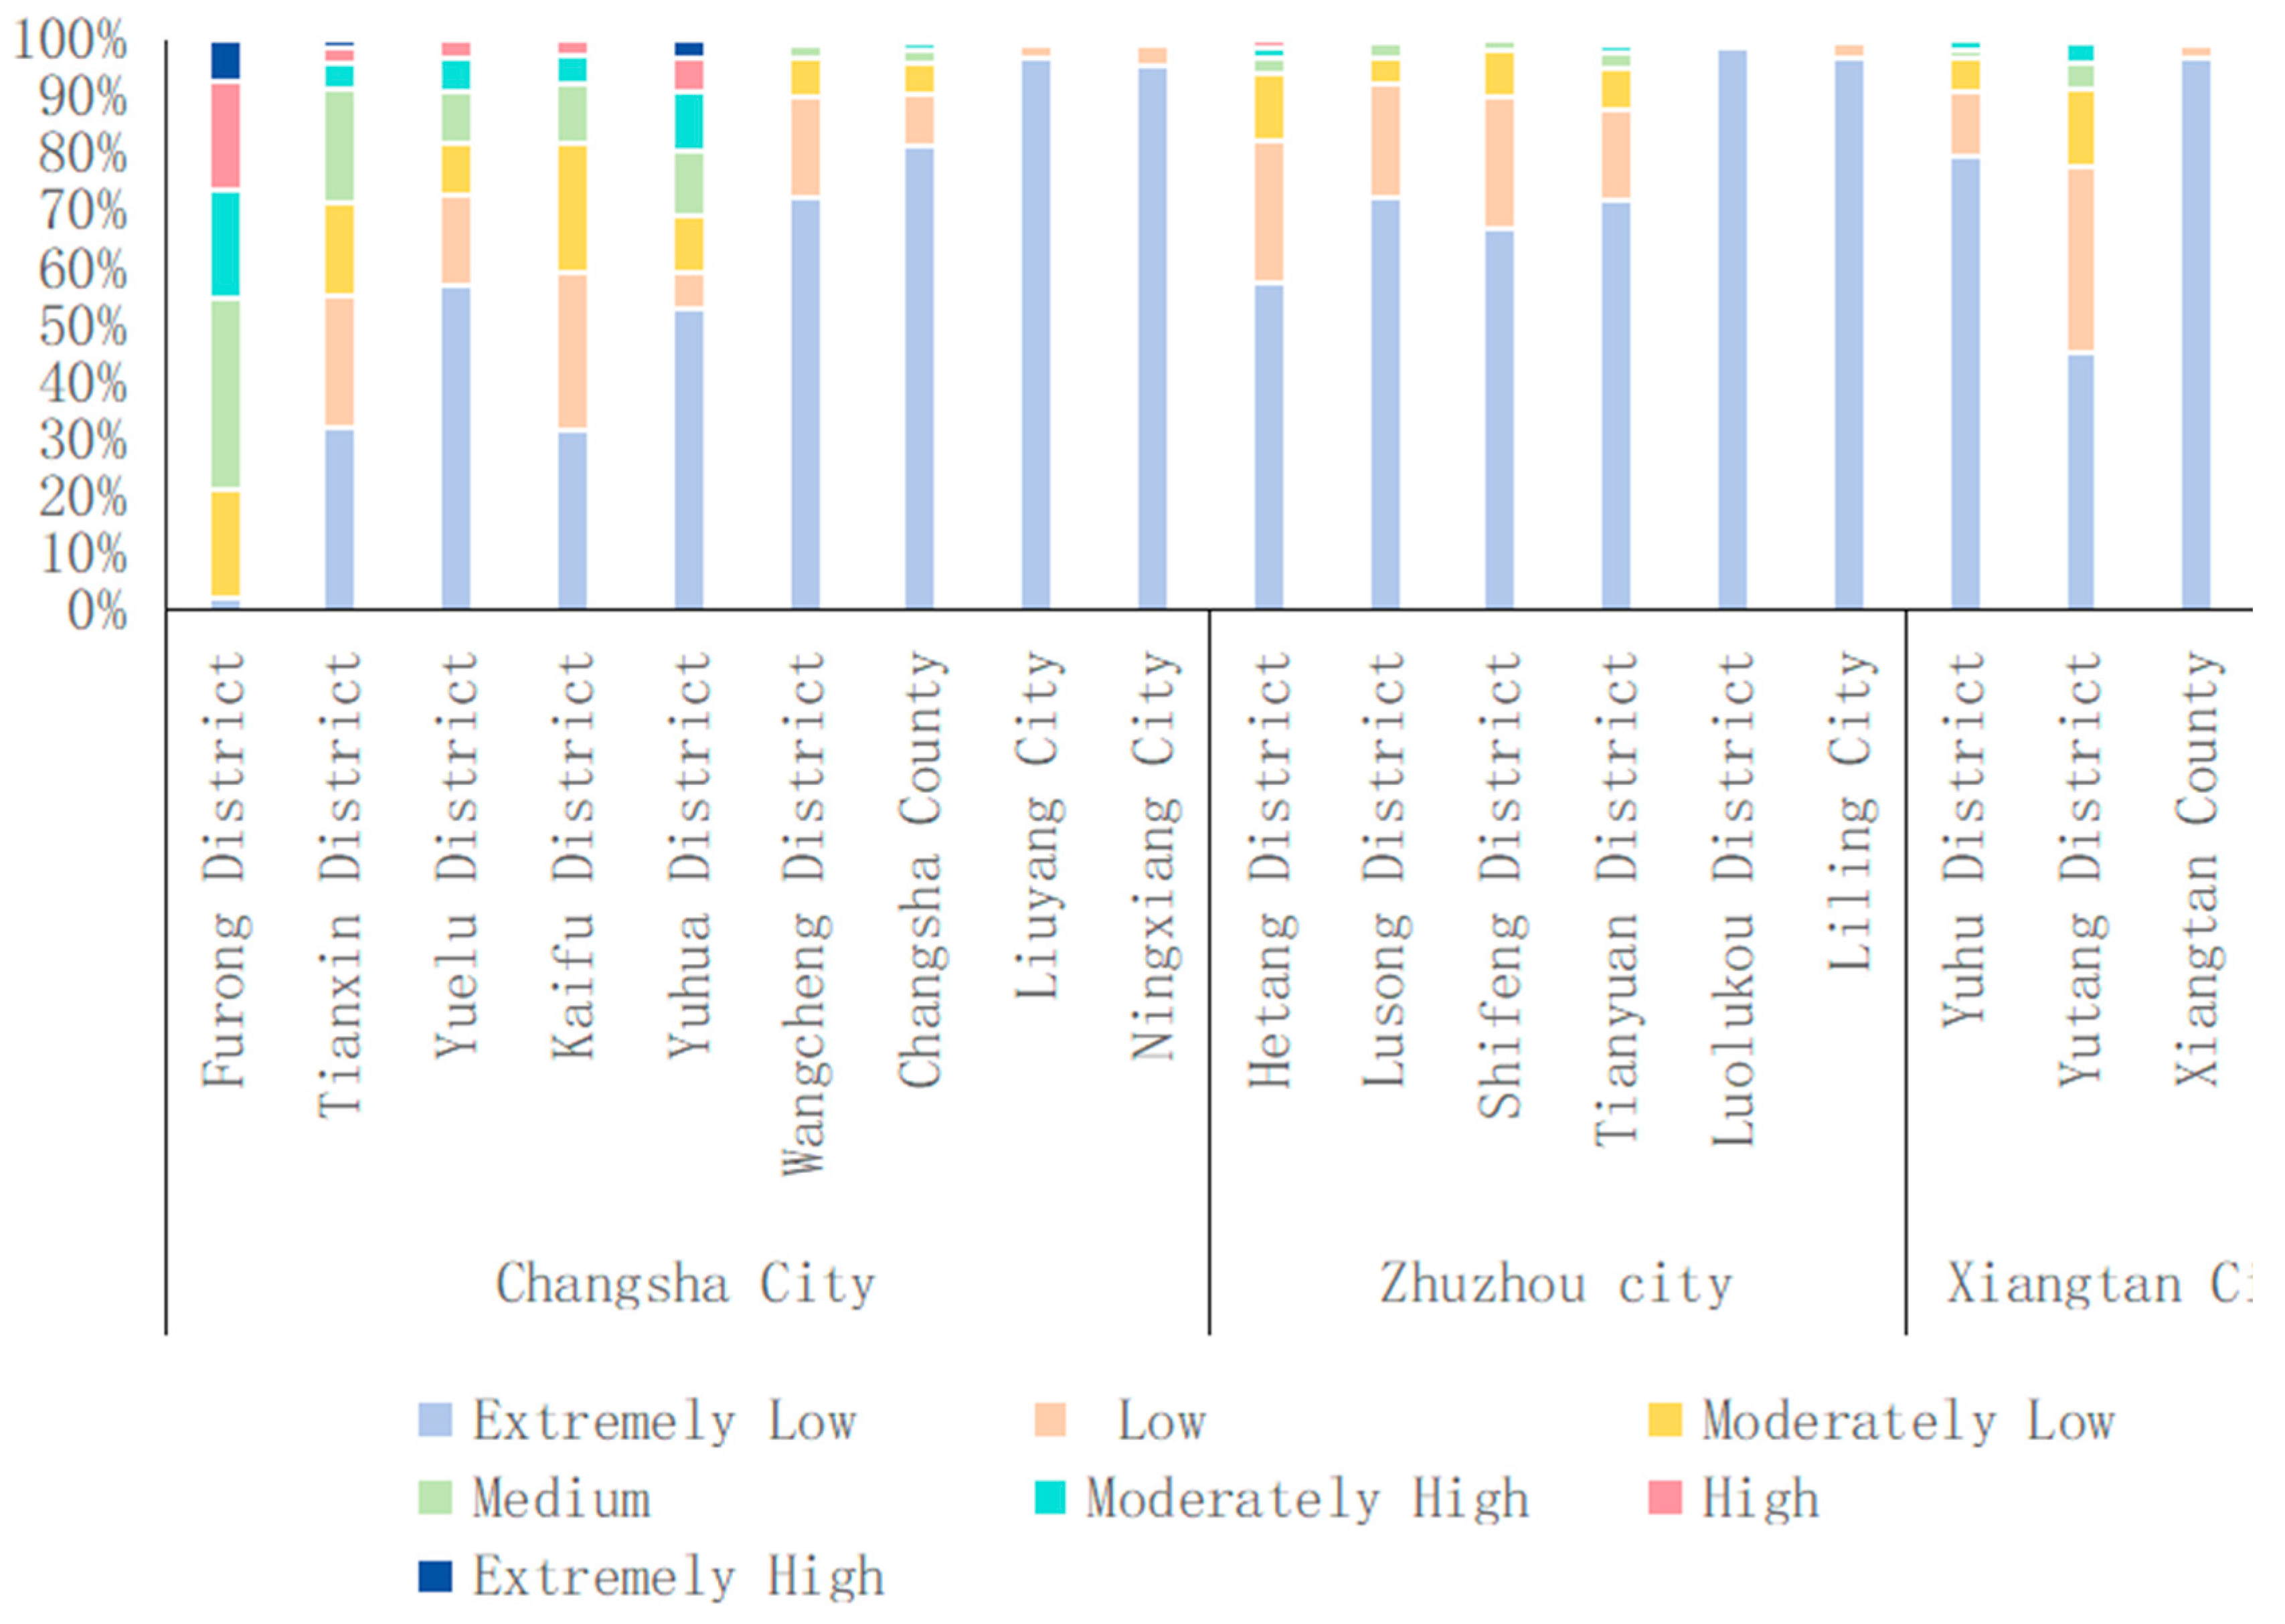
4.2.2. Characterization of the Distribution of Substantive Vitality in Metropolitan Areas Based on Crowd Activity

An analysis of the spatial vitality of economic, social and cultural entities in the metropolitan area reveals that the high concentration density of various types of vitality is mainly distributed in the central urban areas of Changsha, Zhuzhou and Xiangtan, with a gradual decrease towards the periphery.
(1)
Social Vitality Spatial Patterns
The social vitality core clusters predominantly in Changsha’s central districts (Tianxin, Yuelu, Yuhua), characterized by high population density, (comprehensive public services, and intensive social interactions. Secondary vitality peaks emerge in Zhuzhou’s Hetang, Tianyuan, Lusong, Shifeng districts, and Xiangtan’s Hetang and Yuhu districts, albeit with limited spatial extents. Notably, suburban high-value clusters in Ningxiang, Wangcheng (Changsha), Liling (Zhuzhou), and Xiangtan County demonstrate a polycentric development pattern combining central polarization and multi-nodal agglomeration (Figure 11).
(2)
Economic Vitality Spatial Configuration
Economic vitality exhibits strong spatial centrality, with Changsha’s core districts demonstrating unparalleled dominance. Three-tier concentric diffusion patterns radiate from municipal cores. Primary cores are as follows: central urban areas of all three cities, generating significant spillover effects; secondary clusters: Ningxiang, Liuyang (Changsha), and Liling (Zhuzhou) showing localized economic hotspots; peripheral zones: exhibiting distance-decay vitality characteristics. This spatial hierarchy aligns with the 2023 county-level GDP distributions (Figure 12).
(3)
Cultural Vitality Spatial Features
Cultural vitality demonstrates fragmented distribution patterns compared to economic dimensions. While Changsha’s core maintains cultural dominance, significant suburban clusters emerge in Wangcheng, Ningxiang, and Liuyang. Zhuzhou and Xiangtan’s urban cores exhibit moderate cultural vitality, with additional clusters in Liling (Zhuzhou) and Shaoshan/Xiangtan County (Xiangtan) (Figure 13).
The metropolitan area exhibits a distinct “core-periphery” spatial structure with emerging multi-nuclear agglomeration, demonstrating a transitional trend from singular-core dominance to polycentric development. Substantive vitality is predominantly concentrated in Changsha’s core districts (Furong, Tianxin, Yuhua, Yuelu), followed by secondary clusters in Zhuzhou’s Hetang, Shifeng, Tianyuan, Lusong districts and Xiangtan’s Yuhu-Yuetang area. Notably, suburban high-value vitality nodes are observed in non-central regions: Changsha County, Wangcheng, Liuyang, Ningxiang (Changsha), Liling (Zhuzhou), and Xiangtan County (Xiangtan), collectively forming a multi-layered spatial hierarchy (Figure 14).
Using natural breaks classification, substantive vitality is divided into seven tiers. Extremely high vitality grids (0.10%) are exclusively located in Changsha’s Yuhua, Furong, and Yuelu districts. High-value grids (0.37%) extend to central Zhuzhou and Xiangtan, while medium-high (0.78%), medium (1.43%), and medium-low tiers (2.58%) predominantly occupy transitional zones between urban cores and peripheries. Low and extremely low vitality grids (6.00% and 88.74%, respectively) dominate peripheral areas. Compared to urban scale distribution, the reduced proportion of low-value vitality grids and increased extremely low grids indicate heightened spatial polarization in substantive vitality allocation (Table 4, Figure 15).

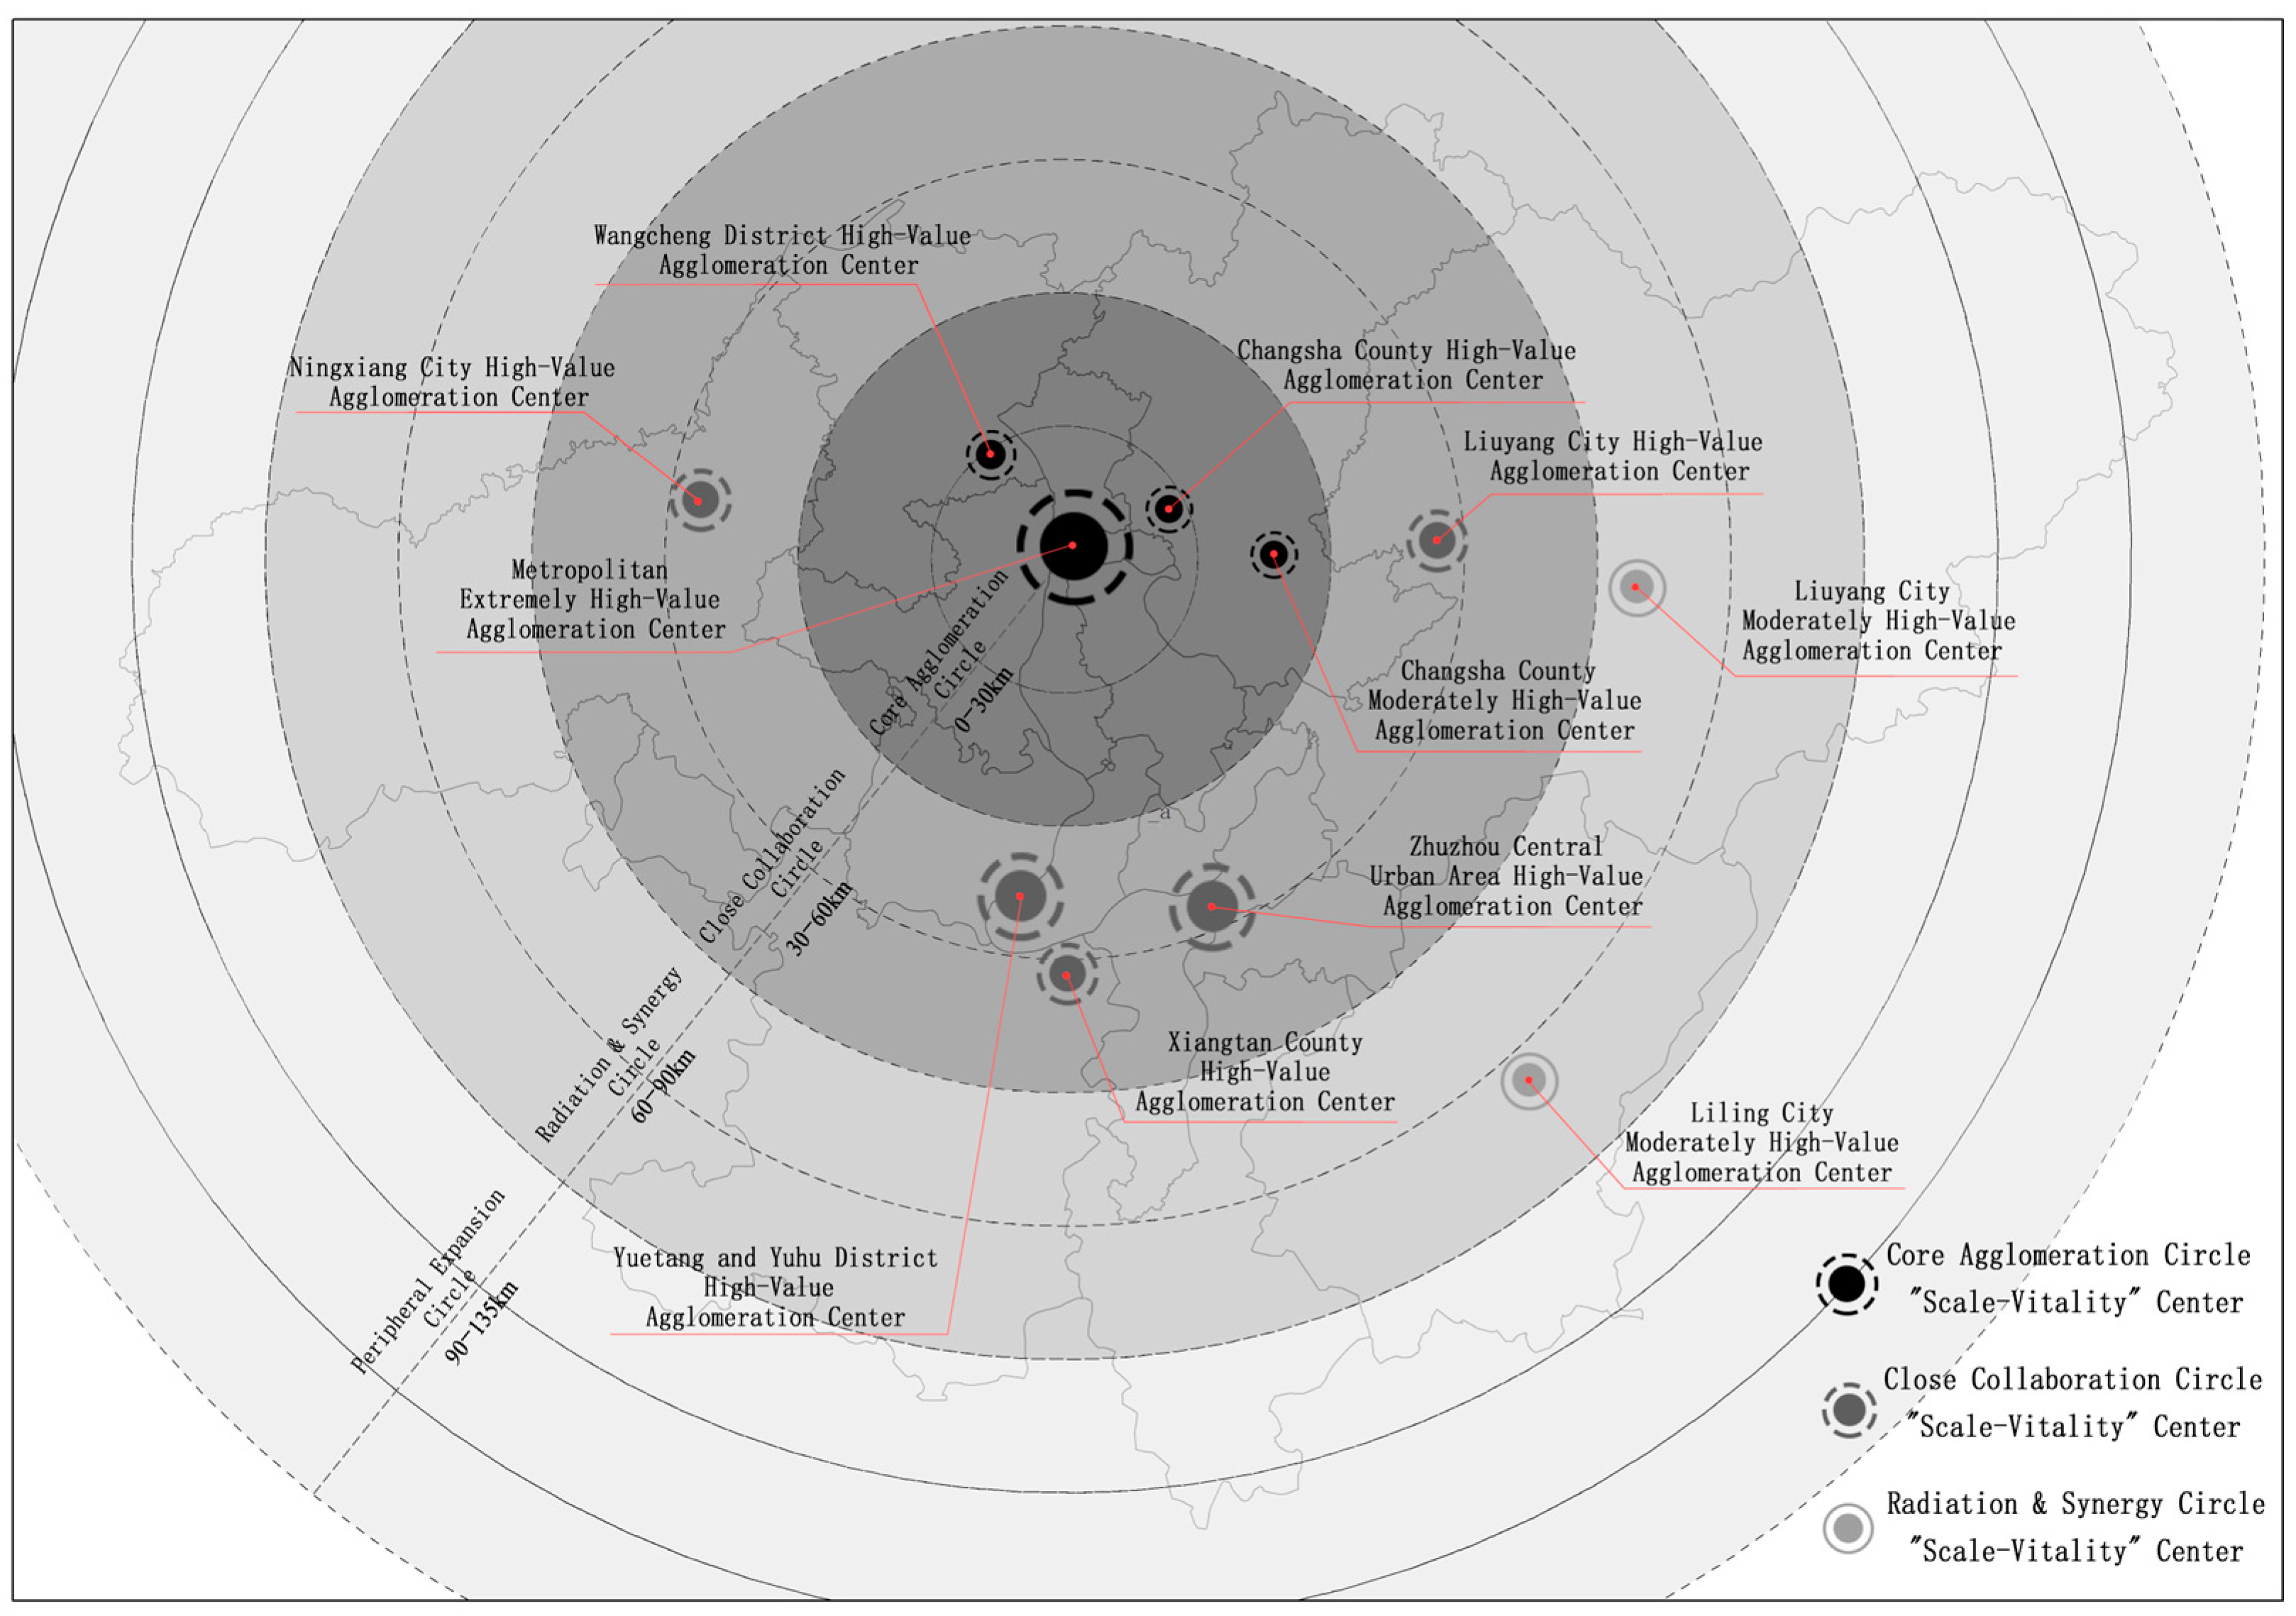
4.3. Metropolitan Area Hierarchical Structure Model

To elucidate the scale-vitality relationship, this study diverges from conventional metropolitan zoning methods based on population or urbanization rates [39,40]. By integrating urban scale metrics (population, land use, economy) with virtual–substantive vitality analysis and the ChangZhuTan Metropolitan Development Plan, we propose a multi-layered spatial framework. Designating Furong District (Changsha), exhibiting concurrent high-scale and high-vitality values, as the metropolitan nucleus, we employ 15 km radial intervals to delineate the following four functional zones (Figure 16):
Core agglomeration zone (0–30 km): encompassing Furong, Kaifu, Yuelu, Tianxin, Yuhua districts, and parts of Changsha County, this zone demonstrates peak scale-vitality integration (extremely high to high values).
Close collaboration zone (30–60 km): covering peripheral areas of Changsha’s core and central districts of Zhuzhou/Xiangtan, showing moderate scale-vitality indices.
Radiation synergy zone (60–90 km): centered on Liuyang (Changsha) and Liling (Zhuzhou), forming secondary vitality growth poles with strong inter-city connectivity.
Peripheral expansion zone (90–135 km): comprising metropolitan fringe territories with minimal scale-vitality values and no significant clusters.
This zoning system, informed by Wang, C. and Qian, Z.’s metropolitan radius theories [41,42], visually deciphers the “core-satellite” gradient pattern of urban development intensity across the ChangZhuTan metropolitan area.

5. Analysis of the Degree of Co-Ordination Between Urban Vitality and Scale Coupling

5.1. Analysis of the Correlation Between City Scale and Virtual–Substantive Vitality

Utilizing ArcGIS spatial analytics and predefined scale-vitality classifications, we conducted grid-level correspondence between urban scale and virtual–substantive vitality indices. Each classification tier (“extremely low” to “extremely high”) was numerically encoded (1–7). Stata 16.0-based correlation analysis (Table 5) reveals the two following key findings:
(1)
Significant positive correlations (p < 0.001) exist between urban scale and both vitality dimensions, with stronger scale-substantive vitality linkages (β = 0.747) than scale-virtual vitality (β = 0.417).
(2)
Hierarchical analysis uncovers spatial heterogeneity in scale-vitality interactions across metropolitan zones.
Specifically, at the aggregate level, both size and real and virtual vitality show significant positive correlations at the 1% level, indicating that urban scale growth has a positive effect on the enhancement of real and virtual vitality in cities. Secondly, the correlation coefficient between scale and real and imaginary vitality in the core agglomeration circle increases compared to the overall level, indicating that the increase in size in this circle enhances vitality more than the overall level. However, within the close collaboration circle, the correlation coefficient between scale and both real and imaginary vitality decreases compared to the overall level, indicating a reduced influence of scale growth on the enhancement of real and imaginary vitality within this circle. Simultaneously, it is evident that in both the radial linkage and peripheral expansion circle, the correlation coefficient between scale and real and imaginary vitality continues to decrease compared to the overall level. Similarly, in the core aggregation and the close collaboration circles, this also further illustrates the gradual increase in scale on the degree of real and imaginary vitality within the circles. The correlation coefficient between scale and real and virtual vitality has been decreasing, which further indicates that the scale is gradually decreasing in this circle. It is worth mentioning that the virtual vitality of the peripheral expansion circle tends to be close to zero compared to the core circle, thus the correlation between size and virtual vitality of this circle is extremely low.

5.2. Coupling Evaluation

5.2.1. Evaluation of the Coupling of Urban Scale and Virtual Vitality

At the metropolitan level, the coupling values between urban scale and virtual vitality predominantly fall within the [0, 1] range, indicating a generally high degree of integration. Specifically, central urban areas of Changsha, Zhuzhou, and Xiangtan exhibit coupling values ≥ 2, reflecting a “scale advancement-vitality lag” phenomenon. Significant positive coupling clusters are observed in Wangcheng, Ningxiang, Liuyang, and Changsha County (Changsha), Liling (Zhuzhou), and Xiangtan County (Xiangtan). This spatial pattern arises from the following two factors:
(1)
High population density and intensive built environments in these areas contribute to elevated urban scale values.
(2)
Aging populations in older urban districts (e.g., Furong District in Changsha, Shifeng District in Zhuzhou) exhibit lower engagement with digital platforms, leading to mismatched scale-virtual vitality relationships.
Conversely, negative coupling values appear sporadically in peripheral zones adjacent to urban cores, where younger demographics drive high virtual vitality through active social media use, despite limited physical infrastructure development (Figure 17).
However, it can also be found that there are a small number of areas with negative coupling values in the radiating areas of urban centers, which may be due to the fact that the number of young people in this type of area is relatively large, and the use of new media on the Internet is more frequent. This leads to the emergence of a high value of virtual vitality, and at the same time, this type of area may be located in the periphery of the core area of urban construction, so that the overall scale of the construction of the overall level of lower levels (Figure 17). In order to further explore the scale and virtual vitality coupling degree of different circles in the metropolitan area, and clarify the circle relationship between the two, this paper therefore carries out statistics on the scale and virtual vitality coupling grid by circle (Table 6). It can be found that the coupling number of each circle coupling relationship accounts for a large proportion, and as the circle expands outward, the proportion of the coupling number between scale and virtual vitality is also rising. In the core aggregation circle and close collaboration circle, there is a phenomenon of non-coupling, which may be because this part of the circle in this category lacks the intensity of virtual vitality excavation, while the urban construction has become a scale. On the whole, the core aggregation circle shows high value coupling, and the peripheral expansion circle shows low value coupling.

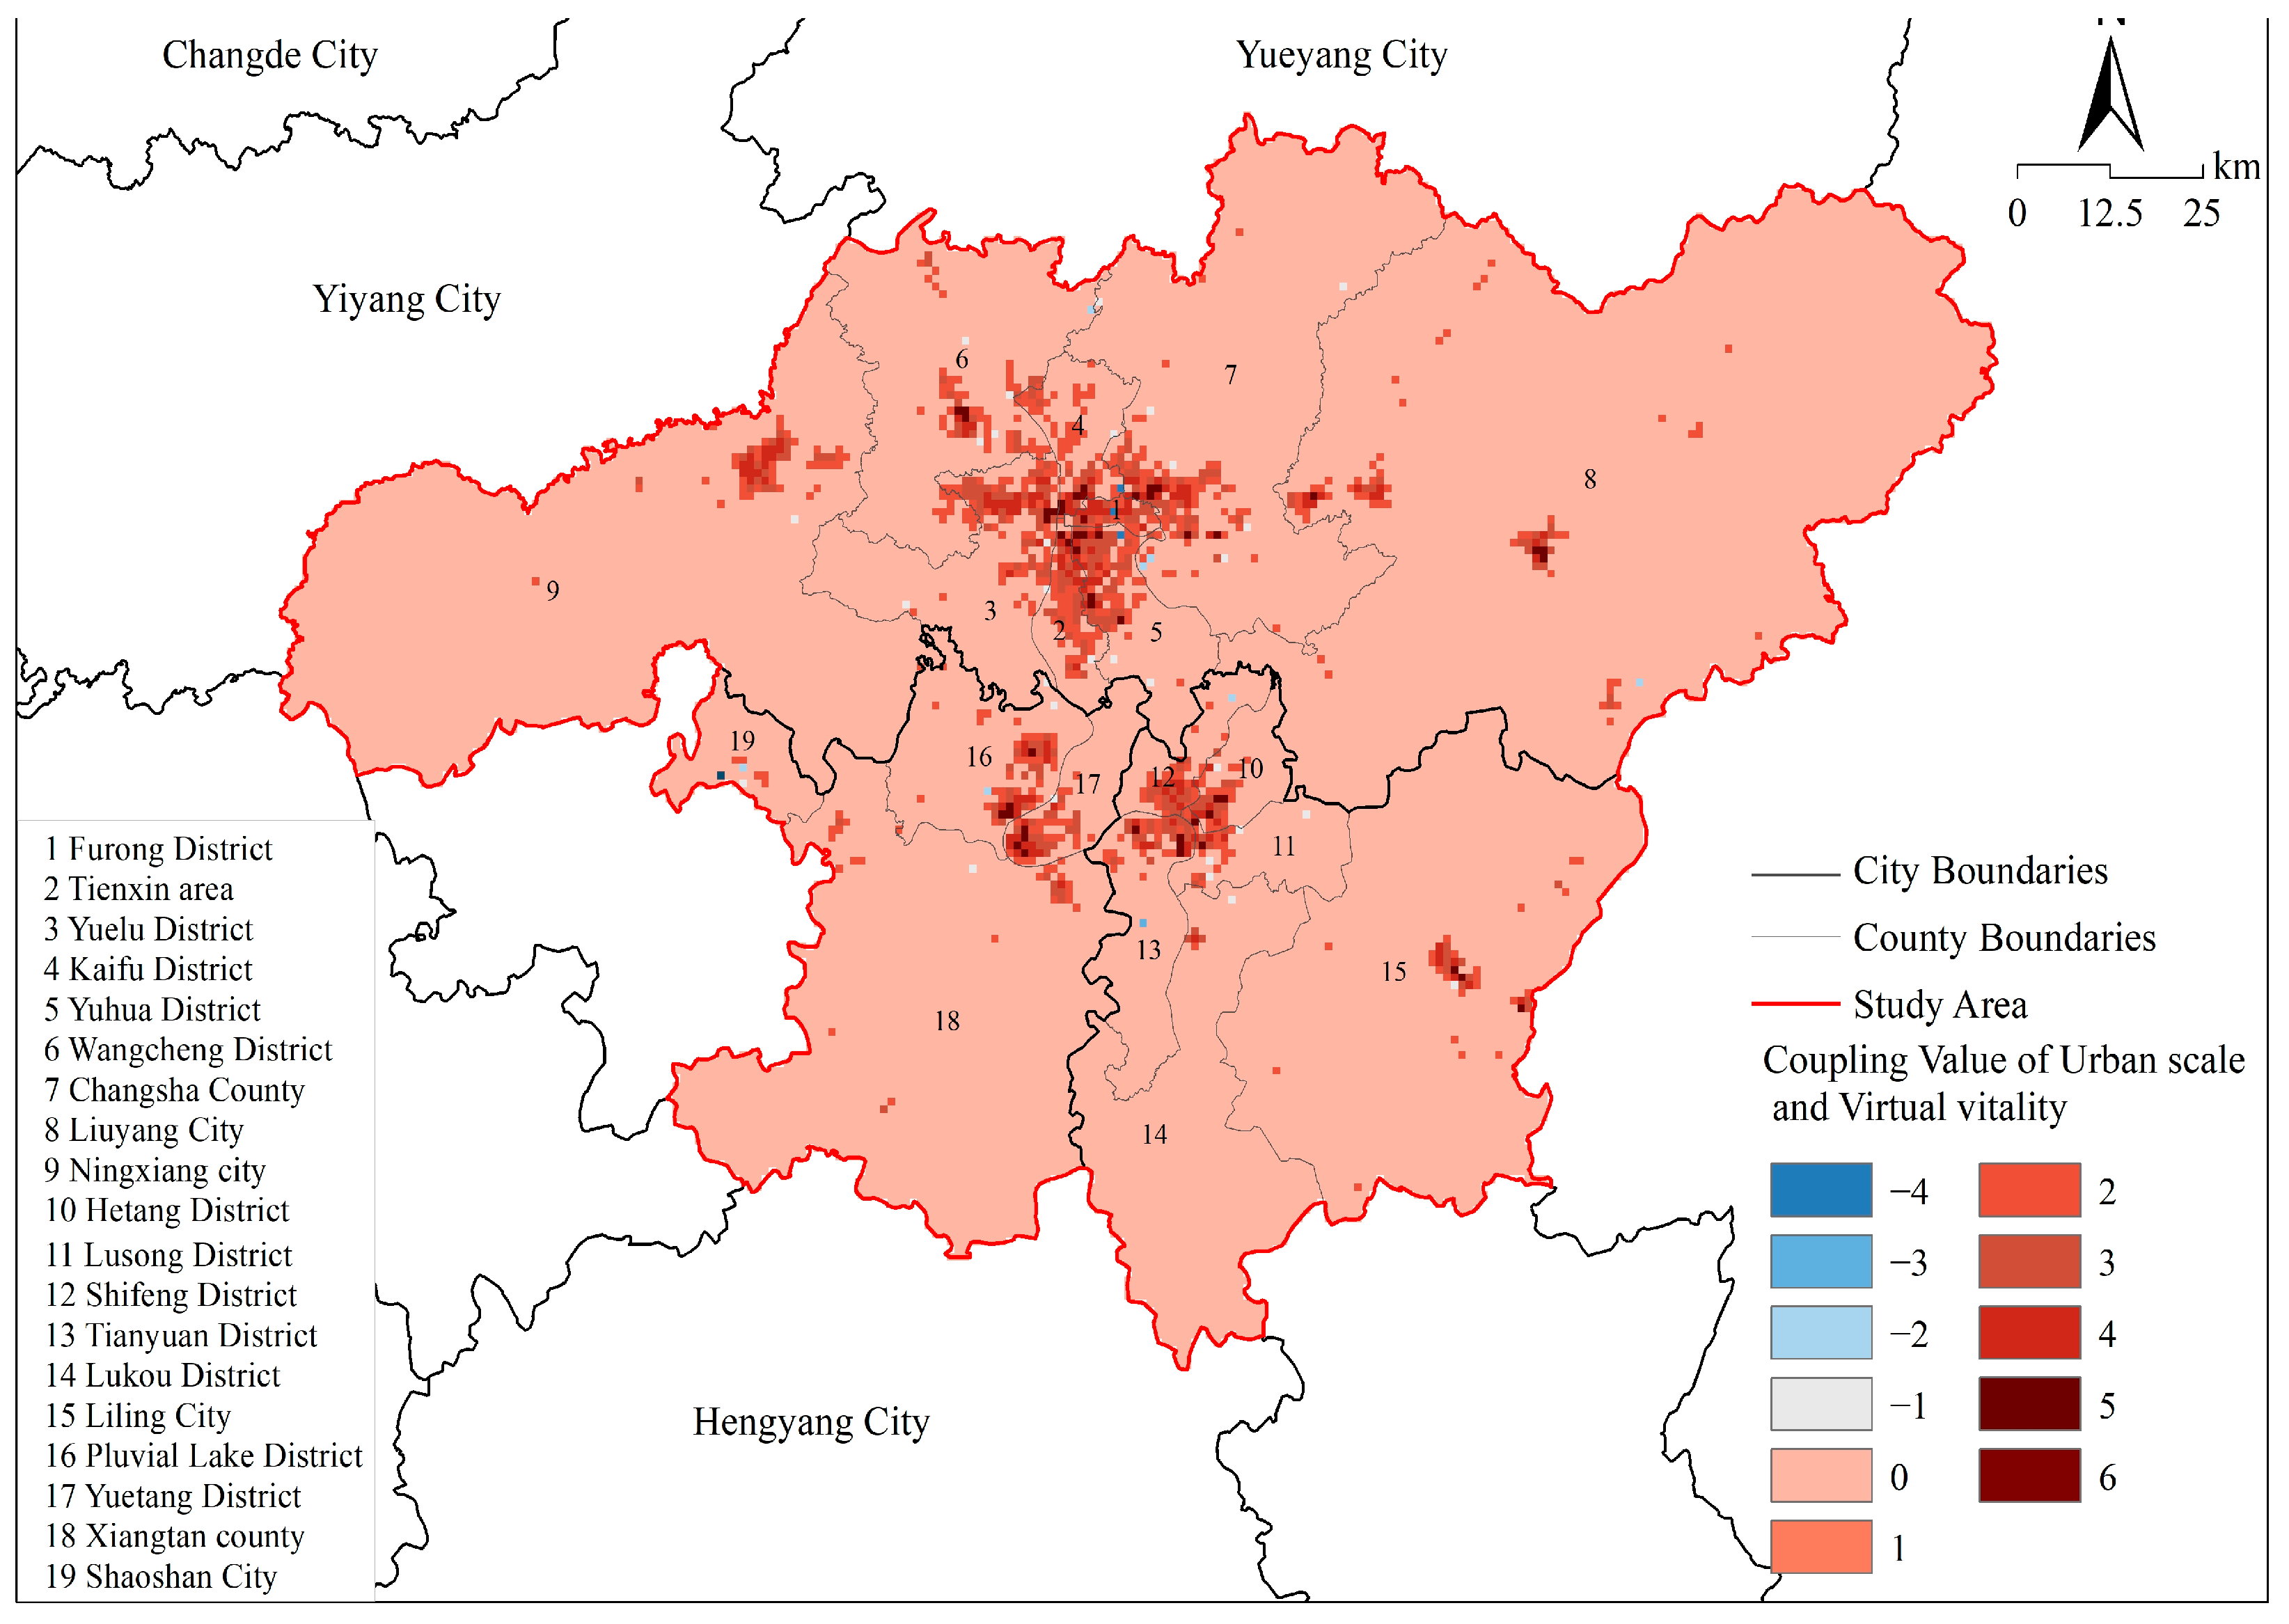
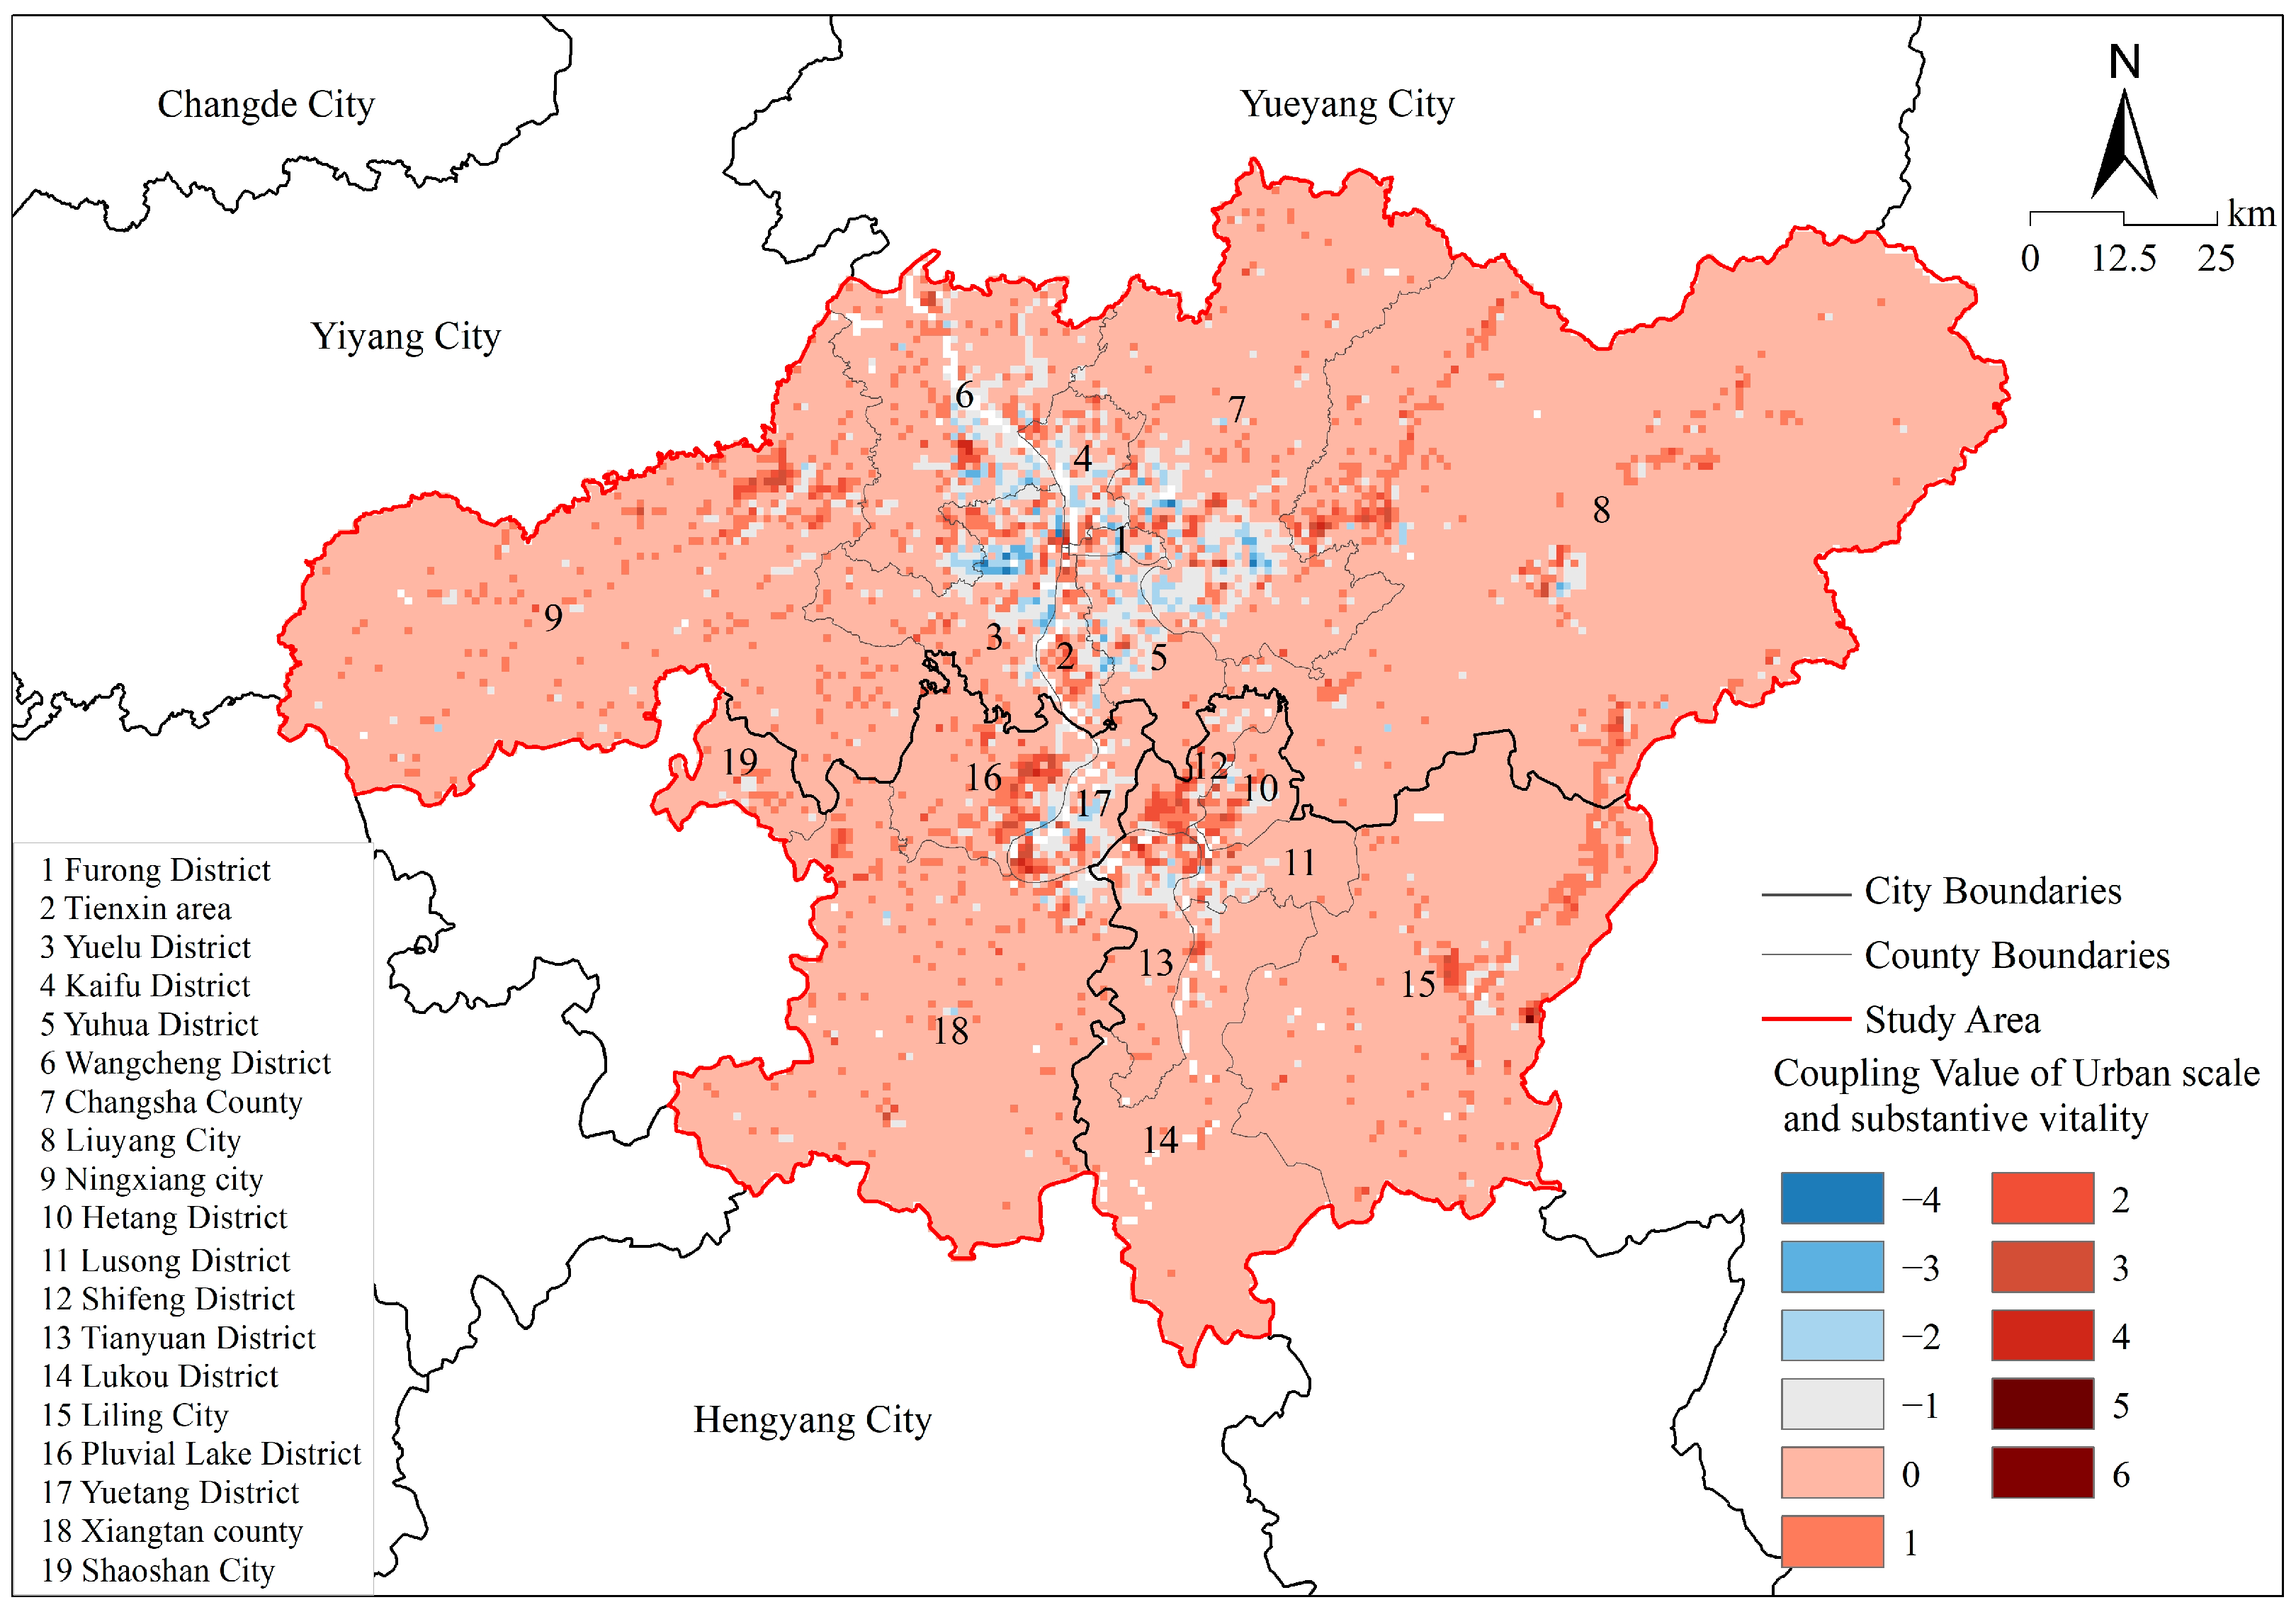
5.2.2. Evaluation of the Coupling of Urban Scale and Substantive Vitality

Compared with the coupling analysis of urban scale and virtual vitality, there is a large number of negative coupling areas in the coupling of urban scale and substantive vitality. On the whole, the overall degree of coupling between city scale and substantive vitality is high, and the range of coupling values is mostly between [−1, 1]. Specifically, the three urban centers of Changsha, Zhuzhou and Xiangtan have more obvious negative coupling values, which manifests as “vitality ahead scale shortage”. However, it should be noted that there are positive and negative coupling values interspersed with each other in the urban centers, which on the one hand indicates that the substantive vitality of the central urban areas is not sufficiently developed, and on the other hand also reflects the reality of the dilemma of overbuilding in the urban centers. Secondly, Wangcheng District, Changsha County and Liuyang City in Changsha City and Xiangtan County in Xiangtan City outside the urban centers have negative coupling values, and the coupling values of “scale-substantive vitality” and “scale-virtual vitality” are opposite to each other, which can be indirectly seen that the substantive vitality of this type of region does not fully promote the generation of virtual vitality. Again, the analysis results show that there are many positive coupling characteristics in the periphery of the metropolitan area, such as Ningxiang City, Wangcheng District and Liuyang City in Changsha City, and Liling City in Zhuzhou City, etc. This indicates that the substantive vitality of the area is lower compared to the scale. This may be due to the loss of permanent population in this type of area, which leads to substantive vitality not being enough to match the existing city scale (Figure 18). Similarly, the coupling relationship between city scale and substantive vitality is divided into circles (Table 7), and it can be found that the ratio of the coupling number in the coupling relationship increases with the expansion of the circle. Moreover, only the core aggregation circle appears to be uncoupled between the circles. The rest of the circle as a whole presents the spatial status quo of coupling and basic coupling. It can be found that the coupling of substantive vitality and city scale has a high degree of coordination.

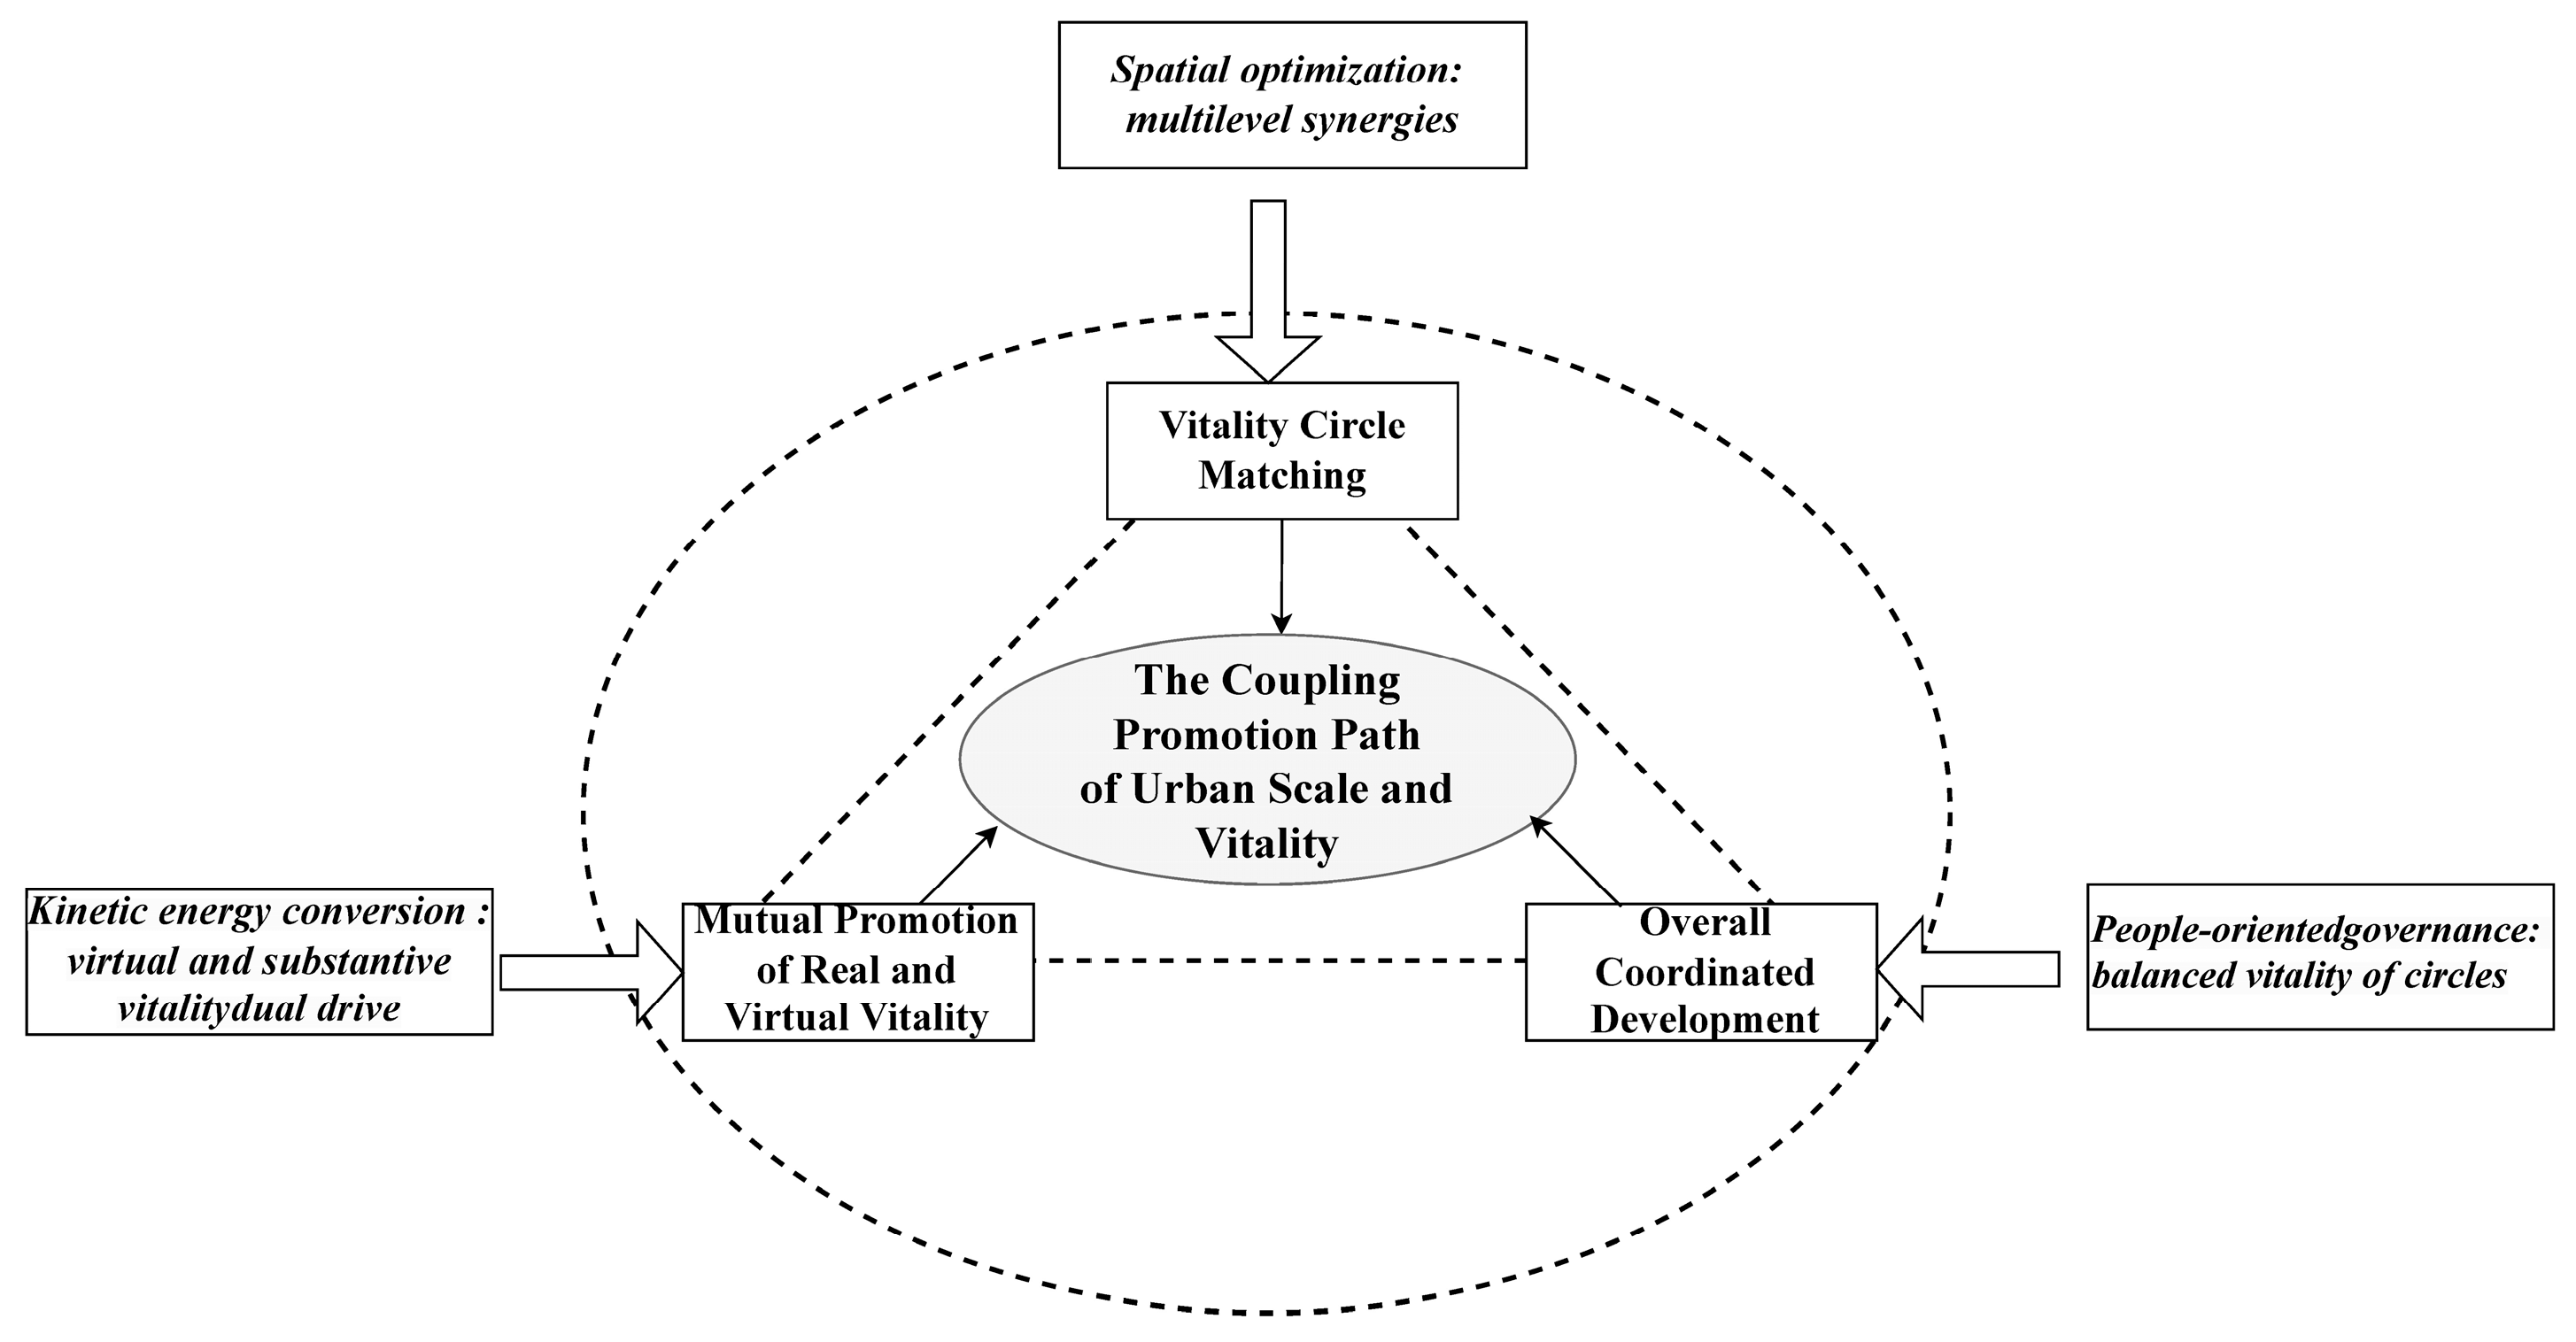
6. The Coupling Promotion Path of Urban Scale and Vitality

6.1. Spatial Optimization: Multi-Level Synergies

Multi-level synergy has a better guiding and regulating effect on the allocation and utilization of resources in the metropolitan area. Based on the existing research and combined with the Changzhutan metropolitan area development plan, it can be found that the core agglomeration circle, as a metropolitan area scale and vitality threshold circle, has a more obvious role in driving the neighboring regions; thus it should further strengthen the functions of scientific and technological innovation, high-end manufacturing, etc. At the same time, it can be used for the general manufacturing industry and the logistic base, etc., to be relocated to the surrounding circles, so as to promote the overall land use efficiency. Secondly, the close collaboration circle covers multiple “scale-vitality” agglomeration sub-centers, such as the central urban areas of Zhuzhou and Xiangtan, Liuyang City and Ningxiang City in Changsha, etc., which should be further strengthened to promote vitality by linking with the core city in functions like industry, business, public service and recreation, etc. [43]. According to the coupling relationship between scale and vitality, it can be found that the radial linkage circle and the peripheral expansion circle are mostly coupled with positive values. Therefore, on the one hand, it is necessary to control the scale of urban construction and rely on the existing construction to improve the quality of the city. On the other hand, it is necessary to use high-speed railways and other traffic trunk lines to enhance traffic connectivity and accessibility in order to attract external resources to strengthen urban vitality. At the same time, it is also important to focus on intra-city transportation development, as highly connected urban transportation can improve urban vitality as a whole [36].

6.2. Kinetic Energy Conversion: Virtual and Substantive Vitality Dual Drive

Substantive vitality and virtual vitality can realize synergistic gain through two-way mutual feedback mechanism, forming a composite dynamic evolution path. Urban substantive vitality and virtual vitality are closely linked with each other, with the highly relevant feature of “obvious and hidden mutual reference” [26], substantive vitality can drive the generation of virtual vitality, and virtual vitality can also reflect the strength of substantive vitality in the side. According to the measurement of virtual and real vitality, it can be seen that the virtual and real vitality has a large spatial difference, such as Changsha city center. The virtual and real vitality have shown a state of agglomeration. On the contrary, although the substantive vitality of Zhuzhou and Xiangtan City center is higher, their virtual vitality does not exhibit significant agglomeration. For the actual phenomenon of substantive vitality agglomeration but poor virtual vitality, on the one hand, cultural resources can be digitized, for example in Zhuzhou City, industrial heritage (such as the old industrial zone of Qingshuitang) can be used to build a digital museum of industrial culture to enhance the power of cultural communication. Xiangtan City can be digitized for the development of red cultural resources, attracting young people to participate in the virtual interaction. On the other hand, it can integrate the digital resources of the three cities of ChangZhuTan, enhance the viscosity of the virtual space, and improve the strength of the digital connection of ChangZhuTan. With the help of Changsha’s relatively perfect digital services in transportation, medical care, culture and tourism services, etc., it can drive the digital development of Zhuzhou and Xiangtan to stimulate the generation of virtual vitality.

6.3. People-Oriented Governance: Balanced Vitality of Circles

Reconstructing the spatial governance framework can effectively solve the dilemma of imbalance between the vitality of the core and peripheral areas and promote the balanced enhancement of the vitality of the whole region. The source of urban vitality lies in communication and interaction between people. The stronger the vitality of an area, the more frequent the communication between people. Conversely, the weaker the vitality of an area, the less communication there is between people. Residents’ participation is essential to sustain vitality. Constructing a multi-level participation framework comprising government guidance, community organization, and residents’ co-construction, can activate the endogenous dynamics of grassroots vitality. For instance, in the transformation of old communities with weak urban vitality, the introduction of the “participatory design” can engage residents. For example, in the renovation of old communities with weak urban vitality, a “participatory design” model can be introduced, where the function of public spaces (such as pocket parks and shared vegetable gardens) is determined through the consultation of residents’ councils, so as to enhance the sense of belonging and vitality. Secondly, social welfare organizations can be nurtured and empowered to transform their volunteer services into public service priorities, stimulating active participation in social affairs and boosting the vitality of urban entities. Once again, the system can be designed to guide the mobility of youth groups to the peripheral region and build a network of youth communities in the marginal areas of the metropolitan area, so as to enhance the vitality of these areas, and at the same time promote innovations in the distribution of resources, so as to further break the “siphonage” dilemma in the core cities (Figure 19).

7. Conclusions and Discussion

This study systematically investigates the coupling relationship between urban scale and virtual–substantive vitality within the ChangZhuTan metropolitan area through a “scale-vitality” analytical framework. First, we revealed the spatial differentiation patterns of urban scale and dual vitality (virtual and substantive). Second, we delineated metropolitan subzones based on scale-vitality gradients and quantified their correlation coefficients and coupling degrees across overall and zonal levels. Finally, we proposed pathways to optimize scale-vitality synergies. The key findings are as follows:
(1)
Core periphery structure of urban scale and vitality: the core urban area of Changsha exhibits high concentration in population, land use, and economic scale, followed by Zhuzhou and Xiangtan, while peripheral regions lag significantly.
(2)
Spatial divergence between virtual and substantive vitality: virtual vitality clusters predominantly in Changsha’s central districts without peripheral aggregation, whereas substantive vitality distributes across both core and selected peripheral areas.
(3)
Scale–vitality correlations: urban scale positively correlates with both vitality types, with stronger linkages to substantive vitality. Scale-driven vitality enhancement is more pronounced in core agglomerations.
(4)
Coupling dynamics: High coupling degrees exist between urban scale and dual vitality, particularly for virtual vitality. Coupling intensity transitions from high to low values radially from the core yet demonstrates an ascending trend.
This research provides theoretical foundations and practical insights for spatial planning and sustainable development in the ChangZhuTan metropolitan area. However, limitations should be noted:
(1)
Data constraints: the cross-sectional analysis, while revealing spatial patterns, lacks temporal dynamics of vitality evolution. Future studies should incorporate longitudinal data to track spatiotemporal vitality transitions.
(2)
Mechanistic gaps: focused on spatial analytics, this study is limited in exploring residents’ behaviors and socioeconomic drivers. Integrating surveys and interviews could unravel underlying social mechanisms.
(3)
Generalizability: comparative analyses across diverse metropolitan regions are needed to validate the universality of scale-vitality coupling principles.

Author Contributions

Conceptualization, C.Y. and Z.W.; methodology, C.Y., Z.W. and Y.W.; formal analysis, C.Y. and Z.W.; investigation, C.Y., X.C., W.Y. and M.J.; resources, C.Y. and X.C.; writing—original draft, C.Y., Z.W., X.C., W.Y. and M.J.; writing—review and editing, C.Y., Z.W., Y.W. and X.C.; visualization, Z.W., Y.W., X.C., W.Y. and M.J.; supervision, C.Y. and X.C.; project administration, C.Y., Z.W. and X.C.; funding acquisition, C.Y. and X.C. All authors have read and agreed to the published version of the manuscript.

Funding

National College Student Innovation and Entrepreneurship Training Program: S202411527123; Hunan Provincial Natural Science Foundation: 2022JJ50279; Hunan Provincial Natural Science Foundation of China: “Assessment and Optimization Path of Rural Residential Space Value for National Land Spatial Planning: A Case Study of Dongting Lake Region” (No. 2025JJ80057); Scientific Research Project of Hunan Provincial Department of Education: Evaluation and Optimization Strategies of Online-Offline Urban Spatial Vitality in the Digital Era: A Case Study of Changsha City: 24C0461; Yiyang Key Project of Philosophy and Social Sciences: Y0216927; Hunan City University 2024 Graduate Research Innovation Project: 2024KYCX10.

Institutional Review Board Statement

Not applicable.

Informed Consent Statement

Not applicable.

Data Availability Statement

Data will be made available upon request.

Conflicts of Interest

The authors declare no conflicts of interest.

References

  1. Mao, W.; Zhong, Y. Spatial pattern and influencing factors of urban vitality in the middle reaches of the yangtze river. World Reg. Stud. 2020, 29, 86–95. [Google Scholar] [CrossRef]
  2. Lynch, K. Good City Form; MIT Press: Cambridge, MA, USA, 1984; ISBN 978-0-262-62046-8. [Google Scholar]
  3. Jiang, D. The Theory of City Form Vitality; Southeast University Press: Nanjing, China, 2007; ISBN 978-7-5641-0627-0. [Google Scholar]
  4. Lu, J.; Zhang, F. Coordinated development of historical inheritance and the city’s vitality. New Archit. 2016, 32–36. [Google Scholar] [CrossRef]
  5. Implementation Plan for New Urbanization During the 14th Five-Year Plan Period. Available online: https://www.ndrc.gov.cn/fggz/fzzlgh/gjjzxgh/202207/t20220728_1332050.html (accessed on 22 February 2005).
  6. Sun, H.; Jiang, Y. Spatial heterogeneity of the impact of built environment on urban vitality: A case study of the central urban area of Nanjing. Geogr. Res. 2024, 43, 1700–1714. [Google Scholar]
  7. Jin, X.; Long, Y.; Sun, W.; Lu, Y.; Yang, X.; Tang, J. Evaluating Cities’ Vitality and Identifying Ghost Cities in China with Emerging Geographical Data. Cities 2017, 63, 98–109. [Google Scholar] [CrossRef]
  8. Liu, X.; Liu, Y. Influence Mechanism of Spatial and Temporal Evolution of Urban Vitality Under Shrinkage—A Case Study in Yichun. Master’s Thesis, Northeast Normal University, Changchun, China, 2020. [Google Scholar] [CrossRef]
  9. Tong, M. How urban fabric can help sustain the vitality of cities. Urban Plan. Forum 2014, 85–96. [Google Scholar] [CrossRef]
  10. Yang, G. Tracing research progress of urban vitality. Shanxi Archit. 2019, 45, 20–22. [Google Scholar] [CrossRef]
  11. Jacobs, J. The Death and Life of Great American Cities; Vintage Books: New York, NY, USA, 2012. [Google Scholar]
  12. Montgomery, J. Editorial Urban Vitality and the Culture of Cities. Plan. Pract. Res. 1995, 10, 101–110. [Google Scholar] [CrossRef]
  13. Still, B.; Simmonds, D. Parking Restraint Policy and Urban Vitality. Transp. Rev. 2000, 20, 291–316. [Google Scholar] [CrossRef]
  14. Ye, Y.; Li, D.; Liu, X. How Block Density and Typology Affect Urban Vitality: An Exploratory Analysis in Shenzhen, China. Urban Geogr. 2018, 39, 631–652. [Google Scholar] [CrossRef]
  15. Liu, L.; Xu, Y.; Jiang, S.; Wu, Q. Evaluation of urban vitality based on fuzzy matter-element model. Geogr. Geo-Inf. Sci. 2010, 26, 73–77. [Google Scholar]
  16. Nie, X.; Zhang, Y.; Zhou, W.; Su, H.; Yang, T.; Li, X.; Lan, S. Research status and trend of urban space vitality—Comparative analysis of chinese and english literature. J. Southwest Univ. Nat. 2021, 43, 147–155. [Google Scholar] [CrossRef]
  17. Liang, L.; Zeng, W.; Song, Y.; Shao, Z.; Liu, X. Urban Comprehensive Vitality Evaluation and Influencing Factors Analysis Considering Population Agglomeration and Emotional Intensity. J. Geo-Inf. Sci. 2022, 24, 1854–1866. [Google Scholar] [CrossRef]
  18. Li, Z.; Guo, Y.; Han, Z. Comparative research on statistical measurement of city vitality. World Surv. Res. 2021, 8, 74–80. [Google Scholar] [CrossRef]
  19. Zhang, W.; Huang, S.; Zhuo, H.; Tang, J. Measurement and evaluation to population vitality of characteristic towns in zhejiang province based on big data. Zhejiang Soc. Sci. 2022, 8, 22–33+156–157. [Google Scholar] [CrossRef]
  20. Ye, Y.; Zhuang, Y.; Zhang, L.; Van Nes, A. Designing urban spatial vitality from morphological perspective—A study based on quantified urban morphology and activities’ testing. Urban Plan. Int. 2016, 31, 26–33. [Google Scholar]
  21. Wang, J. Inclusiveness and sharing, explicit and implicit mutual learning, livability predicted: Historical prospect and contemporary creation of urban vitality. City Plan. Rev. 2019, 43, 9–16. [Google Scholar] [CrossRef]
  22. Luo, Q.; Wen, Z.; Yu, L. Developing a Dynamic Street Space in Small Towns by the Guidance of Environment-Behavior Studies: A Case Study on Zihu Town. Urban Dev. Stud. 2019, 26, 20–24,30. [Google Scholar] [CrossRef]
  23. Ye, Y.; Zhuang, Y. A Hypothesis of Urban Morphogenesis and Urban Vitality in Newly Built-up Areas: Analyses Based on Street Accessibility, Building Density and Functional Mixture. Urban Plan. Int. 2017, 32, 43–49. [Google Scholar] [CrossRef]
  24. Lu, B.; Zeng, Z.J.; Qian, Y.; Wei, W.X.; Yang, Y.M.; Li, H. Influence of road network form on urban vitality in the main urban area of lanzhou city. Arid Land Geogr. 2023, 46, 1333–1343. [Google Scholar] [CrossRef]
  25. Wang, E.; Zhou, J.; Yang, J.; Wang, Y.; Yang, P.; Wang, X. Impact of built environment on spatial differentiation of urban vitality at the subdistrict level based on mgwr: A case study of of shenyang central urban area. Geogr. Sci. 2024, 44, 1322–1331. [Google Scholar] [CrossRef]
  26. Yang, M.; Huang, X.; Song, T. A study on the evaluation of urban public space vitality based on “explicit and implicit mutual learning”: A case of park green space in Xi’an. Hum. Geogr. 2023, 38, 118–125+192. [Google Scholar] [CrossRef]
  27. Jiang, H.; Song, T.; Li, S. Deng Zhiping Spatial pattern characteristics of urban virtual-real vitality in the digitization context: A case study of guangzhou. Trop. Geogr. 2023, 43, 695–706. [Google Scholar] [CrossRef]
  28. Liu, L.; Zhou, T. A new understanding of the city scale theory. Econ. Surv. 2006, 22, 112–115. [Google Scholar] [CrossRef]
  29. Li, Y.; Huang, Q.; Cao, W. Assessing the pan-yangtze delta region’s coordination of urban efficiency and scale. Hum. Geogr. 2017, 32, 124–130. [Google Scholar] [CrossRef]
  30. Wang, G.; Li, F.; Liu, X.; Gao, N.; Gao, Y. New patterns of urbanization in the new development stage—The concept and identification standards of modern metropolitan areas. Urban Plan. Forum 2021, 2, 15–24. [Google Scholar] [CrossRef]
  31. National Development and Reform Commission. Response Letter on Acceptance of ChangZhuTan Metropolitan Area Development Plan (NDRC Planning [2022] No. 199); National Development and Reform Commission: Beijing, China, 2022.
  32. National Development and Reform Commission. Urbanization’s Second Half: Releasing Metropolitan Regions’ Full Potential; National Development and Reform Commission: Beijing, China, 2024.
  33. Hunan Provincial People’s Government Hunan Provincial People’s Government on the Issuance of the Development Plan for Changzhutan Metropolitan Area; Hunan Provincial People’s Government: Changsha, China, 2022.
  34. Zhang, Y.; Zhao, H.; Long, Y. CMAB: A Multi-Attribute Building Dataset of China. Sci. Data 2025, 12, 430. [Google Scholar] [CrossRef]
  35. Shan, R.; Zhang, S. The vitality assessment of renewed historic built environment and a discussion on regeneration strategies: The cases of tianzifang, xintiandi, and yuyuan tourist mall in shanghai. Urban Plan. Forum 2021, 79–86. [Google Scholar] [CrossRef]
  36. Ma, L.; Xiu, C. Research on the matching relationship between residential and commercial space in shenyang based on shopping trip. Hum. Geogr. 2022, 37, 63–70. [Google Scholar] [CrossRef]
  37. Wang, N.; Wu, W.J.; Li, S.; Wang, H.; Peng, Z. Spatial features of urban vitality and the impact of built environment on them based on multi-source data: A case study of shenzhen. Trop. Geogr. 2021, 41, 1280–1291. [Google Scholar] [CrossRef]
  38. Ding, X.H.; Luo, B.; Zhou, H.T.; Chen, Y.H. Generalized solutions for advection–dispersion transport equations subject to time-and space-dependent internal and boundary sources. Comput. Geotech. 2025, 178, 106944. [Google Scholar] [CrossRef]
  39. Zhou, Y. Recommendations on Clarifying the Concept of Towns and Cities and the Caliber of Urban Population Statistics in China. City Plan. Rev. 1986, 9, 10–15. [Google Scholar]
  40. Guo, X.; Huang, G. A Preliminary Investigation of the Notion of a Metropolitan Region and the Parameters That Define It. Contemp. Finance Econ. 2006, 79–83. [Google Scholar] [CrossRef]
  41. Wang, C.; Sheng, J.; Leng, B.; Yi, Z. Metropolitan Area Layers and Their Delimitation Methods and the Practice of Chongqing. Planners 2023, 39, 36–43. [Google Scholar] [CrossRef]
  42. Qian, Z. The concept of metropolitan regionand its delineation. Planners 2022, 38, 152–156. [Google Scholar] [CrossRef]
  43. Ministry of Natural Resources Code of Practice for Territorial Spatial Planning of Metropolitan Region. Available online: https://www.cacp.org.cn/u/cms/www/202109/10161846vnu6.pdf (accessed on 22 February 2025).
Figure 1. Location map.
Sustainability 17 05059 g001
Figure 2. Example of raster data coupling operation.
Sustainability 17 05059 g002
Figure 3. Analysis architecture.
Sustainability 17 05059 g003
Figure 4. Metropolitan area population size characteristics.
Sustainability 17 05059 g004
Figure 5. Characteristics of land scale in the metropolitan area.
Sustainability 17 05059 g005
Figure 6. Economic scale characteristics of metropolitan area.
Sustainability 17 05059 g006
Figure 7. Characteristics of urban scale in metropolitan areas.
Sustainability 17 05059 g007
Figure 8. Percentage of urban scale grids in districts and counties.
Sustainability 17 05059 g008
Figure 9. Characteristics of urban virtual vitality in metropolitan areas.
Sustainability 17 05059 g009
Figure 10. Percentage of virtual vitality grids in districts and counties.
Sustainability 17 05059 g010
Figure 11. Characteristics of social vitality in metropolitan areas.
Sustainability 17 05059 g011
Figure 12. Characteristics of economic vitality in the metropolitan area.
Sustainability 17 05059 g012
Figure 13. Cultural vitality characteristics of the metropolitan area.
Sustainability 17 05059 g013
Figure 14. Substantive characteristics of metropolitan entity.
Sustainability 17 05059 g014
Figure 15. Percentage of substantive vitality grid in districts and counties.
Sustainability 17 05059 g015
Figure 16. Scale-vitality circle distribution in ChangZhuTan metropolitan area.
Sustainability 17 05059 g016
Figure 17. Coupling analysis of urban scale and virtual vitality.
Sustainability 17 05059 g017
Figure 18. Coupling analysis of urban scale and substantive vitality.
Sustainability 17 05059 g018
Figure 19. Coupling promotion path of urban scale and vitality.
Sustainability 17 05059 g019
Table 1. Indicator system.
System LevelSubsystem LevelIndicator LevelQuantification MethodData Source
City scaleSize of populationpopulation gridpopulation/space unit areaGeo-Remote Sensing Ecological Network (2024)
Size of the siteScale of constructionGross floor area of buildings in cell/spatial unit areaGoogle Earth image data (2022–2024)
Scale of the economyGDP gridMillion dollars/square kilometerGeo-Remote Sensing Ecological Network (2024)
Urban vitalityVirtual vitalityThe amount of jitterbug punchingTotal number of punches in the cell/space unit areaNew Shake official website (2024)
Jitterbug viewsTotal number of views in cell/space unit areaNew Shake official website (2024)
Substantive vitalitysocial vitalityNumber of shopping facilities POI in cell/space unit areaGaode Maps Open Platform (2024)
economic vitalityNight-time Lighting IndexNPP-VIIRS (2024)
cultural vitalityNumber of cultural facilities POI in cell/area of space unitGaode Maps Open Platform (2024)
Table 2. Metropolitan area city scale grid class statistics.
Name of Prefecture-Level CityDistrict and County NamesExtremely LowLowModerately LowMediumModerately HighHighExtremely High
Changsha CityFurong District0
(0.00)
1
(2.38)
12
(28.57)
11
(26.19)
7
(16.67)
7
(16.67)
4
(9.52)
Tianxin District36
(0.00)
31
(2.38)
34
(28.57)
19
(26.19)
11
(16.67)
2
(16.67)
7
(9.52)
Yuelu District325
(25.71)
88
(22.14)
47
(24.29)
48
(13.57)
26
(7.86)
4
(1.43)
0
(5.00)
Kaifu District48
(60.41)
65
(16.36)
50
(8.74)
11
(8.92)
5
(4.83)
4
(0.74)
6
(0.00)
Yuhua District162
(25.40)
27
(34.39)
29
(26.46)
29
(5.82)
29
(2.65)
14
(2.12)
2
(3.17)
Wangcheng District760
(55.48)
155
(9.25)
59
(9.93)
16
(9.93)
4
(9.93)
3
(4.79)
0
(0.68)
Changsha County1533
(76.23)
163
(15.55)
60
(5.92)
31
(1.60)
23
(0.40)
6
(0.30)
0
(0.00)
Liuyang City4806
(84.42)
249
(8.98)
50
(3.30)
17
(1.71)
13
(1.27)
4
(0.33)
0
(0.00)
Ningxiang City2775
(93.52)
220
(4.85)
32
(0.97)
18
(0.33)
18
(0.25)
0
(0.08)
0
(0.00)
Zhu Zhou CityHetang District94
(90.60)
18
(7.18)
15
(1.04)
9
(0.59)
5
(0.59)
10
(0.00)
0
(0.00)
Lusong District180
(62.25)
15
(11.92)
12
(9.93)
5
(5.96)
2
(3.31)
5
(6.62)
0
(0.00)
Shifeng District109
(82.19)
17
(6.85)
19
(5.48)
15
(2.28)
7
(0.91)
0
(2.28)
0
(0.00)
Tianyuan District 243
(65.27)
33
(10.18)
18
(11.38)
15
(8.98)
8
(4.19)
8
(0.00)
0
(0.00)
Luolukou District 1073
(74.77)
25
(10.15)
1
(5.54)
3
(4.62)
1
(2.46)
0
(2.46)
0
(0.00)
Liling City2027
(97.28)
153
(2.27)
23
(0.09)
12
(0.27)
8
(0.09)
3
(0.00)
0
(0.00)
Xiangtan CityYuhu District308
(91.06)
70
(6.87)
32
(1.03)
17
(0.54)
12
(0.36)
6
(0.13)
0
(0.00)
Yutang District117
(69.21)
36
(15.73)
17
(7.19)
20
(3.82)
11
(2.70)
7
(1.35)
0
(0.00)
Xiangtan County2084
(56.25)
123
(17.31)
22
(8.17)
8
(9.62)
3
(5.29)
0
(3.37)
0
(0.00)
Shaoshan City217
(93.04)
20
(5.49)
5
(0.98)
0
(0.36)
0
(0.13)
0
(0.00)
0
(0.00)
Summary16,897
(86.47)
1509
(7.72)
537
(2.75)
304
(1.56)
193
(0.99)
83
(0.42)
19
(0.10)
Note: Percentage of grids of different urban scales in the same district or county is in parentheses.
Table 3. Ranking statistics of the virtual vitality grid for the ChangZhuTan metropolitan area.
Name of Prefecture-Level CityDistrict and County NamesExtremely LowLowModerately LowMediumModerately HighHighExtremely High
Changsha CityFurong District22
(52.38)
10
(23.81)
4
(9.52)
4
(9.52)
0
(0.00)
0
(0.00)
2
(4.76)
Tianxin District117
(83.57)
14
(10.00)
3
(2.14)
2
(1.43)
2
(1.43)
1
(0.71)
1
(0.71)
Yuelu District497
(92.38)
26
(4.83)
11
(2.04)
3
(0.56)
1
(0.19)
0
(0.00)
0
(0.00)
Kaifu District161
(85.19)
16
(8.47)
9
(4.76)
2
(1.06)
0
(0.00)
0
(0.00)
1
(0.53)
Yuhua District245
(83.90)
31
(10.62)
8
(2.74)
6
(2.05)
1
(0.34)
0
(0.00)
1
(0.34)
Wangcheng District983
(98.60)
11
(1.10)
3
(0.30)
0
(0.00)
0
(0.00)
0
(0.00)
0
(0.00)
Changsha County1783
(98.18)
17
(0.94)
12
(0.66)
3
(0.17)
1
(0.06)
0
(0.00)
0
(0.00)
Liuyang City5131
(99.84)
5
(0.10)
3
(0.06)
0
(0.00)
0
(0.00)
0
(0.00)
0
(0.00)
Ningxiang City3053
(99.67)
9
(0.29)
1
(0.03)
0
(0.00)
0
(0.00)
0
(0.00)
0
(0.00)
Zhuzhou cityHetang District 138
(91.39)
4
(2.65)
6
(3.97)
1
(0.66)
1
(0.66)
1
(0.66)
0
(0.00)
Lusong District 210
(95.89)
6
(2.74)
2
(0.91)
1
(0.46)
0
(0.00)
0
(0.00)
0
(0.00)
Shifeng District166
(99.40)
0
(0.00)
1
(0.60)
0
(0.00)
0
(0.00)
0
(0.00)
0
(0.00)
Tianyuan District 312
(96.00)
6
(1.85)
4
(1.23)
3
(0.92)
0
(0.00)
0
(0.00)
0
(0.00)
Luolukou District 1102
(99.91)
1
(0.09)
0
(0.00)
0
(0.00)
0
(0.00)
0
(0.00)
0
(0.00)
Liling City2219
(99.69)
5
(0.22)
1
(0.04)
0
(0.00)
1
(0.04)
0
(0.00)
0
(0.00)
Xiangtan CityYuhu District430
(96.63)
12
(2.70)
2
(0.45)
1
(0.22)
0
(0.00)
0
(0.00)
0
(0.00)
Yutang District186
(89.42)
19
(9.13)
3
(1.44)
0
(0.00)
0
(0.00)
0
(0.00)
0
(0.00)
XiangtanCounty2231
(99.60)
8
(0.36)
1
(0.04)
0
(0.00)
0
(0.00)
0
(0.00)
0
(0.00)
Shaoshan City239
(98.76)
1
(0.41)
0
(0.00)
1
(0.41)
0
(0.00)
1
(0.41)
0
(0.00)
Summary19,225
(98.38)
201
(1.03)
74
(0.38)
27
(0.14)
7
(0.04)
3
(0.02)
5
(0.03)
Note: Percentage of virtual vitality grids of different levels in the same district and county in parentheses.
Table 4. Chang-Zhu-Tan metropolitan area substantive vitality grid level statistics.
Name of Prefecture-Level CityDistrict and County NamesExtremely LowLowModerately LowMediumModerately HighHighExtremely High
Changsha CityFurong District1
(2.38)
0
(0.00)
8
(19.05)
14
(33.33)
8
(19.05)
8
(19.05)
3
(7.14)
Tianxin District45
(32.14)
32
(22.86)
23
(16.43)
28
(20.00)
6
(4.29)
4
(2.86)
2
(1.43)
Yuelu District307
(57.06)
85
(15.80)
48
(8.92)
49
(9.11)
31
(5.76)
17
(3.16)
1
(0.19)
Kaifu District60
(31.75)
52
(27.51)
43
(22.75)
19
(10.05)
10
(5.29)
5
(2.65)
0
(0.00)
Yuhua District155
(53.08)
18
(6.16)
29
(9.93)
33
(11.30)
30
(10.27)
17
(5.82)
10
(3.42)
Wangcheng District721
(72.32)
178
(17.85)
67
(6.72)
20
(2.01)
9
(0.90)
2
(0.20)
0
(0.00)
Changsha County1476
(81.28)
170
(9.36)
93
(5.12)
45
(2.48)
20
(1.10)
8
(0.44)
4
(0.22)
Liuyang City4982
(96.94)
107
(2.08)
30
(0.58)
14
(0.27)
4
(0.08)
2
(0.04)
0
(0.00)
Ningxiang City2919
(95.30)
111
(3.62)
16
(0.52)
10
(0.33)
5
(0.16)
2
(0.07)
0
(0.00)
Zhuzhou CityHetang District 87
(57.62)
37
(24.50)
18
(11.92)
4
(2.65)
3
(1.99)
2
(1.32)
0
(0.00)
Lusong District 158
(72.15)
44
(20.09)
10
(4.57)
6
(2.74)
1
(0.46)
0
(0.00)
0
(0.00)
Shifeng District112
(67.07)
38
(22.75)
14
(8.38)
3
(1.80)
0
(0.00)
0
(0.00)
0
(0.00)
Tianyuan District 234
(72.00)
51
(15.69)
24
(7.38)
9
(2.77)
4
(1.23)
3
(0.92)
0
(0.00)
Luolukou District 1085
(98.37)
14
(1.27)
3
(0.27)
1
(0.09)
0
(0.00)
0
(0.00)
0
(0.00)
Liling City2152
(96.68)
58
(2.61)
7
(0.31)
5
(0.22)
4
(0.18)
0
(0.00)
0
(0.00)
Xiangtan CityYuhu District355
(79.78)
50
(11.24)
26
(5.84)
6
(1.35)
7
(1.57)
1
(0.22)
0
(0.00)
Yutang District94
(45.19)
68
(32.69)
28
(13.46)
9
(4.33)
8
(3.85)
1
(0.48)
0
(0.00)
Xiangtan County2171
(96.92)
49
(2.19)
14
(0.63)
3
(0.13)
3
(0.13)
0
(0.00)
0
(0.00)
Shaoshan City228
(94.21)
10
(4.13)
3
(1.24)
1
(0.41)
0
(0.00)
0
(0.00)
0
(0.00)
Summary17,342
(88.74)
1172
(6.00)
504
(2.58)
279
(1.43)
153
(0.78)
72
(0.37)
20
(0.10)
Note: In parentheses are the percentage of different levels of substantive vitality grids in the same district and county.
Table 5. Correlation analysis between urban scale and virtual–substantive vitality.
Person Correlation AnalysisUrban Virtual VitalityUrban Substantive Vitality
The overall planningCorrelation coefficient 0.417 ***0.747 ***
Prominence 0.0000.000
Number of samples (grids)19542
Core gathering circle
(0–30 km)
Correlation coefficient 0.451 ***0.750 ***
Prominence0.0000.000
Number of samples2822
Tight collaboration circle
(30–60 km)
Correlation coefficient 0.345 ***0.711 ***
Prominence0.0000.000
Number of samples (grids)6724
Radiation linkage ring
(60–90 km)
Correlation coefficient 0.231 ***0.606 ***
Prominence0.0000.000
Number of samples (grids)6901
Peripheral expansion circle
(90–135 km)
Correlation coefficient/0.245 ***
Prominence/0.000
Number of samples (grids)3095
Note: *** Related at the 1% level.
Table 6. City size and virtual vitality coupling circle statistics.
Coupling RangeCoupling RelationshipNumber of Couplings (Pairs)Percentage of Spheres (%)
Core gathering circle[−1, 1]Coupling226480.23
[−3, −2], [2, 4]Basic coupling53018.78
[5, 6]Non-coupling280.99
Tight collaboration circle[−1, 1]Coupling632794.10
[−4, −2], [2, 4]Basic coupling3795.64
[5]Non-coupling180.27
Radiation linkage ring[−1, 1]Coupling681798.78
[2, 4]Basic coupling781.13
[5]Non-coupling60.09
Peripheral expansion circle[0, 1]Coupling309299.90
[2]Basic coupling30.10
Table 7. City size and substantive vitality coupling circle statistics.
Coupling RangeCoupling RelationshipNumber of Couplings (Pairs)Percentage of Spheres (%)
Core gathering circle[−1, 1]Coupling254813.04
[−4, −2], [2, 3]Basic coupling2671.37
[5, 6]Non-coupling70.04
Tight collaboration circle[−1, 1]Coupling652433.38
[−4, −2], [2, 4]Basic coupling1961.00
[5]Non-coupling40.02
Radiation linkage ring[−1, 1]Coupling685135.06
[−3, −2], [2, 4]Basic coupling480.25
[5]Non-coupling20.01
Peripheral expansion circle[−1, 1]Coupling309215.82
[2]Basic coupling30.02
Disclaimer/Publisher’s Note: The statements, opinions and data contained in all publications are solely those of the individual author(s) and contributor(s) and not of MDPI and/or the editor(s). MDPI and/or the editor(s) disclaim responsibility for any injury to people or property resulting from any ideas, methods, instructions or products referred to in the content.

