
Evaluation of Air-Assisted Spraying Technology for Pesticide Drift Reduction


Abstract

1. Introduction
2. Materials and Methods
2.1. Methods Used to Measure and Evaluate Spray Liquid Drift
2.2. Plot Layout
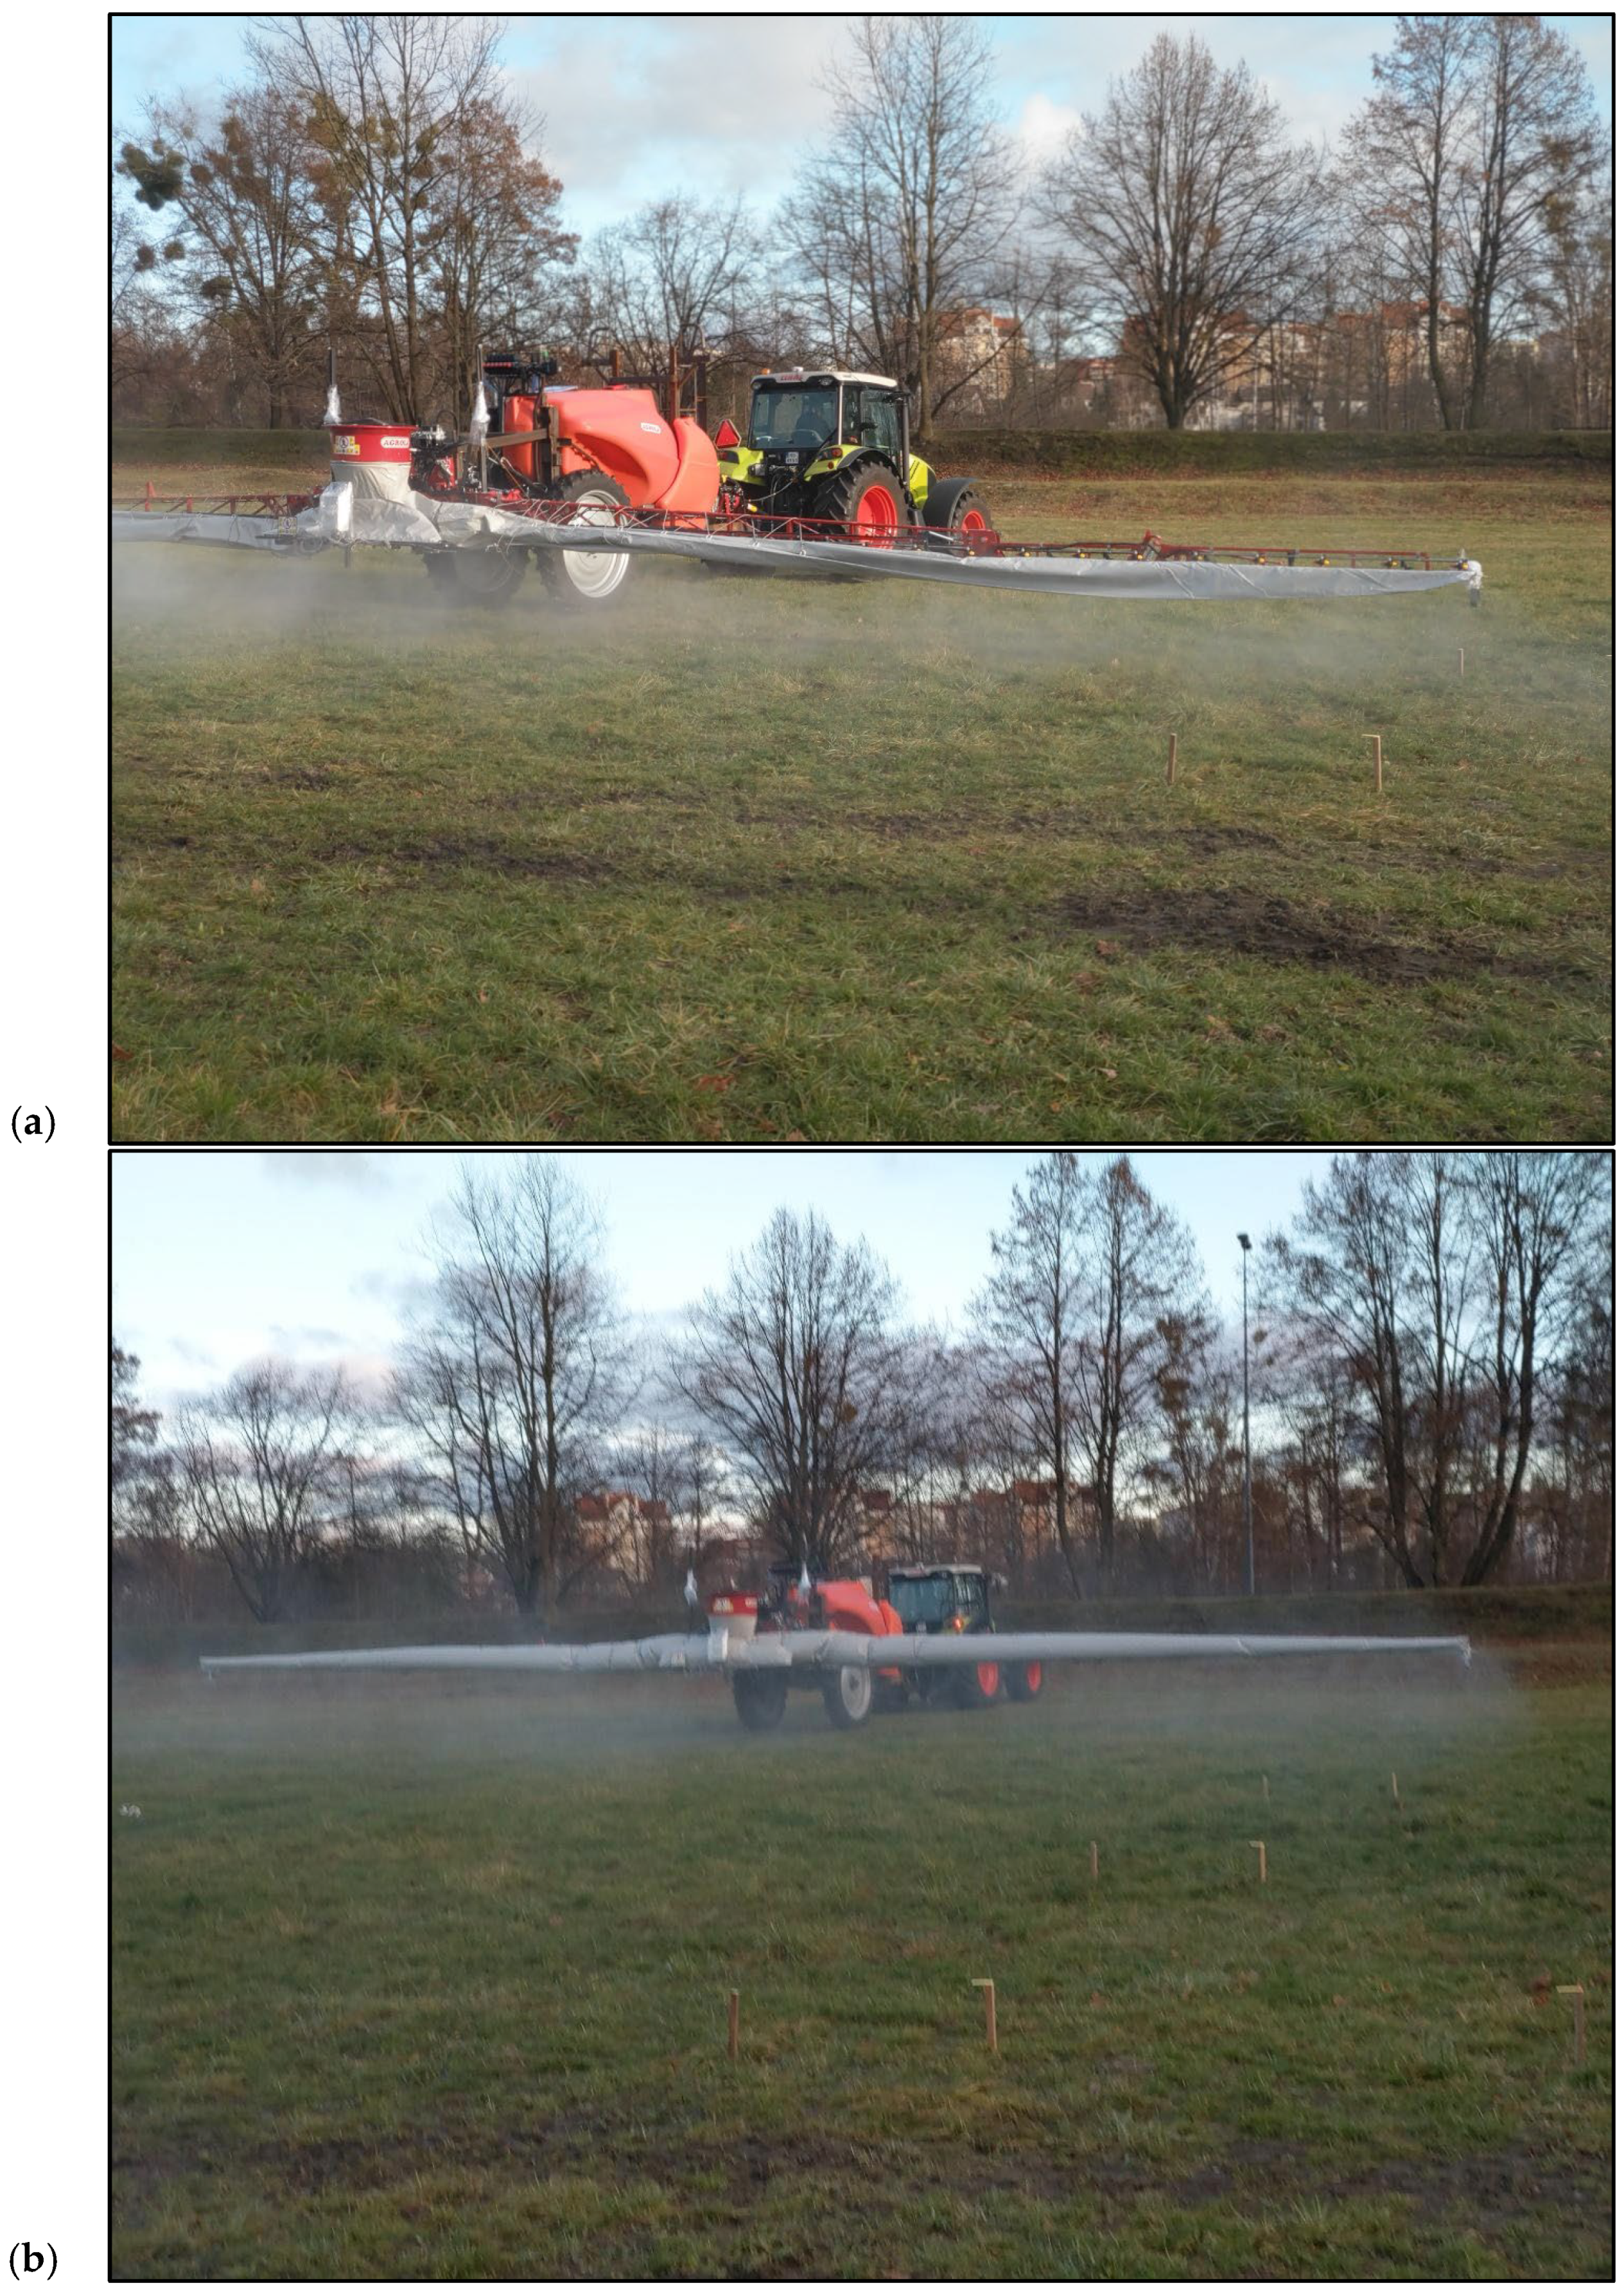
2.3. Equipment
2.4. Description and Conditions of the Experiment
2.5. Image Analysis
2.6. Statistical Analysis
3. Results
3.1. Evaluation of Air-Assistance in Field Spraying—Visual Results
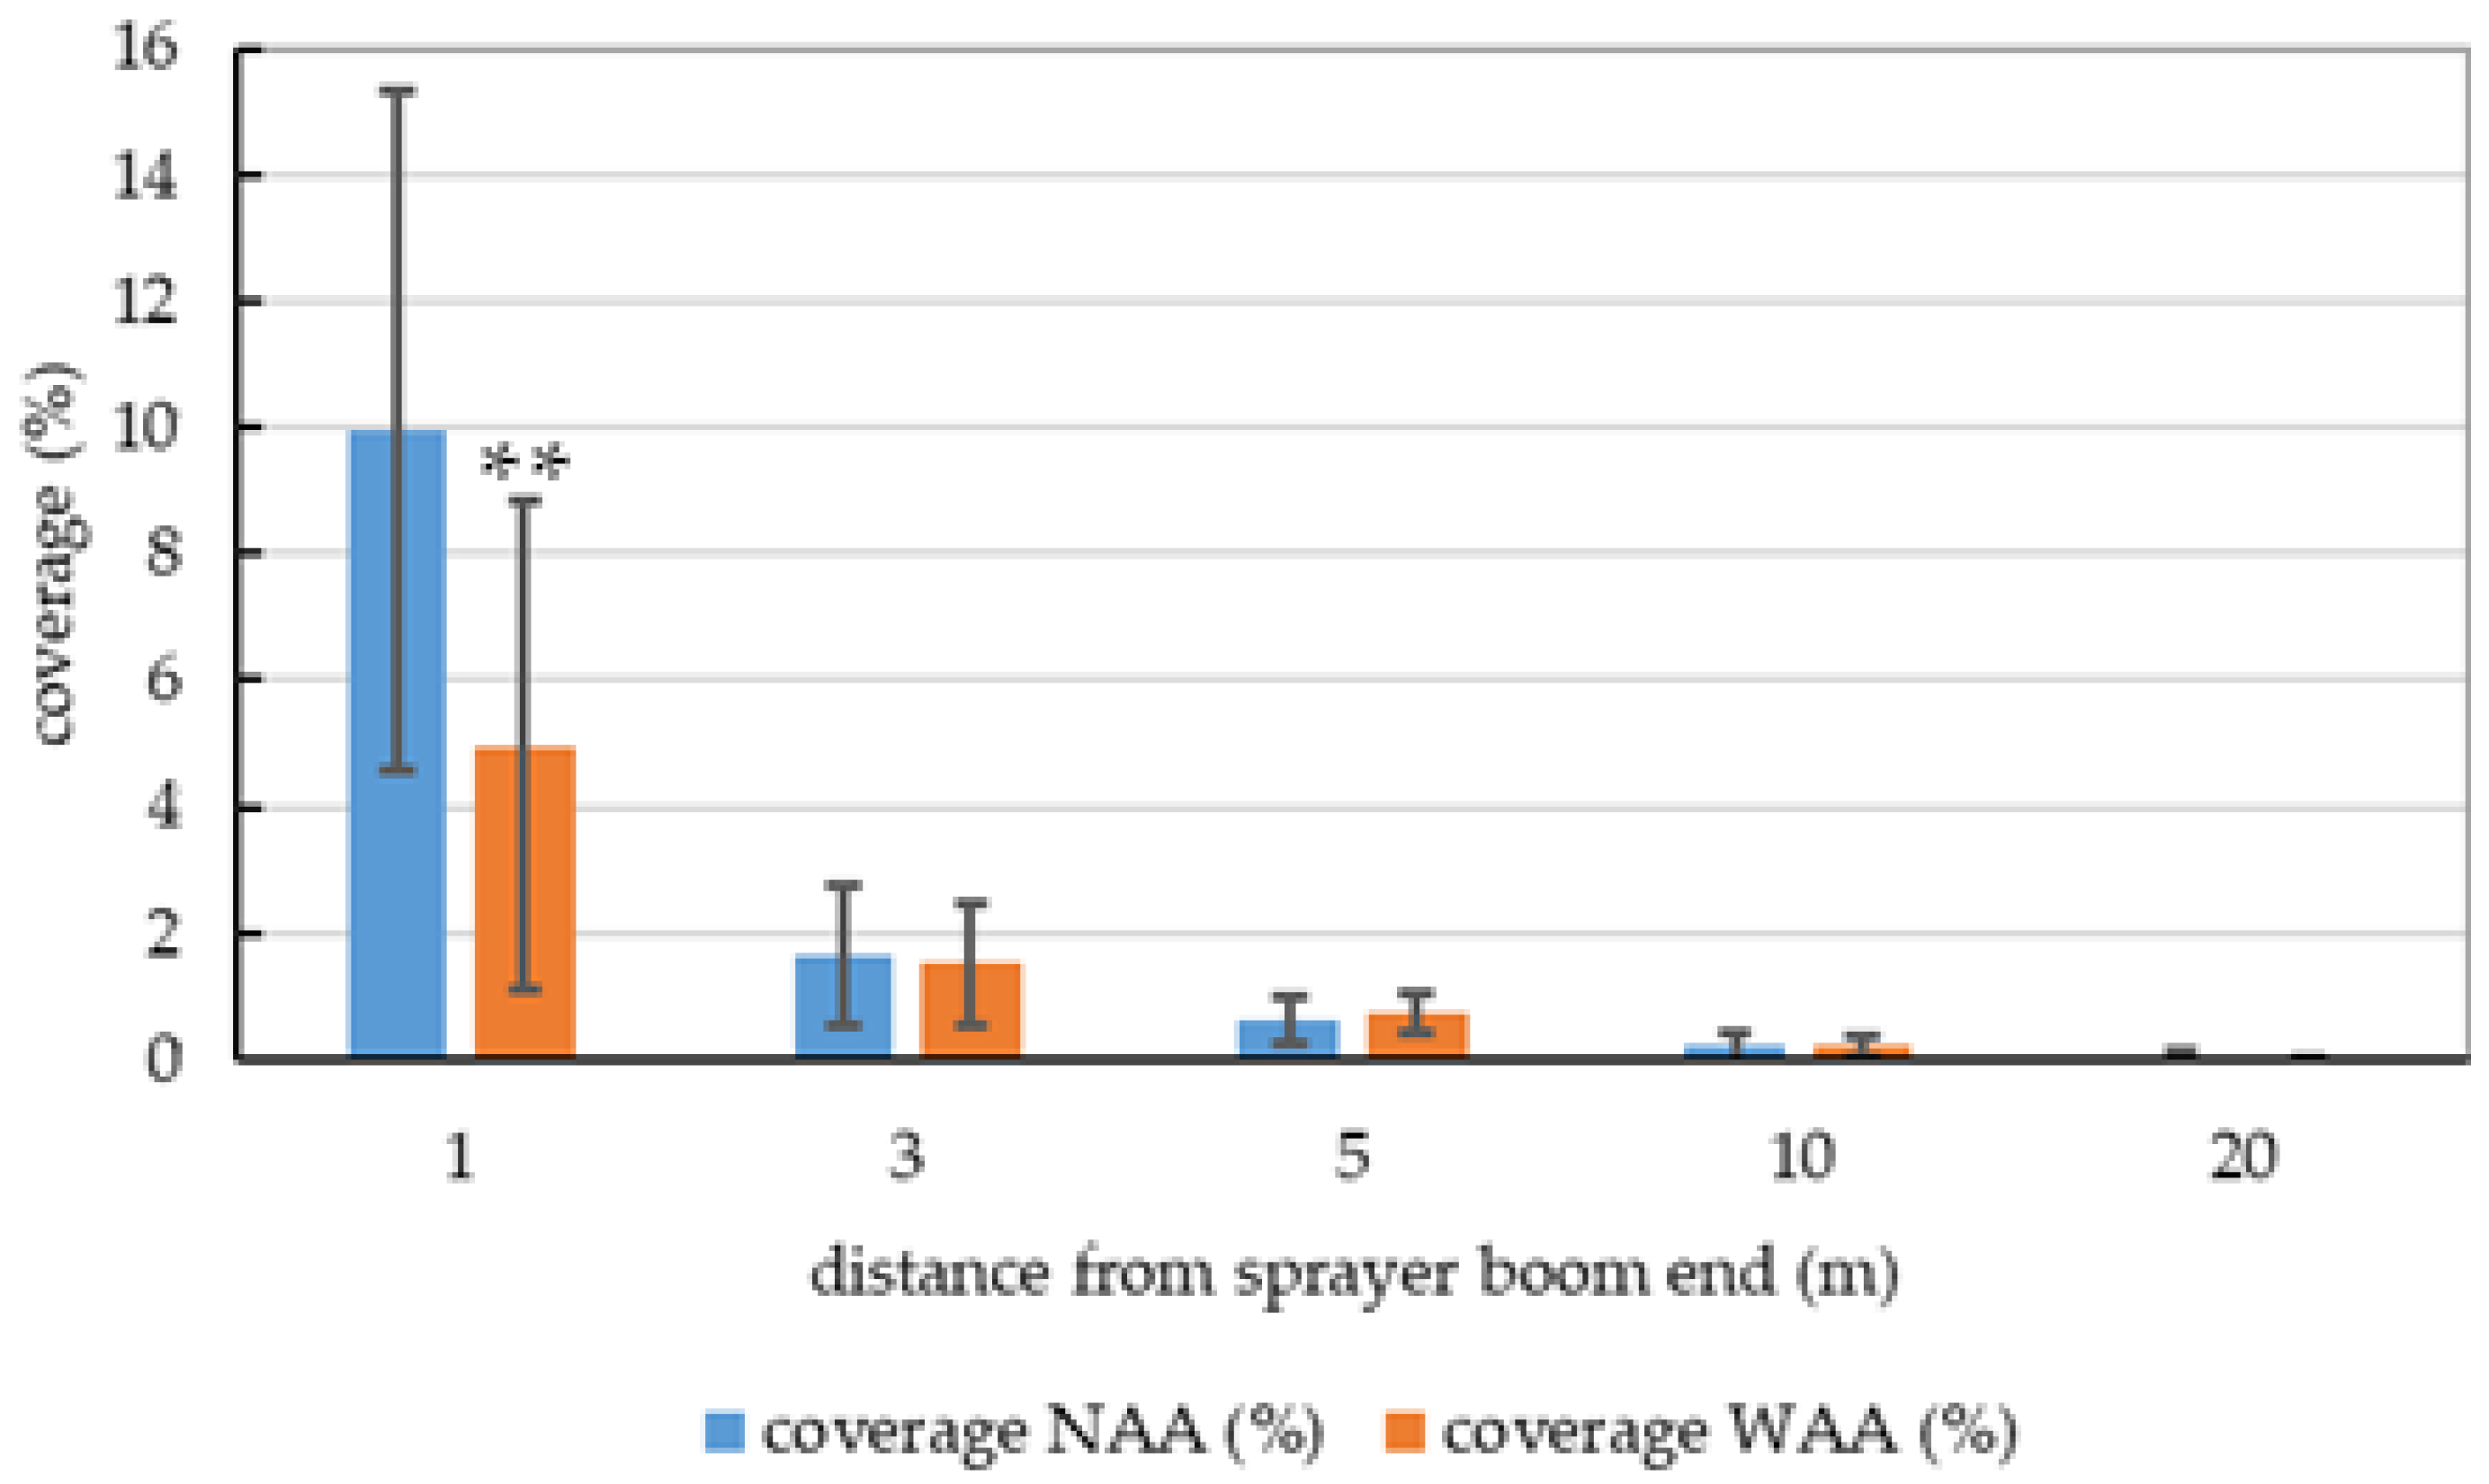
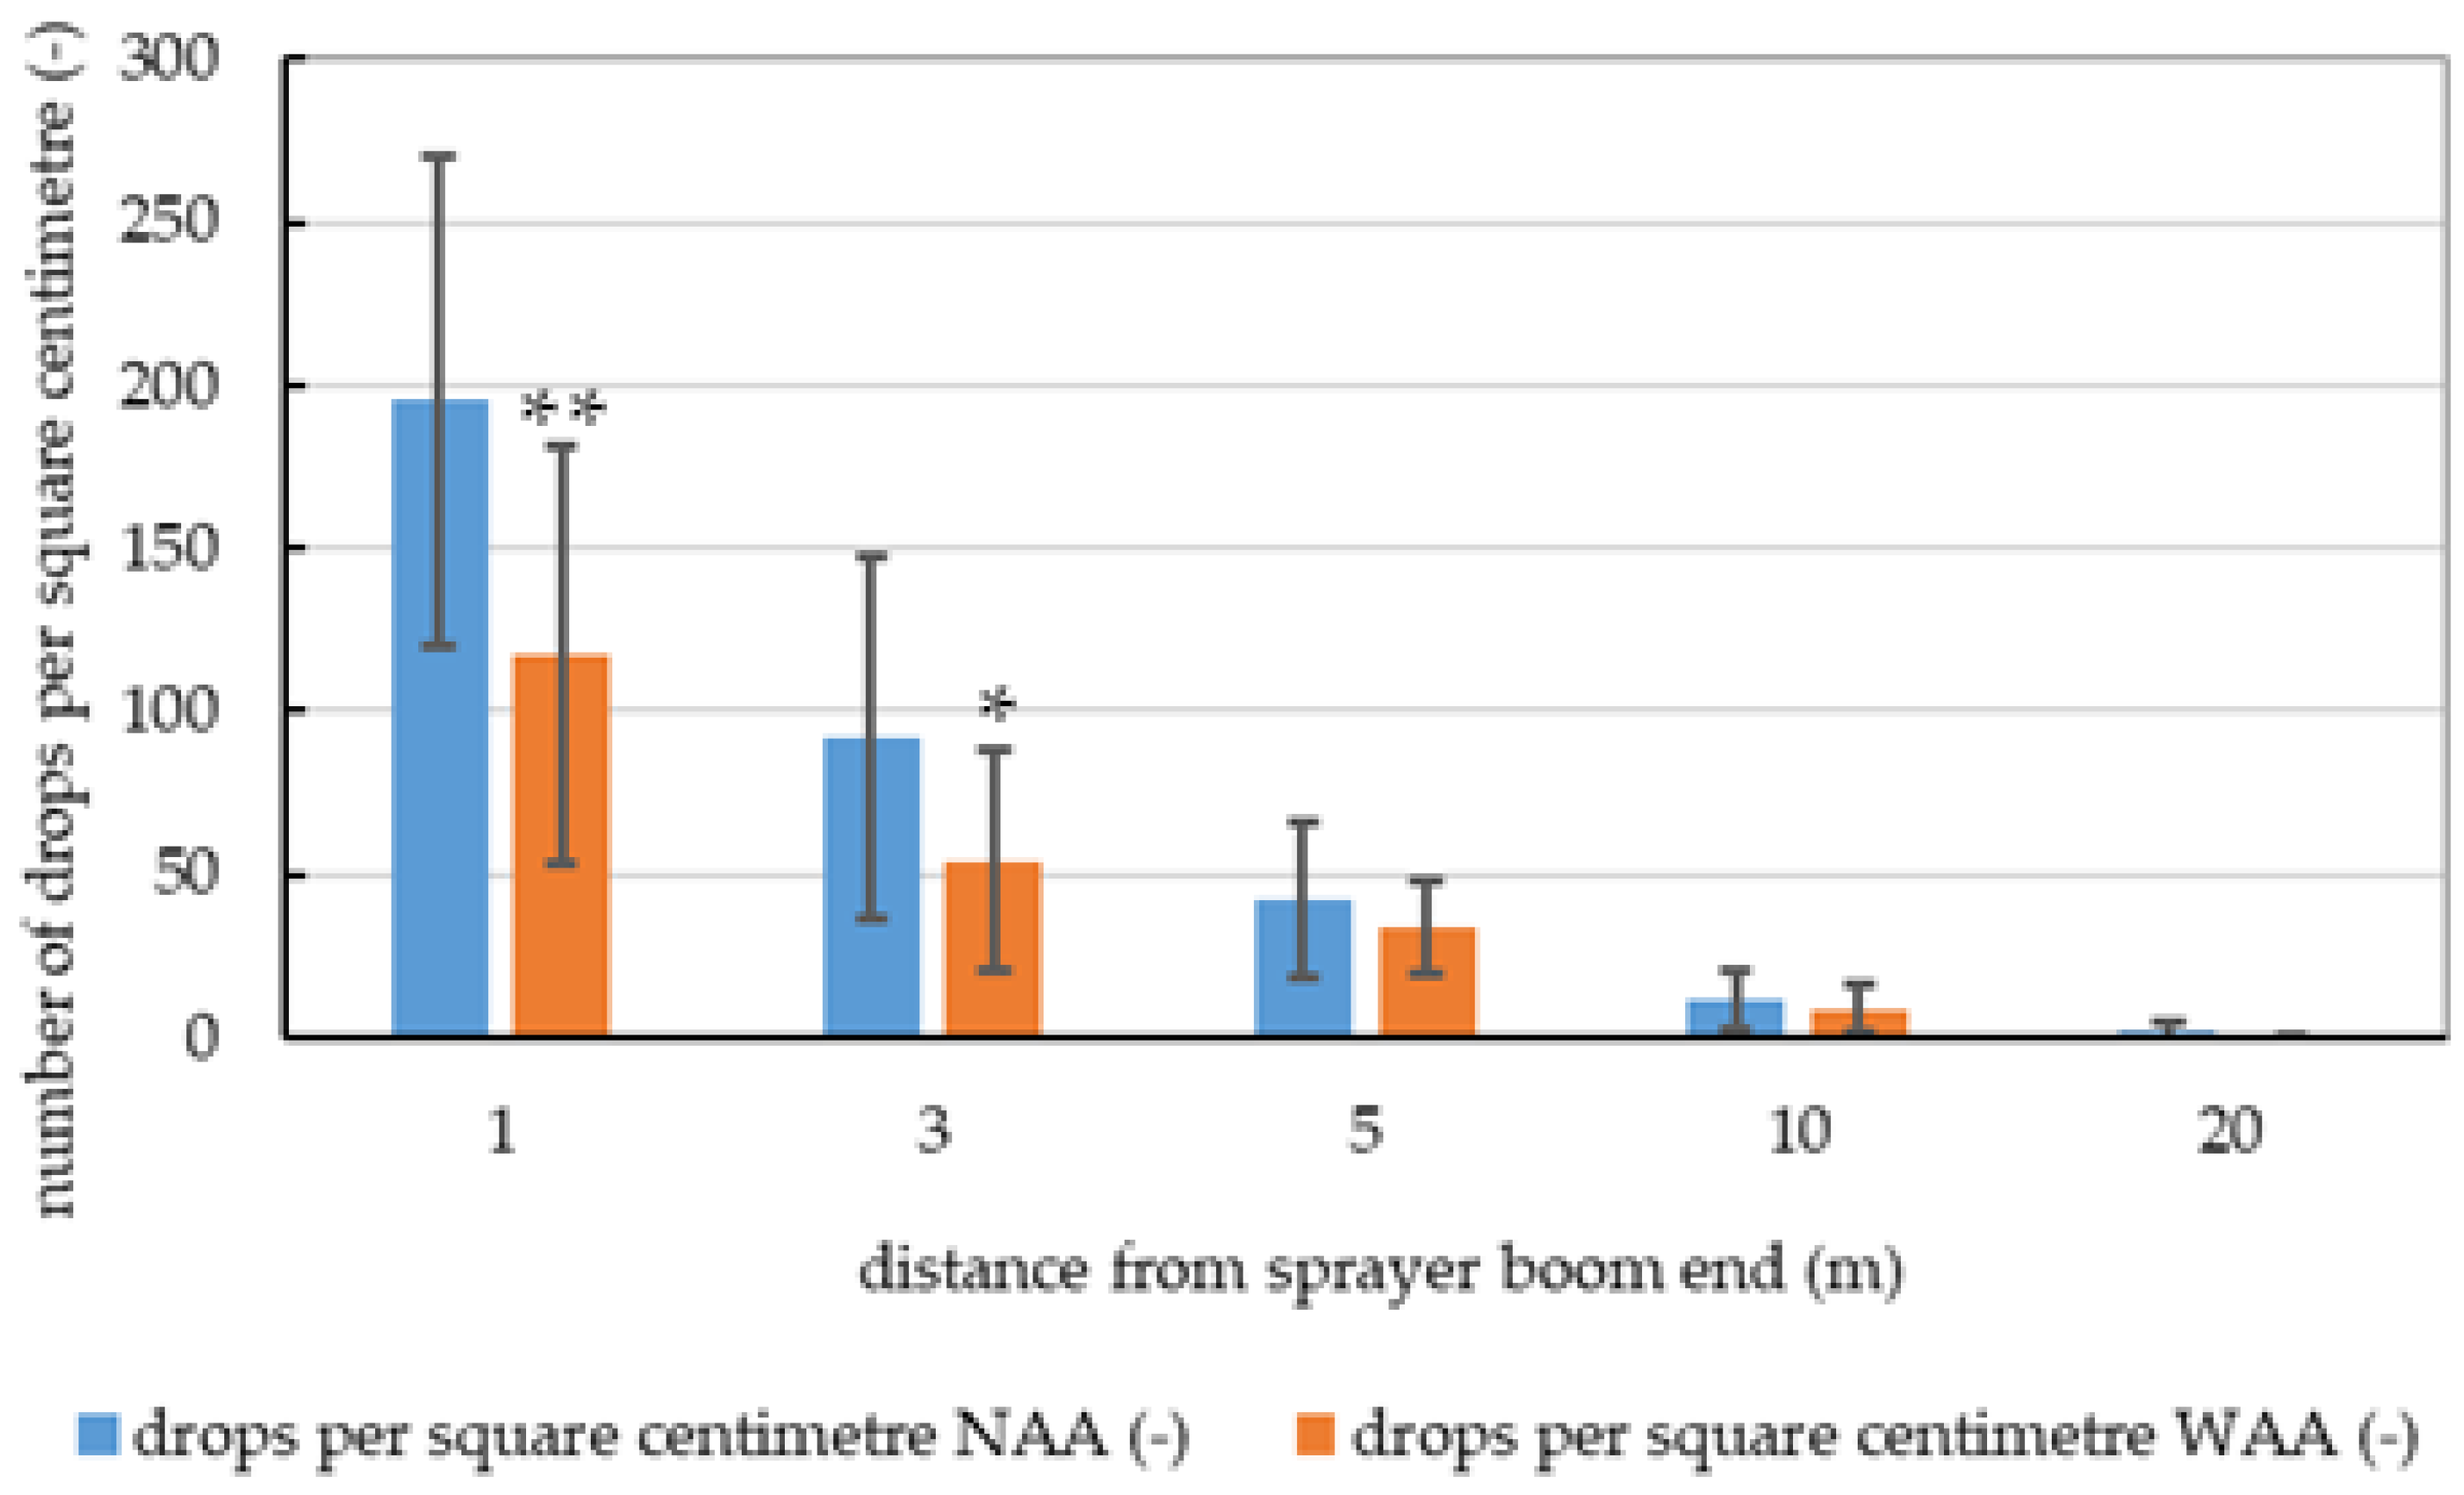
3.2. Quantitative Assessment of Obtained Results
4. Discussion
4.1. Interpretation and Conclusions in the Context of Literature
- air assistance significantly reduces drift outside the target zone, particularly at shorter distances from the end of the sprayer boom;
- although droplet diameter was not measured directly in this study, the combined analysis of coverage percentage and droplet density indicates that beyond one meter from the end of the sprayer boom, a noticeable decrease in droplet count per cm2—despite similar coverage levels regardless of air assistance—suggests that coverage at these distances was maintained by fewer, but larger, droplets;
- this observation contrasts with previous findings [17,55], which indicate that smaller droplets are more prone to drift. Our results suggest that once outside the target zone, larger droplets may actually travel farther—possibly because smaller droplets are more susceptible to deflection and turbulence, and thus disperse in directions not aligned with the main direction of movement;
4.2. Study Limitations and Future Work
5. Summary and Conclusions
Author Contributions
Funding
Institutional Review Board Statement
Informed Consent Statement
Data Availability Statement
Conflicts of Interest
Abbreviations
| NAA | No air assistance |
| WAA | With air assistance |
| WSP | Water-sensitive paper |
| nd | Number of drops |
References
- Khan, F.A.; Khorsandi, F.; Ali, M.; Ghafoor, A.; Khan, R.A.R.; Umair, M.; Shahzaib; Rehman, A.; Hussain, Z. Spray drift reduction management in agriculture: A review. Prog. Agric. Eng. Sci. 2024, 20, 1–36. [Google Scholar] [CrossRef]
- Tang, Q.; Zhang, R.; Chen, L.; Zhang, P.; Li, L.; Xu, G.; Yi, T.; Hewitt, A. Improving UASS pesticide application: Optimizing and validating drift and deposition simulations. Pest Manag. Sci. 2025, 81, 127–140. [Google Scholar] [CrossRef] [PubMed]
- Xun, L.; Campos, J.; Salas, B.; Fabregas, F.X.; Zhu, H.; Gil, E. Advanced spraying systems to improve pesticide saving and reduce spray drift for apple orchards. Precis. Agric. 2023, 24, 1526–1546. [Google Scholar] [CrossRef]
- D’alessandro, A.; Coletta, M.; Torresi, A.; Dell’ambrogio, G.; Renaud, M.; Ferrari, B.J.D.; La Terza, A. Evaluation of the Impact of Plant Protection Products (PPPs) on Non-Target Soil Organisms in the Olive Orchard: Drone (Aerial) Spraying vs. Tractor (Ground) Spraying. Sustainability 2024, 16, 11302. [Google Scholar] [CrossRef]
- Kumar, R.; Sankhla, M.S.; Kumar, R.; Sonone, S.S. Impact of pesticide toxicity in aquatic environment. Biointerface Res. Appl. Chem. 2021, 11, 10131–10140. [Google Scholar]
- Teklu, B.M.; Haileslassie, A.; Mekuria, W. Pesticides as water pollutants and level of risks to environment and people: An example from Central Rift Valley of Ethiopia. Environ. Dev. Sustain. 2022, 24, 5275–5294. [Google Scholar] [CrossRef]
- Tudi, M.; Ruan, H.D.; Wang, L.; Lyu, J.; Sadler, R.; Connell, D.; Chu, C.; Phung, D.T. Agriculture development, pesticide application and its impact on the environment. Int. J. Environ. Res. Public Health 2021, 18, 1112. [Google Scholar] [CrossRef] [PubMed]
- European Commission. Communication from the Commission to the European Parliament, the European Council, the Council, the European Economic and Social Committee and the Committee of the Regions—The European Green Deal (COM(2019) 640 final); European Commission: Brussels, Belgium, 2019.
- Fetting, C. The European Green Deal; ESDN Report; ESDN Office: Vienna, Austria, 2020. [Google Scholar]
- European Commission. Communication from the Commission to the European Parliament, the Council, the European Economic and Social Committee and the Committee of the Regions—A Farm to Fork Strategy. For a Fair, Healthy and Environmentally-Friendly Food System. (COM(2020) 381 Final); European Commission: Brussels, Belgium, 2020.
- Mowlds, S. The EU’s farm to fork strategy: Missing links for transformation. Acta Innov. 2020, 36, 17–30. [Google Scholar] [CrossRef]
- Radlińska, K. Changes in the Structure of Agriculture in Central and Eastern Europe in the Light of the European Green Deal. Sustainability 2024, 17, 104. [Google Scholar] [CrossRef]
- European Commission. Communication from the Commission to the European Parliament, the Council, the European Economic and Social Committee and the Committee of the Regions—EU Biodiversity Strategy for 2030—Bringing Nature Back Into Our Lives (COM(2020) 380 Final); European Commission: Brussels, Belgium, 2020.
- Hermoso, V.; Carvalho, S.B.; Giakoumi, S.; Goldsborough, D.; Katsanevakis, S.; Leontiou, S.; Markantonatou, V.; Rumes, B.; Vogiatzakis, I.N.; Yates, K.L. The EU Biodiversity Strategy for 2030: Opportunities and challenges on the path towards biodiversity recovery. Environ. Sci. Policy. 2022, 127, 263–271. [Google Scholar] [CrossRef]
- Nicastro, R.; Papale, M.; Fusco, G.M.; Capone, A.; Morrone, B.; Carillo, P. Legal Barriers in Sustainable Agriculture: Valorization of Agri-Food Waste and Pesticide Use Reduction. Sustainability 2024, 16, 8677. [Google Scholar] [CrossRef]
- Felsot, A.S.; Unsworth, J.B.; Linders, J.; Roberts, G.; Rautman, D.; Harris, C.; Carazo, E. Agrochemical spray drift; assessment and mitigation—A review. J. Environ. Sci. Heal. B 2010, 46, 1–23. [Google Scholar] [CrossRef]
- Nuyttens, D.; De Schampheleire, M.; Baetens, K.; Brusselman, E.; Dekeyser, D.; Verboven, P. Drift from field crop sprayers using an integrated approach: Results of a five-year study. Trans. ASABE 2011, 54, 403–408. [Google Scholar] [CrossRef]
- Wawrzosek, J.; Parafiniuk, S. Optimization of the opening shape in slot spray nozzles in a field boom sprayer. Sustainability 2021, 13, 3291. [Google Scholar] [CrossRef]
- Chen, S.; Liu, J.; Chang, K.; Guo, J.; Hu, S.; Xu, X.; Lan, Y. The effects of lateral wind and droplet size on the droplet drift characteristics of fan-shaped nozzles for aerial spraying. Int. J. Precis. Agric. Aviat. 2023, 1, 16–22. [Google Scholar] [CrossRef]
- Jomantas, T.; Lekavičienė, K.; Steponavičius, D.; Andriušis, A.; Zaleckas, E.; Zinkevičius, R.; Popescu, C.V.; Salceanu, C.; Ignatavičius, J.; Kemzūraitė, A. The influence of newly developed spray drift reduction agents on drift mitigation by means of wind tunnel and field evaluation methods. Agriculture 2023, 13, 349. [Google Scholar] [CrossRef]
- Ranta, O.; Marian, O.; Muntean, M.V.; Molnar, A.; Ghețe, A.B.; Crișan, V.; Stănilă, S.; Rittner, T. Quality analysis of some spray parameters when performing treatments in vineyards in order to reduce environment pollution. Sustainability 2021, 13, 7780. [Google Scholar] [CrossRef]
- Brown, R.B.; Carter, M.H.; Stephenson, G.R. Buffer zone and windbreak effects on spray drift deposition in a simulated wetland. Pest Manag. Sci. 2024, 60, 1085–1090. [Google Scholar] [CrossRef]
- Hewitt, A.J. Adjuvant use for the management of pesticide drift, leaching and runoff. Pest Manag. Sci. 2024, 80, 4819–4827. [Google Scholar] [CrossRef]
- ISO 22866:2005; Equipment for Crop Protection—Methods for Field Measurement of Spray Drift. ISO: Geneva, Switzerland, 2005.
- Lipiński, A.J.; Lipiński, S.; Burg, P.; Sobotka, S.M. Influence of the instability of the field crop sprayer boom on the spraying uniformity. J. Agric. Food Res. 2022, 10, 100432. [Google Scholar] [CrossRef]
- Lysov, A.; Kornilov, T. Ecological evaluation of technologies for application of plant protection measures by spraying method. BIO Web Conf. 2020, 21, 00042. [Google Scholar] [CrossRef]
- Jeon, H.Y.; Womac, A.R.; Gunn., J. Sprayer boom dynamic effects on application uniformity. Trans. ASAE 2004, 47, 647. [Google Scholar] [CrossRef]
- Kaliniewicz, Z.; Lipiński, A.; Markowski, P.; Szczyglak, P.; Lipiński, S. The influence of selected operating parameters of a field sprayer on boom stability. Comput. Electron. Agric. 2024, 219, 108787. [Google Scholar] [CrossRef]
- Markowski, P.; Kaliniewicz, Z.; Lipiński, A.; Lipiński, S.; Burg, P.; Mašán, V. Horizontal Distribution of Liquid in an Over-Row Sprayer with a Secondary Air Blower. Appl. Sci. 2024, 14, 9036. [Google Scholar] [CrossRef]
- Višacki, V.V.; Sedlar, A.D.; Gil, E.; Bugarin, R.M.; Turan, J.J.; Janic, T.V.; Burg, P. Effects of sprayer boom height and operating pressure on the spray uniformity and distribution model development. Appl. Eng. Agric. 2016, 32, 341–346. [Google Scholar]
- Griesang, F.; Decaro, R.A.; dos Santos, C.A.M.; Santos, E.S.; Roque, N.H.d.L.; Ferreira, M.d.C. How much do adjuvant and nozzles models reduce the spraying drift? drift in agricultural spraying. Am. J. Plant Sci. 2017, 8, 2785–2794. [Google Scholar] [CrossRef]
- Sayinci, B.; Demir, B.; Acik, N. Comparison of spray nozzles in terms of spray coverage and drop distribution uniformity at low volume. Turk. J. Agric. 2020, 44, 262–270. [Google Scholar] [CrossRef]
- Alves, G.S.; Kruger, G.R.; da Cunha, J.P.A.; de Santana, D.G.; Pinto, L.A.T.; Guimarães, F.; Zaric, M. Dicamba spray drift as influenced by wind speed and nozzle type. Weed Technol. 2017, 31, 724–731. [Google Scholar] [CrossRef]
- Gulyas, Z.; Fenyvesi, L.; Szoboszlay, S. Liquid atomization and spray drift measurement in a wind tunnel for a twin fluid system with a deflector nozzle. Turk. J. Agric. 2012, 36, 469–475. [Google Scholar] [CrossRef]
- Li, S.; Li, J.; Yu, S.; Wang, P.; Liu, H.; Yang, X. Anti-drift technology Progress of plant protection applied to orchards: A review. Agronomy 2023, 13, 2679. [Google Scholar] [CrossRef]
- Bahlol, H.Y.; Chandel, A.K.; Hoheisel, G.A.; Khot, L.R. The smart spray analytical system: Developing understanding of output air-assist and spray patterns from orchard sprayers. Crop Prot. 2020, 127, 104977. [Google Scholar] [CrossRef]
- Hong, S.W.; Zhao, L.; Zhu, H. CFD simulation of pesticide spray from air-assisted sprayers in an apple orchard: Tree deposition and off-target losses. Atmos. Environ. 2018, 175, 109–119. [Google Scholar] [CrossRef]
- Sinha, R.; Ranjan, R.; Khot, L.R.; Hoheisel, G.A.; Grieshop, M.J. Drift potential from a solid set canopy delivery system and an axial–fan air–assisted sprayer during applications in grapevines. Biosyst. Eng. 2019, 188, 207–216. [Google Scholar] [CrossRef]
- Lipiński, S.; Lipiński, A.J. Application of morphological image processing to extraction of information about the droplet size using water sensitive paper. Meas. Automat. Monit. 2011, 57, 630–633. [Google Scholar]
- Van de Zande, J.C.; Rautmann, D.; Holterman, H.J.; Huijsmans, J.F.M. Joined Spray Drift Curves for Boom Sprayers in the Netherlands and Germany; Report no. 526; Plant Research International: Wageningen, The Netherlands, 2015. [Google Scholar]
- ISO 22369-2; Crop Protection Equipment—Drift Classification of Spraying Equipment—Part 2: Classification of Field Crop Sprayers by Field Measurements. ISO: Geneva, Switzerland, 2010.
- Gu, C.; Sun, J.; Li, S.; Yang, S.; Zou, W.; Zhai, C. Deposition Characteristics of Air-Assisted Sprayer Based on Canopy Volume and Leaf Area of Orchard Trees. Plants 2025, 14, 220. [Google Scholar] [CrossRef]
- Larbi, P.A. On-Target Deposition from Two Engine-Powered Sprayers in Medium-Foliage-Density Citrus Canopies. Agronomy 2024, 14, 1883. [Google Scholar] [CrossRef]
- Lopes, L.D.L.; Cunha, J.P.A.R.D.; Nomelini, Q.S.S. Use of unmanned aerial vehicle for pesticide application in soybean crop. AgriEngineering 2023, 5, 2049–2063. [Google Scholar] [CrossRef]
- Zhang, Z.; Zhu, H.; Guler, H. Quantitative analysis and correction of temperature effects on fluorescent tracer concentration measurement. Sustainability 2020, 12, 4501. [Google Scholar] [CrossRef]
- Ferguson, J.C.; Hewitt, A.J.; O’Donnell, C.C.; Kruger, G.R. Comparison of water-sensitive paper, Kromekote and Mylar collectors for droplet deposition with a visible fluorescent dye solution. J. Plant Prot. Res. 2020, 60, 98–105. [Google Scholar]
- Lipiński, A.J.; Lipiński, S. Automatic valuation of the spraying quality on the basis of drops traces using the computer image analysis. Agric. Eng. 2009, 13, 163–168. [Google Scholar]
- Lipiński, A.J.; Lipiński, S. Binarizing water sensitive papers–how to assess the coverage area properly? Crop Prot. 2020, 127, 104949. [Google Scholar] [CrossRef]
- Otsu, N. A threshold selection method from gray-level histograms. IEEE Trans. Syst. Man Cybern. 1979, 9, 62–66. [Google Scholar] [CrossRef]
- Sezgin, M.; Sankur, B. Survey over image thresholding techniques and quantitative performance evaluation. J. Electron. Imaging 2004, 13, 146–165. [Google Scholar]
- Kalicka, R.; Lipiński, S. A fast method of separation of the noisy background from the head-cross section in the sequence of MRI scans. Biocybern. Biomed. Eng. 2010, 30, 15–27. [Google Scholar]
- Karakus, P. Detection of Water Surface Using Canny and Otsu Threshold Methods with Machine Learning Algorithms on Google Earth Engine: A Case Study of Lake Van. Appl. Sci. 2025, 15, 2903. [Google Scholar] [CrossRef]
- Burn, A. Pesticide buffer zones for the protection of wildlife. Pest Manag. Sci. 2003, 59, 583–590. [Google Scholar] [CrossRef]
- El Afandi, G.; Ismael, H.; Fall, S. A Hybrid Modeling Approach for Estimating the Exposure to Organophosphate Pesticide Drift in Sangamon County, Illinois. Sustainability 2024, 16, 2908. [Google Scholar] [CrossRef]
- Ferguson, J.C.; O’Donnell, C.C.; Chauhan, B.S.; Adkins, S.W.; Kruger, G.R.; Wang, R.; Ferreira, P.H.U.; Hewitt, A.J. Determining the uniformity and consistency of droplet size across spray drift reducing nozzles in a wind tunnel. Crop Prot. 2015, 76, 1–6. [Google Scholar] [CrossRef]
- Knoche, M. Effect of droplet size and carrier volume on performance of foliage-applied herbicides. Crop Prot. 1994, 13, 163–178. [Google Scholar] [CrossRef]
- Yan, J.; Wang, J.; Lv, C.; Wang, S. A CFD simulation method for nozzle droplet deposition characteristics and corresponding experimental validation. J. Agric. Eng. 2025, 56, 1708. [Google Scholar] [CrossRef]
- Baetens, K.; Nuyttens, D.; Verboven, P.; De Schampheleire, M.; Nicolaï, B.; Ramon, H. Predicting drift from field spraying by means of a 3D computational fluid dynamics model. Comp. Electron. Agric. 2007, 56, 161–173. [Google Scholar] [CrossRef]
- Hong, S.W.; Park, J.; Jeong, H.; Lee, S.; Choi, L.; Zhao, L.; Zhu, H. Fluid dynamic approaches for prediction of spray drift from ground pesticide applications: A review. Agronomy 2021, 11, 1182. [Google Scholar] [CrossRef]
- Duga, A.T.; Delele, M.A.; Ruysen, K.; Dekeyser, D.; Nuyttens, D.; Bylemans, D.; Nocolai, B.M.; Verboven, P. Development and validation of a 3D CFD model of drift and its application to air-assisted orchard sprayers. Biosyst. Eng. 2017, 154, 62–75. [Google Scholar] [CrossRef]


Disclaimer/Publisher’s Note: The statements, opinions and data contained in all publications are solely those of the individual author(s) and contributor(s) and not of MDPI and/or the editor(s). MDPI and/or the editor(s) disclaim responsibility for any injury to people or property resulting from any ideas, methods, instructions or products referred to in the content. |
© 2025 by the authors. Licensee MDPI, Basel, Switzerland. This article is an open access article distributed under the terms and conditions of the Creative Commons Attribution (CC BY) license (https://creativecommons.org/licenses/by/4.0/).
Share and Cite
Lipiński, S.; Kaliniewicz, Z.; Markowski, P.; Szczyglak, P. Evaluation of Air-Assisted Spraying Technology for Pesticide Drift Reduction. Sustainability 2025, 17, 5036. https://doi.org/10.3390/su17115036
Lipiński S, Kaliniewicz Z, Markowski P, Szczyglak P. Evaluation of Air-Assisted Spraying Technology for Pesticide Drift Reduction. Sustainability. 2025; 17(11):5036. https://doi.org/10.3390/su17115036
Chicago/Turabian StyleLipiński, Seweryn, Zdzisław Kaliniewicz, Piotr Markowski, and Piotr Szczyglak. 2025. "Evaluation of Air-Assisted Spraying Technology for Pesticide Drift Reduction" Sustainability 17, no. 11: 5036. https://doi.org/10.3390/su17115036
APA StyleLipiński, S., Kaliniewicz, Z., Markowski, P., & Szczyglak, P. (2025). Evaluation of Air-Assisted Spraying Technology for Pesticide Drift Reduction. Sustainability, 17(11), 5036. https://doi.org/10.3390/su17115036