Article

Exploring the Influencing Factors of Wetland Parks on the Sustainable Development of Urban Economy: A Case in Southern China

1
School of Design, South China University of Technology, Guangzhou 510641, China
2
College of Forestry and Landscape Architecture, South China Agricultural University, Guangzhou 510642, China
*
Author to whom correspondence should be addressed.
Sustainability 2025, 17(11), 5021; https://doi.org/10.3390/su17115021
Submission received: 25 February 2025 / Revised: 11 April 2025 / Accepted: 28 April 2025 / Published: 30 May 2025

Abstract

:
Currently, studies in green infrastructure have developed different wetland park value evaluation systems, and various criteria to measure urban economic development have been proposed. However, these criteria are not widely adopted, and there is a lack of investigation on the relationship between wetland parks and urban economic development. The existing literature indicates that the specific impact factors of wetland parks on urban economic development have not been further explored. Therefore, this study builds on previous theoretical research to develop a conceptual model with 12 hypotheses, followed by a questionnaire survey method to obtain data. The questions have been developed for each of five variables in the conceptual model to validate the research hypotheses that have been contextually modified according to the uniqueness of different wetland parks based on previous classic scales, namely, ecological value, recreational value, resource attraction, a diversified industrial structure, and economic expectation. This study aims to investigate how wetland parks promote urban economic health through ecological value and recreational value, particularly their indirect role in fostering diversified industrial structure, resource attraction, and economic expectations. Structural equation modeling with the Statistical Package for the Social Sciences (SPSS) 26.0 and the Analysis of Moment Structures (AMOS) 24.0 has been used for validating the hypotheses. The findings in this paper highlight that recreational value has the most significant impact on a diversified industrial structure that, in turn, has a highly significant positive impact on both resource attraction and economic expectations. In addition, the influence of ecological value on urban economic outcomes largely depends on recreational value as a mediator. Two significant impact pathways have been further identified: (1) from ecological value, recreational value, and a diversified industrial structure to resource attraction; and (2) from ecological value, recreational value, and a diversified industrial structure to economic expectations. Further, the managers and developers of wetland parks need to fully preserve the ecological value of the parks and optimize their recreational value before embarking on new development projects. The theoretical contribution of this paper lies in uncovering the direct and indirect effects of ecological value and recreational value on diversified industrial structure and resource attraction, emphasizing the crucial role of recreational value in driving economic diversification. The practical implications are reflected in providing concrete pathways and strategies for urban planners and policymakers to optimize the ecological and recreational value of wetland parks, thereby promoting urban economic development.

1. Introduction

The existing research mainly focuses on the ecological value of wetland parks or their inherent economic value, with insufficient theoretical attention and elaboration on their role in urban development [1,2,3]. Previous studies have shown that wetland parks can promote urban economic development by attracting tourists, increasing tourism revenue, and providing employment opportunities for local residents [4,5,6]. Additionally, wetland parks can improve residents’ quality of life. Proximity to natural environments can reduce stress and fatigue, thereby enhancing physical health [7]. Similarly, wetland parks can provide recreational spaces for residents, increase opportunities for social activities, and foster community cohesion.
However, with the acceleration of urbanization, cities face numerous challenges that highlight the unsustainability of traditional economic development models. Urbanization brings many benefits, but it also triggers a series of negative reactions, such as inefficiency in public services [8], air pollution [9,10], climate change [11,12], loss of biodiversity [13], soil erosion, and energy depletion [14,15]. These negative reactions limit the sustainable development and continuous prosperity of cities. Therefore, it is crucial to promote the healthy economic development of cities to achieve coordination and balance across economic, environmental, social, and cultural dimensions.
Green infrastructure has been shown to enhance property values and commercial activity in China [16,17] and Adelaide, Australia [18], reporting higher housing prices near accessible green spaces. Additionally, green infrastructure contributes to tourism growth and urban food systems, as integrating food production into urban areas and preserving agricultural land at the urban fringe are recognized economic benefits [19]. Further, a cost–benefit analysis of an urban renewal project in Taiwan further demonstrated that green infrastructure investment, despite an initial cost increase of $9.2 million, generated an additional $1.2 million in annual economic value, achieving full cost recovery within eight years [20]. However, despite the significant role of wetland parks in promoting urban economic development, research in the field remains relatively scarce. A notable example is shown from a bibliometric review on green infrastructure and ecosystem services [21], which identified 39,719 studies, of which only three met the economic valuation criteria after systematic filtering, highlighting a serious lack of economic analysis in the field.
Currently, research on how wetland parks promote healthy urban economic development remains relatively scarce, particularly regarding how their ecological and recreational values influence economic structural optimization and resource attraction through mediating mechanisms. Therefore, this paper explores the existing theoretical research to propose a conceptual model incorporating five variables, namely, ecological value, recreational value, resource attraction, a diversified industrial structure, and economic expectations, with 12 hypotheses. By the use of questionnaire surveys and structural equation modeling (SEM) analysis, this paper investigates the roles of the five variables in the conceptual model for enhancing urban economic health by revealing both the direct effects of ecological and recreational values and their indirect influence on industrial diversification, which, in turn, drives resource attraction and economic expectations.

2. Literature Review and Hypothesis

2.1. Literature Review

As a type of green infrastructure, wetland parks play an important role in ecological protection and management while having multiple impacts on urban economies through their ecological and recreational value. In recent years, many studies have investigated the relationship between green infrastructure and the healthy economic development of cities, proposing various understandings and expressions, including economic sustainability, economic resilience, economic welfare, and economic efficiency [22,23]. These studies consistently emphasize that urban economic development should be in harmony with environmental, social, and cultural aspects to achieve long-term balance and stability.
Studies using hedonic pricing to estimate the economic benefits of green infrastructure indicate that the proximity to green infrastructure significantly affects property prices. In developed countries, reducing the distance to parks or increasing the size of nearby parks generally increases property values [23]. Similarly, a study of 51 cities in China found that green indicators, such as urban green coverage ratio, per capita public green space, and the number of days with good air quality, have a measurable impact on housing prices. Specifically, the urban green coverage ratio alone can contribute to a 5% price premium [24]. However, undeveloped green infrastructure may negatively impact property values due to negative external issues such as unpleasant odors, safety issues, and solid waste management [22]. This impact varies significantly across different regions and countries, reflecting the importance of the management and maintenance of green infrastructure. Additionally, the role of green infrastructure in regulating air quality and urban temperature generates substantial economic value. For instance, a study of 86 Canadian cities found that urban trees have been used to assist with annually removing 16,000 tons of air pollutants, corresponding to an economic value of 227 million Canadian dollars and preventing 22,000 cases of acute respiratory symptoms [25,26]. Additionally, a 15-year longitudinal study in Hangzhou, China, found that the average annual frequency of short-duration heavy rainfall events in the city was 9.6 times per year, and the coordinated coupling degree of green infrastructure was significantly higher in years with more stable climatic conditions [27]. Trees also provide significant economic benefits through carbon storage and sequestration, avoiding stormwater runoff, and reducing residential energy costs, accounting for 71% of carbon storage and sequestration, 2.88% in energy savings, 20.32% in alleviating respiratory diseases, and 5.62% in stormwater runoff mitigation [28].
Despite revealing various positive factors of green infrastructure on urban economic health, different studies employ diverse economic benefit evaluation tools, leading to inconsistent data results. For instance, the economic benefit evaluation tools used across studies vary widely, often relying on different assumptions and models to calculate pollutant removal and economic benefits, which, in turn, affects the final outcomes. For example, the i-Tree tool provides relatively constant pollutant removal data for different study areas, whereas data from the National Bureau of Statistics of China shows zero in some areas [29]. These differences reflect the limitations and challenges of different research methods and tools in evaluating the economic benefits of green infrastructure, suggesting that existing tools may inadequately account for regional differences and environmental variables, thus impacting the reliability and comparability of the study results. In studies related to the influencing factors of green infrastructure, some research only discusses direct impacts, with limited studies on the mediating effects between latent variables [30,31].
Currently, studies in green infrastructure have developed different wetland park value evaluation systems [32]. Similarly, various criteria to measure urban economic development have been proposed [33,34]. However, these criteria are not widely adopted, and there is a lack of investigation on the relationship between wetland parks and urban economic development. To address this problem, this paper draws upon the theoretical foundations of sustainable development, resilient cities, smart growth, and green transition to explore how wetland parks contribute to healthy urban economic development. Since sustainable development emphasizes meeting present needs without compromising the ability of future generations to meet theirs, it advocates for the balanced integration of economic, social, and environmental factors [35]. The resilient cities theory highlights the capacity of urban systems to absorb shocks and maintain functional stability, enhancing economic adaptability and social well-being [36,37]. Smart growth promotes efficient land use, compact development, and public transportation optimization to achieve sustainable economic growth [38,39,40]. Meanwhile, the green transition theory underscores the importance of resource conservation and environmentally friendly development models, aiming for the harmonious integration of economic, environmental, and social benefits [41,42,43].
As green infrastructure, wetland parks naturally align with these four theoretical frameworks, forming a foundation for promoting healthy urban economic development [44]. By facilitating ecological conservation and optimizing resource utilization, wetland parks contribute to the achievement of sustainable development goals [45,46]. Their ecological restoration and environmental regulation functions enhance urban resilience [47], aligning with the resilient cities concept [48]. Through the efficient use of wetland resources and industrial linkages, they support compact urban development, in line with smart growth principles [49,50]. Simultaneously, wetland parks foster low-carbon economies and green industries, driving urban green transition [51]. Thus, wetland parks are not only integral to urban ecological systems but also serve as key drivers of healthy economic development, embodying the synergy between ecology, economy, and society. The existing literature indicates that the specific impact factors of wetland parks on urban economic development have not been further explored. Therefore, this paper is set to explore the impact factors of wetland parks on urban economic development towards sustainability.

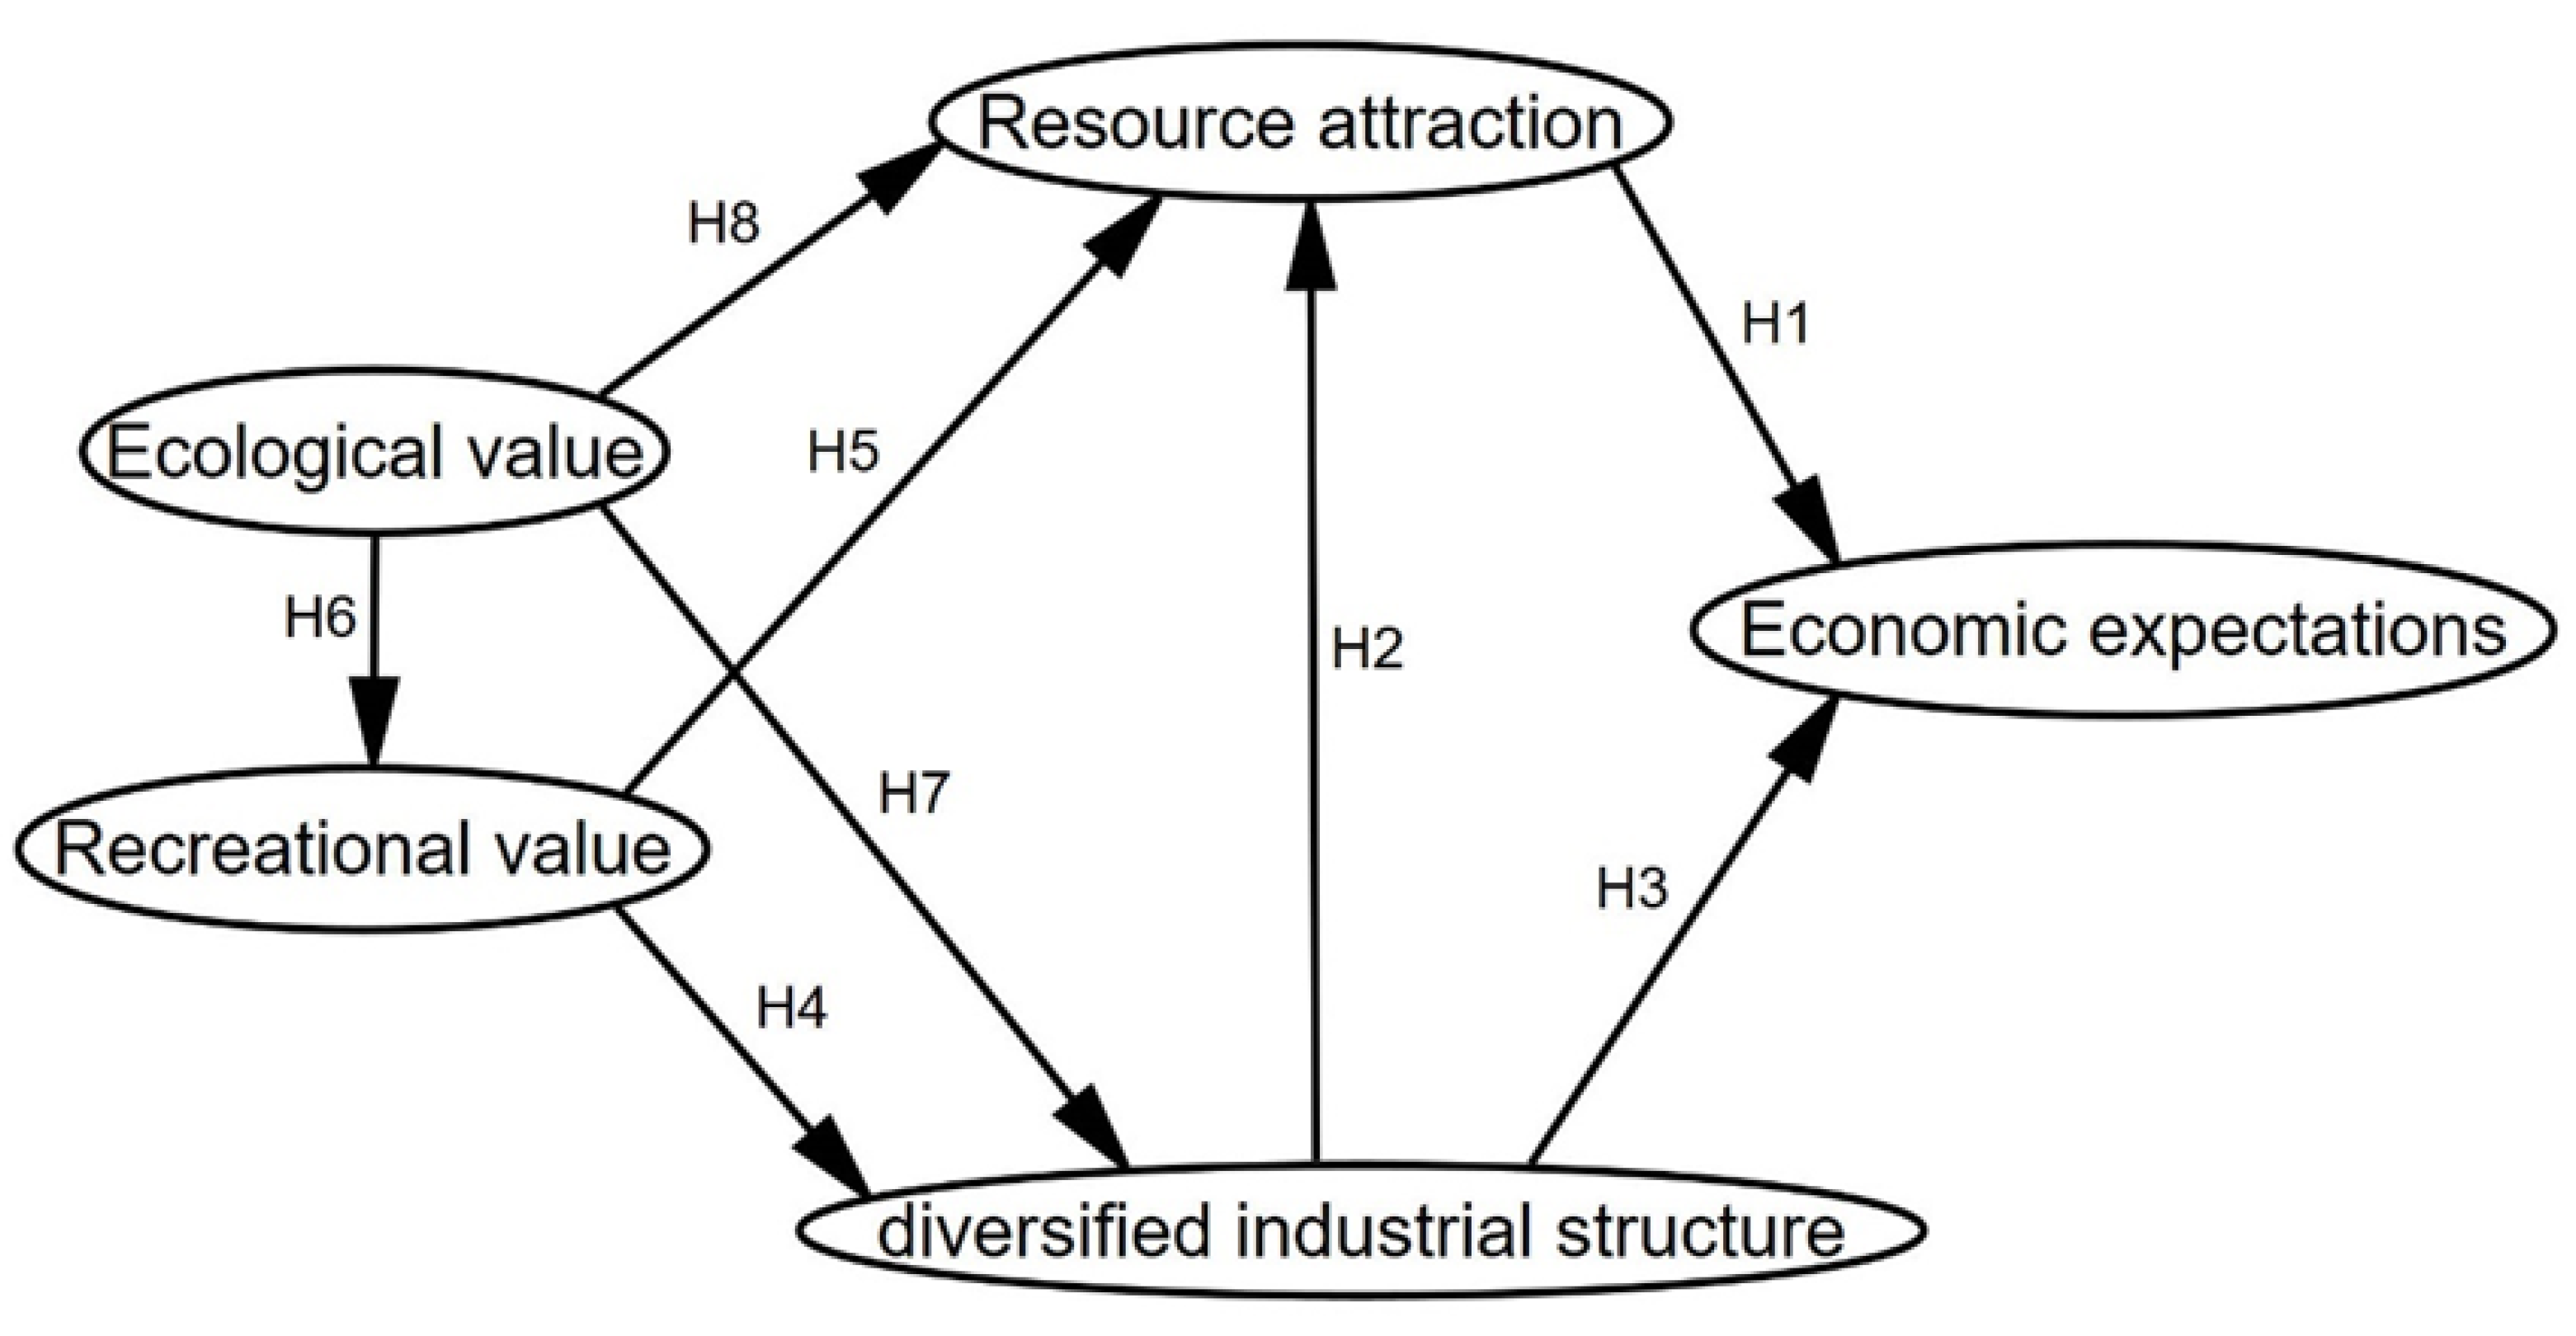
2.2. Model Construction

This paper adopts four urban development-related theories, i.e., sustainable development, resilient cities, smart growth, and green transformation, and combines the ecological, social, and economic benefits of wetland parks to set latent variables and propose hypotheses. Especially, ecological services of wetland parks, such as water purification, climate regulation, and biodiversity protection, have been provided, and the development of green industries and circular economies to achieve sustainable development is promoted [52], in which wetland parks can enhance urban resilience to natural disasters and environmental changes, reduce the destructiveness of external shocks, and stimulate related industries and tourism, increasing urban economic resilience [53,54]. Moreover, the ecological services and development can improve land-use efficiency, reduce urban sprawl, attract talent and investment, and provide continuous motivation for economic growth, achieving smart growth [55,56]. As such, wetland parks can promote sustainable industries, green innovation, and circular economies, balancing economic growth, social welfare, and environmental protection to achieve the green transformation of urban economics [57,58,59].
In constructing the initial model, this paper refers to previous research results, integrating classical expectation models from various studies [60,61,62,63,64,65], and selects two latent variables most commonly used in wetland park value assessments: ecological value [66] and recreational value [67]. To assess the impact on economic development around wetland parks, parameters commonly used in urban economic development evaluations are integrated into three latent variables: diversified industrial structure, resource attraction, and economic expectation.
Diversified industrial structure reflects the impact of wetland parks on the surrounding industrial structure, providing stronger support for urban economic development [68]. Resource attraction represents the ability of wetland parks to attract capital, technology, and talent, contributing to a diversified industrial structure and urban economic development [57]. Economic expectation reflects residents’ confidence and attitudes towards urban economic development. Constructing this initial model allows for a comprehensive analysis of the role that wetland parks play in promoting sustainable urban economic development [69].

2.3. Hypothesis Formulation

2.3.1. Economic Expectations

Economic expectation refers to the predictions and estimations by residents or practitioners regarding future economic activities and various economic indicators, based on data analysis, historical trends, and policy changes [69]; it is a key indicator for measuring the healthy development of urban economies and reflects residents’ perceptions of economic health. In the research model, economic expectation is the core dependent variable, influenced directly or indirectly by other latent variables, such as resource attraction or diversified industrial structure. To measure economic expectation, this paper uses subjective perceptions of residents on income growth, income stability, consumption frequency, and employment opportunities [70,71].

2.3.2. Resource Attraction

Resource attraction refers to the process by which wetland parks attract related practitioners and enterprises by creating a beautiful ecological environment, providing industrial development opportunities, and sharing benefits. As ecological infrastructure, wetland parks can attract key resources such as talent, technology, and capital by offering ecological services, improving environmental quality, and promoting the development of green industry chains, thereby providing economic development space and enhancing economic competitiveness [72]. To accurately measure resource attraction, past studies referenced classic scales from previous studies and made contextual adaptations [73].
Residents of higher socioeconomic status enjoy better access to green spaces and interact more closely with these areas, indicating that the high-quality livable environment provided by wetland parks effectively attracts high-net-worth individuals to live or work there [74]. As this process develops, the agglomeration effect of talent and resources around wetland parks strengthens, further attracting more practitioners and enterprises and creating a virtuous cycle [75], improving local residents’ income levels and quality of life, and thereby enhancing economic expectations. Therefore, the following hypothesis is proposed:
H1. 
Resource attraction has a significant positive impact on economic expectations.

2.3.3. Diversified Industrial Structure

Industrial diversification refers to the phenomenon where the economic activities or industrial structure of a specific region spans multiple distinct sectors [76,77,78]. Previous studies have indicated that industrial diversification contributes to enhancing economic resilience, reducing urban economies’ dependence on a single industry, mitigating risks, improving economic flexibility, and fostering sustainable economic growth in urban areas [68].
The development of wetland parks can promote tourism and cultural and creative industries [79], provide ecosystem services, attract educational institutions, and increase surrounding real estate values [80], which enriches the surrounding industries.
A diversified industrial structure provides more employment opportunities and development prospects, attracting various talents, technologies, and capital resources. Industrial diversification forms a complete industrial chain and synergy, improving overall competitiveness, effectively promoting resource attraction, and driving regional economic development [81]. This indicates that a diversified industrial structure positively impacts resource attraction and economic expectation. Based on this, the following hypotheses are proposed:
H2. 
Diversified industrial structure has a significant positive impact on resource attraction.
H3a. 
Diversified industrial structure has a significant positive impact on economic expectations.

2.3.4. Mediating Effect of Resource Attraction

Industrial diversification attracts innovative talent and enterprises, bringing advanced technologies and knowledge, enhancing the innovation base, and driving economic growth and competitiveness [82,83]. A diversified industrial structure creates more employment opportunities, attracting a diversified labor force, improving employment rates and quality, and enhancing employment market stability and growth, thereby improving economic expectations. Simultaneously, the influx of resources driven by a diversified industrial structure promotes infrastructure development, such as transportation, communication, energy, and public services, further driving a diversified industrial structure and supporting favorable economic expectations [84]. Therefore, resource attraction plays a key mediating role in the impact of a diversified industrial structure on economic expectations, enhancing regional competitive advantage, innovation capacity, employment levels, and infrastructure development and improving economic expectations. Based on this, the following hypothesis is proposed:
H3b. 
Resource attraction acts as a mediator in the relationship between a diversified industrial structure and economic expectations.

2.3.5. Recreational Value

Recreational value refers to the functions and activities provided by wetland parks, such as ecological, cultural, wellness, and entertainment, which satisfy people’s leisure time needs [67]. Past studies show that the recreational value of wetland parks directly affects their functions, such as attracting tourists and promoting tourism development [85]. To accurately measure recreational value, this paper adopted a past research approach that is based on the descriptions of recreation value scale indicators from previous studies, with contextual adaptations made to suit the study’s framework [65].
The recreational value of wetland parks effectively attracts tourists for visits, leisure, and entertainment, driving the development of tourism and related service industries and promoting a diversified industrial structure [61]. As green infrastructure with high recreational value, wetland parks enhance regional resource attraction, attracting talent, enterprises, and investors to settle, start businesses, and invest [60] and achieving the coordinated development of resource attraction and a diversified industrial structure. As such, the following hypotheses are proposed:
H4. 
Recreational value has a significant positive impact on a diversified industrial structure.
H5a. 
Recreational value has a significant positive impact on resource attraction.

2.3.6. Mediating Effect of a Diversified Industrial Structure

The recreational value of wetland parks promotes the development of ecology-related industries, fostering a diverse labor market and providing more career choices and development opportunities, which enhances talent attraction [86]. Additionally, areas with high recreational value have strong social ties, facilitating the sharing of resources, knowledge, and skills, promoting innovation and technological development, and attracting innovative enterprises and talent, thereby creating a richer innovation environment [82]. These mechanisms enhance a diversified industrial structure, further boosting economic resilience, reducing dependence on a single industry and economic risks, attracting more resources and investments, and improving competitiveness and labor market stability. Therefore, the following hypothesis is proposed:
H5b. 
A diversified industrial structure acts as a mediator in the relationship between recreational value and resource attraction.

2.3.7. Ecological Value

The ecological value of wetland parks refers to the ecosystem services they provide, such as water purification, biodiversity protection, climate regulation, carbon sequestration, and soil protection and restoration [66]. Ecological value is a key endogenous variable that directly or indirectly affects other variables, such as recreational value. The measurement of ecological value will be based on the subjective perceptions of surrounding residents on air quality, noise, water quality, climate, and biodiversity [62,63,64].
Wetland parks with high ecological value possess rich biodiversity, attracting tourists and promoting the prosperity of tourism and related service industries, which provide ecological services such as air purification, climate regulation, and water resource protection, offering unforgettable recreational experiences for visitors [87]. Simultaneously, wetland parks can serve as platforms for ecological technology innovation by research institutions and enterprises [88], attracting related talent and enterprise investments and promoting industrial integration and innovative development. Therefore, the following hypotheses are proposed:
H6. 
Ecological value has a significant positive impact on recreational value.
H7a. 
Ecological value has a significant positive impact on a diversified industrial structure.
H8a. 
Ecological value has a significant positive impact on resource attraction.

2.3.8. Mediating Effect of Recreational Value

Wetland parks with high ecological value attract tourists, residents, and enterprises, providing natural environments and recreational activities and thereby generating recreational value. Well-maintained wetland parks with diverse wildlife and unique natural features help increase recreational value. The enhancement of recreational value stimulates the development of tourism, hospitality, and outdoor recreation industries. At the same time, high recreational value locations have been used to attract elite individuals for employment and residency, promoting the growth of knowledge-intensive industries. Recreational value serves as a bridge between ecological value and a diversified industrial structure and resource attraction, making areas more attractive, stimulating industrial development, and attracting cross-industry investments [89]. This process fosters the formation of sustainable and resilient economic entities. Therefore, the following hypotheses are proposed:
H7b. 
Recreational value acts as a mediator in the relationship between ecological value and a diversified industrial structure.
H8b. 
Recreational value acts as a mediator in the relationship between ecological value and resource attraction.
Based on the hypothesis research, this paper proposes a conceptual model of the influencing factors of wetland parks in urban economic sustainable development, as shown in Figure 1.

3. Methodology

This paper employed a questionnaire survey method to obtain data for which questions have been developed for each of the five variables in the conceptual model (Figure 1) to validate the research hypotheses that have been contextually modified according to the uniqueness of different wetland parks based on previous classic scales, namely, ecological value [63,64,83], recreational value [65,90], resource attraction [75,91], a diversified industrial structure [68,80,81], and economic expectation [70,71].

3.1. Questionnaire Design

To ensure the effectiveness of the survey questionnaire, after completing the initial measurement scale development, the measurement content, wording, and question phrasing of the preliminary questionnaire were validated with two experts in the relevant research field, two master’s students with empirical research experience in the field, and two master’s students with a disciplinary background in the field. Based on the results of their feedback, some ambiguous questions were revised, and some questions that were unclear for the potential variables were deleted, resulting in an initial version of the questionnaire consisting of five latent variables and 23 observed variables, based on which a pilot study was conducted and the question items were further updated. After conducting a second survey with data from 50 samples, an updated questionnaire consisting of five latent variables and 22 measurement items was established.
The questionnaire has been designed with two parts, i.e., background information and a total of 22 measurement items related to the five latent variables, of which all the quantitative indicators were measured using a five-point Likert scale, with 1 “strongly disagree”, 2 “disagree”, 3 “neutral”, 4 “agree”, and 5 “strongly agree”.

3.2. Research Sites

This study selected three wetland parks in the Pearl River Delta urban agglomeration of China as case studies: Haizhu Wetland Park in Guangzhou, Overseas Chinese Town (OCT) Wetland Park in Shenzhen, and Huayang Lake National Wetland Park in Dongguan. Haizhu Wetland Park is located near Guangzhou’s new central axis, integrating a rich cultural industry and recognized as the largest and most scenic wetland park in Guangzhou [92]. Huayang Lake National Wetland Park successfully integrated sewage treatment from six nearby towns, transforming from an area of environmental pollution into a model for environmental protection [88]. OCT Wetland Park in Shenzhen is adjacent to the city’s early entertainment hub, surrounded by numerous large entertainment venues. The selection of these cities was based on their economic status and historical development, aiming to provide a more diverse perspective and enhance the generalizability of the study’s conclusions.

3.3. Data Collection

The formal survey for this study was conducted from March to April 2023 through a hybrid method combining both online and offline surveys. Specifically, the online questionnaires were primarily distributed via the Wenjuanxing platform [74], while the offline questionnaires were distributed through random sampling, with the online version being delivered to local residents by government personnel, and the offline version was distributed to nearby businesses and practitioners around the wetland park.

3.4. Data Analysis

The data analysis was conducted using SPSS 26.0 and AMOS 24.0 via the following three stages. Firstly, reliability analysis was conducted to ensure the validity and reliability of the data, which checks the consistency of the indicators or measurement items in different contexts and that the collected data accurately reflect the characteristics and relationships of the variables under study. Secondly, confirmatory factor analysis was performed to test the interpretability of the data, which ensures that the measurement items used effectively measure the studied concepts. The third stage involved regression analysis and mediation analysis to test the hypotheses of the study.

4. Results

4.1. Questionnaire Statistics

A total of 400 questionnaires were distributed online and offline, and 345 questionnaires were successfully collected. Questionnaires that were too short in duration or had the same content were excluded, of which 314 were valid. This meets the need of the minimum requirement for sample size in structural equation modeling, which is 10 times the number of observed items (n = 22), making the data suitable for further analysis [63,93].
As shown in Table 1, females account for 58.3% of all the respondents, while males account for 41.7%. The respondents are primarily young and well-educated individuals, with those aged below 30 (64.2%) and those with a bachelor’s degree or above (44.9%). The overwhelming respondents (75.5%) have a lower income level. In terms of occupation, the respondents are enterprise employees (45.5%) and students (19.7%). The majority of respondents have resided or worked in the vicinity of the wetland parks for less than one year (57.6%).

4.2. Reliability Analysis

The obtained questionnaire data were imported into SPSS 26.0 for reliability analysis, calculating the Cronbach’s α coefficient for each variable. As shown in Table 2, the Cronbach’s α coefficients for all five individual variables and the overall scale are greater than 0.8, surpassing the widely accepted threshold of 0.7, which suggests that the data from the questionnaire have good internal consistency.
By conducting a correlation analysis (CITC) on the measurement items, as shown in Table 2, the consistency and validity between internal questions in each item for the five variables are relatively rational, which indicates that the reliability of the questionnaire data is good and can be further analyzed.

4.3. Confirmatory Factor Analysis

The appropriateness of the measurement model was assessed through confirmatory factor analysis to test the convergent validity of the latent variables. As shown in Table 3, the value of χ2/df (1.221) indicates a good fit, as it is less than 3. The RMSEA (0.018) is below the threshold of 0.08, revealing a good fit. Additionally, the CFI, IFI, NFI, and GFI all exceed 0.9, meeting the general standards for model fit. These results suggest a good fit of the model structure. Furthermore, the factor loadings for each dimension are above 0.6 and significant. The composite reliability (CR) is above 0.7, and the average variance extracted (AVE) is above 0.5, meeting the required thresholds. Thus, all five variables have convergent validity, of which fit indices and the results of the model are presented in Table 4.
Discriminant validity analysis assesses whether different variables have good discriminant power. The AVE (average variance extracted) method was used to examine the discriminant validity of each variable in the questionnaire. It is considered adequate if the square root of AVE for each factor is greater than the correlation coefficients between the pairs of variables, which demonstrates that the factors have good discriminant validity [94]. As shown in Table 5, the square root of AVE is greater than the standardized correlation coefficients outside the diagonal, indicating good discriminant validity among the variables.

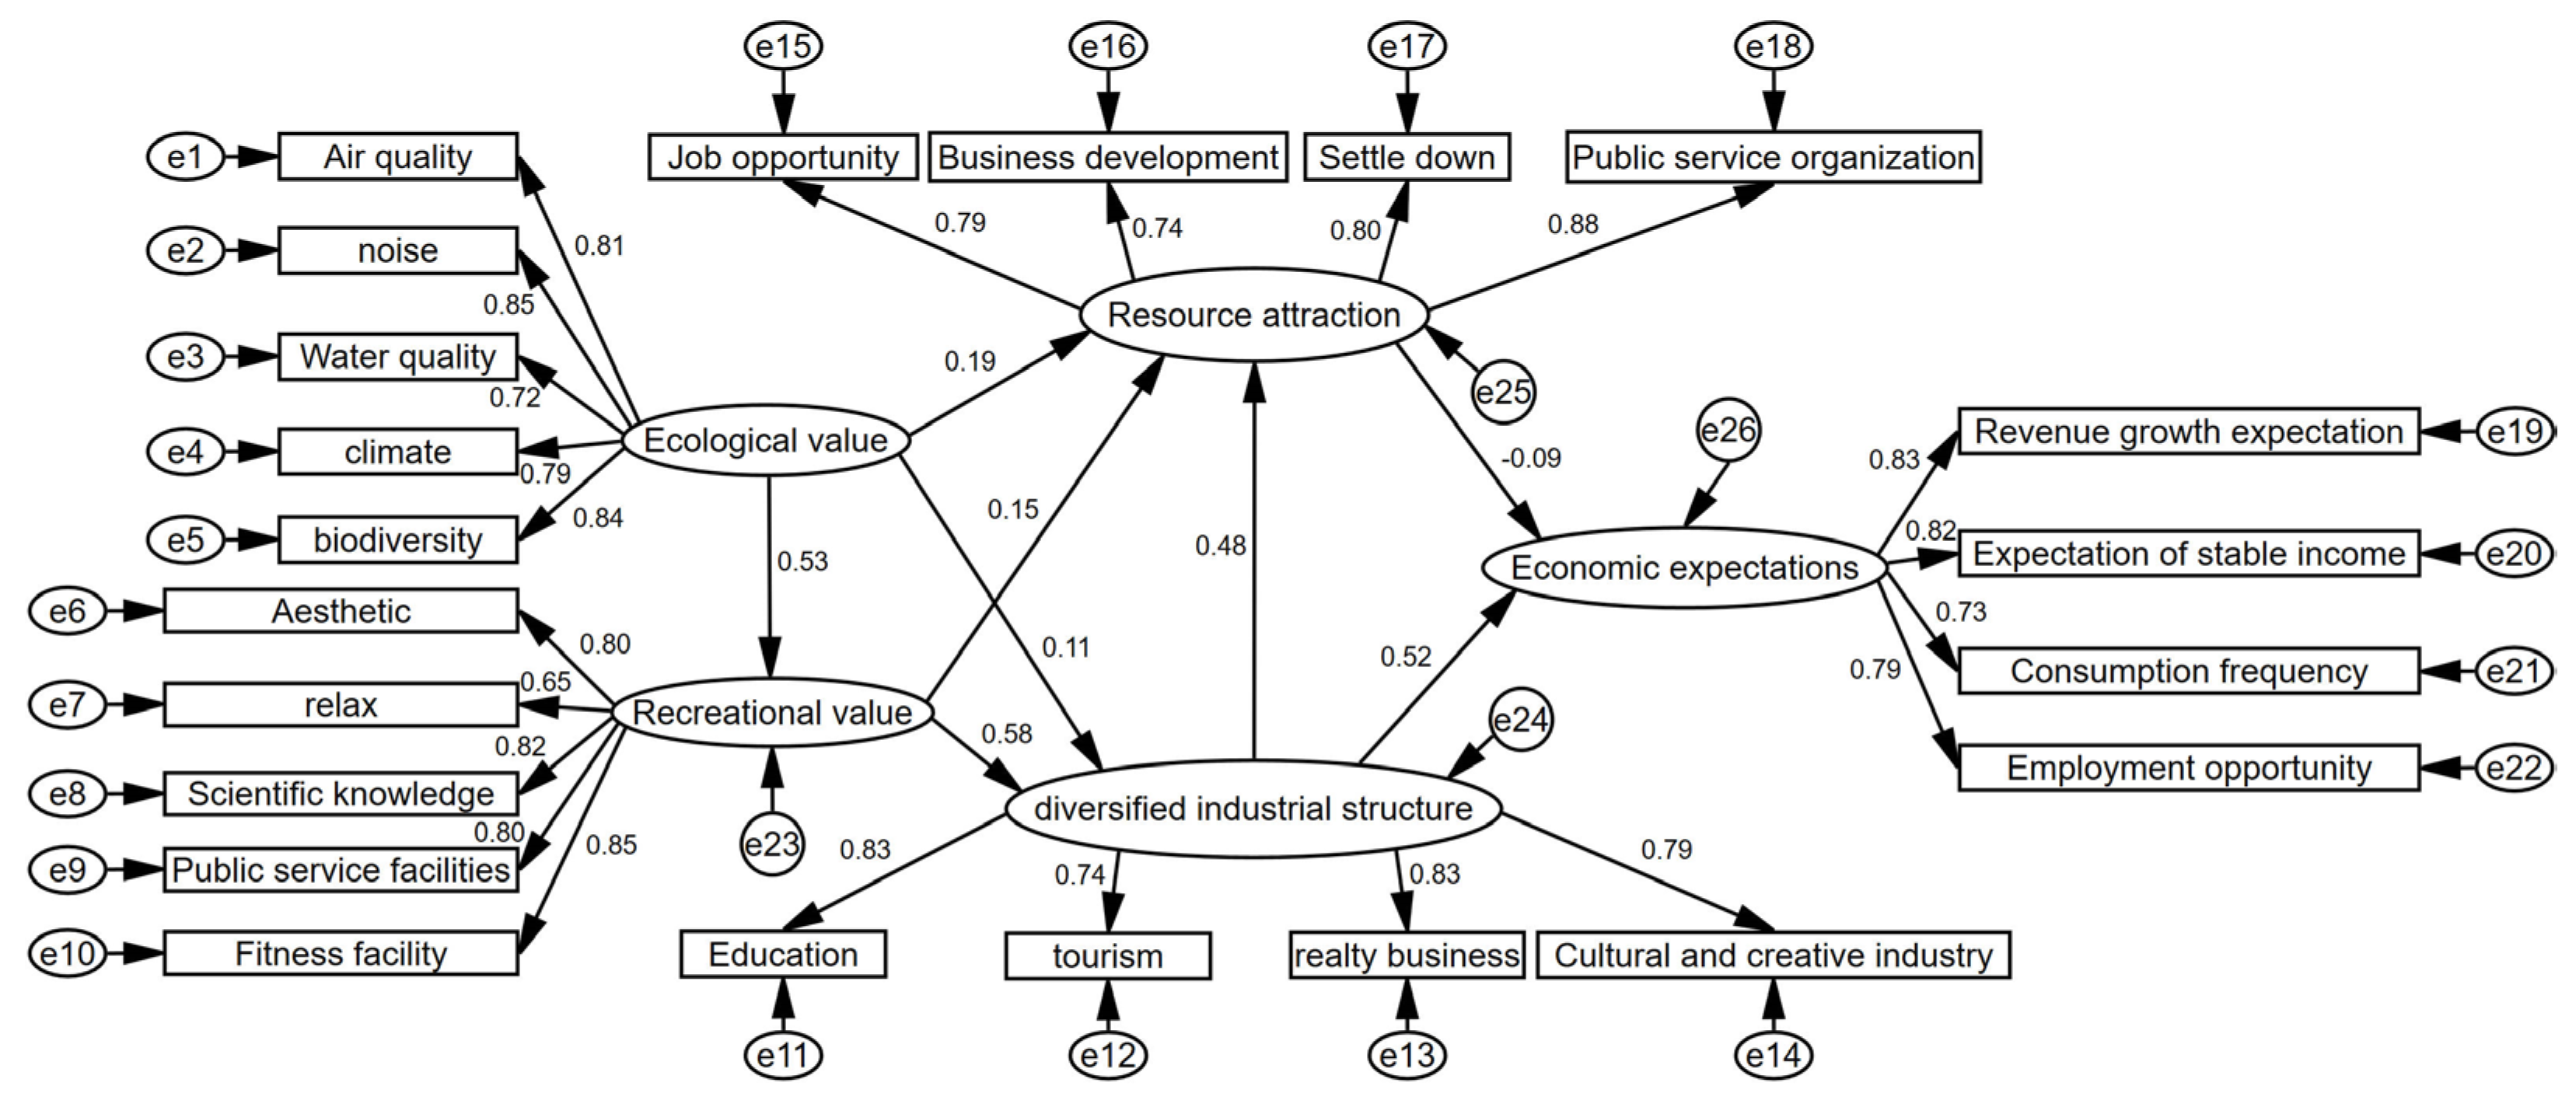
4.4. Evaluating the Structure Model and Regression Analysis

4.4.1. Structure Fit Testing

The overall fit indices of the model have been summarized in Table 6. Due to the sensitivity of the chi-square (χ2) value to sample size, refs. [95,96] recommend using the χ2/df ratio to test model fit. Thus, as shown in Table 6, the measurement model has a χ2/df ratio of 1.223, which is less than 3, indicating a good fit for the measurement model. Additionally, other indices such as GFI = 0.934, RMSEA = 0.017, RMR = 0.04, AGFI = 0.917, NFI = 0.943, and CFI = 0.934 were observed. The fit indices have reached the expected values. These results indicate a good fit between the measurement model and the empircal data, suggesting the feasibility of path analysis.
Moreover, a regression analysis was conducted using AMOS to examine the causal relationships between the variables and their items to further validate the proposed hypotheses. The fitted path diagram has been generated as shown in Figure 2, and the regression results have been presented in Table 7. The impact of resource attraction on economic expectations was not significant (β = −0.107, t = −1.097, p = 0.272), indicating that Hypothesis 1 is not supported. A diversified industrial structure has a significant positive influence on resource attraction (β = 0.407, t = 6.322, p < 0.001) and economic expectations (β = 0.510, t = 5.841, p < 0.001), supporting Hypotheses 2 and 3a. Recreational value has a significant positive impact on both a diversified industrial structure (β = 0.607, t = 8.383, p < 0.001) and resource attraction (β = 0.132, t = 1.959, p = 0.050), supporting Hypotheses 4 and 5a. Ecological value has a significant positive influence on both recreational value (β = 0.552, t = 8.811, p < 0.001) and resource attraction (β = 0.172, t = 3.059, p = 0.002), supporting Hypotheses 6 and 8a. However, the impact of ecological value on a diversified industrial structure is not significant (β = 0.121, t = 1.783, p = 0.075), indicating that Hypothesis 7a is not supported.
Furthermore, in the Structural Equation Model (SEM), variables can have indirect effects on the dependent variables and items through one or more mediator variables. Therefore, it is necessary to verify the mediating effects to uncover the complex relationships among the factors influencing the impact of wetland parks on the sustainable economic development of cities and identify potential pathways of influence. Hence, the bootstrap method was employed with 5000 repeated samples. If the 95% confidence interval does not include zero, it indicates a significant mediating effect. The results are presented in Table 8.
As shown in Table 8, the confidence interval for Path 1 does not include zero, and p < 0.05, indicating the presence of a mediating effect. Therefore, Hypothesis H7b is supported. Similarly, the confidence interval for Path 2 does not include zero, and p < 0.05, indicating the presence of a mediating effect. Thus, Hypothesis H8b is supported. The confidence interval for Path 3 does not include zero, and p < 0.05, suggesting the presence of a mediating effect and supporting Hypothesis H5b. However, for Path 4, the confidence interval includes zero, and p > 0.05, indicating the absence of a mediating effect. Hence, Hypothesis H3b is not supported. As such, the hypothesis testing for the 12 hypotheses influencing the impact of wetland parks on the healthy economic development of cities has been completed.

4.4.2. Regression Analysis

As shown in Table 9, the ecological and recreational values of wetland parks have a significant positive impact on enhancing resource attraction. There is also a significant positive relationship between recreational value and a diversified industrial structure, with a moderate to high strength. Wetland parks with high recreational value effectively promote the diversification of industrial structures, providing momentum for stable urban economic growth. Furthermore, a diversified industrial structure significantly improves economic expectations, as the integrity of the industrial chain and the synergy between industries effectively enhance overall competitiveness [81], thereby providing strong support for economic development. However, the impact of ecological value on a diversified industrial structure and the impact of resource attraction on economic expectations are not significant, indicating that these relationships require further investigation.
Therefore, the model identifies two significant impact pathways: (1) from ecological value, recreational value, and a diversified industrial structure to resource attraction; and (2) from ecological value, recreational value, and a diversified industrial structure to economic expectations. In the process of wetland parks contributing to urban development, ecological value and recreational value play crucial roles, consistent with the initial hypotheses of this paper.
In addition, as shown in Figure 3, the standardized path coefficient of ecological value to recreational value is 0.53, indicating that an increase in ecological value largely represents an increase in recreational value and showing a significant positive correlation. Additionally, among the influencing factors of ecological value, the load of water quality improvement is relatively small, at 0.724. This may be due to severe water pollution from early economic development, where biological water purification methods used by most wetland parks require a long time to take effect, and current water quality still needs improvement.
Further, the standardized path coefficient of recreational value to a diversified industrial structure is 0.58, the highest among all coefficients. Recreational value also mediates the impact of ecological value on both a diversified industrial structure and resource attraction, indicating that recreational value is a critical cornerstone for wetland parks to promote urban economic health. High emphasis on the recreational value of wetland parks and the continuous optimization of the visitor experience not only aids in achieving a diversified industrial structure and resource attraction but also unlocks the potential of ecological value, supporting the healthy development of the urban economy. Therefore, in the planning and management of wetland parks, the comprehensive consideration of recreational value and the promotion of recreational experience optimization are essential.
Hence, the construction and development of wetland parks significantly promote a diversified industrial structure around them, especially in education and real estate services. Bootstrap mediation effect tests show that a diversified industrial structure plays a crucial mediating role in promoting urban economic health through wetland parks. It mediates the impact of recreational value on resource attraction and has significant positive impacts on resource attraction and economic expectations, with standardized coefficients of 0.48 and 0.52, respectively, at a medium-to-high level. This indicates that a diversified industrial structure can fully positively impact resource attraction and economic expectations.

5. Discussion

5.1. Theoretical Implications

This paper provides valuable insights into the role of wetland parks in promoting healthy urban economic development, particularly with regard to the mediating effect of recreational value. Based on the validation of previous theoretical claims about green infrastructure [22,23,74,81], the results of this paper further uncover the direct and indirect effects of ecological value and recreational value on diversified industrial structure and resource attraction. Specifically, the results suggest that recreational value serves as a key driver of diversified industrial structure around wetland parks, demonstrating the importance of maintaining high ecological standards to enhance visitor experiences and thereby promoting tourism development. Moreover, high ecological value that brings high-value-added recreational spaces can also effectively increase the residential premium in surrounding areas [23,24], thus supporting industrial diversification. This aligns with the frameworks of smart growth that emphasize the efficient use of resources and the interconnectedness of multiple industries and resilient cities, focusing on enhancing urban adaptability through ecological resilience [53,54,56,97]. Further, the results of Section 4.4.2 (Figure 3) suggest that the assessment of recreational value in wetland parks is heavily influenced by their ecological value, consistent with previous research findings that biodiversity and landscapes perceived as more “traditional” tend to have higher aesthetic value. For example, studies in Italy have shown that maintaining bird species richness enhances the cultural heritage attributes of landscapes, thereby increasing the recreational value [98].
In addition, this paper extends previous research by emphasizing the broader economic impacts of wetland parks. Compared with past studies that primarily focused on the direct economic benefits of wetland parks themselves, which generally examined the role of green infrastructure in increasing property premiums, green infrastructure’s crop value, or its climate-regulating effects in reducing certain medical costs [1,2,3,19,64], this paper attempts to explore and verify the role of the ecological and recreational value provided by wetland parks in urban economic development. By improving high-quality ecological values, such as air quality, water quality, climate, and biodiversity, the recreational value of wetland parks is enhanced, which, in turn, promotes the development of various industries, such as tourism, real estate, and education. This also attracts high-quality talent, businesses, and government facilities to the area, leading to agglomeration effects and ultimately improving economic expectations.
Surprisingly, the findings of this paper reveal that while diversified industrial structure influences resource attraction, resource attraction does not directly lead to higher economic expectations, which challenges the assumption that green infrastructure automatically enhances economic perceptions, suggesting that the factors influencing economic health are more complex than previously anticipated. One possible explanation is that economic expectations are influenced by broader macro-economic factors, such as overall economic growth trends, employment stability, and government policies, rather than solely by the availability of resources attracted by wetland parks. For instance, if the industries drawn to the area are primarily low-wage sectors such as retail or seasonal industries, e.g., tourism, their contribution to long-term economic security may be limited. Additionally, resource attraction may have a delayed effect on economic perceptions, as the benefits of new businesses or institutions often take time to materialize. Further, the direct effects of industrial diversification on economic expectations may bypass the need for resource attraction as an intermediary, suggesting a more complex relationship between green infrastructure and economic perceptions. This complexity relies on empirical evidence from subsequent studies to validate and refine the findings.

5.2. Practical Implementation

The findings of this paper offer valuable guidance for urban planners and policymakers. This paper highlights two key pathways of influence: (1) from ecological value, recreational value, and diversified industrial structure to resource attraction; and (2) from ecological value, recreational value, and diversified industrial structure to economic expectations. The findings indicate that ecological value plays a fundamental role in shaping the recreational appeal of wetland parks, with maintaining ecological integrity being critical for attracting both visitors and investors [98]. If wetland parks fail to preserve sufficient ecological quality, their recreational appeal will diminish, thereby weakening their ability to drive economic growth. This finding is consistent with previous research [87].
Moreover, the results of this paper reveal that the recreational value of wetland parks has the most direct impact on surrounding industries. High-quality recreational experiences not only attract tourists and residents but also stimulate the development of hospitality, retail, and tourism-related sectors [4,5,6,19,20,61]. Urban planners could prioritize investments in these facilities to ensure that wetland parks contribute maximally to local economic growth.
However, green infrastructure in underdeveloped areas may not always yield the same benefits, as insufficient infrastructure development can limit its value [99]. In wetland parks with high ecological value but low recreational value, the results of this paper suggest prioritizing investments in tourism and public facilities. Conversely, in parks with high recreational value, efforts should focus on improving ecological conditions to sustain long-term economic growth.

6. Conclusions

This study establishes and tests a model to explore how wetland parks promote healthy urban economic development. A total of 12 hypotheses and a theoretical model have been proposed. The findings highlight that recreational value exerts the most significant impact on a diversified industrial structure, which, in turn, positively influences both resource attraction and economic expectations. In addition, this paper reveals that the influence of ecological value on urban economic outcomes is largely mediated by recreational value. Two significant impact pathways have been identified: (1) from ecological value, recreational value, and a diversified industrial structure to resource attraction; and (2) from ecological value, recreational value, and a diversified industrial structure to economic expectations. Moreover, the model analysis suggests that the managers and developers of wetland parks must prioritize the preservation of ecological value and optimize their recreational value before undertaking new development projects. This approach will allow wetland parks to exert a significant positive impact on the surrounding economy. Furthermore, focusing on optimizing recreational value and enhancing visitor experiences can help foster a diversified industrial structure, attract talent and business resources, and unlock the full potential of ecological value, thus providing solid support for healthy urban economic development.
However, this paper has limitations. Due to the limitations of research funding, personnel, time, and other resources, the cases from the Pearl River Delta region have been selected for this first study. The findings may not be representative of the broader understanding of such issues in other regions. Future research is needed to include wetland parks of different regions, types, and scales. In addition, future research could extend the study to include wetland parks of different regions, types, and sizes. In addition, the variables of the conceptual model for the impact of wetland parks on urban economic health are focused on five aspects: ecological value, recreational value, resource attraction, a diversified industrial structure, and economic expectations. Furthermore, the data collection period, spanning from March to April, may lead to some limitations due to seasonal variations in both ecological and recreational experiences. During this time period, wetland parks may not fully reveal their year-round visitor patterns or economic impacts; for example, the economic impact on sectors such as tourism or retail could be under-represented if peak seasons for these industries occur outside the data collection window. Thus, future research could include more related variables on important influencing factors.
The findings may be biased due to the absence of external factors such as policy support and socio-cultural influences, which the model does not fully capture. Future studies could incorporate these variables to enhance the robustness of the results and expand the sample to cities with different levels of policy support and economic development to obtain more accurate conclusions. Further, this paper relies on quantitative data from a questionnaire survey, which may result in sample selection bias. For future research, qualitative methods such as case studies and in-depth interviews could be considered to supplement this with more dimensional validation.

Author Contributions

Conceptualization, S.G. and H.H.; methodology, S.G. and H.H.; software, S.G. and H.H.; validation, S.G., H.H., Z.L. and C.C.; formal analysis, S.G. and H.H.; investigation, S.G. and H.H.; resources, S.G.; data curation, S.G. and H.H.; writing—original draft preparation, H.H. and S.G.; writing—review and editing, S.G., H.H., Z.L. and C.C.; visualization, H.H. and S.G.; supervision, S.G.; project administration, S.G.; funding acquisition, S.G. All authors have read and agreed to the published version of the manuscript.

Funding

This work was supported by the National Natural Science Foundation of China Art Project “Research on green infrastructure design strategy for healthy city construction” (Project No. 20BG117); the Fundamental Research Funds for the Central Universities of China Project “Study on the Impact Pathways of Green Infrastructure in Healthy City Construction (Project No. ZLTS2021045)”; and the Fundamental Research Funds for the Central Universities of China Project “Research on the construction of green infrastructure evaluation index system for healthy city construction” (Project No. ZDPY202403).

Institutional Review Board Statement

Ethical review and approval were waived for this study due to Legal Regulations (https://www.gov.cn/zhengce/zhengceku/2023-02/28/content_5743658.htm?ivk_sa=1023197a; https://www.gov.cn/gongbao/2023/issue_10826/202311/content_6915814.html, accessed on 24 February 2025).

Informed Consent Statement

Informed consent was obtained from all subjects involved in the study.

Data Availability Statement

The original contributions presented in the study are included in the article; further inquiries can be directed to the corresponding author.

Acknowledgments

The authors would like to thank the editor and the anonymous referees for their helpful comments and suggestions.

Conflicts of Interest

The authors declare no conflicts of interest.

References

  1. Deng, K.; Dan, X.-Q.; Wang, L.-F.; Wu, H.-J. Main Functions and Development Needsof Wetland Parks in China. Wetl. Sci. Manag. 2011, 7, 40–44. (In Chinese) [Google Scholar] [CrossRef]
  2. Li, J. Studies on the Ecosystem Services of Xixi Wetland, Hangzhou. Master’s Thesis, Southwest University, Chongqing, China, 2006. Available online: https://kns.cnki.net/kcms2/article/abstract?v=m6wOUVKyYs6hbf23tpiTzQY9i4EDtVCgGOnrQ445S79lEfke5fLPSpY-5XrH29xABGZ9KHE2wDY4iTGXxkGwzauwKzUzVB5cjqttsagpF4yRYZ-_9E8_Si4EpHQU0CqoDEU1O72YZrXi8hvhxf0DOFpZtRKc056W3_kOjcvKkXeNFJcuuJ8D-DRB4M1NAqLK&uniplatform=NZKPT&language=CHS (accessed on 24 February 2025). (In Chinese).
  3. Zhang, F. Master Planning Research of Nation Wetland Park—Take Harbin Baiyupao National Wetland Park as Example. Master’s Thesis, Northeast Agricultural University, Harbin, China, 2012. Available online: https://kns.cnki.net/kcms2/article/abstract?v=m6wOUVKyYs4zfhzA4SXjApLDrOlFwGWeq9cwVVGwhmdXw7KqpohM91pIkQ1lkIEJQ_JbgaibeCNM0JGWjGoIH_dlborFDEapq2rsd0IATKLnYq6wvVF9PrMxBlix6C9IyDbU9ROMhBkv6GoXqFGUGxTjW4dS0w_VK1UzpJEsIurPeNb3ePi1psF8R2YzHYnQREKJQhYKG6g=&uniplatform=NZKPT&language=CHS (accessed on 24 February 2025). (In Chinese).
  4. Qiu, B.-X. The Significance of City Wetland Park to Society, Economy and Ecology. LA Forum 2006, 5, 5–8. Available online: https://kns.cnki.net/kcms2/article/abstract?v=m6wOUVKyYs4yeVBLfZkIujmntRCKSEjYRYSx8LCVx8EH8r89RzFA6Mg8VkoukorEuG7jjaQBzK25g5ouwrEQaCrubkXEaTGFjqN76BLe-nR_P-EryVmYMq3CX1ikm2wZfHuu7SGJEN-CFjaIF4Te3Sn3VNunPPSJi9ghyTDYQp0FJo6MrZ03RJabb1FD5zvj&uniplatform=NZKPT&language=CHS (accessed on 24 February 2025). (In Chinese).
  5. Cui, X.; Qian, Y. A Brief Discussion on the Origin, Characteristics, and Functions of Wetland Parks. Shanghai Constr. Sci. Technol. 2003, 43–44+50. Available online: https://kns.cnki.net/kcms2/article/abstract?v=m6wOUVKyYs7lacFoIm05DsCP61yZeP7huAQy62u6q1Suh3qugudlNQIgMkj4U7Ya5n39Xy7H2U-n-JTG_VM_tdiE9hnn4KMQERcgjtDaSGzNlBe5AsDBwkDmXApendUDZhLDRVq8j5q8FSJj4V-5hBas82InPHgDmwQQWwt3AzzZp40ER3UJVeSA2Sefu763&uniplatform=NZKPT&language=CHS (accessed on 24 February 2025). (In Chinese).
  6. Luo, L.-C. Harvest and Inspiration of Investigation to Wetland Parks in Singapore, Malaysia, Japan and Hongkong. Wetl. Sci. 2004, 2, 238–240. (In Chinese) [Google Scholar] [CrossRef]
  7. Nieuwenhuijsen, M.J. Green Infrastructure and Health. Annu. Rev. Public Health 2021, 42, 317–328. [Google Scholar] [CrossRef]
  8. Dyson, T. The Role of the Demographic Transition in the Process of Urbanization. Popul. Dev. Rev. 2011, 37, 34–54. [Google Scholar] [CrossRef]
  9. Fang, C.; Wang, Z.; Xu, G. Spatial-temporal characteristics of PM2.5 in China: A city-level perspective analysis. J. Geogr. Sci. 2016, 26, 1519–1532. [Google Scholar] [CrossRef]
  10. Wang, S.; Zhou, C.; Wang, Z.; Feng, K.; Hubacek, K. The characteristics and drivers of fine particulate matter (PM2.5) distribution in China. J. Clean. Prod. 2017, 142, 1800–1809. [Google Scholar] [CrossRef]
  11. Banerjee, T.; Srivastava, R.K. Assessment of the ambient air quality at the Integrated Industrial Estate-Pantnagar through the air quality index (AQI) and exceedence factor (EF). Asia Pac. J. Chem. Eng. 2011, 6, 64–70. [Google Scholar] [CrossRef]
  12. Fung, J.C.H.; Lau, A.K.H.; Lam, J.S.L.; Yuan, Z. Observational and modeling analysis of a severe air pollution episode in western Hong Kong. J. Geophys. Res. Atmos. 2005, 110, D09105. [Google Scholar] [CrossRef]
  13. Yeoman, F.; Nally, R.M. The avifaunas of some fragmented, periurban, coastal woodlands in south-eastern Australia. Landsc. Urban Plan. 2005, 72, 297–312. [Google Scholar] [CrossRef]
  14. Dhakal, S. GHG emissions from urbanization and opportunities for urban carbon mitigation. Curr. Opin. Environ. Sustain. 2010, 2, 277–283. [Google Scholar] [CrossRef]
  15. Rosenzweig, C.; Solecki, W.; Hammer, S.A.; Mehrotra, S. Cities lead the way in climate–change action. Nature 2010, 467, 909–911. [Google Scholar] [CrossRef] [PubMed]
  16. Jim, C.Y.; Chen, W.Y. Impacts of urban environmental elements on residential housing prices in Guangzhou (China). Landsc. Urban Plan. 2006, 78, 422–434. [Google Scholar] [CrossRef]
  17. Jim, C.Y.; Chen, W.Y. External effects of neighbourhood parks and landscape elements on high-rise residential value. Land Use Policy 2010, 27, 662–670. [Google Scholar] [CrossRef]
  18. Mahmoudi, P.; Hatton MacDonald, D.; Crossman, N.D.; Summers, D.M.; Van der Hoek, J. Space matters: The importance of amenity in planning metropolitan growth. Aust. J. Agric. Resour. Econ. 2013, 57, 38–59. [Google Scholar] [CrossRef]
  19. Gashu, K.; Gebre-Egziabher, T. Public assessment of green infrastructure benefits and associated influencing factors in two Ethiopian cities: Bahir Dar and Hawassa. BMC Ecol. 2019, 19, 16. [Google Scholar] [CrossRef]
  20. Hsu, K.-W.; Chao, J.-C. Economic Valuation of Green Infrastructure Investments in Urban Renewal: The Case of the Station District in Taichung, Taiwan. Environments 2020, 7, 56. [Google Scholar] [CrossRef]
  21. Ersoy Mirici, M. The Ecosystem Services and Green Infrastructure: A Systematic Review and the Gap of Economic Valuation. Sustainability 2022, 14, 517. [Google Scholar] [CrossRef]
  22. Leonardi, F. The Definition of Health: Towards New Perspectives. Int. J. Health Serv. 2018, 48, 735–748. [Google Scholar] [CrossRef]
  23. Wang, H. Landscape Planning, Design, and Ecological Suitability Assessment for Wetland Parks; Southeast University Press: Nanjing, China, 2018; p. 233. (In Chinese) [Google Scholar]
  24. Wang, Z.; Zhang, S.; Zhang, Y.; Zhang, J. The spillover effect of urban green space on residential land price. J. Arid Land Resour. Environ. 2016, 30, 24–29. (In Chinese) [Google Scholar] [CrossRef]
  25. Bircher, J.; Kuruvilla, S. Defining health by addressing individual, social, and environmental determinants: New opportunities for health care and public health. J. Public Health Policy 2014, 35, 363–386. [Google Scholar] [CrossRef] [PubMed]
  26. van Druten, V.P.; Bartels, E.A.; van de Mheen, D.; de Vries, E.; Kerckhoffs, A.P.M.; Nahar-van Venrooij, L.M.W. Concepts of health in different contexts: A scoping review. BMC Health Serv. Res. 2022, 22, 389. [Google Scholar] [CrossRef] [PubMed]
  27. Ying, J.; Yao, W.; Cheng, Y.; Sun, L. Quantitative Analysis of Coordination Relationship between the Climate and Green Infrastructure in Hangzhou Downtown Based on the Coupling Model. Landsc. Micro-Clim. 2017, 33, 53–57. Available online: https://kns.cnki.net/kcms2/article/abstract?v=m6wOUVKyYs7vEWVXByxlR-BQMATulYSy2GJ25BmfQmVhA7oM_jHPIrVgwzbxT5loLxuD7tQvht3CJ3fz0hj72JFkkHD4aOy8DkTn0kGTT2uUnltZtCqz4-LT7QzhZKIMJWWi1hw5_KINdKGbu2K54wDmu-SeQRLgU9Blz10pbhbMMTBa6VYUPqbrEqul7dv39JzagFyOj5o=&uniplatform=NZKPT&language=CHS (accessed on 24 February 2025). (In Chinese).
  28. Owethu Pantshwa, A.; Buschke, F.T. Ecosystem services and ecological degradation of communal wetlands in a South African biodiversity hotspot. R. Soc. Open Sci. 2019, 6, 181770. [Google Scholar] [CrossRef]
  29. Ma, X. Research on the Planning and Design of Urban Wetland Park Based on the Concept of Sustainable Development—Take Changshu South Lake Wetland Park as an Example. Master’s Thesis, Beijing University of Agriculture, Beijing, China, 2021. Available online: https://link.cnki.net/doi/10.26950/d.cnki.gbjnx.2021.000023 (accessed on 24 February 2025). (In Chinese).
  30. Du, Y.Q.; Zhao, R. Research on the Development of Urban Parks Based on the Perception of Tourists: A Case Study of Taihu Park in Beijing. Int. J. Environ. Res. Public Health 2022, 19, 5287. [Google Scholar] [CrossRef]
  31. Zhao, Y.W.; van den Berg, P.E.W.; Ossokina, I.; Arentze, T.A. How do urban parks, neighborhood open spaces, and private gardens relate to individuals’ subjective well-being: Results of a structural equation model. Sustain. Cities Soc. 2024, 101, 10. [Google Scholar] [CrossRef]
  32. Li, M.; Wang, G.; Zhang, X. Exploration of the Comprehensive Index Method for Evaluating Agricultural Economic Benefits. Shanxi Agric. Econ. 2020, 59+61. Available online: https://link.cnki.net/doi/10.16675/j.cnki.cn14-1065/f.2020.10.031 (accessed on 24 February 2025). (In Chinese).
  33. Xia, L. Study on Healthy City Evaluation Index System. Master’s Thesis, Chongqing University, Chongqing, China, 2019. Available online: https://link.cnki.net/doi/10.27670/d.cnki.gcqdu.2019.001714 (accessed on 24 February 2025). (In Chinese).
  34. Xuan, Z.; Wei, C.; Fu, H. The Modern Concept of Healthy Cities. Shanghai J. Prev. Med. 2002, 197–199. (In Chinese) [Google Scholar] [CrossRef]
  35. Deng, C. Research on the Sustainable Development of Wetland Parks in China. Master’s Thesis, Hunan Agricultural University, Changsha, China, 2020. Available online: https://link.cnki.net/doi/10.27136/d.cnki.ghunu.2020.000547 (accessed on 24 February 2025). (In Chinese).
  36. Xu, Z.; Wang, Y.; Guo, J.; Pan, L. Strategic Thinking on Promoting Urban Planning and Construction of the Resilience Cities in China. Urban Dev. Stud. 2014, 21, 79–84. Available online: https://kns.cnki.net/kcms2/article/abstract?v=m6wOUVKyYs5pkeG_mcj9HCu2uzRu7AH2gd5SqOEYw40t8TOtDD_YSt-24Vx6BLZREzOXKGE1ABMUFhui_11Wwee-a6LHHPa27qkp56hmzFKTg4n_tesUEZ0VzAYWfybVtpBr8dmJKvSaSeusAwG4G0XKTeDpj9HuQ3IaozW53VjfYhWr-5JC7yPy56fr1Lnr&uniplatform=NZKPT&language=CHS (accessed on 24 February 2025). (In Chinese).
  37. Mao, L. Design Research on Waterfront Landscape Based on Resilient City Concept—Taking the Riverside Section of Nanjing Erqiao Park as an Example. Master’s Thesis, East China Normal University, Shanghai, China, 2022. Available online: https://link.cnki.net/doi/10.27149/d.cnki.ghdsu.2022.002584 (accessed on 24 February 2025). (In Chinese).
  38. Li, Y. Research on the Development Strategy of the Gateway Area of Small and Medium Sized Cities Under the Concept of Mart Growth—Taking the Northern Gateway Area of Puyang City as an Example. Master’s Thesis, Beijing University of Civil Engineering and Architecture, Beijing, China, 2022. Available online: https://link.cnki.net/doi/10.26943/d.cnki.gbjzc.2022.000069 (accessed on 24 February 2025). (In Chinese).
  39. Zhu, D.; Liu, D. Managing Urban Growth: Review on the Theory of Smart Growth and Its Reference for City Development in China. Tongji Univ. J. Soc. Sci. Sect. 2006, 22–28. Available online: https://kns.cnki.net/kcms2/article/abstract?v=m6wOUVKyYs4UhgCp2Ezvu31SMZ9JH8ojdWM6c8qv4Fs3X99u97yLzMkXLjMK5Npf0-4X3Alx0GUt4W-npog5WRnpFOICdVsZJV_TjivOf3Jdi_UwH1DONNgCfJ91njG--cz1gyxaAWmEcND_TDlhHv8qhuBt_nHZSNEVi22OiBqZX35edy_wP3WuZ6G4BM6j&uniplatform=NZKPT&language=CHS (accessed on 24 February 2025). (In Chinese).
  40. Tang, X. A Review of “Smart Growth” Research. Urban Probl. 2009, 98–102. Available online: https://kns.cnki.net/kcms2/article/abstract?v=m6wOUVKyYs6z9rbUs2Q8nvHlTyUoNsCb4RDhZ4NGZBLZ_LqoQqCM7yudb1R8SwiaFrxvVFjNJx-cw7HMm-qAm7ZldkCoxTm4OINfgxMFBpG0u_oeSTlHk34xSJcn9Xog60PIj7wI1OC0-9r-wbx_mAD6T6yFVaK-kbpiSsYx0FrCK7mgDajsqW66oBKOa0M2&uniplatform=NZKPT&language=CHS (accessed on 24 February 2025). (In Chinese).
  41. Jansson, Å. Reaching for a sustainable, resilient urban future using the lens of ecosystem services. Ecol. Econ. 2013, 86, 285–291. [Google Scholar] [CrossRef]
  42. Crespi, F. Policy complexity and the green transformation of the economies as an emergent system property. Environ. Econ. Policy Stud. 2016, 18, 143–157. [Google Scholar] [CrossRef]
  43. Wang, Y. China’s Green Transformation: Progress and Prospects. China Policy Rev. 2019, 18–25. Available online: https://kns.cnki.net/kcms2/article/abstract?v=m6wOUVKyYs56pznE5yayMDXYnqFQUcNkb_Whalid3YC075gsXGXSvpwmkRO9ihzsPykQsWoaJe8YPSDOe2nf4KyV2IDmBJfznVdZVmyRXQ8XYYKh7BtQTo4oNk7eqIUZVrrwCjZ0SYLSYt19AyXM7m9lfgxuWB4KXJxPvMYQ_Rnd59JdcAL7dyz5iBpTZXfLW5wAfQL-fPo=&uniplatform=NZKPT&language=CHS (accessed on 24 February 2025). (In Chinese).
  44. Loughran, K. Urban parks and urban problems: An historical perspective on green space development as a cultural fix. Urban Stud. 2020, 57, 2321–2338. [Google Scholar] [CrossRef]
  45. Zhang, D.; Li, Z.G.; Zhong, J.L.; Yang, J. A framework for prioritizing urban ecological infrastructure (UEI) implementation tasks based on residents’ ecological demands and government policies. J. Environ. Manag. 2024, 354, 14. [Google Scholar] [CrossRef] [PubMed]
  46. Kumar, P.; Debele, S.E.; Khalili, S.; Halios, C.H.; Sahani, J.; Aghamohammadi, N.; de Fatima Andrade, M.; Athanassiadou, M.; Bhui, K.; Calvillo, N.; et al. Urban heat mitigation by green and blue infrastructure: Drivers, effectiveness, and future needs. Innovation 2024, 5, 100588. [Google Scholar] [CrossRef]
  47. Green, T.L.; Kronenberg, J.; Andersson, E.; Elmqvist, T.; Gómez-Baggethun, E. Insurance Value of Green Infrastructure in and Around Cities. Ecosystems 2016, 19, 1051–1063. [Google Scholar] [CrossRef]
  48. Schäffler, A.; Swilling, M. Valuing green infrastructure in an urban environment under pressure—The Johannesburg case. Ecol. Econ. 2013, 86, 246–257. [Google Scholar] [CrossRef]
  49. Artmann, M.; Kohler, M.; Meinel, G.; Gan, J.; Ioja, I.C. How smart growth and green infrastructure can mutually support each other—A conceptual framework for compact and green cities. Ecol. Indic. 2019, 96, 10–22. [Google Scholar] [CrossRef]
  50. Wang, A.P.; Lin, W.F.; Liu, B.; Wang, H.; Xu, H. Does Smart City Construction Improve the Green Utilization Efficiency of Urban Land? Land 2021, 10, 657. [Google Scholar] [CrossRef]
  51. Yan, Z.M.; Sun, Z.; Shi, R.; Zhao, M.J. Smart city and green development: Empirical evidence from the perspective of green technological innovation. Technol. Forecast. Soc. Change 2023, 191, 13. [Google Scholar] [CrossRef]
  52. Matamoros, V.; Bayona, J.M. Behavior of emerging pollutants in constructed wetlands. In Emerging Contaminants from Industrial and Municipal Waste: Removal Technologies; Springer: Berlin/Heidelberg, Germany, 2008; pp. 199–217. [Google Scholar]
  53. Mills, E. Synergisms between climate change mitigation and adaptation: An insurance perspective. Mitig. Adapt. Strateg. Glob. Change 2007, 12, 809–842. [Google Scholar] [CrossRef]
  54. Li, Y.; Zhu, X.; Sun, X.; Wang, F. Landscape effects of environmental impact on bay-area wetlands under rapid urban expansion and development policy: A case study of Lianyungang, China. Landsc. Urban Plan. 2010, 94, 218–227. [Google Scholar] [CrossRef]
  55. Ai, H.S.; Zhou, Z.Q. Green growth: The impact of urban forest construction on economic growth in China. Econ. Model. Sustain. Cities Soc. 2023, 125, 17. [Google Scholar] [CrossRef]
  56. Cheng, M. Research on the Evaluation and Optimization of Nanjing Urban Growth from the Perspective of Smart Growth. Doctoral Dissertation, Nanjing Normal University, Nanjing, China, 2012. Available online: https://kns.cnki.net/kcms2/article/abstract?v=m6wOUVKyYs54Dot9WeiiDRzTxZdwR7-SzPBbkHO-XrCfIjIKlRS6o7bPgNHIfl2UmVZI-SQmL9uZQl6J0_dyDDc0OySjh1n2WqSbJruFbUko0wYGfaxO_g5Xjk_wy-P9ZF_ZXq6qoDjp1gwhMCSIcMQDKWmu-QFpbfAMwkFOJqy0WVvNxDop8ShCnd9XyYUDNDbc286SQxU=&uniplatform=NZKPT&language=CHS (accessed on 24 February 2025). (In Chinese).
  57. Atoba, K.O.; Brody, S.D.; Highfield, W.E.; Shepard, C.C.; Verdone, L.N. Strategic property buyouts to enhance flood resilience: A multi-criteria spatial approach for incorporating ecological values into the selection process. Environ. Hazards 2021, 20, 229–247. [Google Scholar] [CrossRef]
  58. Parks, P.J.; Kramer, R.A. A policy simulation of the wetlands reserve program. J. Environ. Econ. Manag. 1995, 28, 223–240. [Google Scholar] [CrossRef]
  59. Liu, Y.; Wang, Z. On the Green Transformation of the ‘Chinese Model’. Soc. Sci. 2016, 56–60. Available online: https://kns.cnki.net/kcms2/article/abstract?v=m6wOUVKyYs5HXcMaAwEitEq78D6OCgCYLFulqEiLZ4vB1IZvEoYNLv-sYUvztRqgZRFeL-nsGgEw28TGSt4XnNBkDDbxBP58VDRdtsN_JbSsXUo2_7Yt2rUUU8WiD0FiEeGLD8cz5CUkovQPwSD2OWe6LjwQwKjHTbDF6uRoA5RH1ajUAWhK0Bq5GGqvCOHkp5qZWjo8Ln4=&uniplatform=NZKPT&language=CHS (accessed on 24 February 2025). (In Chinese).
  60. Yu, X.; Mingju, E.; Sun, M.; Xue, Z.; Lu, X.; Jiang, M.; Zou, Y. Wetland recreational agriculture: Balancing wetland conservation and agro-development. Environ. Sci. Policy 2018, 87, 11–17. [Google Scholar] [CrossRef]
  61. Carlsen, J.; Wood, D.S. Assessment of the Economic Value of Recreation and Tourism in Western Australia’s National Parks, Marine Parks and Forests. Citeseer 2004. Available online: https://www.researchgate.net/publication/228468472_Assessment_of_the_Economic_Value_of_Recreation_and_Tourism_in_Western_Australia’s_National_Parks_Marine_Parks_and_Forests (accessed on 15 March 2024).
  62. López-Mosquera, N.; Sánchez, M. Emotional and satisfaction benefits to visitors as explanatory factors in the monetary valuation of environmental goods. An application to periurban green spaces. Land Use Policy 2011, 28, 151–166. [Google Scholar] [CrossRef]
  63. Tang, S.; Xu, Z.-L.; Feng, N.-H. Behavior intentions of urban forest recreationists based on structural equation model. Ecol. Inform. 2021, 66, 101432. [Google Scholar] [CrossRef]
  64. Zhang, F.; Wang, X.; Liu, X. Research on Functional Value Estimation and Development Mode of Green Infrastructure Based on Multi-Dimensional Evaluation Model: A Case Study of China. Land 2022, 11, 1603. [Google Scholar] [CrossRef]
  65. Li, L.; Yang, A.; Wang, J. Assessment and Optimization of Recreation Value Perception in Forest Parks in the Context of National Parks: A Case Study of Horseshoe Temple Forest Park. For. Resour. Manag. 2022, 164–171. (In Chinese) [Google Scholar] [CrossRef]
  66. Li, X.; Song, W.; Wang, Y. Research on the Ecological Value Evaluation System in China. Fujian Trib. 2019, 25–33. Available online: https://kns.cnki.net/kcms2/article/abstract?v=m6wOUVKyYs5LU4sRkHSt1--xix4z1l-TMRu34J66stCD3i8MMxDfdLYUWfhBLrWnaMlxcyBxTtQiHcpprNXZol45Nq835UMmSPuJDj0W0dQHGtPmUAhlcRFP8Z1RmS3RyIgrBSvL9r7-Gc7jLaXzKXLPPp_K-_KV4Z_swhuQcDYPZCE9VkH99IcC1TCVRrJejVm-q6yv_KQ=&uniplatform=NZKPT&language=CHS (accessed on 24 February 2025). (In Chinese).
  67. Chen, X.; Wang, J. Discussion on Theoretical System of Ecotourism and Its Practice in Forest Parks. World For. Res. 2001, 74–80. (In Chinese) [Google Scholar] [CrossRef]
  68. Guo, Y. Empirical measurement of the impact of industrial diversification on regional economic development. J. Commer. Econ. 2020, 156–158. Available online: https://kns.cnki.net/kcms2/article/abstract?v=m6wOUVKyYs5Sgq9QT8IFnwA6xbiiS79bRAsJ4vs_A677-_v2B9V0sheKg4RsOy-x7xeAO43y_hN9d5wlQbz6YkaevtbnHHIf3f98u-3oFlqxrURIsO3c94NKG6G8Q6ZV-zij7mJMSh9DKXHKOhUZZyUzKjGVuekNaVOeiiMQjbMTVun6ZmJMFdC5yLVC9GvY2_iHVmKQXIU=&uniplatform=NZKPT&language=CHS (accessed on 24 February 2025). (In Chinese).
  69. Xing, R. Perceptions and Reactions of ASEAN Countries to the Indo-Pacific Economic Framework (IPEF)—Explanations Based on Economic Expectations and Threat Perceptions. Southeast Asian Stud. 2023, 1–20. (In Chinese) [Google Scholar] [CrossRef]
  70. Duku, E.; Dzorgbe Mattah, P.A.; Angnuureng, D.B. Assessment of wetland ecosystem services and human wellbeing nexus in sub-Saharan Africa: Empirical evidence from a socio-ecological landscape of Ghana. Environ. Sustain. Indic. 2022, 15, 100186. [Google Scholar] [CrossRef]
  71. Ommer, J.; Bucchignani, E.; Leo, L.S.; Kalas, M.; Vranić, S.; Debele, S.; Kumar, P.; Cloke, H.L.; Di Sabatino, S. Quantifying co-benefits and disbenefits of Nature-based Solutions targeting Disaster Risk Reduction. Int. J. Disaster Risk Reduct. 2022, 75, 102966. [Google Scholar] [CrossRef]
  72. Luo, J.W.; Zhu, K.K. The Influential Factors on the Attraction of Outstanding Scientific and Technological Talents in Developed Cities in China. Sustainability 2023, 15, 6214. [Google Scholar] [CrossRef]
  73. Pearsall, H.; Eller, J.K. Locating the green space paradox: A study of gentrification and public green space accessibility in Philadelphia, Pennsylvania. Landsc. Urban Plan. 2020, 195, 103708. [Google Scholar] [CrossRef]
  74. Cole, H.V.S.; Lamarca, M.G.; Connolly, J.J.T.; Anguelovski, I. Are green cities healthy and equitable? Unpacking the relationship between health, green space and gentrification. J. Epidemiol. Community Health 2017, 71, 1118–1121. [Google Scholar] [CrossRef]
  75. Yang, H.; Chen, T.; Zeng, Z.; Mi, F. Does urban green space justly improve public health and well-being? A case study of Tianjin, a megacity in China. J. Clean. Prod. 2022, 380, 134920. [Google Scholar] [CrossRef]
  76. Brown, L.; Greenbaum, R.T. The role of industrial diversity in economic resilience: An empirical examination across 35 years. Urban Stud. 2017, 54, 1347–1366. [Google Scholar] [CrossRef]
  77. Martin, R.; Sunley, P.; Gardiner, B.; Tyler, P. How Regions React to Recessions: Resilience and the Role of Economic Structure. Reg. Stud. 2016, 50, 561–585. [Google Scholar] [CrossRef]
  78. Tan, J.; Hu, X.; Hassink, R.; Ni, J. Industrial structure or agency: What affects regional economic resilience? Evidence from resource-based cities in China. Cities 2020, 106, 102906. [Google Scholar] [CrossRef]
  79. Yan, W. City Park Green Space Economic Value of Quantitative Measurement Research: Hangzhou Xixi Wetland National Park as an Example. Master’s Thesis, Zhejiang University of Technology, Hangzhou, China, 2016. Available online: https://kns.cnki.net/kcms2/article/abstract?v=m6wOUVKyYs5dXzVDDTXsXdTq-FJlmPeyjqRxQh5-JvhT-pE1dEkZ48ZPmKKeHv939NgH_JiH1J3_cFN0i99T1LhOVuWBbkkUtvRA_S4kZJmlK5wLVpbxd_ZrH328T4e25Ix_H2c-pDMMVLDJ-Q-fLn26neYAlRoHpEaYK6fGSstEV211MaKPNCm_WO4nVAVIII3v4nyqDG4=&uniplatform=NZKPT&language=CHS (accessed on 24 February 2025). (In Chinese).
  80. Lin, J. Study on Post Evaluation of Lake Type National Wetland Park Construction—A Case Study of Taihu National Wetland Park. Master’s Thesis, Suzhou University of Science and Technology, Suzhou, China, 2018. Available online: https://kns.cnki.net/kcms2/article/abstract?v=m6wOUVKyYs6MXzITW5HBKWr9pazb990CxapEHd0bOUA4vQRNuzB49nPP9PmOBeer0XCerNchQAEe1XnIZ72m4WkyaStrJPfP3HA4tiFvvXrR0yfD8TzedXdpBjJzYP-sQBTu_n6rfL2qHOjyChfz3jsZUqFmC9WOn40ztlE4RZ0DpF6WbQ1w_kYnTwDHEYSG-plIu8FEcA0=&uniplatform=NZKPT&language=CHS (accessed on 24 February 2025). (In Chinese).
  81. Yao, S.; Chen, Z.-G.; Wang, B.; Wang, C. A Study on Development Mechanism and Growth Factors of Big Cities along Coastal Area of China. Areal Res. Dev. 2008, 1–6. Available online: https://kns.cnki.net/kcms2/article/abstract?v=m6wOUVKyYs7RPb9bR_YeIrldVWH3g67W5qDX9_prUafOYRIxAnFDUfHkQKua0Suh-3rzdoIwVEIDfLHxa6mdx1ww6m4Z8W5_qLgRn_0yb4mNLO7X9COOWdLACQkKgjWMQcRe0fC-h5eTXrsVSQD7hVUaNfkVdsYe72PcYtz04LwpMAOFp0WOBNmZW5pPLmli&uniplatform=NZKPT&language=CHS (accessed on 24 February 2025). (In Chinese).
  82. Florida, R. The economic geography of talent. Ann. Assoc. Am. Geogr. 2002, 92, 743–755. [Google Scholar] [CrossRef]
  83. Garcia-Vega, M. Does technological diversification promote innovation?: An empirical analysis for European firms. Res. Policy 2006, 35, 230–246. [Google Scholar] [CrossRef]
  84. Li, W.; Wang, Y.Y. Producer services agglomeration and green growth: Evidence from China. Econ. Change Restruct. 2024, 57, 35. [Google Scholar] [CrossRef]
  85. Liston-Heyes, C.; Heyes, A. Recreational benefits from the dartmoor national park. J. Environ. Manag. 1999, 55, 69–80. [Google Scholar] [CrossRef]
  86. Niedomysl, T.; Hansen, H.K. What matters more for the decision to move: Jobs versus amenities. Environ. Plan. A 2010, 42, 1636–1649. [Google Scholar] [CrossRef]
  87. Wang, Y.; Lu, M.; Wu, Y.; Liu, Q. Research hotspots and trend characteristics of recreational service value evaluation at home and abroad: Bibliometric analysis based on knowledge graph. In Proceedings of the Spatial Governance for High Quality Development: Proceedings of the 2021 China Urban Planning Annual Conference (08 Urban Ecological Planning), Chengdu, China, 25–30 September 2021; pp. 313–324. Available online: https://link.cnki.net/doi/10.26914/c.cnkihy.2021.027895 (accessed on 24 February 2025). (In Chinese).
  88. Guan, S.; Zhang, X.; Wu, J. The Methods and Approaches Green Infrastructure that will Promote China’s Urban Transformation: A Case Study of the Dongguan National Wetland Park. In Recent Developments in Chinese Urban Planning: Selected Papers from the 8th International Association for China Planning Conference, Guangzhou, China, 21–22 June 2014; Pan, Q., Cao, J., Eds.; Springer International Publishing: Cham, Switzerland, 2015; pp. 49–68. [Google Scholar]
  89. Powers, S.L.; Pitas, N.A.; Barrett, A.G.; Graefe, A.R.; Mowen, A.J. Local policy-makers’ community priorities and perceived contributions of parks and recreation. J. Park Recreat. Adm. 2021, 39, 37–54. [Google Scholar] [CrossRef]
  90. Chen, Y.; Zhao, Z.; Zhang, C.; Hao, T. Landscape value perception and attitude evaluation of community residents on historical protection area: A case study of Han Chang’an City Historical Site. Geogr. Res. 2015, 34, 1971–1980. Available online: https://link.cnki.net/urlid/11.1848.p.20151017.0950.028 (accessed on 24 February 2025). (In Chinese).
  91. Sun, X. Investigation and Study of Livability in Cangzhou Based on Structural Equation Model. Master’s Thesis, Hebei University of Economics and Business, Shijiazhuang, China, 2020. Available online: https://link.cnki.net/doi/10.27106/d.cnki.ghbju.2020.000624 (accessed on 24 February 2025). (In Chinese).
  92. Yang, F. Haizhu National Wetland Park Aquatic Plant Investigation and Evaluation of the Configuration. Master’s Thesis, Zhongkai University of Agriculture and Engineering, Guangzhou, China, 2016. Available online: https://kns.cnki.net/kcms2/article/abstract?v=m6wOUVKyYs73XqjpBeNNd1Uw5zUQO9olmVq2hEvuqaYmuIGeTh_SwOkBIsF-vqWcUnPGFsUVHCgAC9Ae2ZNn3qDowARECT7hUrsnZQh5WP48V95R0J3xdG3R-M2U3mSxYWpHsAo9v0o5bN1XfD4V8YvihM_CI-SnTy2sP-iU32s80HPIStltzusklIEDMSh_B-YeM0un4Ok=&uniplatform=NZKPT&language=CHS (accessed on 24 February 2025). (In Chinese).
  93. Babbie, E.R. The Practice of Social Research; Wadsworth Publishing Company: Belmont, CA, USA, 1989. [Google Scholar]
  94. Fornell, C.; Larcker, D.F. Structural equation models with unobservable variables and measurement error: Algebra and statistics. J. Mark. Res. 1981, 18, 382–388. [Google Scholar] [CrossRef]
  95. Hair, J.F.; Anderson, R.E.; Tatham, R.L.; Black, W.C. Multivariate data analysis. englewood cliff. N. J. USA 1998, 5, 207–2019. [Google Scholar]
  96. Hair, J.F.; Black, W.C.; Babin, B.J.; Anderson, R.E.; Tatham, R.L. Multivariate Data Analysis, 6th ed.; Pearson Prentice Hall: Upper Saddle River, NJ, USA, 2006. [Google Scholar]
  97. Wang, B.; Zhang, Q.; Cui, F. Scientific research on ecosystem services and human well-being: A bibliometric analysis. Ecol. Indic. 2021, 125, 107449. [Google Scholar] [CrossRef]
  98. Assandri, G.; Bogliani, G.; Pedrini, P.; Brambilla, M. Beautiful agricultural landscapes promote cultural ecosystem services and biodiversity conservation. Agric. Ecosyst. Environ. 2018, 256, 200–210. [Google Scholar] [CrossRef]
  99. Boone, C.G.; Buckley, G.L.; Grove, J.M.; Sister, C. Parks and people: An environmental justice inquiry in Baltimore, Maryland. Ann. Assoc. Am. Geogr. 2009, 99, 767–787. [Google Scholar] [CrossRef]
Figure 1. Conceptual model of factors influencing the healthy development of urban economies through wetland parks.
Sustainability 17 05021 g001
Figure 2. Structural equation model of wetland parks promoting healthy urban economic development.
Sustainability 17 05021 g002
Figure 3. Final model of factors influencing wetland parks promoting healthy urban economic development.
Sustainability 17 05021 g003
Table 1. Sample Characteristics.
Gender (%)Age (%)Educational Background (%)Occupation (%)Hours of Living or Working Around Wetland Park (%)Monthly Income (¥)
Male41.7Under 18 years old2.5College and below55.1Student19.7≤1 year57.6No income38.5
Female58.318~2542Undergraduate 31.2Enterprise personnel45.51–3 years17.2≤10005.7
26~3019.7Master9.9Teachers and professional technicians11.13–5 years2.51001–300013.7
31~4016.9Doctor and above3.8Worker25–8 years15.93001–500013.7
41~501.6 Soldier0.6≥8 years6.75001–80001.3
51~6017.2 Peasant8.2 8001–10,0008.9
Service practitioner6.7 10,001–15,0009.2
Retired personnel5.7 15,001–20,0005.1
Table 2. CITC values and reliability analysis of the questionnaire scale.
ItemCITCα if DeletedCronbach’s α
EV10.7560.8790.901
EV20.7930.871
EV30.6960.892
EV40.7450.882
EV50.7820.874
RV10.7540.8570.887
RV20.6080.890
RV30.7610.855
RV40.7330.862
RV50.7850.850
RA10.7240.8490.878
RA20.6890.863
RA30.7430.841
RA40.7930.821
ID10.7730.8170.872
ID20.6650.861
ID30.7580.825
ID40.7130.842
EE10.7550.8210.870
EE20.7510.823
EE30.6660.857
EE40.7210.835
Table 3. Fitting indicators.
Model Fitting IndexOptimal Standard ValueStatistic
χ2 242.972
df 199
χ2/df<31.221
RMR<0.050.037
GFI>0.80.935
AGFI>0.80.917
NFI>0.90.944
IFI>0.90.989
TLI>0.90.988
CFI>0.90.989
RMSEA<0.080.018
Table 4. Confirmatory factor analysis.
Parameter Significance EstimationFactor LoadSMCCRAVE
VariableIndexUnstd.S.E.T-ValuepStd
Ecological valueEV11 0.8110.6580.9020.648
EV21.0280.0617.239***0.8530.728
EV30.8590.06213.897***0.7240.524
EV40.9240.0615.449***0.7860.618
EV51.0230.0616.965***0.8430.711
Recreational valueRV11 0.8040.6460.8900.619
RV20.830.06911.958***0.6470.419
RV31.0430.06516.093***0.8200.672
RV41.0120.06415.702***0.8040.646
RV51.0680.06416.742***0.8450.714
Resource attractionRA11 0.7860.6180.8790.647
RA20.9870.07213.716***0.7440.554
RA31.0560.0715.009***0.8020.643
RA41.1490.06916.548***0.8780.771
Diversified industrial structureID11 0.8330.6940.8750.637
ID20.8910.06214.347***0.7360.542
ID30.9360.05516.891***0.8320.692
ID40.9320.05915.68***0.7870.619
Economic expectationsEE11 0.8260.6820.8720.630
EE20.9830.06215.74***0.8200.672
EE30.8830.06413.728***0.7310.534
EE40.9530.06315.172***0.7940.630
Note: *** indicates significance at the level of p < 0.001.
Table 5. Discriminant validity table.
VariableEconomic ExpectationsDiversified Industrial StructureResource AttractionRecreational ValueEcological Value
Economic expectations0.794
Diversified industrial structure0.4650.787
Resource attraction0.2480.6520.804
Recreational value0.2110.6490.5540.787
Ecological value0.1470.4270.4680.5340.805
Table 6. Fitting situation table.
Model Fitting IndexOptimal Standard ValueStatistic
χ2 245.767
df 201
χ2/df<31.223
RMR<0.050.040
GFI>0.80.934
AGFI>0.80.917
NFI>0.90.943
IFI>0.90.989
TLI>0.90.987
CFI>0.90.934
RMSEA<0.080.017
Table 7. Non-standardized path analysis.
Dependent VariableIndependent VariableNonnormalized CoefficientStandard Errortp
Recreational ValueEcological value0.5520.0638.811***
Diversified industrial structureEcological value0.1210.0681.7830.075
Diversified industrial structureRecreational Value0.6070.0728.383***
Resource attractionEcological value0.1720.0563.0590.002
Resource attractionRecreational Value0.1320.0671.9590.050
Resource attractionDiversified industrial structure0.4070.0646.322***
Economic expectationDiversified industrial structure0.5100.0875.841***
Economic expectationResource attraction−0.1070.097−1.0970.272
Note: *** indicates significance at the level of p < 0.001.
Table 8. Test results of bootstrap mediation effect.
Standardized PathEffect SizeBias-Corrected 95% CIp
LowerUpper
Path 10.3350.2430.4450.000
Path 20.0540.0020.1030.044
Path 30.2470.1600.3590.000
Path 4−0.043−0.1380.0330.260
Note: Path 1: ecological value → recreational value → diversified industrial structure; Path 2: ecological value → recreational value → resource attraction; Path 3: recreational value → diversified industrial structure → resource attraction; Path 4: diversified industrial structure → resource attraction → economic expectation.
Table 9. Summary of hypothesis test results.
IDHypothesisValidation
H1Resource attraction has a significant positive impact on economic expectations.false
H2Diversified industrial structure has a significant positive impact on resource attraction.true
H3aDiversified industrial structure has a significant positive impact on economic expectations.true
H3bResource attraction acts as a mediator in the relationship between a diversified industrial structure and economic expectations.false
H4Recreational value has a significant positive impact on a diversified industrial structure.true
H5aRecreational value has a significant positive impact on resource attraction.true
H5bA diversified industrial structure acts as a mediator in the relationship between recreational value and resource attraction.true
H6Ecological value has a significant positive impact on recreational value.true
H7aEcological value has a significant positive impact on a diversified industrial structure.false
H7bRecreational value acts as a mediator in the relationship between ecological value and a diversified industrial structure.true
H8aEcological value has a significant positive impact on resource attraction.true
H8bRecreational Value acts as a mediator in the relationship between ecological value and resource attraction.true
Disclaimer/Publisher’s Note: The statements, opinions and data contained in all publications are solely those of the individual author(s) and contributor(s) and not of MDPI and/or the editor(s). MDPI and/or the editor(s) disclaim responsibility for any injury to people or property resulting from any ideas, methods, instructions or products referred to in the content.

