Article

Start-Up Strategies for Thermophilic Semi-Continuous Anaerobic Digesters: Assessing the Impact of Inoculum Source and Feed Variability on Efficient Waste-to-Energy Conversion

by
Amal Hmaissia
1,
Edgar Martín Hernández
1,
Steve Boivin
2 and
Céline Vaneeckhaute
1,*
1
BioEngine Research Team on Green Process Engineering and Biorefineries, Chemical Engineering Department, Université Laval, Pavillon Adrien-Pouliot 1065, av. de la Médecine, Québec, QC G1V 0A6, Canada
2
Centre de Biométhanisation de L’agglomération de Québec, Ville de Québec, 100 Chemin de la Baie de Beauport, Québec, QC G1N 4C3, Canada
*
Author to whom correspondence should be addressed.
Sustainability 2025, 17(11), 5020; https://doi.org/10.3390/su17115020
Submission received: 17 January 2025 / Revised: 23 May 2025 / Accepted: 25 May 2025 / Published: 30 May 2025
(This article belongs to the Special Issue Recycling Materials for the Circular Economy—2nd Edition)

Abstract

Anaerobic digestion (AD) has gained broad interest as a sustainable organic waste management and resource recovery method. However, the complexity of the AD process could pose serious risks in real-scale applications. One of the most critical phases in the operation of AD systems is the start-up phase, including the seeding strategy of the digesters. This study aims to assess the effect of digestate post-treatment before seeding on the start-up of thermophilic AD systems. Two anaerobic digesters (R1 and R2) were started using two different thermophilic inocula and were kept operational for 17 weeks under identical conditions. Lab digesters were seeded with digestates sampled from a thermophilic full-scale reactor (R2) and a post-treatment mesophilic tank (R1). The start-up strategies exhibited satisfactory stability and high productivity, achieving mean weekly methane-based biodegradability rates of 61 and 64% of the feed’s theoretical biomethane potential (BMP), respectively, in R1 and R2. However, R2 showed greater resilience to high and sudden organic loads applications, making it more suitable for rapid and aggressive start-ups. These results are expected to assist full-scale anaerobic digester operators in selecting an appropriate inoculum based on the characteristics of its source.

1. Introduction

In recent years, anaerobic digestion (AD) has gained global interest as a sustainable technique for organic waste treatment, energy production, and resource recovery [1]. In addition to the stabilization of organic matter, this biochemical process yields biogas consisting mainly of methane and CO2, along with a nutrient-rich fertilizer [2]. During the implementation of AD in real-scale plants, special attention should be given to its key operational stages, primarily the start-up phase, to avoid operational delays and additional costs [3]. A wrongly planned start-up phase could lead to prolonged periods of suboptimal anaerobic digester performance, characterized by instability and operational inefficiencies [1,3]. During this phase, biogas production is low in both quantity and quality (low methane percentage), resulting in no income. The primary risks during the start-up phase stem from improper microorganisms’ seeding strategy or inoculation, which can inhibit microbial growth [4]. This leads to extended periods of system disruption before the digester reaches steady-state operation and full process capacity [5]. Therefore, an adequate start-up strategy results in a rapid build-up of active microbial biomass acclimated to the desired processing conditions [6]. The initial presence and abundance of methane-producing microorganisms in a reactor are primarily controlled by the inoculum as well as the operating parameters during the start-up phase [7]. Thus, a significant amount of research was conducted to assess the possibility of using different materials to start up anaerobic reactors. Leachate, sludge, animal slurry, and aerobic compost were identified as potential seeding starters to AD systems [8]. Indeed, they have the potential to provide active communities for biogas production due to their composition of methane-producing microorganisms along with syntrophic communities such as propionate-oxidizing and sulfate-reducing bacteria [9]. Among these identified seeding starters, digested effluent or digestate from stable and fully operational anaerobic reactors is currently the most commonly used inoculum for start-up new AD systems due to its richness in anaerobic digestion microorganisms [10]. Given sufficient evidence that the origin of the inoculum impacts the production of intermediate products [11], there has been growing interest in the literature in assessing the performance of these materials in initiating the digestion process during the start-up phase. Particularly, significant efforts have been conducted to relate the performance of the start-up phase to the microbial composition of the inoculum [12]. Although some studies examine the bacterial and archaeal communities initially present in the inoculum using molecular and biochemical techniques, such as the 16S rRNA genes sequencing technique [13], the use of these methods is currently limited to research purposes and cannot be systematically implemented for industrial and real-scale contexts. Instead, simpler indicators reflecting the inoculum performance related to its origin and physicochemical characteristics were used to assess the effectiveness of digested material under various start-up scenarios. For instance, inocula from high-ammonia AD processes were found to reduce start-up efficiency during the early hydraulic retention times (HRTs) of the start-up phase [13]. Indeed, Hmaissia and Vaneeckhaute [14] found a significant negative correlation between ammonia and volatile fatty acid (VFA) concentrations in the inoculum and bacterial diversity. This reduction in diversity led to lower methane production kinetics, possibly due to the limited functional redundancy of the VFA- and ammonia-rich inoculum. It has been reported that under stress conditions, AD subprocesses are sustained by microbial communities that can perform the same functions as those that perished [15]. Similarly, digested inoculum (digestate) outperformed undigested inoculum (raw sewage sludge), resulting in better economic performance due to its more diverse microbial communities [16]. The authors attributed the lower performance of the undigested inoculum to the presence of undigested organic matter, which inhibited the process. Therefore, parameters reflecting the composition of the inoculum could serve as indicators of its performance and suitability for start-up conditions. In the case of digestate, its properties and composition are primarily influenced by the operational conditions of the reactor from which it was sampled. For instance, the microbial communities in the digestate are shaped by the substrate processed in its source. Therefore, using an inoculum derived from an AD system that processes the same or a similar feedstock as the new digester is a crucial factor in the rapid establishment of a steady state in the anaerobic digester. This was demonstrated with digested manure, which proved to be a high-performance inoculum compared to an inoculum sampled from a wastewater treatment plant for treating corn straw. The superior performance was attributed to the inoculum’s enzymatic activity and nutrient content, which was suited to the processed feedstock [17].
Moreover, the temperature of the inoculum’s origin is a critical factor influencing start-up success, as microorganisms must be acclimated to the temperature of the new digester [14,15,18,19]. Additionally, inocula sourced from large-scale systems achieved faster and more efficient start-up performances compared to those obtained from lab-scale systems [20].
These studies emphasized the importance of assessing both the characteristics of the inoculum and the key operational parameters of its origin (i.e., the anaerobic system from which it was sampled) to evaluate its suitability and performance during the start-up phase. However, additional indicators are needed to establish reliable decision-making guidelines that reflect inoculum quality. This would enable operators to make informed choices without relying on complex and costly microbiological analyses. For instance, inoculum storage can alter its properties, leading to an increase in VFA concentrations and a decrease in microbial activity [21,22]. In real- and industrial-scale applications, supplementing digestate from a stable digester can be challenging. The availability of freshly generated digestate from a fully operational large-scale digester within a short timeframe may be limited, especially when significant volumes of inoculum are required. As a more practical alternative, operators often rely on stored digestate or extract digestate from cooling tanks—a post-treatment step in thermophilic facilities—to initiate new anaerobic systems. Several batch studies have investigated the storage of inoculum under various temperatures and durations [23,24,25]. However, these studies focused primarily on the specific methane production of the inoculum without examining its impact on process parameters in semi-continuous conditions.
To the best of the authors’ knowledge, only Wu et al. [26] explored the effect of inoculum preservation in semi-continuous experiments. However, this study only compared two preservation temperatures and did not investigate the differences in the impacts of preserved and fresh inocula during the start-up phase. As a result, the inoculum indicator describing whether the inoculum is stored (post-treated or stored inoculum vs. freshly sampled inoculum) has not been systematically evaluated for its impact on inoculum performance. Hence, this study aims to assess the impact of inoculum post-treatment on the start-up phase by comparing the performance of two AD systems using thermophilic digestate samples as inoculum—one before mesophilic post-treatment (R2) and the other after post-treatment (R1) in their original full-scale facility. Additionally, in biogas plants, variable influent loads, depending on feedstock availability, make it challenging to control the OLR, with only the HRT being adjustable. Understanding the impact of these conditions on process parameters is crucial for engineering purposes. Therefore, this study replicated such conditions through three extreme feeding events driven by influent variability (fluctuating VS, resulting in uncontrolled OLR). The feeding events were used to evaluate the responses of R1 and R2, with a particular focus on the impact of the inoculum used. These events included (1) an abrupt increase in the organic loading rate (OLR), (2) a sharp but brief fluctuation in the OLR, and (3) a reduction in OLR following relative process stabilization. The findings of this study are valuable for refining the design and optimization of AD start-up protocols by providing key indicators for inoculum selection. These guidelines aim to mitigate the risk of suboptimal AD performance, prevent operational delays and financial losses, and enhance overall system efficiency.

2. Materials and Methods
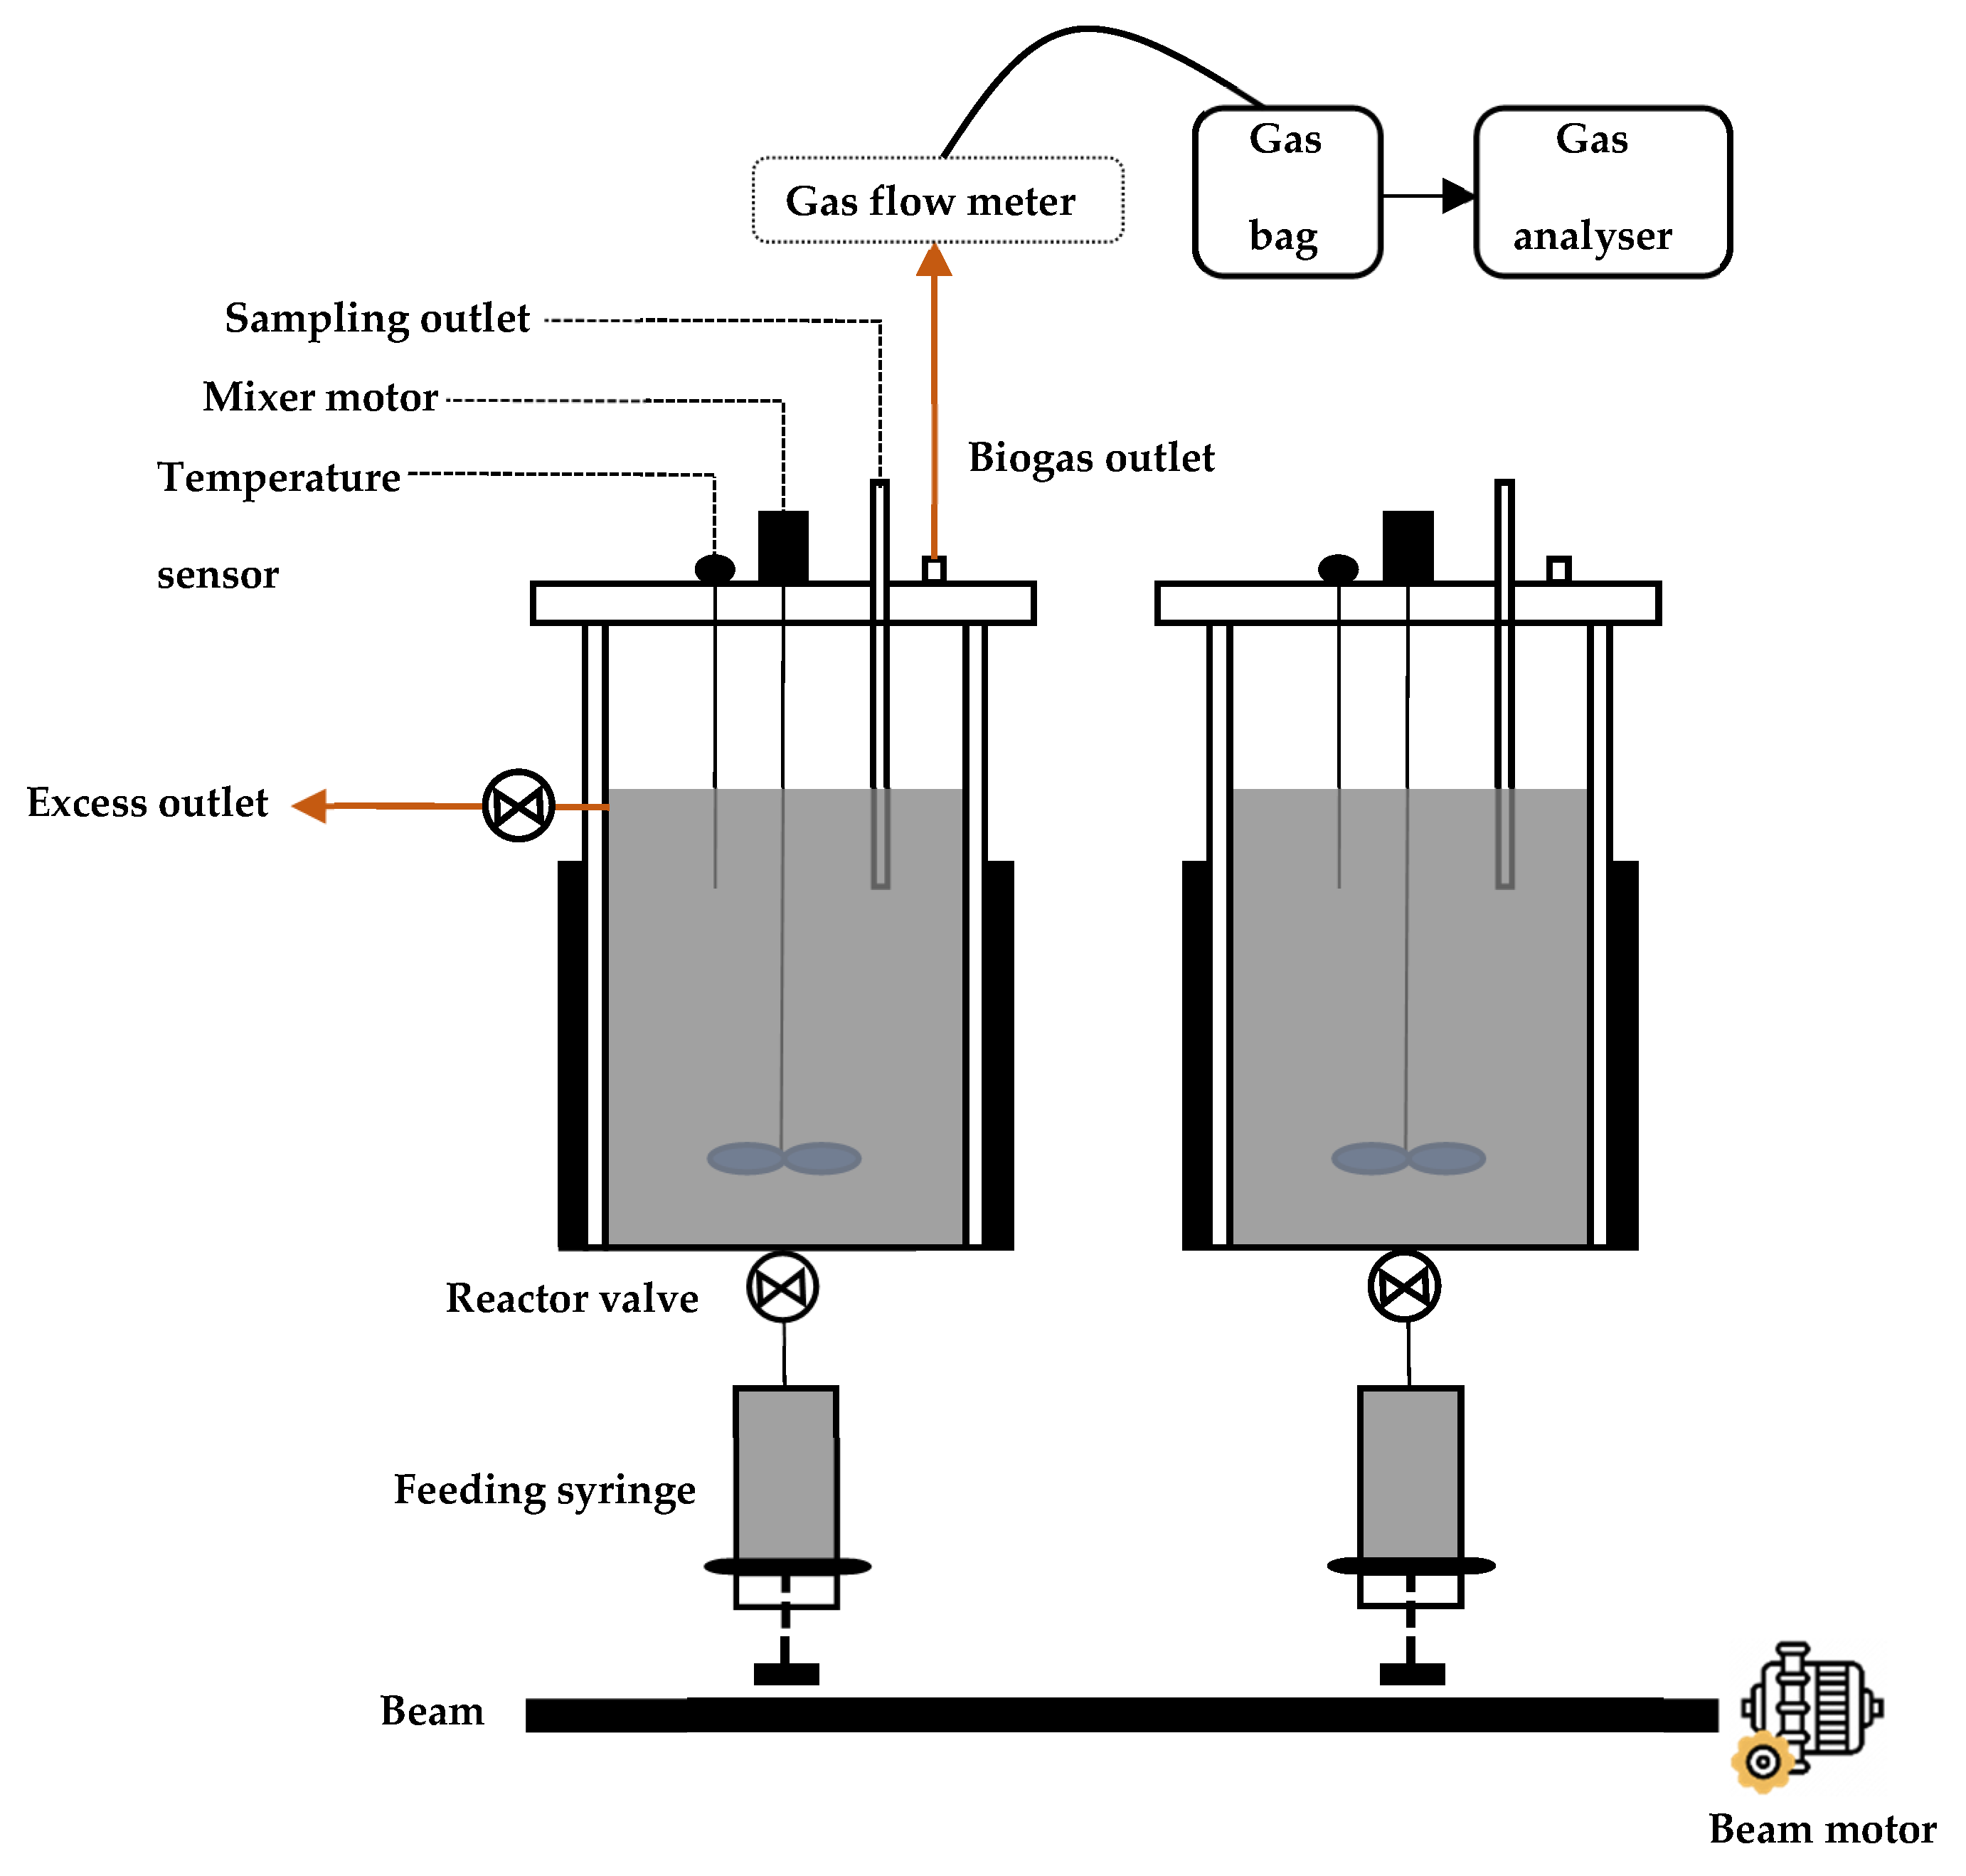
2.1. AD System

The AD system used in this study is an auto-fed semi-continuous system composed of two stainless steel reactors (Anaero Technology, Cambridge, UK) (Figure 1). Each reactor has an operational volume of 5 L and is equipped with a feeder composed of two syringes operated by a motor-driven beam. The feedstock is supplied to the reactors from the bottom through a feeder port, facilitated by the vertical motion of the feeding syringe’s piston. This design prevents air from entering the reactors, thereby mimicking the feeding conditions of full-scale anaerobic digesters. The syringes replicate the function of feed tanks in real-scale systems and enable the semi-automatic delivery of heterogeneous feedstock without the clogging issues often encountered with laboratory-scale feeding pumps. Moreover, because both syringes are actuated by the same lifting beam, the system ensures identical feeding conditions in both reactors, allowing for a fair comparison of the performance of the two inocula. Effluent is automatically directed into 1 L digestate tanks connected to the reactor discharge outlets. Maintaining a temperature of 55 °C is achieved by using electric heating jackets enveloping the external walls of each reactor. Agitator speed and reactor temperature are automatically regulated and monitored by a programmable logic controller (PLC) unit (Anaero Technology, Cambridge, UK). Cumulative and instantaneous biogas production is continuously and punctually measured and converted to standard conditions (273 °K, 1013.35 mbar) by a gas flow meter using the liquid displacement method involving diluted HCl (pH = 2). The collected data are then stored as CSV files by the PLC controller. The produced biogas is collected within 25 L gas sampling bags (VWR, Radnor, PA, USA) before undergoing analysis using a gas analyzer equipped with electrochemical sensors for CH4, CO2, O2, and H2S (ppm) (SWERIN, Gütersloh, Germany).

2.2. Feedstock and Inocula

The inocula used in this study were digestates sampled from a full-scale biogas plant in Québec, Canada. The facility operates a three-stage AD process, which includes one thermophilic acidogenic reactor (45–55 °C, depending on the influent flow rate), two thermophilic methanogenic reactors (54 ± 1 °C), and a mesophilic post-treatment reactor (37 °C). These reactors process organic fractions of municipal solid waste (OFMSW), both packaged and unpackaged organic waste from industrial, commercial, and institutional sectors, as well as effluents from the agri-food industry. The effluent from the acidogenic reactor is equally distributed between the two methanogenic reactors, all three of which are continuously mixed.
R2 was seeded with digestate from one of the thermophilic methanogenic reactors (54 ± 1 °C, HRT of 18–19 days), while R1 was seeded with digestate from the mesophilic post-treatment reactor (37 °C, HRT of 8–9 days). The role of this post-treatment reactor is to cool and stabilize the thermophilic digestate for the dehydration process, meaning the post-treated digestate is not a typical mesophilic inoculum.
The feedstock used in this study was raw sewage sludge (SS), a blend of 60% primary sludge and 40% secondary sludge sourced from a wastewater treatment plant (WWTP) in Québec, Canada. The SS was received in 20 L batches, stored in tightly sealed buckets, and maintained at 4 °C for one to two weeks. On feeding days, the required volume was withdrawn to maintain the target HRT and then divided to ensure an equal feedstock supply to both R1 and R2.

2.3. Operation and Monitoring

A long-term start-up experiment was conducted over 17 weeks, targeting a full-load HRT of 12 days. The experiment was carried out in two semi-continuous reactors (Figure 1). Initially, each reactor was filled with 5 L of non-diluted digestate, and the temperature was immediately set to 55 °C to rapidly achieve thermophilic conditions. After 24 h, a small feeding of SS (50 mL·d−1) was introduced. One week later, the feeding rate was doubled to 100 mL·d−1 and maintained for 10 days to facilitate a gradual initiation of methanogenic activity. Subsequently, the feeding rate was progressively increased, ensuring that each HRT was maintained for at least one week (except for week 7). By the 7th week, the target HRT of 12 days was reached. Feeding occurred once per day during the designated feeding periods. In response to system disturbances, such as pH fluctuations or a decline in methane content, feeding was temporarily suspended in both reactors. It was resumed once the AD systems showed signs of recovery, indicated by pH stabilization or an increase in methane content.
The stability of reactors was monitored using weekly averages of gas production rate (GPR), free organic acids/total inorganic carbon ratio (FOS/TAC), pH, and ammonia. Biogas production directly reflects the metabolic activity of the microbial consortia within the inocula, enabling comparison between them [27]. pH serves as a fundamental indicator of process stability, as it reflects the system’s ability to buffer acid accumulation, particularly during fluctuations in feeding rate [27]. FOS/TAC was utilized because the inhibitory impact of VFAs on the AD process is typically assessed through the acid-to-alkalinity ratio, expressed as the acetic acid content relative to calcium carbonate [28]. This ratio serves as an early indicator of an imbalance between acid production and consumption rates in an anaerobic digester, allowing for the detection of potential process instability before a pH drop occurs [29]. Thus, GPR, pH, and FOS/TAC enabled the implementation of an adaptive feeding strategy based on the inocula’s progression in adapting to the operational conditions—an approach commonly used in full-scale plants during the start-up phase [30]. The performance of reactors was assessed based on methane-based biodegradability (BdCH4) of SS and volatile solids (VS) removal. Methane production was used as a key indicator of how rapidly and efficiently each inoculum converts organic matter into methane, particularly under stress conditions such as feedstock variations [31]. VS removal efficiency provides insight into the inoculum’s hydrolytic and fermentative capacities, reflecting its overall effectiveness in degrading organic matter [32]. The responses of the AD systems to differences in inoculum were analyzed across three distinct feeding scenarios, aiming to evaluate each inoculum’s adaptability to feedstock variability: an abrupt increase in OLR (event 1, denoted as E1), a rapid and brief change in OLR (event 2, denoted as E2), and the decrease in OLR following process stabilization (event 3, denoted as E3). These events are summarized in Table 1, with additional specifications provided for further clarity.
Once full HRT load (target HRT) was reached (week 7), biogas production, pH, and chemical oxygen demand (CODt) of the effluent were compared to their respective weekly mean values. Steady-state conditions were considered established when daily measurements fluctuated by less than 15% from their weekly averages, as defined by Podeh [33], Azbar et al. [34], and Alvarez et al. [35]. At the end of the experiment, the physicochemical properties of the effluent were analyzed and compared to the influent characteristics to validate the mass balance for mineral content, total nitrogen, and organic matter.

2.4. Physicochemical Analysis and Calculations

pH measurements were conducted using a pH meter (Accumet AB200, Fisher Scientific, Waltham, MA, USA), while FOS/TAC was determined by titrating with 0.1 N sulfuric acid using a potentiometric titrator (AT1000, Hach Company, London, ON, Canada). Ammonia, total nitrogen, and CODt were measured via spectrophotometry (absorbance measurement) using a Hach DR3900 spectrophotometer and Hach high-range test kits for ammonia, total alkalinity, volatile acids, COD, total nitrogen (TN) and total Kjeldahl nitrogen (TKN) (Hach Company, London, ON, Canada). The total solids (TS) and VS of the effluent, as well as the elemental analysis of feedstock, including C, H, N, O, and S, were determined following standard protocols [36]. Physicochemical analyses were performed on digesters’ liquor samples one hour before feeding. VS and COD removal ratios were calculated based on the mass balance principle, as shown in Equation (1):
VS removal = V S f e e d V S l i q V S f e e d
where V S f e e d is the sludge VS and V S l i q is the VS of the digester liquor expressed as percentages. GPR was determined from the daily biogas production.
Theoretical biomethane potential in NmLCH4·(gVS)−1 of each SS load or B0-Theo was calculated from the empirical formula of SS, assumed to be CaHbOcNdSe using Boyle’s equation [37]:
B 0 - T h e o   = a 2 + b 8 c 4 3 d 8 e 4 × 22 , 400 12 a + b + 16 c + 14 d + 32 e
BdCH4 denotes the percentage of B0-Theo achieved by the experimental methane production [38]:
B d C H 4 = S M R × 100 B 0 - T h e o
where SMR is the weekly specific methane rate in NmL CH4·(gVS)−1.

2.5. Statistical Analysis

Statistical analysis was conducted using R language version 4.2.1. An independent t-test was applied with the ‘tidyverse’ package [39] to compare the weekly means of GPR, BdCH4, and FOS/TAC between the two reactors, with a significance level set at 0.05. Additionally, Pearson correlation analysis was performed using the ‘metan’ package [40] to assess the impact of influent variability on GPR, FOS/TAC, and BdCH4 in R1 and R2. A correlation matrix, along with the corresponding significance levels, was then generated.

3. Results and Discussion

3.1. Inocula and Substrate Characteristics

Table 2 presents the characteristics of the SS loads used as feedstock and both inocula. The post-treated inoculum exhibits greater stability in terms of TS, VS, and COD content compared to the fresh thermophilic inoculum, with respective values of 1.6%, 0.8%, and 13.3 g·L−1 compared to 2.2%, 1.3%, and 14.9 g·L−1 for the fresh inoculum. In contrast, the fresh inoculum has lower total ammonia and volatile fatty acid (VFA) concentrations, as outlined in Table 2 (1898 mg·L−1 and 1.65 g·L−1 compared to 2140 mg·L−1 and 1.94 g·L−1 for ammonia and VFA, respectively). The lower organic content in the post-treated inoculum suggests that fermentation processes were still ongoing in the post-treatment tank. Similarly, the higher concentration of total ammonia in the post-treated inoculum suggests the continuing degradation of residual organic nitrogen that was not fully decomposed in the methanogenic thermophilic reactor [41]. This could be attributed to the high nitrogen content of the feedstock used in the full-scale biogas plant, which includes agro-industrial waste (Section 2.2), as well as the mesophilic temperature of the post-treatment tank with an 8–9-day HRT. The conditions in this tank still allow anaerobic digestion reactions to occur, facilitating the conversion of organic carbon into methane and CO2 and organic nitrogen into ammonia and ammonium. Furthermore, the elevated ammonia content in the post-treated inoculum may explain its higher alkalinity, as ammonium ions contribute to total alkalinity [42,43].
Since this study involved seven loads of SS sampled at different times, their variations are presented in terms of minimum, maximum, and mean values, as illustrated in Table 2. The VFA concentration of SS and its organic content, represented by the VS/TS ratio, are graphically depicted in Figure 2. The VS/TS ratio varied between 74.1% and 84.76%, indicating a high degradable fraction in the SS sample [44]. Figure 2 shows that some SS loads exhibited notably high total VFA concentrations, surpassing 10 g acetic acid equivalent (aace)·L−1. This can be attributed to the initial fermentation of simpler components within the thickeners of the WWTP upstream. The C/N ratios of SS loads ranged from 9.07 to 13.32, which is lower than the optimal range of 15–30:1 for AD [45]. This suggests a high nitrogen content in the feedstock, potentially posing a risk of ammonia inhibition [27]. The TS content of the SS loads, as outlined in Table 2, ranged from 5.05% to 7.18%, which is relatively high compared to the values typically reported for wet AD (2–5.5%) [46]. This can be attributed to the thickening of the SS samples and the high proportion of primary sludge in the feed (60%), which generally has a higher solids content than secondary sludge [47].

3.2. Effect of the Start-Up Strategy on the Stability of Anaerobic Digesters

3.2.1. Comparison Between R1 and R2 in Terms of Gas Production Rate

GPR was studied in both reactors to reflect the activity of AD microorganisms in response to the applied start-up strategies involving strategies of seeding, feeding, and temperature increase. Figure 3a illustrates the variations in the weekly means of GPR in R1 and R2.
Throughout the experiment, both reactors generally exhibited similar GPR trends except during weeks 3, 5, 7, and 8, as shown in Figure 3a. At the start of the experiment, R1 and R2 experienced lag phases of three and two weeks, respectively, due to the direct temperature shift from room temperature to 55 °C, with R1 requiring an additional week for adaptation. These results align with findings from batch digesters processing chicken manure and swine wastewater at 55 °C (25 days) and 35 °C (20 days), respectively [48]. However, a shorter lag phase was reported by Angelidaki et al. [49] in a batch biodegradation test of source-sorted organic fraction of household municipal solid waste at 55 °C, which lasted only seven days.
A statistically significant difference between the weekly mean GPR of R1 and R2 was observed in week 3 (0.06 ± 0.06 and 0.34 ± 0.18 Lbiogas·d−1·Lreactor−1 respectively), with a corresponding p-value of 0.006. In week 4, the GPR values in both reactors were modestly influenced by the first increase in the feed from 0.97 to 2.43 g VS·d−1·Lreactor−1 during E1, as this event was preceded by a four-day feeding suspension.
While GPR remained stable in R1 between weeks 4 and 5, it declined by 40% in R2(with respective p-values of 0.1 for week 4 and 0.8 for week 5). This period coincided with a feeding suspension in both reactors due to VFA accumulation in R1, as indicated by the FOS/TAC ratio exceeding 1 (Figure 3b). Additionally, R2 exhibited a relatively lower GPR compared to R1 in weeks 9 (1.53 ± 1.07 and 1.42 ± 1.03 Lbiogas·d−1.Lreactor−1 in R1 and R2 respectively, p-value of 0.3) and 15 (2.12 ± 0.09 and 2.05 ± 0.08 Lbiogas·d−1.Lreactor−1 in R1 and R2 respectively, p-value of 0.9) This behavior could also be attributed to feed suspension caused by low methane production in R1, suggesting higher anaerobic microbial activity in R2 compared to R1.
The abrupt change in the organic load during E2 led to a 20% reduction in GPR for R1, whereas GPR continued to rise in R2 (with a p-value of 0.07). This discrepancy underscores the greater adaptability of microbial communities in R2 to OLR variations compared to R1. Additionally, R1 took two weeks to fully recover from E2. Following the increase of the OLR to 4.42 g VS·d−1·Lreactor−1 during weeks 9 and 10, the GPR peaked in week 11 for both reactors, reaching 2.21 ± 0.17 and 2.44 ± 0.20 Lbiogas·d−1·Lreactor−1 in R1 and R2, respectively, with a significant difference (p-value of 0.04) (Figure 3a). This peak indicates the adaptation of microbial populations to high OLRs in both reactors, demonstrating that their degradation capacity was robust enough to handle E3, particularly the high OLR at this stage of the experiment. From week 12 onward, GPR remained relatively stable in both reactors, with mean weekly biogas production of 2.03 ± 0.15 and 2.08 ± 0.51 Lbiogas·d−1·Lreactor−1 in R1 and R2, respectively (p-values ranging from 0.2 to 0.9). These values are higher than those reported in the literature of thermophilic reactors started up with SS (0.11–0.41 Lbiogas·d−1·Lreactor−1) [33,34]. This discrepancy could be attributed to several factors, including the higher OLR, the use of thicker sludge samples in this study, differences in reactor design, and the lower HRT (12 days in this experiment compared to 20–40 days in previous studies) [50,51].

3.2.2. Comparison Between R1 and R2 in Terms of FOS/TAC and pH

FOS/TAC and pH variations are shown in Figure 3b. Throughout the experiment, pH values ranged from 7.39 ± 0.28 to 7.85 ± 0.09 in R1 and from 7.63 ± 0.27 to 7.86 ± 0.01 in R2. These values remained above the lower limit of the optimal pH range for AD (6.8–7.4) [52]. Since AD microorganisms can tolerate a pH range of 6.5 to 8 [53], the pH conditions in both reactors remained favorable for biogas production throughout the experiment. Between weeks 5 and 10, when E1, E2, and E3 occurred, R1 exhibited a slight pH decline compared to R2 (Figure 3b). This decrease corresponded with three peaks in the FOS/TAC values in R1 during weeks 5, 8, and 10 (p-values of 0.009, 0.06, and 0.24), occurring approximately one week after each event. In contrast, R2 displayed two FOS/TAC peaks, appearing one week after E1 and E3 (Figure 3b), though these values remained lower than those observed in R1. Notably, E2 did not significantly impact R2, likely because the VFA concentration in the SS load for E2 was lower than in E1 and E3 (Figure 2). The FOS/TAC peak observed upon E3 supports this observation, as the maximum FOS/TAC value (0.92) coincided with the SS load having the highest VFA content (10.42 g aace·L−1) (week 10 in Figure 2 and Figure 3b).
Unlike R2, R1 was more affected by the OLR fluctuations than by VFA variations in the SS load. The peaks in FOS/TAC observed in both reactors indicate that the rate of VFA production from organic components temporarily exceeded the rate of VFA degradation. The subsequent decline in FOS/TAC after each peak reflects the reactors’ ability to recover through increased acid degradation activity [54]. Furthermore, during this period of perturbation (weeks 5–10), FOS/TAC values remained higher in R1 than in R2, indicating greater instability in R1. Upon stabilization (week 12), the FOS/TAC ratio in both reactors stabilized around 0.5, with R2 showing a slightly higher value. Significant differences were observed in weeks 12 and 13 (p-values of 0.018 and 0.016, respectively).

3.2.3. Comparison Between R1 and R2 in Terms of Ammonia Concentration

Figure 3c illustrates the evolution of weekly means of ammonia concentration in R1 and R2. Similar trends were observed in R1 and R2, with high values at the beginning of the experiment and progressive decrease until stabilization from week 11 onwards. Mean values of 1213 ± 45 and 1263 ± 49 mg·L−1 were reached in R1 and R2, respectively. According to El-Fadel et al. [8], these values are slightly higher than the lower range value associated with inhibitory effects on AD (1200–4900 mg·L−1).

3.2.4. Stability of Thermophilic Anaerobic Digestion of Sewage Sludge

The stability of both reactors was continuously monitored to detect potential severe perturbations that could lead to reactor failure. To prevent such failures, precautionary measures, including feed suspension, were implemented whenever one or more monitoring parameters showed signs of decline. AD instability was assumed when an increase in FOS/TAC coincided with a decrease in methane production [55]. Overall, the start-up strategy proved successful, ensuring a relatively smooth transition to stable operation within 13 weeks. However, both reactors experienced some perturbations, primarily reflected in fluctuations in FOS/TAC values. Corrective measures were implemented by controlling the organic loading rate (OLR) through periodic feed suspension to allow for the degradation of excessive VFAs [49]. As a result, feeding was halted multiple times throughout the experiment, ranging from one to four days per week, to suppress fermentative activity whenever the FOS/TAC value exceeded 0.4. Feeding was resumed when biogas production increased or when the FOS/TAC value decreased, indicating improved process stability.
The 0.4 threshold for the FOS/TAC was fixed based on the literature, as higher values were known to lead to unfavorable conditions for AD microbial populations [56]. Nevertheless, both reactors tolerated even higher values of FOS/TAC (1.5 and 0.92 in R1 and R2, respectively) (Figure 3b) without experiencing severe perturbations, particularly in pH levels. Indeed, the FOS/TAC ratio is a well-known indicator of digester stability as it reflects the balance between VFA content and the buffer capacity of AD systems [57]. However, balanced methanogenic activity can still be maintained under VFA concentrations observed in perturbed digesters [55]. According to Kroeker [55], inhibition of methanogenic activity is primarily attributed to the unionized form of VFA, whose levels increase when pH decreases. Therefore, since pH variations remained within the neutral range in both reactors (between 7.2 and 8.1), bacterial degradation activity continued smoothly and stably despite the elevated VFA levels (high FOS/TAC). This finding aligns with McMahon et al. [29], who considered a FOS/TAC value exceeding 1 to be an indicator of AD stress.
Furthermore, the C/N ratio of SS loads ranged from 9.07 to 12.07 (Table 2), which represents a potential risk for AD due to possible ammonia accumulation [58]. However, nitrogen presence could also be beneficial in thermophilic AD systems [59]. Thermophilic temperature promotes the decomposition of nitrogenous compounds into ammonium bicarbonate [60], which buffers the acidification caused by VFA accumulation. In this study, a neutral pH (7.2–8 and 7.3–8.1 in R1 and R2, respectively) was maintained throughout the experiment without the need for neutralizing agents. On the other hand, the relatively high ammonia levels did not pose a critical risk to methanogenic activity, as the inhibition of acetoclastic methanogenesis occurs only with free ammonia, which forms based on pH levels [45,46,61,62]. Since the pH in both reactors remained neutral (Figure 3b), only a small fraction of total ammonia was converted to free ammonia [63].

3.3. Effect of the Start-Up Strategy on the Performance of Anaerobic Digesters

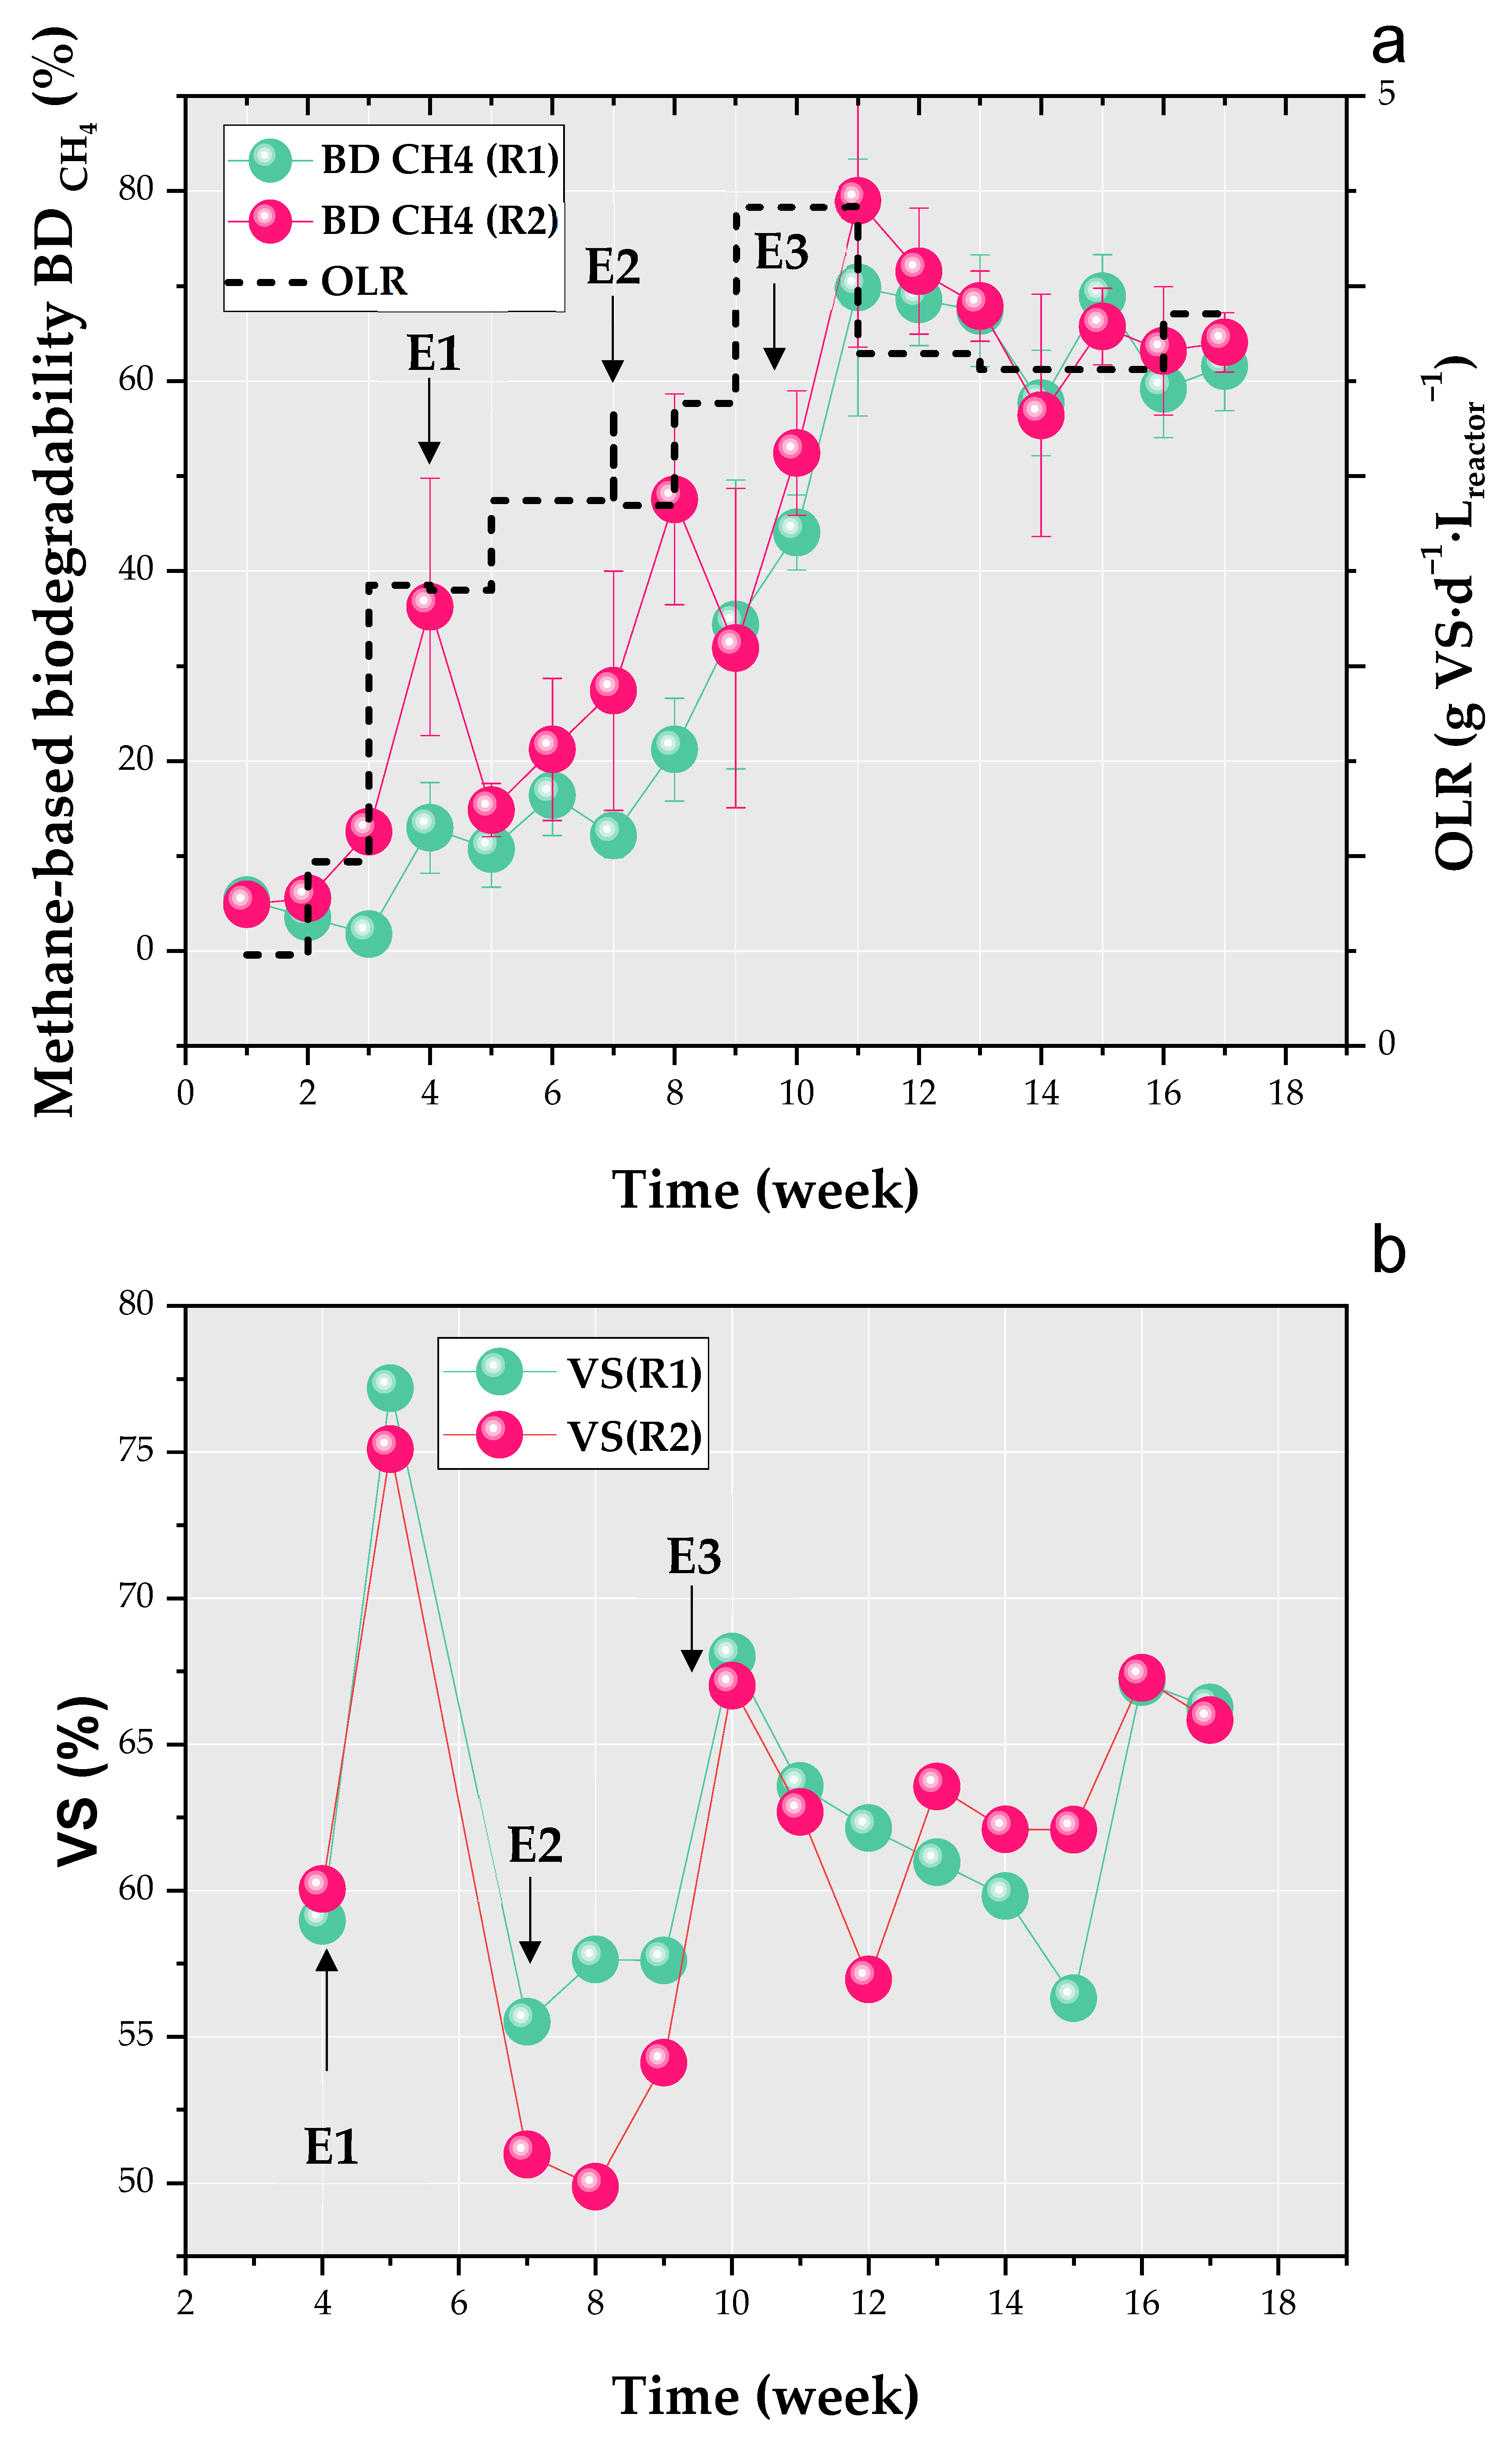
3.3.1. Comparison Between R1 and R2 in Terms of the Methane-Base Biodegradability

BdCH4 and OLR variations are shown in Figure 4a.
The trends in the weekly means of BdCH4, shown in Figure 4a, closely resemble the trends of GPR in Figure 3a. However, more pronounced differences between R1 and R2 are observed in BdCH4 (Figure 3a). This larger discrepancy could be attributed to a transient increase in CO2 production in R1, indicating higher acidogenic activity in this reactor compared to R2. At the start of the experiment, both reactors exhibited a lag phase in BdCH4, reflecting a slower growth rate of methanogens compared to the VFA degradation rate [64]. This imbalance was resolved two weeks later in R2 and three weeks later in R1. The most notable differences between R1 and R2 occurred in weeks 4, 7, and 8, with significant differences in weeks 4 and 8 (p-values of 0.01), suggesting that R2 adapted better to E1 and E2 than R1. Between weeks 3 and 4, the OLR was increased from 0.97 to 2.43 g VS·d−1·Lreactor−1 (E1), resulting in BdCH4 values of 12.97 ± 4.76% for R1 and 36.24 ± 13.56% for R2 in week 4 (Figure 4a). However, a further increase in OLR by 0.45 g VS·d−1·Lreactor−1 between weeks 4 and 5 led to a decline in methanogenic activity in R2, with BdCH4 dropping to 14.86 ± 2.82% in week 5. This reduction could be attributed to a four-day feeding cessation in week 5, compared to a two-day cessation in week 4.
In week 7, following E2, BdCH4 in R1 dropped to 12.18 ± 2.34%, while in R2, it continued its gradual increase, reaching 27.40 ± 12.59%, before jumping to 47.54 ± 11.09% in week 8 (Figure 4a). This reflects a higher methane production rate in R2 compared to R1. Additionally, the difference in methane production between the two reactors was greater during E1 and E2 than during E3 (Figure 4a), likely due to the establishment of acclimated microbial populations in both R1 and R2 by this stage. The relative decrease in methanogenic activity in R1 persisted for an additional week after E2 (week 8). In response to E3, BdCH4 peaked in both reactors during week 12, reaching 68.57 ± 4.84% and 71.55 ± 6.62% in R1 and R2, respectively (Figure 4a). At steady-state, BdCH4 in R1 and R2 converged to 61.83% and 62.34%, with corresponding methane production rates of 0.31 and 0.32 LCH4·d−1·(g VS)−1, respectively.

3.3.2. Comparison Between R1 and R2 in Terms of Volatile Solid Removal Efficiency

VS removal percentages of R1 and R2 are shown in Figure 4b. A peak can be observed in week 5 upon E1, followed by a decrease in VS removal between weeks 7 and 9 after E2 (Figure 4b). After the first step increase of OLR in E1 (Figure 4a), both reactors responded with an increase in biodegradation capacity with VS removal of 77 and 75% in R1 and R2, respectively. This increase in the conversion rate of organic matter coincides with a decrease in methane production (Figure 4a), suggesting that while substrate consumption continues, methanogenic activity is inhibited, allowing other microbial processes to persist [65]. The rise in OLR stimulates VFA production, which may exceed the methanogens’ capacity to convert VFAs into methane [66]. This is further supported by the increase in the FOS/TAC ratio in R1 and R2 (Figure 3b), reaching 1.06 ± 0.09 in R1 and 0.65 ± 0.03 in R2, respectively. The high VS removal values observed in R1 and R2 at week 5 reflect the specialization of hydrolytic and acidogenic communities under thermophilic conditions [67].
Additionally, R1 did not exhibit lower methane production than R2 during E1, suggesting similar methanogenic activity. In contrast, Wu et al. [26] reported a reduced diversity of methanogenic archaea when the system was started with inoculum preserved at a low temperature (15 °C), whereas inocula stored at higher temperatures (35 °C) maintained greater microbial diversity. This discrepancy could be attributed to differences in operational and storage conditions (i.e., temperature ranges and durations) between the two studies. Therefore, further research should focus on microbial community dynamics in inocula preserved under varying temperature conditions to better understand their impact on anaerobic digestion performance. On the other hand, E2 had a stronger impact on R1 and R2 than E1 in terms of VS removal efficiency, causing a decrease in the degradation capacity of microorganisms lasting three weeks. The effect of E2 on VS removal could also be accentuated by the change in the SS load with higher VS/TS content (Figure 2). The recovery of VS removal efficiencies in R1 and R2 in week 10, along with methane production (Figure 3a,b), may indicate the restoration of AD processes through microbial community restructuring and metabolic adjustments, as reported in the literature [68,69]. For instance, OLR shocks have been shown to drive microbial adaptation by upregulating the acetoclastic pathway while downregulating hydrogenotrophic pathways [69]. However, this remains an assumption, as microbial populations were not analyzed in this study. From week 10 until the end of the experiment, the VS removal percentage in R1 and R2 stabilized at around 63% in both reactors.

3.3.3. Performance of Thermophilic Anaerobic Digestion of Sewage Sludge

Despite significant fluctuations in the OLR due to variations in the feed conditions, both reactors exhibited high productivity. Methane production rates monitored using the BdCH4 index responded well to the feeding and temperature increase strategies (Figure 3a). Towards the end of the experiment, methanogenic activities in R1 and R2 became sufficiently high to process SS at OLR of 3.5–3.8 g VS·d−1·Lreactor−1 (Figure 4a.). The steady-state methane production rates achieved were 0.31 and 0.32 LCH4·d−1·(g VS)−1 in R1 and R2, respectively. These results are comparable to those reported in previous tests using a thermophilic pilot-scale digester processing thickened waste-activated sludge (0.27 LCH4·d−1·(g VS)−1) [70]. Similarly, the VS removal efficiencies in R1 and R2 (63%) were higher than those reported for thermophilic AD systems processing SS (50–53%) [51]. However, the VS removal efficiency remains lower than that of mesophilic AD systems (75%) [61] and thermophilic AD systems fed with lower OLR (86% for 2 g VS·d−1·Lreactor−1) [71].

3.4. Steady-State Operation and Mass Balance

Steady-state conditions were systematically studied in this research for both R1 and R2 to understand the impact of the inoculum on the start-up duration. Mass balances further confirmed the stability of the systems, enhancing the interpretability of the results.
Biogas production stability was achieved simultaneously in R1 and R2 in week 12, whereas CODt of digestate stabilized one week earlier in R2 (week 11). pH variations remained below 10% of the mean value (7.65 and 7.73 in R1 and R2, respectively) throughout the experiment in both reactors. The difference in CODt stabilization in R1 and R2 suggests a higher rate of SS degradation in R2, which resulted from the use of the fresh thermophilic inoculum compared to the post-treated inoculum. Compared to start-up studies where the same temperature increase strategy was applied, the present experiment took more time to reach a stable biogas production rate [50]. This delay may be attributed to fluctuations in feed quality and the higher OLR applied. According to Bortoloti et al. [31], fluctuations in feed quality can disrupt the equilibrium between fermentative and methanogenic processes, potentially causing stress in AD systems. Indeed, the properties of SS samples fluctuated throughout the experiment, requiring microbial communities to readapt to new feedstock quality. For instance, the VFA of sludge samples varied between 6.46 and 10.42 g aace·L−1 between samples 3 and 4 (Figure 2), which could have prolonged the start-up period.
The degradation efficiency of organic matter (CODt) and the mineral mass balance (effluent ash content) were within 90–98% in both reactors, indicating successful mass balance achievement at steady-state. Regarding TN, R1 did not reach a satisfactory mass balance percentage (85% compared to 90% in R2), which could be attributed to the onset of nitrogen accumulation in the reactor. Additionally, a margin of error may have been introduced by the heterogeneity of the samples analyzed, which could account for the 15% difference between the TN of influent and effluent in R1.

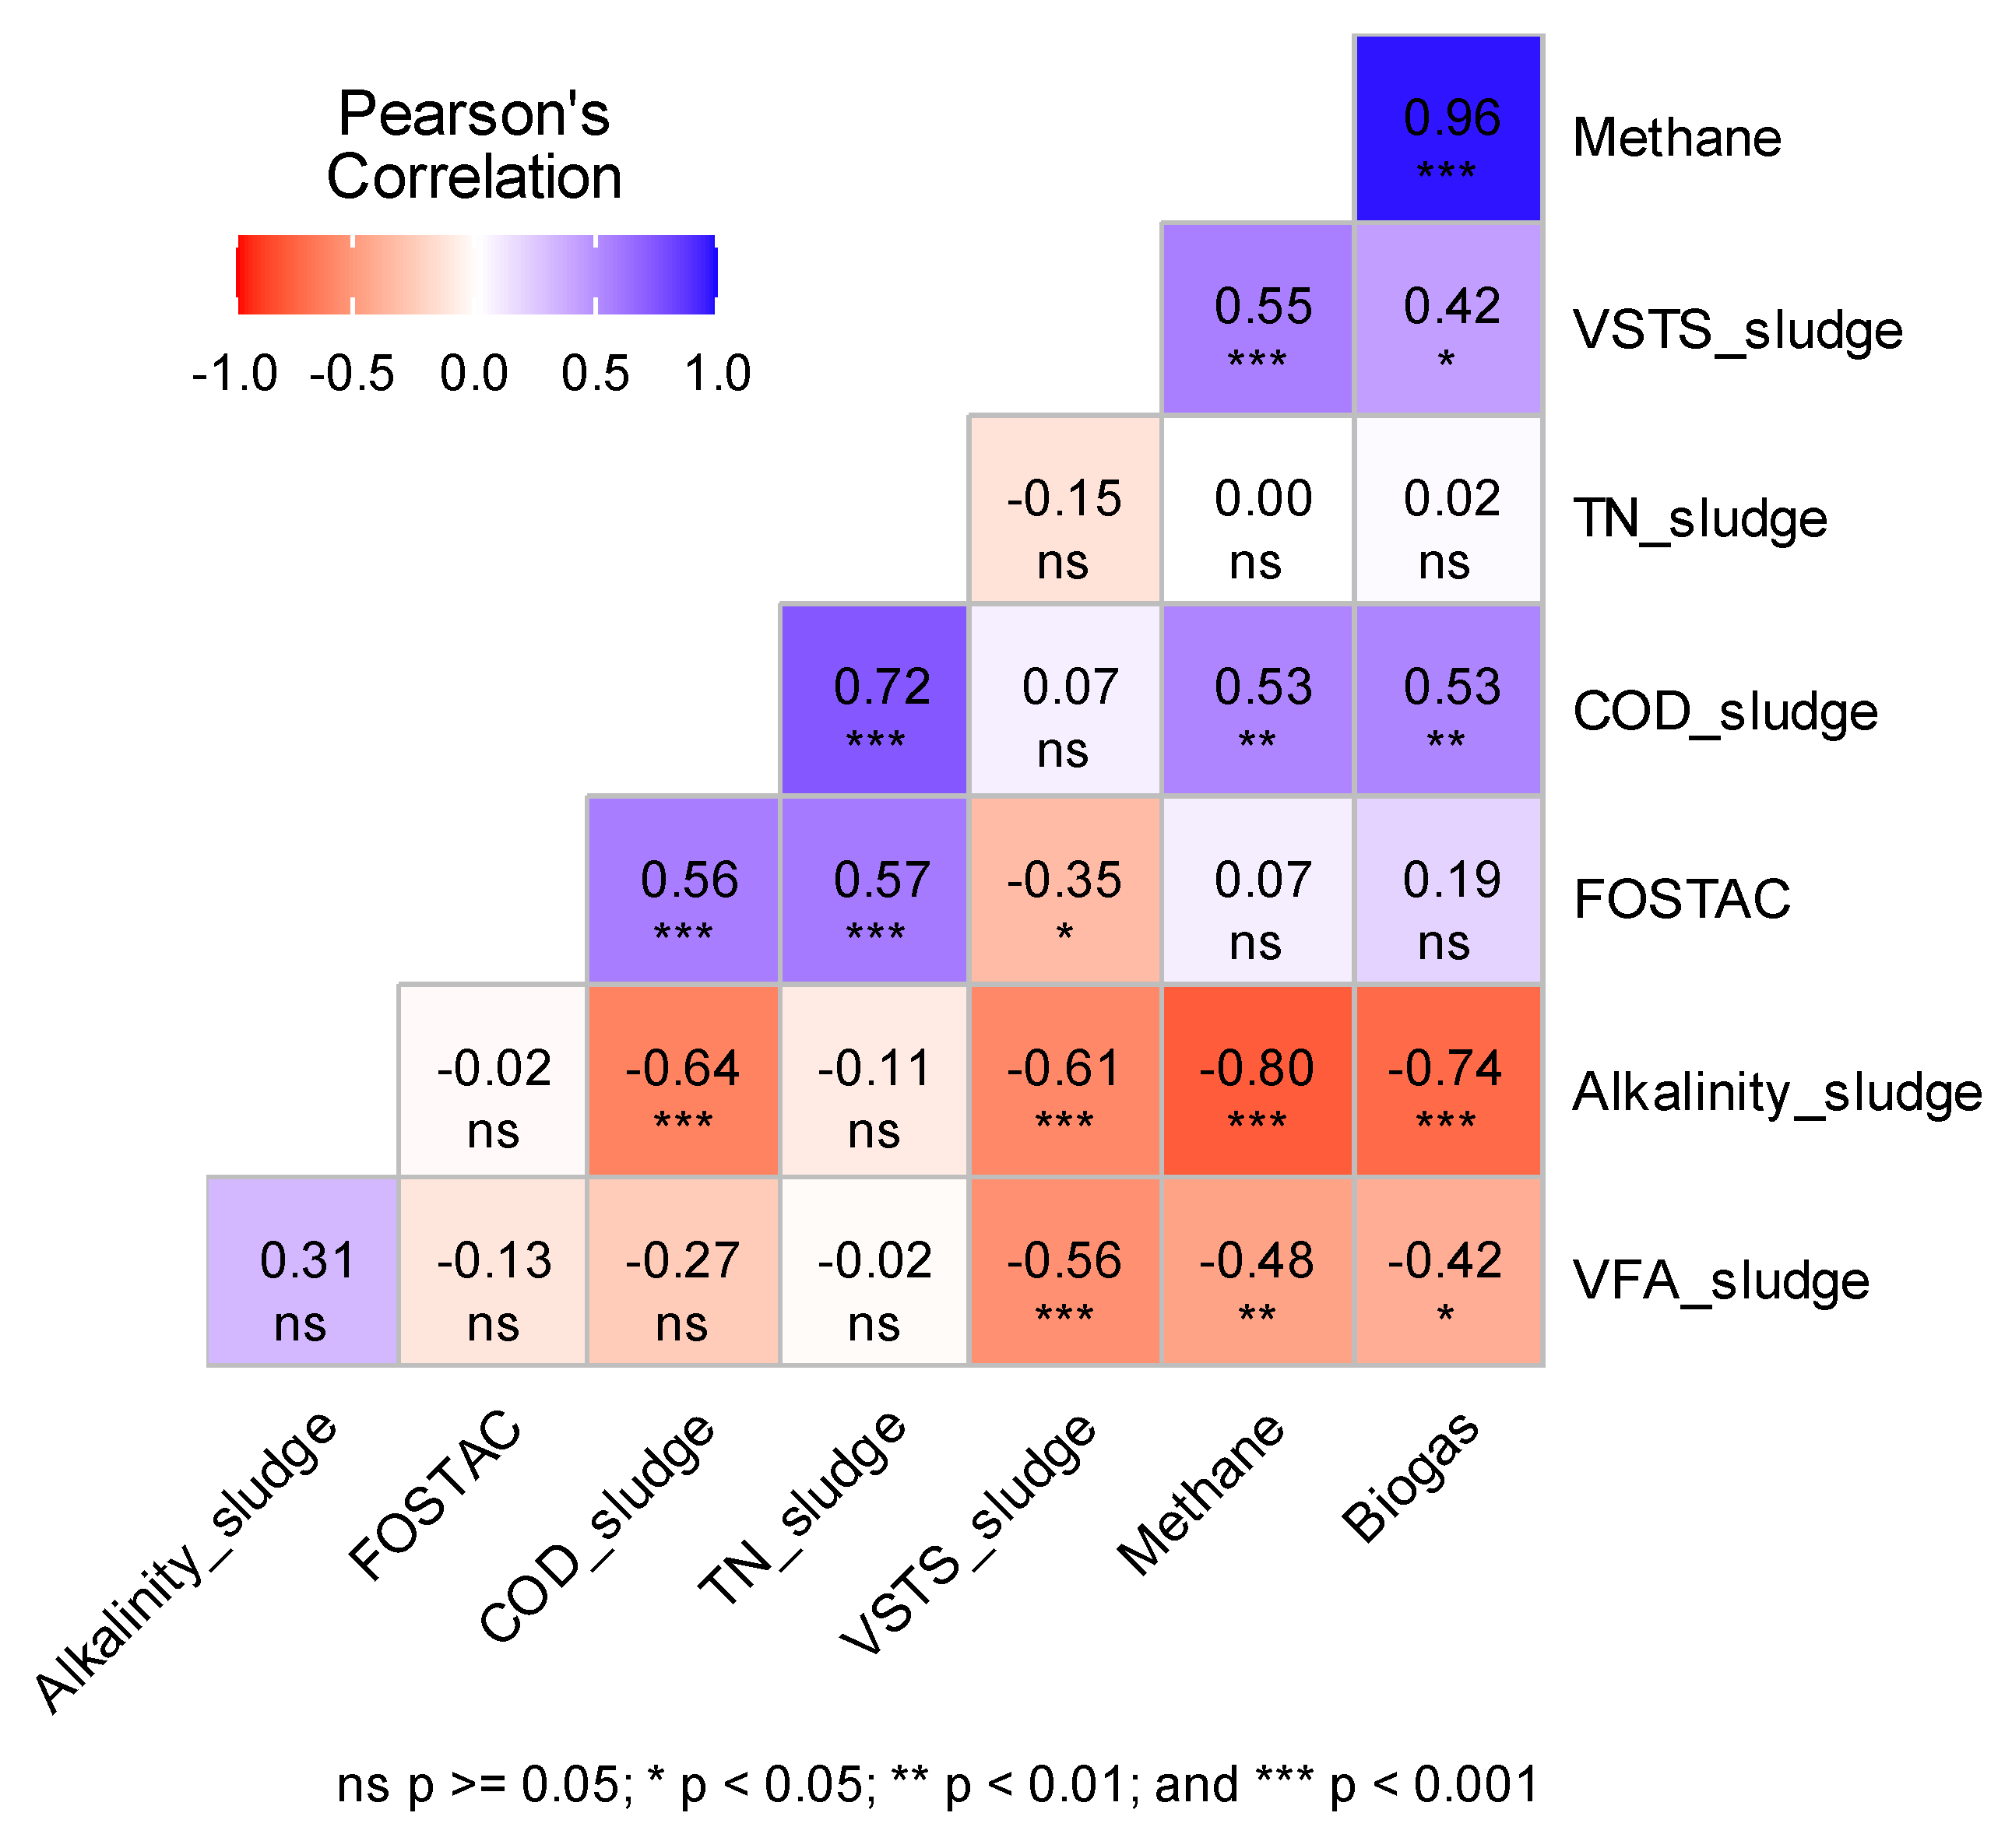
3.5. Correlation Between Influent Properties Variability and Reactors’ Response

Influent variability, driven by feedstock availability, is often unavoidable in full-scale biogas plants, making it difficult to control the OLR, which can pose a risk to process parameters. For example, fluctuations in nitrogen and organic concentrations in food waste have been shown to impact biogas production [72]. In contrast, variability in crude carbohydrate, protein, and lipid concentrations in the influent did not significantly affect biogas and methane production. Instead, carbohydrate degradability provided a better explanation for the variability in biogas and methane production [73]. Therefore, correlations between the characteristics of the seven SS loads used in the experiment and reactors’ outputs were investigated to determine whether the variations of SS load properties contribute to the process parameters variability or not.
Figure 5 shows the Pearson correlation matrix between alkalinity, VS/TS, VFA, TN, CODt of SS, biogas, methane content, and digestate FOS/TAC in R1 and R2. Four strong correlations were depicted: (1) between reactors’ methane and biogas production (0.96, p-value < 0.05), (2) between TNsludge and CODsludge (0.72 p-values < 0.05), (3) between Alkalinitysludge and biogas (−0.74 p-value < 0.05) and (4) between Alkalinitysludge and methane production (−0.8 p-value < 0.05) (Figure 5). The significant correlation between biogas and methane yields indicates that the composition of the biogas remained consistent throughout the experiment. Specifically, the methane percentage in the biogas did not decrease in favor of an increase in CO2 due to the applied start-up strategies, as shown in Figure 3a and Figure 4a. As for TNsludge and CODsludge, a part of TN nitrogen consists of organic nitrogen. Consequently, an increase in TN leads to an increase in COD [74]. Even though positive correlations between alkalinity and both biogas and methane production are expected [75], an increase in biogas and methane production was observed with the decrease in SS samples’ alkalinity. This could be attributed to the imbalances that may be induced by the additional alkalinity introduced by the feed to the AD system. Indeed, an increase in alkalinity could lead to a rise in pH, which in turn might inhibit methane-producing microorganisms [76]. Furthermore, high alkalinity is often associated with a high concentration of ammonia [77].
Moderate correlations between SS properties and reactors’ characteristics were noticed in the correlation matrix. Correlation coefficients of 0.56 (p-value < 0.05), 0.53 (p-value < 0.05), 0.57 (p-value < 0.05), and 0.53 (p-value < 0.05) were reported between CODsludge and FOS/TAC, CODsludge and methane, TNsludge and FOS/TAC and CODsludge and biogas of both reactors respectively (Figure 5). These correlations are the result of the strong aforementioned intercorrelations. As for the VS/TS of SS, it was moderately correlated to methane production of reactors with a coefficient of 0.55 (p-value < 0.05) (Figure 5).

3.6. Overall Differences Between R1 and R2

The performance of two inocula samples extracted from the same biogas plant but from a thermophilic digester and a post-treatment mesophilic tank was assessed through the application of three feeding events. R2 exhibited better adaptation to variations in the OLR, imposed by influent variability, than R1 and maintained a higher methane production rate throughout the experiment. The rate of hydrolysis and acidogenesis was higher in R2 during the first two weeks, leading to relatively high total VFA levels (high FOS/TAC). Starting from week 3, a balance between these initial steps and methanogenesis was achieved, resulting in a noticeable increase in methane production in R2, as shown in Figure 4a. For R1, during the transition period, it is hypothesized that fewer hydrolytic and fermentative bacteria acclimated to thermophilic temperature were active, which could explain the lower VFA levels observed during the first three weeks.
Upon the application of the feeding events (E1), imbalances in the rate of different AD steps became more pronounced, as indicated by high FOS/TAC and low methane production. After the first increase in OLR during week 4, feed suspension in weeks 5, 9, and 14 negatively affected methanogenic activity in R2. This led to a decrease of BdCH4 with 57%, 37%, and 15%, respectively, while in R1, BdCH4 slightly decreased in weeks 5 and 14 and increased in week 9. Despite the lack of microbiological analysis due to logistical constraints, the decrease in methane production following feed suspension suggests a higher number of active thermophilic methanogens in R2 compared to R1.
With regards to effluent quality, R1 and R2 had similar values throughout the experiment, with a slightly better COD removal efficiency in R2 and a better VS removal efficiency in R1. After the establishment of steady thermophilic AD, the difference between all parameters monitored in R1 and R2 values became minimal. The same observation was reported by Liu et al. [13] during a comparison of different inocula, leading to a similarity in microbial compositions of the compared reactors upon steady-state. The short-term (8–9 days) preservation of inoculum under mesophilic temperatures had a minimal impact on the start-up phase and resulted in steady-state performance comparable to that of a fresh thermophilic inoculum. Similar results were observed when mesophilic-preserved sludge was stored for 60 days under low feeding, demonstrating consistent methane production in a semi-continuous system [26].
In contrast, a low-temperature stored inoculum (15 °C) showed poor performance even after 30 days of operation in the same study. However, batch experiments have yielded different findings, where digested SS stored at room temperature (22 °C) exhibited 63% higher methane production compared to mesophilic-stored inoculum [24]. Additionally, digested pig manure stored at 37 °C and 4 °C showed similar methane production, while digested sludge stored at 4 °C had 20% higher methane production than that stored at 37 °C [24]. On the other hand, the use of preservation agents such as agar gel produced differing results, where digestate stored at room temperature exhibited better methane production than that stored at 4 °C [23]. These contradictions may result from differences in the microbial communities of the inoculum, as the composition of the inoculum depends on the operational conditions of its origin. For example, discontinuous feeding has been shown to enhance microbial diversity, increasing the resilience of microorganisms against overloading events [78].
Moreover, the impact of preservation techniques—including temperature, duration, feeding, and preservation agents—on process parameters in semi-continuous conditions, and not just on specific methane production, remains underexplored. This highlights the need for further research in this area. Previous studies on inocula have not consistently demonstrated a clear impact on AD performance [79], and in some cases, the starting inoculum did not significantly influence digester outcomes [12,57,80]. However, since R1 and R2 were operated under similar conditions, the only difference being the mesophilic post-treatment of the inoculum, the observed differences in performance between R1 and R2 are likely attributable to the inocula. This variation in inoculum, combined with the adopted feeding strategy, led to better acclimation of R2 to extreme feeding events, particularly E1 and E2, but poorer performance during feed suspension (E3). In contrast, R1 exhibited a typical response to high organic loads, characterized by a decline in methanogenic activity followed by recovery after feed suspension. These findings suggest that a fresh thermophilic inoculum is better suited than a mesophilically stabilized one for rapid and aggressive start-up under thermophilic AD conditions.
Furthermore, the results of this study are directly applicable to full-scale operations, as the digestates used to inoculate R1 and R2 were sourced from an actual biogas plant rather than from pure laboratory cultures, which are often difficult to obtain in large quantities for industrial applications. This enhances the real-world relevance of the findings. The degree of post-digestion of the inoculum can serve as a practical performance indicator to help engineers and plant operators select the most suitable inoculum, particularly in thermophilic AD processes and during temperature transitions. Feeding variability, both in quantity and quality, is another factor that increases the relevance of directly applying the findings of this study to full-scale biogas plants. In real-world conditions, feeding rates primarily depend on feedstock availability since redirecting organic waste or storing it for extended periods can result in odor issues, greenhouse gas emissions, and additional tipping fees. Addressing this variability can thus help reduce start-up duration and improve the system’s resilience to fluctuations in feeding. Moreover, selecting the appropriate inoculum can minimize environmental risks such as methane flaring caused by process failures or the disposal of partially biodegraded organic material due to inefficient digestion. Finally, choosing an inoculum with high operational resilience to stress conditions, such as fluctuating feedstock availability, can help lower the operational costs of biogas plants by ensuring process stability and maximizing methane yields [16].

4. Conclusions

A start-up of two digesters seeded with digestates from a full-scale biogas plant, sampled from a thermophilic digester, and a mesophilic post-treatment tank was performed. R1 was seeded with the mesophilically post-digested thermophilic digestate, whereas R2 was seeded with the fresh thermophilic one. Three extreme feeding events were applied to compare both inocula in terms of resistance to influent variability.
Correlation analysis between the SS samples’ properties and digesters’ parameters revealed the impact of sludge alkalinity on biogas and methane production. Variations in SS quality during early HRT periods of the experiment negatively impacted the performance of reactor R1. The changes introduced in R1, intended as precautionary feeding measures, had a subsequent negative impact on the performance of R2. Since both reactors were fed likewise, the methane production rate in R2 was held because of feed suspension. Thus, in the context of discontinuous adaptive feeding, the reactor seeded with the mesophilically post-digested thermophilic digestate was more sensitive to high organic loads, whereas the reactor seeded with fresh thermophilic digestate was more affected by feed suspension. To the best of the authors’ knowledge, the effect of digestate post-treatment before seeding on the start-up of thermophilic systems has not been previously assessed. Therefore, the findings of this study, combined with well-established digestate characteristics, could assist biogas plant operators and engineers in developing indicators to evaluate the potential of different inocula, thereby enabling robust, case-specific start-up decisions that enhance the environmental benefits of AD.

Author Contributions

Conceptualization, A.H. and C.V.; Methodology, A.H. and C.V.; Software, A.H.; Validation, A.H., C.V., S.B. and E.M.H.; Formal Analysis, A.H., C.V., S.B. and E.M.H.; Investigation, A.H.; Resources, C.V.; Data Curation, A.H., C.V. and S.B.; Writing—Original Draft Preparation, A.H.; Writing—Review and Editing, A.H., E.M.H., C.V. and S.B.; Visualization, A.H. and C.V.; Supervision, C.V. and E.M.H.; Project Administration, C.V.; Funding Acquisition, C.V. All authors have read and agreed to the published version of the manuscript.

Funding

This work received funding from an NSERC (Natural Science and Engineering Research Council of Canada) Alliance Grant (ALLRP548561-19) in partnership with Quebec City as well as a Discovery Grant (RGPIN-2017-04838). Céline Vaneeckhaute holds the Canada Research Chair in Resource Recovery and Bioproducts Engineering.

Institutional Review Board Statement

Not applicable.

Informed Consent Statement

Not applicable.

Data Availability Statement

The dataset are available upon request from the authors.

Acknowledgments

The authors would like to thank Québec City for providing the samples of sludge and assisting in the monitoring analysis.

Conflicts of Interest

The authors declare no conflicts of interest.

References

  1. Maroun, R.; El Fadel, M. Start-up of anaerobic digestion of source-sorted organic municipal solid waste in the absence of classical inocula. Environ. Sci. Technol. 2007, 41, 6808–6814. [Google Scholar] [CrossRef] [PubMed]
  2. Calbry-Muzyka, A.; Madi, H.; Rüsch-Pfund, F.; Gandiglio, M.; Biollaz, S. Biogas composition from agricultural sources and organic fraction of municipal solid waste. Renew. Energy 2022, 181, 1000–1007. [Google Scholar] [CrossRef]
  3. Griffin, M.E.; Mcmahon, K.D.; Mackie, R.I.; Raskin, L. Methanogenic Population Dynamics during Start-Up of Anaerobic Digesters Treating Municipal Solid Waste and Biosolids. Biotechnol. Bioeng. 1998, 57, 342–355. [Google Scholar] [CrossRef]
  4. Tezel, U.; Tandukar, M.; Hajaya, M.G.; Pavlostathis, S.G. Transition of municipal sludge anaerobic digestion from mesophilic to thermophilic and long-term performance evaluation. Bioresour. Technol. 2014, 170, 385–394. [Google Scholar] [CrossRef]
  5. Ahmed, W.; Rodríguez, J. A model predictive optimal control system for the practical automatic start-up of anaerobic digesters. Water Res. 2020, 174, 115599. [Google Scholar] [CrossRef]
  6. Escudié, R.; Cresson, R.; Delgenès, J.P.; Bernet, N. Control of start-up and operation of anaerobic biofilm reactors: An overview of 15 years of research. Water Res. 2011, 45, 1–10. [Google Scholar] [CrossRef]
  7. Goux, X.; Calusinska, M.; Lemaigre, S.; Marynowska, M.; Klocke, M.; Udelhoven, T.; Benizri, E.; Delfosse, P. Microbial community dynamics in replicate anaerobic digesters exposed sequentially to increasing organic loading rate, acidosis, and process recovery. Biotechnol. Biofuels 2015, 8, 122. [Google Scholar] [CrossRef] [PubMed]
  8. El-Fadel, M.; Saikaly, P.; Ghanimeh, S. Startup and stability of thermophilic anaerobic digestion of OFMSW. Crit. Rev. Environ. Sci. Technol. 2013, 43, 2685–2721. [Google Scholar] [CrossRef]
  9. Mcmahon, K.D.; Stroot, P.G.; Mackie, R.I.; Raskin, L. Anaerobic codigestion of municipal solid waste and biosolids under various mixing conditions—II: Microbial population dynamics. Water Res. 2001, 35, 1817–1827. [Google Scholar] [CrossRef]
  10. Angelidaki, I.; Sanders, W. Assessment of the anaerobic biodegradability of macropollutants. Rev. Environ. Sci. Biotechnol. 2004, 3, 117–129. [Google Scholar] [CrossRef]
  11. Moestedt, J.; Westerholm, M.; Isaksson, S.; Schnürer, A. Inoculum source determines acetate and lactate production during anaerobic digestion of sewage sludge and food waste. Bioengineering 2020, 7, 3. [Google Scholar] [CrossRef] [PubMed]
  12. Mellyanawaty, M.; Nakakoji, S.; Tatara, M.; Marbelia, L.; Sarto; Prijambada, I.D.; Budhijanto, W.; Ueno, Y. Enrichment of thermophilic methanogenic microflora from mesophilic waste activated sludge for anaerobic digestion of garbage slurry. J. Biosci. Bioeng. 2021, 132, 630–639. [Google Scholar] [CrossRef] [PubMed]
  13. Liu, T.; Sun, L.; Müller, B.; Schnürer, A. Importance of inoculum source and initial community structure for biogas production from agricultural substrates. Bioresour. Technol. 2017, 245, 768–777. [Google Scholar] [CrossRef] [PubMed]
  14. Hmaissia, A.; Vaneeckhaute, C. Effects of inoculum temperature and characteristics on cellulose and sewage sludge biodegradability: A comparative study of three inocula. Chemosphere 2025, 372, 144077. [Google Scholar] [CrossRef]
  15. De Vrieze, J.; Christiaens, M.E.R.; Walraedt, D.; Devooght, A.; Ijaz, U.Z.; Boon, N. Microbial community redundancy in anaerobic digestion drives process recovery after salinity exposure. Water Res. 2017, 111, 109–117. [Google Scholar] [CrossRef]
  16. Hmaissia, A.; Hernández, E.M.; Vaneeckhaute, C. Comparing sewage sludge vs. digested sludge for starting-up thermophilic two-stage anaerobic digesters: Operational and economic insights. Waste Manag. 2025, 194, 24–35. [Google Scholar] [CrossRef]
  17. Gu, Y.; Chen, X.; Liu, Z.; Zhou, X.; Zhang, Y. Effect of inoculum sources on the anaerobic digestion of rice straw. Bioresour. Technol. 2014, 158, 149–155. [Google Scholar] [CrossRef]
  18. Martí-Herrero, J.; Castro, L.; Jaimes-Estévez, J.; Grijalva, M.; Gualatoña, M.; Aldás, M.B.; Escalante, H. Biomethane potential test applied to psychrophilic conditions: Three issues about inoculum temperature adaptation. Bioresour. Technol. Rep. 2022, 20, 101279. [Google Scholar] [CrossRef]
  19. Tsigkou, K.; Sakarika, M.; Kornaros, M. Inoculum origin and waste solid content influence the biochemical methane potential of olive mill wastewater under mesophilic and thermophilic conditions. Biochem. Eng. J. 2019, 151, 107301. [Google Scholar] [CrossRef]
  20. Li, K.; Yun, J.; Zhang, H.; Yu, Z. Full-scale anaerobic reactor samples would be more suitable than lab-scale anaerobic reactor and natural samples to inoculate the wheat straw batch anaerobic digesters. Bioresour. Technol. 2019, 293, 122040. [Google Scholar] [CrossRef]
  21. Li, Q.; Koyama, M.; Nakasaki, K. Effect of storage time on organic matter decomposition during composting by inoculating enriched microorganisms. Environ. Technol. Innov. 2023, 29, 102984. [Google Scholar] [CrossRef]
  22. Liu, C.; Ge, J.; Dai, J.; Qu, M.; Ouyang, K.; Qiu, Q. The Effects of Mixed Inoculum Storage Time on In Vitro Rumen Fermentation Characteristics, Microbial Diversity, and Community Composition. Animals 2025, 15, 5. [Google Scholar] [CrossRef] [PubMed]
  23. Yan, M.; Fotidis, I.A.; Jéglot, A.; Treu, L.; Tian, H.; Palomo, A.; Zhu, X.; Angelidaki, I. Long-term preserved and rapidly revived methanogenic cultures: Microbial dynamics and preservation mechanisms. J. Clean Prod. 2020, 263, 121577. [Google Scholar] [CrossRef]
  24. Astals, S.; Koch, K.; Weinrich, S.; Hafner, S.D.; Tait, S.; Peces, M. Impact of storage conditions on the methanogenic activity of anaerobic digestion inocula. Water 2020, 12, 1321. [Google Scholar] [CrossRef]
  25. Nohra, J.A.; Barrington, S.; Frigon, J.C.; Guiot, S.R. In storage psychrophilic anaerobic digestion of swine slurry. Resour. Conserv. Recycl. 2003, 38, 23–37. [Google Scholar] [CrossRef]
  26. Wu, J.; Zhang, H.; Zhao, Y.; Yuan, X.; Cui, Z. Effect of Temperature on the Inocula Preservation, Mesophilic Anaerobic Digestion Start-Up, and Microbial Community Dynamics. Agronomy 2024, 12, 2991. [Google Scholar] [CrossRef]
  27. Jain, S.; Jain, S.; Wolf, I.T.; Lee, J.; Tong, Y.W. A comprehensive review on operating parameters and different pretreatment methodologies for anaerobic digestion of municipal solid waste. Renew. Sustain. Energy Rev. 2015, 52, 142–154. [Google Scholar] [CrossRef]
  28. Poggi-Varaldo, H.M.; Oleszkiewicz, J.A. Anaerobic co-composting of municipal solid waste and waste sludge at hlgh total solids levels. Environ. Technol. 1992, 13, 409–421. [Google Scholar] [CrossRef]
  29. McMahon, K.D.; Zheng, D.; Stams, A.J.M.; Mackie, R.I.; Raskin, L. Microbial population dynamics during start-up and overload conditions of anaerobic digesters treating municipal solid waste and sewage sludge. Biotechnol. Bioeng. 2004, 87, 823–834. [Google Scholar] [CrossRef]
  30. Rimkus, R.R.; Ryan, J.M.; Cook, E.J. Full-Scale Thermophilic Digestion at the West-Southwest Sewage Treatment Works, Chicago, Illinois. Water Pollut. Control. Fed. 1982, 54, 1447–1457. [Google Scholar]
  31. Bortoloti, M.A.; Challiol, A.Z.; Navarro, B.L.; Sicchieri, I.M.; Kuroda, E.K.; Fernandes, F. Challenges of Load Variation on Anaerobic Digestion of Organic Waste on a Full Scale: An Applied Study. Waste Biomass Valorization 2023, 14, 4141–4154. [Google Scholar] [CrossRef]
  32. Schievano, A.; D’Imporzano, G.; Orzi, V.; Adani, F. On-field study of anaerobic digestion full-scale plants (Part II): New approaches in monitoring and evaluating process efficiency. Bioresour. Technol. 2011, 102, 8814–8819. [Google Scholar] [CrossRef]
  33. Haghighi Podeh, M.R.; Bhattacharya, S.K.; Qu, M. Effects of nitrophenols on acetate utilizing methanogenic systems. Water Res. 1995, 29, 391–399. [Google Scholar] [CrossRef]
  34. Azbar, N.; Ursillo, P.; Speece, R.E. Effect of process configuration and substrate complexity on the performance of anaerobic processes. Water Res. 2001, 35, 817–829. [Google Scholar] [CrossRef]
  35. Alvarez, R.; Villca, S.; Lidén, G. Biogas production from llama and cow manure at high altitude. Biomass Bioenergy 2006, 30, 66–75. [Google Scholar] [CrossRef]
  36. Eaton, A.D. (Ed.) Standard Methods for the Examination of Water and Wastewater, 20th ed.; American Public Health Association: Washington, DC, USA, 1999. [Google Scholar]
  37. Boyle, W.C. Energy Recovery from Sanitary Landfills—A review. In Microbial Energy Conversion; Elsevier: Amsterdam, The Netherlands, 1977; pp. 119–138. [Google Scholar]
  38. Raposo, F.; Fernández-Cegrí, V.; de la Rubia, M.A.; Borja, R.; Béline, F.; Fernández-Polanco, M.; Frigon, J.C.; Ganesh, R.; Kaparaju, P.; Koubova, J.; et al. Biochemical methane potential (BMP) of solid organic substrates: Evaluation of anaerobic biodegradability using data from an international interlaboratory study. J. Chem. Technol. Biotechnol. 2011, 86, 1088–1098. [Google Scholar] [CrossRef]
  39. Wickham, H.; Averick, M.; Bryan, J.; Chang, W.; McGowan, L.; François, R.; Grolemund, G.; Hayes, A.; Henry, L.; Hester, J.; et al. Welcome to the Tidyverse. J. Open Source Softw. 2019, 4, 1686. [Google Scholar] [CrossRef]
  40. Olivoto, T.; Lúcio, A.D.C. metan: An R package for multi-environment trial analysis. Methods Ecol. Evol. 2020, 11, 783–789. [Google Scholar] [CrossRef]
  41. Babson, D.M.; Bellman, K.; Prakash, S.; Fennell, D.E. Anaerobic digestion for methane generation and ammonia reforming for hydrogen production: Athermodynamic energy balance of a model system to demonstrate net energy feasibility. Biomass Bioenergy 2013, 56, 493–505. [Google Scholar] [CrossRef]
  42. Hao, T.; Xiao, Y.; Varjani, S. Transiting from the inhibited steady-state to the steady-state through the ammonium bicarbonate mediation in the anaerobic digestion of low-C/N-ratio food wastes. Bioresour. Technol. 2022, 351, 127046. [Google Scholar] [CrossRef]
  43. Moure Abelenda, A.; Aiouache, F. Flash Distillation Process for Stabilization of Anaerobic Digestate and Synthesis of Ammonium Bicarbonate. Preprints 2023, 2023052236. [Google Scholar] [CrossRef]
  44. Braguglia, C.M.; Gallipoli, A.; Gianico, A.; Pagliaccia, P. Anaerobic bioconversion of food waste into energy: A critical review. Bioresour. Technol. 2018, 248, 37–56. [Google Scholar] [CrossRef] [PubMed]
  45. Zhang, J.; Tian, H.; Wang, X.; Tong, Y.W. Effects of activated carbon on mesophilic and thermophilic anaerobic digestion of food waste: Process performance and life cycle assessment. Chem. Eng. J. 2020, 399, 125757. [Google Scholar] [CrossRef]
  46. Kobayashi, T.; Yasuda, D.; Li, Y.Y.; Kubota, K.; Harada, H.; Yu, H.Q. Characterization of start-up performance and archaeal community shifts during anaerobic self-degradation of waste-activated sludge. Bioresour. Technol. 2009, 100, 4981–4988. [Google Scholar] [CrossRef]
  47. Tezel, U.; Tandukar, M.; Pavlostathis, S.G. Anaerobic Biotreatment of Municipal Sewage Sludge. In Comprehensive Biotechnology, 2nd ed.; Elsevier: Amsterdam, The Netherlands, 2011; Volume 6, pp. 447–461. [Google Scholar]
  48. Córdoba, V.; Fernández, M.; Santalla, E. The effect of different inoculums on anaerobic digestion of swine wastewater. J. Environ. Chem. Eng. 2016, 4, 115–122. [Google Scholar] [CrossRef]
  49. Angelidaki, I.; Chen, X.; Cui, J.; Kaparaju, P.; Ellegaard, L. Thermophilic anaerobic digestion of source-sorted organic fraction of household municipal solid waste: Start-up procedure for continuously stirred tank reactor. Water Res. 2006, 40, 2621–2628. [Google Scholar] [CrossRef]
  50. Tian, Z.; Zhang, Y.; Li, Y.; Chi, Y.; Yang, M. Rapid establishment of thermophilic anaerobic microbial community during the one-step startup of thermophilic anaerobic digestion from a mesophilic digester. Water Res. 2015, 69, 9–19. [Google Scholar] [CrossRef]
  51. Shin, J.; Jang, H.M.; Shin, S.G.; Kim, Y.M. Thermophilic anaerobic digestion: Effect of start-up strategies on performance and microbial community. Sci. Total. Environ. 2019, 687, 87–95. [Google Scholar] [CrossRef]
  52. Mao, C.; Feng, Y.; Wang, X.; Ren, G. Review on research achievements of biogas from anaerobic digestion. Renew. Sustain. Energy Rev. 2015, 45, 540–555. [Google Scholar] [CrossRef]
  53. Cioabla, A.E.; Ionel, I.; Dumitrel, G.-A.; Popescu, F. Comparative study on factors affecting anaerobic digestion of agricultural vegetal residues. Biotechnol. Biofuels 2012, 5, 39. [Google Scholar] [CrossRef]
  54. Iranpour, R.; Oh, S.; Cox, H.H.J.; Shao, Y.J.; Moghaddam, O.; Kearney, R.J.; Deshusses, M.A.; Stenstrom, M.K.; Ahring, B.K. Changing Mesophilic Wastewater Sludge Digestion into Thermophilic Operation at Terminal Island Treatment Plant. Water Environ. Res. 2002, 74, 494–507. [Google Scholar] [CrossRef]
  55. Kroeker, E.J.; Schulte, D.D.; Sparling, A.B.; Lapp, H.M. Anaerobic Treatment Process Stability. Water Pollut. Control. Fed. 1979, 51, 718–727. [Google Scholar]
  56. Scano, E.A.; Asquer, C.; Pistis, A.; Ortu, L.; Demontis, V.; Cocco, D. Biogas from anaerobic digestion of fruit and vegetable wastes: Experimental results on pilot-scale and preliminary performance evaluation of a full-scale power plant. Energy Convers. Manag. 2014, 77, 22–30. [Google Scholar] [CrossRef]
  57. De La Rubia, M.A.; Riau, V.; Raposo, F.; Borja, R. Thermophilic anaerobic digestion of sewage sludge: Focus on the influence of the start-up A review. Crit. Rev. Biotechnol. 2013, 33, 448–460. [Google Scholar] [CrossRef]
  58. Karthikeyan, O.P.; Visvanathan, C. Bio-energy recovery from high-solid organic substrates by dry anaerobic bio-conversion processes: A review. Rev. Environ. Sci. Biotechnol. 2013, 12, 257–284. [Google Scholar] [CrossRef]
  59. Chandra, R.; Takeuchi, H.; Hasegawa, T. Methane production from lignocellulosic agricultural crop wastes: A review in context to second generation of biofuel production. Energy Rev. 2012, 16, 1462–1476. [Google Scholar] [CrossRef]
  60. Fikri Hamzah, M.A.; Md Jahim, J.; Mohamed Abdul, P. Comparative start-up between mesophilic and thermophilic for acidified palm oil mill effluent treatment. IOP Conf. Ser. Earth Environ. Sci. 2019, 268, 012028. [Google Scholar] [CrossRef]
  61. Tonanzi, B.; Gallipoli, A.; Gianico, A.; Montecchio, D.; Pagliaccia, P.; Di Carlo, M.; Rossetti, S.; Braguglia, C.M. Long-term anaerobic digestion of food waste at semi-pilot scale: Relationship between microbial community structure and process performances. Biomass Bioenergy 2018, 118, 55–64. [Google Scholar] [CrossRef]
  62. Batstone, D.J.; Angelidaki, I.; Vavilin, V. Anaerobic digestion model No 1 (ADM1). Water Sci. Technol. 2002, 45, 65–73. [Google Scholar] [CrossRef]
  63. Anthonisen, A.C.; Loehr, R.C.; Prakasam, T.B.S.; Srinath, E.G. Inhibition of nitrification by ammonia and nitrous acid. J. Water Pollut. Control Fed. 1976, 48, 835–852. [Google Scholar]
  64. Weiland, P. Biogas production: Current state and perspectives. Appl. Microbiol. Biotechnol. 2010, 85, 849–860. [Google Scholar] [CrossRef]
  65. López-Escobar, L.A.; Martínez-Hernández, S.; Corte-Cano, G.; Méndez-Contreras, J.M. Influence of organic loading rate on methane production in a CSTR from physicochemical sludge generated in a poultry slaughterhouse. J. Environ. Sci. Health A Tox Hazard. Subst. Environ. Eng. 2014, 49, 1710–1717. [Google Scholar] [CrossRef]
  66. Nakasaki, K.; Kwon, S.H.; Takemoto, Y. An interesting correlation between methane production rates and archaea cell density during anaerobic digestion with increasing organic loading. Biomass Bioenergy 2015, 78, 17–24. [Google Scholar] [CrossRef]
  67. Steiniger, B.; Hupfauf, S.; Insam, H.; Schaum, C. Exploring Anaerobic Digestion from Mesophilic to Thermophilic Temperatures—Operational and Microbial Aspects. Fermentation 2023, 9, 798. [Google Scholar] [CrossRef]
  68. Wirasembada, Y.C.; Shin, B.; Shin, J.; Kurniawan, A.; Cho, J. Effects of sudden shock load on simultaneous biohythane production in two-stage anerobic digestion of high-strength organic wastewater. Bioresour. Technol. 2023, 394, 130186. [Google Scholar] [CrossRef]
  69. Mercado, J.V.; Koyama, M.; Nakasaki, K. Complexity of acclimatization substrate affects anaerobic digester microbial community response to organic load shocks. Environ. Res. 2022, 216, 114722. [Google Scholar] [CrossRef]
  70. De La Rubia, M.A.; Romero, L.I.; Sales, D.; Perez, M. Temperature conversion (mesophilic to thermophilic) of municipal sludge digestion. AIChE J. 2005, 51, 2581–2586. [Google Scholar] [CrossRef]
  71. Ghanimeh, S.; Al-Sanioura, D.; Saikaly, P.E.; El-Fadel, M. Comparison of Single-Stage and Two-Stage Thermophilic Anaerobic Digestion of SS-OFMSW During the Start-Up Phase. Waste Biomass Valorization 2020, 11, 6709–6716. [Google Scholar] [CrossRef]
  72. Kim, M.; Cui, F. Multiple-layer statistical methodology for developing data-driven models of anaerobic digestion process. J. Environ. Manag. 2023, 347, 119153. [Google Scholar] [CrossRef]
  73. Tisocco, S.; Weinrich, S.; Lyons, G.; Wills, M.; Zhan, X.; Crosson, P. Application of a simplified ADM1 for full-scale anaerobic co-digestion of cattle slurry and grass silage: Assessment of input variability. Front. Environ. Sci. Eng. 2023, 18, 50. [Google Scholar] [CrossRef]
  74. Jørgensen, N.O.G. Organic Nitrogen; Elsevier Inc.: Amsterdam, The Netherlands, 2009; pp. 832–851. [Google Scholar]
  75. Fang, H.H.P.; Lau, I.W.C. Startup of thermophilic (55 °C) UASB reactors using different mesophilic seed sludges. Water Sci. Technol. 1996, 34, 445–452. [Google Scholar] [CrossRef]
  76. Kadam, P.C.; Boone, D.R. Influence of pH on Ammonia Accumulation and Toxicity in Halophilic, Methylotrophic Methanogens. Appl. Environ. Microbiol. 1996, 62, 4486–4492. [Google Scholar] [CrossRef]
  77. Filer, J.; Ding, H.H.; Chang, S. Biochemical methane potential (BMP) assay method for anaerobic digestion research. Water 2019, 11, 921. [Google Scholar] [CrossRef]
  78. Bonk, F.; Popp, D.; Weinrich, S.; Sträuber, H.; Kleinsteuber, S.; Harms, H.; Centler, F. Intermittent fasting for microbes: How discontinuous feeding increases functional stability in anaerobic digestion 06 Biological Sciences 0605 Microbiology. Biotechnol. Biofuels 2018, 11, 274. [Google Scholar] [CrossRef]
  79. Toreci, I.; Droste, R.L.; Kennedy, K.J. Mesophilic Anaerobic Digestion with High-Temperature Microwave Pretreatment and Importance of Inoculum Acclimation. Water Environ Res. 2011, 83, 549–559. [Google Scholar] [CrossRef]
  80. Ghanimeh, S.; El Fadel, M.; Saikaly, P. Mixing effect on thermophilic anaerobic digestion of source-sorted organic fraction of municipal solid waste. Bioresour. Technol. 2012, 117, 63–71. [Google Scholar] [CrossRef]
Figure 1. Scheme of the semi-continuous anaerobic digestion system used for the start-up phase, showing its different constituents. The system is composed of two identical reactors. The feeding module ensures the same feeding rate is distributed to both reactors.
Sustainability 17 05020 g001
Figure 2. Organic content and total volatile fatty acids (VFA) of the seven loads of sewage sludge (SS). Pink circles represent the volatile solids/total solids (VS/TS) of each of the seven loads of SS for each week of the experiment. E1, E2, and E3 denote the three feeding events applied in weeks 4, 7, and between weeks 9 and 10.
Sustainability 17 05020 g002
Figure 3. Variations of weekly means of gas production rate (GPR) and hydraulic retention time (HRT) (a), FOS/TAC and pH (b), and ammonia (c) in reactors R1 and R2.
Sustainability 17 05020 g003
Figure 4. Variations of weekly means of methane-based biodegradability (BdCH4) with the organic loading rate (OLR) (a) and volatile solid (VS) removal efficiency (b) in R1 and R2.
Sustainability 17 05020 g004
Figure 5. Correlation matrix between properties of the seven loads of sewage sludge (SS) and reactors’ parameters during the 17-week start-up of R1 and R2, with the level of significance (p-value).
Sustainability 17 05020 g005
Table 1. Description of the time and characteristics of the feeding events: event 1 (E1), event 2 (E2), and event 3 (E3).
EventWeekOLR Change
E14Increase from 0.97 to 2.43 g VS·d−1·Lreactor−1.
E27Increase from 2.87 to 3.36 g VS·d−1·Lreactor−1 followed by a rapid decrease to 2.85 g VS·d−1·Lreactor−1 after two days because of the reception of a different load of SS.
E39–10Increase of OLR to 4.42 g VS·d−1·Lreactor−1 followed by a decrease to 3.64 g VS·d−1·Lreactor−1 after reaching the full load HRT.
Table 2. Characterization parameters of feedstock and inocula. FM—fresh matter; aace—acetic acid equivalent; TS—total solids, and VS—volatile solids.
ParameterUnitSewage SludgePost-Treated InoculumFresh Thermophilic Inoculum
MinMaxMean
TS%FM5.17.25.8 ± 0.71.62.2
VS%FM4.15.34.6 ± 0.40.81.3
CODtg·L−153.3101.581.8 ± 15.613.314.9
Ammoniamg·L−186.1279.0138.0 ± 65.72140.01898.0
pH-5.346.035.60 ± 0.218.418.91
Alkalinityg·L−11.592.261.92 ± 0.2711.9010.47
VFA *g aace·L−16.4610.428.16 ± 1.551.941.65
TKNg·L−11.702.802.25 ± 0.352.392.07
TNmg·L−11.792.912.34 ± 0.392.442.12
C%TS36.8341.8039.55 ± 1.78--
H%TS5.226.055.65 ± 0.29--
O%TS27.8832.7031.08 ± 1.60--
N%TS3.254.393.80 ± 0.35--
S%TS0.380.540.45 ± 0.05--
C/N-9.0712.0710.53--
B0-thNmL·(gVS)−1461.30508.38489.43 ± 17.05--
* VFA was measured as mg of aace per L.
Disclaimer/Publisher’s Note: The statements, opinions and data contained in all publications are solely those of the individual author(s) and contributor(s) and not of MDPI and/or the editor(s). MDPI and/or the editor(s) disclaim responsibility for any injury to people or property resulting from any ideas, methods, instructions or products referred to in the content.

