Article

Predicting Soil Organic Carbon Stocks Under Native Forests and Grasslands in the Dry Chaco Region of Argentina

1
Centro de Investigaciones y Transferencia (CIT), Formosa, Consejo Nacional de Investigaciones Científicas y Técnicas (CONICET), Ruta 11 km 1164, Formosa 3600, Argentina
2
Instituto Nacional de Tecnología Agropecuaria (INTA), Ruta 89 km 227, Las Breñas H3722, Argentina
3
Instituto Nacional de Tecnología Agropecuaria (INTA), Ciudad de Buenos Aires C1033AAE, Argentina
4
Unidad Academica Rio Gallegos, Departamento de Ciencias Naturales, Universidad Nacional de la Patagonia Austral (UNPA), Consejo Nacional de Investigaciones Científicas y Técnicas (CONICET), Río Gallegos 9400, Argentina
5
Instituto de Investigación Animal del Chaco Semiárido (IIACS-CIAP-INTA), Chañar Pozo s/n, San Miguel de Tucumán 4113, Argentina
6
Facultad de Agronomía, Zootecnia y Veterinaria (FAZ-UNT), Universidad Nacional de Tucumán, Avenida Gral. Roca 1900, San Miguel de Tucumán 4000, Argentina
7
Independent Researcher, Terratio, San Miguel de Tucumán 4000, Argentina
8
Independent Researcher, Pujato 3764, Roldan 2134, Argentina
9
Instituto Nacional de Tecnología Agropecuaria (INTA), Ruta 226 km 73,5, cc 276, Balcarce 7620, Argentina
10
Facultad de Ciencias Exactas y Naturales, Universidad Nacional de Mar del Plata, Funes 3350, Mar del Plata 7600, Argentina
11
Grasslands Research Centre, AgResearch Ltd., Tennent Drive, Private Bag 11008, Palmerston North 4442, New Zealand
*
Author to whom correspondence should be addressed.
Sustainability 2025, 17(11), 5012; https://doi.org/10.3390/su17115012
Submission received: 1 April 2025 / Revised: 22 May 2025 / Accepted: 27 May 2025 / Published: 29 May 2025
(This article belongs to the Section Sustainable Agriculture)

Abstract

Soil organic carbon (SOC) stocks play an important role in ecosystem functioning and climate regulation. These stocks are declining in many tropical dry forests due to land-use change and degradation. Data on topsoil (0–300 mm) organic C stocks from six experiments conducted in the Dry Chaco region, the world’s largest dry tropical forest, were used to test the predictive performance of the Rothamsted Carbon Model (RothC) after its implementation in an object-oriented graphical programming language. RothC provided promising predictions (i.e., precise and accurate) of the SOC stocks under two representative land covers in the region, native forest and Rhodes grass [relative prediction error (RPE) < 10%, concordance correlation coefficient (CCC) > 0.9, modelling efficiency (MEF) > 0.7]. Comparatively, model predictions of the SOC stocks under degraded Rhodes grass swards were suboptimal. The predictions were sensitive to C inputs; under native forests and Rhodes grass, a high C input improved the predictive performance of the model by reducing the mean bias and increasing the MEF values, compared with mean and low C inputs. Larger datasets and revisiting some of the underlying assumptions in the SOC modelling will be required to improve the model’s performance, particularly under the degraded Rhodes grass land cover.

1. Introduction

Soils play a crucial role in the global carbon (C) cycle, serving as the largest reservoir of organic C on Earth. Within the top meter of the soil, there are approximately 1500 to 2500 petagrams (Pg) of C [1], which is about twice as much as that in the atmosphere, and about three times more than that in vegetation [2]. However, these SOC reserves are highly susceptible to environmental changes resulting from land use practices. Actions such as maintaining continuous soil cover, practicing integrated nutrient management, and restoring degraded ecosystems can enhance the removal of carbon dioxide (CO2) from the atmosphere. By contrast, practices that have negative impacts, such as converting natural ecosystems into managed ones, can exacerbate C release [3].
In tropical dry regions, such as the Dry Chaco, the upper soil layer (0–1 m) accounts for 136 of a total of 1416 Pg of SOC stocks globally [4]. Notably, in these regions, the soil stores about 75% of the total terrestrial carbon (compared to 43 Pg in phytomass), highlighting the key role of soils in the regional carbon balance. It has been reported that approximately 50% of the SOC stocks in the Dry Chaco region are located in the top 300 mm of the soil [5]. The Intergovernmental Panel on Climate Change (IPCC) has emphasized the critical importance of the SOC in the upper layer (0–300 mm) because it is the more chemically decomposable and directly exposed to both natural and anthropogenic-induced disturbances [6].
The Dry Chaco region is the largest (787,000 km2) dry forest in the world [7], with about 80% of its annual rainfall occurring between October and March, ranging from 450 to 1000 mm per year from west to east, respectively [8]. This region includes not only forests but natural grasslands, savannas, scrublands, and wetlands. However, only 12% of the area is under protection [9], despite having experienced some of the highest global deforestation rates over the past two decades [10]. In the southern semiarid Chaco, the total ecosystem carbon varies across different ecosystems (i.e., primary forest, secondary forest, closed/open shrubland, and cropland), with higher values in more conserved ecosystems. However, carbon stocks were reduced by approximately 52% in neighboring croplands when compared with primary forests [11]. Predominantly situated in Argentina, the remaining area is shared between Bolivia and Paraguay. Historically, the Dry Chaco region has seen land use dominated by activities such as woodland exploitation, crop expansion, and cattle production [12,13]. Cattle farming, in particular, relies mainly on native grasslands as well as exotic tropical pastures [14], with Rhodes grass (Chloris gayana) as one of the most common exotic species [15]. Cropping and cattle production, deforestation, and land use changes have significantly contributed to the reduction of the SOC stocks in the region [5,16]. To comprehend the SOC dynamics in the region, it is essential to understand the interplay between specific environmental conditions and land use; regrettably, there is limited information available for the Dry Chaco region [17].
Process-based models have been successful in capturing the dynamics and monitoring of the SOC stocks [18]. These mathematical representations seek to quantify and improve our understanding of soil processes while accounting for spatiotemporal variability arising from different environmental conditions [19]. However, it is important to note that not all factors and mechanisms influencing SOC dynamics are captured by these models [20]. Predicted estimates of the SOC stocks (used herein as a proxy for the SOC dynamics) depend on the availability of the observed data (environmental and management), which enable model calibration and evaluation using locally observed data [21]. One such model, the Rothamsted Carbon Model (RothC), offers a simple yet effective means to predict changes in the SOC stocks, incorporating soil type, weather data, and plant cover as inputs at a monthly time step [22]. RothC is considered to be one of the top five models used worldwide to assess SOC dynamics [19].
RothC has been applied to various ecosystems around the globe, including grasslands and forests (e.g., Germany, England, USA, Czech Republic, Australia) [22] and shrublands (e.g., England, Spain) [23]. It has also been used across a range of climates, such as tropical [22], temperate [24], and dryland regions [25]. Despite its widespread use, RothC presents limitations in simulating the SOC dynamics in semiarid regions, most likely attributed to carbon inputs, soil moisture, and evaporation [25]. However, dry tropical forests, characterized by stronger seasonality of precipitation and historical land use change [9,10], have received comparatively less attention than other land cover types [26], which could suggest that fewer models related to the SOC (e.g., RothC) have been used in these regions; significant uncertainties remain regarding both the current and projected carbon stocks and fluxes [27,28]. These uncertainties highlight the need to test and adapt RothC in regions like the Dry Chaco, where reliable SOC modelling is critical for carbon accounting and land management under global change scenarios. RothC has been extended to other programming languages, such as R-code [29]; but, to our knowledge, it is yet to be implemented using an object-oriented graphical programming language. This development could prove valuable insights complementing other simulation models that use similar programming languages [30].
In Argentina, the predictive ability of RothC was considered to be adequate to predict the SOC stocks under different crop–grass alternatives in the southeastern Pampas region [31]. In the Dry Chaco region, both RothC [32] and CENTURY [33] have been used to estimate the SOC stock changes in cropland, grasslands, and forests [32], as well as the SOC changes under contrasting rainfall and management practices [33]. In both studies, however, emphasis was placed on scenario testing rather than on model validation and identifying gaps that prevent optimal parameterization of process-based models. Data on the SOC stocks and C inputs, and the soil characteristics under the representative land uses, such as native forests (Animal Research Institute of Semiarid Chaco (IIACS); unpublished data) and tropical pasture ([34]; IIACS; unpublished data), have been collected in the Dry Chaco region since 2007. These measurements provide a robust foundation for running the RothC model. Therefore, the objective of this paper was to validate the RothC model for predicting the SOC stocks under native forests or grasslands predominantly in tropical grasses, such as Rhodes grass (Chloris gayana), in the Dry Chaco region of Argentina.

2. Materials and Methods

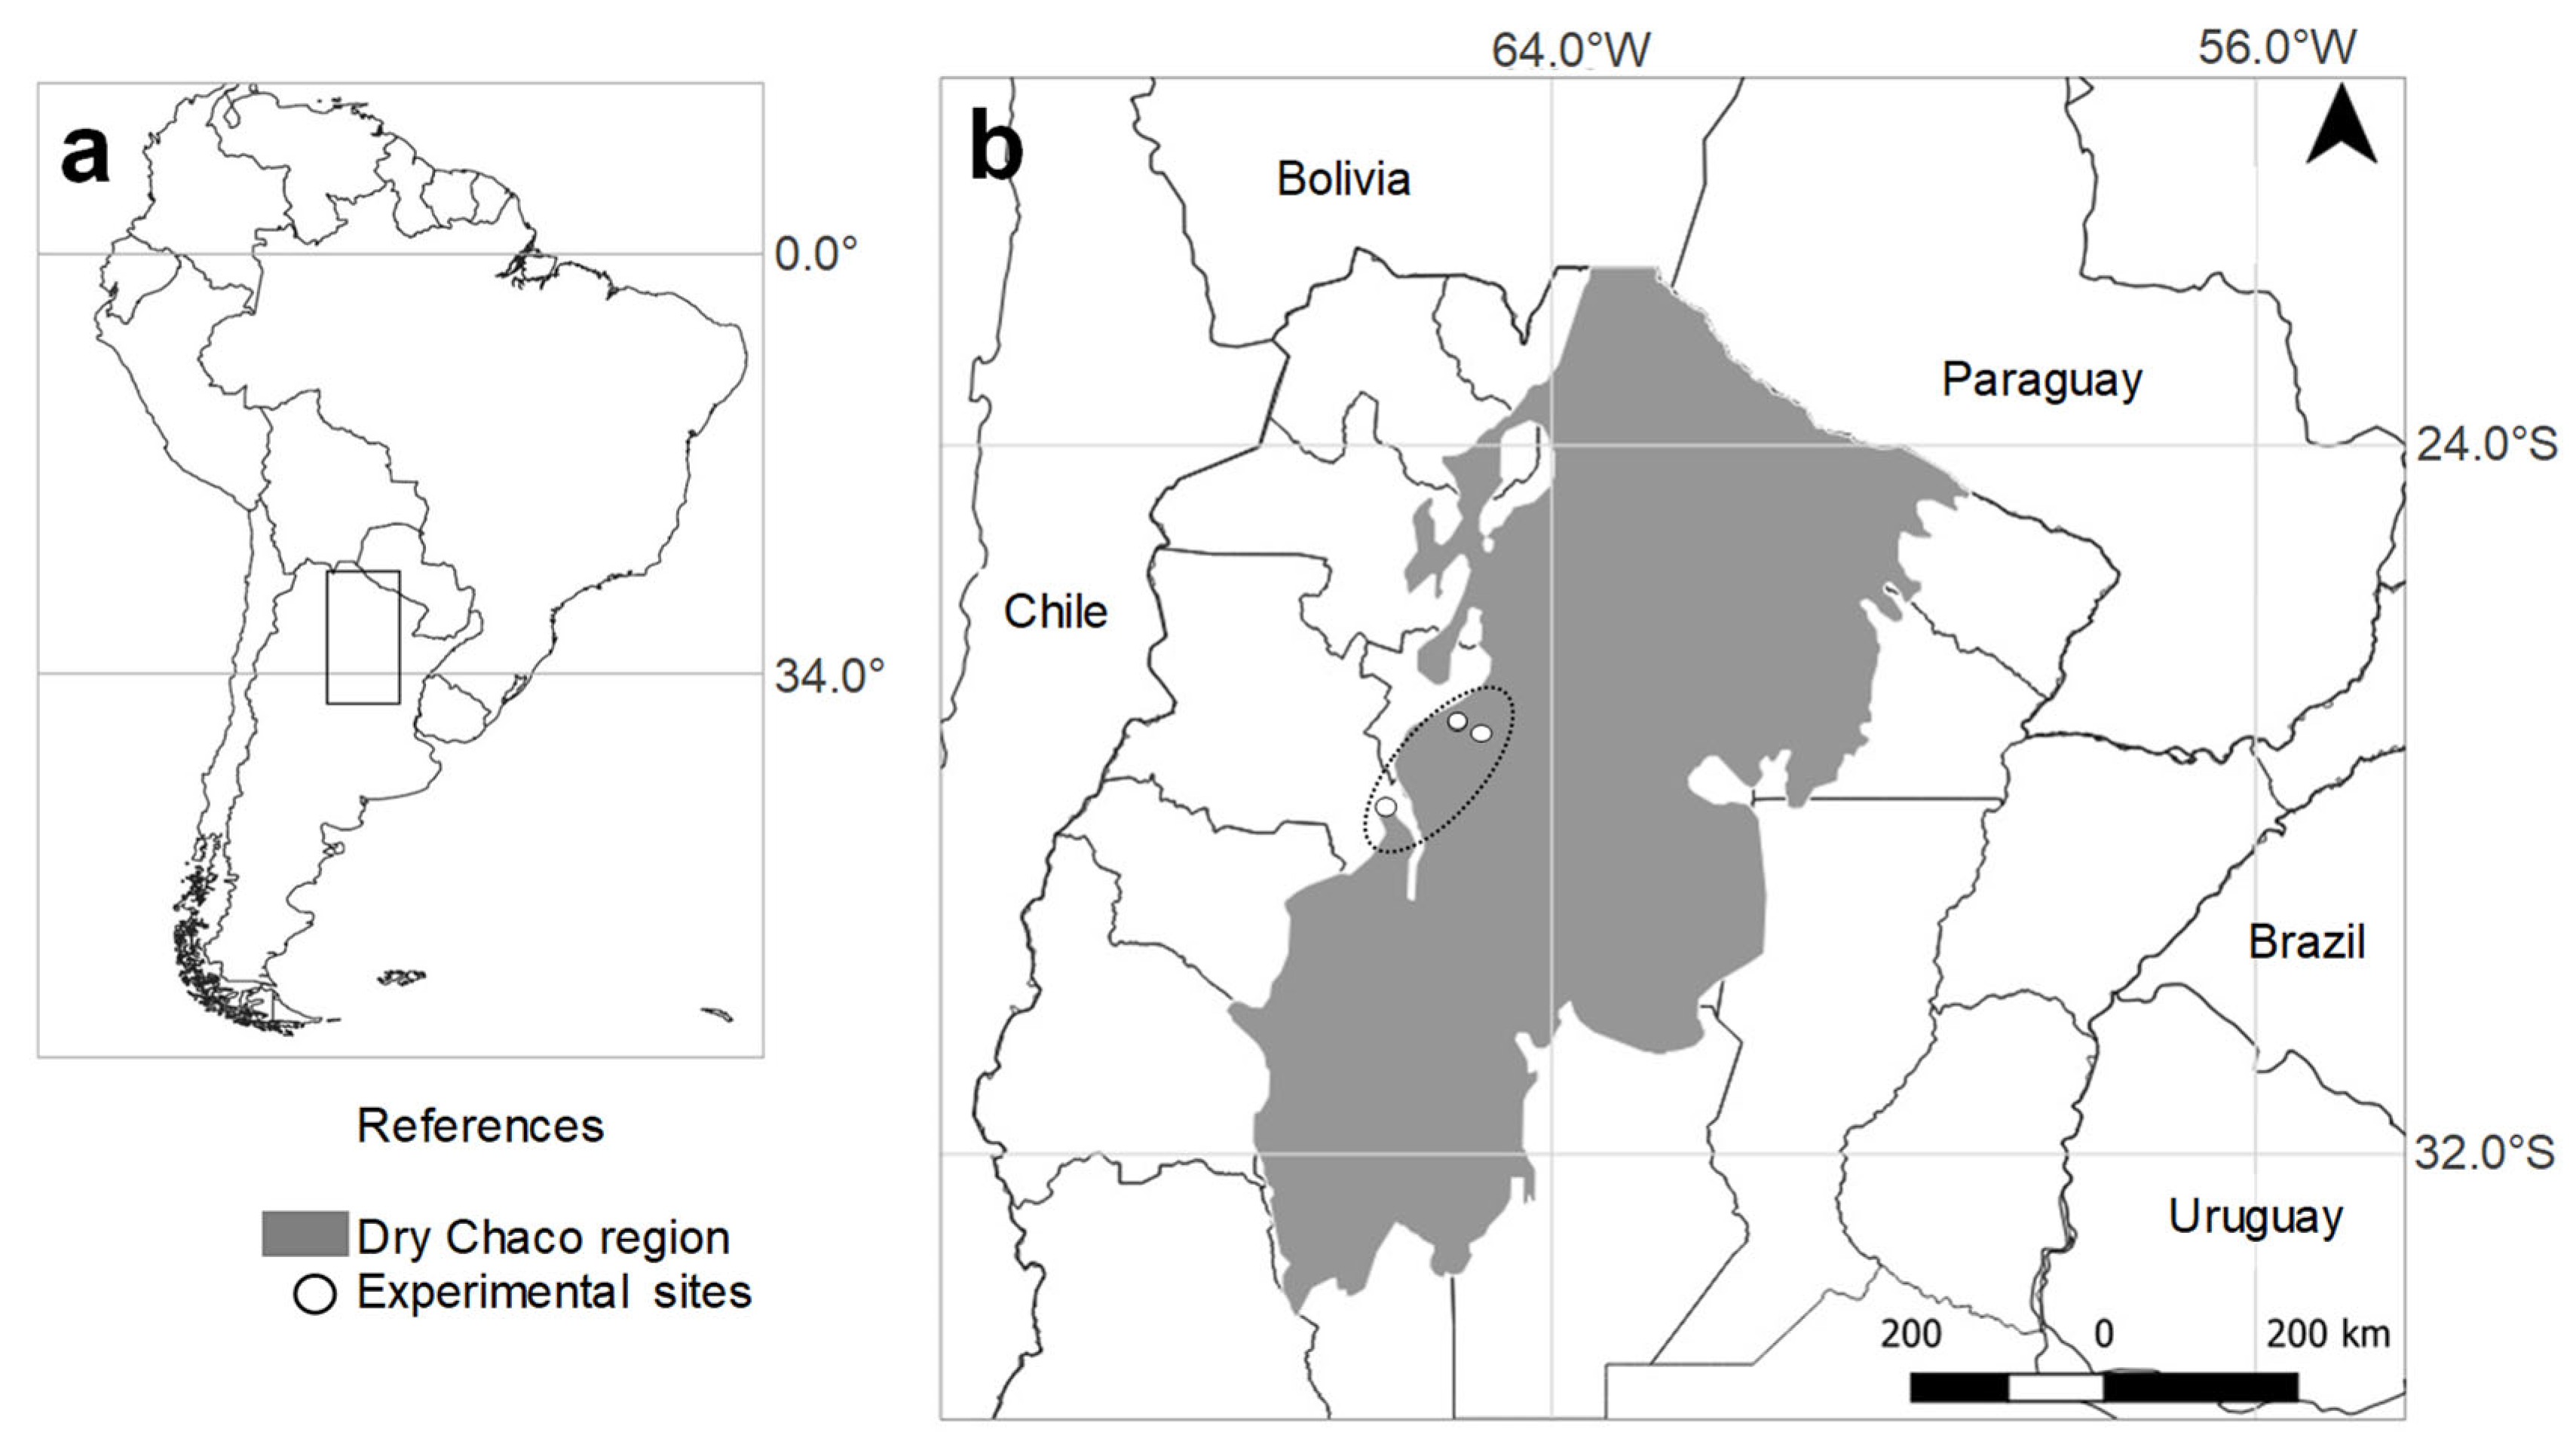
2.1. Experimental Sites and Description of Datasets

Data were compiled from six experiments conducted at the Animal Research Institute of Semiarid Chaco (IIACS) of the National Institute of Agricultural Technology (INTA) in Tucumán, within the Dry Chaco region of Argentina (Figure 1). The climate in the Dry Chaco region is categorized as subtropical subhumid, with a well-defined dry winter season (April to October). The region has a long-term mean annual precipitation of 924 mm (mainly from October to March) and an interannual coefficient of variation of 35%. The mean annual potential evapotranspiration is 1379 mm, and the mean annual temperature is 19 °C, ranging from 26 °C in January to 13 °C in July (source: IIACS’s weather station, 27°11′ S, 65°17′ W, 335 m above sea level). All experiments were conducted on Mollisol soils, a prominent soil order in the Dry Chaco region [9,35] (Table 1). The soil type corresponds to Fluvaquentic Haplustolls (Textural class: Loam and Silt Loam) following the USDA Soil Taxonomy System (Soil Survey Staff, 2022. Keys to Soil Taxonomy, 13th edition. USDA Natural Resources Conservation Service. Available at www.nrcs.usda.gov). The soils in the region are characterized by developing on gentle slopes, a dark surface horizon rich in organic matter and close to neutral pH, and sensitive to changes in vegetation cover, with deforestation resulting in reduced water availability, and a weakening of the water cycle.
The following experiments and experimental sites were considered to assess the ability of the RothC model to predict the SOC stocks under different land covers in the Dry Chaco region.
Experiments 1 (27°11′39.62″ S, 65°13′54.29″ W), 2 (27°11′42.12″ S, 65°13′49.68″ W) (IIACS; unpublished data), and 3 (3a; 27°11′39.21″ S, 65°13′49.07″ W; [34]) represent a native land cover condition (secondary ecological succession) (Table 1).
Experiments 3 (3b–2e; 27°11′38.72″ S, 65°13′58.37″ W; [34]) and 4 (27°12′32.78″ S, 65°13′56.24″ W; [37]) included common agronomic management practices applied to Rhodes grass (Chloris gayana cv Finecut), the most popular grass in the Dry Chaco region (Table 1).
Experiments 5 (27°11′35.24″ S, 65°13′46.36″ W) and 6 (27°12′29.04″ S, 65°13′49.76″ W) were chosen to depict the common situation of degraded Rhodes grass found on many cattle farms in the Dry Chaco region (i.e., an annual yield of about 4 Mg dry matter (DM) ha−1 vs. 8 Mg DM ha−1 was achieved in Experiment 2a) (IIACS; unpublished data) (Table 1).
Soil samples (Table 1) were collected from experimental plots as repeated measures over time (Experiments 1, 2, 5, and 6) and under two distinct scenarios: one with 16 plots and the other one with 12 plots [34,37]. In the first scenario, each treatment was replicated four times (four replicates per treatment); while in the second scenario, six replicates were established per treatment. In all cases, composite samples were formed by mixing individual subsamples (from at least six samples at each site), collected from 0 to 300 mm soil depth (consistent with RothC input requirements) within each plot, ensuring thorough homogenization. Sampling was performed using a stainless-steel auger following a randomized grid design. Soil samples were air-dried at room temperature, then sieved through a 2-mm mesh to remove stones, coarse roots, and any other litter material. The SOC concentrations were determined using the Walkley–Black wet oxidation method [38].
To estimate the SOC stocks in Mg per hectare, a volumetric conversion was conducted using bulk density. The soil bulk density was estimated by dividing the total dry weight by the total volume, and was used to calculate the SOC stocks according to the following equation:
SOCi stock (Mg C ha−1) = OCi × BDfinei × (1 − vGi) × ti × 0.1
  • where,
  • SOCi = soil organic carbon stock (in Mg C ha−1) of the depth increment i,
    OCi = organic carbon content (Mg C g soil−1) of the fine soil fraction (<2 mm) in the depth increment i,
  • BDfinei = the mass of the fine earth per volume of fine earth of the depth increment i (g fine earth cm−3 fine earth = dry soil mass [g] − coarse mineral fragment mass [g])/(soil sample volume [cm3] − coarse mineral fragment volume [cm3]),
  • vGi = the volumetric coarse fragment content of the depth increment i,
  • ti = thickness (depth, in cm) of the depth increment i,
  • 0.1 = conversion factor for converting Mg C cm−2 to Mg C ha−1.

2.2. Simulation Model

We used the RothC model v.26.3 [39]. The model has four active SOC pools, each quantifying different components: decomposable plant material (DPM), resistant plant material (RPM), microbial biomass (BIO), and humified organic matter (HUM) [40]. Additionally, the model includes an inert organic matter (IOM) pool which is resistant to decay. The RothC model partitions incoming plant residues into DPM and RPM based on the DPM/RPM ratio specific to the plant material. For our study, we adopted the suggested values for the DPM/RPM ratio [39] for tropical woodlands (0.25), improved grasslands (1.44), and unimproved grasslands (0.67).
Plant material decomposes resulting in the production of CO2, BIO, and HUM. All active pools undergo decomposition through first-order kinetics, each with its characteristic decomposition rate. This rate is modified according to soil moisture, temperature, and the soil surface vegetation cover for a given month. The soil clay content also affects the partition between CO2 and BIO + HUM formation. The RothC model is designed to run in two modes: “inverse”, when C is calculated at an equilibrium state from a known SOC stock, and “forward”, which uses C inputs to calculate changes in the SOC stocks.
We programmed RothC to run in Powersim Studio 10® (Psim), making it compatible with models developed on a similar programming language. Psim is an object-oriented graphical programming language designed specifically to model dynamic systems [41]. Systems dynamics is a methodology that provides a theoretical framework to understand and model complex systems [42]. Knowledge of system variables, such as stocks, flows, auxiliaries, and constants, is needed to build a dynamic model and to establish the appropriate connections between them [42] (Figure 2).
In this framework, levels represent accumulations within the land use systems. Therefore, the active SOC stock pools (DPM, RPM, BIOM, and HUM) were considered to be levels. Auxiliaries are host values or functions used in the model, encompassing variables like ambient temperature, soil moisture, soil surface vegetation cover, soil depth, C inputs, soil clay content, and IOM. Links establish a relationship among various elements of the model, enabling the transfer of information through arrows in different directions (e.g., from auxiliary to auxiliary, from auxiliary to flows, from auxiliary to levels, or from constants to auxiliary). Finally, constants represent fixed information throughout the simulation, such as the DPM/RPM ratio and the decomposition rate (Figure 2).

2.3. Calculation of C Inputs

The C inputs needed to match the initial estimate of the SOC stocks were calculated by running the model in the “inverse” mode [40]. We used the DPM/RPM ratios of 0.25 (tropical woodlands), 1.44 (improved grasslands), and 0.67 (unimproved grasslands). In the next step, we ran the model in “forward” mode using the C inputs from each experiment.
Aboveground C inputs were calculated monthly from the litter measurement (Experiments 1, 3, 4, and 5), defined as dead plant material deposited on the soil surface and no longer attached to the plant [43]. For Experiments 2 and 6, where litter measurements were unavailable, we assumed a 15% increase in the C input for Experiment 2 relative to Experiment 1, and a 15% reduction for Experiment 6 relative to Experiment 3b, based on expert opinion (Banegas, N., IIACS, personal communication). Litter (Mg litter DM ha−1 month−1) was converted to C using the IPCC-recommended conversion factors (40% for grass and 50% for subtropical forest) [6]. We also assumed a similar aboveground organic matter (OM) formation efficiency factor (% of C inputs retained in the SOC) of 7 ± 3% (mean ± standard deviation) for grass/crops and forest conditions [44].
Belowground C input (roots + rhizodeposition) for Experiments 1, 2, and 3a without measurements, we estimated the belowground C inputs by assuming a root/aboveground ratio of 29 ± 3% (top–1000 mm) [45], and a proportion of roots in the top layer (0–300 mm) of 70% [46]. Belowground C input (roots + rhizodeposition) was annually measured in Experiment 3 (3b–3e), and we used a regression curve to estimate the monthly C inputs. For Experiments 4, 5, and 6 without measurements, we estimated the belowground C inputs by assuming a root/aboveground ratio (calculated by dividing the belowground biomass by the aboveground biomass) of 81 ± 7% (suggested for tropical grass [47]), and a proportion of roots in the top layer (0–300 mm) of 83% [46]. The belowground C input (roots + rhizodeposition) was converted using the IPCC conversion factors (50% for subtropical forest and 40% for grass) [6]. We considered the belowground OM formation efficiency of 49 ± 11% for forest, and 50 ± 6% for grass [44].

2.4. Evaluation of the Model’s Performance

We assessed the predictive ability of the model using several indicators from a comparison of the observed vs. the predicted values. The root mean squared error of prediction (RMSEP; Mg SOC ha−1) quantifies the difference between the observed values and the model-predicted values (Equation (1)).
R M S E P = i = 1 n ( O i P i ) 2 n
where Oi is the observed value, Pj is the model-predicted value, and n is the number of data points.
Lower RMSEP values indicate better simulation accuracy [48]. To gauge the relative prediction error (RPE; %), we considered the relationship between the RMSEP and the mean observed values. An RPE value below 10% indicates a good prediction of the model, while values between 10% and 20% suggest reasonable predictions, and values greater than 20% suggest poor predictions [49]. The RMSEP was further partitioned into three sources of error: error due to bias (the most accurate model exhibits a mean bias error close to 0), error due to the deviation of regression between the observed and predicted values being different from 1 (slope bias), and random error, the latter representing the error unexplained by the model. A robust model should have a small bias component and most of the error partitioning in the random category [48].
We also assessed the association between the observed and predicted values using the coefficient of determination (R2), which quantifies the model’s precision by indicating how much of the variance in the observed values is predicted by the model (Equation (2)).
r = 1 i = 1 n ( O i P i ) 2 i = 1 n ( O i P ) 2
where Oi is the observed value, Pi is the model-predicted value, and P is the mean of the model-predicted values.
We also calculated the concordance correlation coefficient (CCC), an indicator of both the accuracy and precision of the model [50], which provides a measure of the deviation of the slope of regression of the observed vs. the predicted values relative to 1 (perfect agreement); values closer to 1 indicate a more accurate and precise prediction (Equation (3)).
C C C = 2 x s C s D O 2 + s D P 2 + ( O i P i ) 2
where SC is the covariance between the observed and predicted values, SDO is the standard deviation of the observed values, SDP is the standard deviation of the model-predicted values, Oi is the observed value, and Pi is the model-predicted value.
Modelling efficiency (MEF), a dimensionless statistic based on the sum of squares, is used to depict the degree to which deviations approach zero, providing information about the accuracy of the model [21]. An MEF value greater than 0 is crucial to provide a realistic simulation, as negative values indicate that the model-predicted values are worse than the observed mean, and values close to 1 suggest reasonable to good predictive ability [21] (Equation (4)).
M E F = 1 i = 1 n ( O i P i ) 2 i = 1 n ( O i O ) 2
where Oi is the observed value, Pi is the model-predicted value, and O is the mean of the observed values.
All analyses for the model’s performance evaluation were conducted in Model Evaluation System v 3.2.4 (Texas A&M University) [48].
Prior to evaluating the model, we grouped Experiments 1 to 3a, 3 (3b–3e) to 4, and 5 and 6 according to similar land cover types: native forest, Rhodes grass, and degraded Rhodes grass, respectively. This categorization allowed us to assess the overall model performance. The C inputs estimation is the most important, yet most uncertain, to predict the SOC stocks by RothC [51]. Therefore, in our work, we used the mean values and standard deviations reported for two key parameters (i.e., the OM formation efficiency factor and the root/aboveground ratio) to represent the mean C input (MCI; mean value), the high C input (HCI; mean value plus one standard deviation), and the low C input (LCI; mean value minus one standard deviation) scenarios (Table 2). Our goal was to identify associations between the goodness of fit and land cover types (native forest, Rhodes grass, and degraded Rhodes grass) using three C input estimates. We applied the mean value ± one standard deviation to estimate the C input (Table 2), representing approximately 68% of the values in a normal distribution for the C input. In a second evaluation, we employed the suggested value (MCI, HCI, or LCI) from the previous step to evaluate the model’s goodness of fit for each individual experiment.

3. Results and Discussion

The main objective of our study was to evaluate the performance of the RothC model, which demonstrated good accuracy in the prediction of the SOC stocks under native forests and Rhodes grass. Additionally, we found that the model was highly sensitive to C input levels across all land covers (i.e., native forest, Rhodes grass, and degraded Rhodes grass). The model slightly underestimated the SOC stocks in areas with higher initial C stocks. Importantly, the model was successfully implemented in a new programming language, likely to expand its use in collaboration with other models developed in similar programming languages.

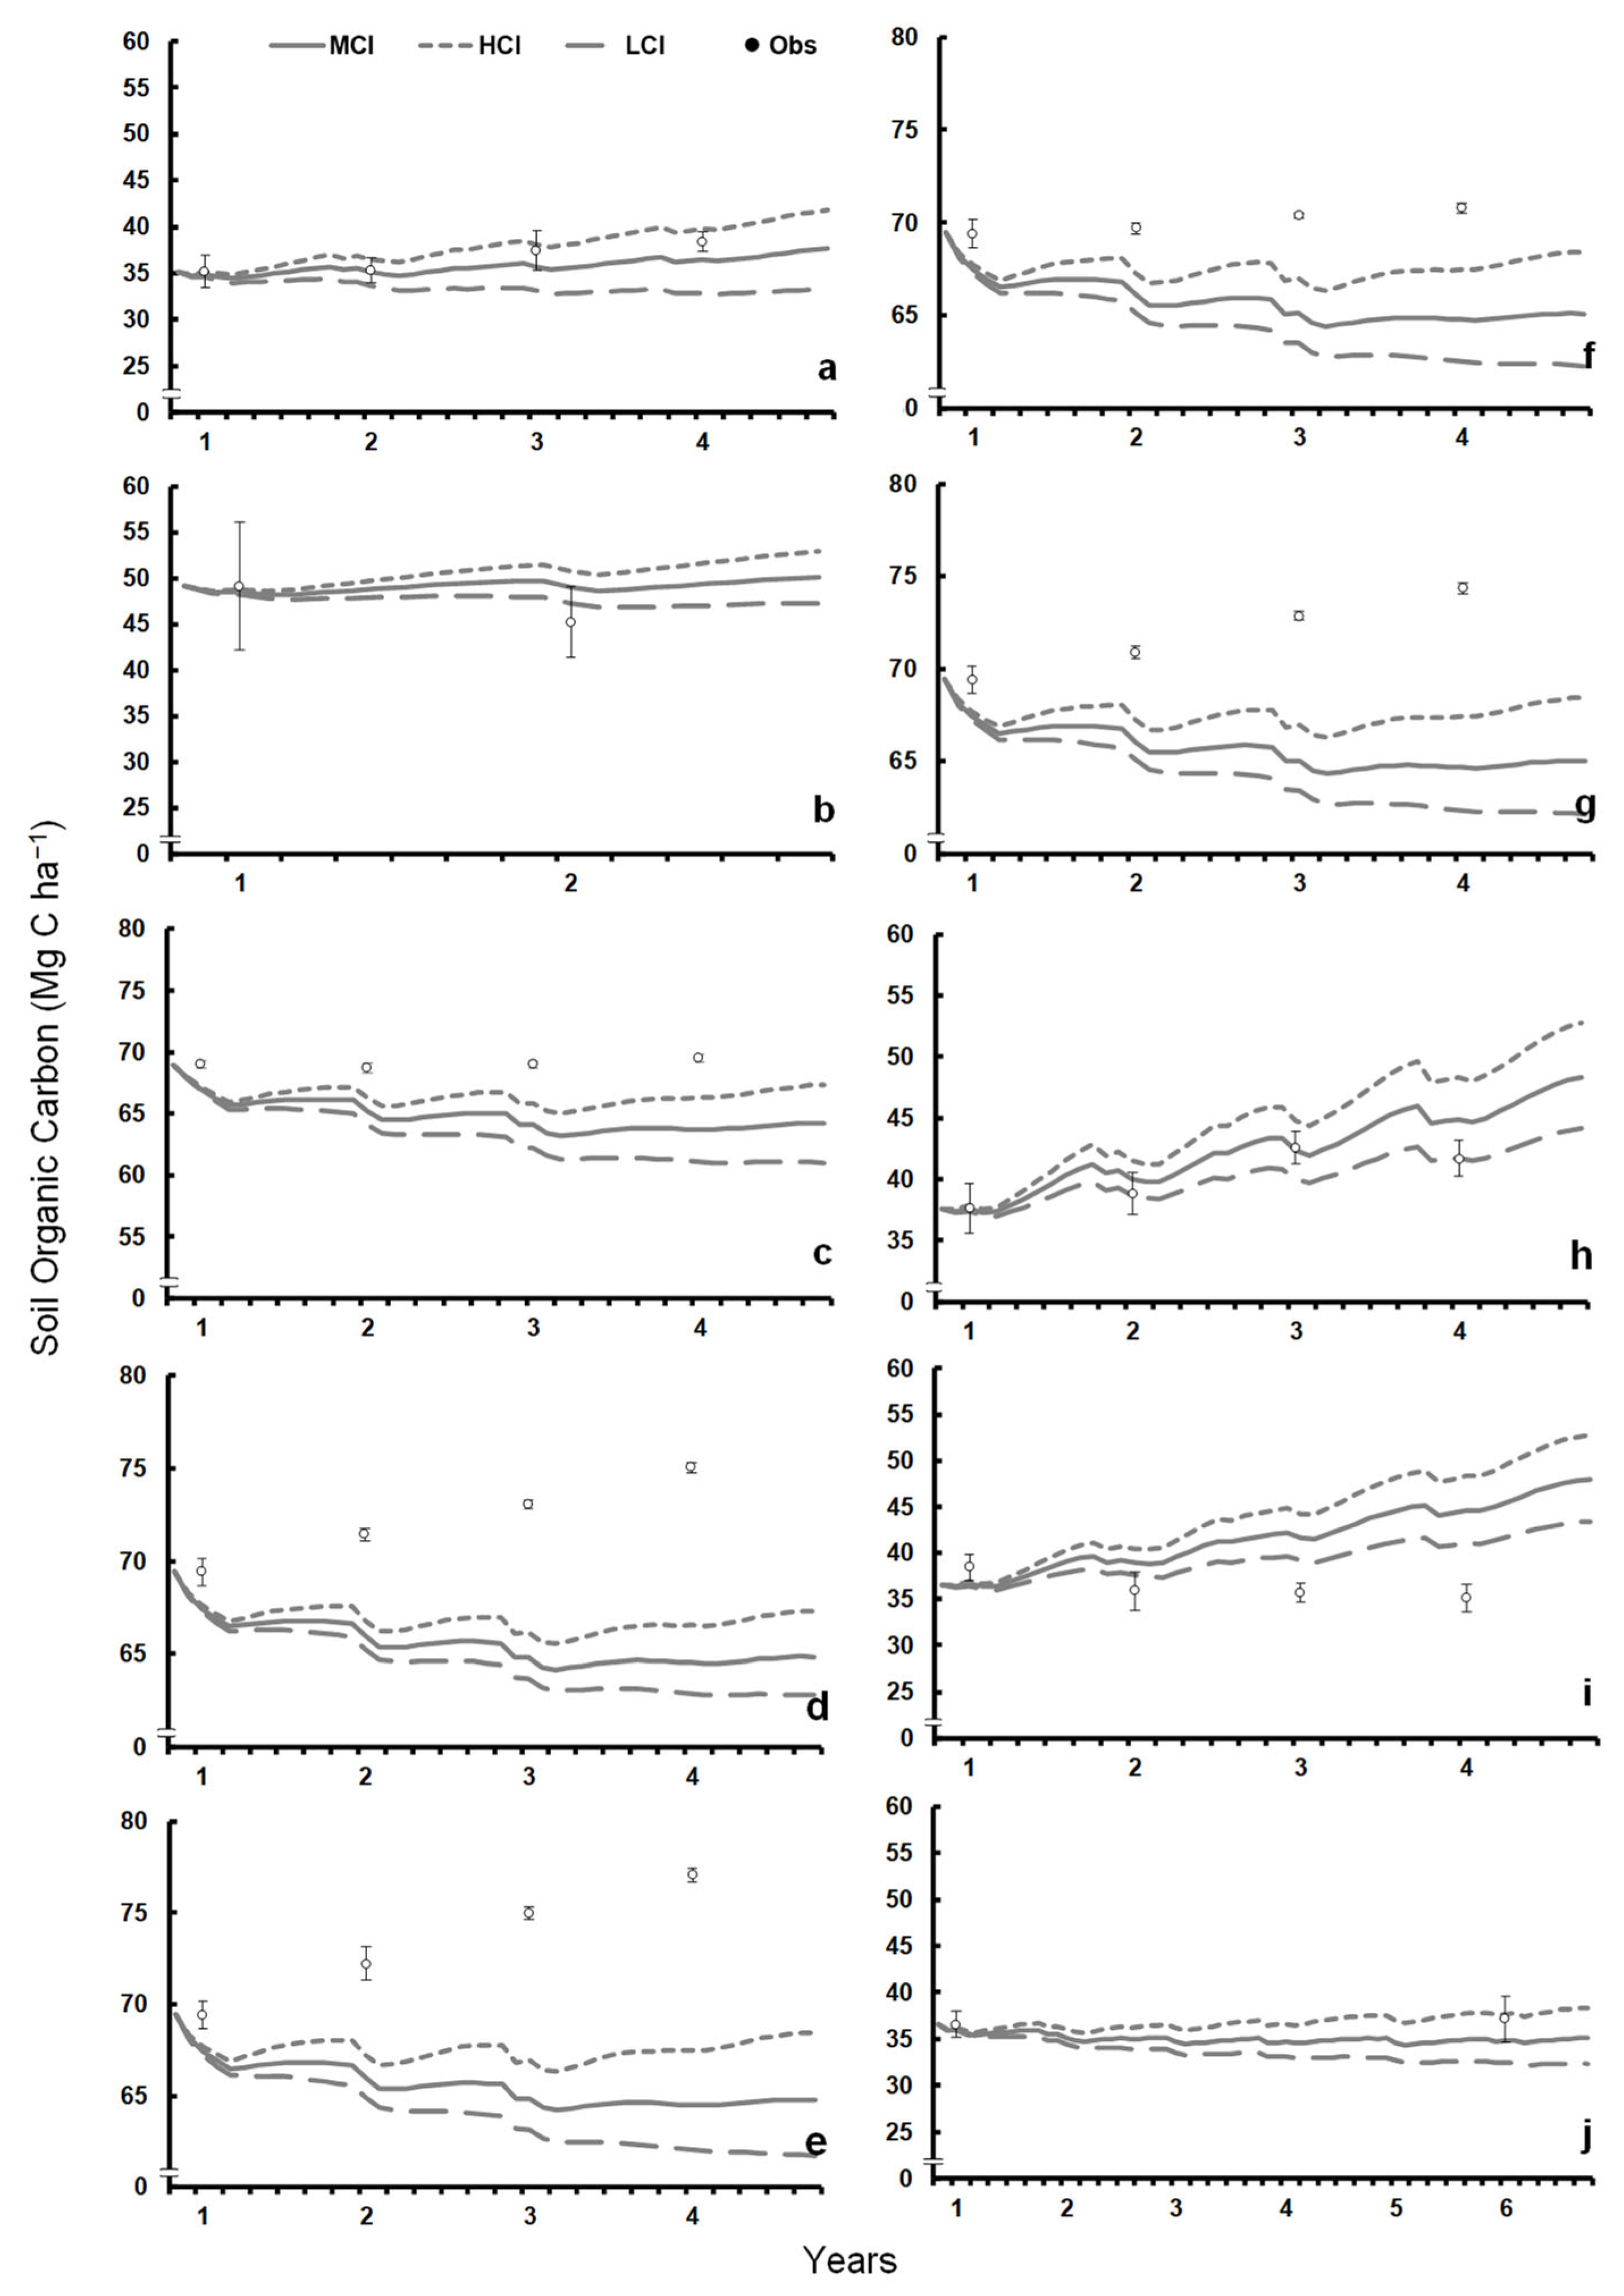
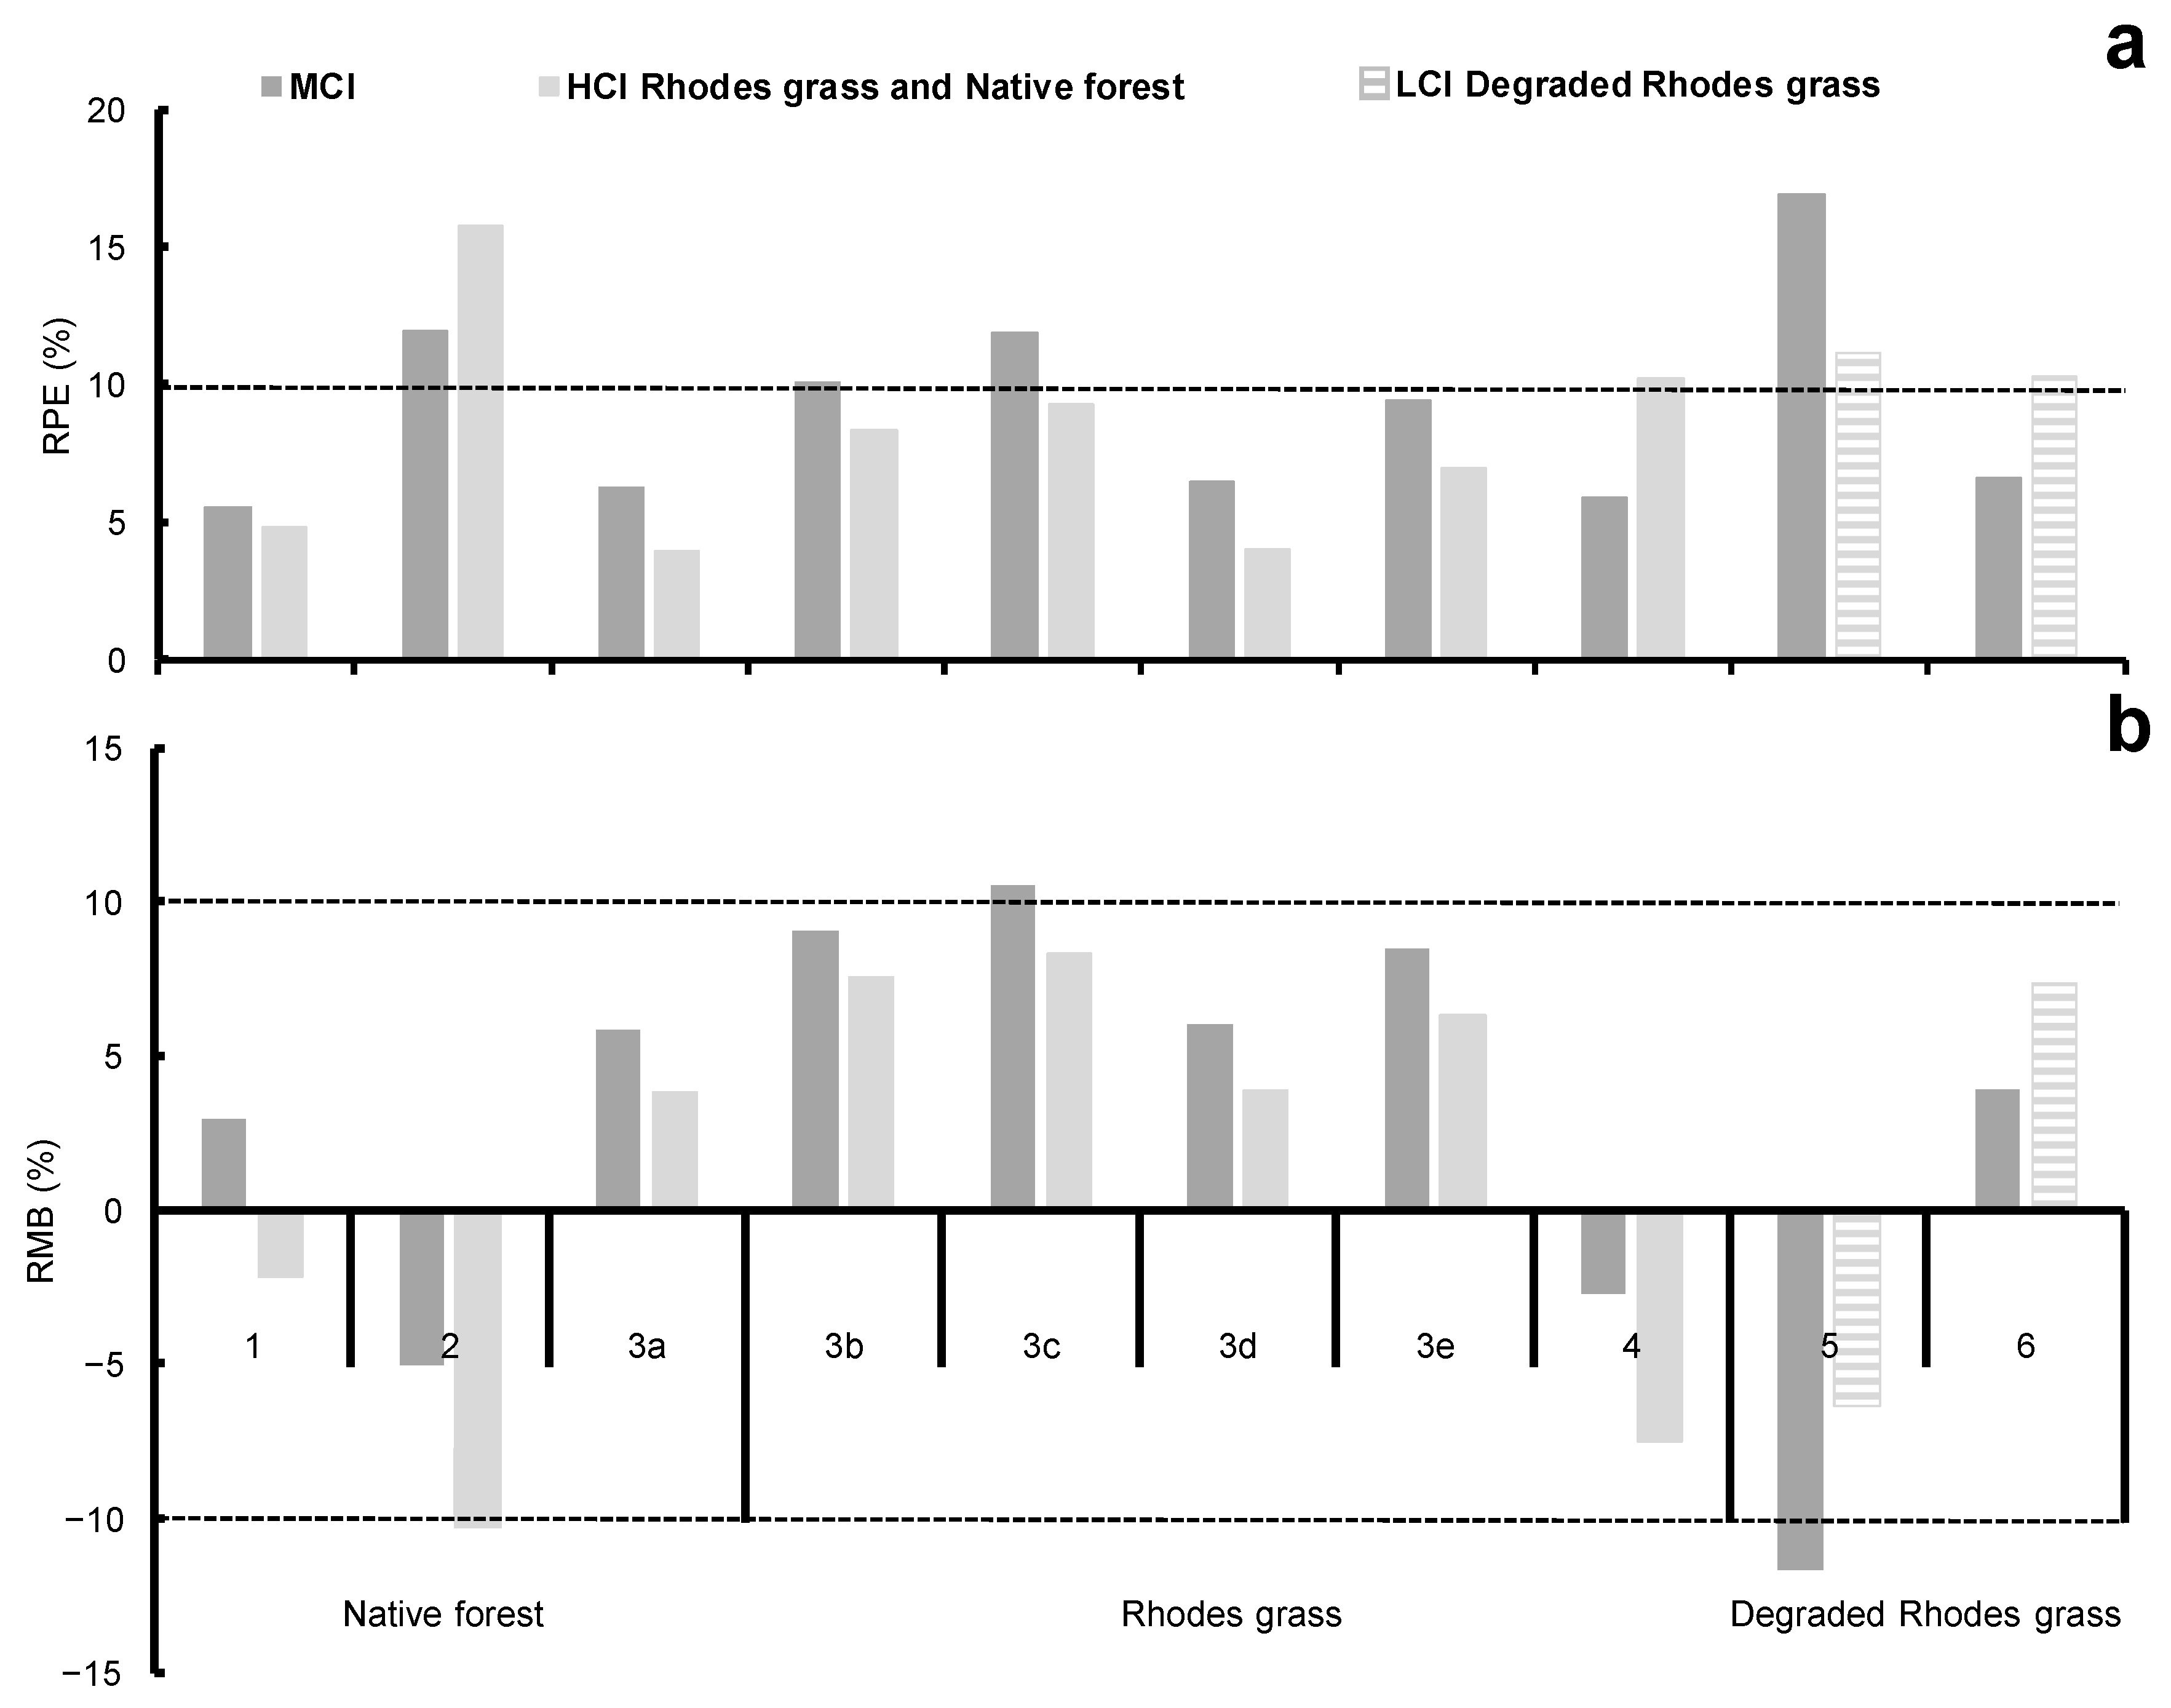
3.1. Model Performance by Land Cover Type

In the top 300 mm, mean (± standard deviation) the SOC stocks were 48.2 (±14.6), 59.7 (±15.6), and 36.7 (±1.9) Mg ha−1 for native forests, Rhodes grass, and degraded Rhodes grass land covers, respectively (Table 3). Based on a comparison of the observed vs. the predicted values, RothC provided promising predictions (in terms of both precision and accuracy) of the SOC stocks under two (out of three) representative land covers of the Dry Chaco region (Table 3). The RothC model predictions of the SOC stocks (0–300 mm) under native forests and Rhodes grass can be considered adequate (RPE < 10%, CCC > 0.9, R2 > 0.9, MEF close to 1). The range of the SOC stock values for this soil order are in agreement with the most frequent SOC stock values reported for the region under native forests (57.9 ± 37.4 Mg ha−1) and tropical pastures (64.8 ± 18.5 Mg ha−1) [17,52]. Collectively, these results indicate the potential usefulness of RothC in modelling the SOC stocks under these land covers in the region.
Land cover is inherently associated with land management, e.g., native vegetation in a secondary ecological succession with autochthonous trees, Rhodes grass with and without N fertilization grazed rotationally by steers or free of livestock and herbage made into hay, or Rhodes grass pastures with degraded swards. Prior work in the region assessing SOC stock dynamics identified C inputs as a key driver of the SOC stock changes [33]. In our study, with native forests and Rhodes grass, the high C input (HCI) improved the predictive performance of the model by reducing the mean bias and the RMSEP values, and increasing CCC, R2, and MEF values, compared with the MCI and the LCI (Table 3). Under the native forest, the best predictive performance by RothC occurred with high annual C inputs (4.7 Mg C ha−1) compared with the MCI (3.1 Mg C ha−1) and the LCI (1.6 Mg C ha−1). A mean annual C input value of 4.6 Mg C ha−1 was reported for Ultisols under a dry tropical forest in India with 821 mm of annual rainfall (~10% lower compared with our study) [53]. It is important to note, however, that the error partitioning towards a small bias component (% bias in Table 3) and a large random component (% random in Table 3) in the prediction of the SOC stocks under the native forest are a sign of a more robust prediction [48] compared with Rhodes grass, irrespective of the C input level.
In grasslands, in particular, plant C allocation patterns tend to be site-specific and vary strongly with the management regimes [51], as the C input plays a key role in determining the goodness of fit for this land cover type. Reportedly, the SOC stock changes under perennial subtropical ecosystems are largely controlled by the quantity and quality of the C inputs [54]. Under healthy Rhodes grass swards, the best predictive performance by RothC with high C inputs was likely due to a more representative annual C input value (5.4 Mg C ha−1) compared with the MCI and the LCI (3.5 and 1.9 Mg C ha−1, respectively). Comparatively, a lower C input value (3.3 Mg C ha−1 yr−1) was reported for Gatton panic (Megathyrsus maximus), as predicted by the plant growth sub-model in the CENTURY model across a 600–800 mm annual rainfall gradient (~20% lower compared with our study) location in the Dry Chaco region [33]. Also, a lower annual C input range (3.6–4.2 Mg C ha−1) was reported under a crop–pasture rotation (maize–soybeans–spring wheat) with Mollisols in the Pampas region [31].
Conversely, the model predictions of the SOC stocks under degraded Rhodes grass swards were poor. For degraded Rhodes grass, the low input (LCI) slightly improved the predictive performance of the model by reducing the mean bias (−1.5 vs. −3.3 and −5.2 for mean and high C inputs, respectively) and the RMSEP values (4.0 vs. 5.7 and 7.9 Mg SOC ha−1 for mean and high C inputs, respectively), but no other improvements were shown across varying C inputs; the predictive performance of the model was poor, irrespective of the C input levels (Table 3). It is important to note that, in our study, a 15% reduction in the aboveground C input was assumed for degraded Rhodes grass; however, further reductions for analyzing the goodness of fit were not applied. Similarly, as mentioned previously, the lower C input (i.e., LCI) does not improve the CCC (−0.34 vs. −0.25 and −0.17 for mean and high C inputs, respectively) or R2 (0.17 vs. 0.23 and 0.24 for mean and high C inputs, respectively). On the other hand, the C input from manure was not considered due to its uneven distribution within paddocks. In grass-based systems, cattle tend to spend more time near feeders or drinking troughs, areas which are commonly overgrazed by animals [55]. The RothC model was originally developed and parameterized to predict the SOC stocks of long-term experiments [40], unlike the short-term experiments analyzed in our study. The limited available information in the Dry Chaco region [17] hinders the calibration of the RothC model, potentially contributing to its poor predictive performance under degraded Rhodes grass swards. It is important to note that degraded swards are characterized by having lower aboveground biomass, greater spatial heterogeneity, and are often more sensitive to short-term climatic and management fluctuations [27]. These factors contribute to an increased uncertainty in both the SOC measurement and the model input data (e.g., C inputs). Therefore, future studies should focus on direct measurement of the aboveground and belowground biomass, as well as the C inputs, for this particular land cover. Calibration success stories, such as the one reported for paddy soils with long-term experiments (≥16 years of sampling) [56], suggest that more extensive data collection over time will lead to improved predictions.
It is also important to note that the C input levels (MCI, HCI, LCI) assumed in our study were calculated using aboveground/belowground OM formation efficiencies from the literature [44] and may be inaccurate or lack specificity for these site and management conditions. Limited data sources from degraded tropical grass species contribute to these inaccuracies. The aboveground/belowground OM formation efficiencies assumed were kept constant in our calculations; these values can vary over time and can be altered by management practices (e.g., fertilization) [44]. We also used root/aboveground ratios derived from a global-scale study of native forests [45] due to a lack of local information. Additionally, the root/aboveground ratio is affected by biotic and abiotic factors, such as stand age, diameter at breast height, canopy height, basal area, temperature, soil moisture, and soil texture [45]. Despite using a generic coefficient, the performance of the RothC model was adequate for this land cover. Furthermore, the use of equally proportional changes in the key model parameters (mean value ± 1 SD) in the sensitivity analysis was for the sole purpose of evaluating the goodness of fit of these parameters as they relate to the C input. Alternatives other than these proportional changes (e.g., altering one or more parameters differently) were not considered in our study. Futures studies could implement broader sensitivity analyses, such as multivariable methods (e.g., Morris or Sobol), which allow for exploration of non-linear combinations and interactions among multiple key model parameters.
Comparing the model performance results obtained here with those of other studies that have used RothC to predict the SOC stocks remains a difficult task, as study objectives, land covers, farm management, and soil types and depths used in the quantification of the SOC stocks vary. For example, in the Pampeana region of Argentina, it has been reported with moderate precision (i.e., about 50% of the variability in the observed SOC stocks was explained by the simulation) and good accuracy (i.e., mean bias was about 2% of mean observed values) by RothC in the prediction of the SOC stock changes in the top 200 mm under different crop–pasture alternatives [31]. Interestingly, most of the differences between the observed and predicted SOC stock values were attributed to inaccurate estimates of the C input [31]. Also, except for the native forest with a high C input, RothC tended to underestimate the SOC stocks. In agreement with this tendency, it has been reported that the model tended to underestimate the SOC stocks in soils with the highest levels of the SOC stocks in Mollisols located in the southeast of the Pampeana region [31].
For the Dry Chaco region, CENTURY showed moderate to good precision (R2 = 0.63 and 0.66 for the native forest and Gatton panic, respectively) in the prediction of the SOC stocks [33]. In addition to climate data, this model requires inputs related to the soil (i.e., sand, silt, and clay contents, bulk density) and plant variables (i.e., lignin-to-N ratio in plant litter, plant C and N content, atmospheric N deposition) for the parametrization of the plant growth sub-model. Despite the fact that RothC has a simpler structure and requires fewer input parameters, the predictive performance of RothC has been reported to be similar to that of CENTURY [24], which is an advantage in a region with scarce data, such as the Dry Chaco region. RothC has also shown a better predictive performance than other more complex models (e.g., DNDC) in Japanese paddy soils using the same dataset [56].
The RothC model v.26.3 [39] was successfully implemented in an object-oriented graphical programming language. This integration enables seamless integration with other models, including the agroecosystem model developed for the Dry Chaco region [30]. While the existing model (i.e., [30]) primarily focuses on greenhouse gas emissions within the farm context, its integration with RothC opens up opportunities for comprehensive studies encompassing the C balance and the SOC dynamics under beef cattle systems in the region.

3.2. Model Performance by Experiment

The observed and predicted SOC stocks for native forests (Experiments 1 to 3a), Rhodes grass (Experiments 3 (3b–3e) and 4), and degraded Rhodes grass (Experiments 5 and 6) are presented in Figure 3. Under the native forest (Experiments 1 to 3a), the SOC stocks predicted by RothC showed a similar trend to those observed over time, especially for Experiments 1 and 2 (Figure 3a,b). For all treatments in Experiment 3 (3a–3e), RothC showed a decreasing trend in the SOC stocks at the start (<18 months), followed by a plateau of the SOC stocks, during which time the model tended to underestimate the SOC stocks, irrespective of the C inputs (Figure 3c–g). RothC appeared to adequately predict the SOC stocks observed in Experiment 4, with a slightly better performance when using the LCI and the MCI (i.e., the predicted SOC stocks were similar to those observed) compared with the HCI; the model overestimated the SOC stocks when using high C inputs (Figure 3h). Under degraded Rhodes grass swards, RothC predicted an increase in the SOC stocks (Experiment 5), whereas the observed values were similar over time (Figure 3i). In Experiment 6, the observed and predicted values were similar (Figure 3j).
In all treatments in Experiment 3 (3b–3e), the HCI represented 64% of the C inputs predicted by RothC using the inverse mode (averaging 6.2 Mg C ha−1 yr−1). Tendencies to underestimate the SOC stocks when the initial SOC levels are high (~70 Mg C ha−1) (Figure 3d–g) have been reported, even when the observed C inputs are similar to those in the RothC inverse model [31]. The lower C inputs along with the high initial SOC stock values could explain the underestimation in the predicted SOC stocks relative to the observed values over time. In the Dry Chaco region, mean SOC stocks of 54 Mg C ha−1 have been reported [17], and a slight underestimation could be expected in areas where the initial C stocks are notably higher than average (~70 Mg C ha−1). In Experiment 4, the increase in the SOC stocks predicted by RothC was attributed to the twice-annual C inputs using the MCI and the LCI compared with the C inputs derived from the predictions by RothC using the inverse mode (3.2 Mg C ha−1 yr−1) which is necessary to conserve the SOC stocks [40].
In most instances, the HCI improved the performance of the model under both native forests and Rhodes grass by lowering the relative prediction error (RPE; Figure 4a) and relative mean bias (RMB; Figure 4b), compared with the MCI. Under the native forest (Experiments 1 to 3a), slight differences between the observed and predicted SOC changes over time occurred. In Experiment 3a, with high initial SOC stocks (~70 Mg C ha−1), an underestimation of the SOC stocks by the model was evident; C inputs represented 65% of those provided by RothC in the inverse mode (5.4 Mg C ha−1 yr−1). Despite this difference, Experiments 1 and 3a showed some of the lowest RPE and RMB values.
In treatments such as Rhodes grass for hay making without added N (Experiment 3, treatment 3d) and Rhodes grass for hay making with N (3e) (Table 1), the model provided some of the lowest RPE and RMB values (Figure 4). This could be attributed to the original development of the model, as RothC was originally developed for crop systems where the soils were ploughed and stubble was incorporated shortly after crop harvest [40]. Also, a better RothC model performance has been reported in predicting the SOC stocks in experiments with stubble burning compared to those with stubble retention [57]. Under degraded Rhodes grass (Experiment 5), differences between the observed and predicted SOC stocks (Figure 3i), along with a consistent overestimation (Figure 4b), suggest a poor model performance for this land cover.
Overall, the widespread use of RothC has demonstrated its effectiveness across several climates, soil types, and land cover types [25]. Given the substantial demand for the SOC stock monitoring in the Dry Chaco region [16], especially in areas with annual rainfall below 500 mm, the various RothC versions [25] could serve as a valuable supplement for future research aimed at predicting the SOC stocks in these semiarid regions.

3.3. Uncertainties and Limitations

Our simulation includes several sources of uncertainty. A first source of uncertainty is around the assumed C inputs to the soil for each land cover. Carbon inputs are an essential parameter for the prediction of the SOC stocks in RothC. While our simulation relies on the fixed values of the aboveground and belowground OM formation efficiency, and the root/aboveground ratios, these values do not vary over the simulation period. Consequently, the sensitivity analysis has revealed the potential for the over- or underprediction of the C inputs, which affects the model’s performance. The sensitivity of the RothC model to C inputs suggests that management practices affecting aboveground or root biomass (e.g., fertilization or land cover) can introduce significant uncertainty into the SOC stock predictions when local data are lacking. This limitation reduces the model’s usefulness for accurately estimating the benefits of certain short-term management practices. Additionally, the model’s difficulty in capturing spatial variability within a management unit implies that predictions should be interpreted as average estimates rather than absolute values at the plot scale. Therefore, we recommend using model predictions as a complement to field measurements—especially for long-term planning—and support them with local assessments and context-specific adaptations.
A second source of uncertainty is related to the heterogeneous distribution of the SOC stocks within a specific spatial unit. In addition to the inherent error related to sampling and analysis, factors such as the complete removal of the aboveground plant material layer or the proper mixing of composite samples can contribute to this uncertainty [58]. For the detection of the SOC stock changes in short-term experiments, which typically span about ten years, a larger number of soil samples (see Table 3) is typically required [59].
A third source of uncertainty is related to the nature of the RothC model, which was primarily parameterized using data from long-term experiments, and having to adapt to short-term ones is a hard ask from the model. However, this also highlights the possibility of using the model with limited data, providing valuable insights that can be enhanced through future studies.

4. Conclusions

Based on a comparison of the observed vs. the predicted values, the RothC model provided promising predictions of topsoil organic C stocks under native forests and Rhodes grass in the Dry Chaco region. Our findings suggest that the RothC model performed adequately in the prediction of topsoil organic C stocks under these land covers, especially in cases where high C inputs were assumed. The model’s performance in predicting the SOC stocks under degraded Rhodes grass, however, appears to be suboptimal. Larger datasets and revisiting some of the underlying assumptions will be required to improve the model’s performance in predicting the SOC stocks under this particular land cover. The model’s performance provides a robust and valuable tool for the evaluation of different management strategies and impacts on the SOC stocks under the representative land cover of the Dry Chaco region of Argentina.

Author Contributions

Conceptualization, I.D.F., N.B., J.N., M.S., C.F. and R.V.; Methodology, I.D.F., C.F. and R.V.; Software, I.D.F.; Validation, I.D.F.; Formal analysis, I.D.F.; Investigation, I.D.F.; Resources, J.N.; Data curation, I.D.F., N.B. and J.N.; Writing—original draft, I.D.F., C.F. and R.V.; Writing—review & editing, I.D.F., N.B., J.N., M.S., C.F. and R.V.; Visualization, I.D.F.; Supervision, C.F. and R.V.; Funding acquisition, P.L.P. All authors have read and agreed to the published version of the manuscript.

Funding

This publication is a partial requirement to obtaining a Doctoral degree at the Programa de Posgrado en Ciencias Agrarias, Facultad de Ciencias Agrarias, Universidad Nacional de Mar del Plata by I.D. Filip (CONICET INTA doctoral scholarship). We wish to acknowledge the financial support received for this research: The project was made possible through a Doctoral Grant co-funded by CONICET and INTA (RESOL-2018-1225-APN-DIR#CONICET; RESOL-2018-1017-APN-DIR#CONICET), INTA 2019: PD-E3-I062-001-Estrategias de producción que incrementen el secuestro de C en suelo para la mitigación del Cambio Climático, PE-E1-I006-001-Respuestas tecnológicas para el manejo sustentable y eficiente de pasturas megatérmicas en sistemas ganaderos del centro y norte de Argentina, and 2023-PD-L02-I097-Emisiones de gases de efecto invernadero y captura de carbono en sistemas agropecuarios y forestales.

Institutional Review Board Statement

Not applicable.

Informed Consent Statement

Not applicable.

Data Availability Statement

Data are contained within the article.

Conflicts of Interest

Author Ronaldo Vibart is employed by AgResearch Ltd. The remaining authors declare that the research was conducted in the absence of any commercial or financial relationships that could be construed as a potential conflict of interest.

References

  1. Tifafi, M.; Guenet, B.; Hatté, C. Large Differences in Global and Regional Total Soil Carbon Stock Estimates Based on SoilGrids, HWSD, and NCSCD: Intercomparison and Evaluation Based on Field Data From USA, England, Wales, and France. Glob. Biogeochem. Cycles 2018, 32, 42–56. [Google Scholar] [CrossRef]
  2. Smith, P. Soils and climate change. Curr. Opin. Environ. Sustain. 2012, 4, 539–544. [Google Scholar] [CrossRef]
  3. Lal, R.; Smith, P.; Jungkunst, H.F.; Mitsch, W.J.; Lehmann, J.; Ramachandran Nair, P.K.; McBratney, A.B.; De Moraes Sá, J.C.; Schneider, J.; Zinn, Y.L.; et al. The carbon sequestration potential of terrestrial ecosystems. J. Soil Water Conserv. 2018, 73, 145A–152A. [Google Scholar] [CrossRef]
  4. Scharlemann, J.P.W.; Tanner, E.V.J.; Hiederer, R.; Kapos, V. Global soil carbon: Understanding and managing the largest terrestrial carbon pool. Carbon Manag. 2014, 5, 81–91. [Google Scholar] [CrossRef]
  5. Villarino, S.H.; Studdert, G.A.; Baldassini, P.; Cendoya, M.G.; Ciuffoli, L.; Mastrángelo, M.; Piñeiro, G. Deforestation impacts on soil organic carbon stocks in the Semiarid Chaco Region, Argentina. Sci. Total Environ. 2017, 575, 1056–1065. [Google Scholar] [CrossRef]
  6. Intergovernmental Panel on Climate Change (IPCC). 2019 Refinement to the 2006 IPCC Guidelines for National Greenhouse Gas Inventories; Calvo Buendia, E., Tanabe, K., Kranjc, A., Baasansuren, J., Fukuda, M., Ngarize, S., Osako, A., Pyrozhenko, Y., Shermanau, P., Federici, S., Eds.; IPCC: Geneva, Switzerland, 2019. [Google Scholar]
  7. Portillo-Quintero, C.A.; Sánchez-Azofeifa, G.A. Extent and conservation of tropical dry forests in the Americas. Biol. Conserv. 2010, 143, 144–155. [Google Scholar] [CrossRef]
  8. Sarmiento, G. Ecological and floristic convergences between seasonal plant formations of tropical and subtropical South America. J. Ecol. 1972, 60, 367–410. [Google Scholar] [CrossRef]
  9. Fernández, P.D.; Baumann, M.; Baldi, G.; Banegas, R.N.; Bravo, S.; Gasparri, N.I.; Lucherini, M.; Marinaro, S.; Nanni, A.S.; Nasca, J.S.; et al. Grasslands and Open Savannas of the Dry Chaco. In Encyclopedia of the World’s Biomes; Elsevier: Amsterdam, The Netherlands, 2020. [Google Scholar] [CrossRef]
  10. Baumann, M.; Gasparri, I.; Piquer-Rodríguez, M.; Gavier Pizarro, G.; Griffiths, P.; Hostert, P.; Kuemmerle, T. Carbon emissions from agricultural expansion and intensification in the Chaco. Glob. Change Biol. 2016, 23, 1902–1916. [Google Scholar] [CrossRef]
  11. Conti, G.; Pérez-Harguindeguy, N.; Quètier, F.; Gorné, L.D.; Jaureguiberry, P.; Bertone, G.A.; Enrico, L.; Cuchietti, A.; Díaz, S. Large changes in carbon storage under different land-use regimes in subtropical seasonally dry forests of southern South America. Agric. Ecosyst. Environ. 2014, 197, 68–76. [Google Scholar] [CrossRef]
  12. Lambin, E.F.; Gibbs, H.K.; Ferreira, L.; Grau, R.; Mayaux, P.; Meyfroidt, P.; Morton, D.C.; Rudel, T.K.; Gasparri, I.; Munger, J. Estimating the world’s potentially available cropland using a bottom-up approach. Glob. Environ. Change 2013, 23, 892–901. [Google Scholar] [CrossRef]
  13. Torrella, S.A.; Adámoli, J. Situación ambiental de la ecorregión del Chaco Seco. La Situación Ambient. Argentina 2005, 2005, 73–75. [Google Scholar]
  14. Kunst, C.; Ledesma, R.; Castañares, M.; Cornacchione, M.; van Meer, H.; Godoy, J. Yield and growth features of Panicum maximum (Jacq.) var Trichoglume cv Petrie (Green Panic) under woody cover, Chaco region, Argentina. Agroforest Syst. 2014, 88, 157–171. [Google Scholar] [CrossRef]
  15. Nasca, J.A.; Berone, G.; Arroquy, J.I.; Feldkamp, C.; Colombatto, D. Evaluación de un modelo de producción de pasturas mediante pruebas empíricas. Rev. Investig. Agropecu. 2020, 46, 88–95. [Google Scholar]
  16. Fernández, P.D.; de Waroux, Y.P.; Jobbágy, E.G.; Loto, D.E.; Gasparri, N.I. A hard-to-keep promise: Vegetation use and aboveground carbon storage in silvopastures of the Dry Chaco. Agric. Ecosyst. Environ. 2020, 303, 107117. [Google Scholar] [CrossRef]
  17. Instituto Nacional de Tecnología Agropecuaria (INTA); Ministerio de Agricultura Ganadería y Pesca (MAGyP). Reporte Nacional: Estimación de las Reservas de Carbono Orgánico del Suelo con Plantaciones Forestales y Otros Usos de la Tierra, en Distintas Regiones de Argentina; MAGyP: Buenos Aires, Argentina, 2022; p. 80. [Google Scholar]
  18. Smith, P.; Smith, J.U.; Powlson, D.S.; McGill, W.B.; Arah, J.R.M.; Chertov, O.G.; Coleman, K.; Franko, U.; Frolking, S.; Jenkinson, D.S.; et al. A comparison of the performance of nine soil organic matter models using datasets from seven long-term experiments. Geoderma 1997, 81, 153–225. [Google Scholar] [CrossRef]
  19. Campbell, E.E.; Paustian, K. Current developments in soil organic matter modeling and the expansion of model applications: A review. Environ. Res. Lett. 2015, 10, 123004. [Google Scholar] [CrossRef]
  20. Jørgensen, S.E. Overview of the model types available for development of ecological models. Ecol. Modell. 2018, 215, 3–9. [Google Scholar] [CrossRef]
  21. Yang, J.M.; Yang, J.Y.; Liu, S.; Hoogenboom, G. An evaluation of the statistical methods for testing the performance of crop models with observed data. Agric. Syst. 2014, 127, 81–89. [Google Scholar] [CrossRef]
  22. Coleman, K.; Jenkinson, D.S.; Crocker, G.J.; Grace, P.R.; Klír, J.; Körschens, M.; Poulton, P.R.; Richter, D.D. Simulating trends in soil organic carbon in long-term experiments using RothC-26.3. Geoderma 1997, 81, 109–120. [Google Scholar] [CrossRef]
  23. Nieto, O.M.; Castro, J.; Fernández, E.; Smith, P. Simulation of soil organic carbon stocks in a Mediterranean olive grove under different soil-management systems using the RothC model. Soil Use Manag. 2010, 26, 118–125. [Google Scholar] [CrossRef]
  24. Falloon, P.; Smith, P. Simulating SOC changes in long-term experiments with rothC and CENTURY: Model evaluation for a regional scale application. Soil Use Manag. 2002, 18, 101–111. [Google Scholar] [CrossRef]
  25. Farina, R.; Coleman, K.; Whitmore, A.P. Modification of the RothC model for simulations of soil organic C dynamics in dryland regions. Geoderma 2013, 200–201, 18–30. [Google Scholar] [CrossRef]
  26. Siyum, Z.G. Tropical dry forest dynamics in the context of climate change: Syntheses of drivers, gaps, and management perspectives. Ecol. Process. 2020, 9, 25. [Google Scholar] [CrossRef]
  27. Yao, J.; Liu, H.; Huang, J.; Gao, Z.; Wang, G.; Li, D.; Yu, H.; Chen, X. Accelerated dryland expansion regulates future variability in dryland gross primary production. Nat. Commun. 2020, 11, 1665. [Google Scholar] [CrossRef]
  28. Schlesinger, W.H. An evaluation of abiotic carbon sinks in deserts. Glob. Change Biol. 2017, 23, 25–27. [Google Scholar] [CrossRef]
  29. Sierra, C.A.; Müller, M.; Trumbore, S.E. Modeling radiocarbon dynamics in soils: SoilR version 1.1. Geosci. Model Dev. 2014, 7, 1919–1931. [Google Scholar] [CrossRef]
  30. Nasca, J.A.; Feldkamp, C.R.; Arroquy, J.I.; Colombatto, D. Efficiency and stability in subtropical beef cattle grazing systems in the northwest of Argentina. Agric. Syst. 2015, 133, 85–96. [Google Scholar] [CrossRef]
  31. Studdert, G.A.; Monterubbianesi, M.G.; Domínguez, G.F. Use of RothC to simulate changes of organic carbon stock in the arable layer of a Mollisol of the southeastern Pampas under continuous cropping. Soil Tillage Res. 2011, 117, 191–200. [Google Scholar] [CrossRef]
  32. Villarino, S.H.; Studdert, G.A.; Laterra, P. Greenhouse gas inventories: Deriving soil organic carbon change factors and assessing soil depth relevance in Argentinean Semiarid Chaco. Catena 2018, 169, 164–174. [Google Scholar] [CrossRef]
  33. Baldassini, P.; Paruelo, J.M. Deforestation and current management practices reduce soil organic carbon in the semi-arid Chaco, Argentina. Agric. Syst. 2020, 178, 102749. [Google Scholar] [CrossRef]
  34. Banegas, N.; Albanesi, A.S.; Pedraza, R.O.; Dos Santos, D.A. Non-linear dynamics of litter decomposition under different grazing management regimes. Plant Soil 2015, 393, 47–56. [Google Scholar] [CrossRef]
  35. Cruzate, G.A.; Morras, H.J.M.; Pizarro, M.J.; Gómez, L.A. Argentina Físico-Natural: Suelos. ANIDA. Atlas Nacional Interactivo de Argentina; Instituto Geográfico Nacional: Buenos Aires, Argentina, 2023; p. 61. [Google Scholar]
  36. Secretaria de Recursos Naturales y Desarrollo sustenable (SRNyDS). Eco-Regiones de la Argentina; Secretaria de Recursos Naturales y Desarrollo sustenable (SRNyDS): Buenos Aires, Argentina, 1999; p. 43. [Google Scholar]
  37. Nasca, J.A.; Banegas, N.; García Posse, F.; Martín, A.; Della Rosa, M.; Molina, A.; Fernández, P. Evaluación productiva y emisiones de gases de efecto invernadero en dos sistemas de cría bovina contrastante del Chaco Seco argentino. Rev. Agronómica Del. Noroeste Argent. 2020, 40, 13–22. [Google Scholar]
  38. Nelson, D.W.; Sommers, L.E. Total carbon, organic carbon, and organic matter. In Methods of Soil Analysis. Part 2, 2nd ed; Agron. Monogr. 9. ASA and SSSA; American Society of Agronomy, Soil Science Society of America: Madison, WI, USA, 1982; pp. 539–579. [Google Scholar]
  39. RRes, 2007. Rothamsted Carbon Model (RothC). Rothamsted Research, Harpenden, Hertfordshire, United Kingdom. Available online: http://www.rothamsted.ac.uk/rothamsted-carbon-model-rothc (accessed on 5 July 2024).
  40. Coleman, K.; Jenkinson, D.S. RothC-26.3-A Model for the Turnover of Carbon in Soil. Evaluation of Soil Organic Matter Models. In Evaluation of Soil Organic Matter Models Using Existing Long-Term Datasets; Powlson, D.S., Smith, P., Smith, J.U., Eds.; Springer: Berlin/Heidelberg, Germany, 1996; pp. 237–246. [Google Scholar]
  41. Smith, P.F.; Holzworth, D.P.; Robertson, M.J. Linking icon-based models to code-based models: A case study with the agricultural production systems simulator. Agric. Syst. 2005, 83, 135–151. [Google Scholar] [CrossRef]
  42. Bala, B.K.; Arshad, F.M.; Noh, K.M. System Dynamics: Modelling and Simulation; Springer: Singapore, 2017; p. 278. [Google Scholar] [CrossRef]
  43. Rezende, C.P.; Cantarutti, R.B.; Braga, J.M.; Gomide, J.A.; Pereira, J.M.; Ferreira, E.; Tarré, R.; Macedo, R.; Alves, B.J.R.; Urquiaga, S.; et al. Litter deposition and disappearance in Brachiaria pastures in the Atlantic forest region of the South of Bahia, Brazil. Nutr. Cycl. Agroecosyst. 1999, 54, 99–112. [Google Scholar] [CrossRef]
  44. Villarino, S.H.; Pinto, P.; Jackson, R.B.; Piñeiro, G. Plant rhizodeposition: A key factor for soil organic matter formation in stable fractions. Sci. Adv. 2021, 7, eabd3176. [Google Scholar] [CrossRef]
  45. Ye, J.; Yue, C.; Hu, Y.; Ma, H. Spatial patterns of global-scale forest root-shoot ratio and their controlling factors. Sci. Total Environ. 2021, 800, 149251. [Google Scholar] [CrossRef]
  46. Jackson, R.B.; Canadell, J.; Ehleringer, J.R.; Mooney, H.A.; Sala, O.E.; Schulze, E.D. A global analysis of root distributions for terrestrial biomes. Oecologia 1996, 108, 389–411. [Google Scholar] [CrossRef]
  47. Holl, K.D. Effects of above- and below-ground competition of shrubs and grass on Calophyllum brasiliense (Camb.) seedling growth in abandoned tropical pasture. For. Ecol. Manag. 1998, 109, 187–195. [Google Scholar] [CrossRef]
  48. Tedeschi, L.O. Assessment of the adequacy of mathematical models. Agric. Syst. 2006, 89, 225–247. [Google Scholar] [CrossRef]
  49. Bryant, J.R.; Lopez Villalobos, N. Choice of the most appropriate models and estimation procedures of lactation curves for grazing dairy cattle. Proc. N. Z. Soc. Anim. Prod. 2007, 67, 209–214. [Google Scholar]
  50. Lin, L.I.K. A concordance Correlation Coefficient to Evaluate Reproducibility. Biometrics 1989, 45, 255–268. [Google Scholar] [CrossRef] [PubMed]
  51. Poeplau, C. Estimating root: Shoot ratio and soil carbon inputs in temperate grasslands with the RothC model. Plant Soil 2016, 407, 293–305. [Google Scholar] [CrossRef]
  52. Fernández, P.D.; Gasparri, N.I.; Rojas, T.N.; Banegas, N.R.; Nasca, J.A.; Jobbágy, E.G.; Kuemmerle, T. Silvopastoral management for lowering trade-offs between beef production and carbon storage in tropical dry woodlands. Sci. Total Environ. 2024, 912, 168973. [Google Scholar] [CrossRef]
  53. Singh, L.; Singh, J.S. Storage and flux of nutrients in a dry tropical forest in India. Ann. Bot. 1991, 68, 275–284. [Google Scholar] [CrossRef]
  54. Eclesia, R.P.; Jobbagy, E.G.; Jackson, R.B.; Rizzotto, M.; Piñeiro, G. Stabilization of new carbon inputs rather than old carbon decomposition determines soil organic carbon shifts following woody or herbaceous vegetation transitions. Plant Soil 2016, 409, 99–116. [Google Scholar] [CrossRef]
  55. Barcella, M.; Filipponi, F.; Assini, S. A simple model to support grazing management by direct field observation. Agric. Ecosyst. Environ. 2016, 234, 107–117. [Google Scholar] [CrossRef]
  56. Shirato, Y.; Yokozawa, M. Applying the Rothamsted Carbon Model for Long-Term Experiments on Japanese Paddy Soils and Modifying It by Simple Tuning of the Decomposition Rate. Soil Sci. Plant Nutr. 2005, 51, 405–415. [Google Scholar] [CrossRef]
  57. Liu, D.L.; Chan, K.Y.; Conyers, M.K. Simulation of soil organic carbon under different tillage and stubble management practices using the Rothamsted carbon model. Soil Tillage Res. 2009, 104, 65–73. [Google Scholar] [CrossRef]
  58. FAO. Measuring and Modelling Soil Carbon Stocks and Stock Changes in Livestock Production Systems: Guidelines for Assessment (Version 1). Livestock Environmental Assessment and Performance (LEAP) Partnership; FAO: Rome, Italy, 2019; p. 170. [Google Scholar]
  59. Schrumpf, M.; Schulze, E.D.; Kaiser, K.; Schumacher, J. How accurately can soil organic carbon stocks and stock changes be quantified by soil inventories? Biogeosciences 2011, 8, 1193–1212. [Google Scholar] [CrossRef]
Figure 1. The Dry Chaco region in Argentina and experimental sites for the model’s evaluation. Panel (a) a map of South America with the Dry Chaco region (in the box), and panel (b) north-central Argentina with the Dry Chaco region in grey [36].
Sustainability 17 05012 g001
Figure 2. Powersim Studio 10® elements (panel (a)). Structure, pools, and flows of carbon (C) in the RothC model programed in Powersim Studio® software (10.14.5555.6) (panel (b)). Panel (b) includes major factors controlling the soil organic carbon (SOC) fluxes (a = multiplier for effects of temperature, b = multiplier for effects of moisture, c = multiplier for effects of soil cover; DPM/RPM = decomposable/resistant plant material ratio); HUM: humified organic carbon; BIO: microbial biomass carbon; IOM: inert organic carbon [40].
Sustainability 17 05012 g002
Figure 3. Observed (dots; mean ± standard deviation) vs. predicted (RothC; lines) soil organic carbon (SOC) stocks over time in the top 300 mm under native forests (ac), Rhodes grass (dh), and degraded Rhodes grass (i,j). MCI, HCI, LCI: mean C input, mean C input plus one standard deviation, and mean C input minus one standard deviation, respectively. Ratios of decomposable plant material (DPM) to resistant plant material (RPM) of 0.25, 1.44, and 0.67 were assumed for native forests, Rhodes grass, and degraded Rhodes grass, respectively [39]. A brief description of each experiment is provided in Table 1.
Sustainability 17 05012 g003
Figure 4. Relative prediction error ((a) root mean squared error of prediction expressed as a percentage of the observed mean) and relative mean bias ((b) observed minus prediction expressed as a percentage of the observed mean) as indicators of the ability of RothC to predict soil organic carbon (SOC) stocks in the top 300 mm under native forests (Experiments 1 to 3a), Rhodes grass (Experiments 3b–3e and 4), and degraded Rhodes grass (Experiments 5 and 6). MCI (darker grey columns), HCI (lighter grey columns), LCI (horizontal stripes): mean C input, mean C input plus one standard deviation, and mean C input minus one standard deviation, respectively, chosen as best C input predictors for each land cover. Experiments are described in Table 1.
Sustainability 17 05012 g004
Table 1. Key characteristics of six experiments and experimental sites available for model testing (soil samples collected to a depth of 300 mm in March of every year).
Exp. No.Initial SOC Stocks (Mg ha−1) 1Annual Mean Air Temp (°C)Annual Rainfall (mm)Annual Potential ET (mm) 2Soil Characteristics Duration of Experiment
(Years)
Aim of ExperimentLand Cover and ManagementReference
135.219.88891356Clay: 13.0%, soil pH: 6.8, EC 3: 6.24Evaluate native vegetation (secondary ecological succession)Native forests (Zizyphus mistol, Geoffroea decorticans, Sideroxylon obtusifolium, Ruprechtia laxiflora)Animal Research Institute of Semiarid Chaco (IIACS)
249.120.16941367Clay: 12.0%, soil pH: 7.5, EC: 2.02
3a69.019.69031481Clay: 12.0%, soil pH: 7.2, EC: 5.54[34]
3b69.419.69031481Clay: 13.2%, soil pH: 6.5, EC: 0.54Understand and model the dynamics of litter decomposition with varying pasture management.Rhodes grass without N applied on grazed plots.[34]
3c Clay: 14.0%, soil pH: 6.8, EC: 0.64Rhodes grass with N (100 kg N ha−1) on grazed plots.
3d Clay: 13.5%, soil pH: 6.6, EC: 0.74Rhodes grass for hay making without N.
3e Clay: 14.3%, soil pH: 6.5, EC: 0.54Rhodes grass for hay with N (100 kg N ha−1).
437.619.88891356Clay: 15.7%, soil pH: 5.9, EC: 0.3 4Evaluate intensification of cow–calf systems.Corn/Rhodes grass [37]
538.419.88891356Clay: 17.0%, soil pH: 6.0, EC: 0.64Evaluate intensification of cow–calf systems.Degraded Rhodes grass with annual yields of ~4 Mg DM ha−1 (vs. 8 Mg DM ha−1 in experiments 3 & 4)Unpublished data. IIACS.
636.519.78531345Clay: 11.0%, soil pH: 7.5, EC: 2.02
1 Initial SOC stocks: soil organic carbon stocks (without coarse elements); 2 ET: evapotranspiration; 3 EC: electrical conductivity (dS m−1).
Table 2. Mean carbon (C) input (MCI), mean C input plus one standard deviation (high C input; HCI), and mean C input minus one standard deviation (low C input; LCI) of the organic matter (OM) formation efficiency factor (i.e., aboveground, belowground), and root/aboveground ratio used to estimate C input in RothC.
ItemsMCIHCILCI
Aboveground OM formation efficiency factor (%) 17104
Belowground OM formation efficiency factor (%) 1
Native forest496038
Rhodes grass and degraded Rhodes grass505644
Root/aboveground ratio (%)
Native forest 2293226
Rhodes grass 3929391
Rhodes grass and degraded Rhodes grass 4818874
1 Rhodes grass and native forest [44]. 2 Native forest (Experiments 1 to 3a) [45]. 3 [34] from local data (Experiment 3b–3e). 4 Root/aboveground ratio for Rhodes grass (Experiments 4, 5 and 6) [47].
Table 3. Soil organic carbon (SOC) stocks (Mg ha−1 in the top 300 mm soil layer) under different land covers as predicted by the RothC model [39].
ItemsLand Cover
Native Forests (N = 57)Rhodes Grass (N = 104)Degraded Rhodes Grass (N = 48)
1 MCI2 HCI3 LCIMCIHCILCIMCIHCILCI
Mean observed (O)48.259.736.7
Mean predicted (P)46.848.544.956.357.954.939.641.637.8
Mean bias (O–P)1.41−0.33.23.31.74.7−3.3−5.2−1.5
4 RMSEP 3.63.54.85.64.96.65.77.94.0
5 RPE, %7.57.310.09.58.211.115.621.411.0
Decomposition of error
% bias14.81.045.235.012.451.355.564.628.0
% slope23.429.910.945.663.730.00.30.39.6
% random61.769.143.919.423.918.744.135.162.3
6 CCC0.960.970.940.920.940.89−0.25−0.17−0.34
7 R20.950.950.940.950.960.940.230.240.17
8 MEF0.920.920.870.770.820.71−1.84−1.98−1.68
1 Mean carbon input, calculated from mean values of organic matter (OM) formation efficiency and root/aboveground ratio [40]. 2 High carbon input: mean C input plus one standard deviation. 3 Low carbon input: mean C input minus one standard deviation. 4 RMSEP: root mean squared error of prediction. 5 RPE: Relative prediction error = (RMSPE/mean observed) × 100. 6 CCC: concordance correlation coefficient. 7 R2: correlation coefficient. 8 MEF: modelling efficiency.
Disclaimer/Publisher’s Note: The statements, opinions and data contained in all publications are solely those of the individual author(s) and contributor(s) and not of MDPI and/or the editor(s). MDPI and/or the editor(s) disclaim responsibility for any injury to people or property resulting from any ideas, methods, instructions or products referred to in the content.

