Article

Grazing Exclusion Affects Alpine Meadow Plants’ Root Morphological Traits and Reduces Their Cold Resistance on the Qinghai–Tibetan Plateau

1
Key Laboratory of Mountain Surface Processes and Ecological Regulation, Institute of Mountain Hazards and Environment, Chinese Academy of Sciences, No. 189 QunXianNan Street, TianFu New Area, Chengdu 610299, China
2
University of Chinese Academy of Sciences, No. 1 East Yanqi Lake Road, Huairou District, Beijing 101408, China
*
Author to whom correspondence should be addressed.
Sustainability 2025, 17(11), 5010; https://doi.org/10.3390/su17115010
Submission received: 7 April 2025 / Revised: 26 May 2025 / Accepted: 27 May 2025 / Published: 29 May 2025
(This article belongs to the Section Environmental Sustainability and Applications)

Abstract

:
Against the background of climate change, grazing accelerates the warming and drying processes in grasslands. There is a relatively clear temperature and humidity difference between grassland used for grazing and grassland that has been excluded from grazing practices. This paper asks whether temperature and humidity differences affect plant roots and cold resistance. Representative plants from an alpine meadow on the eastern margin of the Qinghai–Tibetan Plateau were selected under grazing exclusion and grazing conditions. Dominant plants within and outside of an alpine meadow enclosed for 10 years in the study area were selected as the research objects to study the root morphology and physiological indices of the cold resistance of these plants. The results showed that (1) grazing exclusion (GE) was beneficial for soil temperature and water retention, reduced soil pH, and increased soil nutrient content. Under grazing exclusion conditions, all plant root morphological traits, except root tissue density, increased compared with those under grazing grassland (FG) conditions. Grazed plants adopted resource acquisition strategies, while grazing exclusion plants adopted resource conservation strategies. (2) The changes in the physiological indices of cold resistance in different years and grazing treatments were different. In 2023, the superoxide dismutase (SOD) activity and soluble protein content in GE conditions were significantly lower than those in FG conditions, while the peroxidase (POD) activity was significantly higher than that under FG conditions. The activity of catalase (CAT) in the GE plot was significantly lower than that in the FG plot in 2024. The cold resistance of Gramineae species was lower than that of non-Gramineae plants. A redundancy analysis (RDA) of plant root morphological traits, soil properties, and cold resistance showed that root length and soil pH were the most important factors affecting plant cold resistance. We concluded that grazing exclusion is conducive to plant root growth, but also acidifies the soil and reduces plant cold resistance.

1. Introduction

Ongoing climate change and chronic overgrazing threaten the stability of grassland ecosystems [1,2]. A thicker soil organic layer provides better thermal insulation, whereas grazing reduces above-ground biomass and litter on the surface. This reduces the thickness of organic matter and increases soil exposure, leading to an increase in surface temperature [3,4] and significantly changing soil temperature and moisture. The rate of warming in overgrazed areas was much higher than that in non-overgrazed areas [5]. However, grazing exclusion by fencing changes heat resources, and the surface temperature is significantly lower than that of grazing grasslands [6]. The above research showed a significant temperature difference inside and outside fences; however, there are few studies on whether this temperature difference affects the cold resistance in plants.
Temperature plays a decisive role in the growth process of plants [7], and temperature fluctuations negatively affect plant production. In recent years, extreme global climate events have become more frequent, and plants have become increasingly susceptible to the effects of environmental cold and heat changes. Low temperatures are abiotic stress factors that inhibit plant growth [8]. Plants can improve cold resistance by regulating root growth and development. Below-ground biomass, root crowns, lateral roots [9], and root spatial distribution [10] all affect the cold resistance of plants [11]. Malondialdehyde (MDA), the final product of membrane lipid peroxidation, is a marker for detecting whether cell membranes are damaged [12]. Taking alfalfa as an example, malondialdehyde content is inversely proportional to temperature [13]. Proline, soluble protein, and soluble sugar can reduce intracellular water loss and improve plant cold resistance by regulating osmoregulation [14,15]. Enzymes such as peroxidase (POD), catalase (CAT), and superoxide dismutase (SOD) can reduce the excess reactive oxygen species produced in plants under low-temperature stress, and reduce the destruction of protein, nucleic acid, and other cell components, playing an important role in maintaining the stability of cell membranes [16]. The activities of antioxidant enzymes (CAT, SOD, POD) increased with the prolongation of stress time [11]. These indicators are regarded as the main physiological indicators for judging the cold resistance of plants.
Grassland is the largest ecosystem type in China, accounting for 41% of China’s land area [17]. Grazing, which affects vegetation dynamics and soil resources [18,19], is the main use of grassland [20,21]. Approximately 90% of grasslands in China have been degraded because of climate change, population increases, overgrazing, and rodent destruction [22,23], with overgrazing being the main cause of degradation. Grazing affects the root system mainly through changing the above-ground plant community and then further affecting the underground root system [24,25]. Grazing can reduce soil fertility, plant nutrient content, and vegetation coverage, resulting in a decrease in underground biomass, an increase in plant root turnover rate, and a shortened root life span [26]. Overgrazing can significantly reduce the total root length, root surface area, and root tissue density [27]. Studies have shown that higher grazing pressures promote the accumulation of underground biomass [28]. The impact of grazing on underground ecosystems is complex. To develop reasonable grassland management strategies, an increasing number of studies have focused on the response of underground ecosystems to grazing [29]. In the past several decades, grazing exclusion using fencing has been a major measure utilized to restore degraded grasslands in countries worldwide [30,31], and can effectively improve degraded alpine meadows, increase vegetation coverage and underground biomass, and change plant root morphology [32,33]. However, it has also been found that when plants are subjected to low-temperature stress, the growth of their root systems is also restricted. In a study of grape root systems, it was found that the root tissue structures of grape varieties with different cold resistances varied greatly. Grapes with high cold resistance had thinner and fewer vessels and a compact tissue structure. Low temperatures have a significant inhibitory effect on the root structure and root activity of tomatoes, significantly suppressing the growth of roots and root hairs. The growth in root length, surface area, volume, number of tips, and number of forks is slow.
The eastern margin of the Qinghai–Tibetan Plateau is an important climate transition zone in China, and the alpine meadows found here are an important ecological barrier for the Yellow and Yangtze River basins [34]. Owing to the high altitude and harsh environment, the alpine meadows of the Qinghai–Tibetan Plateau are highly susceptible to interference from global climate change and human activities [35]. Heat is the main limiting factor for plant growth in the region. To determine whether the temperature difference inside and outside of the fence has an impact on the root and cold resistance of plants, in this study, we explored the impacts of grazing exclusion using fencing (10 years) and continuous grazing on plant root morphological traits and cold resistance indices in alpine meadows on the eastern margin of the Tibetan Plateau. The objectives of this study were to evaluate the effects of different management policies on alpine meadows and provide a scientific basis for optimizing grazing management strategies, restoring degraded grasslands, and implementing sustainable grassland management.

2. Materials and Methods

2.1. Study Site and Experimental Plots

The experimental area (32°49′39″ N, 102°34′50″ E) is located at the Ruoergai Wetland Ecological Research Station of Chengdu Institute of Biology, Chinese Academy of Sciences, Hongyuan County, Aba Tibetan and Qiang Autonomous Prefecture, Sichuan Province, China (Figure 1). The study area is located at the eastern margin of the Qinghai–Tibet Plateau at an altitude of 3500 m above sea level. It is a continental plateau with a cold and temperate monsoon climate, short springs and autumns, long winters, and no summers. Under the combined action of the southwest monsoon of the Indian Ocean and the southeast monsoon of the Pacific Ocean, the precipitation in this region is relatively abundant (average annual precipitation of 749.1 mm), 80% of which is concentrated in May–August. The average annual temperature is 1.4 °C. The average annual sunshine duration is 2158.7 h. The average annual snowfall is 76 days. The Ruoergai Station is one of the regions with the most abundant precipitation in the alpine grassland of the Qinghai–Tibetan Plateau. The vegetation type is mainly alpine meadow, and the main vegetation includes Poa pratensis Linn., Carex spp., and Carex myosuroides Vill. The main type of soil is alpine meadow soil.
There is a 30 m × 30 m no-grazing grassland (GE) in the experimental area, and outside the fence is the grazing grassland (FG) plot. There is no water in the experimental area. The fence was set up in 2013 around the experimental plot using galvanized steel wire, completely enclosing the grazing exclusion grassland so that grazing was no longer carried out. The grazing grassland is still grazed according to local traditions: the intensity of grazing is 2 yaks/hm2, and the area is grazed throughout the year.

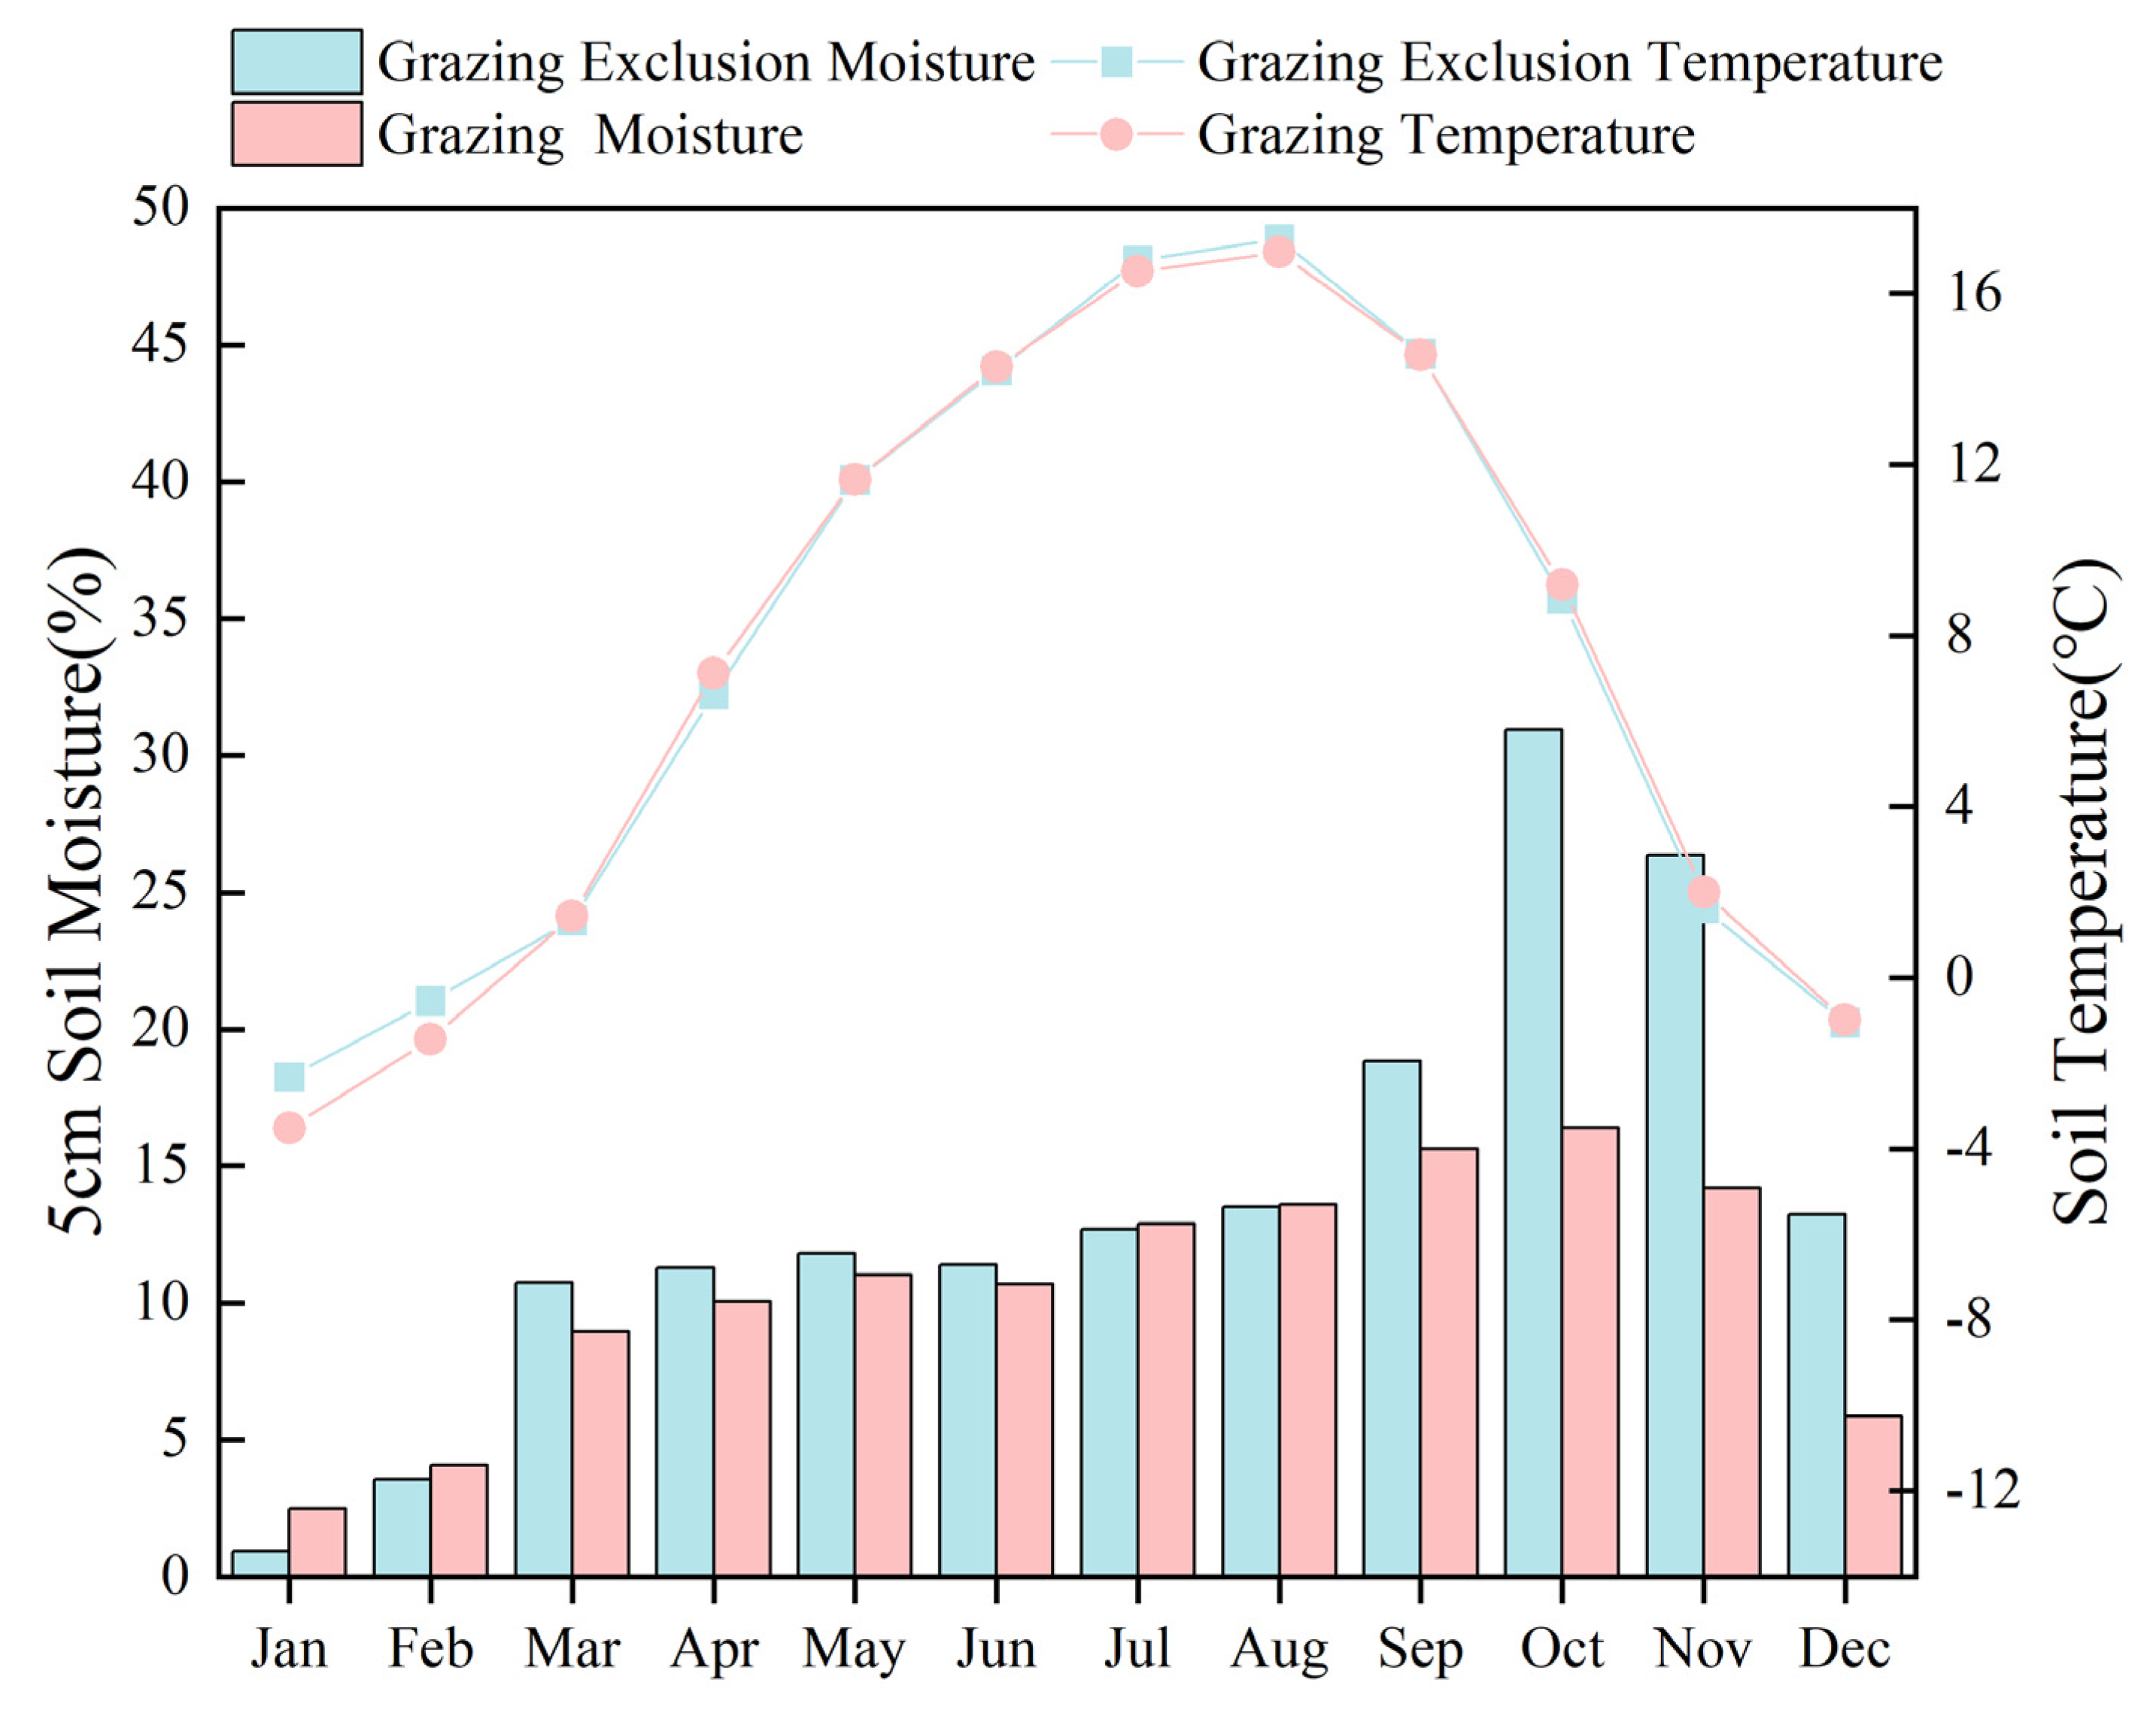
2.2. Soil Temperature and Moisture Measurements

METER 5TM moisture and temperature probes (Shandong Yuanchuang Instrument Co., Ltd., Inc., Jining, China) were placed at a depth of 5 cm in the two experimental plots (close to the sampling plots), i.e., GE and FG, to record soil temperature and humidity every half an hour on average. The data were monitored from 7 January 2023 to 1 January 2024.

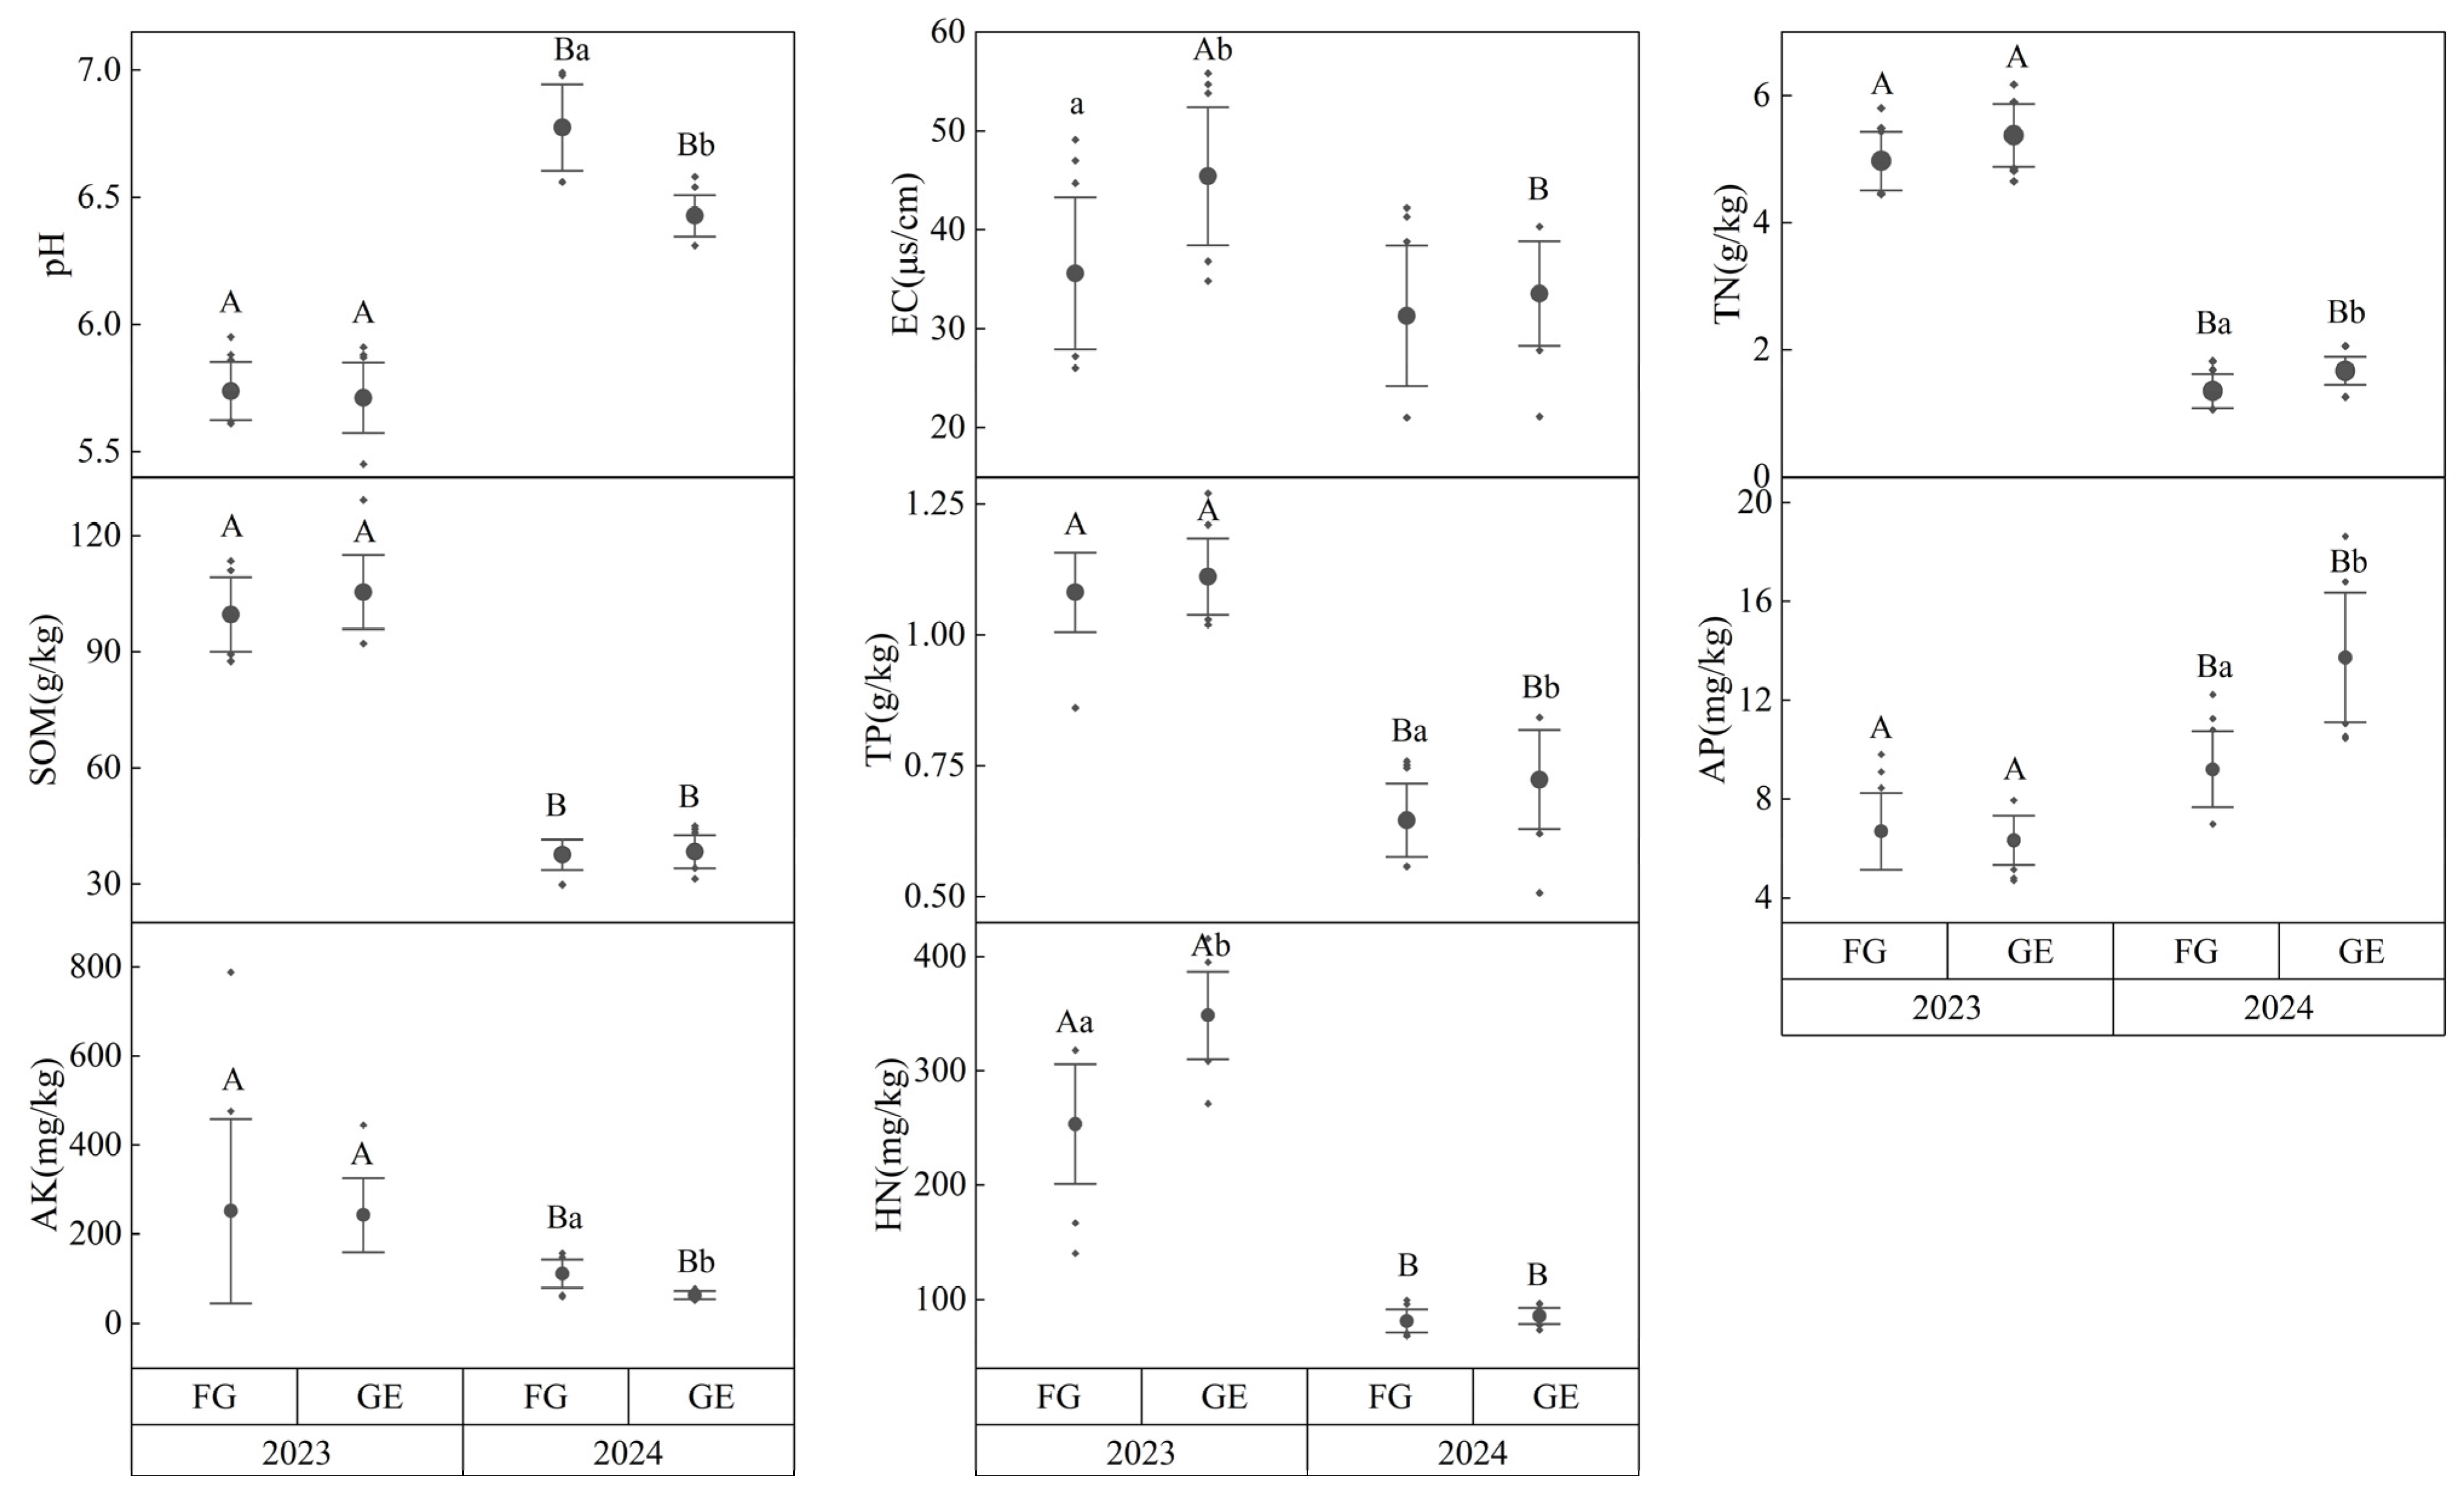
2.3. Sampling and Analysis

We randomly selected four 1 m × 1 m plots (the distance between each sampling plot was more than 2 m and more than 1 m away from the fence) from the grazing and grazing exclusion grasslands in late July 2023 and late July 2024 to collect leaf and root samples from the dominant plants (Table 1). Each 1 × 1 m plot was divided into 25 small quadrats. For each plant species, the number of occurrences in all 25 quadrats was counted. The occurrence frequency of each plant species was divided by the total number of plots and then multiplied by 100 to obtain the frequency percentage. Approximately 10 g of leaf samples and 10 g of root samples per species were collected each year for measuring physiological indices. Each year, 4–7 root samples per species from each of GE and FG plots were used to measure the root traits. The total root length (RL), average root diameter (RD), root surface area (RSA), root volume (RV), and root tips (RT) were measured using an Epson Perfection V750 scanner (Seiko Espon Corporation, Nagano-ken, Japan) and the WinRhizo root analysis system. At each sampling point, the five-point sampling method [36] was used to collect 0–50 cm depth soil as one sample and bring it back to the laboratory to determine the soil properties.
Specific root length (SRL), specific surface area (SRA), and root tissue density (RTD) were calculated using the following Equations (1)–(3):
S R L ( c m / g ) = R L c m / R B ( g )
S R A ( c m 2 / g ) = R S A c m 2 / R B g
R T D ( g / c m 3 ) = R B g / R V c m 3
where RB is the root biomass.
Leaf samples and the remaining root samples were used to measure the physiological indices of cold resistance in plants. Superoxide dismutase (SOD) was measured using the nitrogen blue tetrazole method, peroxidase (POD) using the guaiacol colorimetry method, catalase (CAT) using the ultraviolet absorption method, and malondialdehyde (MDA) using the thiobarbituric acid method. The anthrone method was used to measure soluble sugar (SS), Coomassie bright blue staining for soluble protein (SP), and the sulfosalicylic acid method for proline (PRO). The soil properties were measured to determine the environmental factors that had the greatest influence on the physiological indices of plant cold resistance. Soil pH was determined using a pH meter, electrical conductivity (EC) was determined using the conductivity method, the soil organic matter (SOM) content was determined using the potassium dichromate capacity method, the total nitrogen (TN) content was determined using the potassium dichromate–sulfuric acid nitration method, and the total phosphorus (TP) content was determined using the sodium hydroxide melting–molybdenum antimony resistance colorimetric method. The content of available phosphorus (AP) was determined via sodium bicarbonate extraction and the molybdenum–antimony resistance colorimetric method, the content of available potassium (AK) was determined using a flame photometer, and the content of hydrolyzed nitrogen (TN) was determined via the alkali hydrolysis diffusion method.

2.4. Comprehensive Evaluation of Cold Resistance

The membership function method in Fuzzy mathematics [37] was applied for a comprehensive evaluation, and its calculation formula is as follows in Equations (4)–(6):
U X j = X j X m i n X m a x X m i n                   j = 1,2 , , n
where X j is the j t h comprehensive indicator and X m a x , X m i n indicate the maximum and minimum values of the j t h comprehensive indicator.
W j = P j j = 1 n P j                   j = 1,2 , , n
where the weight W j represents the importance degree of the j t h comprehensive indicator in all indicators, and P j represents the contribution rate of the j t h comprehensive indicator of various plants.
D i = j = 1 n U X j × W j                   i = 1,2 , , m ;   j = 1,2 , , n
where D i is the comprehensive evaluation value of cold resistance of various plants evaluated using comprehensive indices, and m is the number of plant species.

2.5. Statistical Analyses

ArcMap10.5 was used to draw a general map of the study area, and Origin 2025 was used to conduct a principal component analysis (PCA) and draw the resulting analysis chart. Canoco (version 5.0) was used to conduct a redundancy analysis (RDA). The root morphological characteristics under each treatment were analyzed using WinRHIZO 2013 root image analysis system software, and SPSS 26 statistical software was used for a one-way ANOVA to analyze the differences in root morphological characteristics of plants within and outside of the fenced areas (the significance level was set at 0.05). IBM SPSS 26 was used to perform a one-way ANOVA of the physiological indices of the plants’ cold resistance. Correlations between the plants’ morphological traits and physiological indices of cold resistance were determined using Spearman’s correlation analysis.

3. Results

3.1. Results of Soil Temperature, Humidity, and Soil Properties in Grazing Exclusion and Grazing Grasslands

The average annual temperature of the soil in the GE and FG plots was 7.58 °C and 7.46 °C, respectively, and the average annual humidity was 14.10% and 10.65%. There was a difference in annual soil temperature and humidity between the GE and FG plots. The monthly soil temperatures of the GE site in January, February, July, and August were higher than those of the FG site. In contrast to soil temperature, the soil moisture in the GE site was higher than that in the FG site in all months except January, February, July, and August, and a difference was observed from September to December (Figure 2).
There were significant differences in soil properties between the GE and FG plots in the same year (Figure 3). In 2023, the soil EC and HN of the GE site were significantly higher than the FG site. In 2024, the soil pH and AP in the GE site were significantly lower than that in the FG site, while TN, TP, and AP were significantly higher than that in the FG site. In the same treatment of different years, except for the EC of the FG plot, there were significant differences. pH and AP increased significantly within two years, while EC, SOM, TN, TP, AP, and HN decreased significantly within two years.

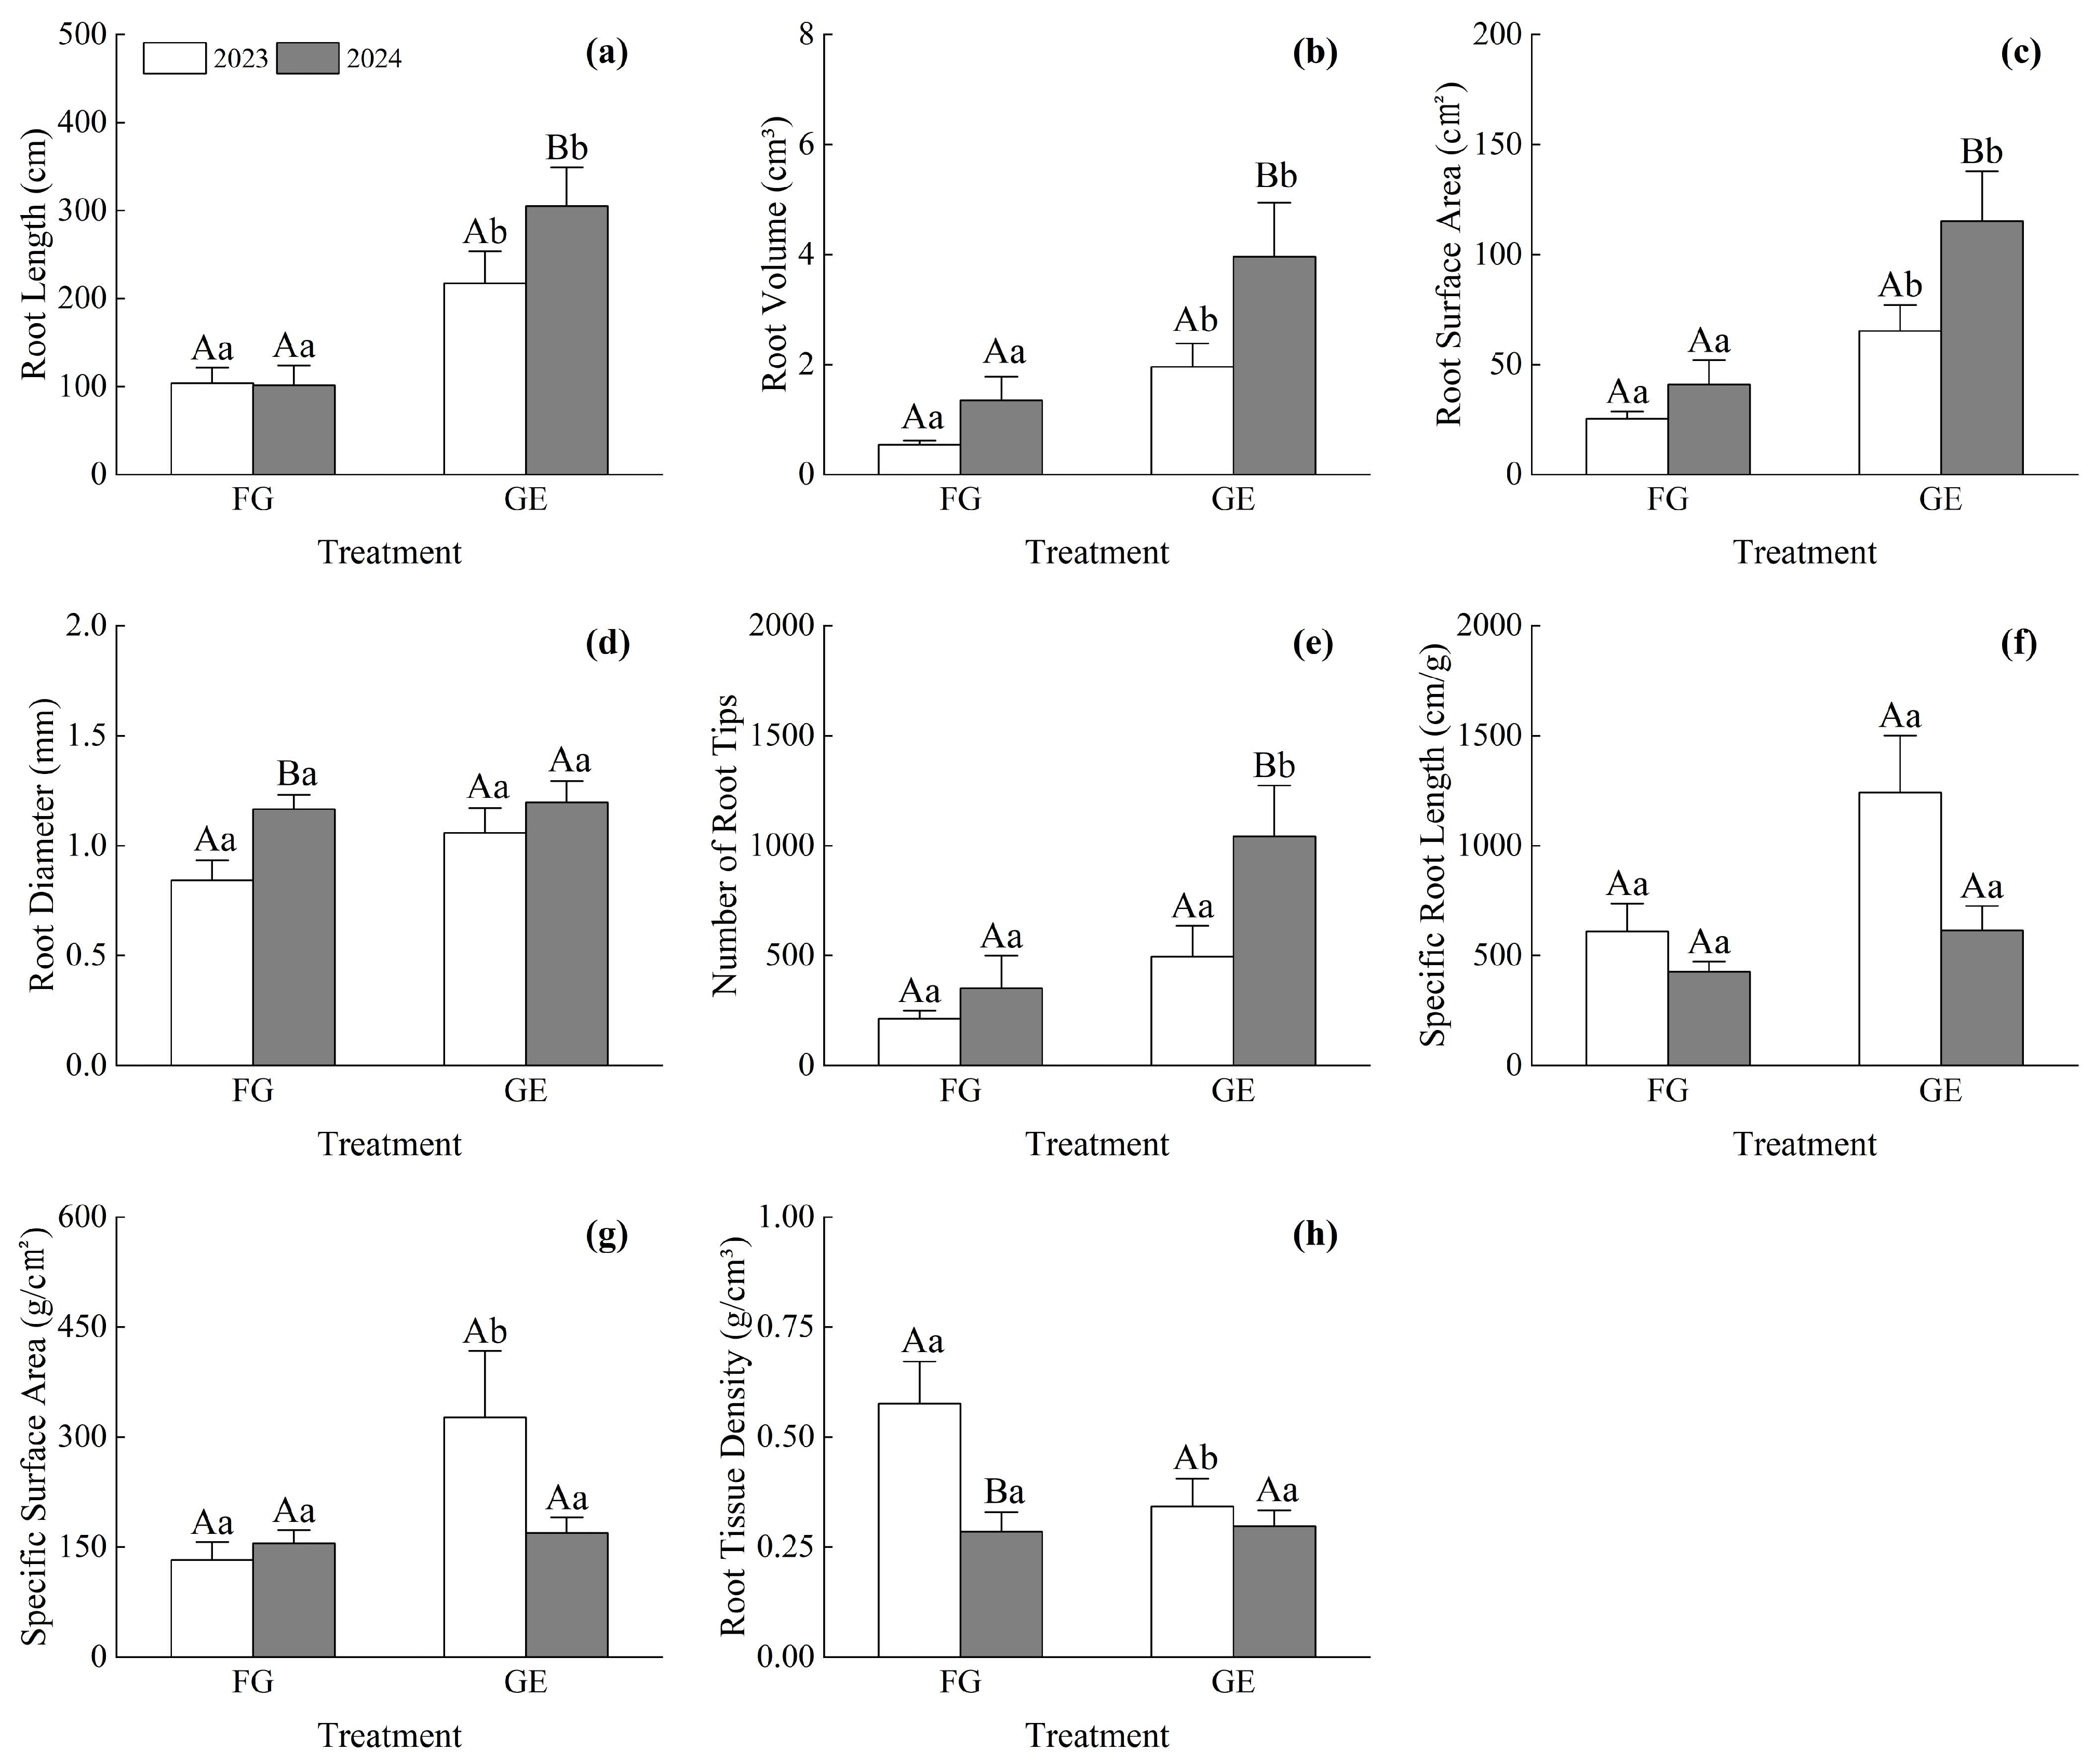
3.2. Differences in Root Morphological Traits

The results of the one-way analysis of variance showed that there were some differences in root morphological traits between the GE and FG sites (Figure 4). In the same year, compared with the FG site, the roots increased at the GE site, with significant differences in total root length, root volume, and surface area (p < 0.05). The specific surface area of the GE plot was significantly higher than that of the FG plot, and the root tissue density was significantly lower than that of the FG plot in 2023 (p < 0.05). Under the same treatment, there were significant differences in the total root length, total volume, root surface area, and number of root tips, and significant differences in root average diameter and tissue density in the FG plot.
Figure 5a shows the results of the principal component analysis of root morphological traits in 2023. The explanations of the first and second principal components are 58.5% and 21.2%, respectively, and the first two axes together explain 79.7% of the variance. The plants under FG treatment were mainly located in the negative section of the second axis, while the plants under GE treatment were mainly located in the positive section, indicating that the plants under FG treatment had a higher specific root length and area, while the mean root diameter decreased, which corresponded to the “resource acquisition” strategy of the root economic spectrum (RES). The GE plants had a larger mean root diameter and root surface area, and mainly adopted the “resource conservation” strategy. Figure 5b shows the results of the principal component analysis for the root morphological traits in 2024. The first and second principal components accounted for 43.8% and 30.9%, respectively, and the first two axes together accounted for 74.7% of the variance. The gramineous plants under GE treatment were mainly located in the positive section of the first axis, while the non-gramineous plants under FG treatment and GE treatment were mainly located in the negative section of the first axis, indicating that the specific root length and specific root area of gramineous plants under GE treatment were reduced, corresponding to the “resource conservation” strategy of the root economic spectrum. The non-gramineous plants adopted the strategy of “resource acquisition” under FG and GE treatment.

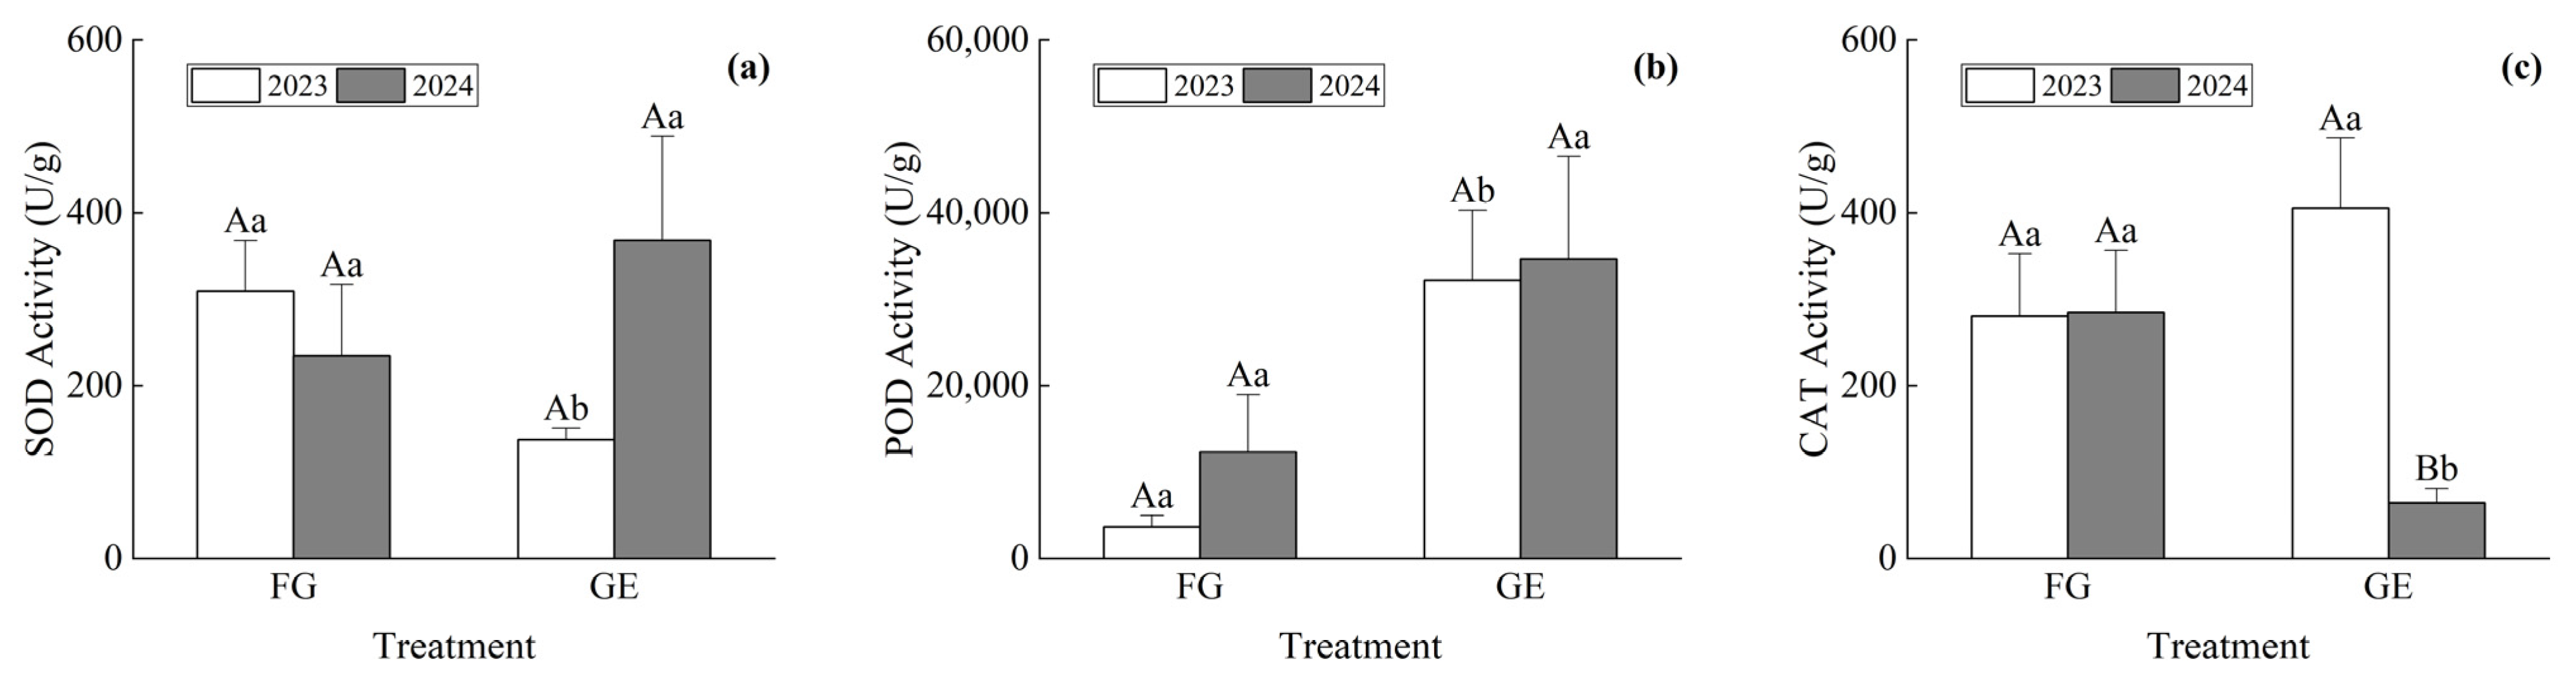
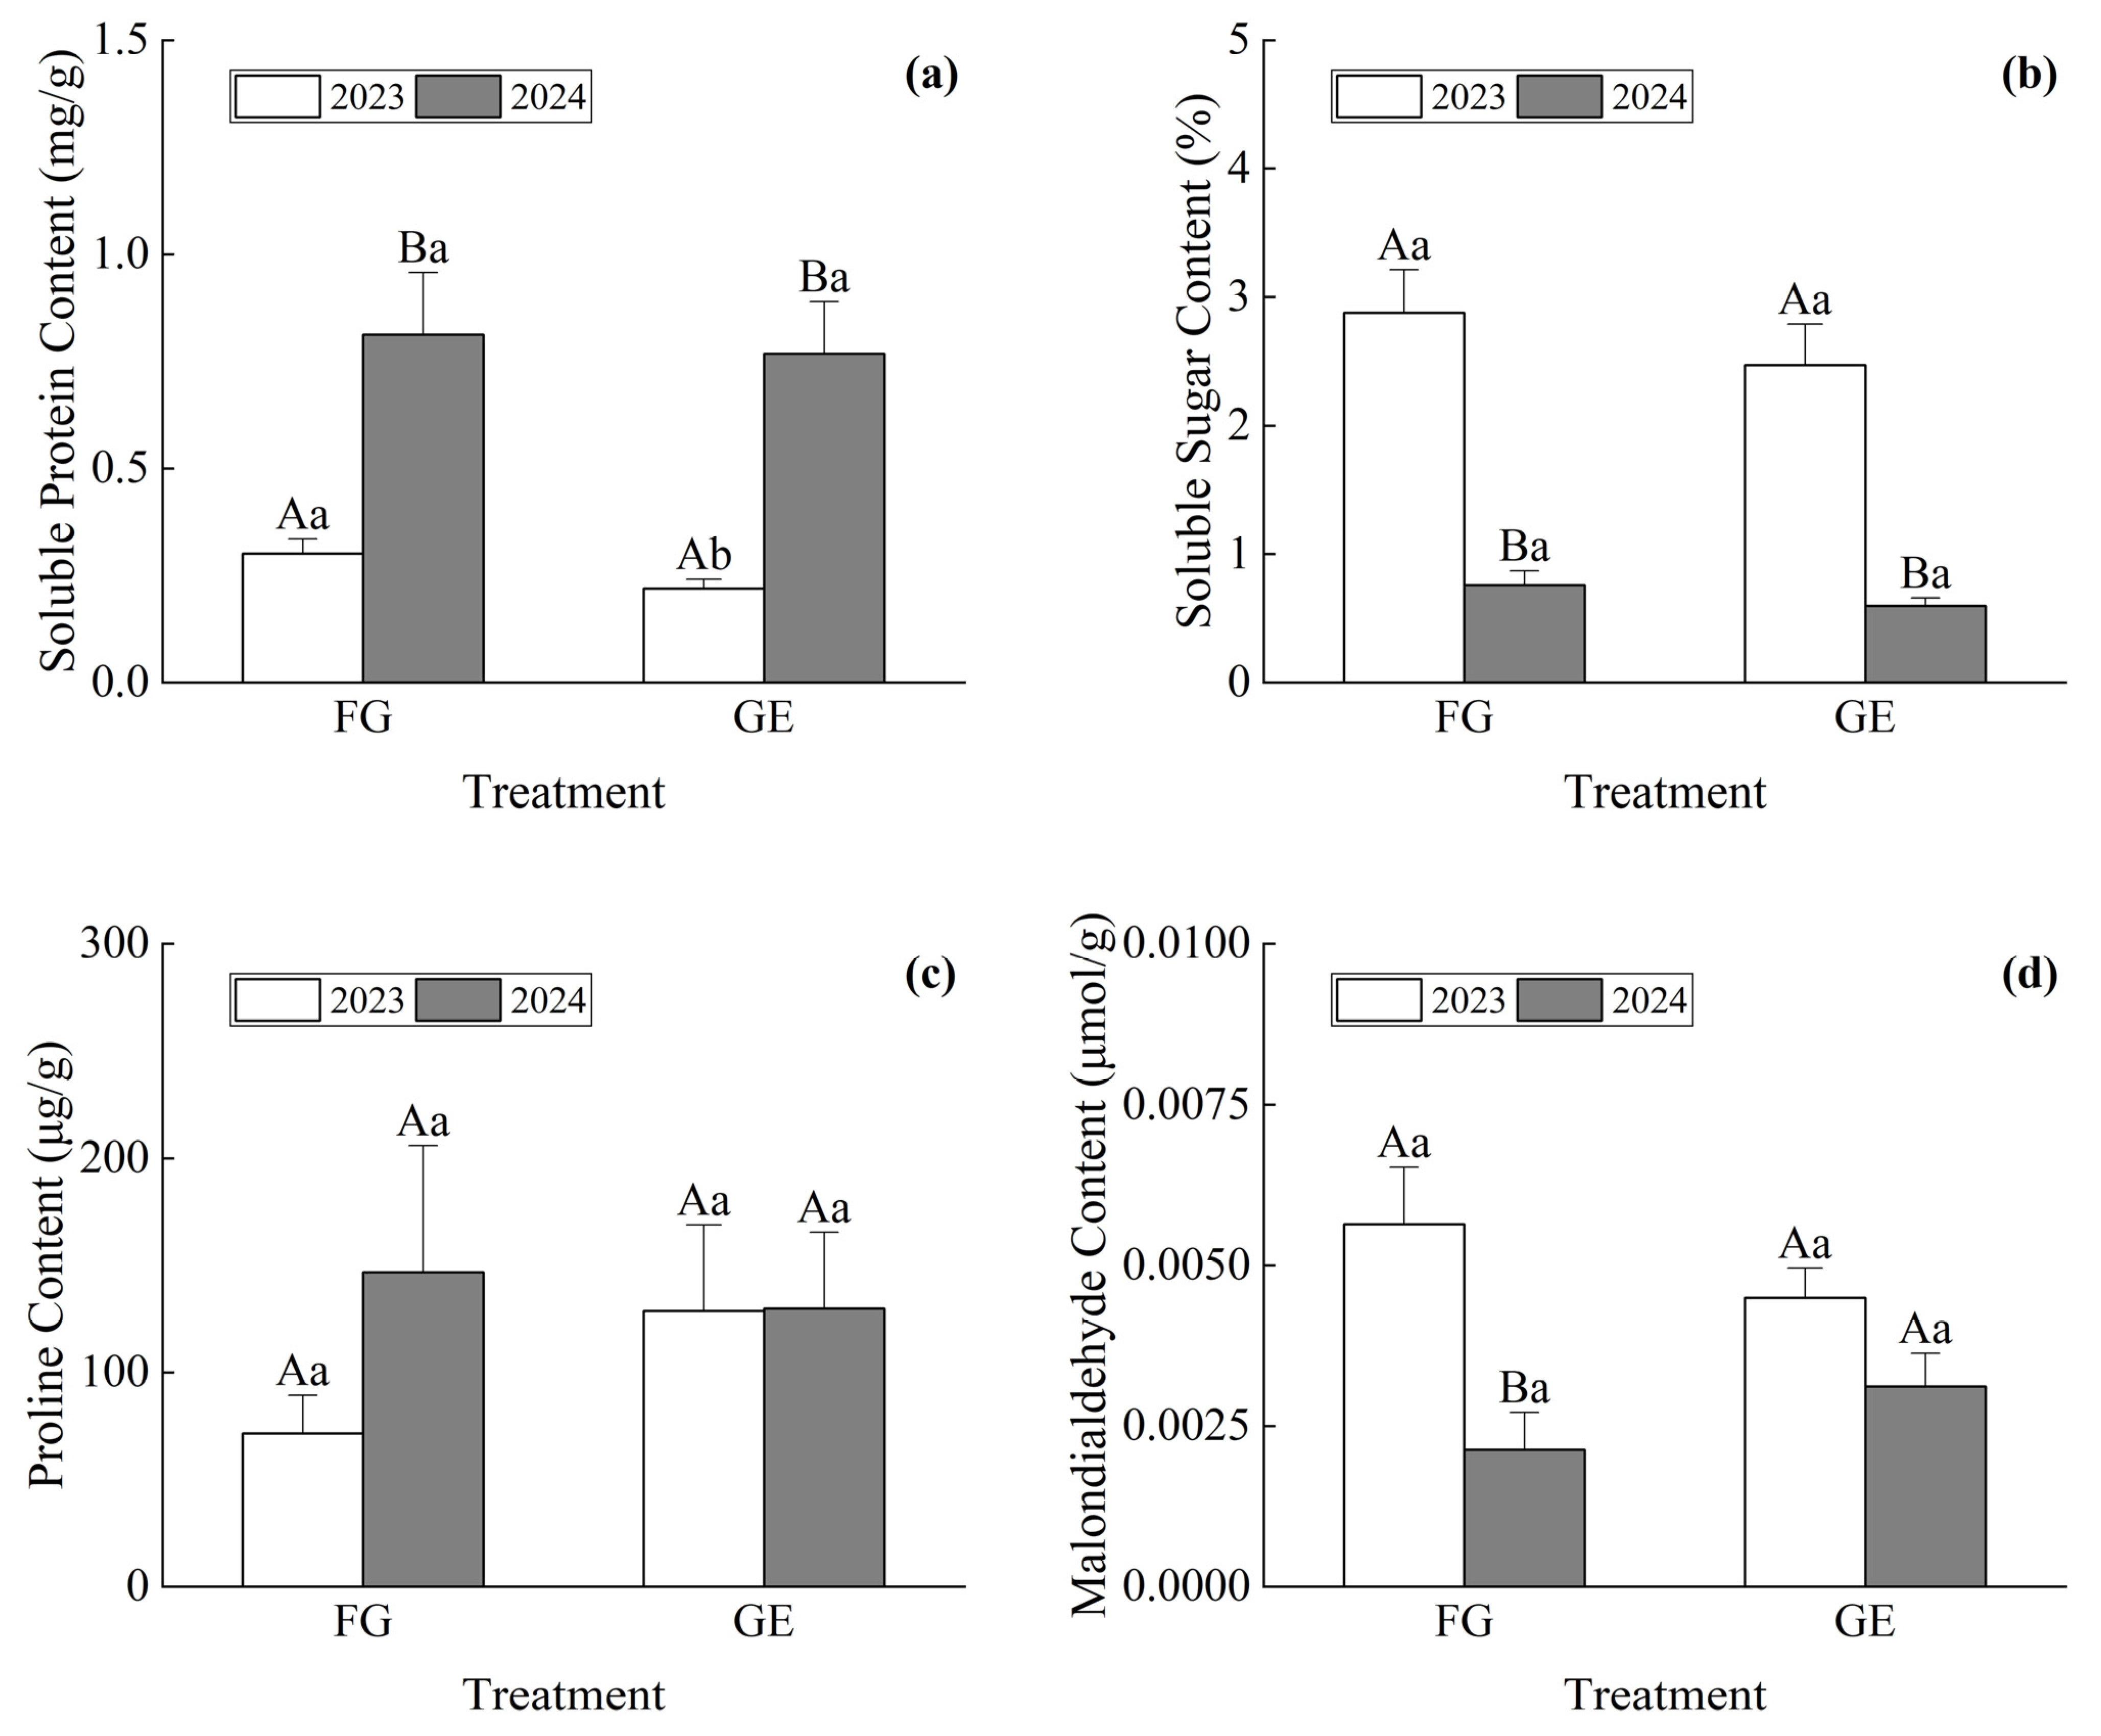
3.3. Plant Cold Resistance Difference

There were certain differences in antioxidant enzyme activities between the two grazing modes: the CAT activity of the GE treatment was significantly lower than that of the FG treatment, while the activities of SOD and POD were significantly different for both treatments in 2023 (Figure 6). There were significant differences in the contents of SP and SS in the same grazing mode between years, the contents of MDA decreased between years, and the contents of SP in the GE plot were significantly lower than those in the FG plot in 2023 (Figure 7).

3.4. Comprehensive Evaluation of Plant Cold Resistance

Principal component analysis was performed on seven physiological indices of cold resistance for six species, and the results are shown in Table 2. As can be seen from the table, the contribution rates of the first three comprehensive indicators are 37.569%, 19.462%, and 18.481%, respectively, and the cumulative contribution rate reaches 75.512%. Theoretically, a cumulative contribution rate over 70% can be considered to represent most of the information of the original indicators and can be used to evaluate plant cold resistance.
According to the comprehensive evaluation value calculated using the plant cold resistance indices over the two years (Table 3), the comprehensive score of grazing FGT was the highest, followed by GET, and the lowest was exhibited for GEP. The D value of comprehensive cold resistance decreased in the following order of magnitude: FGT > GET > GEE > FGC > FGS > GES > GEZ > GEP. In general, the cold resistance of grasses under grazing treatment was higher than that under grazing exclusion treatment, and the cold resistance of Gramineae species was lower than that of non-Gramineae species. The results indicated that the differences in cold resistance between grazing exclusion and grazing were mainly due to species changes caused by the different treatment methods, rather than the physiological and ecological adaptations of the same plant to different treatments.

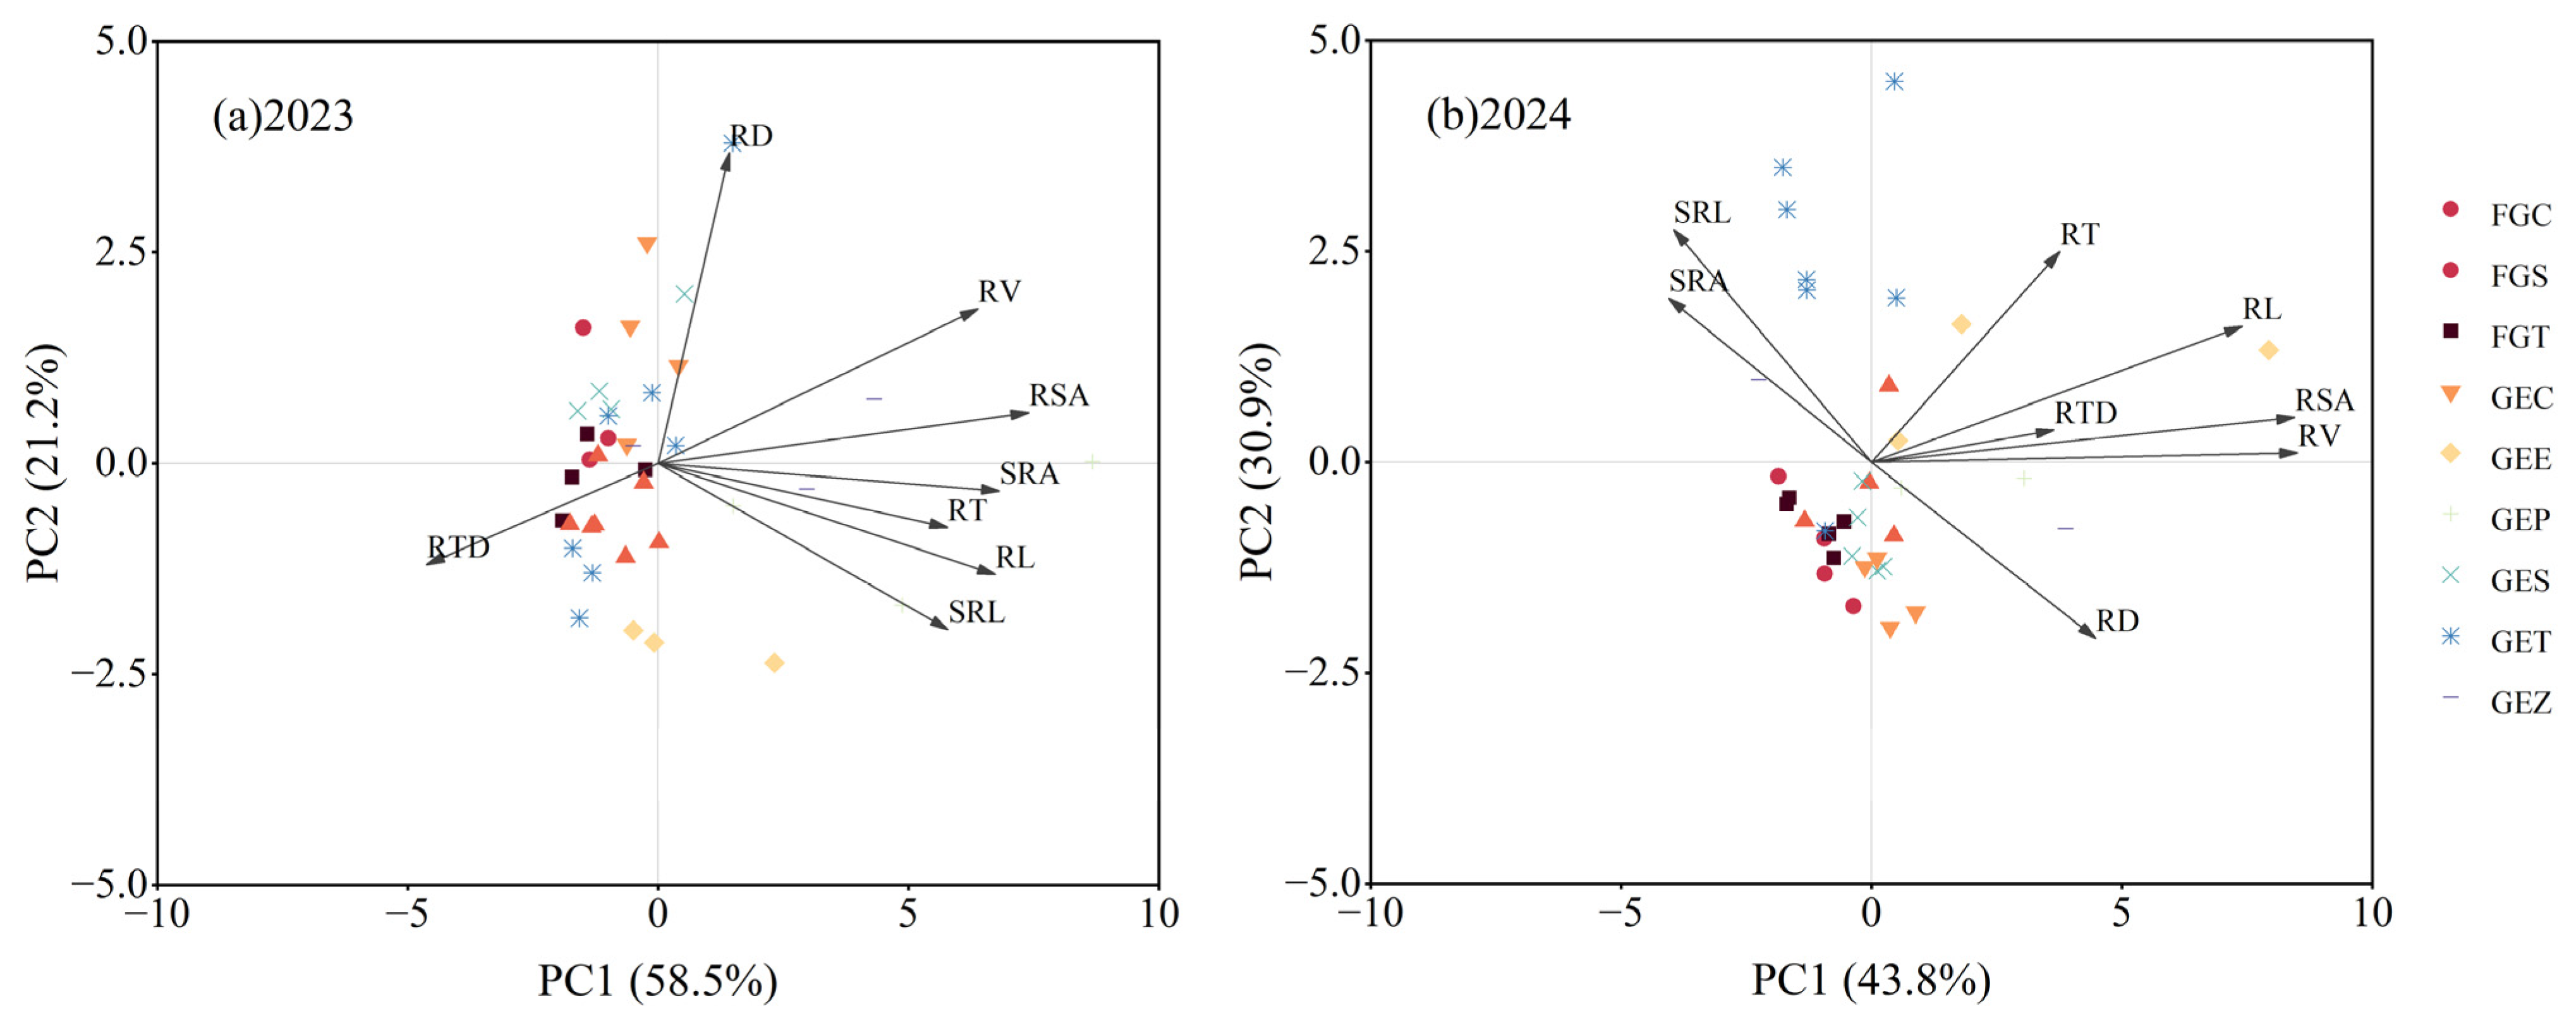
3.5. Correlation Analysis and Redundancy Analysis Between Root Properties and Cold Resistance

The Spearman correlation results of a total of 55 determination results (including duplications) of six plant species collected from the grazing exclusion and grazing plots over two years showed (Table 4) that PRO was significantly negatively correlated with average root diameter; POD was significantly positively correlated with RL and SRL; SP was significantly negatively correlated with SRL; CAT was significantly negatively correlated with RSA; and SS was significantly negatively correlated with RV, RSA, RD, and RT. The correlation coefficient was more than 0.3 and less than 0.5, indicating that there was a moderate correlation between these indices and that there was a certain correlation between plant root morphological traits and the physiological indices of plant cold resistance.
A redundancy analysis was performed to examine the relationships between root morphological traits, soil properties, and cold resistance in plants (Figure 8). The total explanation rate of root morphological traits and soil properties to plant cold tolerance was 28.8%, and the contribution rate of RDA1 and RDA2 was 19.74% and 9.05%, respectively. The correlation of RDA1 and RDA2 was 0.8059 and 0.8384, respectively. Soil pH explained 16% and RL explained 12.9% of the total variation of physiological indices of plant cold resistance, indicating that soil pH and RL had the greatest influence on plant cold resistance physiological indices.

4. Discussion

4.1. Changes in Plant Root Characteristics and Trade-Offs Between Root Morphological Traits

Climate change and chronic overgrazing threaten the function and stability of global grassland ecosystems [20]. In general, the presence of herbivores reduces vegetation cover and increases ground exposure, leading to decreases in above-ground biomass and litter [38]. Conversely, grazing exclusion by fencing can improve the grassland ecosystem structure and function by increasing vegetation cover, diversity, above-ground biomass, soil moisture, and nutrition [39,40,41]. Plant roots, which are connected to the above-ground and subsurface parts of the ecosystem, supply nutrients and water to plants and make important contributions to plant growth and biomass [42]. Changes in root morphological characteristics directly affect the absorption and utilization of soil nutrients and water by plants [43]. In this study, the RL, RV, and RSA of plants in GE were significantly higher than those in FG (p < 0.05). For individual plants, the RL, RV, RSA, and RT of GEP in GE were significantly higher than those in the other plants. Studies have shown that plants can increase their competitiveness by increasing total root length, root surface area, and total volume and reducing average root diameter [44]. Grazing plants had more specific root length and area, and decreased average root diameter, indicating that grazing plants had strong competitiveness and adopted a resource acquisition strategy based on the root economic spectrum, which was consistent with the grazing results of Stipa grandis by Chen et al. [45] in Xilinguo Grassland, Inner Mongolia. The average root diameter and root surface area of grazing exclusion plants increased, while the specific root length and specific root area decreased, indicating that grazing exclusion Gramineae had a weak ability to obtain soil resources [46,47] and adopted resource conservation strategy; in addition, Cao, Wei, Adamowski, Biswas, Li, Zhu, Liu, and Feng [32] also found that with the increase of grazing exclusion years, plants adopted a resource conservation strategy.

4.2. Difference in Cold Resistance and Comprehensive Evaluation

Different soil conditions have different effects on plant growth and development, and changes in temperature affect the normal physiological and biochemical processes of plants [48]. In the present study, the average annual temperature and humidity of the grazing exclusion grasslands were much higher than those of the grazing grasslands, which is consistent with the results of Yan et al. [49]. However, there are also studies showing that grazing leads to a decrease in soil moisture, but there was no significant difference in soil temperature between grazing and grazing exclusion conditions [50,51]. The main reason for the differences in research results may be the different responses of soil temperature to grazing caused by different vegetation types. The temperature in the grazing exclusion grassland plot in January and February was slightly higher than that in the grazed grassland plot, which may have been due to the decrease in vegetation (canopy and litter) and snow cover caused by grazing, the decrease in the insulating effect of vegetation and litter on local net radiation and soil heat flux, and the weakening of the thermal insulation effect on soil caused by grazing [49,50]. In the growing season, the temperature of the grazing exclusion grassland was higher than that of the grazed grassland, which is contrary to the results obtained by others regarding the warming of the soil in grazed grassland in the warm season. This may be because Hongyuan County has less sunshine and less heat, and the warming effect on grazed bare grassland is not significant. Liu et al. [52] analyzed the leaf physiological indices of subalpine meadow plants and found that the plant PRO and soluble sugar were significantly negatively correlated with soil water activity and significantly positively correlated with temperature. In this study, there were significant differences in POD, SOD activity, and SP content between the grazing exclusion and grazed grassland, and there was indeed a difference in temperature and humidity between the two grazing conditions in July 2023, indicating that the physiological indices of the plants differed in response to different grazing modes. According to the temperature and humidity data in July 2023 and July 2024, the average monthly precipitation in July 2024 in Hongyuan County reached 189.7 mm, far exceeding the 90.8 mm recorded for July 2023. It is possible that there was little difference in soil temperature and humidity between the grazing exclusion and grazed grassland in 2024, so there was also no significant difference in the physiological indices of plant cold resistance.
The reactive oxygen species (ROS) in plants are mainly regulated by enzymatic and non-enzymatic oxidation systems. SOD can transform free radicals into H2O2, which has toxic effects on plant cells [53]. Among the three antioxidant enzymes in the grazing areas, only SOD had high activity in 2023; this is the first line of defense in the plant antioxidant system [54], indicating that the plants in grazing areas are greatly damaged by ROS and may be damaged by low temperatures. Soluble protein, soluble sugar, and proline are important osmoregulatory substances that can reduce the effects of various stresses and play decisive roles in plant growth and regeneration [55]. In this study, the soil moisture in the grazing area was low in August, which may have been due to a decrease in soil moisture caused by grazing. Plants adapt to water changes through osmotic regulation [56]. In this study, the soluble protein and soluble sugar activity in the grazing grasslands were higher than those in the grazing exclusion grasslands in July, indicating that the plants in grazing grasslands improved their resistance to cold stress mainly by increasing soluble protein and sugar activity. In addition, plant regeneration is improved in grazing areas [57]. The soluble protein content in both the grazing exclusion and grazing grassland in 2024 was significantly higher than that in 2023, with the opposite results found for soluble sugar and soluble protein. The soluble protein content in both the grazing exclusion and grazing grassland areas in 2024 was significantly reduced, and the change in proline content was the same as that of soluble protein, but also slightly increased, indicating that the physiological indices adopted by the plants to resist cold in different years were different. In 2023, the plants’ resistance to cold was mainly improved by increasing the content of soluble sugar. In 2024, the resistance to cold was mainly improved by increasing the contents of soluble protein and proline [58,59]. Based on the completely different results above, it is necessary to further explore the mechanism of selecting certain physiological indices to improve the cold resistance in plants.
Song et al. [60] studied different grazing treatments in Inner Mongolia and found that the changes in plant physiological indices of cold resistance differed under different grazing treatments in different months. The results of continuous grazing treatment in August, which was similar to this study, showed that POD activity, CAT activity, and SS content were significantly higher than under no-graze treatment; PRO activity under grazing treatment was significantly lower than under no-graze treatment; and SOD activities, MDA, and SP content did not significantly differ. The results for POD activity were consistent with the results in this study, and other physiological indices were significantly different, which may indicate a significant correlation with the study site. The main growth-limiting factor among the plants in Inner Mongolia was drought, while in this study temperature was the main growth-limiting factor. However, Song, Pan, Gong, Li, Liu, Yang, Zhang, and Baoyin [60] found significant differences in the changes in physiological indices during different months and different grazing modes of plants. Therefore, to obtain a more comprehensive understanding of the changes in the physiological indices of plant cold resistance at different times, it is necessary to conduct long-term sampling research.
Plant cold resistance is a complex trait controlled by multiple factors. At present, the comprehensive evaluation of plant cold resistance mainly involves principal component analysis and the membership function method. Nan et al. [61] used the membership function method to evaluate the cold resistance of different root types of Medicago sativa L., and found that the cold resistance of branching roots was better than that of single straight roots. Li et al. [62] compared the cold resistance of different Gramineae species and concluded that the cold resistance of Poa alpina L. was higher than that of Elymus junceus and Agropyron inerme. In this study, the cold resistance of eight species of plants in grazing exclusion and grazing grassland was evaluated comprehensively, finding that the cold resistance of Gramineae was lower than that of non-Gramineae varieties.

4.3. Relationship Between Physiological Indices of Plant Cold Resistance, Root Morphological Traits, and Soil Properties

When the total amount of available resources is limited, plants optimize the allocation of resources among functional traits and adjust, transform, and compensate for their own functions according to the resource environment, which is ultimately reflected in the organizational structure and physiological traits of the plant organs [63,64]. Plant roots can affect soil enzyme activity through resource input, and root morphology is an important factor in altering enzyme activity [42,65,66,67]. Song, Pan, Gong, Li, Liu, Yang, Zhang, and Baoyin [60] reported a complex relationship between the physiological characteristics of Leymus chinensis and grazing. Pan et al. [68] showed that grazing disturbance affected the community diversity and physiological characteristics of L. chinensis and redistributed plant resources, resulting in changes in MDA content and CAT activity. In this study, there was a correlation between the physiological indices of plant cold resistance and the morphological traits of plant roots and root length, among which root morphological traits had the greatest influence on cold resistance. This indicated that the main reason for the differences in cold resistance between the grazing exclusion and grazing areas was the recovery and growth of Gramineae plants after fencing, replacing Cyperaceae as the dominant plants. As the plant root length increased, the plants’ response to the environment changed, and the physiological indices of plant cold resistance also changed.
Although some previous studies have shown that grazing exclusion has a positive [39] or neutral effect [69,70] on soil pH, most grasslands in China showed a trend of decreased soil pH due to grazing exclusion [71]. Yuan et al. [72] found that the soil pH of alpine meadows was negatively correlated with vegetation cover and biomass and that a high soil pH limits plant growth. Grazing exclusion promotes biomass accumulation in humid areas [73,74], thereby affecting the decomposition of dead leaves and the secretion of root exudates, resulting in a decrease in soil pH. Due to the negative effects of grazing exclusion on soil pH in grassland ecosystems and the deposition of atmospheric nitrogen and sulfur in grassland, the soil in China is acidifying [75]. The continuous soil acidification further affects the physiological activity of plants [76]. In this study, soil pH was negatively correlated with the physiological indices of plant cold resistance, and was the most important factor affecting plant cold resistance among the soil properties. Soil acidification caused by grazing exclusion reduced the plant cold resistance. This study provides a scientific basis for optimizing grazing management strategies and restoring degraded grassland. However, the study relied on two years of data, which may not be sufficient to capture the long-term dynamics of root trait plasticity or soil feedback. Long-term soil dynamics will be monitored in the future if conditions permit.

5. Conclusions

Through the analysis of temperature and humidity between grazing exclusion grassland and grazing grassland, plant root morphological traits, and physiological indices of cold resistance, this study drew the following conclusions: (1) Grazing led to a reduction in soil temperature and water loss. Grazing exclusion significantly reduced the soil pH and available potassium and significantly increased the contents of total nitrogen, total phosphorus, and available phosphorus. (2) The morphological characteristics of the grazing exclusion grassland were higher than those of the grazing grassland, indicating that grazing exclusion is conducive to the growth of plant roots. (3) In the GE plots, the Gramineae species adopted resource conservation strategies, and non-Gramineae plants in both plots adopted resource acquisition strategies. (4) The cold resistance of the same plant in the grazing treatment was higher than that in the grazing exclusion treatment, and the cold resistance of Gramineae species was lower than that of non-Gramineae species. (5) There was a certain correlation between the plant root morphological traits, soil properties, and physiological indices of plant cold resistance, with root length and soil pH having the greatest influence on the physiological indices of plant cold resistance.

Author Contributions

J.C. was responsible for study conceptualization, methodology, software, formal analysis, and writing—original draft. Y.Y. assisted with funding acquisition, conceptualization, formal analysis, and writing (review and editing). All authors have read and agreed to the published version of the manuscript.

Funding

This study was funded by the Sichuan Science and Technology Program (2023NSFSC0195).

Institutional Review Board Statement

Not applicable.

Informed Consent Statement

Not applicable, the study did not involve humans.

Data Availability Statement

The data underlying this article will be shared on reasonable request to the corresponding author.

Acknowledgments

The authors thank the financial support from Yan Yan, and also thank the Ruoergai Wetland Ecological Research Station of Chengdu Institute of Biology for providing experimental sites.

Conflicts of Interest

The authors declare no conflicts of interest.

Abbreviations

FGGrazing grasslandsSSSoluble sugar
GEGrazing exclusion grasslandsSPSoluble protein
ECElectrical conductancePROProline
SOMSoil organic matterMDAMalondialdehyde
TNTotal nitrogenRLRoot length
TPTotal phosphorusRTNumber of root tips
APAvailable phosphorusRDRoot mean diameter
AKAvailable potassiumRSARoot surface area
HNHydrolyzable nitrogenRVRoot volume
SODSuperoxide dismutaseSRLSpecific root length
PODPeroxidaseSRASpecific root area
CATCatalaseRTDRoot tissue density

References

  1. Han, Y.; Wu, Y.T.; Cui, J.H.; Li, H.Y.; Li, H.; Zhang, J.H.; Miao, B.L.; Wang, L.X.; Li, Z.Y.; Liang, C.Z. Temporal Stability of Grazed Grassland Ecosystems Alters Response to Climate Variability, While Resistance Stability Remains Unchanged. Agronomy 2023, 13, 2030. [Google Scholar] [CrossRef]
  2. Li, W.; Li, X.; Zhao, Y.; Zheng, S.; Bai, Y. Ecosystem structure, functioning and stability under climate change and grazing in grasslands: Current status and future prospects. Curr. Opin. Environ. Sustain. 2018, 33, 124–135. [Google Scholar] [CrossRef]
  3. Odriozola, I.; García-Baquero, G.; Laskurain, N.A.; Aldezabal, A. Livestock grazing modifies the effect of environmental factors on soil temperature and water content in a temperate grassland. Geoderma 2014, 235–236, 347–354. [Google Scholar] [CrossRef]
  4. Wang, L.J.; Li, P.; Li, T.; Zhou, X.L.; Liu, Z.L.; Zou, Z.Y.; Zhu, Q.A.; Peng, C.H. Grazing alters vegetation phenology by regulating regional environmental factors on the Tibetan Plateau. Agric. Ecosyst. Environ. 2023, 351, 108479. [Google Scholar] [CrossRef]
  5. Nasrallah, H.A.; Balling, R.C. The effect of overgrazing on historical temperature trends. Agric. For. Meteorol. 1994, 71, 425–430. [Google Scholar] [CrossRef]
  6. Makarov, V.; Savvinov, G.; Gavrilieva, L.; Gololobova, A. The Effect of Grazing on the Temperature Regime of the Alas Soils of Central Yakutia. Land 2020, 9, 365. [Google Scholar] [CrossRef]
  7. Moore, C.E.; Meacham-Hensold, K.; Lemonnier, P.; Slattery, R.A.; Benjamin, C.; Bernacchi, C.J.; Lawson, T.; Cavanagh, A.P. The effect of increasing temperature on crop photosynthesis: From enzymes to ecosystems. J. Exp. Bot. 2021, 72, 2822–2844. [Google Scholar] [CrossRef]
  8. Saharan, B.S.; Brar, B.; Duhan, J.S.; Kumar, R.; Marwaha, S.; Rajput, V.D.; Minkina, T. Molecular and Physiological Mechanisms to Mitigate Abiotic Stress Conditions in Plants. Life 2022, 12, 1634. [Google Scholar] [CrossRef]
  9. Liu, Z.; Li, X.; Li, F.; Tao, Y.; Liu, L.; Wang, Z.; Sun, Q. Response of Alfalfa Root Traits to Fall Dormancy and Its Effect on Winter Hardiness. Sci. Agric. Sin. 2015, 48, 1689–1701. [Google Scholar]
  10. Castonguay, Y.; Laberge, S.; Brummer, E.C.; Volenec, J.J. Alfalfa winter hardiness: A research retrospective and integrated perspective. In Advances in Agronomy; Sparks, D.L., Ed.; Elsevier: Amsterdam, The Netherlands, 2006; Volume 90, pp. 203–265. [Google Scholar]
  11. Li, Z.; Wan, L.; Li, S.; Li, X.; He, F.; Tong, Z. Plastic response of Medicago sativa L. root system traits and cold resistance to simulated rainfall events. PeerJ 2021, 9, e11962. [Google Scholar] [CrossRef]
  12. Velikova, V.; Yordanov, I.; Edreva, A. Oxidative stress and some antioxidant systems in acid rain-treated bean plants—Protective role of exogenous polyamines. Plant Sci. 2000, 151, 59–66. [Google Scholar] [CrossRef]
  13. Guo, Y.; Shi, F. Dynamic Analysis of Physiological and Biochemical Substances in Two Types of Root Type Alfalfa during Overwintering Period. Legume Res.-Int. J. 2024, 11, 1884. [Google Scholar] [CrossRef]
  14. Janmohammadi, M.; Zolla, L.; Rinalducci, S. Low temperature tolerance in plants: Changes at the protein level. Phytochemistry 2015, 117, 76–89. [Google Scholar] [CrossRef] [PubMed]
  15. Janska, A.; Marsik, P.; Zelenkova, S.; Ovesna, J. Cold Stress Acclim—What Is Important Metab. Adjust? Plant Biol. 2010, 12, 395–405. [Google Scholar] [CrossRef]
  16. Zhang, Y.; Cong, B.; Wang, X.; Zhang, Q.; Du, X.; Tian, Y. Correlation Analysis of Cold Resistance and Antioxidant Enzyme Activities in Alfalfa Roots. Acta Agrestia Sin. 2021, 29, 244–249. [Google Scholar]
  17. Ni, J. Carbon storage in grasslands of China. J. Arid. Environ. 2002, 50, 205–218. [Google Scholar] [CrossRef]
  18. Kahmen, S.; Poschlod, P.; Schreiber, K.-F. Conservation management of calcareous grasslands. Changes in plant species composition and response of functional traits during 25 years. Biol. Conserv. 2002, 104, 319–328. [Google Scholar] [CrossRef]
  19. Yang, Z.A.; Xiong, W.; Xu, Y.Y.; Jiang, L.; Zhu, E.X.; Zhan, W.; He, Y.X.; Zhu, D.; Zhu, Q.A.; Peng, C.H.; et al. Soil properties and species composition under different grazing intensity in an alpine meadow on the eastern Tibetan Plateau, China. Environ. Monit. Assess. 2016, 188, 678. [Google Scholar] [CrossRef]
  20. Luo, C.Y.; Xu, G.P.; Chao, Z.G.; Wang, S.P.; Lin, X.W.; Hu, Y.G.; Zhang, Z.H.; Duan, J.C.; Chang, X.F.; Su, A.L.; et al. Effect of warming and grazing on litter mass loss and temperature sensitivity of litter and dung mass loss on the Tibetan plateau. Glob. Change Biol. 2010, 16, 1606–1617. [Google Scholar] [CrossRef]
  21. Yang, Z.A.; Zhu, Q.A.; Zhan, W.; Xu, Y.Y.; Zhu, E.X.; Gao, Y.H.; Li, S.Q.; Zheng, Q.Y.; Zhu, D.; He, Y.X.; et al. The linkage between vegetation and soil nutrients and their variation under different grazing intensities in an alpine meadow on the eastern Qinghai-Tibetan Plateau. Ecol. Eng. 2018, 110, 128–136. [Google Scholar] [CrossRef]
  22. Dong, S.K.; Shang, Z.H.; Gao, J.X.; Boone, R.B. Enhancing sustainability of grassland ecosystems through ecological restoration and grazing management in an era of climate change on Qinghai-Tibetan Plateau. Agric. Ecosyst. Environ. 2020, 287, 106684. [Google Scholar] [CrossRef]
  23. Harris, R.B. Rangeland degradation on the Qinghai-Tibetan plateau: A review of the evidence of its magnitude and causes. J. Arid. Environ. 2010, 74, 1–12. [Google Scholar] [CrossRef]
  24. Gao, Y.Z.; Giese, M.; Lin, S.; Sattelmacher, B.; Zhao, Y.; Brueck, H. Belowground net primary productivity and biomass allocation of a grassland in Inner Mongolia is affected by grazing intensity. Plant Soil. 2008, 307, 41–50. [Google Scholar] [CrossRef]
  25. Wang, D.B.; Ding, W.Q. Grazing led to an increase in the root: Shoot ratio and a shallow root system in an alpine meadow of the Tibetan plateau. Front. Environ. Sci. 2024, 12, 1348220. [Google Scholar] [CrossRef]
  26. Bai, W.M.; Fang, Y.; Zhou, M.; Xie, T.; Li, L.H.; Zhang, W.H. Heavily intensified grazing reduces root production in an Inner Mongolia temperate steppe. Agric. Ecosyst. Environ. 2015, 200, 143–150. [Google Scholar] [CrossRef]
  27. Wei, X.T.; Zhong, M.Y.; Liu, Y.H.; Wu, R.X.; Shao, X.Q. Covariation in root traits of Leymus chinensis in response to grazing in steppe rangeland. Rangel. J. 2019, 41, 313. [Google Scholar] [CrossRef]
  28. Chai, X.; Liang, C.Z.; Liang, M.W.; Han, W.H.; Li, Z.Y.; Miao, B.L.; Wang, W.; Wang, L.X. Seasonal dynamics of belowground biomass and productivity and potential of carbon sequestration in meadow steppe and typical steppe, in Inner Mongolia, China. Acta Ecol. Sin. 2014, 34, 5530–5540. [Google Scholar]
  29. Zhou, G.; Zhou, X.; He, Y.; Shao, J.; Hu, Z.; Liu, R.; Zhou, H.; Hosseinibai, S. Grazing intensity significantly affects belowground carbon and nitrogen cycling in grassland ecosystems: A meta-analysis. Glob. Change Biol. 2017, 23, 1167–1179. [Google Scholar] [CrossRef]
  30. Deng, L.; Sweeney, S.; Shangguan, Z.P. Grassland responses to grazing disturbance: Plant diversity changes with grazing intensity in a desert steppe. Grass Forage Sci. 2014, 69, 524–533. [Google Scholar] [CrossRef]
  31. Ma, W.M.; Ding, K.Y.; Li, Z.W. Comparison of soil carbon and nitrogen stocks at grazing-excluded and yak grazed alpine meadow sites in Qinghai–Tibetan Plateau, China. Ecol. Eng. 2016, 87, 203–211. [Google Scholar] [CrossRef]
  32. Cao, J.J.; Wei, C.; Adamowski, J.F.; Biswas, A.; Li, Y.M.; Zhu, G.F.; Liu, C.F.; Feng, Q. On China’s Qinghai-Tibetan Plateau, duration of grazing exclosure alters R:S ratio, root morphology and attending root biomass. Soil. Tillage Res. 2021, 209, 104969. [Google Scholar] [CrossRef]
  33. Su, J.S.; Jing, G.H.; Jin, J.W.; Wei, L.; Liu, J.; Cheng, J.M. Identifying drivers of root community compositional changes in semiarid grassland on the Loess plateau after long-term grazing exclusion. Ecol. Eng. 2017, 99, 13–21. [Google Scholar] [CrossRef]
  34. Xie, H.H.; Wu, Q.G.; Hu, J.Y.; Yu, L.F.; Bie, P.F.; Wang, H.; Deng, D.Z. Changes in Soil Physical and Chemical Properties During the Process of Alpine Meadow Degradation along the Eastern Qinghai-Tibet Plateau. Eurasian Soil. Sci. 2018, 51, 1440–1446. [Google Scholar] [CrossRef]
  35. Chen, H.; Zhu, Q.A.; Peng, C.H.; Wu, N.; Wang, Y.F.; Fang, X.Q.; Gao, Y.H.; Zhu, D.; Yang, G.; Tian, J.Q.; et al. The impacts of climate change and human activities on biogeochemical cycles on the Qinghai-Tibetan Plateau. Glob. Change Biol. 2013, 19, 2940–2955. [Google Scholar] [CrossRef]
  36. Bhadauria, T.; Li, Z.; Xie, Y.; Ning, X.; Zhang, X.; Hai, Q. Spatial distributions of salt-based ions, a case study from the Hunshandake Sandy Land, China. PLoS ONE 2022, 17, e0271562. [Google Scholar] [CrossRef]
  37. He, Z.; Yang, C.; Wang, P.; Bao, A.; Ma, Q. Effect of low-temperature stress on the physiological responses of six gramineous forages in alpine regions and evaluation of their cold resistance. Pratacultural Sci. 2021, 38, 2019–2028. [Google Scholar]
  38. Schönbach, P.; Wan, H.W.; Gierus, M.; Bai, Y.F.; Müller, K.; Lin, L.J.; Susenbeth, A.; Taube, F. Grassland responses to grazing: Effects of grazing intensity and management system in an Inner Mongolian steppe ecosystem. Plant Soil. 2011, 340, 103–115. [Google Scholar] [CrossRef]
  39. Wang, D.; Wu, G.L.; Zhu, Y.J.; Shi, Z.H. Grazing exclusion effects on above- and below-ground C and N pools of typical grassland on the Loess Plateau (China). Catena 2014, 123, 113–120. [Google Scholar] [CrossRef]
  40. Wang, K.B.; Deng, L.; Ren, Z.P.; Li, J.P.; Shangguan, Z. Grazing exclusion significantly improves grassland ecosystem C and N pools in a desert steppe of Northwest China. Catena 2016, 137, 441–448. [Google Scholar] [CrossRef]
  41. Wu, G.L.; Liu, Z.H.; Zhang, L.; Chen, J.M.; Hu, T.M. Long-term fencing improved soil properties and soil organic carbon storage in an alpine swamp meadow of western China. Plant Soil. 2010, 332, 331–337. [Google Scholar] [CrossRef]
  42. Bardgett, R.D.; Mommer, L.; De Vries, F.T. Going underground: Root traits as drivers of ecosystem processes. Trends Ecol. Evol. 2014, 29, 692–699. [Google Scholar] [CrossRef] [PubMed]
  43. Cao, J.R.; Lin, L.; Pang, S.; Guo, X.W.; Cao, G.M.; He, J.S.; Wang, Q.B. Early season precipitation accounts for the variability of fine-root traits in a Tibetan alpine grassland. Environ. Exp. Bot. 2020, 172, 103991. [Google Scholar] [CrossRef]
  44. Zhou, Y.S.; Wang, L.Q.; Zhang, P.; Liang, J.H.; Wang, X.F. Responses of the root architecture of Stipa grandis to grassland degradation. Pratacultural Sci. 2011, 28, 1962–1966. [Google Scholar]
  45. Chen, W.J.; Dong, T.; Gu, C.; Xue, W.J.; Zhao, M.L. Effect of Different Grazing Intensities on Root Characteristics of Stipa grandis. Acta Agrestia Sin. 2015, 37, 86–91. [Google Scholar]
  46. Glimskär, A. Estimates of root system topology of five plant species grown at steady-state nutrition. Plant Soil. 2000, 227, 249–256. [Google Scholar] [CrossRef]
  47. Yang, Y.D.; Ma, J.L.; Ma, H.B.; Zhou, Y.; Li, C.; Dong, C. Effects of grazing exclusion on root trait characteristics of dominant plants in the desert steppe. Pratacultural Sci. 2023, 40, 1507–1517. [Google Scholar]
  48. Beniston, M. Mountain Weather and Climate: A General Overview and a Focus on Climatic Change in the Alps. Hydrobiologia 2006, 562, 3–16. [Google Scholar] [CrossRef]
  49. Yan, Y.C.; Yan, R.R.; Chen, J.Q.; Xin, X.P.; Eldridge, D.J.; Shao, C.L.; Wang, X.; Lv, S.J.; Jin, D.Y.; Chen, J.Q.; et al. Grazing modulates soil temperature and moisture in a Eurasian steppe. Agric. For. Meteorol. 2018, 262, 157–165. [Google Scholar] [CrossRef]
  50. Shao, C.L.; Chen, J.Q.; Li, L.H.; Dong, G.; Han, J.J.; Abraha, M.; John, R. Grazing effects on surface energy fluxes in a desert steppe on the Mongolian Plateau. Ecol. Appl. 2017, 27, 485–502. [Google Scholar] [CrossRef]
  51. Zhao, Y.; Peth, S.; Reszkowska, A.; Gan, L.; Krümmelbein, J.; Peng, X.H.; Horn, R. Response of soil moisture and temperature to grazing intensity in a Leymus chinensis steppe, Inner Mongolia. Plant Soil. 2011, 340, 89–102. [Google Scholar] [CrossRef]
  52. Liu, M.X.; Zhao, R.D.; Zhang, C.; Li, R.; Shao, P. Responses of physiological parameters in plants on sub-alpine meadow to slope aspects. Chin. J. Appl. Ecol. 2017, 28, 2863–2869. [Google Scholar]
  53. Bowler, C.; Montagu, M.V.; Inze, D. Superoxide Dismutase and Stress Tolerance. Annu. Rev. Plant Biol. 1992, 43, 83–116. [Google Scholar] [CrossRef]
  54. Fridovich, I. Superoxide Dismutases. Annu. Rev. Biochem. 1975, 44, 147–159. [Google Scholar] [CrossRef]
  55. Kučerová, K.; Henselová, M.; Slováková, Ľ.; Hensel, K. Effects of plasma activated water on wheat: Germination, growth parameters, photosynthetic pigments, soluble protein content, and antioxidant enzymes activity. Plasma Process. Polym. 2019, 16, 1800131. [Google Scholar] [CrossRef]
  56. Lin, Z.; Li, Y.; Zhang, Z.J.; Liu, X.L.; Hsu, C.C.; Du, Y.Y.; Sang, T.; Zhu, C.; Wang, Y.B.; Satheesh, V.; et al. A RAF-SnRK2 kinase cascade mediates early osmotic stress signaling in higher plants. Nat. Commun. 2020, 11, 613. [Google Scholar] [CrossRef]
  57. Martins, M.R.; Jantalia, C.P.; Reis, V.M.; Döwich, I.; Polidoro, J.C.; Alves, B.J.R.; Boddey, R.M.; Urquiaga, S. Impact of plant growth-promoting bacteria on grain yield, protein content, and urea-15 N recovery by maize in a Cerrado Oxisol. Plant Soil. 2018, 422, 239–250. [Google Scholar] [CrossRef]
  58. Forlani, G.; Bertazzini, M.; Cagnano, G. Stress-driven increase in proline levels, and not proline levels themselves, correlates with the ability to withstand excess salt in a group of 17 Italian rice genotypes. Plant Biol. 2019, 21, 336–342. [Google Scholar] [CrossRef]
  59. Ogawa, A.; Yamauchi, A. Root Osmotic Adjustment under Osmotic Stress in Maize Seedlings. 2. Mode of Accumulation of Several Solutes for Osmotic Adjustment in the Root. Plant Prod. Sci. 2006, 9, 39–46. [Google Scholar] [CrossRef]
  60. Song, L.Y.; Pan, Y.; Gong, J.R.; Li, X.B.; Liu, M.; Yang, B.; Zhang, Z.H.; Baoyin, T.G.T. Physiology of Leymus chinensis under seasonal grazing: Implications for the development of sustainable grazing in a temperate grassland of Inner Mongolia. J. Environ. Manag. 2020, 271, 110984. [Google Scholar] [CrossRef]
  61. Nan, L.L.; Shi, S.L.; Chen, J.G.; Zhu, X.Q.; Guo, Q.E.; Zhao, W.H. Field evaluation of the response and resistance to low temperature of alfalfa root with different root types during over-wintering. Chin. J. Eco-Agric. 2011, 19, 619–625. [Google Scholar] [CrossRef]
  62. Li, Y.B.; Yang, S.Q.; Xin, R.G.; Feng, Y.Z.; Zhang, Q.; Li, P. Changes analysis in physiological properties of several gramineous grass species and cold-resistance comparison on under cold stress. Ecol. Front. 2009, 29, 1341–1347. [Google Scholar]
  63. Navas, M.L.; Roumet, C.; Bellmann, A.; Laurent, G.; Garnier, E. Suites of plant traits in species from different stages of a Mediterranean secondary succession. Plant Biol. 2010, 12, 183–196. [Google Scholar] [CrossRef] [PubMed]
  64. Whitman, T.; Aarssen, L.W. The leaf size/number trade-off in herbaceous angiosperms. J. Plant Ecol. 2009, 3, 49–58. [Google Scholar] [CrossRef]
  65. Sasse, J.; Martinoia, E.; Northen, T. Feed Your Friends: Do Plant Exudates Shape Root Microbiome? Trends Plant Sci. 2018, 23, 25–41. [Google Scholar] [CrossRef]
  66. Sun, X.D.; Ye, Y.Q.; Guan, Q.W.; Jones, D.L. Organic mulching masks rhizosphere effects on carbon and nitrogen fractions and enzyme activities in urban greening space. J. Soils Sediments 2021, 21, 1621–1632. [Google Scholar] [CrossRef]
  67. Wan, X.H.; Yu, Z.P.; Wang, M.J.; Zhang, Y.; Huang, Z.Q. Litter and root traits control soil microbial composition and enzyme activities in 28 common subtropical tree species. J. Ecol. 2022, 110, 3012–3022. [Google Scholar] [CrossRef]
  68. Pan, Y.; Gong, J.R.; Baoyin, T.G.T.; Luo, Q.P.; Zhai, Z.W.; Xu, S.; Wang, Y.H.; Liu, M.; Yang, L.L. Effect of Seasonal Grazing on Trade-off Among Plant Functional Traits in Root, Stem and Leaf of Leymus chinensis in the Temperate Grassland of Inner Mongolia, China. J. Integr. Plant Biol. 2017, 52, 307–321. [Google Scholar]
  69. Lu, X.; Yan, Y.; Sun, J.; Zhang, X.; Chen, Y.; Wang, X.; Cheng, G. Short-term grazing exclusion has no impact on soil properties and nutrients of degraded alpine grassland in Tibet, China. Solid. Earth 2015, 6, 1195–1205. [Google Scholar] [CrossRef]
  70. Steffens, M.; Kölbl, A.; Totsche, K.U.; Kögel-Knabner, I. Grazing effects on soil chemical and physical properties in a semiarid steppe of Inner Mongolia (P.R. China). Geoderma 2008, 143, 63–72. [Google Scholar] [CrossRef]
  71. Hong, J.; Xu, X.; Pang, B.; Ma, X.; Wang, X. Significant soil acidification caused by grazing exclusion across China’s grassland areas. Land. Degrad. Dev. 2020, 32, 535–545. [Google Scholar] [CrossRef]
  72. Yuan, Z.-Q.; Epstein, H.; Li, G.-Y. Grazing exclusion did not affect soil properties in alpine meadows in the Tibetan permafrost region. Ecol. Eng. 2020, 147, 105657. [Google Scholar] [CrossRef]
  73. Deng, L.; Shangguan, Z.-P.; Wu, G.-L.; Chang, X.-F. Effects of grazing exclusion on carbon sequestration in China’s grassland. Earth-Sci. Rev. 2017, 173, 84–95. [Google Scholar] [CrossRef]
  74. Hu, Z.; Li, S.; Guo, Q.; Niu, S.; He, N.; Li, L.; Yu, G. A synthesis of the effect of grazing exclusion on carbon dynamics in grasslands in China. Glob. Change Biol. 2016, 22, 1385–1393. [Google Scholar] [CrossRef]
  75. Yang, Y.; Ji, C.; Ma, W.; Wang, S.; Wang, S.; Han, W.; Mohammat, A.; Robinson, D.; Smith, P. Significant soil acidification across northern China’s grasslands during 1980s–2000s. Glob. Change Biol. 2012, 18, 2292–2300. [Google Scholar] [CrossRef]
  76. Poschenrieder, C.; Gunse, B.; Corrales, I.; Barcelo, J. A glance into aluminum toxicity and resistance in plants. Sci. Total Environ. 2008, 400, 356–368. [Google Scholar] [CrossRef]
Figure 1. Overview of the study area. (a) is the comparison between the grazing exclusion and grazing plots, and (b) is the quantity and size of each plot taken from the grazing exclusion and grazing plots.
Sustainability 17 05010 g001
Figure 2. Temperature and humidity of grazing exclusion grassland (GE) and grazing grassland (FG). The line chart shows soil temperature, and the column chart shows soil moisture.
Sustainability 17 05010 g002
Figure 3. Changes in soil properties in different treatment: grazing exclusion grasslands (GE) and grazing grasslands (FG). Values represent Means ± SD. Dots represent discrete values. Different capital letters indicate significant between the different years for the same grazing treatments at the 0.05 level and different lowercase letters indicate significant the same years among different grazing treatments at the 0.05 level; this is the same for the following figures.
Sustainability 17 05010 g003
Figure 4. Changes in root morphological traits in different grazing modes: grazing exclusion grasslands (GE) and grazing grasslands (FG). Values represent Means ± SE. Different capital letters indicate significant between the different years for the same grazing treatments at the 0.05 level and different lowercase letters indicate significant the same years among different grazing treatments at the 0.05 level. (a) represents the root length under different treatments, (b) represents the root volume under different treatments, (c) represents the root surface area under different treatments, (d) represents the root diameter under different treatments, (e) represents the number of root tips under different treatments, (f) represents the specific root length under different treatments, (g) represents the specific surface area under different treatments, and (h) represents the root tissue density under different treatments.
Sustainability 17 05010 g004
Figure 5. Principal component analysis of root morphological traits. RL, total root length; RD, average root diameter; RSA, root surface area; RV, root volume; RT, root tips; SRL, specific root length; SRA, specific surface area; RTD, root tissue density.
Sustainability 17 05010 g005
Figure 6. Changes in antioxidant enzyme activity in different grazing modes. Antioxidant enzymes: (a) SOD, superoxide dismutase; (b) POD, peroxidase; (c) CAT, catalase. Values represent Means ± SE. Different capital letters indicate significant between the different years for the same grazing treatments at the 0.05 level and different lowercase letters indicate significant the same years among different grazing treatments at the 0.05 level.
Sustainability 17 05010 g006
Figure 7. Changes in osmoregulatory substances and membrane lipid peroxidation indices in different grazing modes. Osmoregulatory substances: (a) soluble protein; (b) soluble sugar; (c) proline. Membrane lipid peroxidation indices: (d) malondialdehyde. Values represent Means ± SE. Different capital letters indicate significant between the different years for the same grazing treatments at the 0.05 level and different lowercase letters indicate significant the same years among different grazing treatments at the 0.05 level.
Sustainability 17 05010 g007
Figure 8. Redundancy analysis of root morphological traits, soil properties, and physiological indices. The blue arrows represent the physiological indicators of cold resistance, and the red arrows represent the indicators of soil properties and root morphology. RL, total root length; RD, average root diameter; RSA, root surface area; RV, root volume; RT, root tips; SRL, specific root length; SRA, specific surface area; RTD, root tissue density. EC, electrical conductance; SOM, soil organic matter; TN, total nitrogen; TP, total potassium; AP, available phosphorus; AK, available potassium; HN, hydrolyzable nitrogen. SOD, superoxide dismutase; POD, peroxidase; CAT, catalase. SS, soluble sugar; SP, soluble protein; PRO, proline. MDA, malondialdehyde.
Sustainability 17 05010 g008
Table 1. Dominant plants collected from grazing exclusion and grazing grasslands.
TreatmentBotanical NameFrequencyHeight
(cm)
AbbreviationGroup
FGCarex muliensis Hand-Mazz.84%2FGTnon-Gramineae
Kobresia pygmaea (C. B. Clarke) C. B. Clarke88%1FGC
Saussurea pulchra Lipsch.60%1.5FGS
GECarex muliensis Hand-Mazz.96%10GET
Kobresia pygmaea (C. B. Clarke) C. B. Clarke96%5GEC
Saussurea pulchra Lipsch.20%20GES
Poa pratensis L.50%60GEZGramineae
Polypogon fugax Nees ex Steud.30%45GEB
Elymus atratus (Nevski) Hand.-Mazz.88%50GEE
Table 2. Results of principal component analysis of physiological indices of plant cold resistance.
Principal Component123
SOD0.2800.6700.120
PRO0.500−0.0300.310
POD0.270−0.6600.310
SP0.500−0.090−0.310
CAT0.5100.1600.230
MDA0.2200.130−0.560
SS−0.2100.2500.580
Contribution rate (%)37.56919.46218.481
Eigenvalue2.6301.3621.294
Cumulative contribution rate (%)37.56957.03175.512
SOD, superoxide dismutase; PRO, proline; POD, peroxidase; SP, soluble protein; CAT, catalase; MDA, malondialdehyde; SS, soluble sugar.
Table 3. Comprehensive evaluation results of cold resistance of different plants.
CI1CI2CI3U (X1)U (X2)U (X3)DOrder
FGT2.2321.335−0.0041.0050.8040.4180.8091
FGC0.6940.496−0.6910.6700.5580.1500.5144
FGS−2.8920.4311.577−0.1100.5391.0360.3385
GET0.9080.7801.2210.7160.6420.8970.7412
GES−1.1940.830−1.0370.2590.6560.0150.3026
GEZ−0.562−1.257−0.6940.3970.0440.1490.2457
GEP−0.531−0.597−1.4150.4030.238−0.1330.2298
GEE1.345−2.0181.0450.812−0.1780.8280.5613
Weight 0.4980.2580.245
Table 4. Spearman correlation analysis of root morphological traits and physiological indices.
SODPROPODSPCATMDASS
RL−0.1280.0110.373 *0.094−0.1650.081−0.205
RV−0.176−0.2160.0890.117−0.2540.026−0.335 *
RSA−0.166−0.1230.1920.131−0.279 *0.028−0.326 *
RD−0.157−0.335 *−0.1370.080−0.147−0.104−0.309 *
RT−0.045−0.0490.1970.256−0.238−0.027−0.396 *
SRL−0.0260.1070.314 *−0.281 *0.2600.1290.144
SRA−0.0550.0090.292 *−0.2120.2120.1180.006
RTD0.0910.199−0.0890.0450.008−0.0030.256
* indicates significant differences (p < 0.05).
Disclaimer/Publisher’s Note: The statements, opinions and data contained in all publications are solely those of the individual author(s) and contributor(s) and not of MDPI and/or the editor(s). MDPI and/or the editor(s) disclaim responsibility for any injury to people or property resulting from any ideas, methods, instructions or products referred to in the content.

