1. Introduction
Cellular foamed mortar has low density, a high strength-to-density ratio, and low thermal conductivity, making it suitable for aggressive environments and fire-resistant applications [
1]. It is a variant of lightweight cellular concrete, composed of cementitious binders, supplementary components, and air entraining agents [
2]. Its classification as lightweight concrete is due to its reduced density, ranging from 300 to 1900 kg.m
−3, with air voids dispersed by the action of a foaming agent.
The application of foamed mortar varies according to its density: at around 400 kg.m
−3, it is used for wall cladding, sealing blocks, and thermal insulation; at around 600 kg.m
−3, it is employed in non-structural elements; and in the 1200–1950 kg.m
−3 range, it can serve a structural role [
3]. Additionally, foamed mortar is used in various applications, including sealing fire escape routes, acoustic insulation, road sub-bases, trench restoration, soil stabilization, and damping barriers at airports [
4].
The physical structure of the foam during curing is an important element in foamed mortar, as it directly impacts the size and distribution of microbubbles within the cement paste, which in turn defines its physical and mechanical behavior [
5]. The foam structure primarily forms during the process of incorporating air into the foaming agent, which traps the air microbubbles and significantly increases the volume of the mixture. Various studies have investigated the effects of synthetic and protein-based foaming agents on the properties of foamed mortar, revealing that protein-based agents result in materials with superior mechanical characteristics [
6].
Foam stability is one of the most important parameters for its incorporation into mortar. Its two-phase nature (liquid–gas), consisting of a film of foaming agent that traps incorporated air, is fragile and susceptible to coalescence during the mixing stage [
7,
8,
9]. To mitigate the tendency for bubbles to coalesce, nanoparticles of alumina, silica, graphene, and other materials have been tested. These nanoparticles adsorb to the surface of the film, resulting in a three-phase solid–liquid–gas foam that reinforces the film’s integrity, making it more difficult for the bubbles to merge [
10]. Studies indicate that foam stability depends on parameters such as surface tension, viscosity of the cementitious matrix, and rheological properties, so it is essential to understand and control physical–chemical interactions during formulation [
11,
12,
13].
In this context, the Pickering stabilization mechanism has been shown to be highly effective in producing stable cementitious foams by using solid particles adsorbed onto the gas–liquid interfaces to prevent bubbles from coalescing. Wang et al. [
10] demonstrated that the addition of nanosilica resulted in an increase in foam stability and a reduction in the drainage rate, as well as improved pore distribution. In their study, the half-life of the foam increased from 25 to 68 min with the addition of just 0.1% particles. Krämer et al. [
5] and Guo et al. [
14] also observed that particles of nanoalumina and carbon nanotubes can organize themselves at the air–liquid interface, forming a physical barrier to the melting of bubbles. The adsorption of these particles creates a solid network on the bubble wall, increasing its mechanical resistance and slowing down drainage and ripening processes.
The amount of air introduced by the foam can vary from 40% to 80%. The addition of foam reduces the mechanical strength of the material, resulting in a porous cellular matrix with air bubbles ranging from 0.1 to 2.0 mm in diameter. The porosity, density, mechanical strength, and thermal and acoustic insulation properties of foamed concrete are directly correlated with the amount of pores incorporated during the foam generation process [
15]. However, the dimensions of the resulting pores are governed by the stability of the foam in its wet phase. Microbubbles are thermodynamically unstable and undergo coalescence during the mortar hardening stage, effectively decreasing the porous system’s free energy [
16].
The union of microbubbles can generate larger voids, particularly at the interface regions between the material and the external medium, resulting in reduced mechanical integrity. Thus, maintaining the stability of air bubbles in the initial suspension or liquid medium is fundamental during foam production [
17].
The influence of nanomagnetite on the characteristics of concrete was previously examined [
5]. In one study, researchers concluded that the addition of 1% iron oxide (Fe
2O
3) to concrete enhanced its durability. Furthermore, incorporating iron oxide nanoparticles in proportions ranging from 0.5% to 2% by weight of cement led to improvements in the mechanical properties of foamed mortar [
18].
These results corroborate the hypothesis that fine mineral particles, such as magnetite derived from acid mine drainage (AMD), can act in a similar way. Although the application of magnetite in foamed concretes is still incipient in the literature, this study seeks to fill this gap by investigating its role in stabilizing the foam and its impact on the physical–mechanical properties of the foamed mortar.
Using magnetite to stabilize foam in foamed mortar offers an innovative and sustainable solution, particularly since the magnetite is derived from AMD, one of the main environmental challenges caused by mining activities. AMD contains toxic compounds, such as iron and sulfur, which can contaminate soil and water sources. Thus, it is essential to develop technologies that enable its reuse. Incorporating magnetite from AMD into foamed mortar not only helps stabilize the foam, potentially improving mechanical and thermal insulation properties, but also contributes to the valorization of mining waste. However, further studies should assess potential environmental risks, such as the leaching of magnetite from cementitious matrices, to ensure safety in urban applications.
Although foamed mortar is widely recognized for its energy efficiency due to its low density and high thermal insulation capacity, limited studies have investigated the use of waste-derived materials as foam stabilizers. In particular, the application of magnetite extracted from AMD remains largely unexplored. While prior research has focused on synthetically produced nanoparticles, there is a lack of knowledge regarding the performance, dispersion behavior, and environmental implications of using AMD-derived magnetite in cementitious foams. Moreover, the interactions between this alternative stabilizer and different sand-to-cement ratios and cement types have not been systematically analyzed. Therefore, this study addresses these gaps by evaluating the effectiveness of AMD-derived magnetite as a foam-stabilizing agent in the production of foamed mortar. The research specifically examines how variations in magnetite content, sand-to-cement ratio, and cement type affect foam stability, porosity, mechanical strength, density, and thermal conductivity, aiming to develop a more sustainable and technically viable formulation for lightweight construction materials.
2. Materials and Methods
Two types of cement were used to prepare the specimens: Portland cement CP II Z and CP V ARI (Cimento Itambé, Curitiba, Paraná, Brasil).
Table 1 presents the chemical and physical properties of the cement used.
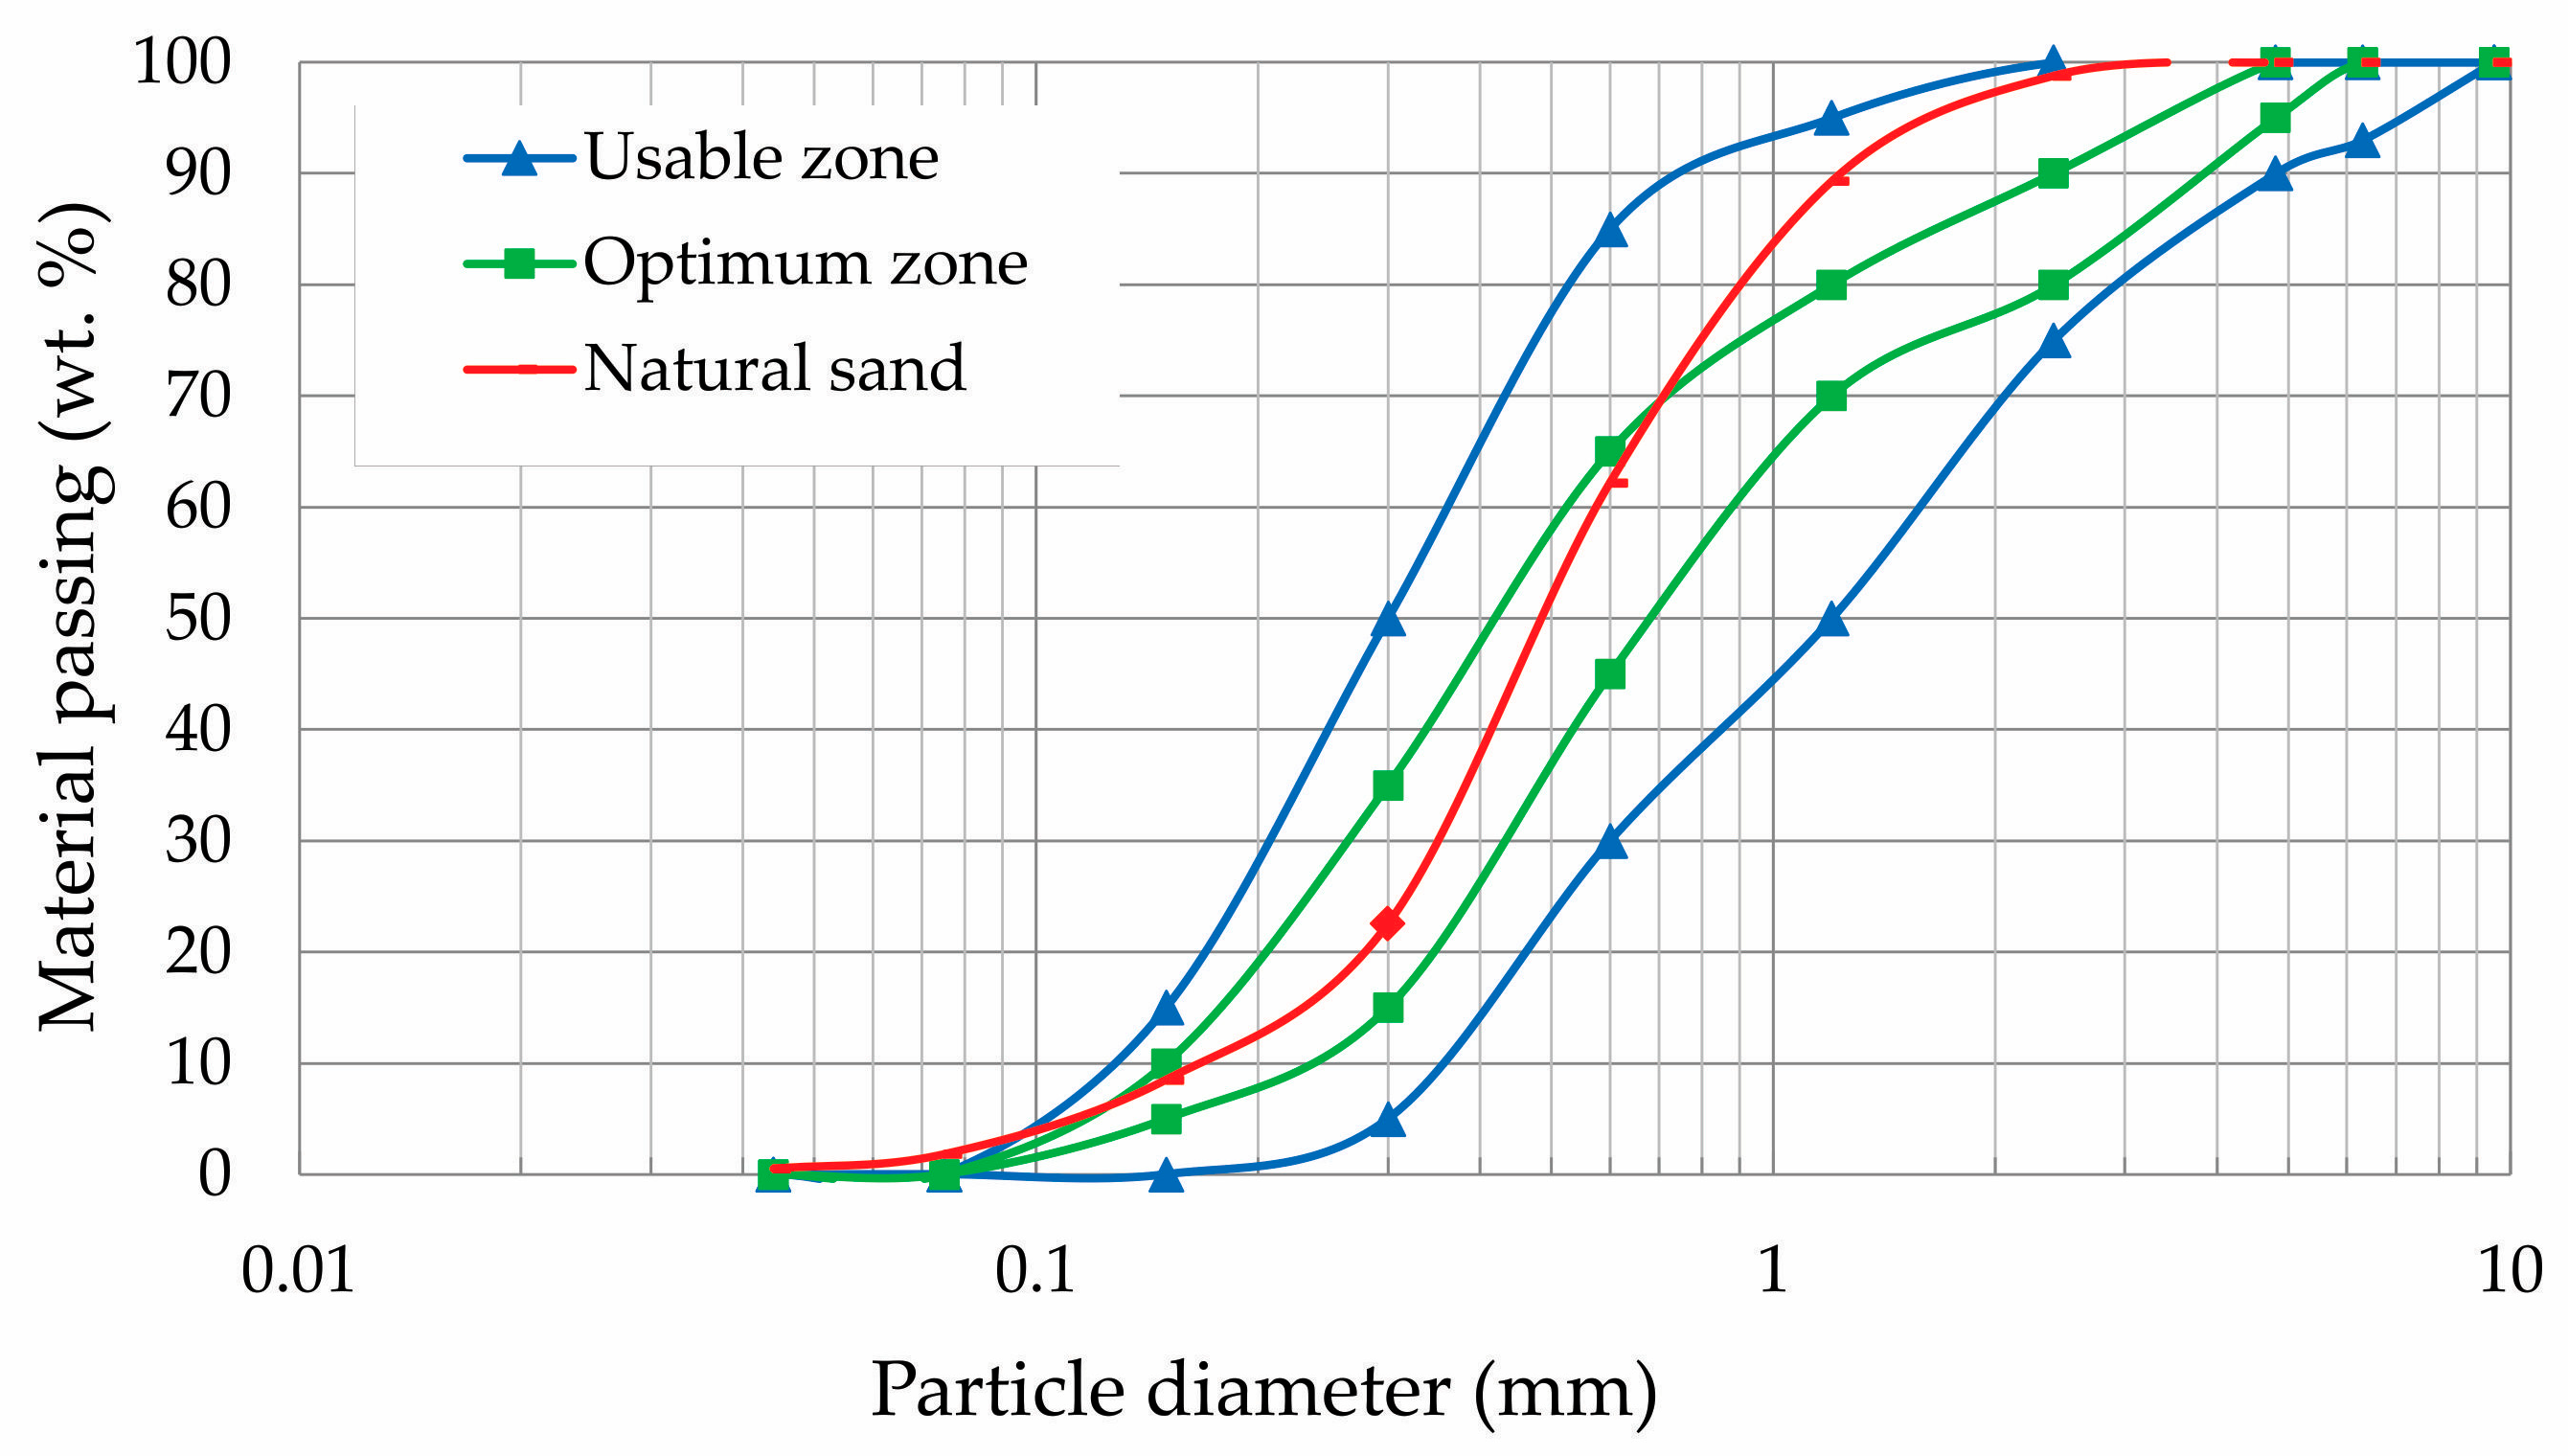
The natural river sand used as aggregate was sourced from Santa Maria, RS, Brazil. Its particle size distribution is shown in the granulometric curve in
Figure 1. The fineness modulus and apparent density of the sand were 1.77 and 1470 kg.m
−3, respectively.
The water used was of potable quality and supplied by Companhia Riograndense de Saneamento, Passo Fundo, RS, Brazil. The foam additive used was coconut fatty acid diethanolamide 90%, a non-ionic surfactant, diluted in a 1:10 ratio with water [
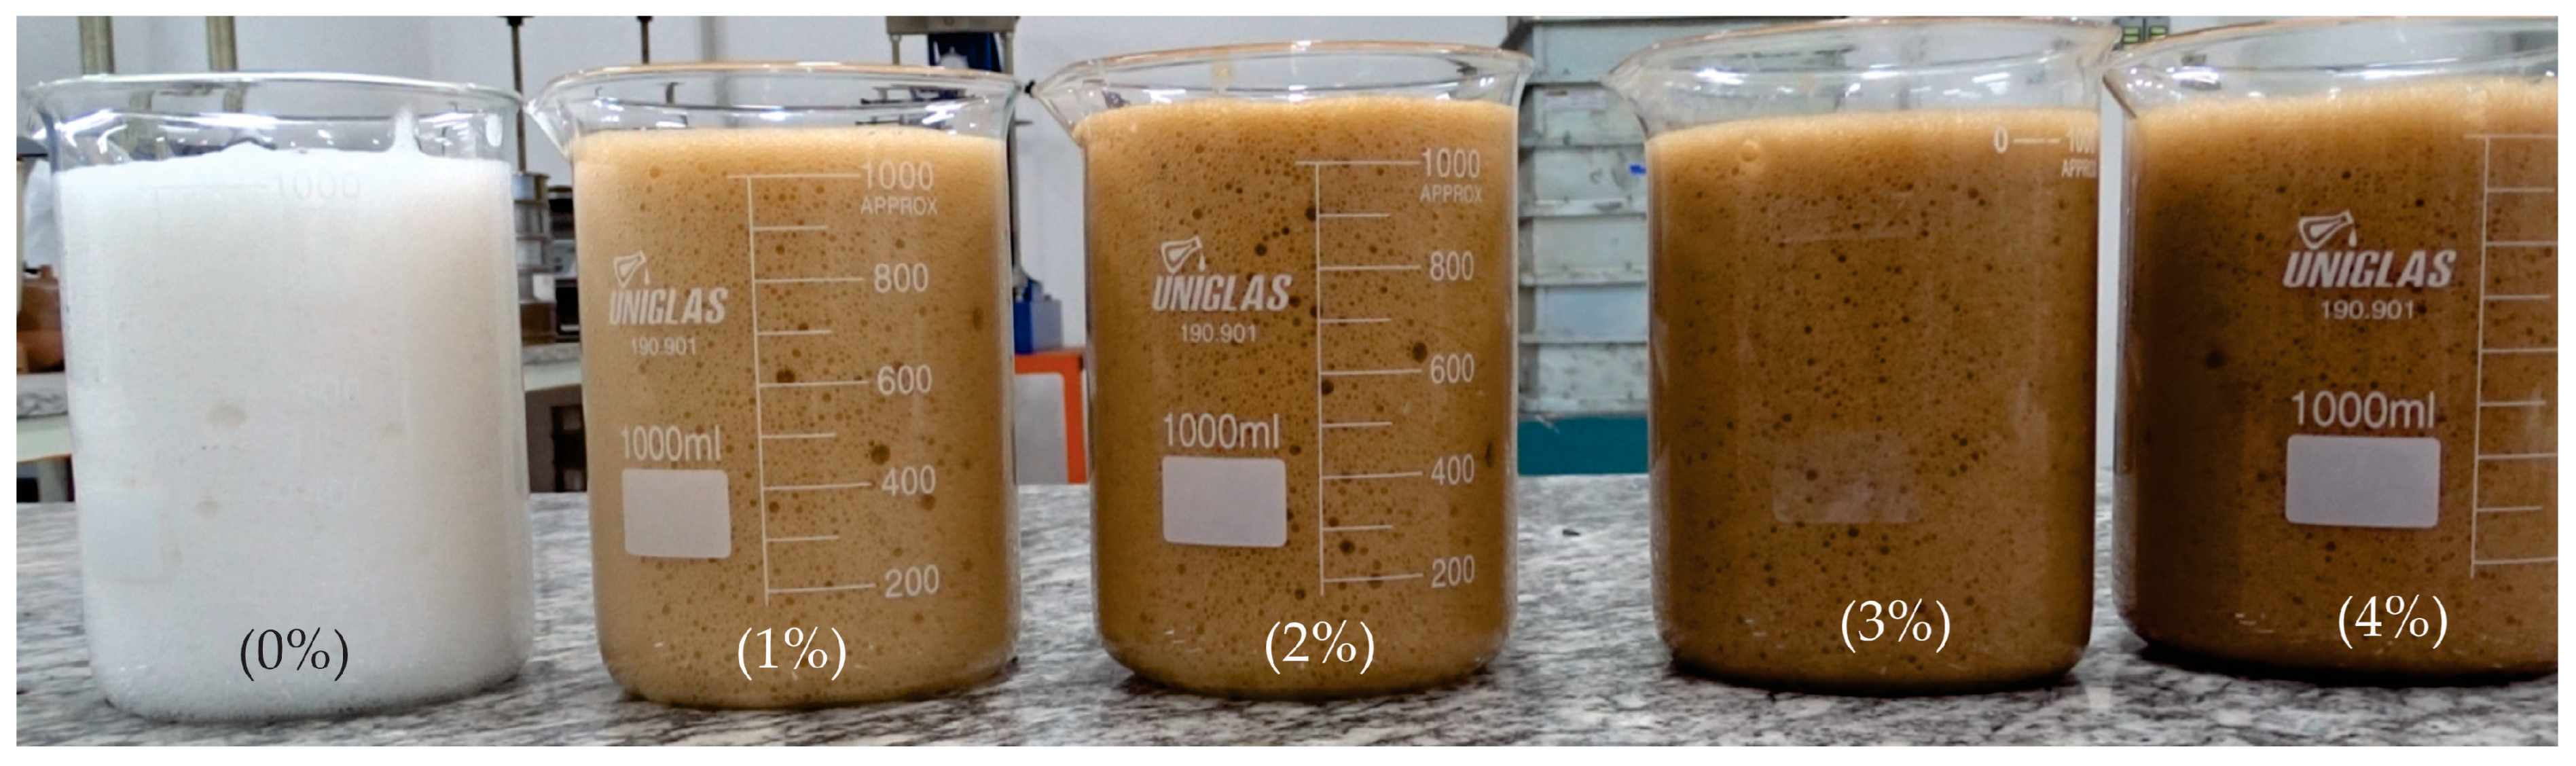
7]. The foam was produced using a mechanical agitator, with a preformed foam density of 229 kg.m
−3. To evaluate foam stability, magnetite was added in proportions of 1%, 2%, 3%, and 4% relative to the mixture mass.
Figure 2 shows the foam produced with different concentrations of magnetite.
2.1. Magnetite
Magnetite is an iron oxide spinel (Fe
3O
4) with magnetic properties. It can be obtained via alkaline precipitation of ferrous solutions (Fe
2+) or by alkalizing AMD free from contaminants [
20,
21]. To obtain AMD with suitable characteristics, an experiment was conducted in the laboratory to produce magnetite pigment, following the prototype described by Vigânico [
22]. This system generated AMD through controlled leaching (percolation and recirculation) in a PVC column (180 mm diameter, 1000 mm height). A 240 L high-density polyethylene tank stored the leachate. The system used a submersible pump operating for eight weeks at 1.2 L/min, keeping the column filled with water and oxygen. The solution produced had a low pH (<2.0) and high concentrations of dissolved iron, sulfate, and acidity, along with other metals in smaller quantities. Ten kilograms of pyrite waste were inserted into the column, producing approximately 6.8 kg of sludge [
23].
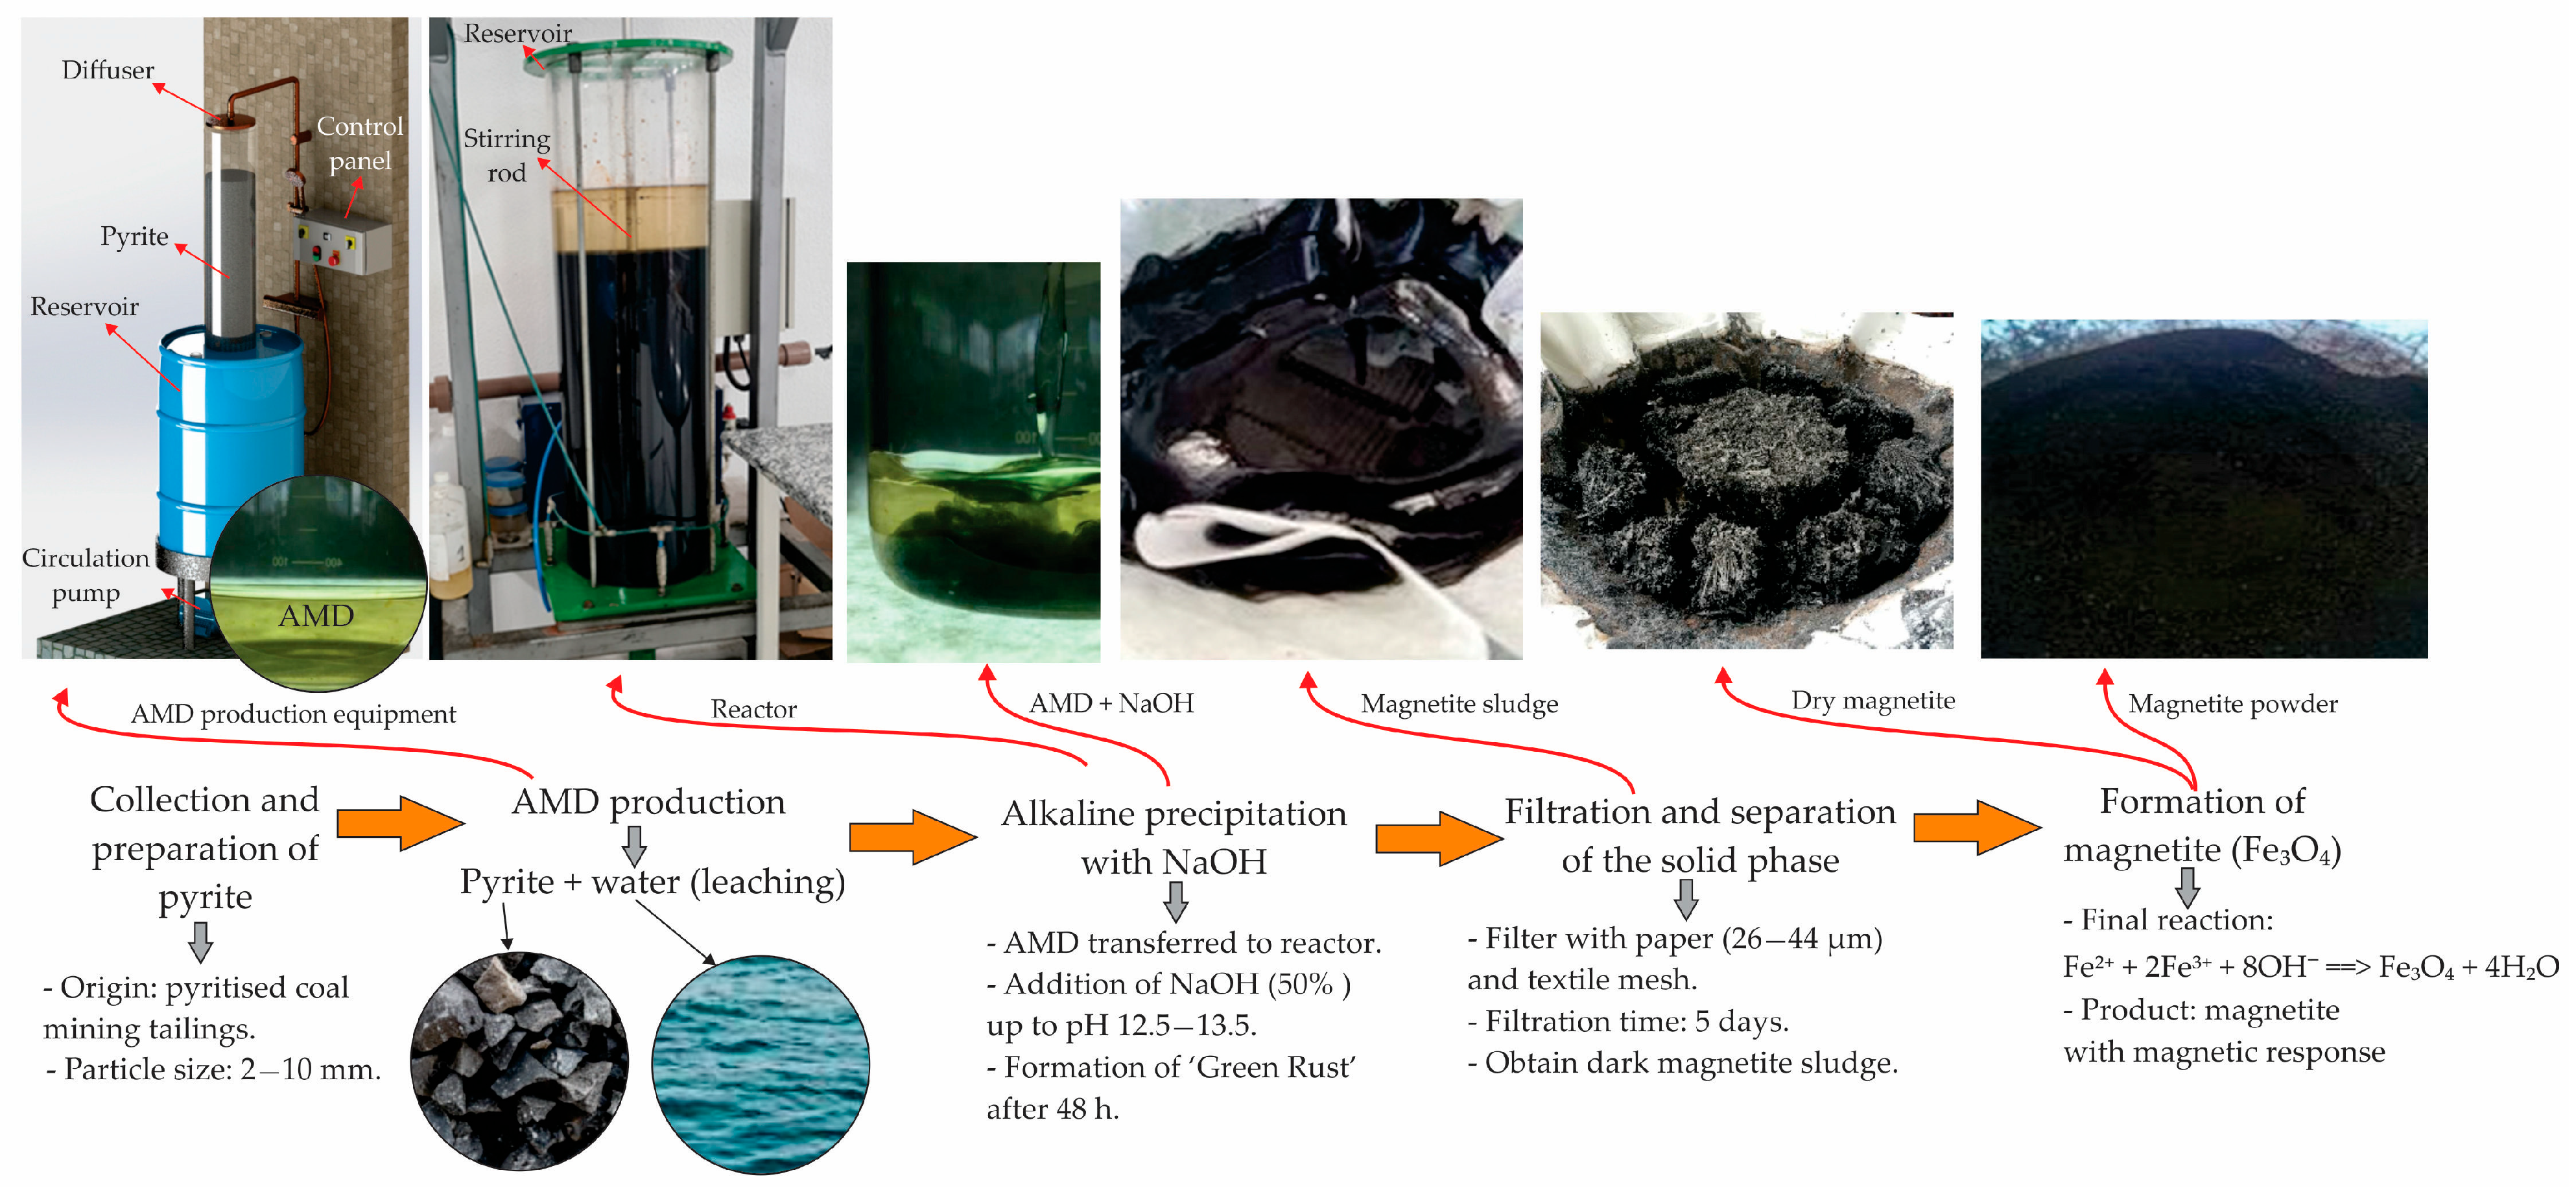
Figure 3 shows the stages in the production of magnetite from AMD.
The pyrite came from a mining company in Criciúma, Santa Catarina, Brazil, with particle sizes of between 2 and 10 mm. The concentrate, obtained from Rio Deserto Company, originated from the Barro Branco layer, known to contain 62% pyrite (FeS
2). This material was previously characterized by Menezes et al. [
24].
The result was an aqueous extract rich in ferrous ions, originating from the natural oxidation of metal sulfide, as described by reactions (1) and (2):
After six weeks of leaching, the AMD was transferred to a reaction tank, and 50% sodium hydroxide solution was added under constant stirring. The pH was adjusted to 12.5–13.5. After mixing for about 5 min, the solution was left to rest for 48 h to allow the sludge to transform into an intermediate known as green rust [
25]. This step is essential for magnetite formation. The solid phase was separated, and the sludge was filtered using filter paper (porosity 26–44 μm) and textile mesh. The filtration process lasted five days.
The resulting material was black with a pasty consistency and exhibited magnetic behavior (reaction 3):
A total of 115 L of AMD and 14 kg of 50% NaOH were used, yielding 6.81 kg of sludge with only 10% solid material with a density of 3900 kg.m−3.
Samples were analyzed by X-ray fluorescence and X-ray diffraction. According to NBR 10004 [
26], the sludge is classified as non-inert and non-hazardous (Class II A).
Crystalline phases present in the pigment were determined by X-ray diffraction analysis. This analysis was carried out using a Siemens D-5000 (Siemens, Berlin, Germany) X-ray diffractometer, equipped with a fixed Cu anode tube (λ = 1.5406 Å), operating at 40 kV and 40 mA in the primary beam, and a curved graphite monochromator in the secondary beam. The angular range analyzed was from 0° to 70° (2θ scale), with a step size of 0.05°/s. A divergence slit of 1° and a receiving slit of 0.2 mm were used in the detector system to improve resolution and minimize scattered radiation.
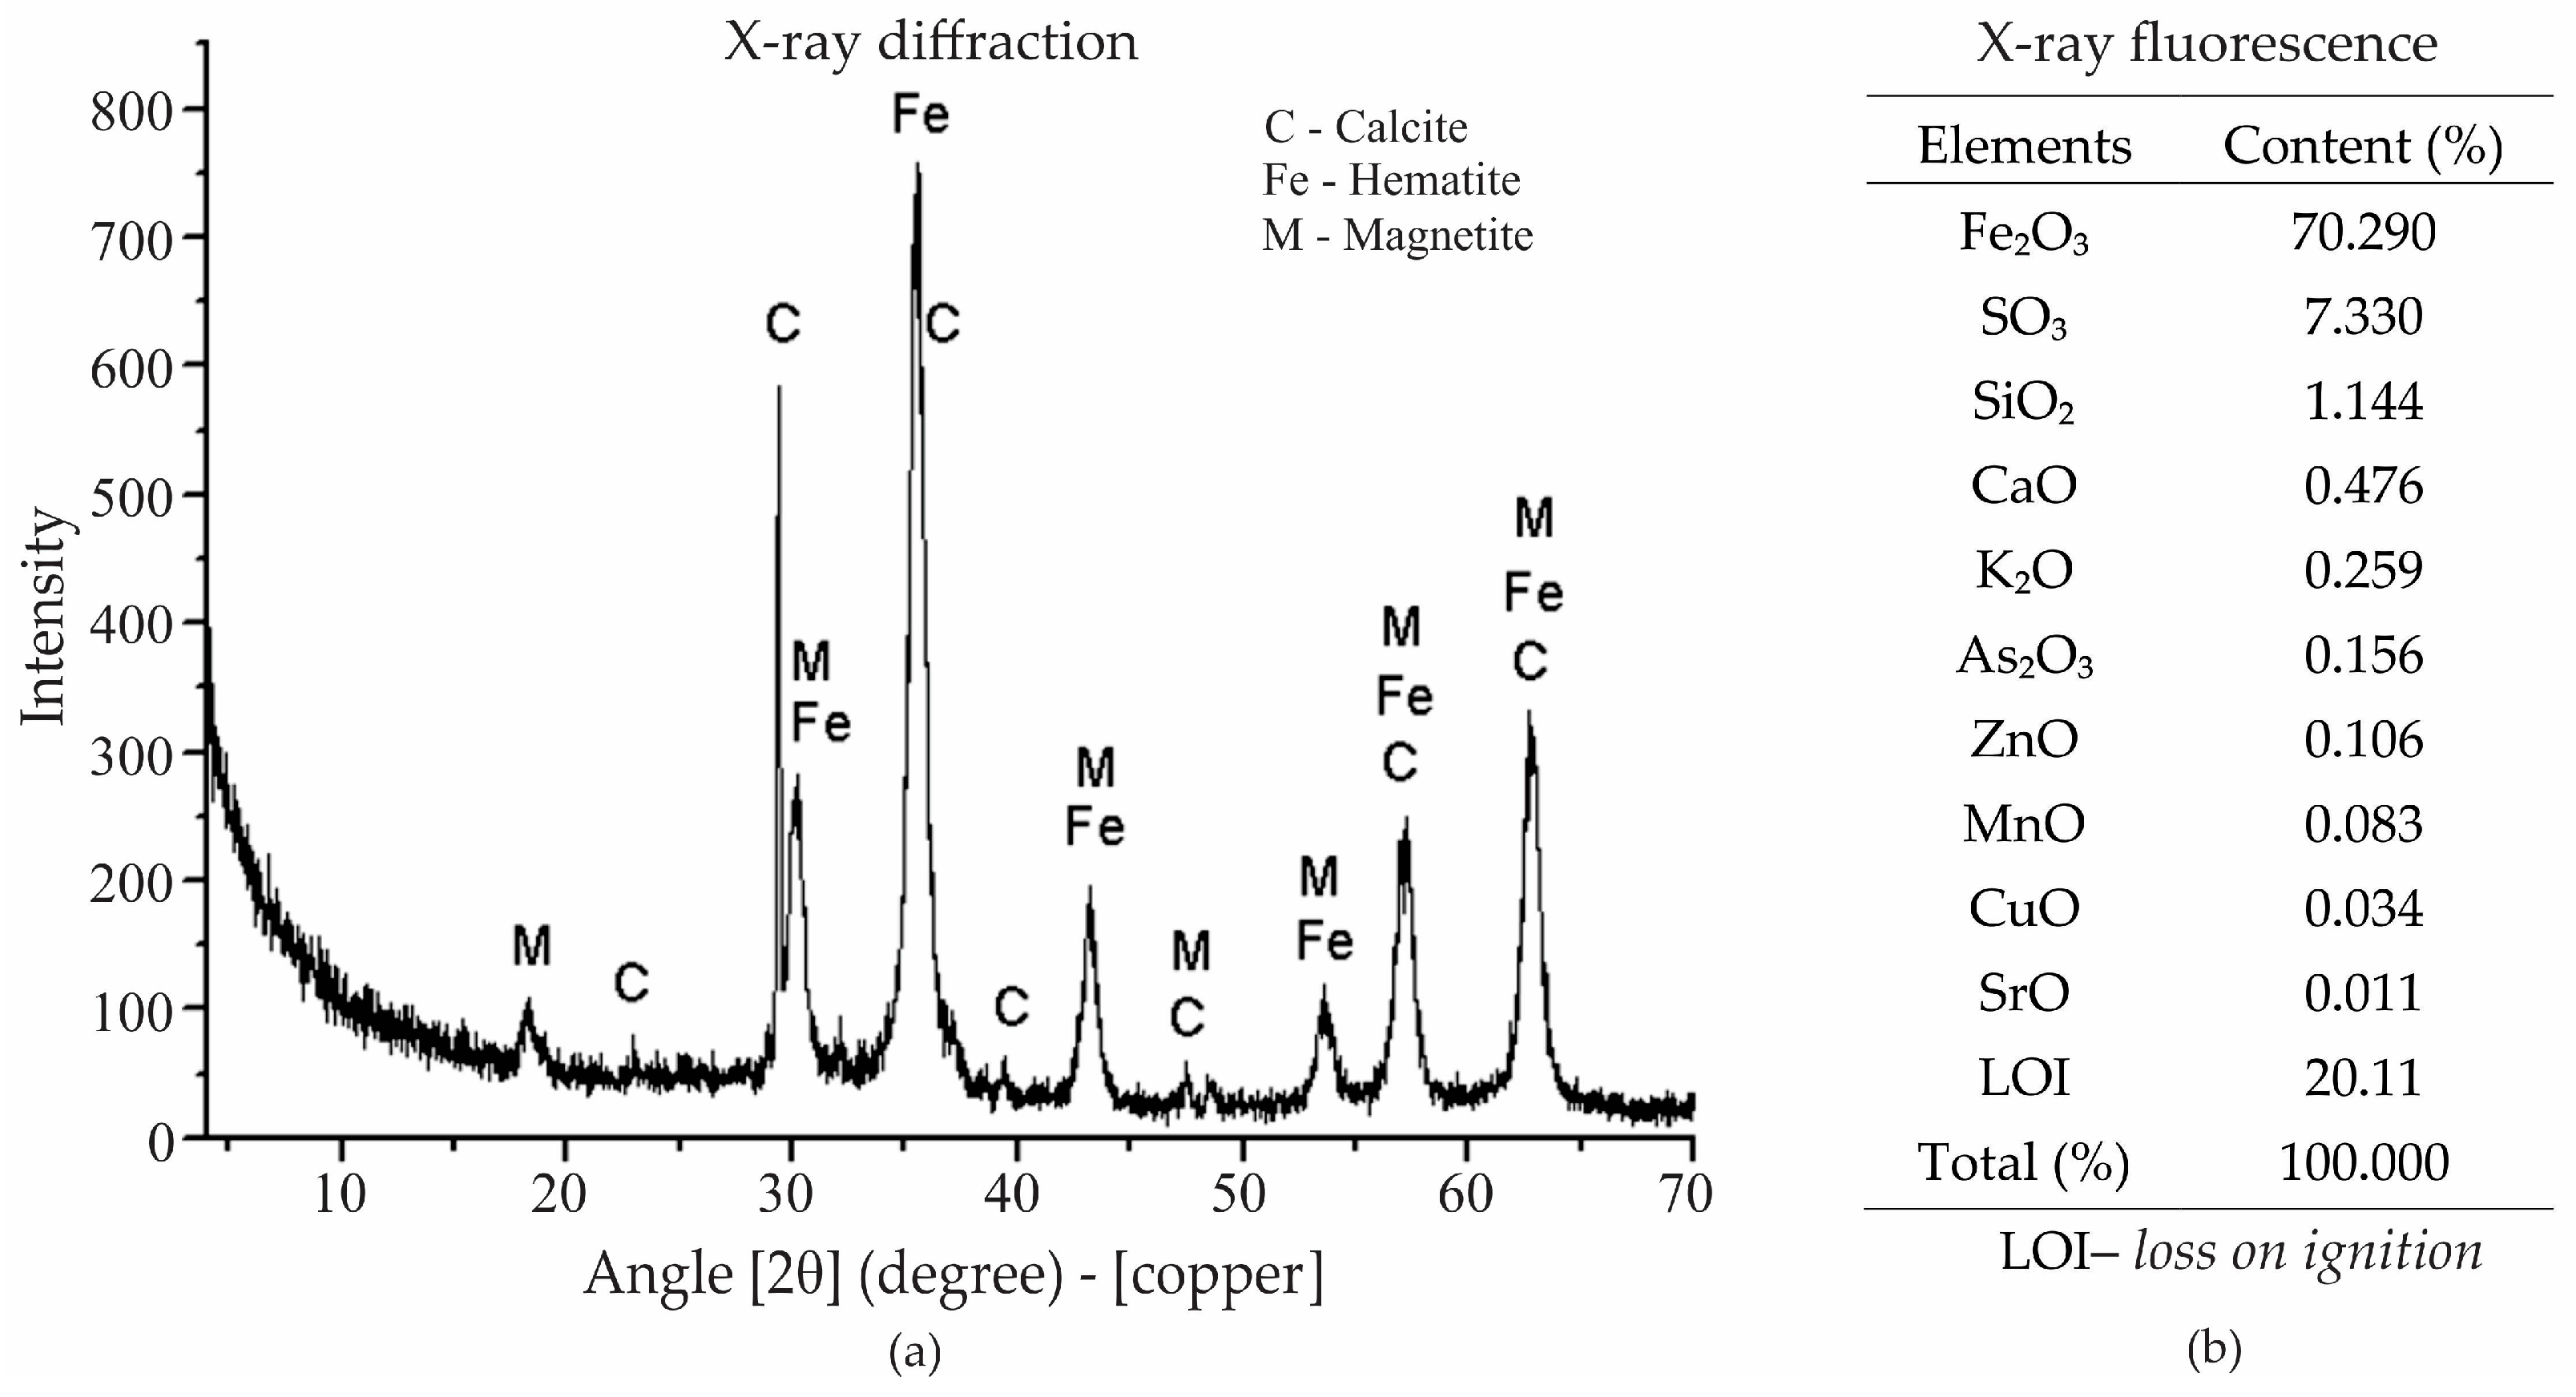
X-ray diffraction analysis of the magnetite extracted from AMD revealed the presence of several distinct mineral phases. The primary phase identified was magnetite (Fe
3O
4), as indicated by the peak labeled “M” on the graph (
Figure 4a). Magnetite is a key iron oxide mineral known for its magnetic properties, which are important for its use in various industrial applications, including foam stabilization in mortar. Other mineral phases observed included hematite (Fe
2O
3) and calcite (CaCO
3), as marked by the labels “Fe” and “C”, respectively [
27].
The chemical composition of the extracted material was quantitatively determined by X-ray fluorescence, as shown in
Figure 4b. The analysis was carried out using a PANalytical MiniPal 4 spectrometer (PANalytical B.V., Almelo, The Netherlands). It showed a high concentration of Fe
2O
3 (70.29%), which is consistent with the presence of magnetite. The X-ray fluorescence also indicated the presence of sulfur (SO
3, 7.33%) and silica (SiO
2, 1.14%), which correspond to the goethite and quartz phases observed in the X-ray diffraction analysis. Other elements present in trace amounts included calcium (CaO), potassium (K
2O), and zinc (ZnO), which may also influence the properties of the magnetite. The loss-on-ignition value of 20.11% reflects the loss of water or volatile compounds upon heating, which is typical for certain minerals like goethite.
The magnetite (Fe
3O
4) used in this study is a chemically stable iron oxide with a mixed valence state (Fe
2+/Fe
3+), which makes it inherently resistant to further oxidation under ambient conditions. Unlike metallic iron, which readily oxidizes to form rust (Fe
2O
3·nH
2O) in the presence of moisture and oxygen, magnetite is an already partially oxidized form and thus thermodynamically stable. In addition, the highly alkaline environment of the cementitious matrix (with pH levels typically exceeding 12) further inhibits oxidation and corrosion processes [
28]. Therefore, the incorporation of magnetite into foamed mortars does not introduce a significant risk of rusting or degradation over time. This stability ensures that magnetite remains an effective and durable additive for foam stabilization without compromising the long-term performance or integrity of the material [
29].
The stabilization of the foam employed in the production of foamed mortar was primarily enhanced by the incorporation of magnetite. Due to its intrinsic magnetic properties, magnetite particles can exhibit a tendency to agglomerate when dried; however, when used in paste form without drying, the dispersion is significantly improved. The well-dispersed magnetite contributed to the formation of a more rigid and stable network around the air bubbles, effectively reducing foam coalescence and collapse during the curing process. This physical stabilization mechanism differs from that provided by other nanoparticles, such as nano-silica or nano-alumina, which typically engage chemically in the hydration process. In contrast, magnetite acted predominantly on the fresh properties of the mortar, enhancing foam stability and promoting a more homogeneous pore structure. Consequently, its inclusion indirectly contributed to improved density uniformity and mechanical performance of the foamed mortar, while maintaining the intended lightweight characteristics.
2.2. Production Process and Experimental Design
The foamed mortar production process had two stages: (1) preparation of mortar with cement, sand, and water (mixed for 5 min), and (2) incorporation of preformed foam, with or without magnetite (mixed for another 5 min). All mixtures were mixed at 140 rpm using a mechanical mixer.
Table 2 presents the experimental matrix. It includes variations in cement type, sand amount, and magnetite content, totaling 30 different mixtures with three replicates each.
After mixing, the specimens were molded into rectangular shapes measuring 300 × 40 × 40 mm (for thermal conductivity) and 160 × 40 × 40 mm (for flexural tensile strength), and cylindrical shapes with a diameter of 50 mm and a height of 100 mm (for other tests). After 24 h, the specimens were demolded and cured at room temperature for 28 days. A total of 450 specimens were prepared.
The sand-to-cement ratios (S/Cs) adopted in this study were strategically selected based on their specific applications and corresponding properties, commonly reported in the literature [
4]. An S/C of 0 (cementitious paste without sand) was chosen for applications requiring excellent thermal and acoustic insulation, typically employed in lightweight, non-structural panels, providing very-low-density, high-insulation capacity, but reduced mechanical strength. An intermediate S/C of 0.5 targets moderate-density applications (approximately 600–1000 kg.m
−3), such as internal wall panels and non-structural elements, offering improved mechanical properties compared to pure cementitious paste while still retaining good thermal and acoustic insulation properties. Finally, an S/C of 1.0 was selected to produce lightweight blocks for non-load-bearing or semi-structural applications, as well as for floor leveling materials, achieving higher compressive strength (3–10 MPa), better dimensional stability, and reduced shrinkage, although with slightly diminished thermal insulation compared to lower S/Cs.
The factors for the experimental design were the type of cement (TC) (two levels: CP II Z and CP V ARI); the S/C, with three levels (1.0, 0.5, and 0); and the amount of magnetite (with five levels: 0%, 1%, 2%, 3%, and 4%). The response variables included porosity (air void), water absorption, dry and wet densities, compressive strength, flexural tensile strength, and thermal conductivity. The water-to-cement ratio was kept constant to minimize the effects of water, particularly on mechanical strength.
An analysis of variance (ANOVA) was performed to evaluate the influence of various factors on the response variables. Factors with
p-values less than or equal to 0.05 were considered statistically significant, corresponding to a confidence level of 95% or higher. The percentage contribution of each factor was calculated based on the sum of squares. The
p-value indicates the probability of obtaining evidence against the null hypothesis, with lower values suggesting stronger evidence. The F-value is a statistical metric used to assess the strength of the association between a factor and the response variable, with higher values indicating a greater influence of the factor being analyzed. The complete ANOVA tables can be found in the
Supplementary Materials.
2.3. Characterization of the Specimens
Compressive strength tests were performed in accordance with the NBR 5739 standard [
28] utilizing a PC200C hydraulic press (Instron, Norwood, MA, USA). Flexural tensile strength tests followed the procedures outlined in the NBR 12142 standard [
30] using a DL10000 universal testing machine (EMIC—Instron Brasil Equipamentos Científicos Ltda, São José dos Pinhais, Paraná, Brazil).
Density (dry and wet), porosity (air void), and water absorption tests were conducted after the specimens had cured for 28 days, following the ASTM C 948-81 [
31] and NBR 9778 [
32] standards.
The pore size distribution of the foamed mortar samples was determined using image analysis techniques based on the methodology described in the British Standard BS EN 480-11 [
33], which is widely adopted for evaluating air void characteristics in hardened concrete. This procedure was complemented by the approach described by other authors [
34,
35,
36] involving the preparation of polished cross-sections of cured specimens. For each composition, five distinct sections were analyzed. These sections were obtained from both longitudinal and transverse cuts of the specimens. Images were captured using a digital USB XTRAD 2Mp (Shenzhen Huaxian Optical Instrument Co., Shenzhen, China) magnifying loupe, and to avoid artifacts that could affect the accuracy of the results, all specimens were carefully ground and polished using progressively finer abrasives. The captured images were processed using ImageJ software (NIH, Bethesda, MD, USA,
https://imagej.net/ij/), allowing for the quantification of pore size distribution, frequency, and morphology. Parameters such as D10, D50, and D90 (representing the diameters below which 10%, 50%, and 90% of the pores are found) were calculated to assess the homogeneity and dispersion of pores.
Thermal conductivity was determined using the surface hot wire technique. This method has been previously validated as a variant of the parallel hot wire method in earlier studies [
34,
37,
38] and is characterized as a direct technique that detects transient temperature. The system consists of two multimeters for measuring electrical current and voltage, two parallelepiped-shaped specimens, a hot wire (0.5 mm diameter Kanthal) connected to a power source, four temperature sensors (NTC—negative temperature coefficient), and a data acquisition system. The temperature sensors were calibrated to operate within the range of 0 °C to 100 °C [
39,
40,
41].
3. Results and Discussion
3.1. Porosity
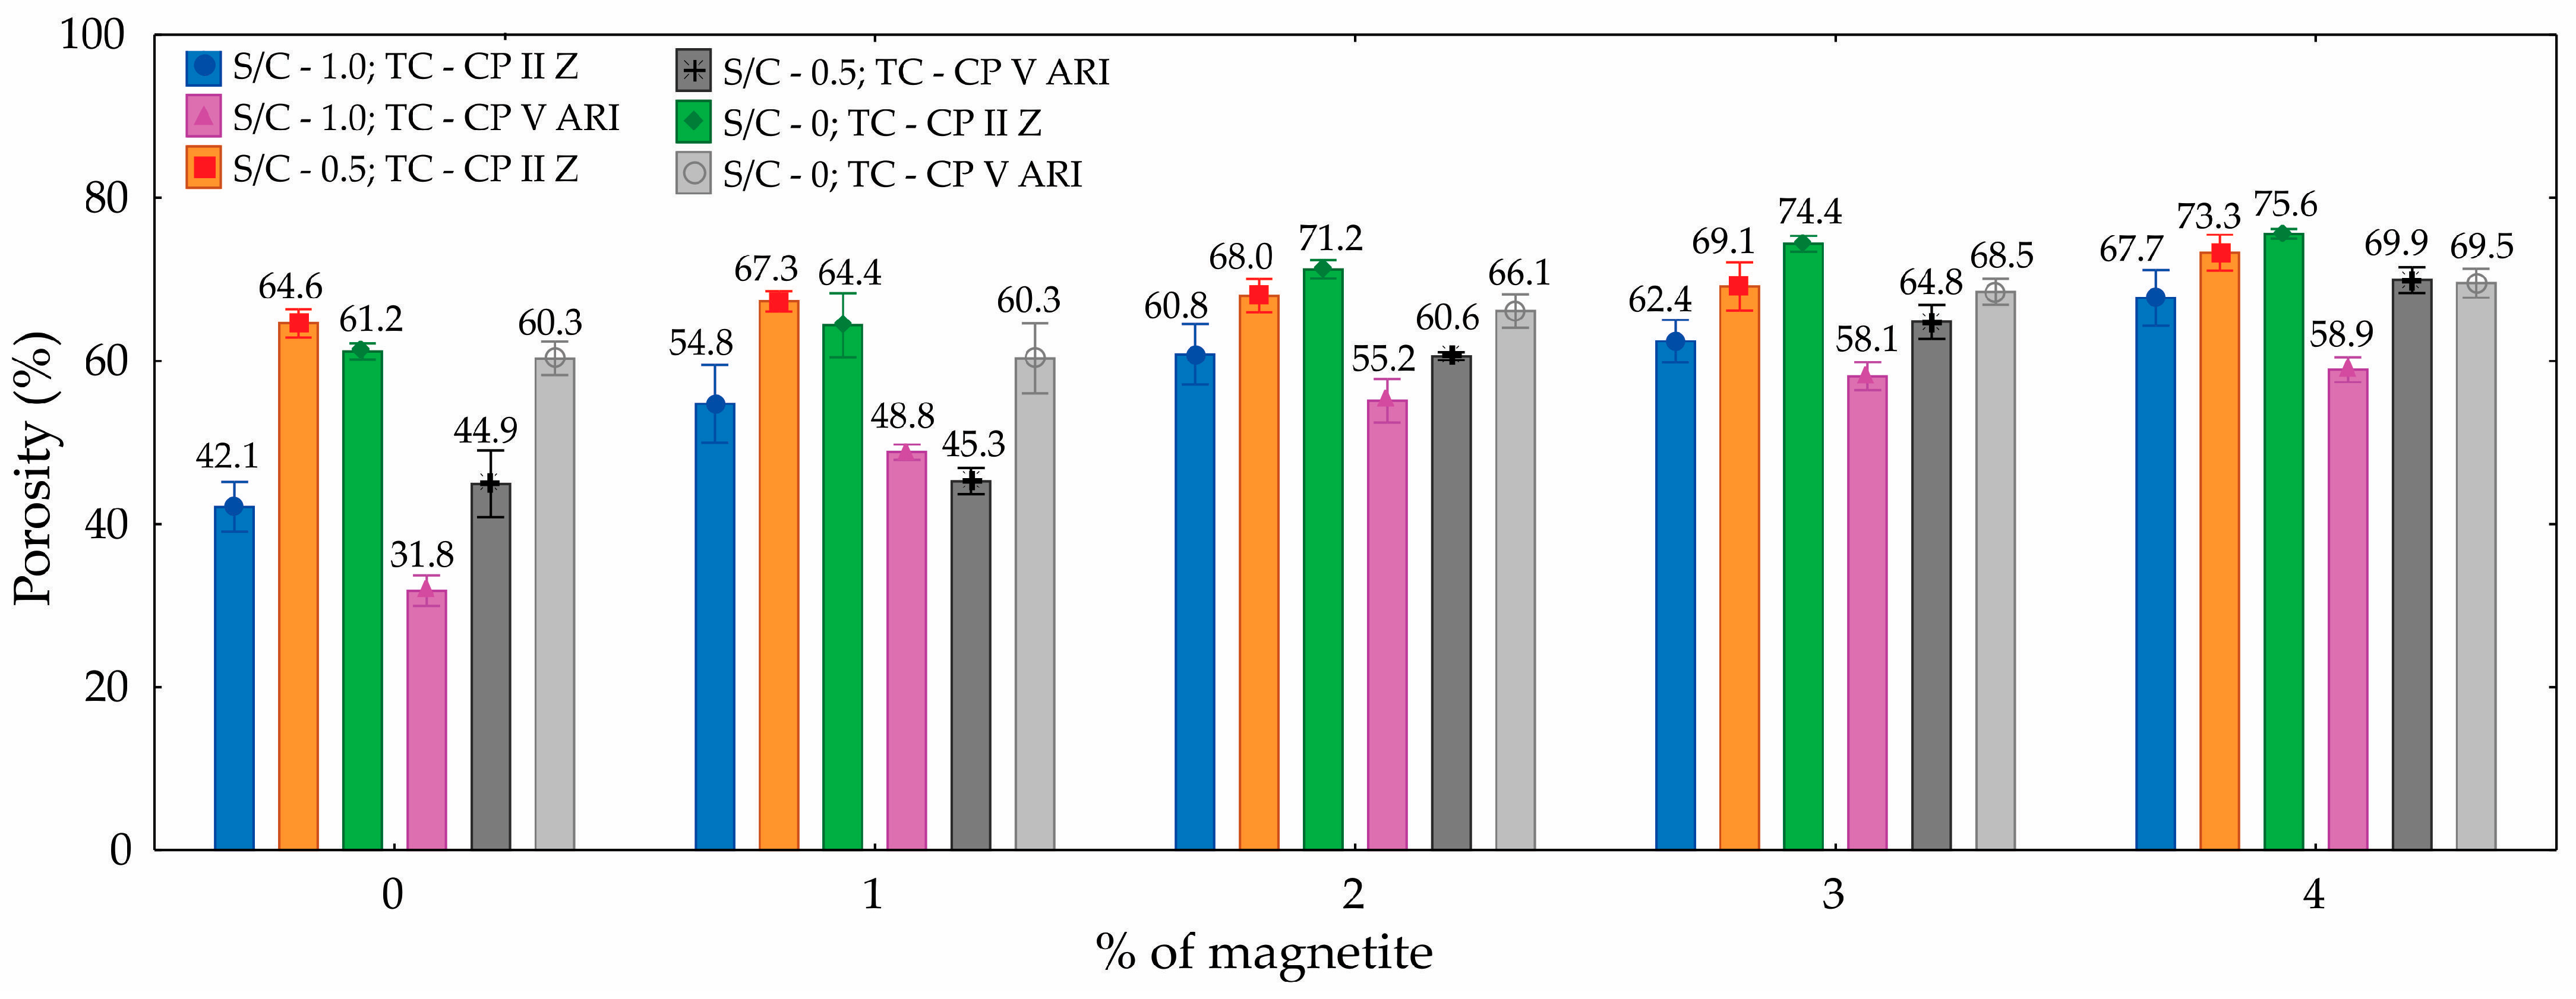
Table 3 presents the ANOVA for porosity. Based on the values shown, it can be concluded with 95% confidence that the percentage of magnetite, S/C, and TC significantly influence the number of pores in the specimens molded from magnetite cellular foamed mortar. The contributions of magnetite (41.7%), S/C (27.8%), and TC (13.5%) had the greatest impact.
The results show that porosity increased with the addition of magnetite. The specimen with an S/C ratio of 0 and a TC of CP II Z showed the highest porosity values at all magnetite concentrations, reaching 75.6% with 4% magnetite. On the other hand, the specimen with an S/C ratio of 1.0 and a TC of CP V ARI had the lowest initial porosity (31.8%), but also showed a progressive increase, reaching 58.9% with 4% magnetite. The influence of the S/C is evident, as specimens with a higher cement content (S/C = 0) showed higher porosity. This can be explained by the greater amount of cementitious material available for hydration reactions and the subsequent formation of a more porous structure. As for the type of cement, CP II Z generally resulted in higher porosity values compared to CP V ARI, possibly due to the presence of additions in CP II Z that affect the material’s microstructure. The addition of magnetite acts as a foam stabilizer, promoting an increase in porosity as its content increases. Thus, the combined factors of composition and magnetite addition play a fundamental role in the porosity behavior of the materials studied.
Figure 5 illustrates the variation in porosity with respect to the magnetite content. It can be observed that the inclusion of magnetite led to an increase in porosity, with differences in the results depending on the types of cement used. For example, CP II Z cement exhibited higher porosity than CP V ARI cement. Another notable observation is the influence of the S/C, where a reduction in this ratio is associated with an increase in porosity values.
An increase in porosity was observed with the addition of magnetite, with the results also varying according to the type of cement used. Mixes produced with CP II Z cement exhibited higher porosity compared to those made with CP V ARI. Additionally, a reduction in the S/C led to a noticeable increase in porosity values.
The measured porosity values ranged from 31.8% to 75.6%, with average porosity increasing in response to variations in CP, S/C, and the percentage of magnetite incorporated.
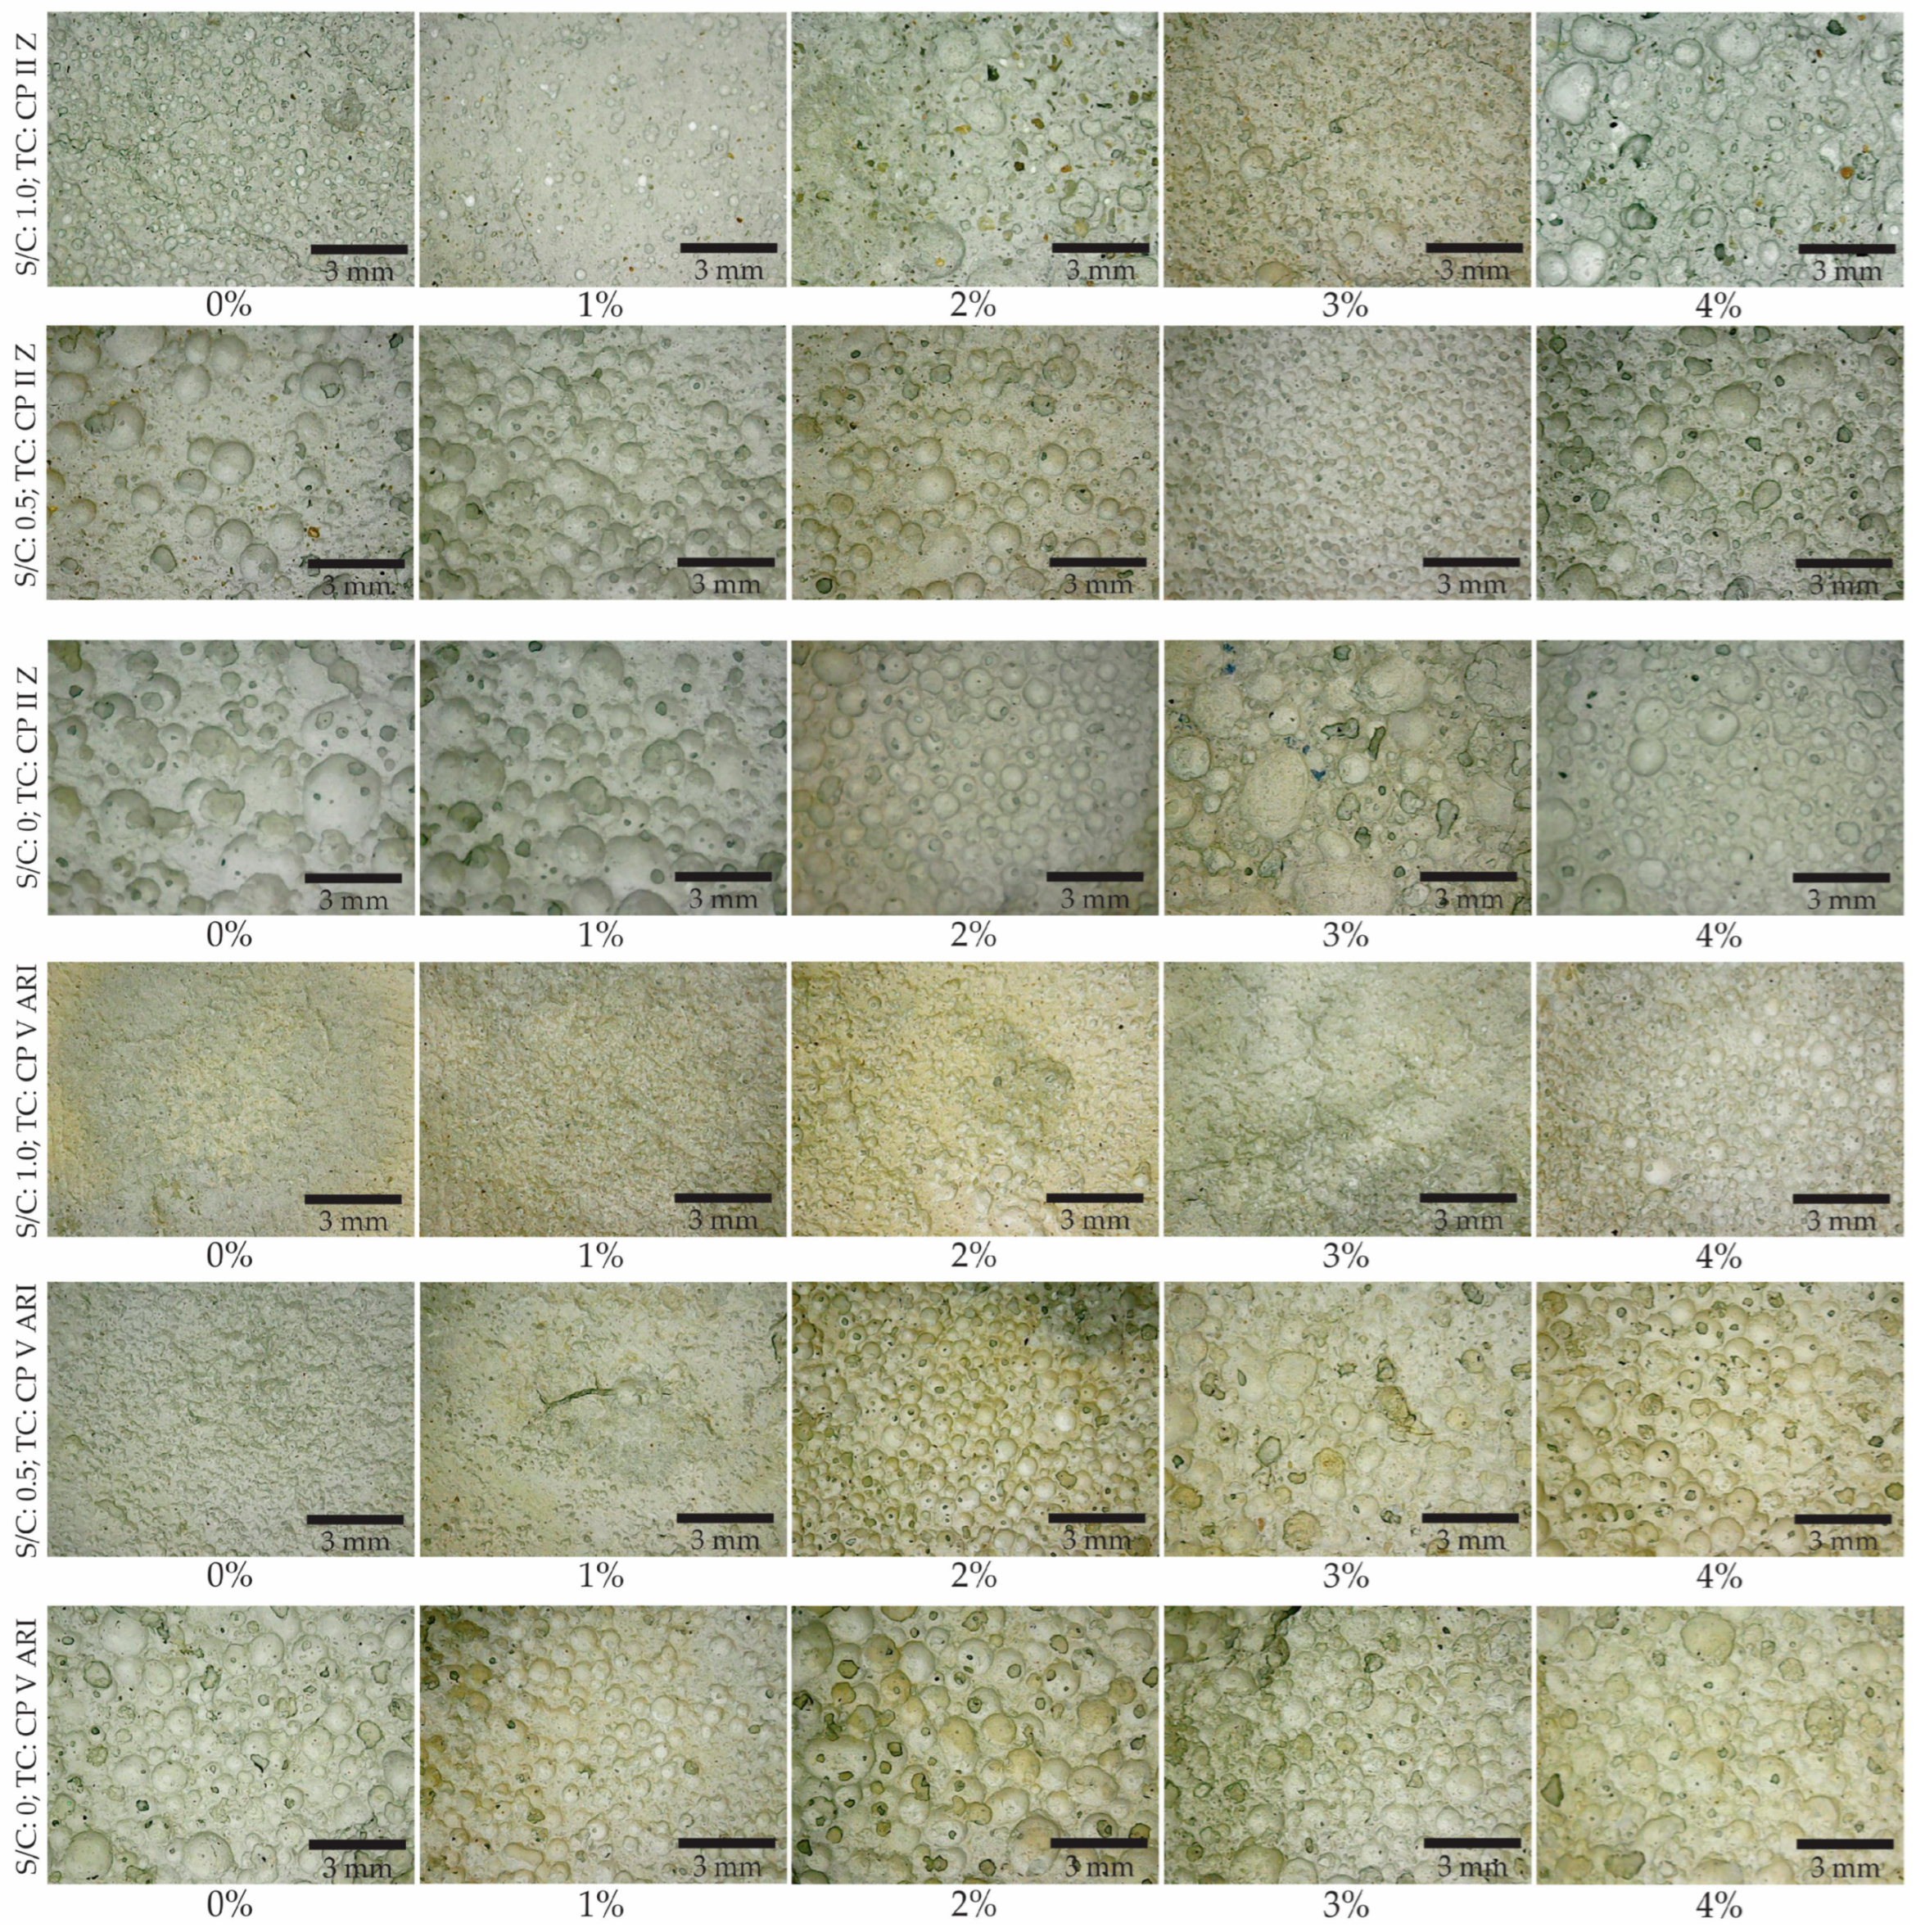
Figure 6 shows the pores in the cross-sectional images of each mix developed. From these images, the pore distribution was determined. Analyzing the images revealed variations in the porosity of mortar. Porosity tended to increase with the addition of magnetite, with pores becoming more visible and larger in samples with higher percentages of magnetite. Pore distribution also varied, with some samples showing a more uniform distribution of pores, while others exhibited a more irregular formation. CP V ARI cement, due to its high initial strength, promoted a more compact pore structure, while CP II Z, with its greater durability, resulted in a different porosity pattern.
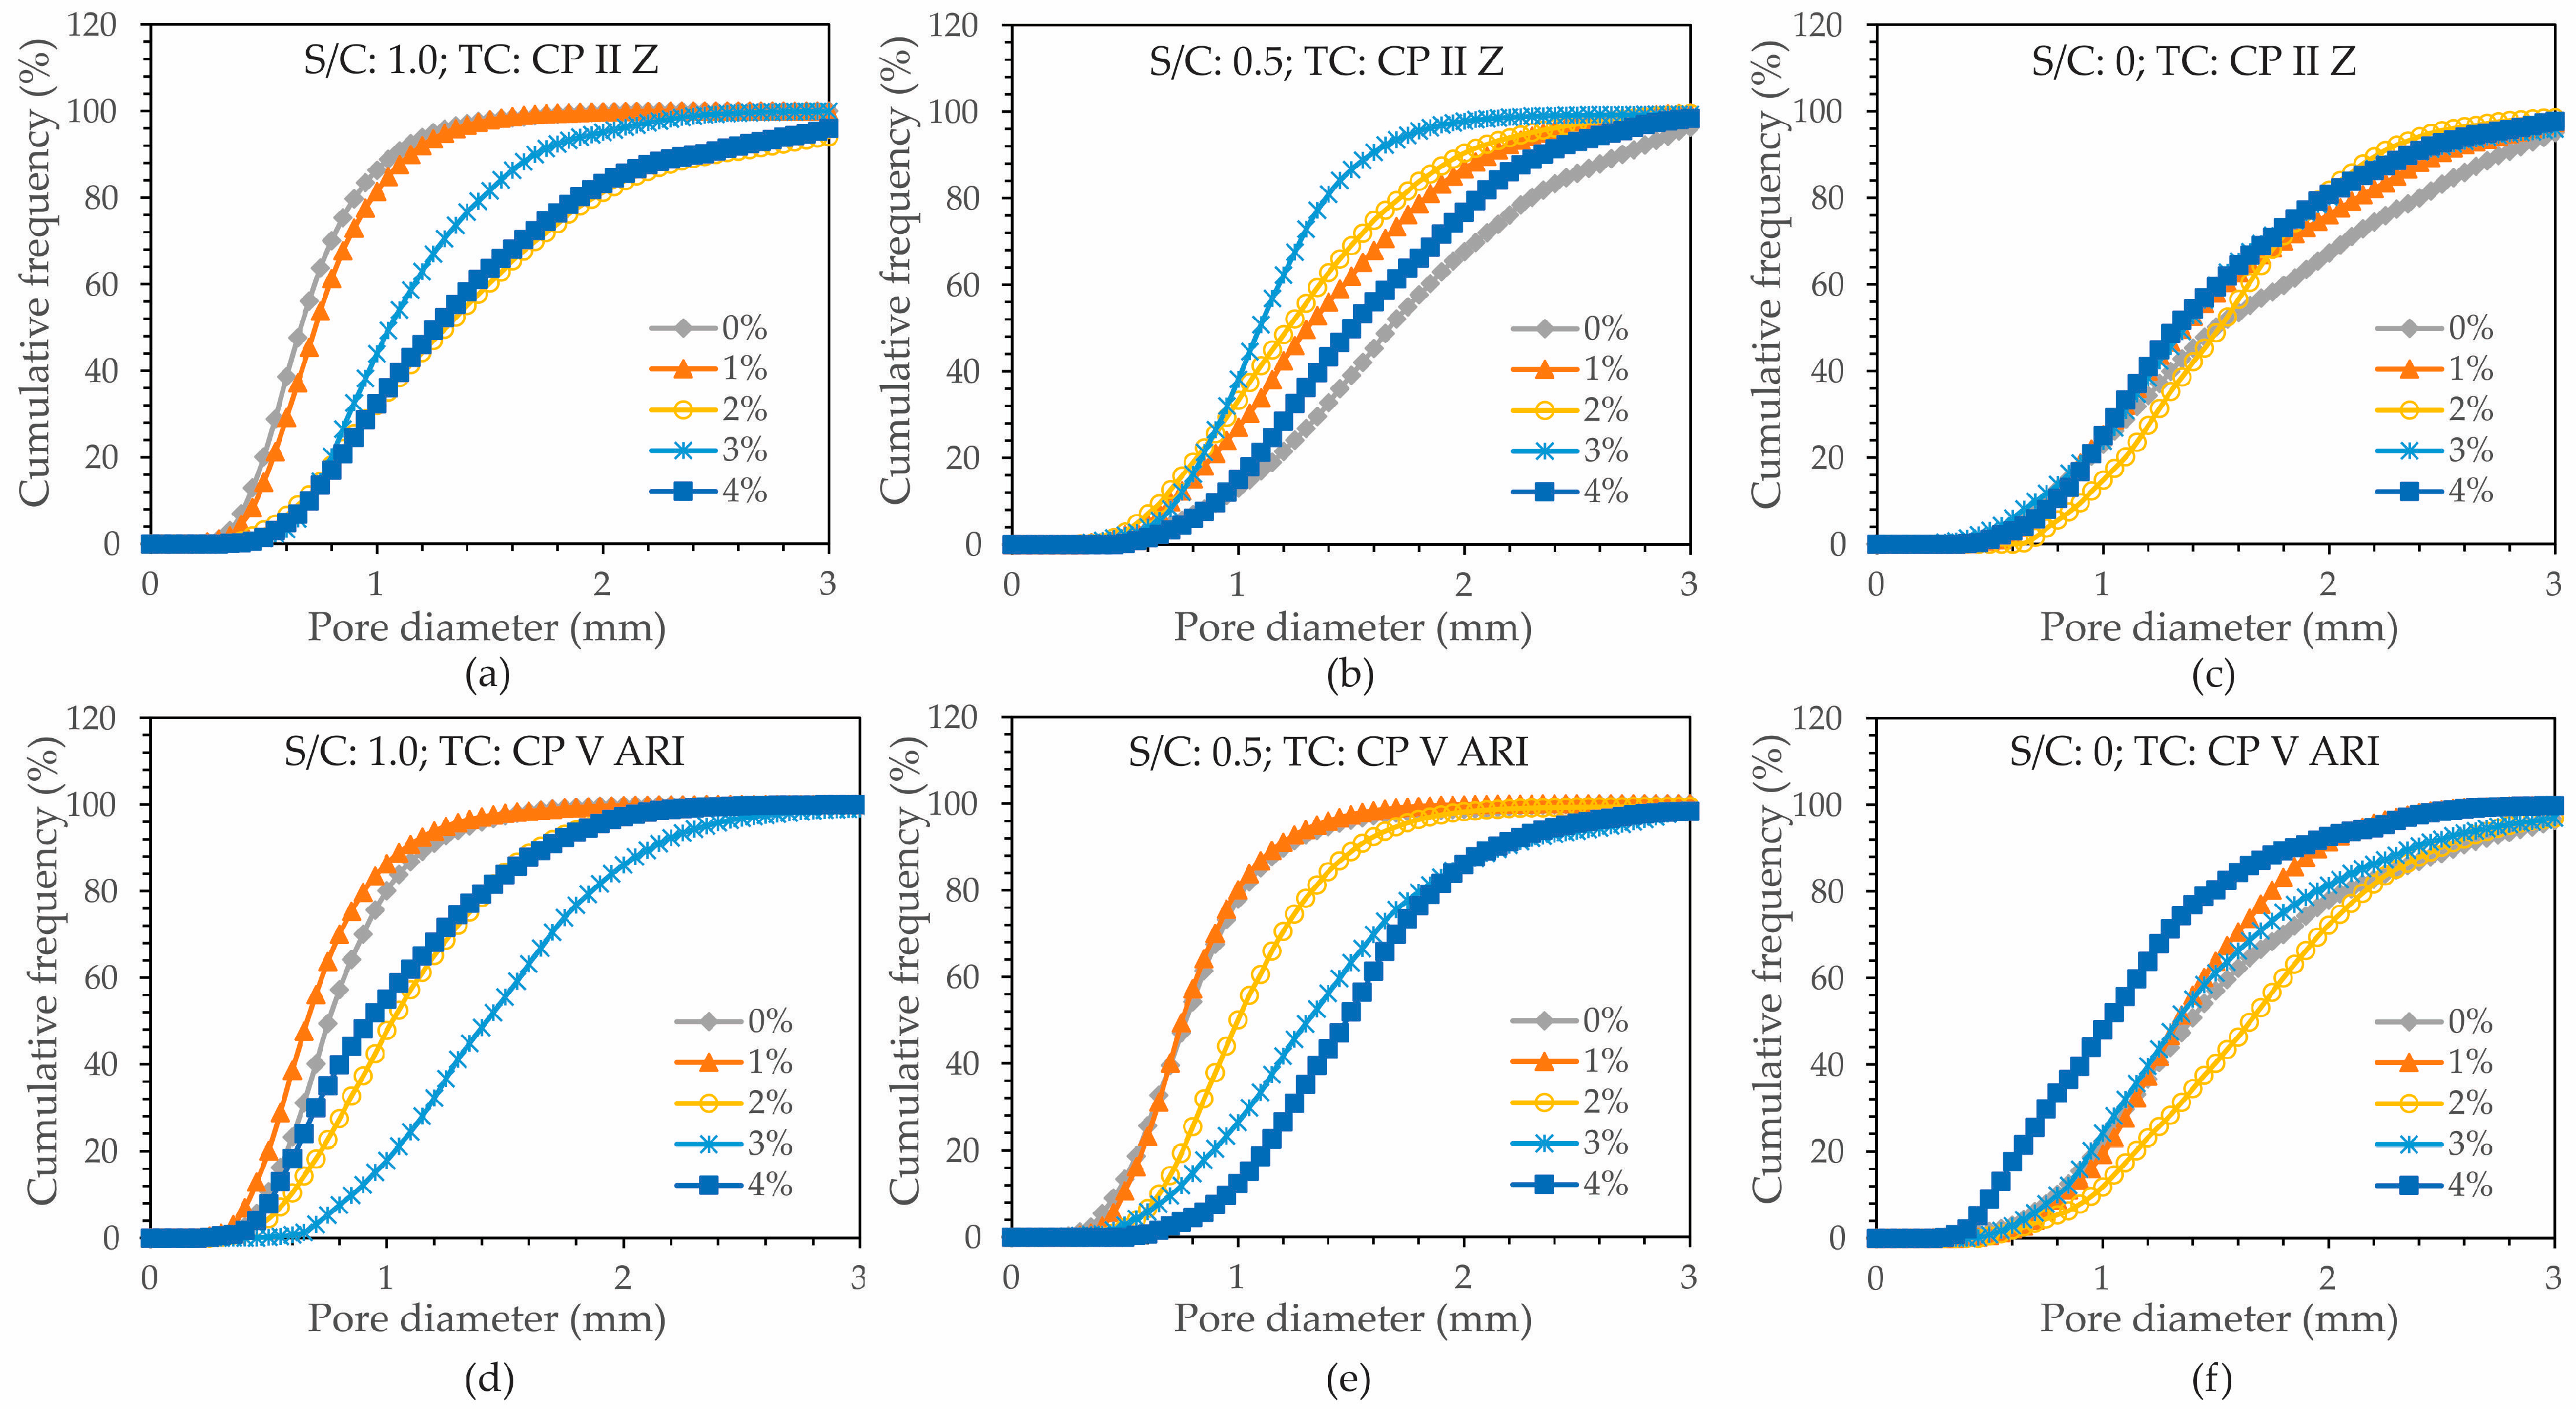
The distribution of pores was also analyzed by cutting the cross-section of the specimens, and the results were obtained. A cumulative frequency graph was created in relation to pore diameter to characterize the porosity in the foamed mortar, with the average diameter shown in
Figure 7.
Based on the D10, D50, and D90 values, it can be concluded that there was a more efficient distribution of pores in the specimens with higher magnetite content, regardless of the S/C. However, as the S/C decreased, a more uniform distribution of pores was observed, especially in the specimens with higher percentages of magnetite. This trend reflects the influence of both the TC and the S/C.
Analyzing the cumulative frequency (%) graphs revealed a significant variation in the porosity of foamed mortar.
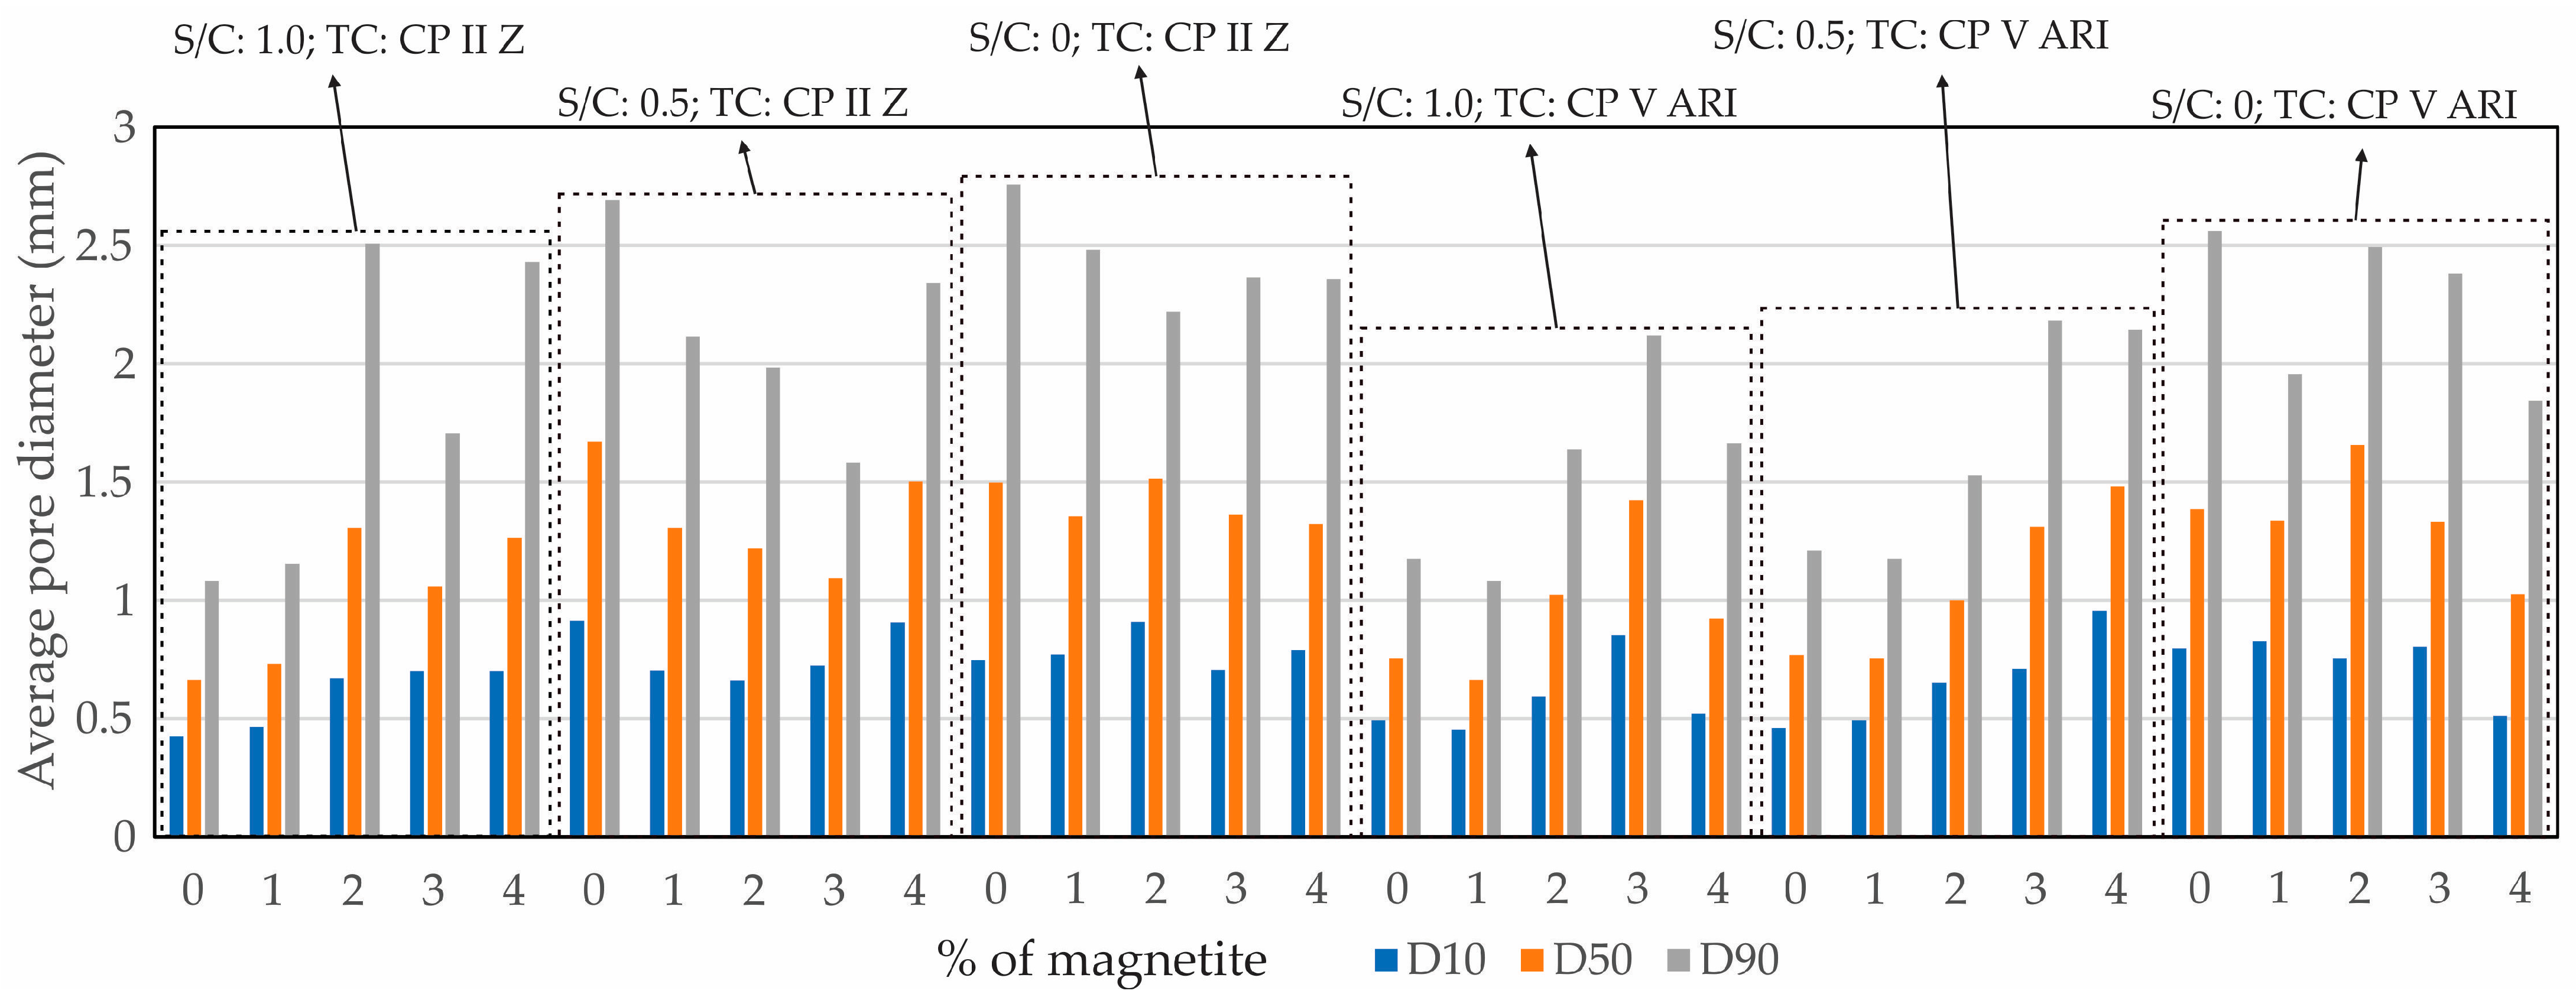
Figure 8 shows the profile of the average pore diameters in relation to the percentage of magnetite (%), including D10 (where 10% of the particles had smaller diameters), D50 (the median diameter, with 50% of the particles below and 50% above this value), and D90 (where 90% of the particles had smaller diameters).
Based on the D10, D50, and D90 values, it can be concluded that there was a more efficient distribution of pores in the specimens with higher magnetite content, regardless of the S/C. However, as the S/C ratio decreased, a more uniform distribution of pores was observed, especially in the specimens with higher percentages of magnetite. This trend reflects the influence of both the TC and the S/C.
Analyzing the cumulative frequency (%) graphs revealed a significant variation in the porosity of foamed mortar.
Figure 8 shows the profile of the average pore diameters in relation to the percentage of magnetite (%), including D10 (where 10% of the particles had smaller diameters), D50 (the median diameter, with 50% of the particles below and 50% above this value), and D90 (where 90% of the particles had smaller diameters).
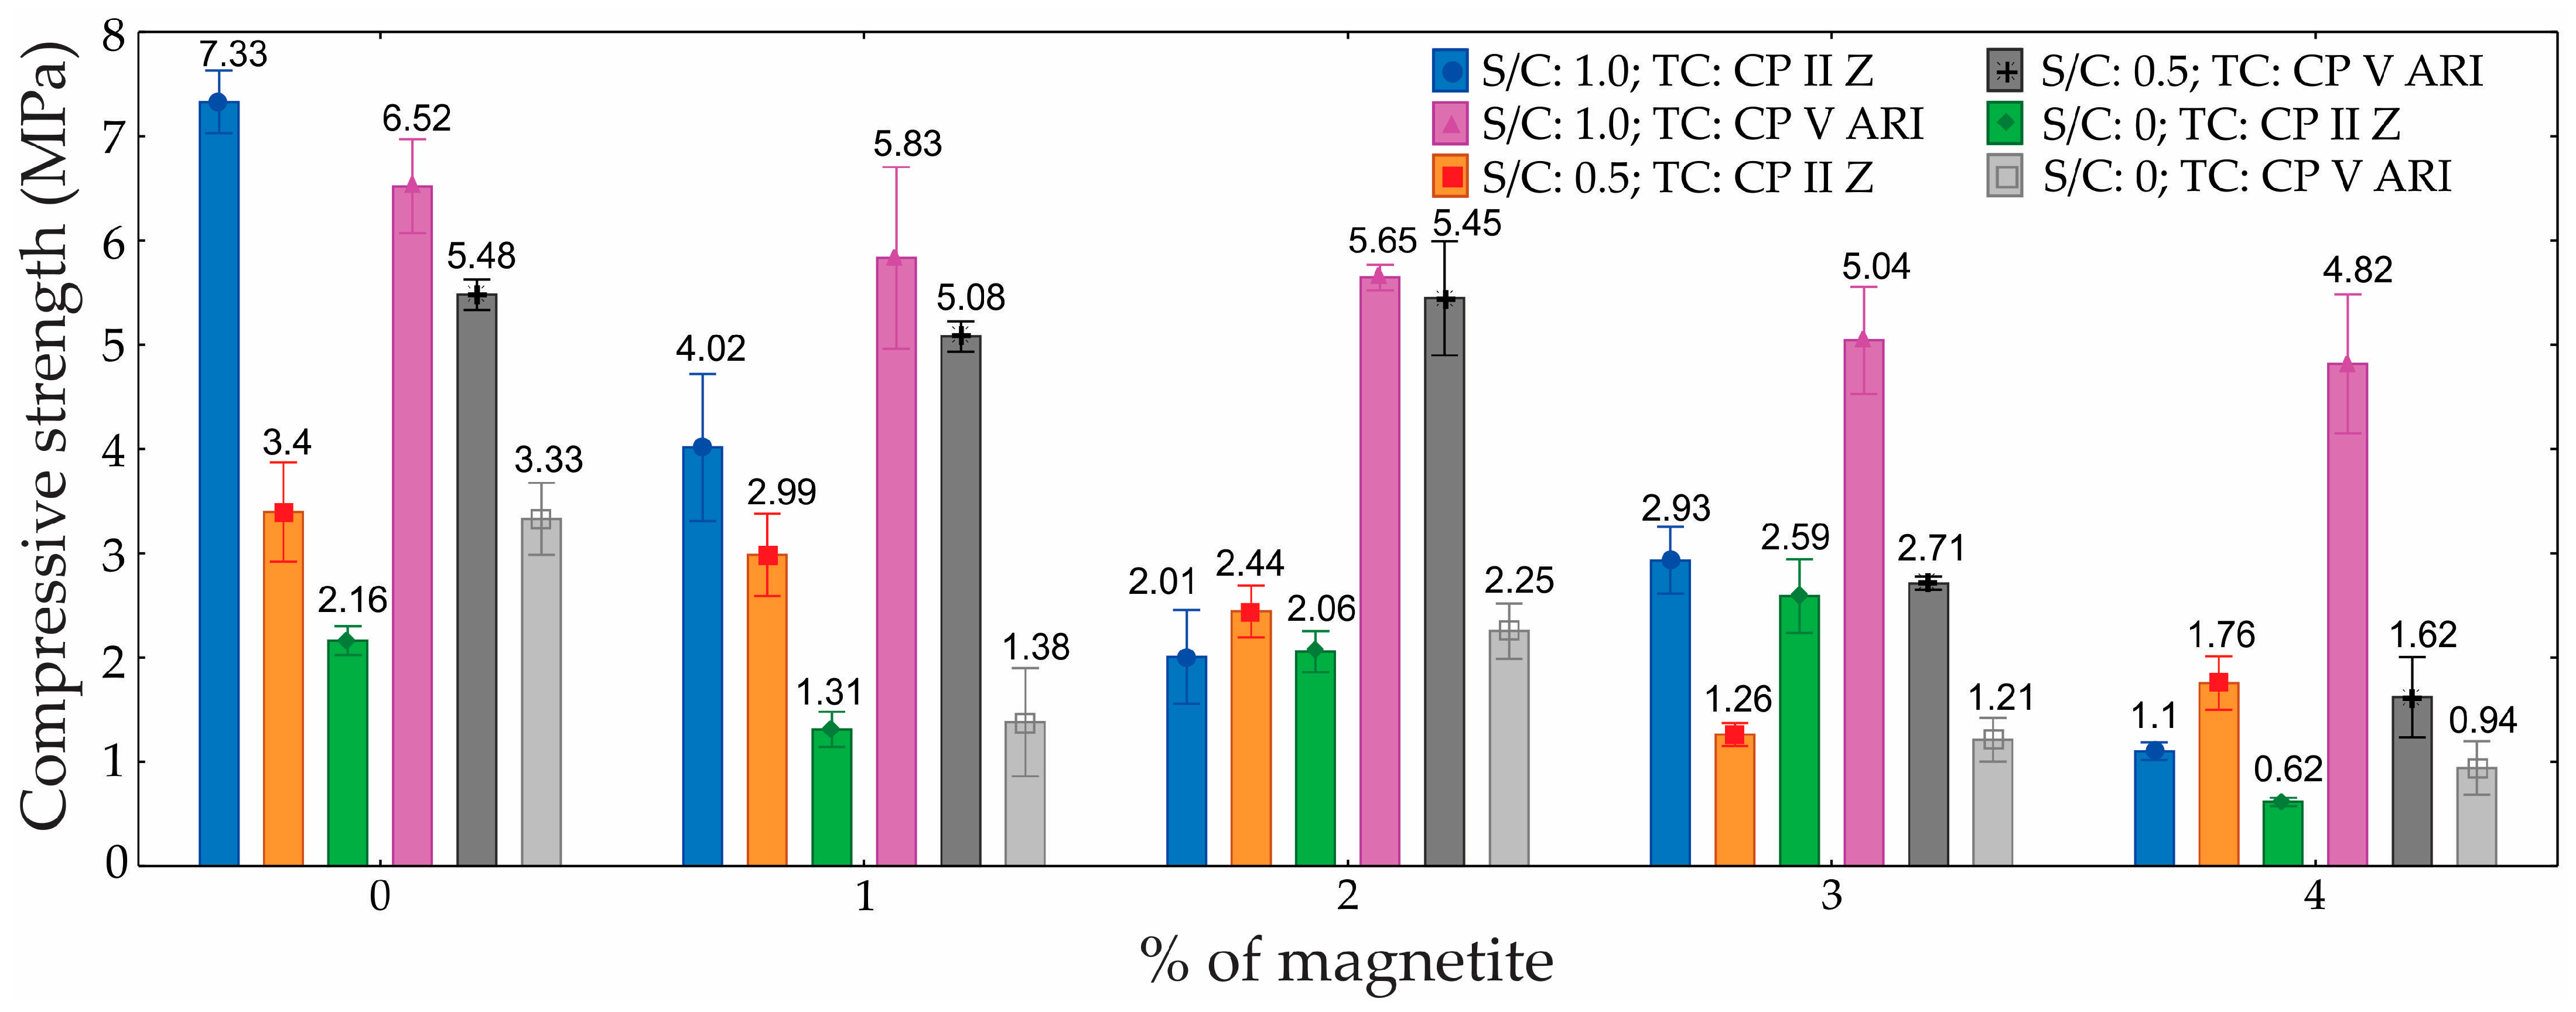
3.2. Compressive Strength
Table 4 presents the ANOVA for the compressive strength of the foamed mortars, with 95% confidence.
Figure 9 shows the compressive strength results and their respective standard deviations for the different percentages of magnetite, S/C, and TC.
The analysis revealed that the TC, the percentage of magnetite, and the S/C, as well as the interactions between these factors, significantly influenced the compressive strength. The greatest influence was observed in the S/C, which contributed 35.5%, followed by the percentage of magnetite, at 26.0%, and the TC, at 11.8%.
The greater impact observed in the S/C is intrinsically linked to the different formulations tested, with the magnetite content kept constant. In the present study, the amount of cement was kept constant across all mixtures, while the sand content was systematically varied to adjust the S/C. As a result, mixtures with lower sand content exhibited lower densities and, consequently, lower compressive strengths. This behavior is consistent with findings reported by Liu et al. [
42] and Othman et al. [
43], who demonstrated that in foamed mortar, the compressive strength is closely related to the material’s density. The increase in sand content improves particle packing within the matrix, reducing pore volume and leading to a denser and more mechanically robust structure. Conversely, the reduction in sand increases the air void, diminishes the efficiency of the solid skeleton, and weakens the foam walls, resulting in lower compressive strength. Moreover, improved packing density contributes to a more effective load distribution and minimizes stress concentrations within the cementitious matrix. Therefore, the trend observed in the experimental results—where mixtures with higher sand content achieved higher compressive strengths—is fully consistent with established behavior in lightweight foamed mortar, reinforcing the accuracy and validity of the results obtained.
As discussed above, it can be seen that as porosity increased, there was a decrease in strength, indicating a direct relationship between porosity and strength. Therefore, particularly at lower densities, achieving a more uniform distribution of air bubble diameters, along with the reduction of larger bubbles, led to an increase in the compressive strength of ultralight foamed mortars [
44].
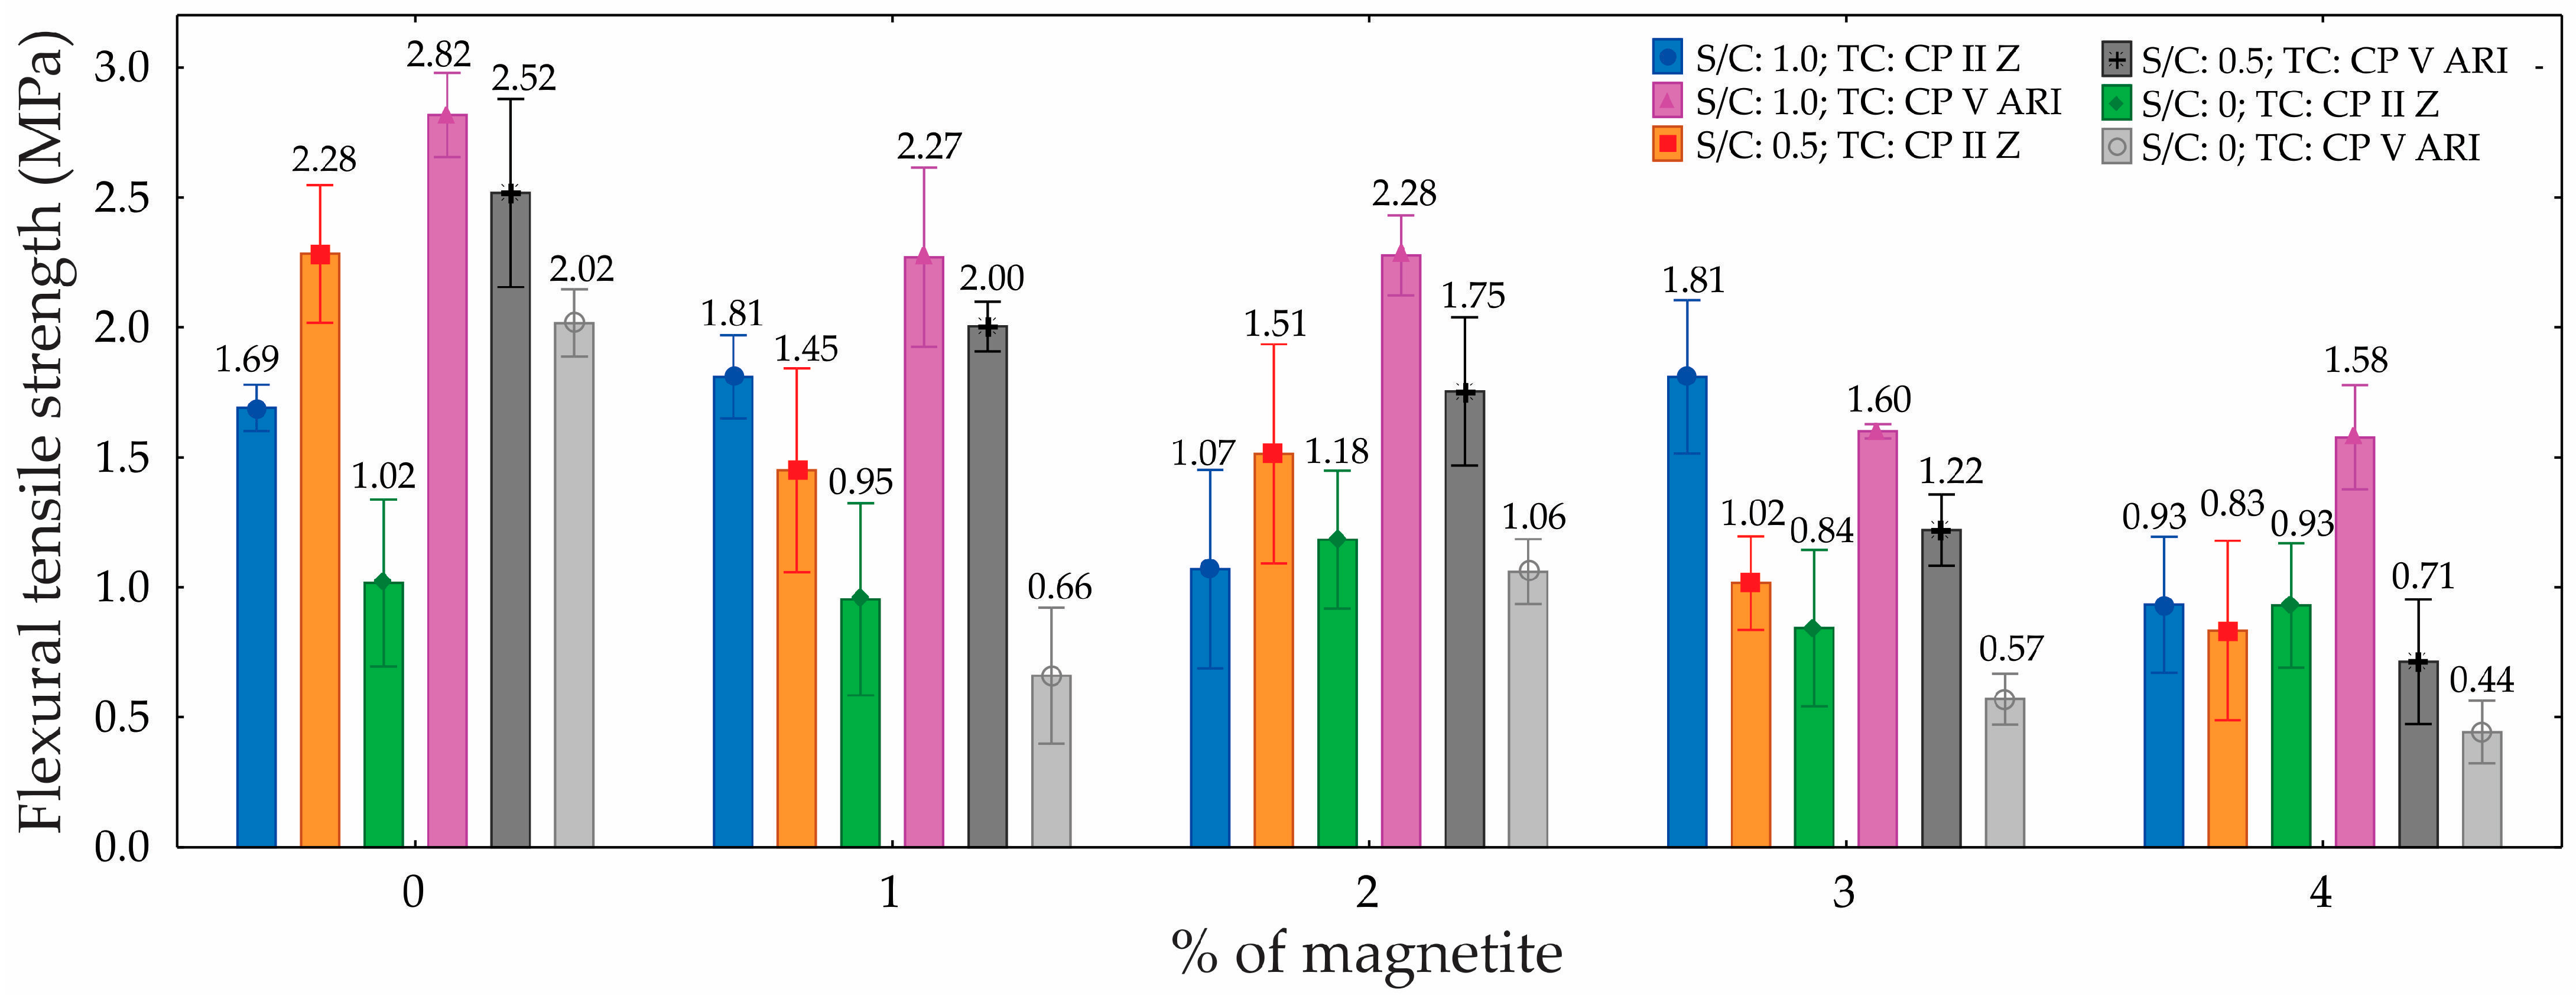
3.3. Tensile Flexural Strength
Table 5 presents the results of the ANOVA for the tensile flexural strength of the foamed mortars, with a 95% confidence level. The ANOVA revealed the significance of each factor in the material’s performance. The TC was identified as a significant factor, indicating that the TC substantially impacts the tensile strength, contributing 4.5% to the total variation. The S/C proved to be even more influential, accounting for 27.5% of the variation, demonstrating that different proportions of cement and sand significantly affect the material’s strength. The percentage of magnetite emerged as the most influential factor, contributing 35.1%, highlighting a strong correlation between the magnetite content and tensile strength.
The graph in
Figure 10 illustrates that tensile flexural strength varied across the different mixes. The highest strength was observed with an S/C of 1.0 and TC CP II Z, achieving 2.52 MPa with 0% magnetite—an increase of approximately 49% compared to the lowest strength (S/C = 0, TC CP V ARI, with 4% magnetite). Overall, increasing the percentage of magnetite progressively reduced strength across all combinations analyzed, with this reduction being most pronounced in CP V ARI. Additionally, the S/C of 1.0 yielded the best results, demonstrating improved stress distribution and superior performance compared to S/Cs of 0.5 and 0. Therefore, the combination of an S/C of 1.0 and CP II Z stands out as the most efficient, while increasing the magnetite content negatively impacts flexural tensile strength.
The reduction in flexural tensile strength with an increase in the percentage of magnetite is associated with an increase in porosity. In other words, by increasing the percentage of magnetite in the foam formulation, the number of pores increases, resulting in a reduction in the material’s mechanical strength. On the other hand, the reduction in mechanical strength as the sand content in the mix decreases can be explained by the lower density of the material and the increased coalescence of the bubbles in the foamed mortar. The amount of sand directly influences the viscosity of the cement paste, which can have an impact on the efficiency of bubble encapsulation during the mixing process.
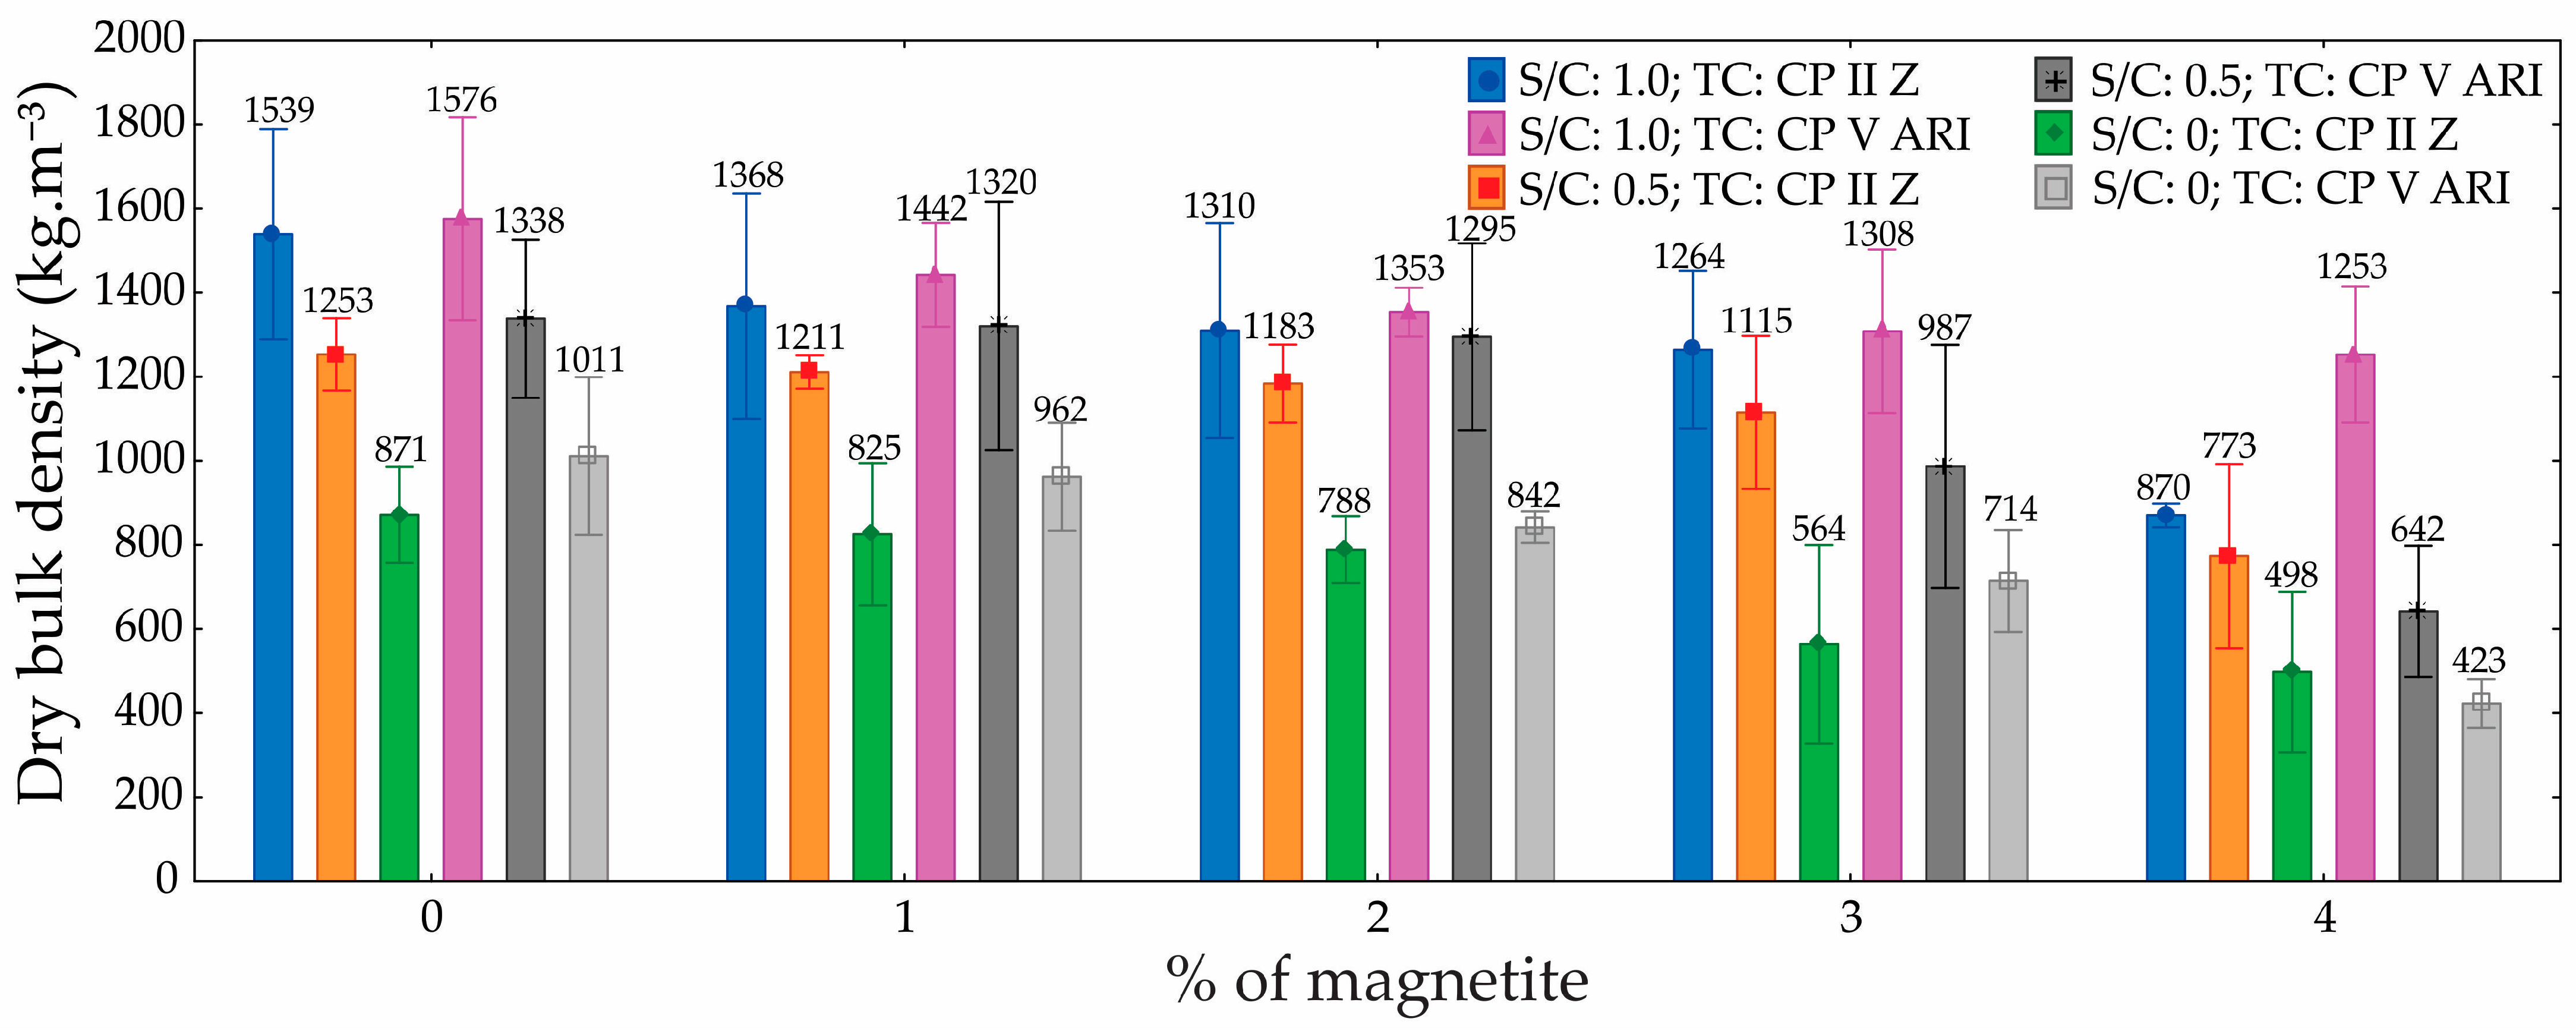
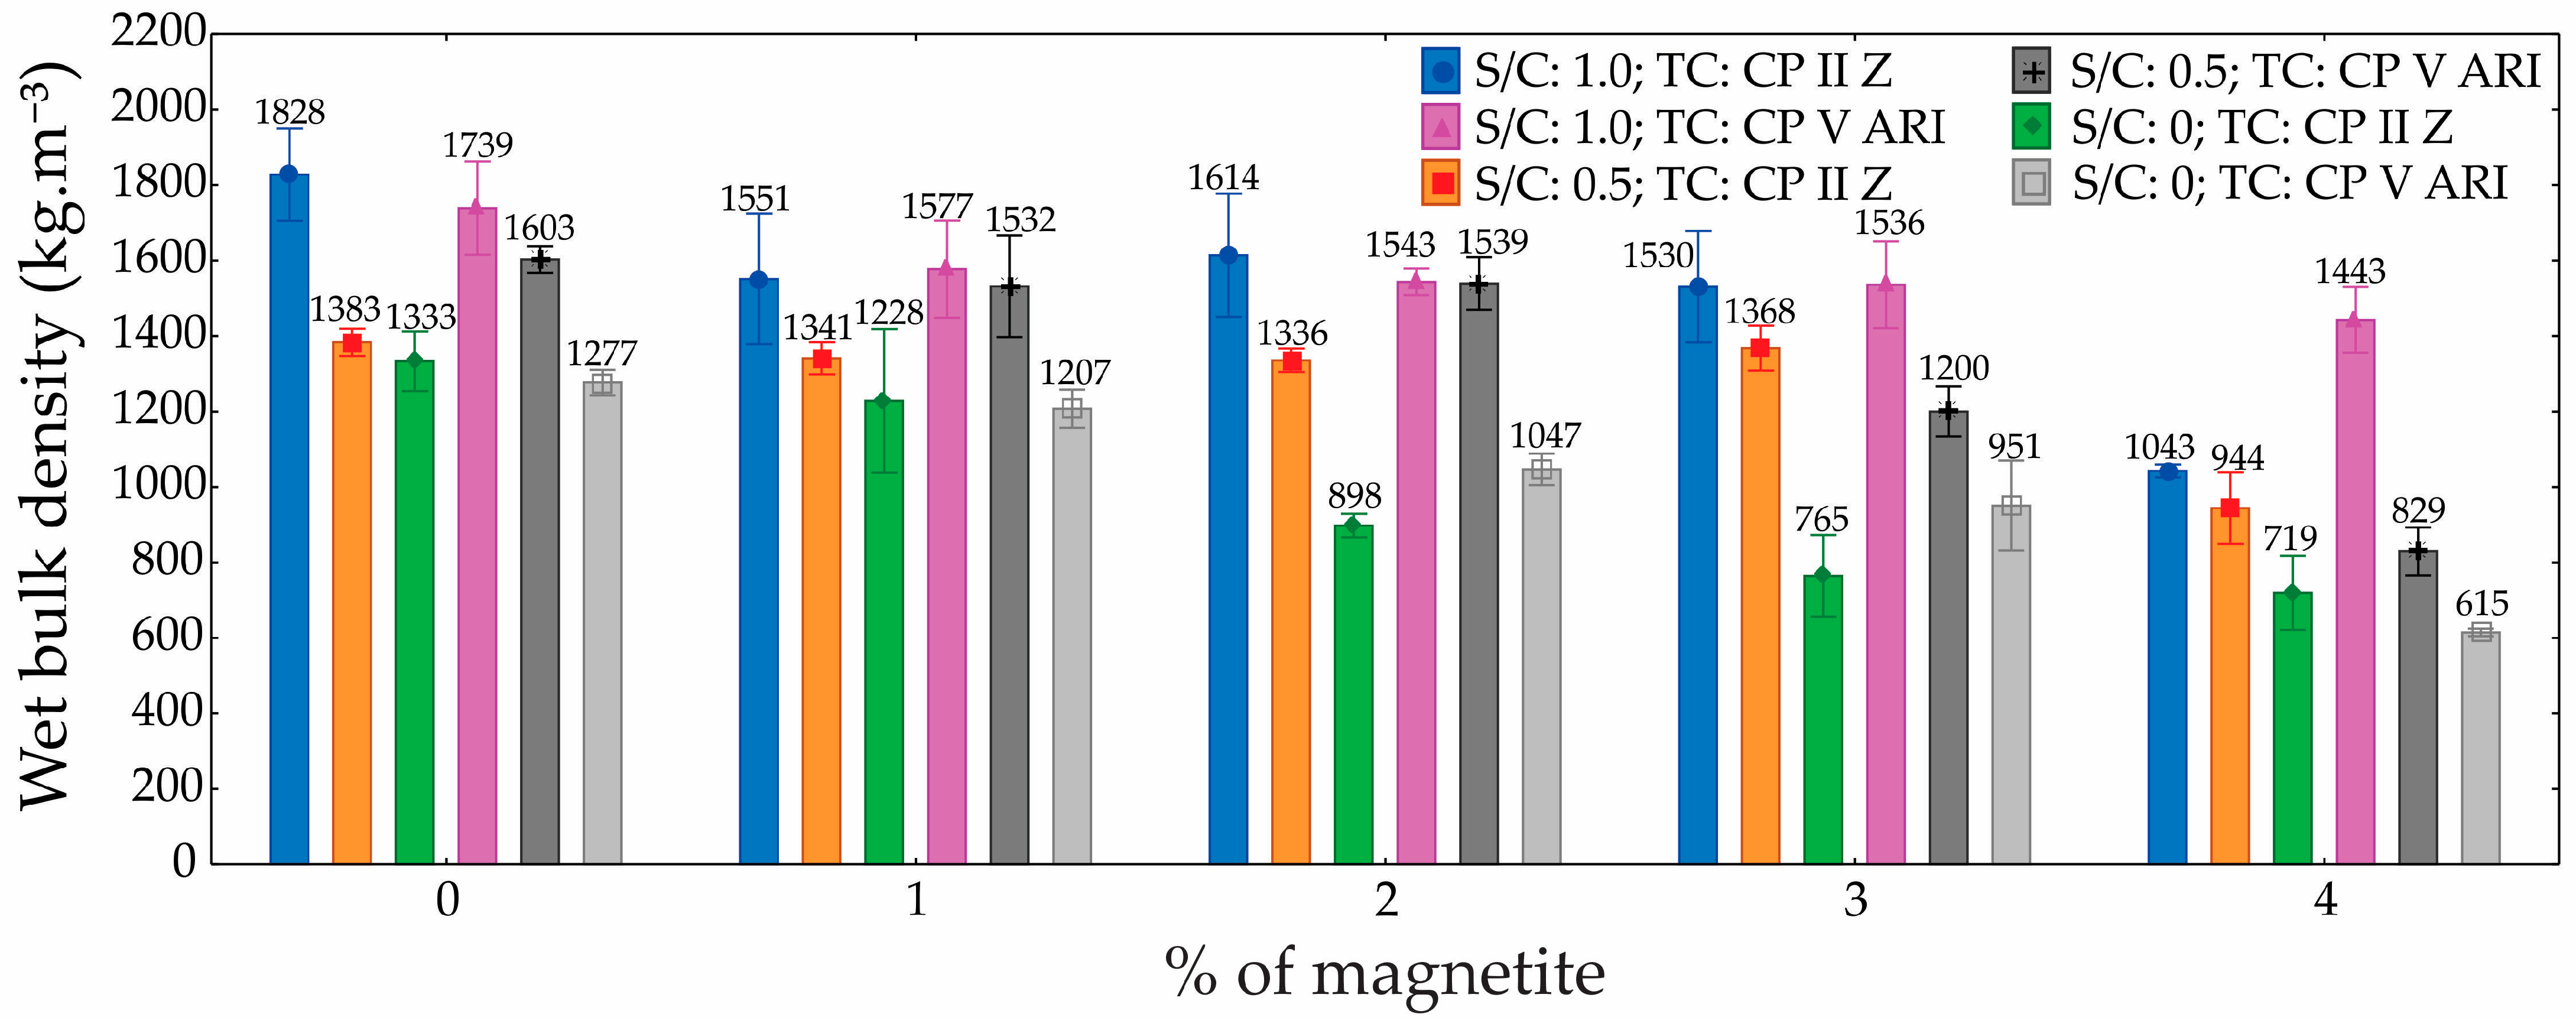
3.4. Dry and Wet Bulk Density
Regarding densities, the ANOVA results (
Table 6 and
Table 7) demonstrated that both the S/C and the magnetite content had a statistically significant influence. These factors notably affected the density of the foamed mortars. As porosity increased, density values decreased accordingly. Since the foam volume was kept constant across all mixtures, variations in density can be attributed solely to changes in the S/C and the amount of magnetite added. When analyzing each mixture individually, magnetite content emerged as the most influential variable. Higher magnetite concentrations helped preserve the integrity of the incorporated air bubbles, likely due to the reinforcement of the hydrolipophilic film surrounding them.
The dry and wet bulk density graphs (
Figure 11 and
Figure 12) for foamed mortars indicate that, overall, density decreased as the percentage of magnetite increased, regardless of the S/C. For dry density, specimens with S/C = 1.0 exhibited the highest values, with a reduction of approximately 22% when the magnetite content increased from 0% to 4% (1800 kg.m
−3 to 1400 kg.m
−3). In contrast, for S/C = 0, the dry density was significantly lower, showing a reduction of around 50% (1400 kg.m
−3 to 700 kg.m
−3).
A similar trend was observed in wet density, where S/C = 1.0 presented the highest initial values (2000 kg.m−3) and a reduction of up to 30% with 4% magnetite. Conversely, specimens with S/C = 0 exhibited considerably lower wet densities, with reductions proportional to those seen in dry density. Specimens with S/C = 0.5 demonstrated intermediate values in both cases, though they also showed a progressive decrease in density as the magnetite content increased.
The differences in density among the specimens can be attributed to a combination of factors, including the material composition and internal structure. The reduction in density with increasing magnetite content is linked to its effect on the foam formation process, which led to greater air incorporation and a lighter cellular structure. Additionally, a higher S/C (1.0) enhanced the stability of the mortar matrix, resulting in greater density due to a more uniform distribution of solid particles and a reduced pore volume. Conversely, at S/C = 0, the absence of sand decreased matrix compaction, leading to increased porosity and lower densities, particularly as the magnetite content increased.
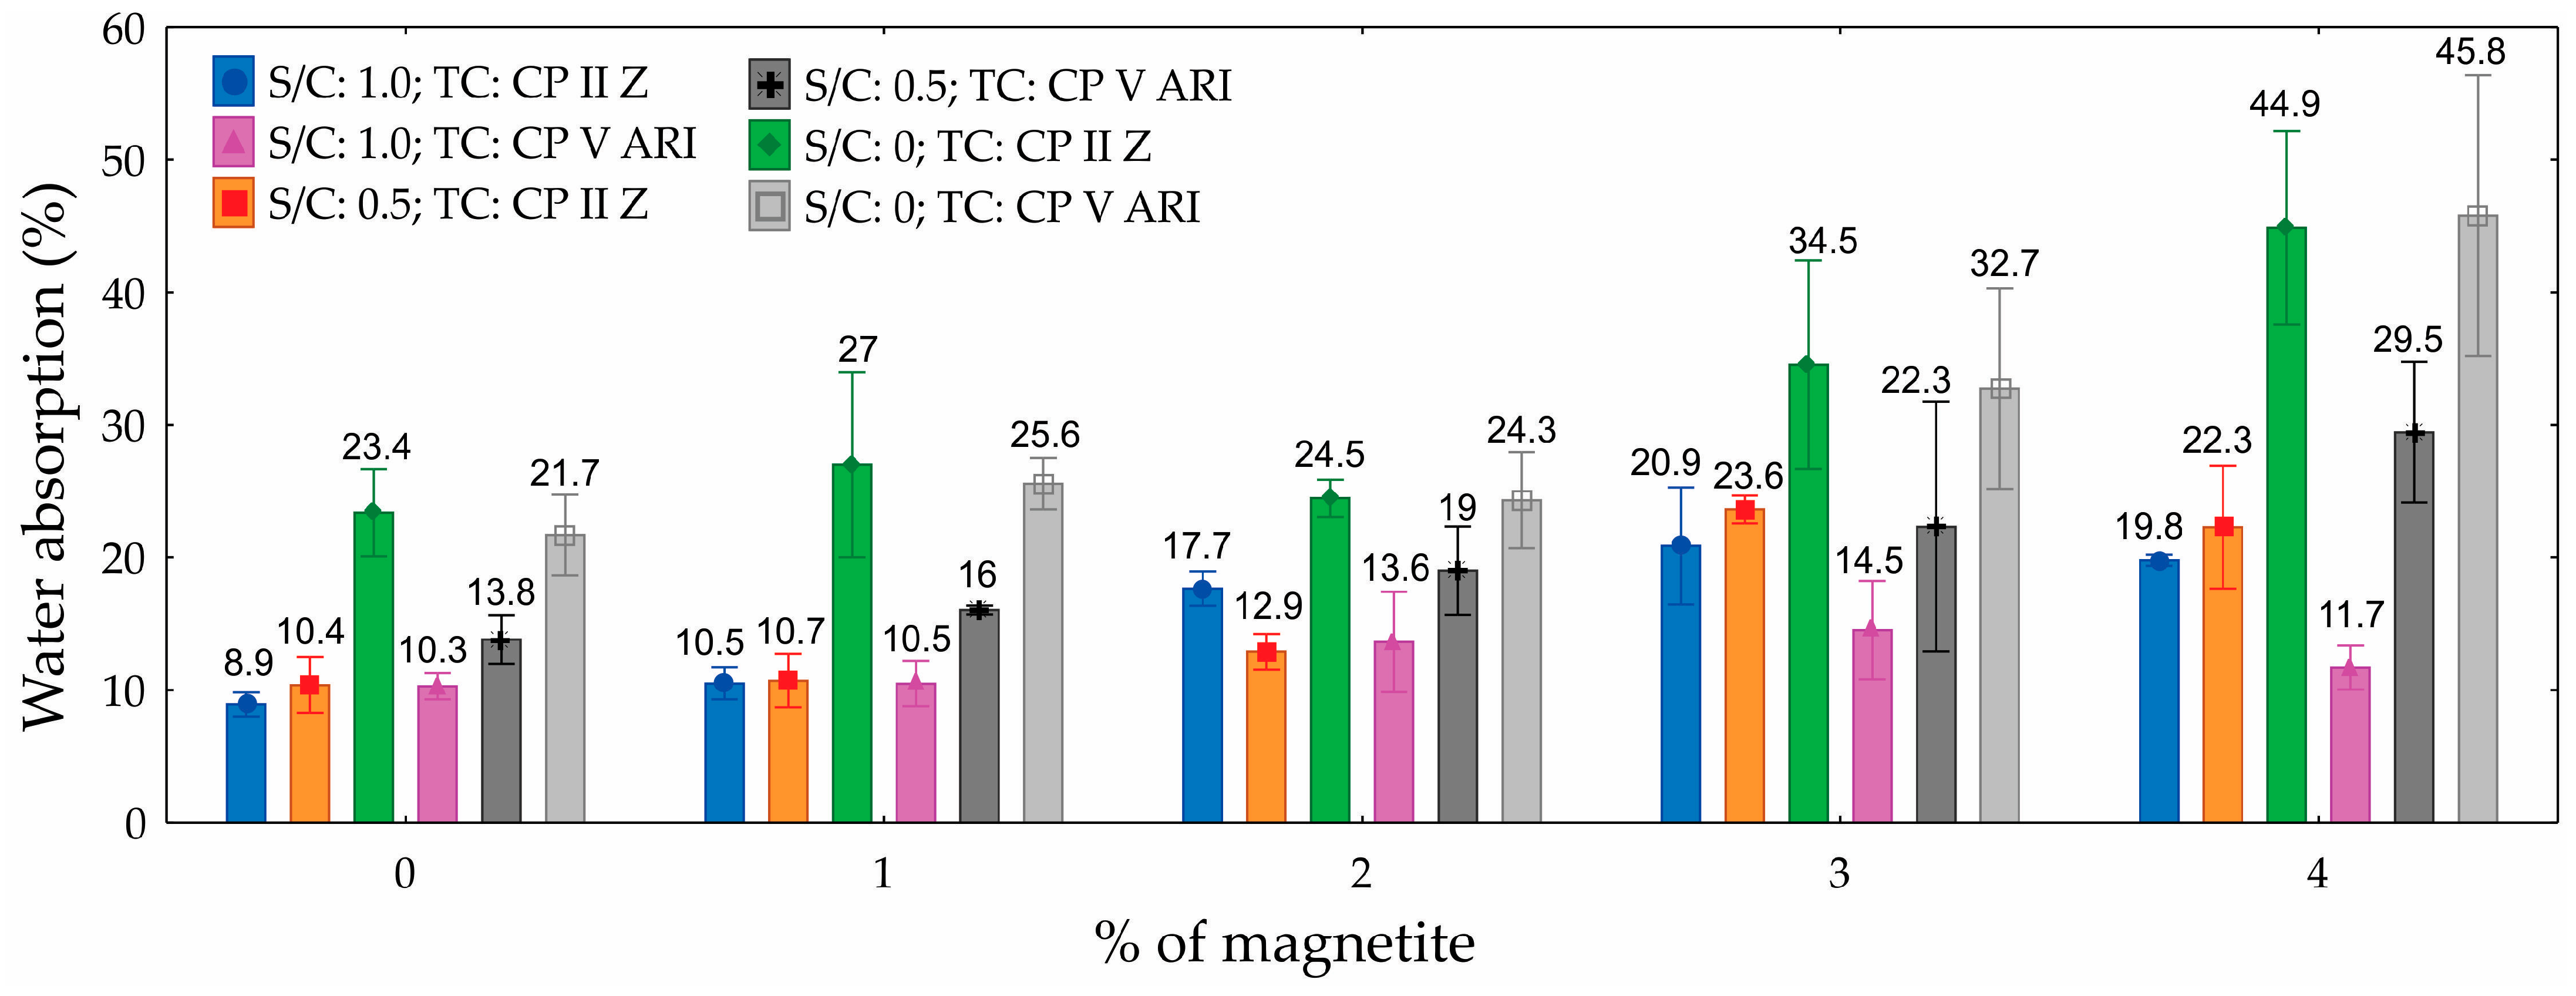
3.5. Water Absorption
The ANOVA analysis for water absorption, presented in
Table 8, reveals that the S/C, the percentage of magnetite, and their interaction significantly influenced the water absorption of the CPs produced, with a 95% confidence level. The S/C was the most influential factor, contributing 47.9% to the variation in water absorption. In contrast, the TC had no significant impact on absorption, proving to be a non-significant factor.
The graph (
Figure 13) illustrates the water absorption of foamed mortars as a function of magnetite content, ranging from 0% to 4%, for different S/Cs and TCs. The results show that water absorption was highest in specimens with an S/C of 0, reaching up to 44.9% for 4% magnetite with CP II Z. In contrast, the lowest absorption values were observed in specimens with an S/C of 1.0, where absorption started at 8.9% without magnetite and increased to 22.3% with 4% magnetite. The addition of magnetite, particularly at higher levels, tended to increase water absorption, with the effect being more pronounced in compositions with less sand (S/C = 0). Comparing the extreme values, water absorption increased by up to 36% as magnetite content increased from 0% to 4%, depending on the composition.
The differences in water absorption values can be attributed to the structure and porosity of the materials, which are directly influenced by the S/C and the presence of magnetite. Specimens with an S/C of 1.0 exhibited lower water absorption due to their higher density and a more uniform distribution of the cementitious matrix, resulting in a reduced volume of interconnected pores. In contrast, specimens with an S/C of 0 show increased porosity due to the absence of sand, which allows for greater water infiltration, particularly at higher magnetite percentages.
3.6. Thermal Conductivity
The ANOVA results for thermal conductivity (
Table 9) offer a comprehensive assessment of the statistical significance and relative contribution of each factor and their interactions. The TC did not exhibit a statistically significant effect (
p-value = 0.063), contributing only 0.5% to the total variance. In contrast, the S/C emerged as the most influential factor, with a highly significant
p-value (
p-value < 0.001) and accounting for 50.3% of the variation in thermal conductivity. The percentage of magnetite also had a statistically significant impact (
p-value < 0.001), explaining 32.9% of the variance.
Among the interaction terms, the S/C × % magnetite interaction was statistically significant (p = 0.003), contributing 3.5% to the variation. Additionally, the three-way interaction (TC × S/C × % magnetite) was also significant (p < 0.001), accounting for 4.2% of the variation. Other interactions, such as TC × S/C and TC × % magnetite, were not statistically significant (p = 0.092 and p = 0.932, respectively), with minimal contributions of 0.7% and 0.1%. The residual (unexplained) variation represented 7.9% of the total.
These findings reinforce the importance of optimizing the S/C and magnetite content to effectively control and tailor the thermal conductivity of foamed mortars, while the TC plays a comparatively minor role.
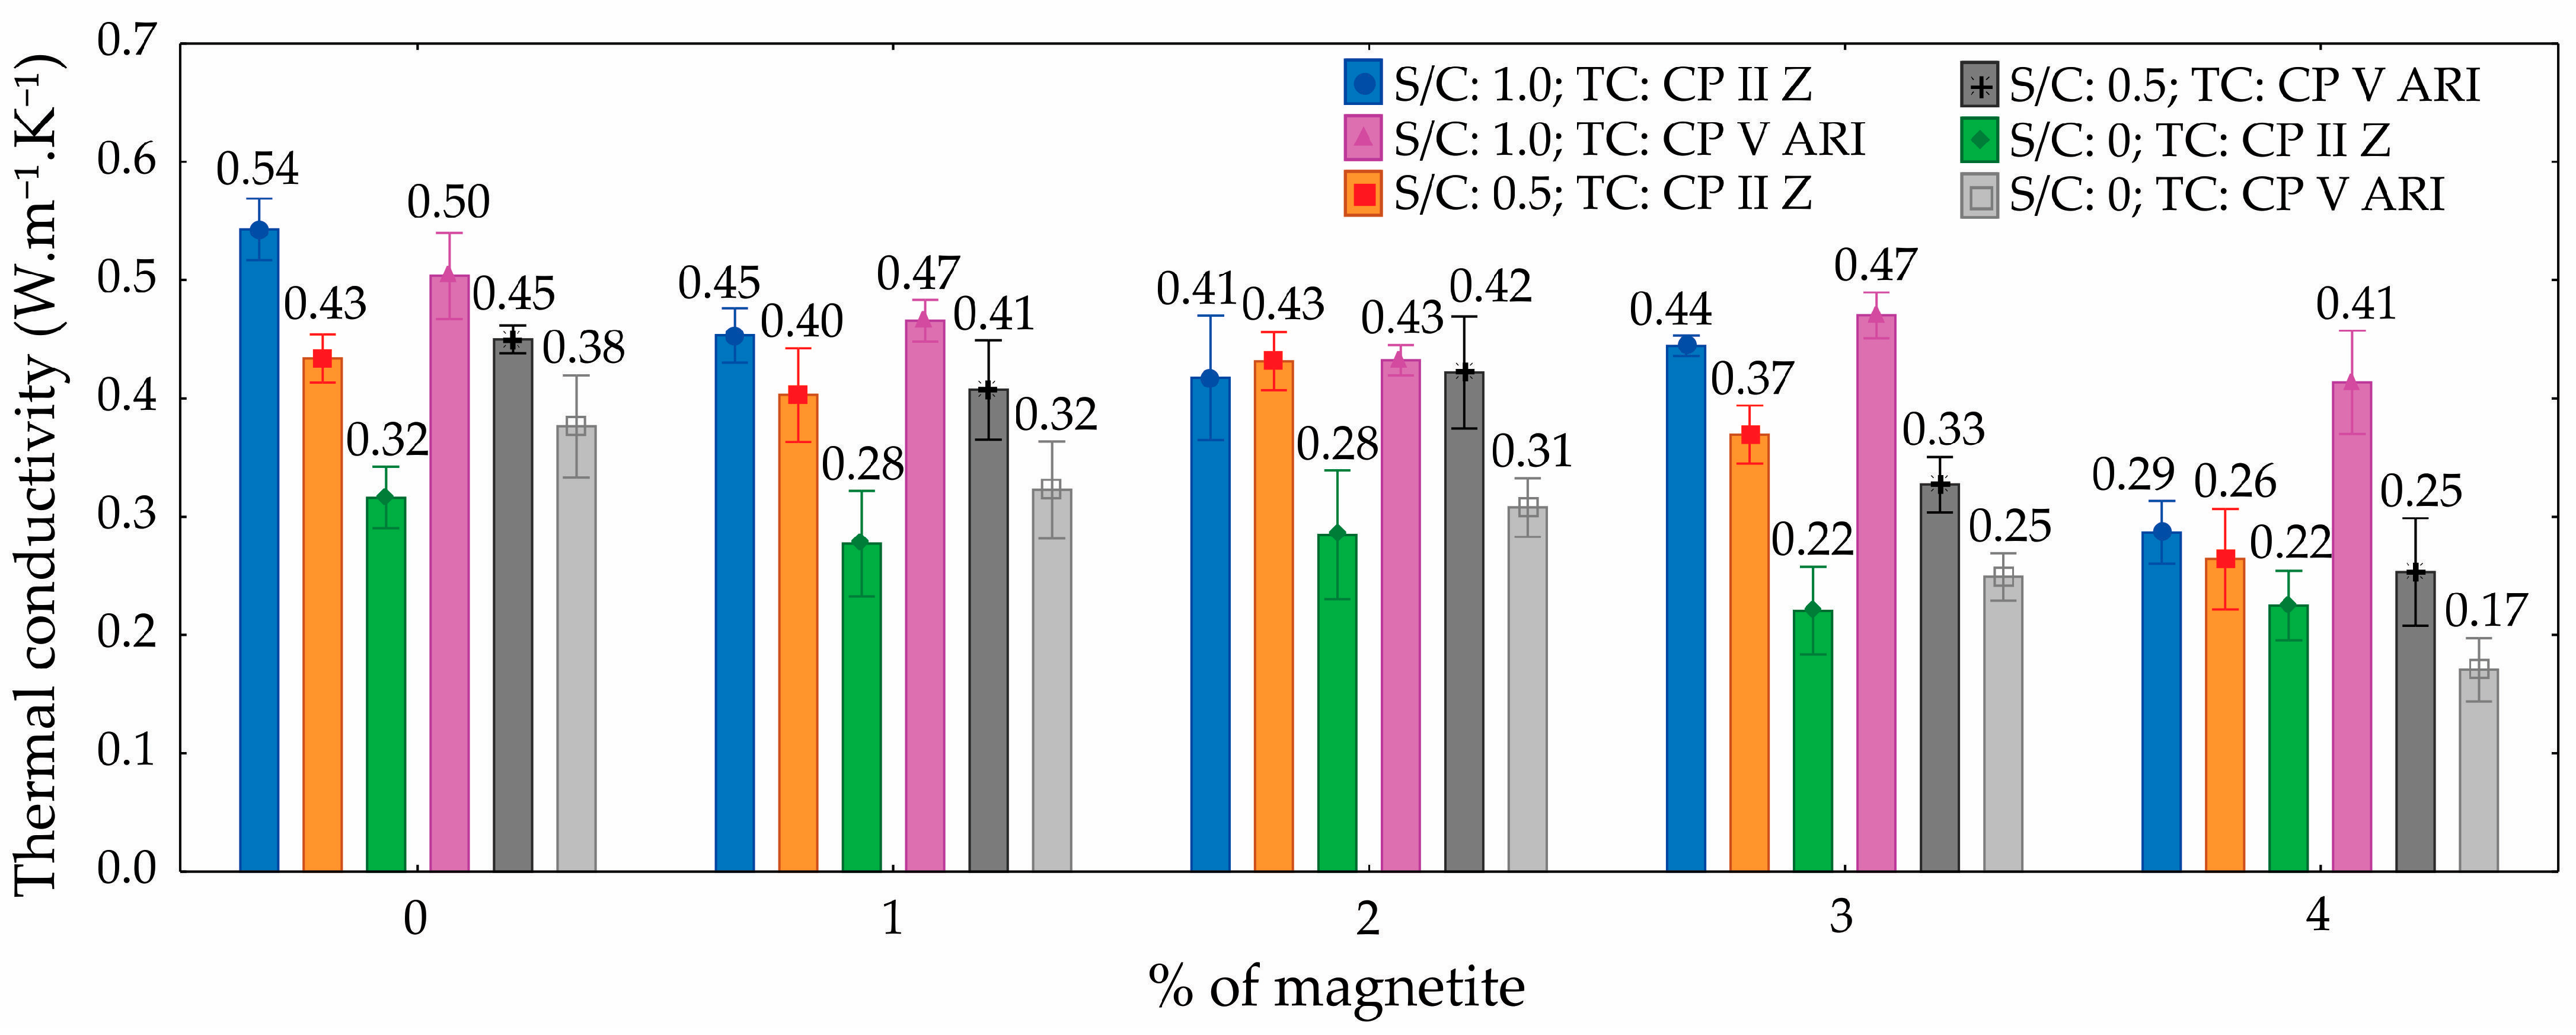
The results indicate that the thermal conductivity of foamed mortars varies significantly depending on the magnetite content and the S/C. For the mix (S/C =1.0; TC = CP II Z), the initial thermal conductivity (0% magnetite) was 0.54 W·m−1·K−1, decreasing by approximately 18.5% to 0.44 W·m−1·K−1 at 4% magnetite. In the same mix with CP V ARI cement, the conductivity dropped by about 24%, from 0.50 W·m−1·K−1 to 0.38 W·m−1·K−1 at 4% magnetite.
In mixes with lower sand proportions (S/C 0.5 and S/C 0), the reductions in thermal conductivity were even more pronounced. For instance, in the S/C 0 mix with CP II Z, the initial conductivity of 0.43 W·m−1·K−1 decreased to 0.22 W·m−1·K−1, representing a reduction of approximately 49%. Overall, specimens with lower sand content exhibited the most substantial reductions in thermal conductivity as the magnetite content increased.
Figure 14 presents the thermal conductivity graph as a function of magnetite percentage, considering different cement types and sand proportions.
The differences in thermal conductivity among the specimens can be primarily attributed to the number of pores in the foamed mortar. The addition of magnetite, particularly in conjunction with lower sand proportions, increased the porosity of the mortar matrix. As the magnetite concentration increased and the sand content decreased, the mortar structure became more porous, leading to a reduction in material density and, consequently, its heat conduction capability. This occurs because the pores act as barriers to heat transfer, creating thermal insulation zones within the mortar matrix. Consequently, mixes with the lowest sand content and highest magnetite levels exhibited the lowest thermal conductivity values, owing to their more porous and less dense structure.
4. Conclusions
This study confirmed the technical feasibility of using magnetite derived from AMD as a foam-stabilizing agent in foamed mortar. The incorporation of magnetite significantly influenced porosity, density, mechanical strength, and thermal conductivity by stabilizing the foam structure.
The optimum performance was achieved with 1% magnetite at S/C = 0.5, which resulted in a compressive strength of 7.3 MPa and a thermal conductivity of 0.27 W·m−1·K−1, balancing mechanical and insulating properties. Porosity ranged from 31.8% to 75.6%, depending on the S/C ratio and cement type, with higher magnetite contents increasing porosity but reducing strength.
Despite these promising results, a key limitation of the study is the absence of durability assessments, such as long-term exposure to moisture, freeze–thaw cycles, or leaching. These are essential for validating the material’s performance in real-world applications.
Future work should include durability testing, such as leaching analyses by ASTM C1308 standard [
45] and freeze–thaw cycling, and efforts to scale up the foam injection process for industrial application. These steps are fundamental for translating the material’s laboratory performance into practical, sustainable solutions for construction.


 ,
, 

