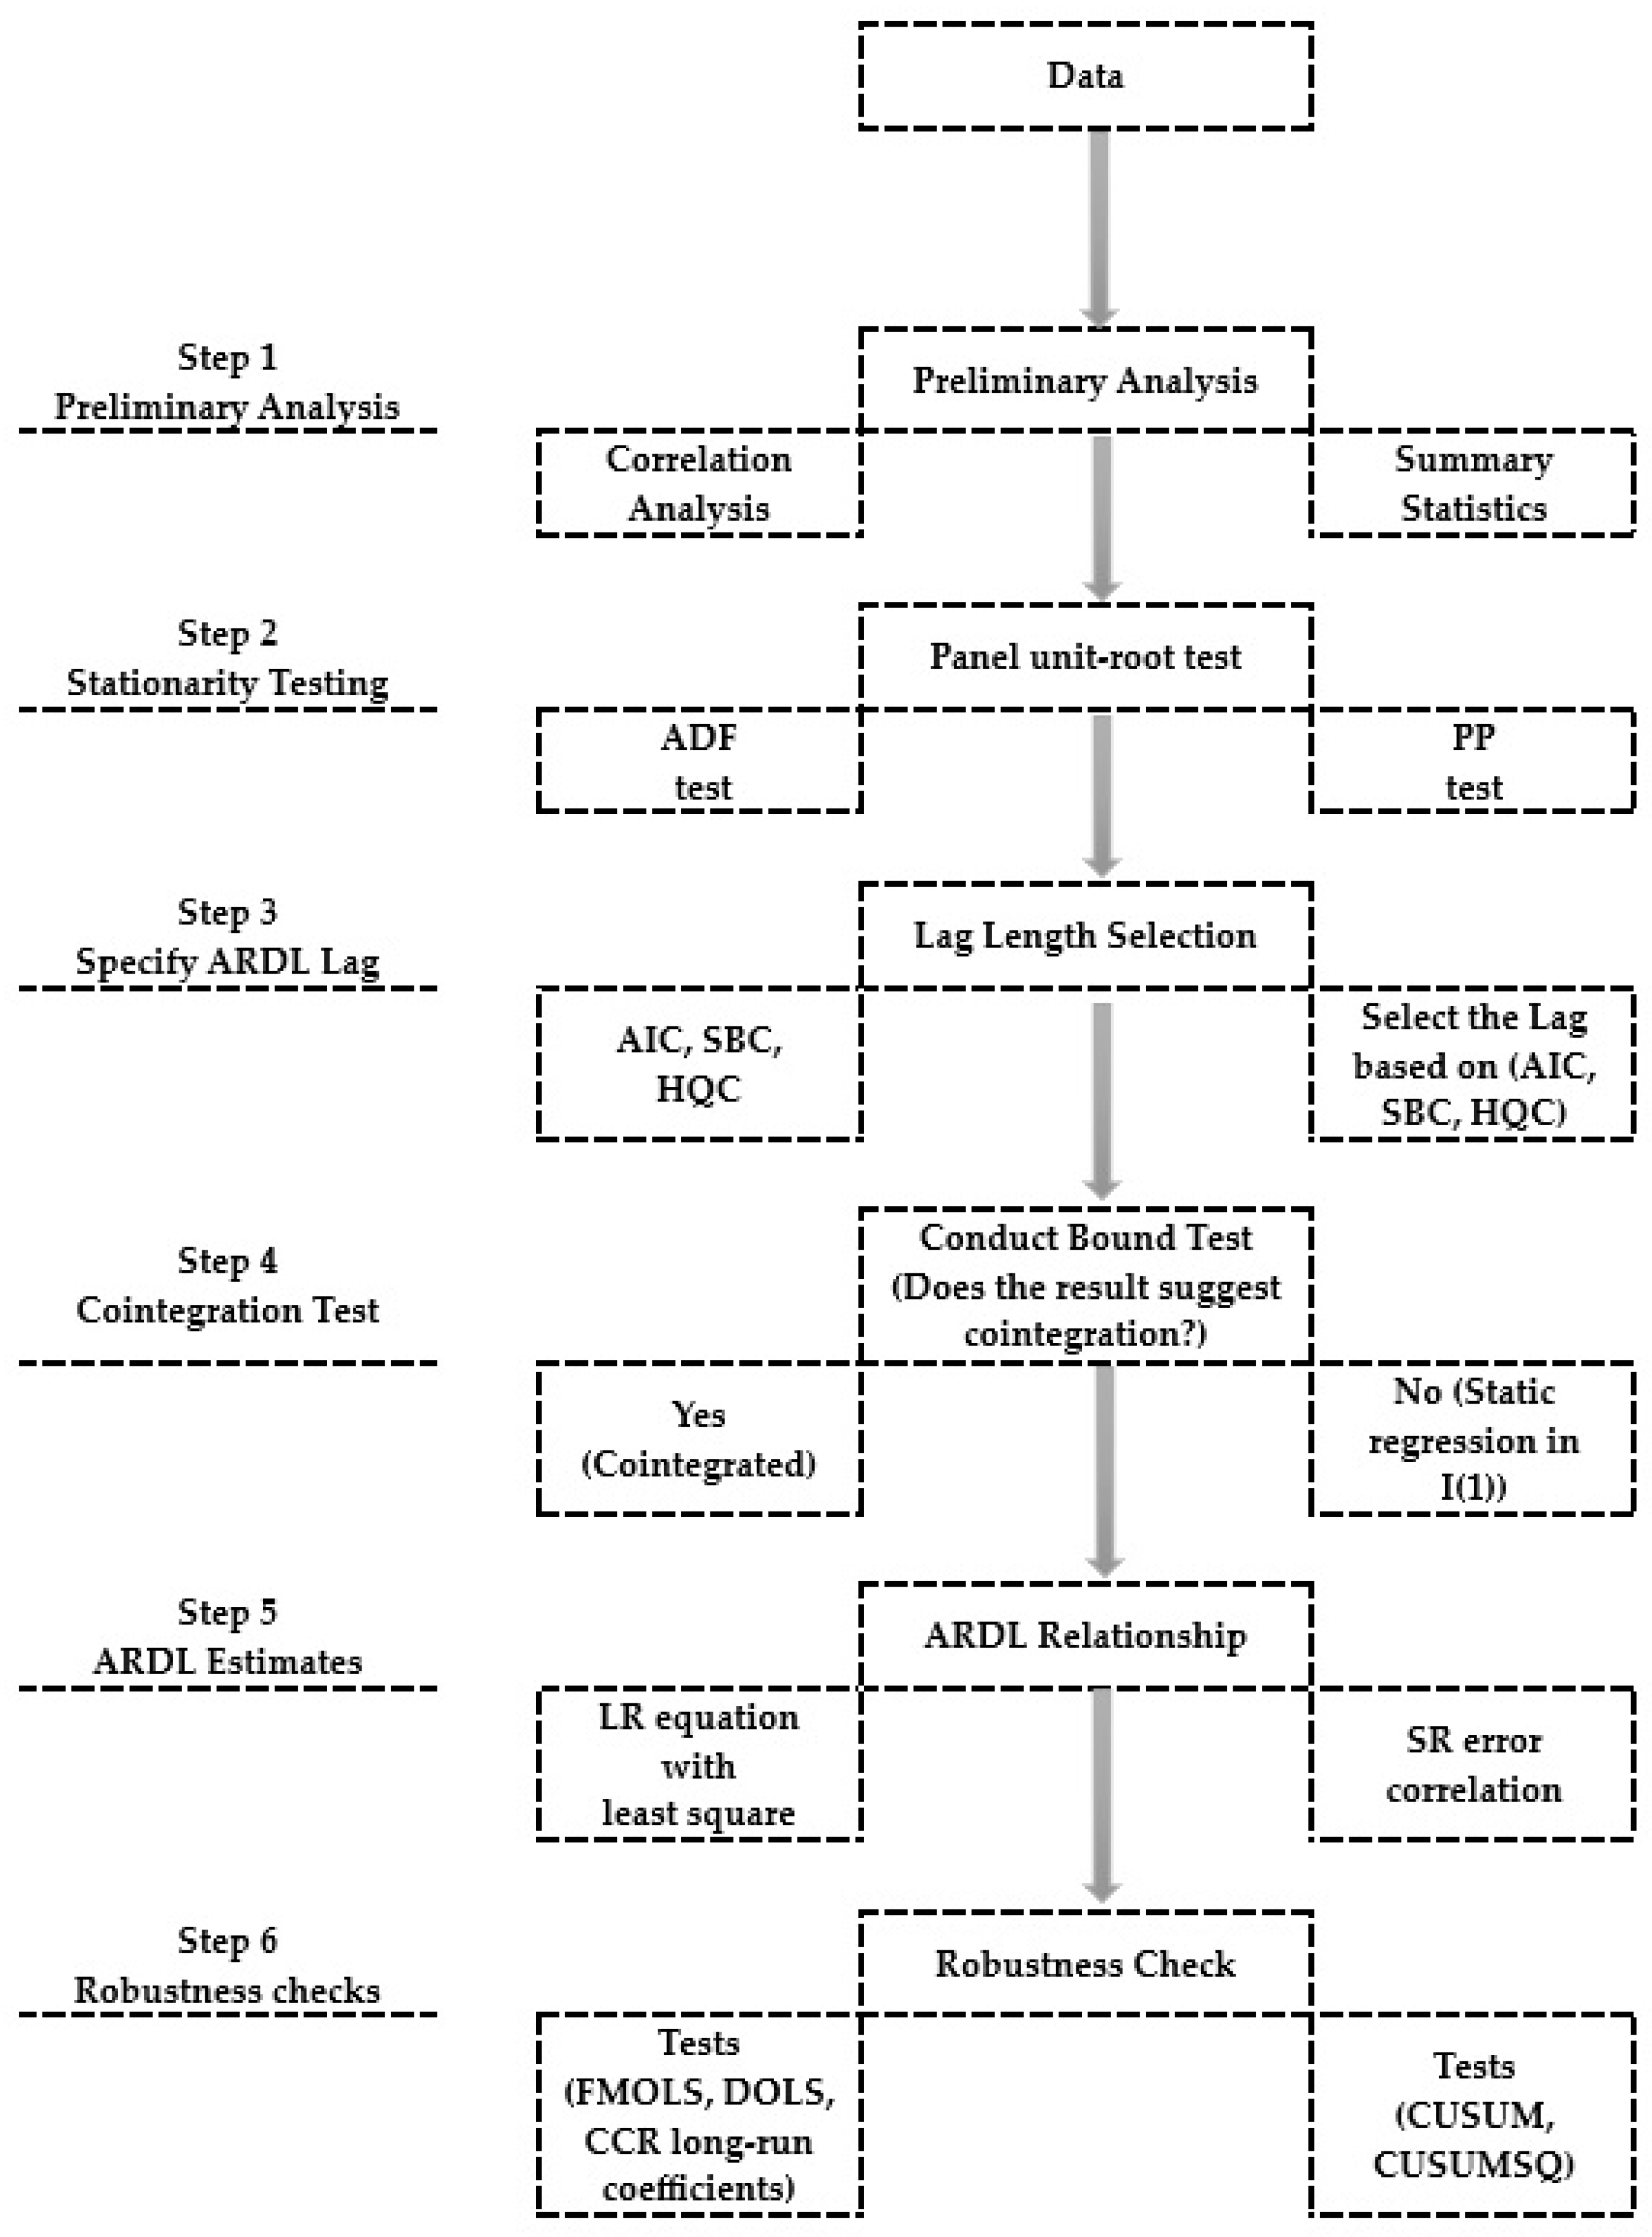
Article

Environmental Degradation, Renewable Energy, and Non-Renewable Energy Consumption in Saudi Arabia: An ARDL Bound Testing Approach

1
Department of Finance and Insurance, College of Business, University of Jeddah, Jeddah 21589, Saudi Arabia
2
Department of Biological Sciences, College of Science, University of Jeddah, Jeddah 21589, Saudi Arabia
3
Department of Management Information Systems, College of Business, University of Jeddah, Jeddah 21589, Saudi Arabia
*
Author to whom correspondence should be addressed.
Sustainability 2025, 17(11), 4970; https://doi.org/10.3390/su17114970
Submission received: 24 March 2025 / Revised: 28 April 2025 / Accepted: 19 May 2025 / Published: 28 May 2025

Abstract

:
Saudi Arabia’s Vision 2030 is closely tied to CO2 emissions and energy consumption issues. This initiative aims to modernize the country’s economy, diversify its energy sources, and enhance sustainability. This paper examines the relationships among CO2 emissions, Renewable Energy Consumption (REC), and Non-Renewable Energy Consumption (NREC) in Saudi Arabia, from 1990 to 2019. To assess the stationarity of the panel time-series data, the Augmented Dickey–Fuller (ADF) and Phillips–Perron (PP) tests were initially used. Given that the data exhibited a mixed order of integration, the Autoregressive Distributed Lag (ARDL) framework was employed. Three different lag selection criteria were applied for cointegration, using CO2 emissions as the dependent variable. Additionally, the direction and significance of causality were analyzed within the ARDL framework. Robust tests were conducted to evaluate the generalizability of the study’s findings. We demonstrated a significant long-term relationship between climate change and both REC and NREC in Saudi Arabia. The findings indicate that in the long run, a 1% increase in REC leads to a 0.21% decrease in CO2 emissions. Furthermore, a 1% increase in NREC corresponds to a substantial 53.4% reduction in CO2 emissions. Finally, policy recommendations were proposed in alignment with Saudi Arabia’s Vision 2030.

1. Introduction

Energy is a crucial factor that significantly impacts economic growth, development, social welfare, and the environment. In today’s industrialized societies, there is an increasing demand for energy in various sectors such as industry, commerce, agriculture, services, housing, and transportation [1].
In Saudi Arabia, the demand for energy to power air conditioning systems is expected to increase significantly due to the heightened risk of heat waves. Global warming is significantly disrupting the flow and temperature of rivers and coastal seas, posing a serious threat to the cooling systems of both thermal and nuclear power plants. Additionally, alterations in the water cycle—including shifts in precipitation patterns and glacier melting—will undoubtedly reduce hydroelectric power generation. Immediate action is necessary to address these challenges [2].
Saudi Arabia’s economy worryingly relies on its oil and petrochemical industries, which account for 87% of government revenues and 90% of export earnings. Though natural gas production has increased, oil remains the country’s primary energy source. Nonetheless, renewable biomass has the potential to serve as an alternative energy source. Renewable energy sources are vulnerable to climate change, which makes the energy system susceptible. The energy sector contributes significantly to global CO2 emissions [3].
This article analyses the linkage between climate change and energy in Saudi Arabia, examining both short-term and long-term effects to determine how climate change impacts renewable and non-renewable energy sources. In other words, it explores whether there is a short-term and long-term correlation between environment and energy.
The remainder of this paper is organized as follows. Section 2 provides a comprehensive literature review of studies on CO2 emissions and their impact on climate change. Section 3 and Section 4 outline the data and the econometric framework utilized in this analysis. Section 5 analyses the data and presents the estimation results. Section 6 discusses the econometric findings. The final section summarizes the paper’s findings and offers policy recommendations in light of Saudi Vision 2030.

2. Literature Review

The literature review is systematically classified according to the associations among the three primary variables of interest in this study: carbon dioxide emissions, renewable energy, and non-renewable energy. More importantly, at the end of this Section, we present a succinct summary of existing research examining the connections between these variables, with a particular emphasis on studies conducted in Saudi Arabia (Table 1).

2.1. The Nexus Between Carbon Dioxide Emissions and Non-Renewable Energy Consumption

Several studies have examined the causal link between non-renewable energy consumption (NREC) and carbon dioxide (CO2) emissions. In their long-term analysis, Karaaslan and Çamkaya (2022) found that GDP and NREC positively correlate with CO2 emissions [21]. They also indicated that renewable energy consumption (REC) adversely correlates with CO2 emissions. In their short-term findings, only GDP and REC exhibited a positive correlation with CO2 emissions. The authors determined that GDP, REC, and NREC have a direct and unidirectional influence on CO2 emissions. This derivative highlights the critical role that economic activity and resource consumption play in driving environmental impact. They advise policymakers to take decisive action to promote economic growth by harnessing renewable energy sources such as solar, wind, and hydropower. They must also prioritize substantial investments in renewable energy projects to combat environmental degradation effectively.
Similarly, Ali et al. (2022) studied the influence of energy sources (REC and NREC) on CO2 emissions in China. Utilizing a dynamic ARDL model from 1990 to 2020, the authors examined the relationship between these variables. They discovered that renewable energy consumption tends to increase carbon dioxide intensity by 0.27%, non-renewable energy consumption by 0.75%, and research and development expenditure by 0.21% in the long run. Meanwhile, the urban population reduces CO2 intensity by 2.31%. In the short run, the signs of these effects change; for instance, the urban population’s effect on CO2 intensity becomes positive at 12.17%, and technological innovation positively affects CO2 intensity at 0.23%. The authors recommend that policymakers invest in renewable energy sources and clean energy technologies, enhance energy efficiency measures, promote forest restoration and carbon neutrality initiatives, and focus on technological innovation to mitigate environmental pressures [22].
The shift to sustainable energy consumption is achievable, despite the high costs and challenges of replacing non-renewable energy sources with renewable ones, as examined by Opeyemi (2021). Using a Translog cost function and seemingly unrelated regression (SUR) estimation techniques, the author investigates the contemporaneous cross-error correlation among renewable energy, non-renewable energy, energy prices, and consumption levels. The findings of this study reveal significant potential for substituting non-renewable energy with renewable energy in Nigeria. Additionally, elasticities of substitution between renewable and non-renewable energy are positive, implying that renewable energy becomes more appealing as the harm of non-renewable energy increases. Following the study, the author proposes a strategy to assist policymakers in Nigeria with the transition to renewable energy, which is fundamental for sustainable development, lowering dependence on fossil fuels, and mitigating environmental impacts [23].
More recently, Rai et al. (2025) investigated the link between energy consumption and carbon dioxide emissions in developing and developed nations. The authors analyzed factors such as renewable and non-renewable energy consumption, CO2 emissions, GDP, urbanization, education, and globalization, drawing from literature spanning from 1970 to 2022, focusing on the period from 2016 to 2022. Using panel data analysis and cointegration tests, the study reveals that a 1% increase in renewable energy consumption is associated with a 0.193% decrease in CO2 emissions in developing Asian economies. In contrast, higher utilization of non-renewable energy sources correlates with increased CO2 emissions. Regarding the control variables, the study found that GDP tends to increase CO2 emissions, although this relationship varies significantly across different countries. The authors noted that urbanization and primary education levels are positively linked to carbon emissions, while secondary education contributes to reduced emissions. The study also highlights a complex association between globalization and carbon dioxide emissions. Globalization can lead to increased emissions due to heightened industrial activity and trade. In conclusion, the authors provide recommendations for governments, suggesting that they promote the adoption of renewable energy and implement policies that encourage energy efficiency to mitigate carbon emissions [24].
The studies cited highlight that enhancing renewable energy sources presents a crucial opportunity to tackle environmental degradation effectively [25]. While it is essential to recognize that climatic conditions influence renewable energy systems, this sensitivity can be leveraged to strengthen the energy sector. By proactively addressing these vulnerabilities, we can significantly reduce the energy sector’s considerable contribution to climate change, which was responsible for approximately two-thirds of global CO2 emissions in 2018 [26,27].

2.2. The Nexus Between Carbon Dioxide Emissions and Renewable Energy Consumption

Renewable energy sources have been proposed as alternatives to non-renewable energy sources. Therefore, renewable energy sources are as important as other environmental factors, such as solar thermal and photovoltaic energy, wind, tidal, and river power. Several researchers propose that renewable energy plays a vital role in reducing carbon dioxide emissions [28]. In this perspective, while renewable energy sources illuminate the path to a sustainable future and aid in combating climate change, they remain vulnerable, facing the adverse impacts of their own development. Despite stringent alleviation policies, some of these negative influences on renewable energy will be inevitable.
According to various authors [29,30], the rate of carbon dioxide (CO2) emissions is a key factor in greenhouse gas (GHG) emissions and their subsequent impacts on environmental and global sustainability. As human demand for resources and consumption patterns increases, carbon dioxide emissions rise, worsening climate change. This makes societies more vulnerable and underscores the urgent need to address the depletion of the Earth’s ecological resources, which are vital for biodiversity and the planet’s well-being [31,32].
The intricate relationship among energy consumption, GDP, and carbon dioxide emissions in the G7 nations was thoroughly explored. The study explored how the energy demands of these industrialized countries relate to their economic growth and environmental impact [33]. They focus on assessing cointegration and causality among GDP, CO2 emissions, and clean energy using the Bootstrap ARDL method. The authors found no integration in Canada, France, Italy, the US, and the UK. However, they found integration in Japan when CO2 emissions were considered the dependent variable. More importantly, energy sources were found to increase GDP in Canada, Germany, and the United States. In Germany, CO2 emissions were found to trigger energy sources, creating a feedback loop between the two. The US has a unidirectional causality from clean energy sources to carbon dioxide emissions. Considering these findings, the authors recommend that G7 countries develop efficient energy-use strategies to reduce CO2 emissions and implement policies promoting clean energy consumption to achieve sustainable GDP and ecological protection.
Yang et al. (2021) investigated the association between 25 manufacturing subsectors across 38 countries and CO2 emissions, highlighting the influence of renewable energy consumption from 2000 to 2014. Employing a Finite Mixture Model (FMM), their findings indicated that growth in manufacturing significantly contributes to increased CO2 emissions. The research revealed that manufacturing subsectors are primarily reliant on natural gas, electricity, and heat produce minimal CO2 emissions compared to those dependent on carbon-based fossil fuels. Additionally, the positive correlation between manufacturing growth and CO2 emissions diminishes as the proportion of renewable energy consumption rises. As renewable energy use expands, nearly half of the countries studied, and two-thirds of the subsectors, experienced a shift in the connection between manufacturing growth and carbon dioxide emissions. The authors emphasize the importance of developing renewable energy policies tailored to specific manufacturing subsectors based on these insights. They highlight that transitioning toward renewable energy is crucial for mitigating the environmental impact associated with manufacturing growth [34]. This finding is backed by Bilgili et al. (2016), who analyzed panel data from 17 OECD countries between 1977 and 2010 [35].
Significant progress has been made in Saudi Arabia through various studies examining the interconnection between energy consumption and carbon dioxide emissions. Nevertheless, unravelling the intricate web of factors behind environmental degradation, particularly how they intertwine with economic growth and urbanization, remains an open question. Take, for instance, Saudi Arabia, where the energy sector not only dominates the economic landscape but also serves as the lifeblood of the nation. In 2017, a staggering 87% of government revenues flowed from this sector, while a remarkable 90% of export earnings were derived from the vibrant oil and petrochemical industry. This underscores the remarkable dependence on these natural resources amidst the ongoing environmental concerns [36].
Saudi Arabia’s energy landscape is primarily driven by oil, which accounts for 87.5% of production, and natural gas, which contributes a growing 12.5%. Notably, natural gas has surged from a mere 5.3% in 1990 to a noteworthy 12.5% by 2019, highlighting the nation’s strategic shift. Over the past twenty years, total energy production has skyrocketed by an impressive 74%, with oil production increasing by 60% and natural gas production soaring by 311%. Therefore, understanding the complex relationships among these energy sources is crucial for achieving the ambitious goals outlined in Saudi Vision 2030, as the kingdom directs its resources toward a sustainable and diverse future [37].
Numerous studies have highlighted the complex association between energy consumption and carbon dioxide emissions within Saudi Arabia’s unique economic landscape. Research conducted with the Autoregressive Distributed Lag (ARDL) model reveals that while Saudi Arabia has successfully reduced CO2 emissions, the slow transition to renewable energy is hindering further reductions. Furthermore, industrial expansion continues to increase emissions, underscoring the urgent need for additional investment in clean technologies [4].
Table 1 outlines several studies conducted in Saudi Arabia that have investigated the connection between carbon dioxide emissions and energy consumption. These studies employed various methodologies, including panel methods, cointegration analysis, time-series analysis, causality tests, and the ARDL model. For each study listed in Table 1, we present the author(s), the variables analyzed, the study period, the methodologies employed, and the key findings.
This study aims to analyze the impact of climate change on renewable and non-renewable Energy in Saudi Arabia. Is there a short- and long-term relationship between climate change and energy? In other words, we aim to gain a deeper understanding of the challenges and opportunities Saudi Arabia faces in transitioning toward sustainable and resilient energy systems. To attain this objective, we utilize the ARDL bound testing approach.

3. Materials and Methods

3.1. Data Description and Summary Statistics

The data on carbon dioxide and energy sources for the period 1990–2019 in this research are obtained from three different data sources (cf. Table 2). The study provides a comprehensive analysis of annual data, focusing on key environmental metrics for Saudi Arabia. Specifically, it examines CO2 emissions per capita, expressed in tons, alongside the share of renewable energy as a proportion of total final energy, and the non-renewable energy ratio as a portion of total electricity production. These essential metrics are illustrated in Table 2.
The statistical properties of these variables are detailed further in Table 3, which describes the underlying patterns and trends present within the data. This analysis accurately calculates skewness and kurtosis metrics using the third and fourth central moments. Skewness provides insight into the asymmetrical distribution, while kurtosis sheds light on the sharpness of its peak. Notably, the results of the Jarque–Bera test [38] exhibit insufficient evidence to reject the null hypothesis, which posits that these variables conform to a normal distribution. This implies that the data analyzed in this study depict a well-defined normal distribution, offering valuable insights into the energy landscape of Saudi Arabia.

3.2. Model Presentation

Previous analyses assessing the effect of energy consumption on CO2 emissions are based on the IPAT model, which stands for Impact, Population (P), Affluence (A), and Technology (T) [39]. Specifically, the IPAT model represents the impact on environmental degradation (I), influenced by population (P), affluence (A), and technology (T). The standard formulation of this model is expressed as follows:
I = f ( P , A , T )
Building on the work of Naqvi and Rehm (2014), we connect CO2 emissions to their environmental impact (I), as they constitute the most significant part of environmental degradation. Furthermore, energy is related to the independent variables in our analysis. As a result, the model presented in Equation (1) can be enlarged into Equation (2), and the CO2 function can be expressed as follows:
l n C O 2 t = α 0 + β 1 l n R E C t + β 2 l n N R E C t + ν t
where C O 2 represents C O 2 emissions, R E C stands for renewable energy consumption, N R E C represents non-renewable energy consumption, and ν is the error term of the white noise. It is worth noting that all variables are in logarithmic form, as we assume that CO2 and energy consumption typically exhibit a multiplicative or exponential relationship rather than a linear one. Therefore, applying logarithms helps to linearize this relationship.

3.2.1. Panel Unit Root Tests

In regression modelling, it is widely recognized that the majority of econometric time series are non-stationary. Consequently, panel unit root tests are performed on all selected variables to prevent spurious regression in the data. Thus, to effectively apply the Autoregressive Distributed Lag (ARDL) approach, we begin by checking if the variables are stationary using the Augmented Dickey–Fuller (ADF) and Phillips–Perron (PP) tests. These tests help us ascertain the order of integration for each variable. The null hypothesis indicates the presence of unit roots, implying the existence of stationarity in the time series. Conversely, the alternative hypothesis posits that a unit root is absent, indicating stationarity. Both hypotheses are comparable in the tests conducted. Additionally, unit root tests are employed to determine the order of integration I(k) of the time series, where k represents the number of operations required to achieve stationarity.

3.2.2. Cointegration Analysis

The ARDL cointegration method, initially introduced by [40] and later expanded by [32], offers unique advantages over other cointegration techniques. Unlike many methods, the ARDL approach does not necessitate that all variables have the same level of integration. It is applicable even when variables are I(0) or I(1). We select this approach for three principal reasons: Firstly, it efficiently captures both short-term and long-term relationships among variables with different integration orders, provided they are stationary, with integration orders of I(0) or I(1). Secondly, the ARDL technique resolves issues related to omitted and autocorrelated variables. Lastly, it is especially beneficial for smaller dataset samples. It is worth noting that ARDL cannot handle integrated variables of order I(2) or greater. The methodological procedure of the ARDL estimation approach is displayed in Figure 1.
The ARDL cointegration method was employed to investigate the linkage between carbon dioxide emissions, treated as the dependent variable, and energy consumption, which encompasses both renewable and non-renewable sources and is regarded as the independent variable. This method was selected for its significant advantages, as discussed earlier. The ARDL bounds testing method enables the estimation of both short-term dynamics and long-term relationships within a unified model framework [41,42,43]. Regarding the time-series CO2t, the specific ARDL model featuring two independent variables, REC and NREC, is defined by the parameters (p, q1, q2) as presented in the equation below:
C O 2 t = θ + i = 1 p α i ln C O 2 t - i + j = 0 q 1 β j ln R E C t - j + k = 0 q 2 γ k ln N R E C t - k + ε t
where
  • C O 2 t Dependent variable (CO2 emissions) at a time.
  • θ : Constant/intercept.
  • α i Coefficients of lagged CO2.
  • β j : Coefficients for lags REC.
  • γ k : Coefficients for lags NREC.
  • R E C t j , N R E C t k : lagged values of the two independent variables.
  • ε t : error term.
  • p , q 1 , q 2 : lag lengths chosen for CO2, REC, and NREC, respectively.
We differentiate the first-order Equation (4) within the error correction model (ECM) framework to examine the short-run dynamics. To account for the long-run relationship, we include lagged-level terms. Thus, starting with the ARDL (p, q1, q2) model, the short-run relationship in error correction models can be expressed as follows:
Δ ln C O 2 t = θ + λ C O 2 t 1 μ 1 ln R E C t - 1 μ 2 ln N R E C t - 1 + i = 1 p 1 φ i Δ ln C O 2 t - i + j = 0 q 1 1 δ j Δ ln R E C t - j + k = 0 q 2 1 η k Δ ln N R E C t - k + ε t
where
  • Δ : denotes the first difference (∆ is the delay operator).
  • C O 2 t 1 μ 1 ln R E C t - 1 μ 2 ln N R E C t - 1 : error correction term representing the long-run balance.
  • λ : adjustment coefficient.
  • φ i , δ j ,   and   η k : short-run dynamic coefficients.
  • ε t : white noise error term.
  • Ln: natural logarithms (the natural logarithm of the data ensures constant variance and highlights the relationships between the variables) of CO2, RENC, and NREC.
The model form in Equation (4) combines both short-run changes in the variables and the long-run relationship through the error correction term. Data were gathered and managed using Microsoft Excel. However, the analysis relied on statistical packages freely available through the open-source statistical system R version 4.5.0 (accessible at http://cran.r-project.org, accessed on 10 January 2025).

4. Results

To investigate the causal relationships among CO2 emissions, REC, and NREC in Saudi Arabia, our initial focus was on assessing the stationarity of the data. This preliminary step is essential because stationarity is a requirement for conducting accurate modelling and regression analyses. In this regard, we utilized two robust statistical techniques: the ADF test and the PP test. These tests are designed to capture the presence of unit roots within the data, which helps determine the level of integration for each variable [44].
The outcomes of the ADF and PP tests are summarized in Table 4. For the variable representing CO2 emissions (lnCO2), both the ADF and PP tests indicated that the null hypothesis could not be rejected at the level of the data, suggesting that lnCO2 is not stationary at this stage. However, when we examined the first difference of lnCO2, we were able to reject the null hypothesis at a significant level of 1%. This result implies that lnCO2 exhibits stationarity at order one, denoted as I(1), meaning it requires first differencing to achieve stationarity.
In contrast, the variable for renewable energy consumption (lnREC) demonstrated a different behavior. The tests showed a definitive rejection of the null hypothesis at the specified level, suggesting that lnREC is stationary at order zero, or I(0), and does not require differencing. This characteristic is significant because it implies that lnREC can be used in analyses without further transformation. Furthermore, we examined the variable for non-renewable energy resources (lnNREC). The ADF and PP tests produced results indicating a weak rejection of the null hypothesis at the level, but a strong rejection at the first difference. Thus, we can conclude that lnNREC also exhibits stationarity at order one, I(1), like lnCO2.
In summary, the results of the ADF and PP tests reveal that CO2 emissions, renewable energy consumption, and non-renewable energy resources exhibit mixed orders of integration, specifically I(1) and I(0). Importantly, none of these variables is of second order, or I(2).
Given these findings, we proceeded with the co-integration testing procedure, which is crucial in examining long-term relationships among non-stationary variables. This step allowed us to calculate and apply the panel Autoregressive Distributed Lag (ARDL) method. The results, confirming that the stationarity tests met the preconditions for ARDL analysis, indicate that it is indeed appropriate to conduct cointegration and relational analyses within the ARDL framework. This approach will enable us to better identify the dynamic exchanges between carbon dioxide emissions, renewable energy consumption, and non-renewable energy resources in the context of Saudi Arabia.
A variety of criteria play a crucial role in pinpointing the optimal number of lags for a model. Prominently featured in this discussion are the Akaike Information Criterion (AIC) and the Schwarz Bayesian Criterion (SBC), as noted by [45]. Among these, AIC often emerges as the favored choice, mainly due to its roots in information theory and its robust approach to addressing some of the concerns associated with the underlying assumptions of SBC. Empirical studies further bolster this preference, revealing that AIC typically outperforms SBC in terms of efficiency. With this compelling evidence in hand, we have decided to rely on AIC to guide us in selecting the most effective number of lags for our model [46].
The maximum number of lags that prevent serial autocorrelation and minimizes the information criteria, with p fixed at two, is shown in Table 5. Applying the Akaike Information Criterion (AIC) and the Schwarz Information Criterion (SIC) resulted in the choice of three lags. Therefore, we will explore ARDL models (p, q, r) that minimize the AIC criterion by appropriately choosing the delays.
To assess if the variables are cointegrated, we must compare the calculated F-statistics with the critical values for I(0) and I(1) shown in Table 6, which is included in the bounds test [4]. If the computed F-statistics exceed the value I(1), we conclude that a long-run relationship exists between the variables. Conversely, if the F-statistic is less than the I(0) value, we find that there is no cointegration. If the computed F-statistic falls between I(0) and I(1), we cannot draw any definitive conclusions.
According to the insightful findings presented in Table 6, a strong long-term relationship intertwines CO2 emissions, REC, and NREC. At the heart of our analysis lies the F-statistics, which yielded a significant value of 6.98163. This value serves as a lens through which we can examine the intricate dynamics and strengths of the relationships between these key variables over an extended timeframe.
To interpret the significance of this F-statistic, we compared it to the critical values established by Pesaran at a 5% significance level. According to the Pesaran critical values table, designed for models that include both an unrestricted intercept and a trend, the lower bound is identified as 2.11, and the upper bound is specified as 3.77. By juxtaposing our calculated F-statistics with these established critical thresholds, we can determine the statistical significance of the long-run relationship. This analysis will yield crucial insights into the connection between CO2 emissions and different energy consumption methods, ultimately deepening our understanding of their impact on environmental dynamics.
This conclusion remains valid when we consider the Pesaran significant values at the 10%, 2.5%, and 1% significance levels because the F-statistic (6.98163) exceeds the upper bounds of 3.35, 4.38, and 5.01, respectively. Therefore, we can confidently state that CO2 emissions are significantly linked to the other variables in this analysis over the long term. Table 6 reports on the long-term cointegration relationship between carbon dioxide and energy sources.
Table 7 illustrates the long-run causality relationships among the variables studied. Firstly, renewable energy consumption (REC) Granger-caused carbon dioxide (CO2) emissions at the 10% significance level (significance = 0.076). This indicates that a 1% increase in renewable energy consumption leads to a 0.21% decrease in CO2 emissions. Secondly, non-renewable energy resources (NREC) also Granger-caused CO2 emissions in Saudi Arabia at a 5% significance level in the long run (p-value = 0.0346). Notably, a 1% increase in non-renewable energy resources resulted in a significant 53.4% decrease in carbon dioxide emissions. These findings suggest that both renewable energy consumption and non-renewable energy resources negatively affect carbon dioxide emissions in Saudi Arabia over the long term during the study period.
Therefore, varying the economy and decreasing reliance on oil revenues— a key goal of Saudi Arabia’s Vision 2030—investing in renewable infrastructure, reducing dependence on fossil fuels, and adopting advanced technologies can significantly lower CO2 emissions in Saudi Arabia while promoting sustainable long-term economic growth. Therefore, to curtail many climate change issues and support the green energy transition in alignment with Vision 2030, efforts should focus on regional collaboration, implementing international best practices, developing human capital, engaging the public, and driving technological innovation (Islam & Ali, 2024). Additionally, despite hydrological and ecological challenges and the water usage footprint, advancing the afforestation initiative launched by Saudi Arabia will contribute to carbon removal and help offset carbon emissions [47].
Furthermore, Saudi Arabia is actively transforming its economy through the Vision 2030 initiative to reduce dependence on oil. However, this transformation requires economic changes and necessitates a set of strategies focused on environmental sustainability. Therefore, to further lower CO2 emissions in KSA, the strategic orientation includes the use of more renewable energy, promoting sustainable transportation options, encouraging factories to capture carbon by offering carbon credits or tax cuts, starting large tree-planting and green projects, providing grants or low-interest loans for eco-friendly home upgrades, invest in research and green technology, cut down on industrial and plastic waste by encouraging recycling, create waste-to-energy plants in cities, establish a national recycling policy with clear goals, look into carbon taxes or emissions trading systems for big polluters, align carbon pricing with the sustainability goals of Gulf countries, work with neighboring countries to create shared renewable energy grids, and collaborate with international climate organizations for support and funding.
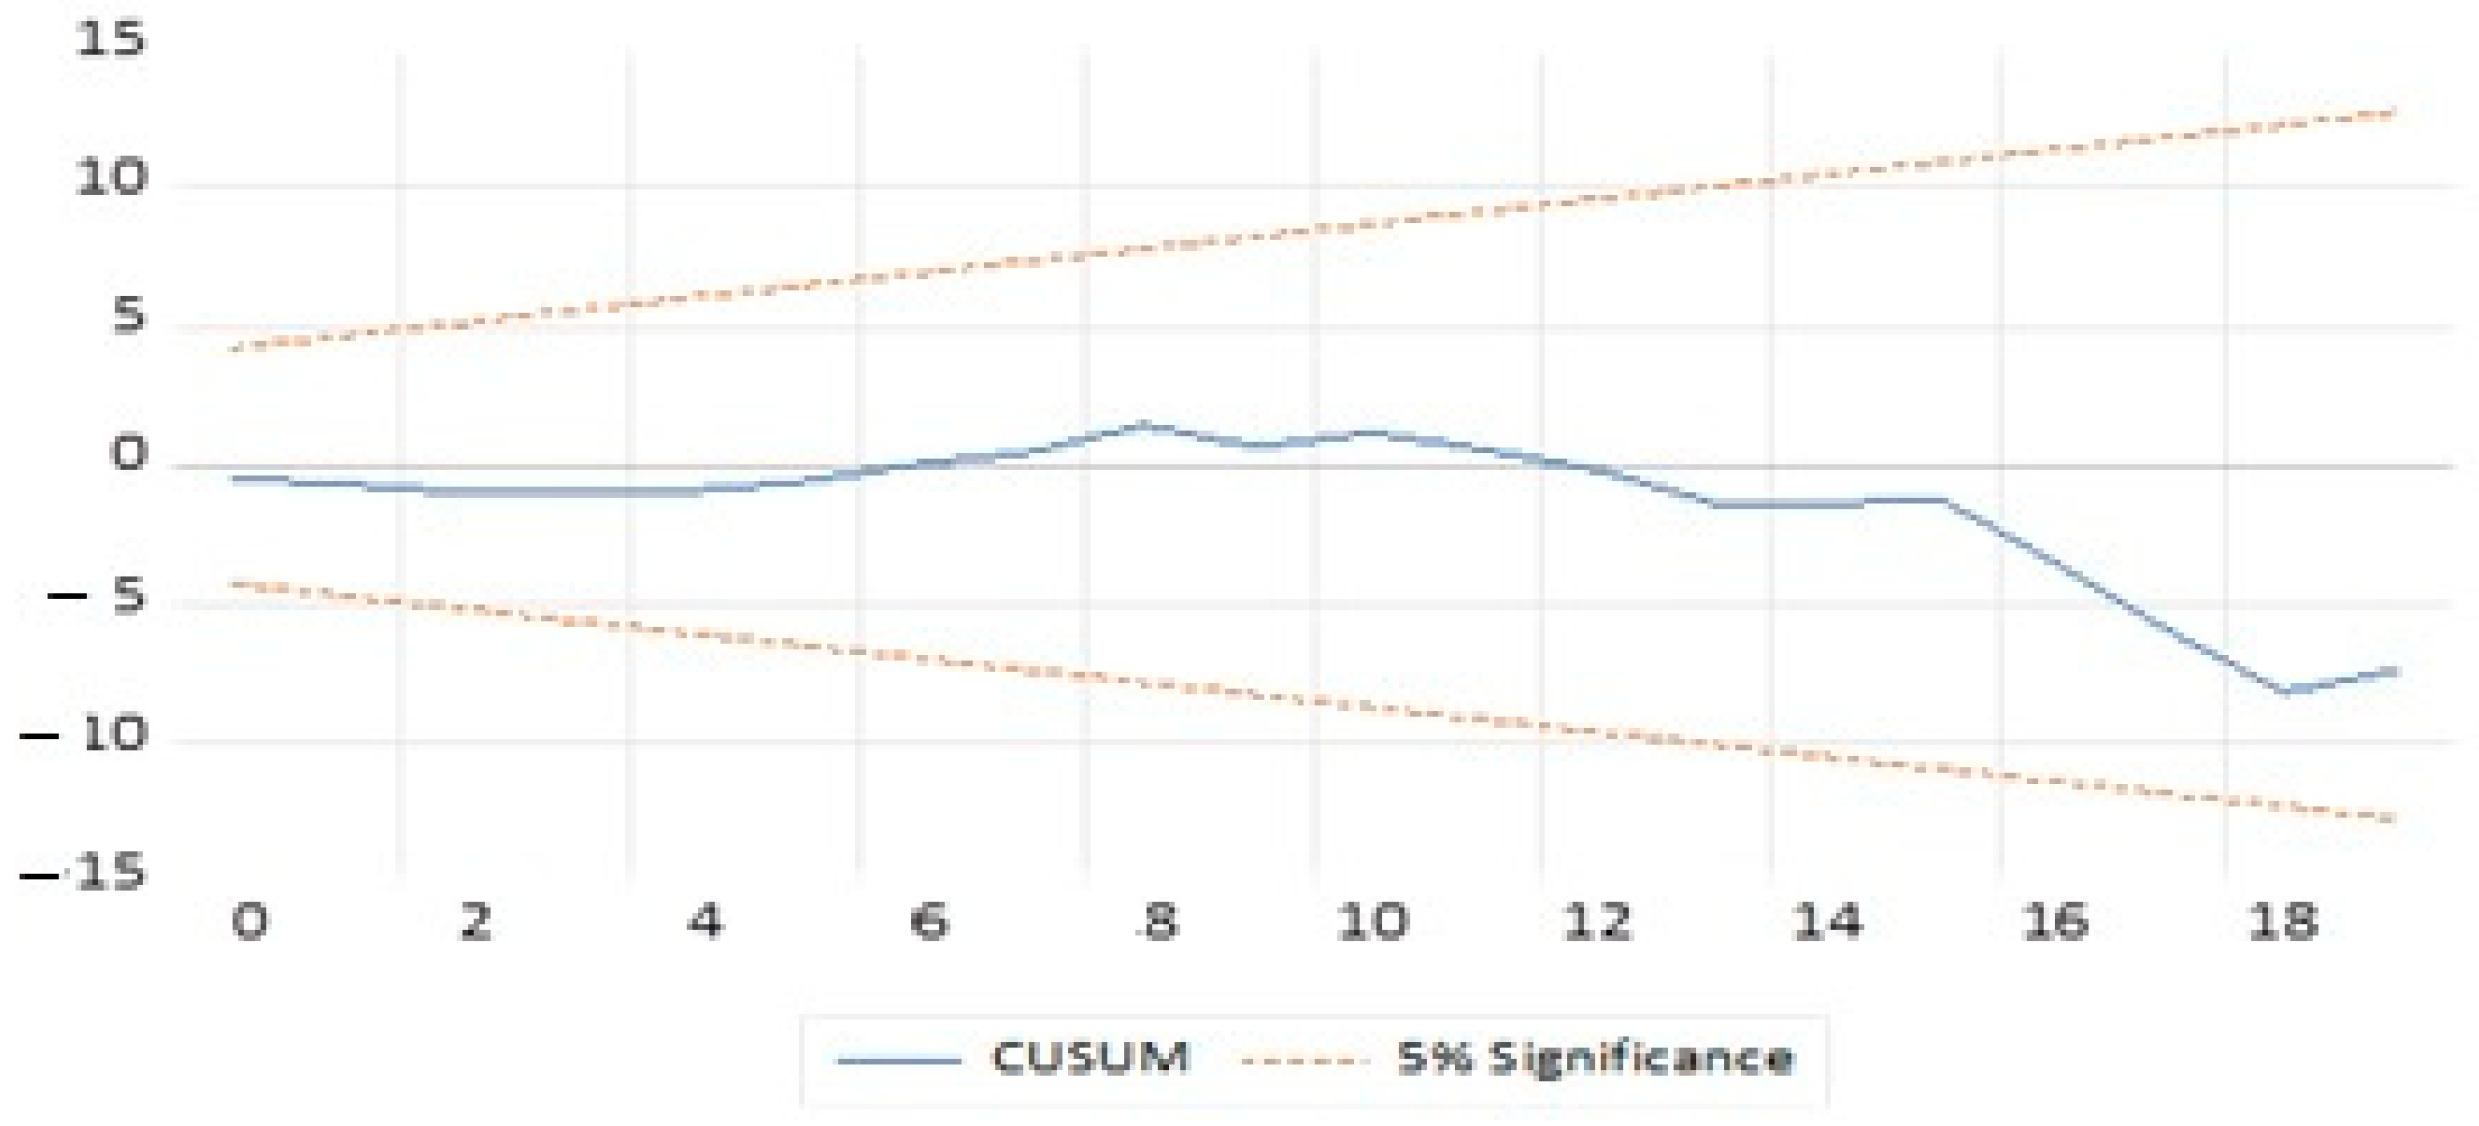
This analysis presents diagnostic tests designed to verify the robustness and stability of the models. Specifically, the Cumulative Sum (CUSUM) and CUSUM square (CUSUMSQ) tests introduced by [48] were employed. The statistic’s value must then be verified under the null hypothesis, which confirms the stability of the relationship curve within a range defined by two straight lines. In the context of time-series analysis, stability tests—also known as structural change tests—evaluate the consistency of the estimated coefficients in the equation. These tests help identify whether there has been a structural change in the relationships being examined. The CUSUM test is specifically applied to assess the stability of long-term relationships between carbon dioxide and energy sources.
Both Figure 2 and Figure 3 vividly illustrate the CUSUM and CUSUM squared graphs of recursive residuals derived from the steadiness tests of the ARDL model. The solid lines in the graphs depict the actual residual values, while the dotted lines form a delicate boundary representing the 95% credible interval. Throughout the observed timeframe, all lines smoothly glide within these critical bounds, indicating that the residuals do not exhibit any noteworthy structural breaks or unexpected deviations from their anticipated behaviour. This consistent stability not only highlights the robustness of the ARDL estimation results previously discussed but also reinforces the model’s credibility and its significant applicability within the research context.
In summary, both the CUSUM and CUSUM squared test curves consistently remain within the 5% confidence interval, demonstrating high stability and reliability of the model. This consistent performance reassures the model’s effectiveness in evaluating the natural relationship among the variables.

5. Discussion

When examining the relationship between carbon dioxide emissions and energy sources, Saudi Arabia is often overlooked as a unique case. Instead, it is commonly grouped with countries in the MENA (Middle East and North Africa), GCC (Gulf Cooperation Council), and G20 categories. As a result, Saudi Arabia represents an area that has not been thoroughly researched, especially compared to countries like China. This is notable given that Saudi Arabia is among the world’s largest power markets and a leading carbon dioxide emitter [49]. Hence, this research presents three significant and innovative contributions. Firstly, it examines Saudi Arabia during its transformative phase aligned with Vision 2030, making it a crucial case for analysis. Second, analyzing individual energy sources rather than just looking at total energy consumption helps identify which fuels contribute most to carbon dioxide emissions, which aids in developing targeted reduction strategies, support effective climate policies, and facilitates the transition to cleaner, low-carbon energy systems. Third, we establish a comprehensive understanding of the carbon dioxide emissions process and provide specific policy recommendations tailored for Saudi Arabia.
This study’s findings suggest that both renewable (the parameter of REC = –0.214583; p = 0.0762 < 0.1) and non-renewable energy (the parameter of NREC = 0.533823; p = 0.0346 < 0.05) sources mitigate carbon dioxide emissions in Saudi Arabia from 1990 to 2010. This conclusion is surprising, as most previous studies have identified non-renewable energy as a significant driver of CO2 emissions. In contrast, our analysis indicates that non-renewable energy has contributed to a slowdown in carbon dioxide emissions. The findings reveal a nuanced picture: while they lend some support to the conclusions drawn by Dogan and Seker (2016) in the European Union regarding renewable energy, but do not support them when it comes to non-renewable energy. This divergence highlights the complexities inherent in the energy landscape, suggesting that different energy sources may behave in distinct ways and for different countries [50]. A probable explanation for these unusual results includes the following points: (1) the ongoing transition in energy production from crude oil to natural gas, (2) the exclusion of other variables that significantly impact climate change and alter carbon dioxide emissions in Saudi Arabia, and (3) the ARDL approach struggles to differentiate between correlation and the actual dynamics between variables due to the model’s oversimplification.

6. Conclusions and Policy Recommendations

This study provides a comprehensive analysis of the impact of both renewable and non-renewable energy sources on climate change in Saudi Arabia. The findings show that both types of energy have a significant adverse effect on climate change. The energy production process releases substantial amounts of greenhouse gases and waste into the atmosphere, posing a threat to the ecosystem. The extent of climate change is assessed through various indicators, including carbon dioxide emissions levels and the country’s average temperature. As energy consumption increases, carbon dioxide emissions also rise, which can expose Saudi Arabia’s adherence to international climate agreements.
The conducted analysis is highly significant as it delivers pertinent results that can inform stakeholders about the harmful effects of climate change. Additionally, policymakers can leverage insights from this research to mitigate the impact of climate change on energy by employing modern technologies, such as carbon footprint calculators and other applications designed to effectively monitor and control carbon emissions. Consequently, the insights gleaned from this study could serve as an invaluable resource for policymakers, industry leaders, and various stakeholders. By harnessing this knowledge, they can craft robust and practical strategies to address and alleviate environmental degradation in Saudi Arabia.
This study has led to insightful policy recommendations based on its findings. The research demonstrates that non-renewable energy sources have consistently reduced CO2 emissions. Given that Saudi Arabia’s economic expansion has historically relied on the oil industry, the nation is seeking to diversify its economy and decrease its reliance on fossil fuels. Consequently, policymakers are urged to invest in renewable energy options, such as the production of green hydrogen, and to enforce effective regulations governing energy management, transportation, and the utilization of technology. This strategy could generate new economic prospects across a diverse array of sectors, including the dynamic realms of manufacturing, the innovative landscape of technology, and the ever-evolving field of services.
Non-renewable energy is crucial for Saudi Arabia’s efforts to diversify its economy, generate jobs, advance technology, and promote sustainability. These initiatives align with the goals of Vision 2030, initiated by Crown Prince Mohammed bin Salman, which aims to embrace renewable energy sources and reduce the Kingdom’s reliance on fossil fuels. We believe that prioritizing renewable energy is vital for sustainable economic growth, resilience, and meeting international climate commitments. By concentrating on renewable energy, Saudi Arabia could position itself as an exporter of clean energy technologies, including solar and wind power systems, to regions such as the Middle East, Asia, and Africa. Furthermore, the Kingdom could supply surplus renewable energy to neighboring countries through regional grids, further enhancing its economic position.
The lack of adequate planning in launching renewable energy projects and the slow pace of technological advancements in Saudi Arabia have led to an unnecessary increase in carbon dioxide emissions across the country. As a result, the Saudi government has prioritized several key areas: combating climate change, protecting the environment, promoting green technologies, and fostering social development and civil society. One way to achieve these goals is by passing new legislation that attracts investment, creates green economy jobs, and provides better protection for the climate. Moreover, Saudi Arabia’s ongoing efforts to reduce energy consumption and increase the utilization of renewable materials should be part of a socially responsible initiative aimed at decreasing greenhouse gas emissions and conserving natural resources.
This study did not address key factors that significantly influence climate change and energy consumption in Saudi Arabia. Therefore, future research and Saudi government policies should consider aspects such as population growth, urbanization, economic development, and technological advancements to effectively adapt to and mitigate climate change. A comprehensive program should focus on the following:
1. Adapting urbanization methods to accommodate a growing population and minimize carbon emissions.
2. Enhancing energy efficiency, expanding renewable energy sources like solar and wind, and developing carbon capture and storage (CCS) technologies.
3. Investing in clean energy and improving energy efficiency to support low-carbon industries and promote sustainable infrastructure in Saudi Arabia.

Author Contributions

Conceptualization, K.B.-A. and S.J.M.; methodology, K.B.-A.; software, K.B.-A.; validation, K.B.-A. and S.J.M.; formal analysis, K.B.-A.; investigation, S.J.M.; resources, T.K.B.; data curation, T.K.B.; writing—original draft preparation, K.B.-A.; writing—review and editing, K.B.-A.; visualization, S.J.M.; supervision, T.K.B.; project administration, K.B.-A. All authors have read and agreed to the published version of the manuscript.

Funding

This research was funded by Deputyship for Research & Innovation, Ministry of Education in Saudi Arabia, grant number Moe-IF-UJ-R2-22-20622-1.

Institutional Review Board Statement

Not applicable.

Informed Consent Statement

Not applicable.

Data Availability Statement

Data will be provided upon request, subject to the consent of all authors.

Acknowledgments

The authors extend their appreciation to the Deputyship for Research & Innovation, Ministry of Education in Saudi Arabia, for funding this research work through project number Moe-IF-UJ-R2-22-20622-1.

Conflicts of Interest

The authors declare that they have no known competing financial interests or personal relationships that could have appeared to influence the work reported in this paper.

References

  1. World Bank. Sustainable Energy for All: The Role of Energy in Development; World Bank: Washington, DC, USA, 2018. [Google Scholar]
  2. Odnoletkova, N.; Patzek, T.W. Data-driven analysis of climate change in Saudi Arabia: Trends in temperature extremes and human comfort indicators. J. Appl. Meteorol. Climatol. 2021, 60, 1055–1070. [Google Scholar] [CrossRef]
  3. Amran, Y.A.; Amran, Y.M.; Alyousef, R.; Alabduljabbar, H. Renewable and sustainable energy production in Saudi Arabia according to Saudi Vision 2030; Status and prospects. J. Clean. Prod. 2020, 247, 119602. [Google Scholar] [CrossRef]
  4. Al-Ismail, F.S.; Alam, M.S.; Shafiullah, M.; Hossain, M.I.; Rahman, S.M. Impacts of renewable energy generation on greenhouse gas emissions in Saudi Arabia: A comprehensive review. Sustainability 2023, 15, 5069. [Google Scholar] [CrossRef]
  5. Alshehry, A.S.; Belloumi, M. Energy consumption, carbon dioxide emissions and economic growth: The case of Saudi Arabia. Renew. Sustain. Energy Rev. 2015, 41, 237–247. [Google Scholar] [CrossRef]
  6. Alkhathlan, K.; Javid, M. Carbon emissions and oil consumption in Saudi Arabia. Renew. Sustain. Energy Rev. 2015, 48, 105–111. [Google Scholar] [CrossRef]
  7. Mezghani, I.; Haddad, H.B. Energy consumption and economic growth: An empirical study of the electricity consumption in Saudi Arabia. Renew. Sustain. Energy Rev. 2017, 75, 145–156. [Google Scholar] [CrossRef]
  8. Khan, U.; Khan, A.M. The impact of energy consumption and economic growth on the Saudi Arabia’s carbon emissions. Int. J. Energy Econ. Policy 2024, 14, 329–335. [Google Scholar] [CrossRef]
  9. Alajmi, R.G. Energy Consumption and Carbon Emissions: An Empirical Study of Saudi Arabia. Sustainability 2024, 16, 5496. [Google Scholar] [CrossRef]
  10. Osman, Y. The Correlation among Industrial Economic Growth, Renewable Energy Provision and CO2 Emissions in Saudi Arabia. WSEAS Trans. Environ. Dev. 2024, 20, 339–349. [Google Scholar] [CrossRef]
  11. Toumi, S.; Toumi, H. Asymmetric causality among renewable energy consumption, CO2 emissions, and economic growth in KSA: Evidence from a non-linear ARDL model. Environ. Sci. Pollut. Res. 2019, 26, 16145–16156. [Google Scholar] [CrossRef]
  12. Alhajji, M.; Demirel, Y. Energy and environmental sustainability assessment of a crude oil refinery by thermodynamic analysis. Int. J. Energy Res. 2015, 39, 1925–1941. [Google Scholar] [CrossRef]
  13. Al-Sharafi, A.; Sahin, A.Z.; Ayar, T.; Yilbas, B.S. Techno-economic analysis and optimization of solar and wind energy systems for power generation and hydrogen production in Saudi Arabia. Renew. Sustain. Energy Rev. 2017, 69, 33–49. [Google Scholar] [CrossRef]
  14. Aljohani, A. Deep learning-based optimization of energy utilization in IoT-enabled smart cities: A pathway to sustainable development. Energy Rep. 2024, 12, 2946–2957. [Google Scholar] [CrossRef]
  15. Bekun, F.V.; Adekunle, A.O.; Gbadebo, A.D.; Alhassan, A.; Akande, J.O.; Yusoff, N.Y.M. Sustainable electricity consumption in South Africa: The impacts of tourism and economic growth. Environ. Sci. Pollut. Res. 2023, 30, 96301–96311. [Google Scholar] [CrossRef] [PubMed]
  16. Almansour, M.; Akrami, M. An Environmental Assessment of Municipal Solid Waste Management Strategies in Riyadh, Saudi Arabia: A Comparative Life Cycle Analysis. Sustainability 2024, 16, 9111. [Google Scholar] [CrossRef]
  17. Alzahrani, A.; Rahman, M.U.; Hafeez, G.; Rukh, G.; Ali, S.; Murawwat, S.; Iftikhar, F.; Haider, S.I.; Khan, M.I.; Abed, A.M. A strategy for multi-objective energy optimization in smart grid considering renewable energy and batteries energy storage system. IEEE Access 2023, 11, 33872–33886. [Google Scholar] [CrossRef]
  18. AlNemer, H.A.; Hkiri, B.; Tissaoui, K. Dynamic impact of renewable and non-renewable energy consumption on CO2 emission and economic growth in Saudi Arabia: Fresh evidence from wavelet coherence analysis. Renew. Energy 2023, 209, 340–356. [Google Scholar] [CrossRef]
  19. Al Shammre, A. Investigating the Impact of Energy Consumption and Economic Activities on CO2 Emissions from Transport in Saudi Arabia. Energies 2024, 17, 4448. [Google Scholar] [CrossRef]
  20. Abid, M.; Gheraia, Z.; Abdelli, H. Does renewable energy consumption affect ecological footprints in Saudi Arabia? A bootstrap causality test. Renew. Energy 2022, 189, 813–821. [Google Scholar] [CrossRef]
  21. Karaaslan, A.; Çamkaya, S. The relationship between CO2 emissions, economic growth, health expenditure, and renewable and non-renewable energy consumption: Empirical evidence from Turkey. Renew. Energy 2022, 190, 457–466. [Google Scholar] [CrossRef]
  22. Ali, U.; Guo, Q.; Kartal, M.T.; Nurgazina, Z.; Khan, Z.A.; Sharif, A. The impact of renewable and non-renewable energy consumption on carbon emission intensity in China: Fresh evidence from novel dynamic ARDL simulations. J. Environ. Manag. 2022, 320, 115782. [Google Scholar] [CrossRef]
  23. Opeyemi, B.M. Path to sustainable energy consumption: The possibility of substituting renewable energy for non-renewable energy. Energy 2021, 228, 120519. [Google Scholar] [CrossRef]
  24. Rai, P.; Gupta, P.; Saini, N.; Tiwari, A.K. Assessing the impact of renewable energy and non-renewable energy use on carbon emissions: Evidence from select developing and developed countries. Environ. Dev. Sustain. 2025, 27, 3059–3080. [Google Scholar] [CrossRef]
  25. Khan, M.U.H. Saudi Arabia’s vision 2030. Def. J. 2016, 19, 36. [Google Scholar]
  26. Al-Gahtani, S.F. Saudi Arabia’s journey toward a renewable future. Energies 2024, 17, 2444. [Google Scholar] [CrossRef]
  27. Olabi, A.G.; Abdelkareem, M.A. Renewable energy and climate change. Renew. Sustain. Energy Rev. 2022, 158, 112111. [Google Scholar] [CrossRef]
  28. Ang, T.Z.; Salem, M.; Kamarol, M.; Das, H.S.; Nazari, M.A.; Prabaharan, N. A comprehensive study of renewable energy sources: Classifications, challenges and suggestions. Energy Strategy Rev. 2022, 43, 100939. [Google Scholar] [CrossRef]
  29. Rudolph, A.; Figge, L. Determinants of Ecological Footprints: What is the role of globalization? Ecol. Indic. 2017, 81, 348–361. [Google Scholar] [CrossRef]
  30. Cowan, W.N.; Chang, T.; Inglesi-Lotz, R.; Gupta, R. The nexus of electricity consumption, economic growth and CO2 emissions in the BRICS countries. Energy Policy 2014, 66, 359–368. [Google Scholar] [CrossRef]
  31. Nathaniel, S.P. Ecological footprint, energy use, trade, and urbanization linkage in Indonesia. GeoJournal 2021, 86, 2057–2070. [Google Scholar] [CrossRef]
  32. Rahman, M.M. Environmental degradation: The role of electricity consumption, economic growth and globalisation. J. Environ. Manag. 2020, 253, 109742. [Google Scholar] [CrossRef] [PubMed]
  33. Cai, Y.; Sam, C.Y.; Chang, T. Nexus between clean energy consumption, economic growth and CO2 emissions. J. Clean. Prod. 2018, 182, 1001–1011. [Google Scholar] [CrossRef]
  34. Yang, M.; Wang, E.Z.; Hou, Y. The relationship between manufacturing growth and CO2 emissions: Does renewable energy consumption matter? Energy 2021, 232, 121032. [Google Scholar] [CrossRef]
  35. Bilgili, F.; Koçak, E.; Bulut, Ü. The dynamic impact of renewable energy consumption on CO2 emissions: A revisited Environmental Kuznets Curve approach. Renew. Sustain. Energy Rev. 2016, 54, 838–845. [Google Scholar] [CrossRef]
  36. International Monetary Fund. Saudi Arabia: 2018 Article IV Consultation—Press Release; Staff Report; and Statement by the Executive Director for Saudi Arabia. IMF Country Report No. 18/263. 2018. Available online: https://www.imf.org/en/Publications/CR/Issues/2018/09/09/Saudi-Arabia-2018-Article-IV-Consultation-Press-Release-Staff-Report-and-Statement-by-the-46210 (accessed on 20 November 2024).
  37. BP. BP Statistical Review of World Energy 2020. 2020. Available online: https://www.bp.com/en/global/corporate/energy-economics/statistical-review-of-world-energy.html (accessed on 25 November 2024).
  38. Jarque, C.M.; Bera, A.K. Efficient tests for normality, homoscedasticity and serial independence of regression residuals. Econ. Lett. 1980, 6, 255–259. [Google Scholar] [CrossRef]
  39. Naqvi, A.A.; Rehm, M. A multi-agent model of a low-income economy: Simulating the distributional effects of natural disasters. J. Econ. Interact. Coord. 2014, 9, 275–309. [Google Scholar] [CrossRef]
  40. Pesaran, M.H.; Shin, Y. An autoregressive distributed lag modelling approach to cointegration analysis. In Centennial Volume of Rangar Frisch; Strom, S., Holly, A., Diamond, P., Eds.; Cambridge University Press: Cambridge, UK, 1999. [Google Scholar]
  41. Pesaran, M.H.; Shin, Y.; Smith, R.J. Bounds testing approaches the analysis of level relationships. J. Appl. Econom. 2001, 16, 289–326. [Google Scholar] [CrossRef]
  42. Engle, R.F.; Granger, C.W.J. Co-Integration and Error Correction: Representation, Estimation, and Testing. Econometrica 1987, 55, 251–276. [Google Scholar] [CrossRef]
  43. Johansen, S. Statistical Analysis of Cointegration Vectors. J. Economic. Dyn. Control 1988, 2, 231–254. [Google Scholar] [CrossRef]
  44. Johansen, S.; Juselius, K. Maximum Likelihood Estimation and Inference on Cointegration—With Applications to the Demand for Money. Oxf. Bull. Econ. Stat. 1990, 52, 169–210. [Google Scholar] [CrossRef]
  45. Cherni, A.; Jouini, S.E. An ARDL approach to the CO2 emissions, renewable energy and economic growth nexus: Tunisian evidence. Int. J. Hydrogon Energy 2017, 42, 29056–29066. [Google Scholar] [CrossRef]
  46. Anderson, D.R.; Burnham, K.P. Model Selection and Multimodal Inference: A Practical Information-Theoretical Approach, 2nd ed.; Springer: New York, NT, USA, 2002. [Google Scholar]
  47. Akaike, H. Factor analysis and AIC. Psychometrika 1987, 52, 317–332. [Google Scholar] [CrossRef]
  48. Brown, R.L.; Durbin, J.; Evans, J.M. Techniques for testing the constancy of regression relationships over Time, Journal of the Royal Statistical Society. Ser. B (Methodol.) 1975, 37, 149–192. [Google Scholar]
  49. Le Quéré, C.; Andres, R.J.; Boden, T.; Conway, T.; Houghton, R.A.; House, J.I.; Marland, G.; Peters, G.P.; Van der Werf, G.; Ahlström, A.; et al. The global carbon budget 1959–2011. Earth Syst. Sci. Data 2013, 5, 165–185. [Google Scholar] [CrossRef]
  50. Dogan, E.; Seker, F. Determinants of CO2 emissions in the European Union: The role of renewable and non-renewable energy. Renew. Energy 2016, 94, 429–439. [Google Scholar] [CrossRef]
Figure 1. Simple diagram-style of the ARDL estimation steps.
Sustainability 17 04970 g001
Figure 2. CUSUMS test for CO2, REC, and NREC.
Sustainability 17 04970 g002
Figure 3. CUSUM square test for CO2, REC, and NREC variables.
Sustainability 17 04970 g003
Table 1. An overview of previous research on the links between carbon dioxide emissions and energy consumption (2015–2024).
StudyVariablesPeriodMethodologyKey Findings
Al-Ismail et al., 2023 [4]Solar PV, Wind, CSP, Biomass, Geothermal1985–2020Comprehensive ReviewRE   C O 2 emissions.
Alshehry and Belloumi, 2015 [5]EC, CO2, GDP, Energy Efficiency (EE), Tech1970–2015Panel data, VARGDP CO2 via industrialization, Tech CO2 , EE can decouple CO2 emissions.
Alkhathlan and Javid, 2015 [6]OC, CO2, GDP, Tech1990–2015Time-series AnalysisOC CO2, OC GDP , Tech CO2
Mezghani and Haddad, 2017 [7]Electricity Consumption (ElC), GDP, EP, Industrial Output1970–2020Cointegration AnalysisElC GDP, GDP ElC in short run but in long run ElC GDP
Khan and Khan, 2024 [8]LNC, LNO, LNG, LNEC, LNELG, LNELO1985–2021ARDL modelEnergy consumption 1%   C O 2 0.631%, economic growth   C O 2
Alajmi, 2024 [9]GDP, EC, FD, POP, UEDT1980–2019Structural Time-Series ModelEnergy consumption   C O 2 . Post-2016, energy efficiency efforts led to a downward trend in emissions.
Osman, 2024 [10]AG, TR, IN, EX, IM, P, GDP, CO21979–2022ARDL modelTransportation sector   C O 2 Energy use in agriculture CO2 emissions
Toumi and Toumi, 2019 [11]REC, CO2, GDPNot specifiedNL ARDL modelRE   C O 2 Economic growth   C O 2
Alhajji and Demirel,2015 [12]RE share, CO2 emissions, EM2015–2019Descriptive analysis, statistical modelingRE still a small part of the EM, CO2 dependent on fossil fuels
Al-Sharafi et al., 2017 [13]Solar PV, Wind, CO2 emissions2015–2020Case studySlow adoption of RE high emissions of CO2
Aljohani, 2024 [14]RE, CO2, GDP2015–2021Time-series analysisRE adoption CO2
Bukun et al., 2023 [15]SE, CO2, EC2017–2020Regression analysisSE, EC limited contribution to CO2 due to infrastructural constraints
AlMansour and Akrami, 2024 [16]WE, SE, CO2 emissions2018–2024Comparative analysis, model simulationWE, SE CO2 emissions, but scalability issues persist
Alzahrani et al., 2023, [17]ET, CO2, Oil2020–2024System dynamics, scenario analysisTransitioning to RE CO2  by 40% by 2030.
ALNemer et al., 2023 [18]REC, NREC, CO2, GDP1990–2020Wavelet Coherence Analysis, Causality Testing, VARREC C O 2 , NREC C O 2 , NREC G D P
Al Shammre, 2024 [19]EC, GDP, Transport, CO2 emissions1990–2020Time-series AnalysisEC CO2 from Transport, GDP T r a n s p o r t C O 2
Abid et al., 2022 [20]REC, EF, GDP, CO21990–2020VAR, Bootstrap Causality Test,REC E F , GDP EF , REC C O 2 E F
Table 2. Data description of the variables.
VariableDescriptionUnitYearSource
CO2Carbon dioxide emissions per capita include sources from fossil fuel use and industrial processes.Ton CO2/capita1990–2019https://edgar.jrc.ec.europa.eu/country_profile/SAU (accessed on 5 December 2024)
RECRenewable energy consumption is the proportion of renewable energy in total final energy consumption.% of total final energy consumption1990–2019https://datacatalog.worldbank.org/public-licenses#cc-by (accessed on 5 December 2024)
NRECEnergy derived from sources that cannot be replenished (coal, oil, natural gas, and nuclear fuel).Electricity production from oil, gas and coal sources (% of total)1990–2019https://www.iea.org/data-and-statistics (accessed on 10 December 2024)
Table 3. Statistical properties of the time-series data of Saudi Arabia from 1990 to 2019.
VariableCO2 EmissionRECNREC
Mean347.0640.014894175.9799315
Median339.6780.020458374.8247301
Min.171.4070.090327167.6731248
Max.565.1910.379852586.9979705
St. Dev2746.31873410.14782663.7394211
Skewness−0.1105526 0.1865272−0.8554191
Kurtosis3.17911511.39457242.2205716
Jarque–Bera1.7691115 (0.5166)4.5861241 (0.2173)3.4462135 (0.3615)
Observations303030
Source: author’s computation, 2025.
Table 4. Results of Unit Root Tests.
At LevelAt First Difference
VariableInterceptIntercept and TrendInterceptIntercept and TrendDecision
ADF TestlnCO2–2.722–2.511–8.054 ***–8.195 ***I(1)
(0.185)(0.131)(0.000)(0.000)
lnREC–1.165–3.174 *–6.226 ***–6.273 ***I(0)
(0.332)(0.079)(0.002)(0.006)
lnNREC–1.857–0.827 **–5.587 ***–3.236I(0)
(0.245)(0.018)(0.003)(0.111)
PP TestlnCO2–2.722–2.511–10.112 ***–5.612 ***I(1)
(0.185)(0.131)(0.000)(0.007)
lnREC–0.177–2.704 *–4.441 ***–4.283 ***I(0)
(0.916)(0.086)(0.007)(0.002)
lnNREC–1.622–3.493 *–3.588 *–1.247 ***I(0)
(0.422)(0.091)(0.012)(0.000)
Note: ***, **, and * denote statistical significance at the 1%, 5%, and 10% levels, respectively.
Table 5. Lagged selection criteria.
LagLogAICSBCHQ
0–28.324142.2462332.3422212.274775
136.08751–2.228704 –1.940741 –2.143078
237.76101–2.056388–1.576449–1.913677
Table 6. Critical values and for the ARDL Bounds test.
Probability0.10.050.0250.01
Bounds testI (0)I (1)I (0)I (1)I (0)I (1)I (0)I (1)
2.6313.3552.1113.7743.5514.3824.1315.011
Notes: F-statistic = 6.98163, K = 2. Null hypothesis (H0): No long-run relationships exist. Source: Author calculation.
Table 7. Results of the long-run causality: coefficient and significance of probability.
VariableCoefficientProb.
ln REC–0.2145830.0762 **
ln NREC–0.5338230.0346 *
Constant70,030.340.1369
Note: * and ** denote significance levels of 5% and 10%, respectively.
Disclaimer/Publisher’s Note: The statements, opinions and data contained in all publications are solely those of the individual author(s) and contributor(s) and not of MDPI and/or the editor(s). MDPI and/or the editor(s) disclaim responsibility for any injury to people or property resulting from any ideas, methods, instructions or products referred to in the content.

