Article

Sustainable Natural Ventilation Strategies for Acceptable Indoor Air Quality: An Experimental and Simulated Study in a Small Office During the Winter Season

1
Department of Architecture, Graduate School, Seoul National University of Science and Technology, Seoul 01811, Republic of Korea
2
School of Architecture, Seoul National University of Science and Technology, Seoul 01811, Republic of Korea
*
Author to whom correspondence should be addressed.
Sustainability 2025, 17(11), 4961; https://doi.org/10.3390/su17114961
Submission received: 13 February 2025 / Revised: 3 April 2025 / Accepted: 13 May 2025 / Published: 28 May 2025

Abstract

:
This study proposes sustainable natural ventilation strategies using the periodic opening and closing of windows and doors to maintain acceptable indoor air quality in a small office space during the winter season. Field experiments were conducted in a 26.8 m2 university office room in Seoul, Korea, measuring the indoor and outdoor temperature, humidity, wind speed, carbon dioxide concentration, and fine dust levels. A simulation model based on a first-order differential equation was developed using EES software (version 9) to predict indoor CO2 concentrations at one-minute intervals. The simulation results showed good agreement with the experimental data, validating the accuracy of the modeling approach. Based on the validated model, practical ventilation durations and intervals were derived according to the occupant number and room volume, ensuring that indoor CO2 concentrations remained below the recommended 1000 ppm threshold. The results demonstrate that simple, periodic natural ventilation is effective in maintaining acceptable indoor air quality. As a passive strategy requiring no electrical energy, it offers a sustainable and low-cost solution for creating a healthy indoor environment.

1. Introduction

Recently, the concentration of fine dust has gradually increased compared to the past, becoming a serious environmental problem [1,2,3,4,5]. The International Agency for Research on Cancer (IARC) under the World Health Organization (WHO) classified fine dust as a Group 1 carcinogen [6,7,8,9]. As shown in Figure 1, a comparison of annual PM2.5 concentrations in Seoul, South Korea, over a seven-year period (2014–2020) indicates that Seoul recorded the second highest levels, following Beijing, China [2,10,11]. According to the ‘2019 World Air Quality Report’ published by Air Visual, a global air pollution research institute, Korea’s annual average fine dust concentration was the highest at 24.8 µg/m3 among OECD member countries in 2019, and 61 Korean cities were included in the world’s top 100 cities with the most severe ultrafine dust pollution [12,13]. As air quality continues to deteriorate, the frequency of ultrafine dust advisories and warnings is on the rise [6,14,15,16,17]. As a result of this air pollution alert system, the public has become increasingly aware of the dangers posed by fine dust and has gradually recognized the importance of proper ventilation [6,18,19,20].
Most people spend over 90% of their time indoors [21,22,23,24,25]. Without adequate ventilation, pollutants generated from human activities and building materials can gradually accumulate, leading to a deterioration in the indoor air quality. In particular, the buildup of fine dust and CO2 generated from human respiration can pose a significant threat to the health of occupants [26,27,28,29,30,31,32,33,34].
In the case of spaces where mechanical ventilation equipment is installed, the efficiency of filters has increased due to technological advancements, so HEPA filters can filter out more than 98% of ultrafine dust, and fresh outside air can now be introduced without concern, even if it contains high levels of fine dust [35,36,37,38,39]. In the Republic of Korea, the installation of mechanical ventilation systems is mandatory in public housing, such as apartments with more than 100 households, when natural ventilation does not meet the minimum ventilation requirements. This regulation is based on the ‘Rules on Equipment Standards for Buildings’, announced by the Ministry of Land, Infrastructure, and Transport in 2006 [40,41].
However, in relatively small spaces, mechanical ventilation systems are often lacking [42,43]. Recently, as the number of individuals aspiring to start their own businesses has increased, the number of one-person creative enterprises has grown rapidly. Consequently, the demand for single-person offices has also risen [43,44,45]. In such smaller spaces without mechanical ventilation systems, natural ventilation is essential due to health concerns. Since there are no legal regulations regarding ventilation in these spaces, it is imperative to conduct research on appropriate ventilation methods [43,46].
The concentration of CO2 has been regarded as an essential indicator for measuring and managing indoor air quality. The Ministry of Environment of the Republic of Korea, in the “Enforcement Rule of the Indoor Air Quality Control Act” (hereinafter referred to as the “Indoor Air Quality Maintenance Standards”), mandates that indoor carbon dioxide concentration levels be maintained below 1000 ppm [47]. When the concentration of CO2 in indoor air exceeds the safety threshold of 1000 ppm, it causes discomfort to occupants, leading to symptoms such as drowsiness, headaches, decreased concentration, and reduced work performance [32,33,34,48,49]. An increase in indoor CO2 concentration has a negative impact on work productivity from a qualitative perspective, even when the concentration is below the indoor air quality standard of 1000 ppm [31]. Table 1 shows the indoor air pollutant standards for offices both domestically and internationally [46].
In the future, as fossil energy sources become increasingly scarce and global climate change mitigation efforts intensify (e.g., under the Paris Agreement and UN Sustainable Development Goals), developing methods to maintain indoor air quality (IAQ) without excessive energy consumption will be essential [50,51,52,53,54,55]. This need is underscored by the building sector’s significant energy and carbon footprint. It currently accounts for roughly 34% of the global final energy demand and about 21% of global greenhouse gas emissions [56]. This considerable share highlights the importance of energy-efficient ventilation strategies for achieving global climate targets, as outlined in international agreements and agendas. While mechanical ventilation systems rely on high-grade energy sources such as electricity, natural ventilation through doors and windows operates without any active energy input [57,58,59]. This passive approach harnesses natural pressure differences between indoor and outdoor environments, making it a more sustainable ventilation strategy for buildings. However, both ventilation methods inevitably introduce outdoor air, which can influence indoor thermal conditions. In particular, during cold winter periods, introducing fresh outdoor air through either mechanical or natural ventilation can lead to heat loss and an increased heating energy demand. The primary difference is that mechanical ventilation actively draws in air using fans, whereas natural ventilation achieves this air exchange passively. Given this fundamental similarity in outcomes, our study focused on the feasibility and effectiveness of natural ventilation as a low-energy strategy, rather than conducting a comparative cost analysis of heating energy requirements.

2. Research Objectives

To propose an appropriate ventilation method for small spaces without mechanical ventilation systems, an experiment was conducted in a small office where people were working. Natural ventilation was achieved through doors and windows, and indoor air quality was analyzed by measuring fine dust and CO2 concentrations. The experiment was carried out during the winter season when the air exchange rate between the indoors and outdoors is relatively high.
The goal of this study is to provide practical guidelines for individuals in similar environments, particularly those managing natural ventilation in small-scale spaces comparable to the experimental setting by determining how long and how often doors and windows should be opened for effective ventilation. By focusing on spaces with similar external conditions and occupancy patterns, this study aims to propose an appropriate ventilation method tailored for small office spaces. Specifically, a correlation equation and guidelines were developed to predict the appropriate natural ventilation times based on the number of occupants and room volume. Furthermore, a simulation program using EES software(version 9) was developed to predict CO2 concentrations on a minute-by-minute basis, and a multiple regression analysis was performed to derive an equation that calculates the appropriate ventilation time on an hourly basis, providing a more precise recommendation for when and for how long occupants should ventilate their spaces.

3. Methods

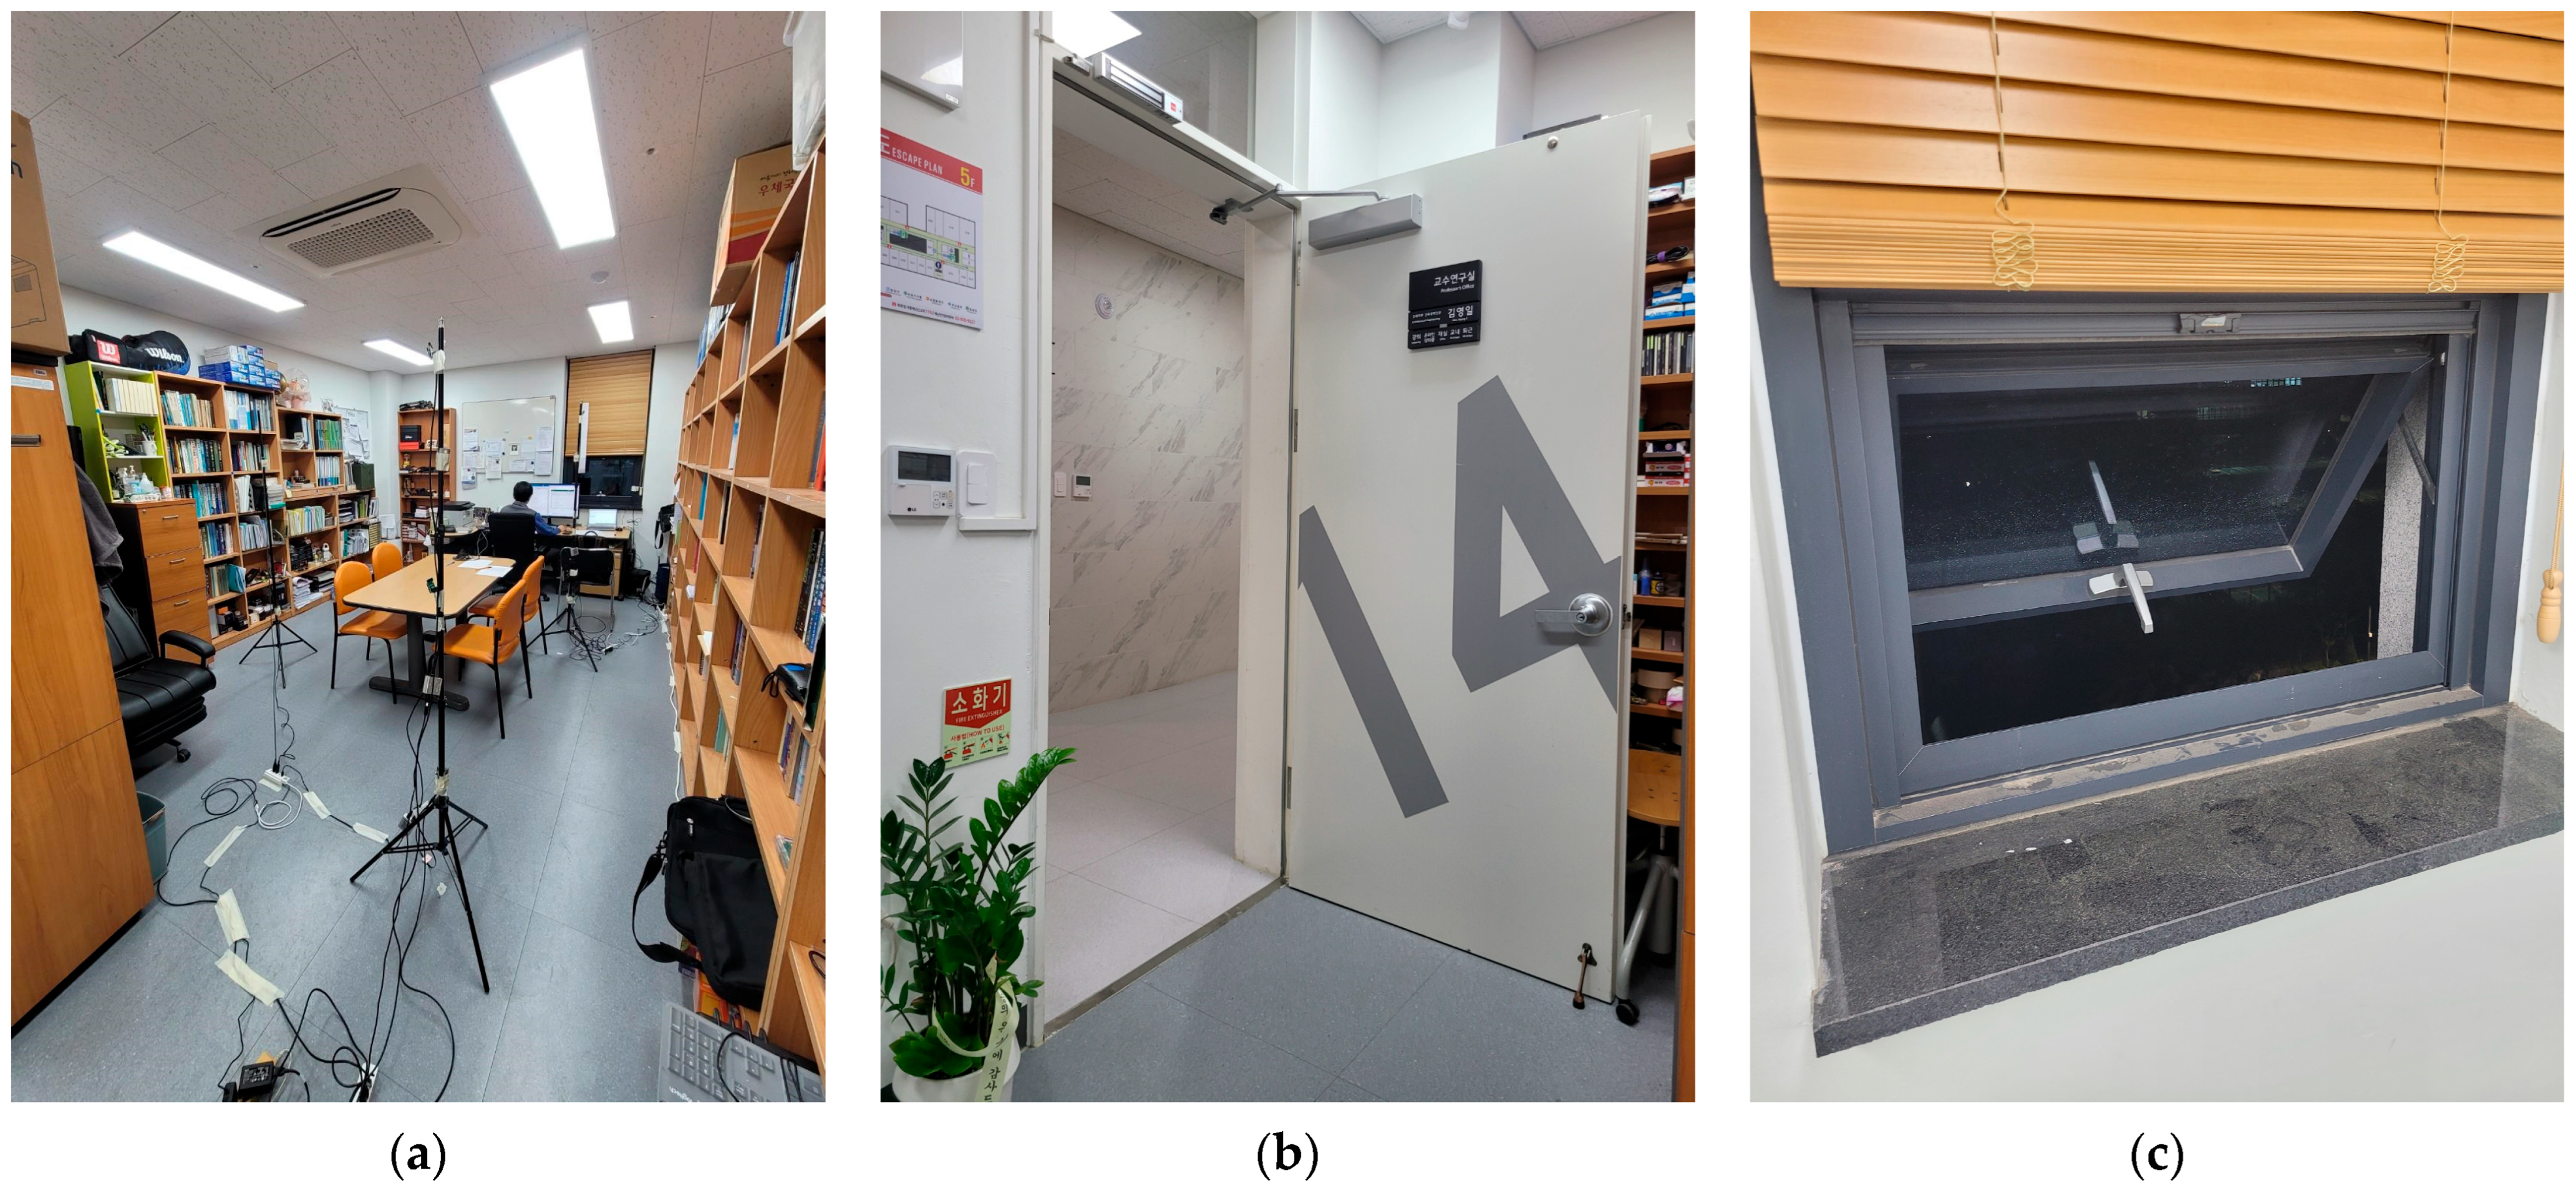
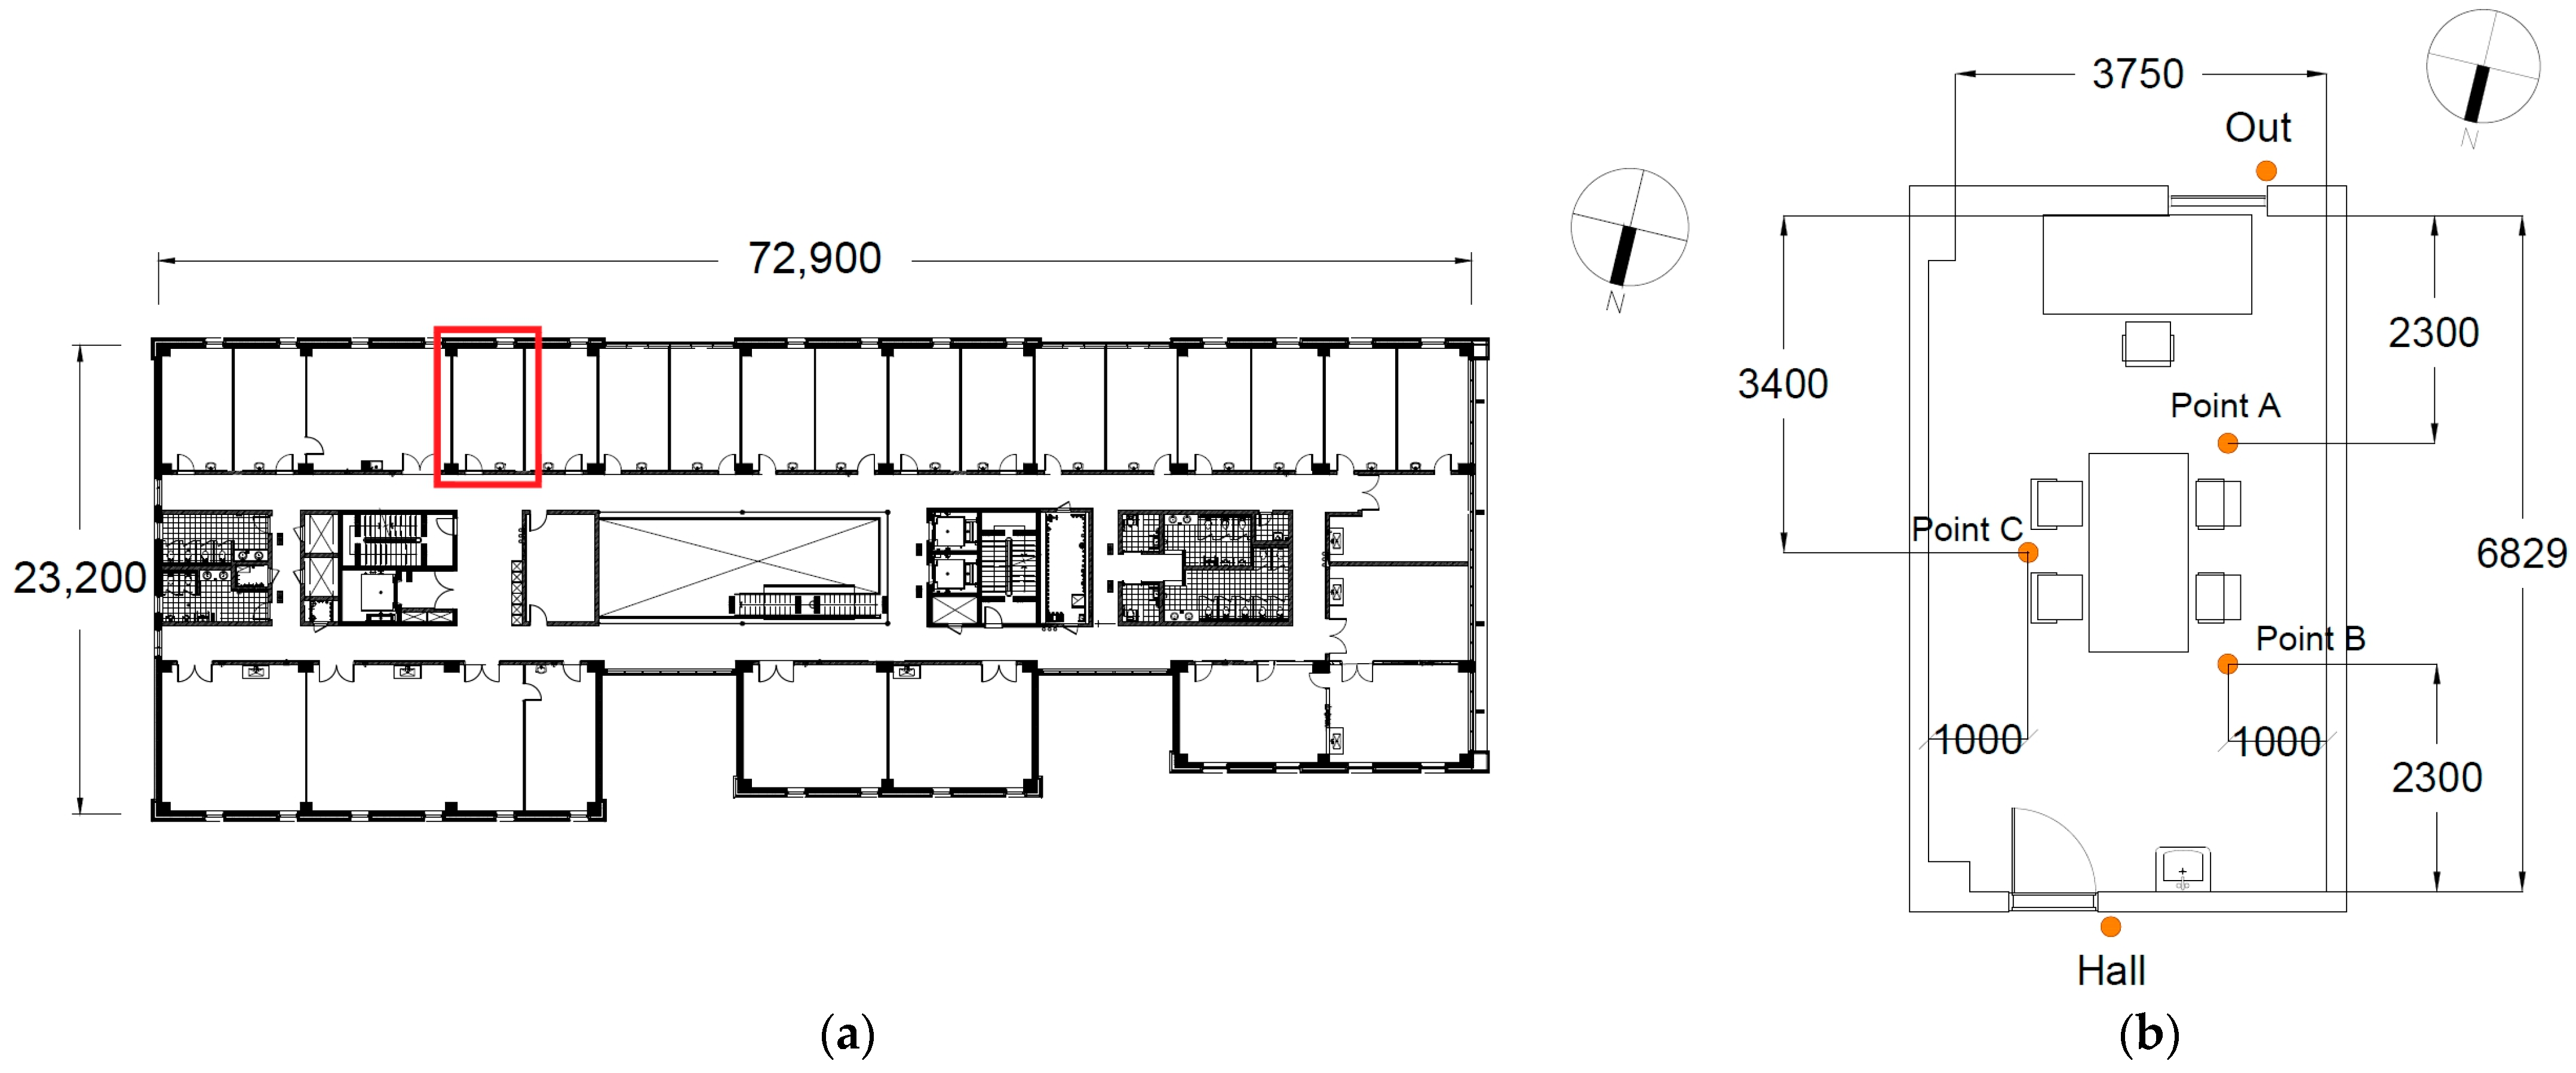
3.1. Space of Test Subject

This study was conducted in a professor’s office within a university building in Seoul, Korea, which was selected as the experimental space. The office is designed for single occupancy. The building has eight floors above ground and one basement level, with the experiment space situated on the 5th floor. The office has a floor area of 26.8 m2, a ceiling height of 2.7 m, and a total volume of 72.36 m3. The room features one door and one window; the door connects to a hallway, and the window opens to the outside. The door, which opens inward, has a surface area of 1.908 m2, while the window, an awning type, provides an effective open area of 0.324 m2. Figure 2 illustrates the experimental space, and the key specifications are summarized in Table 2.

3.2. Measurement Method

3.2.1. Measuring Points and Measuring Elements

To analyze the indoor air quality in the experimental space, concentrations of carbon dioxide (CO2), particulate matter (PM), temperature, and humidity were measured. For CO2 concentration, Sensirion SEK-SCD41 sensors were positioned at heights of 50, 120, and 190 cm above the floor at each sampling point. The placement strategy was designed to ensure a comprehensive representation of CO2 distribution throughout the space. Specifically, the sensors were widely distributed to capture the overall concentration levels across the room, minimizing the impact of localized variations and ensuring a more generalized assessment of air quality.
The choice of measurement heights was determined based on the expected dynamics of CO2 and PM dispersion. Given that the primary source of CO2 emissions is human respiration, the 120 cm height was selected to correspond with the average breathing height of seated occupants, reflecting realistic exposure levels. Additionally, sensors were positioned at 50 cm and 190 cm, representing lower and upper measurement points, respectively, to assess vertical distribution variations. These heights were selected based on a balanced approach, ensuring a 70 cm interval above and below the primary breathing zone to capture potential stratification effects.
For PM concentration, Sensirion SEK-SPS30 sensors were placed at heights of 50 cm and 160 cm above the floor. This placement considered the possibility of particulate matter suspension in air, as lower positions capture settled or resuspended particles near the floor, while higher positions detect airborne particulates within the breathing zone. By incorporating multiple heights, this study aimed to analyze the distribution of PM across different layers of the indoor environment.
Anemometers were installed on the door and window to measure the air velocity of ventilation airflow. The overall arrangement of the sensors was carefully designed to ensure an even distribution across the experimental space, allowing for a representative assessment of air quality parameters. Horizontally, the measurements were taken at three interior points and two exterior points, as shown in Figure 3a, to observe horizontal variations. Since occupants primarily stay near the center of the room, the three interior points were positioned accordingly near the center. Figure 3 illustrates each measurement location, and Table 3 specifies the measured variables at each point.

3.2.2. Experiment Schedule

The experiment was conducted in February 2022 during the winter season and spanned two consecutive days, allowing for stable conditions under typical winter weather. The first day was designated as Experiment 1 and the second day as Experiment 2. The schedule of Experiment 1 was designed to reflect the average working hours of office employees, with occupancy from 9 a.m. to 12 p.m., a lunch break from 12 p.m. to 1 p.m., and re-occupancy from 1 p.m. to 6 p.m. Natural ventilation was implemented every 50 min of occupancy, followed by a 10 min ventilation period. Experiment 1 involved ventilation through both the door and window, and its data were subsequently compared with simulation results to validate the reliability of the simulation model. In Experiment 2, natural ventilation was performed at two-hour intervals, with 110 min of occupancy followed by 10 min of ventilation. This experiment also included ventilation by simultaneously opening the door and window. The detailed schedule of the experiments is provided in Table 4.
The outdoor PM2.5 concentration during the experiments varied within the range classified as ‘Good’ to ‘Moderate’ based on the standards set by the World Health Organization (WHO). Specifically, during Experiment 1, the average outdoor PM2.5 concentration was 16.81 µg/m3 (Moderate), while during Experiment 2, it was 8.58 µg/m3 (Good) [60]. These values indicate that the experiments were conducted under representative air quality conditions in which natural ventilation is generally considered viable. Additionally, the average outdoor temperatures were −1.7 °C for Experiment 1 and −4.8 °C for Experiment 2, with corresponding average relative humidity levels of 38.0% and 22.8%, respectively. These conditions align with typical winter environments, where colder temperatures are often accompanied by lower humidity levels. To maintain an optimal indoor temperature of 21 °C during winter, adjustments were made accordingly, resulting in an average indoor temperature of 21.2 °C for Experiment 1 and 20.4 °C for Experiment 2.
Although this study was conducted over two days, the selection of experimental days was based on stable and representative meteorological conditions to ensure the reliability of the results. Given the variability of outdoor air quality and meteorological factors over extended periods, increasing the number of test days could introduce additional variables that might complicate the interpretation of natural ventilation effects. Instead, by conducting the experiments under controlled yet realistic conditions, this study aimed to provide a practical framework for natural ventilation strategies during the winter season. The findings serve as a reference for appropriate ventilation practices under favorable winter air quality conditions, offering insights that can be applied in similar environments.

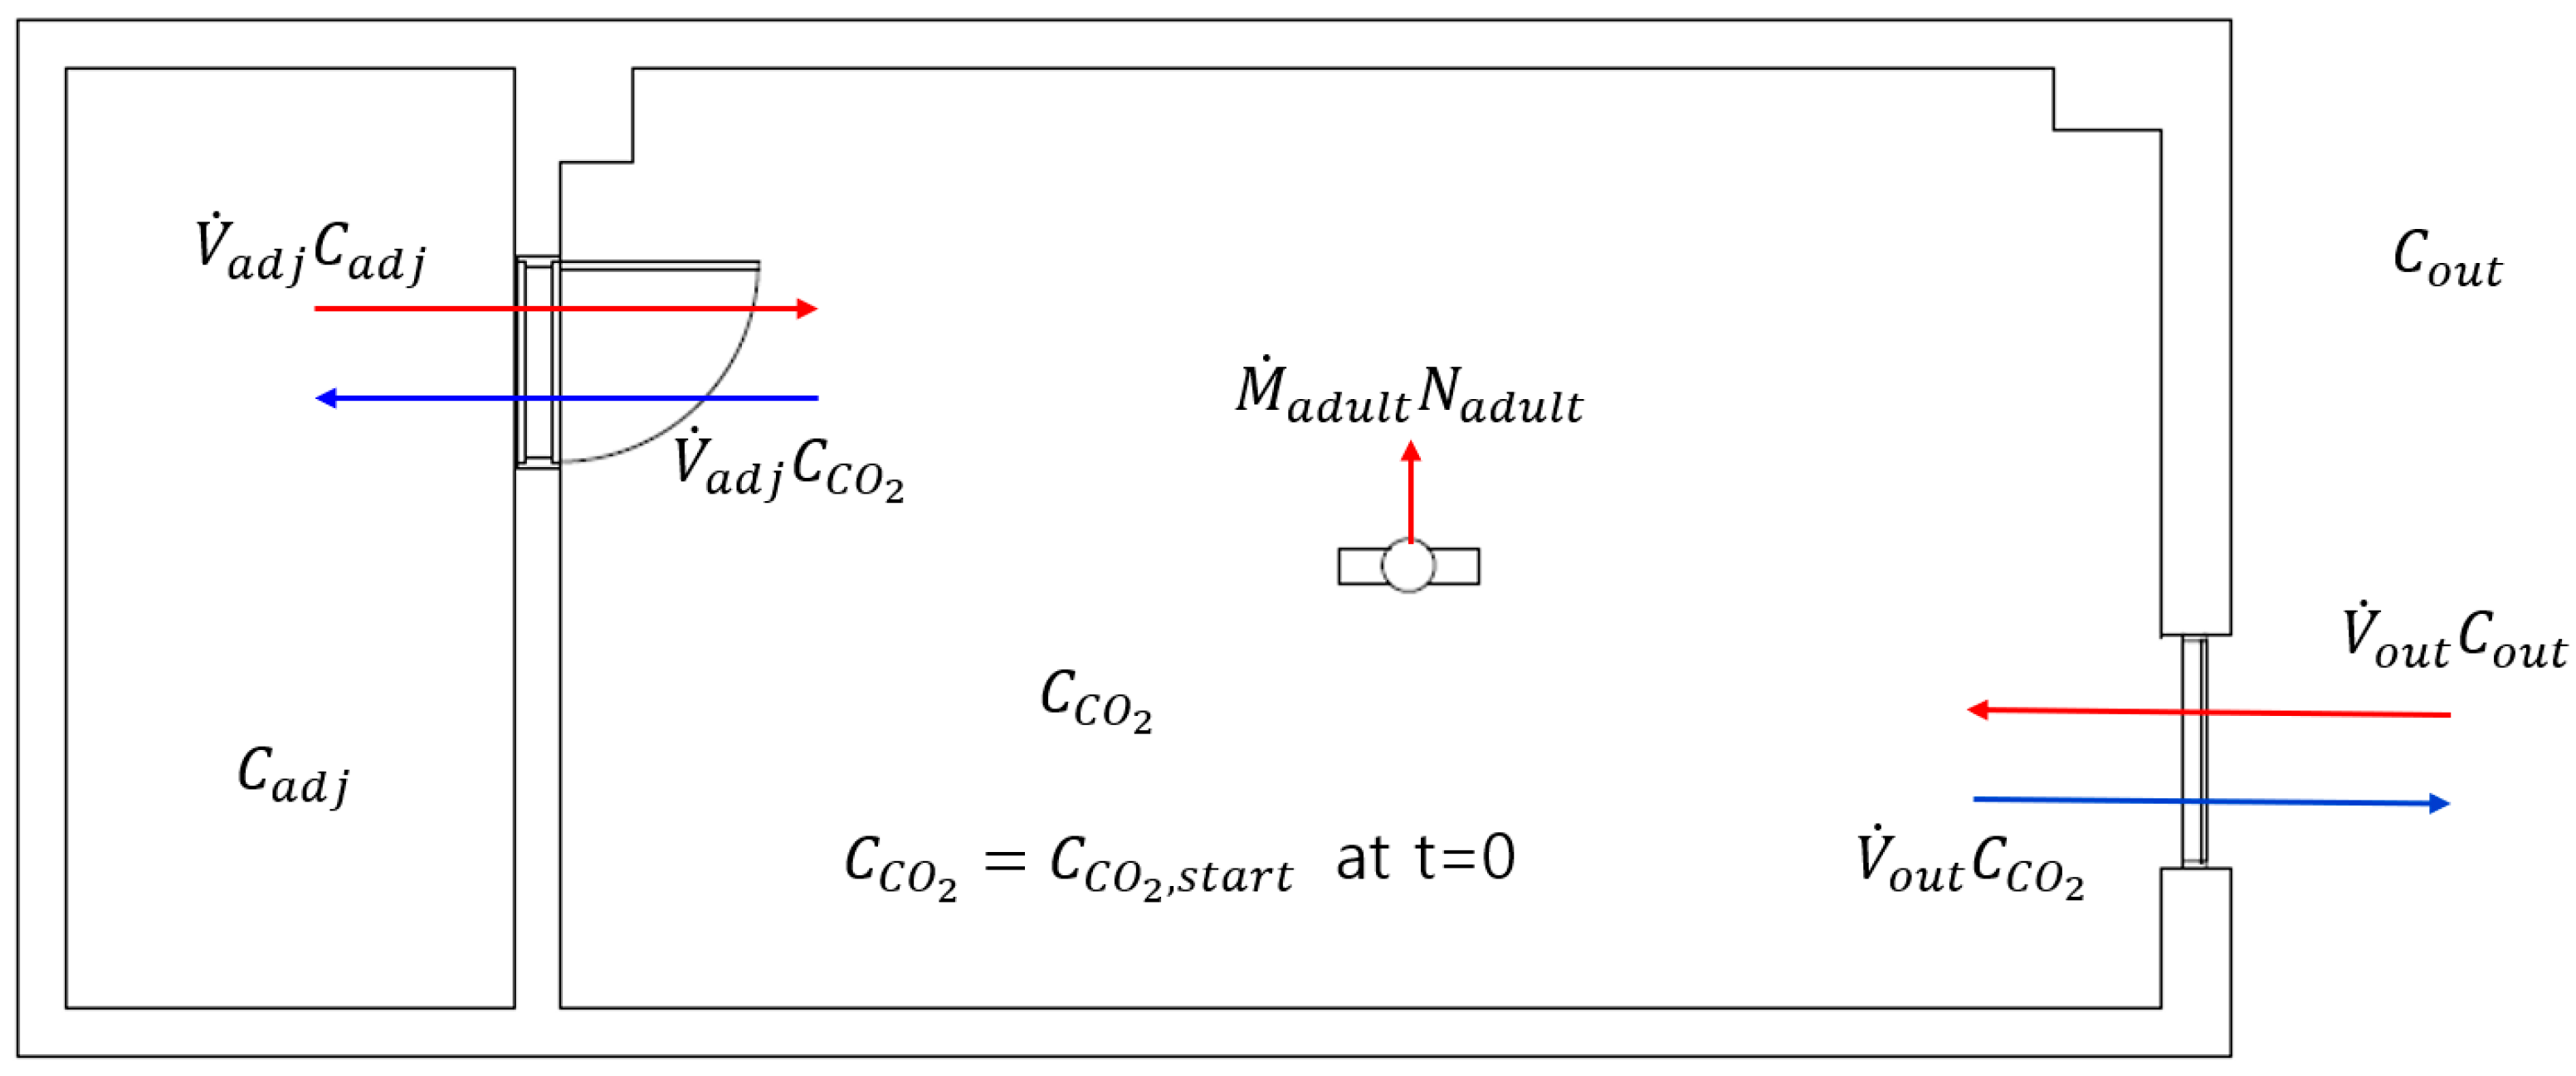
3.3. Development of a CO2 Concentration Prediction Simulation Program

3.3.1. A CO2 Concentration Prediction Simulation Program Based on First-Order Differential Equation

In this study, we developed a CO2 concentration simulation program based on a mass balance equation to predict indoor CO2 concentration at one-minute intervals. The change in indoor CO2 concentration over time can be represented by a first-order differential equation, as shown in Equation (1).
V d C C O 2 d t = V ˙ a d j C a d j V ˙ a d j C ˙ C O 2 + V ˙ o u t C ˙ o u t V ˙ o u t C C O 2 + M ˙ a d u l t N a d u l t
Here, V , C C O 2 , V ˙ a d j , C a d j , V ˙ o u t , C o u t , M ˙ a d u l t , and N a d u l t are the volume of the room, indoor CO2 concentration, volumetric flow rate infiltrating into the adjacent space, CO2 in the adjacent space, external volumetric flow rate, outdoor CO2 concentration, outdoor CO2 concentration, adult CO2 emission rate, and number of adult occupants, respectively. The conceptual diagram of this equation is shown in Figure 4.
This program predicts indoor CO2 concentration over time based on inputs such as room volume, the number of occupants and their occupancy duration, CO2 emission rates per occupant, initial indoor CO2 concentration, outdoor CO2 concentration, CO2 concentration of adjacent spaces, and the method and timing of natural ventilation through a door and window. For the simulation, measured values were used for initial, adjacent, and outdoor CO2 concentrations.
The experiment was conducted in a single-person office space, which inherently involves fewer occupants and lower levels of physical activity compared to multi-occupant offices. To reflect the realistic conditions of such a workspace, one or two occupants primarily remained seated, performing typical office tasks such as reading documents or working at a desk.

3.3.2. Validation of the Simulation Program

To validate the accuracy of the simulation program, measured CO2 concentrations were compared with time-based concentration values generated by the simulation. The accuracy was verified using the CV(RMSE)(Coefficient of Variation of the Root Mean Square Error), as recommended in ASHRAE (2014) Guideline 14. According to this guideline, time-series data with a CV(RMSE) within ±30% are considered reliable, with reliability increasing as the value approaches 0% [61]. The CV(RMSE) can be calculated using Equations (2) and (3) [62].
R M S E = i = 1 n ( y s i m , i y i ) 2 n
C V ( R M S E ) = R M S E y ¯ × 100
where RMSE is the Root Mean Square Error; y s i m , i is simulation based value; y i is actual measurement value; n is the number of actual measurement value; CV(RMSE) is the Coefficient of Variance of the Root Mean Square Error; and y ¯ is mean of actual measurement value.

4. Result

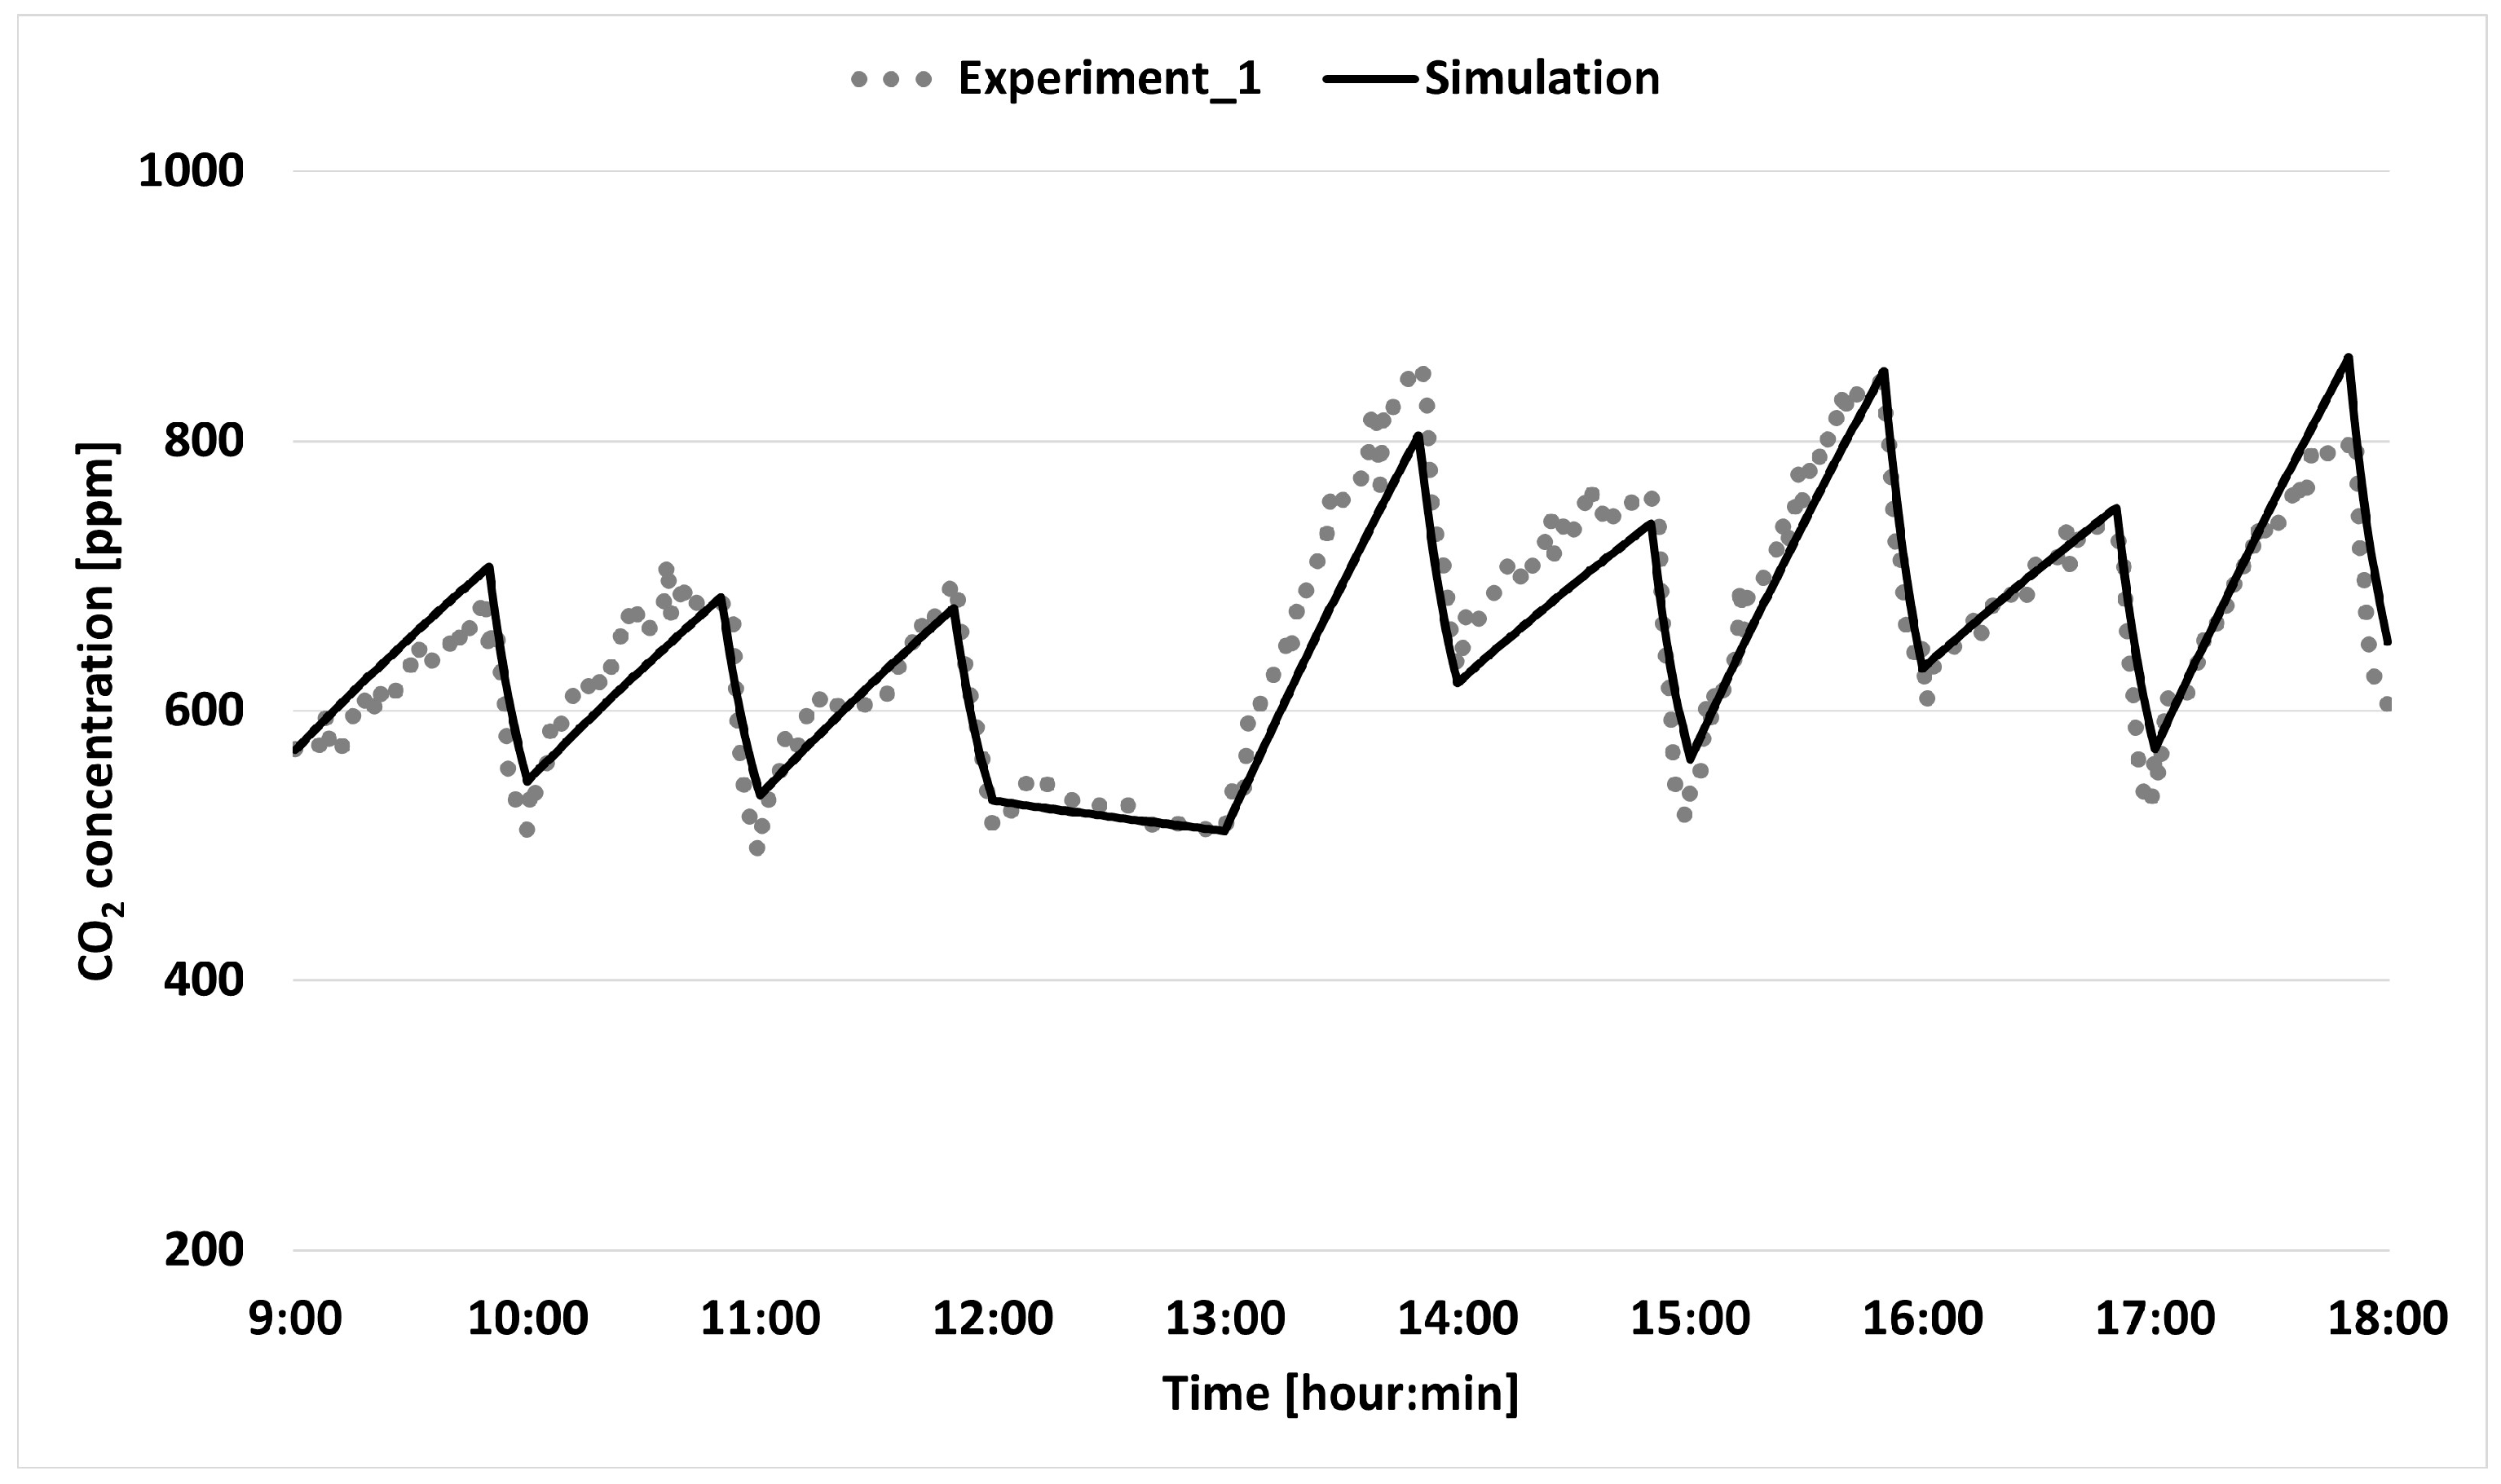
4.1. Results of the Simulation Program Reliability Validation

4.1.1. Simulation Verification Through Experiment 1

The measured CO2 concentrations from Experiment 1 and the predicted values from the simulation program are displayed in Figure 5. The CV(RMSE) for the measured and predicted values in Experiment 1 was calculated to be 4.69%. The CO2 concentration prediction simulation program developed in this study, based on first-order differential equations, met the reliability criteria proposed in ASHRAE Guideline 14 [61].

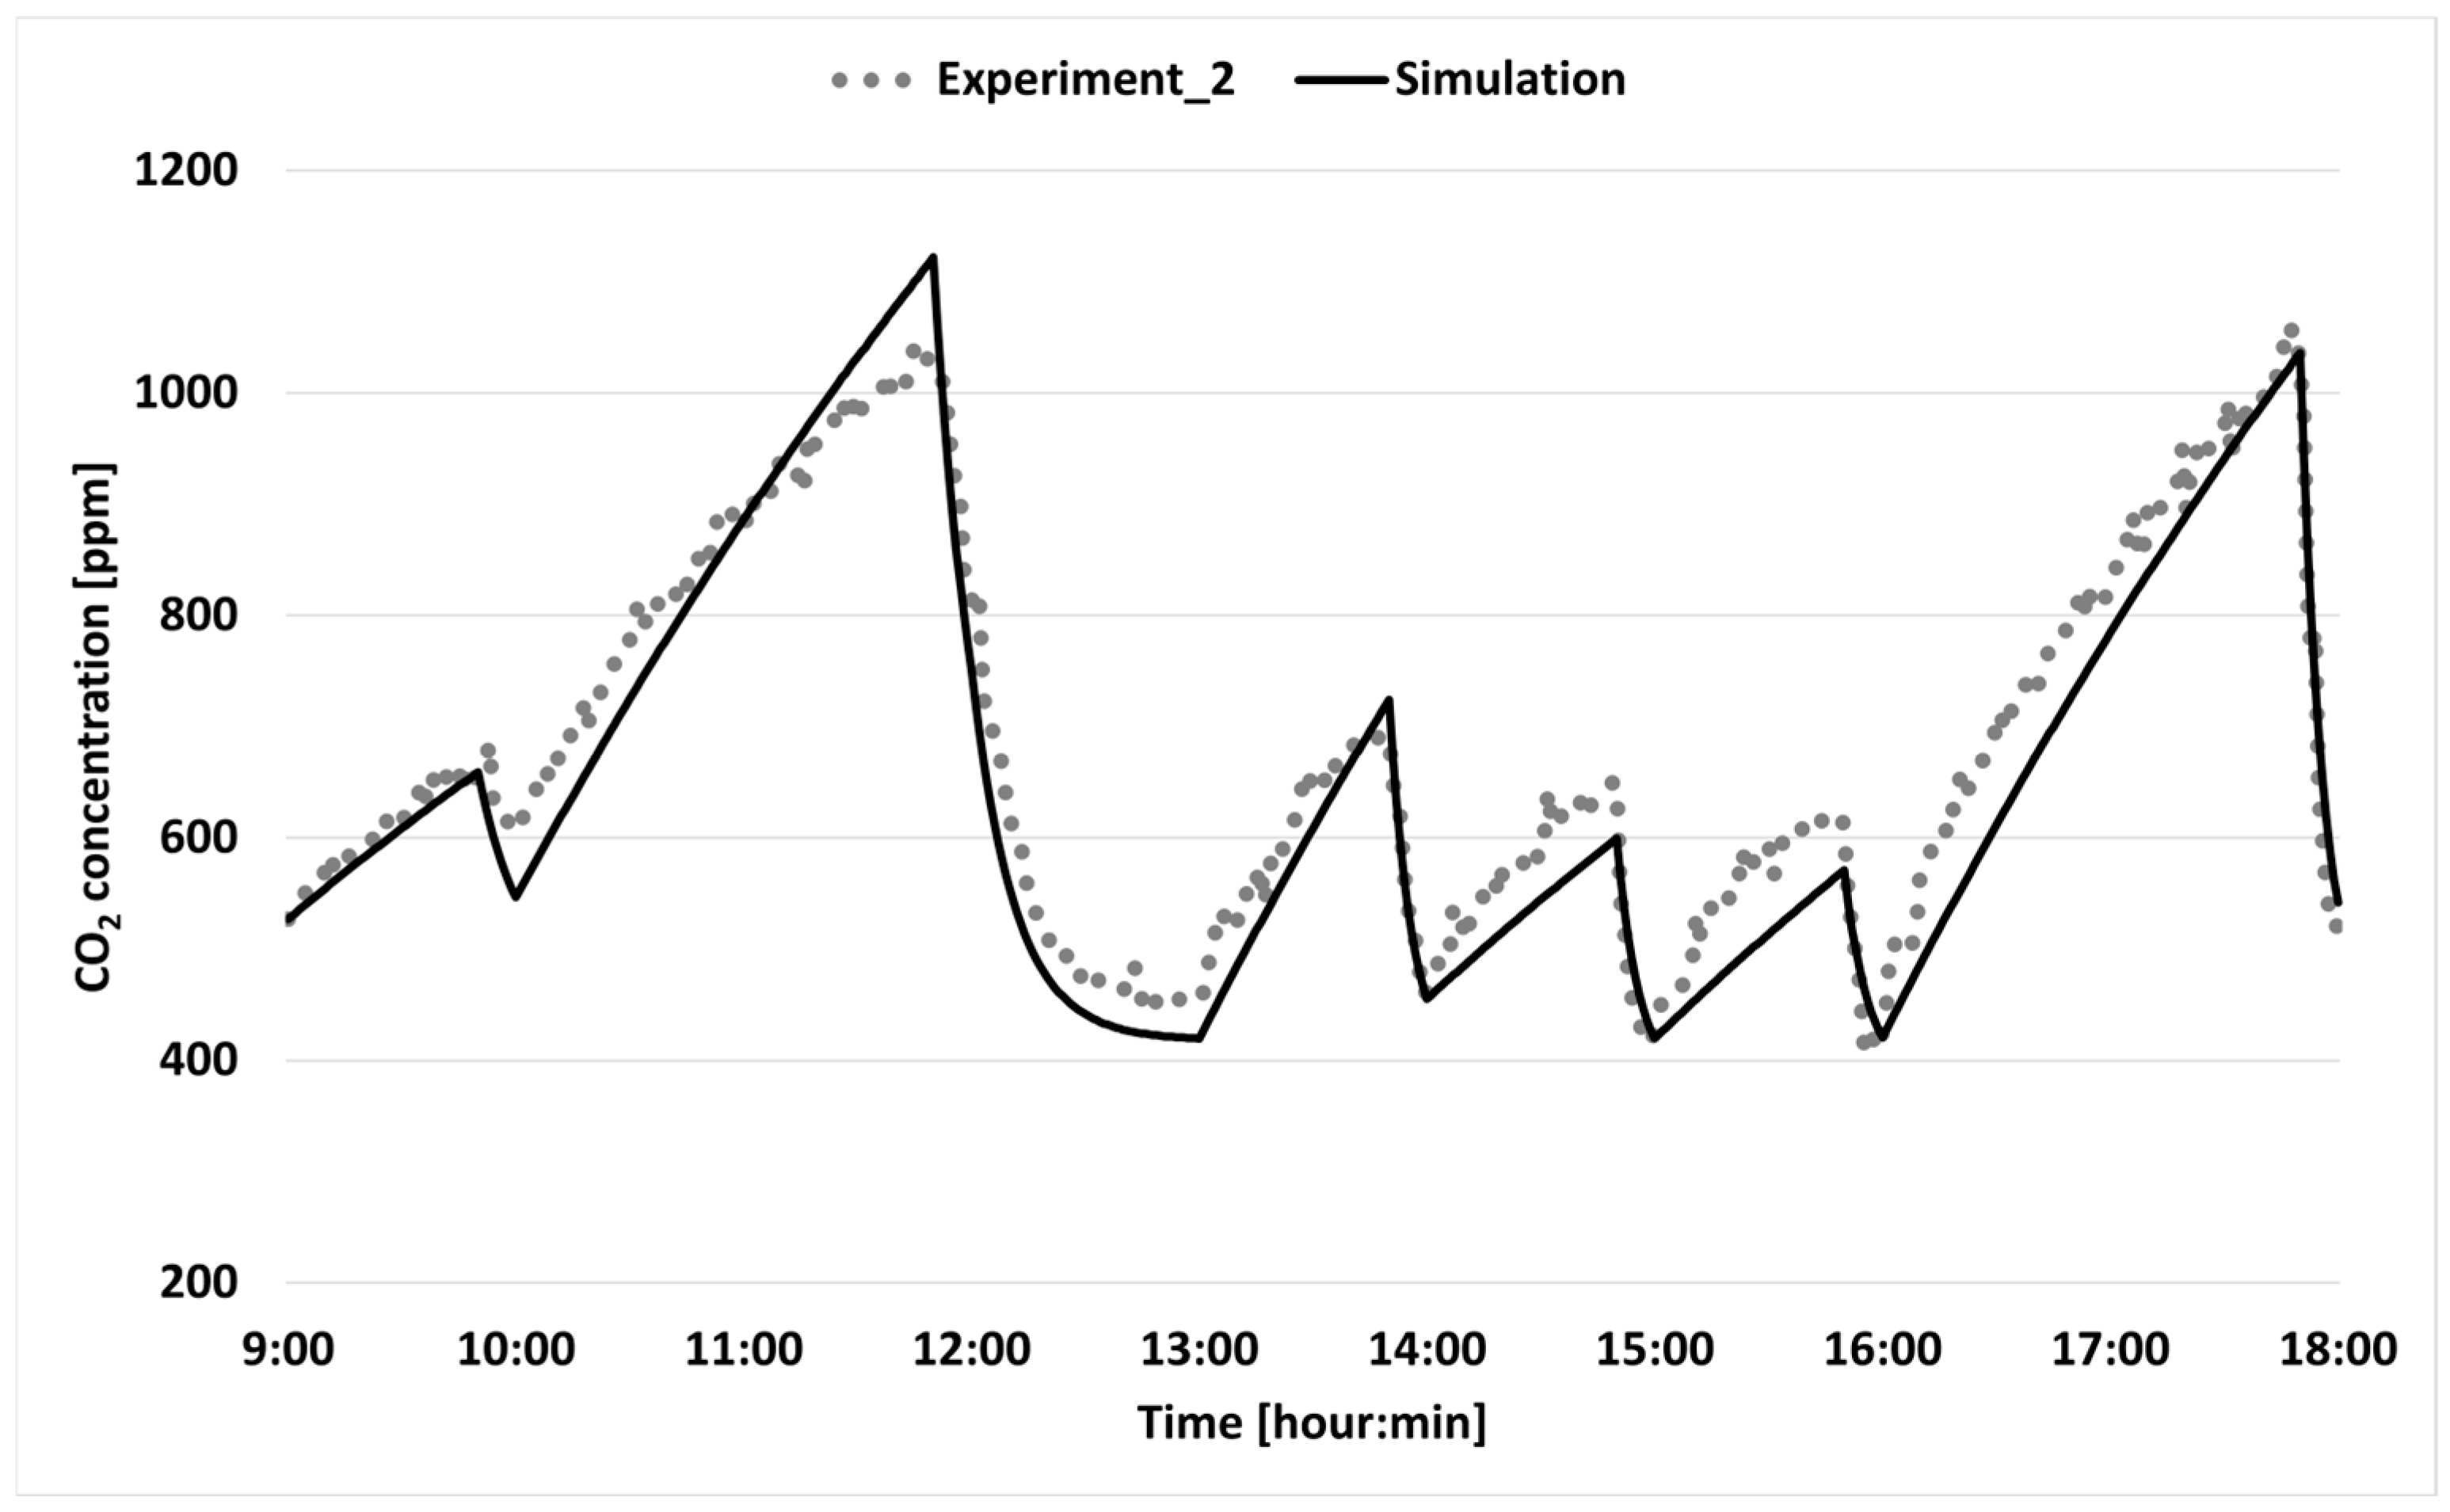
4.1.2. Simulation Verification Through Experiment 2

The CV(RMSE) of the predicted values from the simulation program in Experiment 1 satisfies the criteria of ASHRAE Guideline 14. Therefore, the same simulation input conditions applied in Experiment 1 were used in the simulation to compare with the measured data from Experiment 2, conducted the following day. The measured and simulated CO2 concentrations from Experiment 2 are presented in Figure 6. The CV(RMSE) for Experiment 2 was calculated to be 7.00%. Since both Experiments 1 and 2 satisfy ASHRAE Guideline 14, the reliability of the simulation program for predicting CO2 concentrations at 1 min intervals is considered to be sufficiently validated. Consequently, the simulation program is deemed fully applicable for predicting indoor CO2 concentrations during the winter season.

4.1.3. Air Changes per Hour (ACH) Derived from the Simulation Program

The simulation analysis showed that the air change rate through doors was 4.8 ACH, through windows was 5.2 ACH, and for a closed classroom was 0.2 ACH.

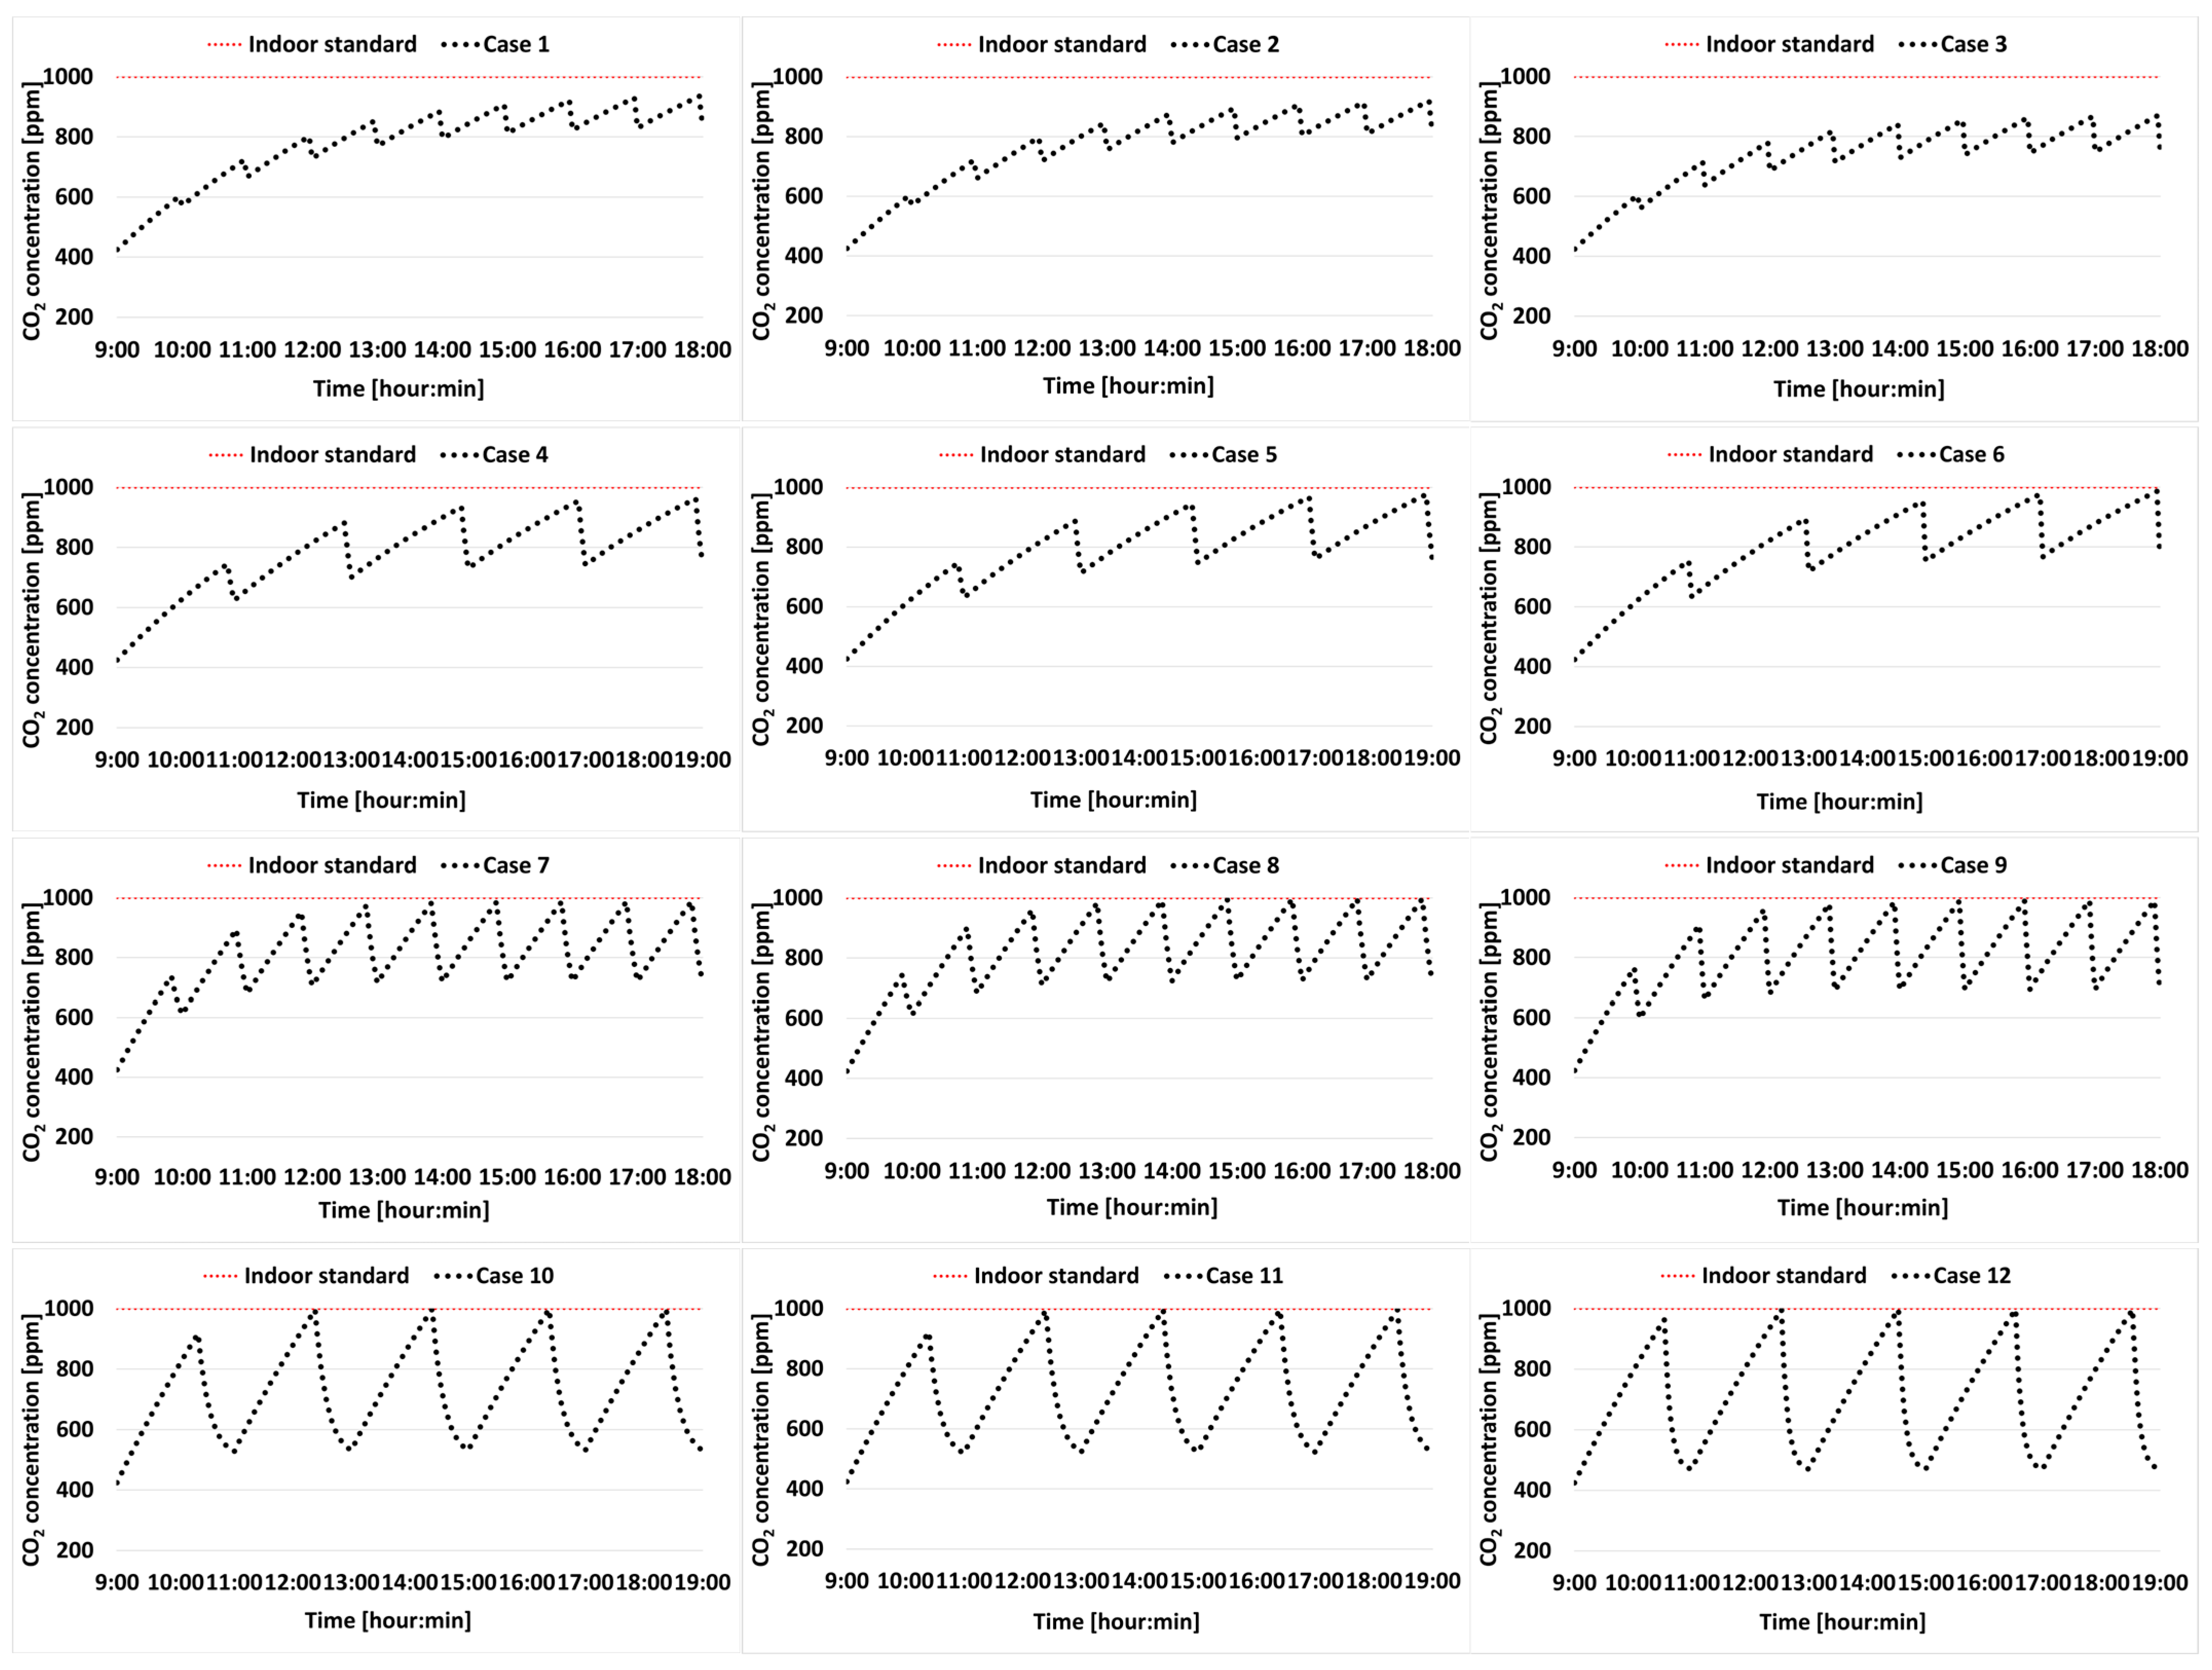
4.2. Analysis Results of Appropriate Ventilation Method for Each Case

Based on ASHRAE Guideline 14, an appropriate natural ventilation method for small spaces was proposed using a minute-by-minute CO2 concentration prediction simulation program that has proven reliability. Since the Ministry of Environment of the Republic of Korea’s “Enforcement Rules for the Indoor Air Quality Management Act” (hereinafter referred to as “Indoor Air Quality Maintenance Standards”) sets the indoor CO2 concentration to 1000 ppm or less, a ventilation method that does not exceed 1000 ppm was proposed [47]. The initial CO2 concentration in the room, CO2 concentration in the adjacent space, and outdoor air concentration were set at 424.7 ppm, which is the monthly average CO2 concentration in January 2020 according to the “Atmospheric Environment Yearbook 2020” published by the National Institute of Environmental Research of the Republic of Korea [63]. For each of the three ventilation methods, the ventilation time according to the occupancy time in 1 h and 2 h increments was presented when one person was in the room and the ventilation time according to the occupancy time in 1 h and 2 h increments when two people were in the room were presented. The results for each case are shown in Figure 7, and the appropriate ventilation methods are shown in Table 5.
Figure 7 shows the results of Cases 1 to 12, which analyzed the natural ventilation method to prevent the indoor CO2 concentration from exceeding 1000 ppm using a minute-by-minute CO2 concentration prediction simulation program. Overall, the concentration of CO2 increased while the occupants were in the room, and CO2 decreased more rapidly during ventilation through doors and windows than the CO2 that increased during the occupancy of one or two people.
It was confirmed that in a small space without mechanical ventilation equipment, the CO2 concentration can be sufficiently maintained below 1000 ppm through natural ventilation.

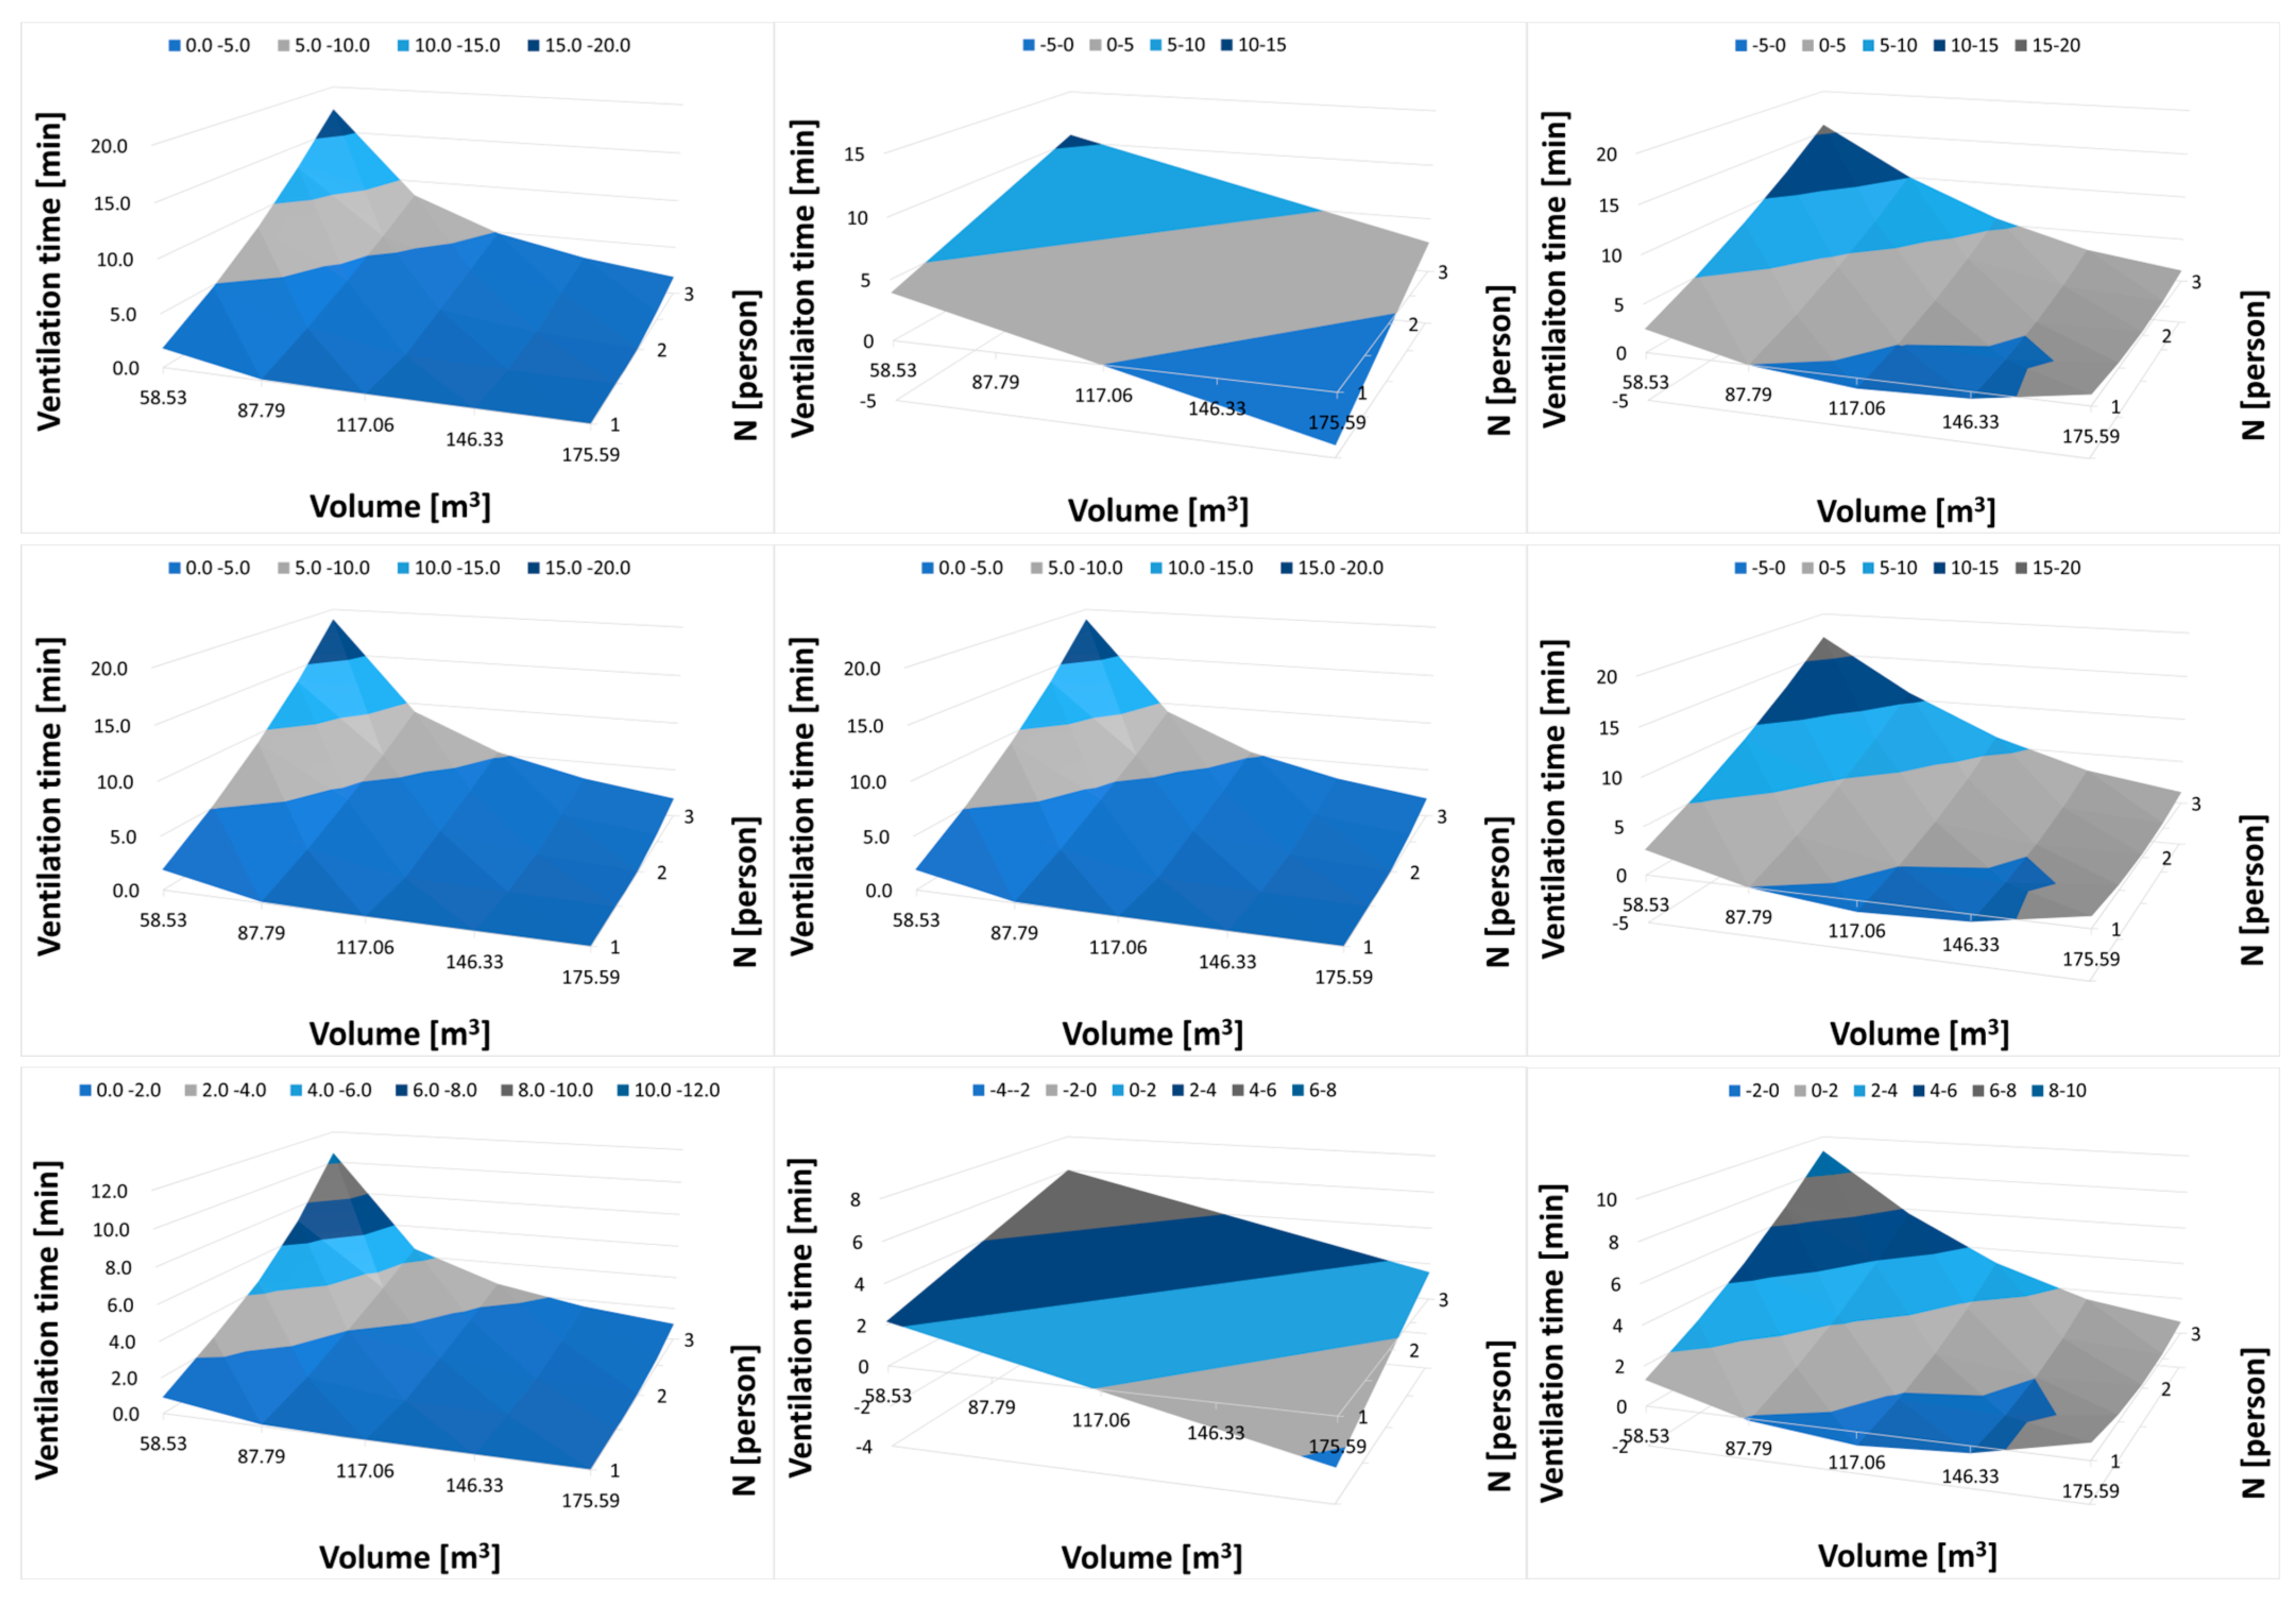
4.3. Development of Natural Ventilation Time Correlation Equation

4.3.1. Proposal of a Predictive Equation

Based on the results of this study, a correlation equation was developed using the least squares method—one of the most widely used techniques for fitting sample data—through regression analysis to predict the natural ventilation time required for a room [64]. The formula for the least squares method is as shown in Equation (4), and the coefficient value that minimizes the sum of error squares was determined. A regression analysis was performed using the number of occupants and volume as parameters, and the analysis was performed using the least squares method function installed in the EES software(version 9). The first- and second-order expressions of the elements were proposed for the predictive equations, as shown in Equations (5) and (6).
S = ( T e s t , i T i ) 2
T v e n t = C n n + C V V + C
T v e n t = C 1 n + C 2 n 2 + C 3 n V + C 4 V + C 5 V 2 + C 6
where T e s t , i is the estimated ventilation time and T i is the validated simulation ventilation time.

4.3.2. Case Selection and Analysis Results for Predicting Ventilation Time

To enable a more precise analysis, the simulation program, which originally predicted the CO2 concentration on a minute-by-minute basis, was modified to predict on a second-by-second basis. The results were then converted back to minute-by-minute values rounded to the first decimal place for analysis. Furthermore, to improve the accuracy of the regression equations, a database of 25 results was constructed for each of the three previously mentioned ventilation methods. The database was created by varying the number of occupants (1, 1.5, 2, 2.5, and 3 persons) and the room volume (1, 1.5, 2, 2.5, and 3 times the experimental volume). The database of ventilation times for the door, window, and door + window ventilations times created from the simulation results is shown in Table 6.

4.3.3. Regression Analysis Results

The regression analysis results for the window, door, and door + window ventilation methods in Table 6, using the number of occupants and volume as the parameters, showed that the second-order prediction equation had fewer errors compared to the first-order prediction equation. The results of the multiple regression analysis are presented in Figure 8, and the coefficients for the two equations are shown in Table 7.
A comparison of the first-order and second-order equations obtained through multiple regression analysis revealed that predictions using the second-order equation had fewer errors than those using the first-order equation. The second-order correlation equations for predicting the ventilation time through doors, windows, and simultaneous door and window ventilation are given as Equations (7), (8), and (9), respectively.
T d , v e n t = 7.309 n + 0.8857 n 2 0.06144 n V 0.16 V + 0.000894 V 2 + 4.321
T w , v e n t = 6.832 n + 0.8 n 2 0.5665 n V 0.1485 V + 0.000827 V 2 + 3.977
T d w , v e n t = 3.669 n + 0.5657 n 2 0.03424 n V 0.08709 V + 0.0005 V 2 + 2.46
This study focused on analyzing CO2 concentrations and did not primarily address particulate matter. However, during the two-day experiment, the average indoor PM2.5 concentrations were 13.87 µg/m3 and 8.21 µg/m3, respectively, both of which satisfy the World Health Organization (WHO) guideline of 15 µg/m3 or less for good indoor air quality. The relatively low activity levels typical of office environments likely contributed to the minimal resuspension of the particulate matter.
In Experiment 1, the average outdoor and corridor PM2.5 concentrations were 16.81 µg/m3 and 15.19 µg/m3, respectively. In Experiment 2, they were 8.58 µg/m3 and 8.51 µg/m3. Since indoor and outdoor PM2.5 levels were generally low and comparable, natural ventilation did not significantly increase the indoor particulate concentrations. Consequently, indoor PM2.5 levels in both experiments remained at 13.87 µg/m3 and 8.21 µg/m3, respectively.
Both experiments were conducted under conditions where particulate matter concentrations were within acceptable limits according to WHO guidelines [60], allowing for natural ventilation without the significant deterioration of indoor air quality. Therefore, this study primarily concentrated on CO2 analysis. Future research will aim to investigate particulate matter dynamics in greater detail and assess their potential effects on indoor air quality during natural ventilation.

5. Conclusions

This study developed a simulation program to predict the indoor CO2 concentration on a one-minute basis using a mass balance equation. The program was used to propose optimal ventilation times for small spaces without mechanical ventilation systems during winter, focusing on natural ventilation methods using windows, doors, and doors + windows. Additionally, correlation equations for predicting optimal natural ventilation times were developed through multiple linear regression analysis. The experiments were conducted in winter and involved natural ventilation through doors, windows, and the simultaneous use of doors and windows. The reliability of the simulation program was validated based on ASHRAE Guideline 14. Using the validated simulation program, optimal ventilation methods were proposed. Regression analysis was conducted with the number of occupants and the volume as parameters to develop correlation equations for predicting natural ventilation durations. The main findings are as follows.
(1)
In this study, a simulation program was developed to predict indoor CO2 concentrations based on a mass balance equation. The program’s reliability was validated using ASHRAE Guideline 14 by comparing it with measured values from two experiments, resulting in CV(RMSE) values of 4.69% and 7.00%, respectively, thereby demonstrating its reliability.
(2)
For a single occupant over a 1 h period, it was seen that indoor CO2 concentration does not exceed 1000 ppm under the following conditions: 57 min of occupancy and 3 min of ventilation using the door, 57 min of occupancy and 3 min of ventilation using the window, or 58 min of occupancy and 2 min of ventilation using both the door and window simultaneously.
(3)
Under the same single-occupant scenario, for a two-hour period, the analysis showed that with ventilation through a door, 113 min of occupancy and 7 min of ventilation, with ventilation through a window, 114 min of occupancy and 6 min of ventilation, and with simultaneous ventilation through both a door and a window, 117 min of occupancy and 3 min of ventilation, the indoor CO2 concentration does not exceed 1000 ppm.
(4)
For a scenario with two occupants, the analysis revealed that with ventilation through a door, 50 min of occupancy and 10 min of ventilation per hour, with ventilation through a window, 51 min of occupancy and 9 min of ventilation per hour, and with simultaneous ventilation through both a door and a window, 55 min of occupancy and 5 min of ventilation per hour, the indoor CO2 concentration does not exceed 1000 ppm.
(5)
In the two-occupants scenario for a two-hour interval, the analysis indicated that with ventilation through a door, 83 min of occupancy and 37 min of ventilation, with ventilation through a window, 84 min of occupancy and 36 min of ventilation, and with simultaneous ventilation through both a door and a window, 92 min of occupancy and 28 min of ventilation, the indoor CO2 concentration does not exceed 1000 ppm.
These results demonstrate that natural ventilation, when properly scheduled, can effectively maintain the indoor air quality without the need for continuous mechanical ventilation systems. This has important implications for reducing building energy use, especially in small-scale office environments where mechanical systems may not be present or efficient. As natural ventilation relies solely on pressure and temperature differences rather than electricity, it serves as a passive and low-energy solution aligned with broader environmental goals to minimize fossil fuel consumption and greenhouse gas emissions.
Future research will address these limitations by considering particulate matter concentrations and room characteristics to propose more generalized ventilation methods. This study aimed to propose natural ventilation methods for small spaces and conducted experiments in a single-person workspace. However, it is limited in that it does not account for the diverse characteristics of various space types under different conditions. This study was carried out in a specific setting, and to improve the reliability of the findings, further validation through repeated experiments under identical conditions across a range0 of space types is necessary. As the workspace size and occupancy increase, the presence of additional furniture and electronic equipment is expected to influence the airflow patterns, CO2 distribution, and the circulation of other contaminants. In larger work environments, the air temperature tends to be neither uniform nor constant throughout the space, resulting in variations in ventilation effectiveness [65]. These factors were beyond the scope of the present study, but will be addressed in future research to develop ventilation strategies suitable for larger and more complex indoor environments. Future studies will also aim to overcome current limitations by incorporating factors such as particulate matter concentrations and room-specific characteristics, ultimately proposing more generalized and robust natural ventilation methods.

Author Contributions

Conceptualization, W.C.L. & Y.I.K.; methodology, W.C.L.; experiment, W.C.L.; software, W.C.L. & Y.I.K.; verification, Y.I.K.; formal analysis, W.C.L.; investigation, W.C.L.; resources, W.C.L.; data curation, W.C.L.; writing—original draft preparation, W.C.L.; writing—review and editing, Y.I.K.; visualization, W.C.L.; director, Y.I.K.; project management, Y.I.K.; funding, Y.I.K. All authors have read and agreed to the published version of the manuscript.

Funding

This study was supported by the Research Program funded by Seoul National University of Science and Technology.

Institutional Review Board Statement

Not applicable.

Informed Consent Statement

Not applicable.

Data Availability Statement

The original contributions presented in the study are included in the article, further inquiries can be directed to the corresponding author.

Conflicts of Interest

The authors declare no conflict of interest.

References

  1. Lee, H.Y.; Kim, N.J. The Impact of Fine Particular Matter Risk Perception on the Outdoor Behavior of Recreationists: An Application of the Extended Theory of Planned Behavior. Tour. Sci. Soc. Korea 2017, 41, 27–44. [Google Scholar] [CrossRef]
  2. Lee, Y.K.; Kim, Y.I.; Kim, G.H. Indoor Air Quality Diagnosis Program for School Multi-Purpose Activity and Office Spaces. Energies 2022, 15, 8134. [Google Scholar] [CrossRef]
  3. Choi, S.Y.; Eom, Y.; Song, J.S.; Kim, H.M. Fine Dust and Eye Health. J. Korean Med. Assoc. 2019, 62, 486–494. [Google Scholar] [CrossRef]
  4. Ritz, B.; Hoffmann, B.; Peters, A. The Effects of Fine Dust, Ozone, and Nitrogen Dioxide on Health. Dtsch. Arztebl. Int. 2019, 116, 881–886. [Google Scholar] [CrossRef]
  5. Choi, H.J.; Seo, J.; Song, Y.H.; Moon, N. Analysis of PM2.5 Concentrations Improvement by Application of Reduction Technology for Construction Vehicle. J. Korean Soc. Atmos. Environ. 2024, 40, 69–83. [Google Scholar] [CrossRef]
  6. Yeo, M.J.; Kim, Y.P. Trends of the PM10 Concentrations and High PM10 Concentration Cases in Korea. J. Korean Soc. Atmos. Environ. 2019, 35, 249–264. [Google Scholar] [CrossRef]
  7. Hamra, G.B.; Guha, N.; Cohen, A.; Laden, F.; Raaschou-Nielsen, O.; Samet, J.M.; Vineis, P.; Forastiere, F.; Saldiva, P.; Yorifuji, T.; et al. Outdoor Particulate Matter Exposure and Lung Cancer: A Systematic Review and Meta-Analysis. Environ. Health Perspect. 2014, 122, 906–911. [Google Scholar] [CrossRef]
  8. Loomis, D.; Huang, W.; Chen, G. The International Agency for Research on Cancer (IARC) Evaluation of the Carcinogenicity of Outdoor Air Pollution: Focus on China. Chin. J. Cancer 2014, 33, 189–196. [Google Scholar] [CrossRef]
  9. Feretti, D.; Pedrazzani, R.; Ceretti, E.; Dal Grande, M.; Zerbini, I.; Viola, G.C.V.; Gelatti, U.; Donato, F.; Zani, C. “Risk Is in the Air”: Polycyclic Aromatic Hydrocarbons, Metals and Mutagenicity of Atmospheric Particulate Matter in a Town of Northern Italy (Respira Study). Mutat. Res. Genet. Toxicol. Environ. Mutagen. 2019, 842, 35–49. [Google Scholar] [CrossRef]
  10. Airkorea Status of Air Pollution in Foreign Countries—Comparison of Major Cities in Foreign Countries. Available online: https://www.airkorea.or.kr/web/contents/contentView/?pMENU_NO=127&cntnts_no=4 (accessed on 29 January 2024).
  11. National Institute of Environmental Research. 2019 Atmospheric Environmental Yearbook; NIER: Incheon, Republic of Korea, 2020. [Google Scholar]
  12. Seo, M.J. Latest Air Filter Technology—Dust Collection Filter Technology Trend. Air Clean. Technol. 2020, 33, 38–45. [Google Scholar]
  13. IQAir. Airvisual 2019 World Air Quality Report; IQAir: Goldach, Switzerland, 2020. [Google Scholar]
  14. Korean Society for Atmospheric Environment (KOSAE). Indoor Air Pollution 2011; Korean Society for Atmospheric Environment: Seoul, Republic of Korea, 2011. [Google Scholar]
  15. Details of Fine Dust Warning Warnings Issued by Region. Available online: https://www.airkorea.or.kr/web/pmWarning?pMENU_NO=115 (accessed on 29 January 2024).
  16. Lee, C.J.; Hong, M.S. Spatiotemporal Variations of Fine Particulates in and around the Korean Peninsula. J. Korean Soc. Atmos. Environ. 2019, 35, 675–682. [Google Scholar] [CrossRef]
  17. Park, S.-M.; Moon, K.-J.; Park, J.-S.; Kim, H.-J.; Ahn, J.-Y.; Kim, J.-S. Chemical Characteristics of Ambient Aerosol during Asian Dusts and High PM Episodes at Seoul Intensive Monitoring Site in 2009. J. Korean Soc. Atmos. Environ. 2012, 28, 282–293. [Google Scholar] [CrossRef]
  18. Moon, H.; Song, J. The Impacts of Particulate Matter on Urban Activities in Jongno-Gu, Seoul. J. Korean Reg. Sci. Assoc. 2021, 37, 29–44. [Google Scholar] [CrossRef]
  19. Park, E.; Oh, H.-J.; Kim, S.-H.; Min, A. The Relationships between Particulate Matter Risk Perception, Knowledge, and Health Promoting Behaviors among College Students. J. Korean Biol. Nurs. Sci. 2017, 20, 20–29. [Google Scholar] [CrossRef]
  20. Jiang, C.; Ren, G.; Kim, J.S. The Effect of the Awareness of Particulate Matter on Decision Making Process of Pro-Environmental Tourism Behaviors: Applying VBN (Value-Belief-Norm) Theory. J. Tour. Leis. Res. 2019, 31, 77–98. [Google Scholar] [CrossRef]
  21. Hildemann, L.M.; Montoya, L.D. Evolution of the Mass Distribution of Resuspended Cat Allergen (Fel d 1) Indoors Following a Disturbance. Atmos. Environ. 2001, 35, 859–866. [Google Scholar]
  22. Simheee, H.; Yeo, C.; Yu, J. Automation of Information Extraction from IFC-BIM for Indoor Air Quality Certification. Korean J. Constr. Eng. Manag. 2017, 18, 63–73. [Google Scholar] [CrossRef]
  23. Yang, W. Time-Activity Pattern of Students and Indoor Air Quality of School. J. Korean Inst. Educ. Facil. 2014, 21, 17–22. [Google Scholar]
  24. Tham, S.; Thompson, R.; Landeg, O.; Murray, K.A.; Waite, T. Indoor Temperature and Health: A Global Systematic Review. Public. Health 2020, 179, 9–17. [Google Scholar] [CrossRef]
  25. Liu, F.; Yan, L.; Meng, X.; Zhang, C. A Review on Indoor Green Plants Employed to Improve Indoor Environment. J. Build. Eng. 2022, 53, 104542. [Google Scholar] [CrossRef]
  26. Ko, Y.; Min, J.; Hong, H. Heating and Cooling Energy Consumption According to Ventilation Method of Multi-Use Establishments. Korean J. Air-Cond. Refrig. Eng. 2020, 32, 405–411. [Google Scholar] [CrossRef]
  27. Choe, Y.; Heo, J.; Park, J.; Kim, E.; Ryu, H.; Jun Kim, D.; Cho, M.; Lee, C.; Lee, J.; Yang, W. Evaluation of Carbon Dioxide Concentrations and Ventilation Rates in Elementary, Middle, and High Schools. J. Environ. Health Sci. 2020, 46, 344–352. [Google Scholar] [CrossRef]
  28. Jang, N.R. A Study on Elementary School Students’ Knowledge. Awareness and Attitude toward Fine Dust. Korean Assoc. Pract. Arts Educ. 2020, 33, 1–20. [Google Scholar] [CrossRef]
  29. Guais, A.; Brand, G.; Jacquot, L.; Karrer, M.; Dukan, S.; Grévillot, G.; Molina, T.J.; Bonte, J.; Regnier, M.; Schwartz, L. Toxicity of Carbon Dioxide: A Review. Chem. Res. Toxicol. 2011, 24, 2061–2070. [Google Scholar] [CrossRef]
  30. Mishra, A.K.; Schiavon, S.; Wargocki, P.; Tham, K.W. Respiratory Performance of Humans Exposed to Moderate Levels of Carbon Dioxide. Indoor Air 2021, 31, 1540–1552. [Google Scholar] [CrossRef]
  31. Oh, G.S.; Jung, G.-S.; Im, G.-J. Impact of Indoor CO2 Concentration on Work Performance. Korean Soc. Archit. 2010, 30, 385–386. [Google Scholar]
  32. Lim, W.C. Literature Review of the Effect of the Carbon Dioxide Concentration in Classroom Air on the Students’ Learning Performance. Korean J. Environ. Educ. 2015, 28, 134–145. [Google Scholar]
  33. Robertson, D.S. Health Effects of Increase in Concentration of Carbon Dioxide in the Atmosphere. Curr. Sci. 2006, 90, 1607–1609. [Google Scholar]
  34. Azuma, K.; Kagi, N.; Yanagi, U.; Osawa, H. Effects of Low-Level Inhalation Exposure to Carbon Dioxide in Indoor Environments: A Short Review on Human Health and Psychomotor Performance. Environ. Int. 2018, 121, 51–56. [Google Scholar] [CrossRef]
  35. Allen, R.W.; Barn, P. Individual—And Household-Level Interventions to Reduce Air Pollution Exposures and Health Risks: A Review of the Recent Literature. Curr. Environ. Health Rep. 2020, 7, 424–440. [Google Scholar] [CrossRef]
  36. Mousavi, E.S.; Godri Pollitt, K.J.; Sherman, J.; Martinello, R.A. Performance Analysis of Portable HEPA Filters and Temporary Plastic Anterooms on the Spread of Surrogate Coronavirus. Build. Environ. 2020, 183, 107186. [Google Scholar] [CrossRef] [PubMed]
  37. Azimi, P.; Zhao, D.; Stephens, B. Estimates of HVAC Filtration Efficiency for Fine and Ultrafine Particles of Outdoor Origin. Atmos Environ. 2014, 98, 337–346. [Google Scholar] [CrossRef]
  38. Lin, J.; Pai, J.Y.; Chen, C.C. Applied Patent RFID Systems for Building Reacting HEPA Air Ventilation System in Hospital Operation Rooms. J. Med. Syst. 2012, 36, 3399–3405. [Google Scholar] [CrossRef] [PubMed]
  39. Lowther, S.D.; Deng, W.; Fang, Z.; Booker, D.; Whyatt, D.J.; Wild, O.; Wang, X.; Jones, K.C. How Efficiently Can HEPA Purifiers Remove Priority Fine and Ultrafine Particles from Indoor Air? Environ. Int. 2020, 144, 106001. [Google Scholar] [CrossRef]
  40. Park, B.; Cho, J.; Oh, B. A Study on Performance Status and Test Standard of Heat Recovery Ventilator. Korean J. Air-Cond. Refrig. Eng. 2022, 34, 145–153. [Google Scholar] [CrossRef]
  41. Ministry of Land, Infrastructure and Transport (MOLIT). Rules on Building Equipment Standards, Etc. Ordinance No. 1375, Article 11, Republic of Korea. 2006. Available online: https://www.law.go.kr/main.html (accessed on 12 May 2025).
  42. Schulze, T.; Eicker, U. Controlled Natural Ventilation for Energy Efficient Buildings. Energy Build. 2013, 56, 221–232. [Google Scholar] [CrossRef]
  43. Song, K.H. Magazine of the SAREK; SAREK: Seoul, Republic of Korea, 2022; pp. 221–232. [Google Scholar]
  44. Ganserer, A.; Gregory, T.; Zierahn, U. Minimum Wages and the Rise in Solo Self-Employment Minimum Wages and the Rise in Solo Self-Employment; IZA: Bonn, Germany, 2022. [Google Scholar]
  45. Heo, S.Y.; Jang, H.E.; Lee, J.H. Exploring the Government Policy for Promoting University Startups in Korea. J. Korea Acad.-Ind. Coop. Soc. 2017, 18, 75–84. [Google Scholar] [CrossRef]
  46. Kim, S.U.; Kim, S.H. Assessment of Indoor Air Quality and Energy Consumption in Office Buildings According to the Automatic Control Method of Ventilation Systems. Korean Soc. Archit. 2008, 24, 211–218. [Google Scholar]
  47. Ministry of Environment (MOE), Republic of Korea. Enforcement Rules of the Indoor Air Quality Control Act, Article 5 (Mandatory Standards for Maintaining Indoor Air Quality). 2022. Available online: https://www.law.go.kr/LSW/eng/engLsSc.do?menuId=2&query=Indoor%20Air%20Quality%20Control%20Act (accessed on 12 May 2025).
  48. Liu, W.; Zhong, W.; Wargocki, P. Performance, Acute Health Symptoms and Physiological Responses during Exposure to High Air Temperature and Carbon Dioxide Concentration. Build. Environ. 2017, 114, 96–105. [Google Scholar] [CrossRef]
  49. Bierwirth, P. Carbon Dioxide Toxicity and Climate Change: A Serious Unapprehended Risk for Human Health; Australian National University: Canberra, Australia, 2019. [Google Scholar] [CrossRef]
  50. Oropeza-Perez, I.; Østergaard, P.A. The Influence of an Estimated Energy Saving Due to Natural Ventilation on the Mexican Energy System. Energy 2014, 64, 1080–1091. [Google Scholar] [CrossRef]
  51. Cuce, E.; Sher, F.; Sadiq, H.; Cuce, P.M.; Guclu, T.; Besir, A.B. Sustainable Ventilation Strategies in Buildings: CFD Research. Sustain. Energy Technol. Assess. 2019, 36, 100540. [Google Scholar] [CrossRef]
  52. Omer, A.M. Energy, Environment and Sustainable Development. Renew. Sustain. Energy Rev. 2008, 12, 2265–2300. [Google Scholar] [CrossRef]
  53. Awbi, H.B. Ventilation and Air Distribution Systems in Buildings. Front. Mech. Eng. 2015, 1, 4. [Google Scholar] [CrossRef]
  54. Roaf, S. Innovative Approaches to the Natural Ventilation of Buildings: The Imperative for Change. Archit. Sci. Rev. 2012, 55, 1–3. [Google Scholar] [CrossRef]
  55. IPCC. Climate Change 2022: Mitigation of Climate Change. Contribution of Working Group III to the Sixth Assessment Report of the Intergovernmental Panel on Climate Change; Cambridge University Press: Cambridge, UK; New York, NY, USA, 2022. [Google Scholar]
  56. UNEP. 2022 Global Status Report for Buildings and Construction: Towards a Zero-Emission, Efficient and Resilient Buildings and Construction Sector; United Nations Environment Programme: Nairobi, Kenya, 2022. [Google Scholar]
  57. Etheridge, D. Natural Ventilation of Buildings Theory Measurement and Design. Int. J. Vent. 2012, 10, 405–406. [Google Scholar] [CrossRef]
  58. Zaniboni, L.; Albatici, R. Natural and Mechanical Ventilation Concepts for Indoor Comfort and Well-Being with a Sustainable Design Perspective: A Systematic Review. Buildings 2022, 12, 1983. [Google Scholar] [CrossRef]
  59. Gil-Baez, M.; Barrios-Padura, Á.; Molina-Huelva, M.; Chacartegui, R. Natural Ventilation Systems in 21st-Century for near Zero Energy School Buildings. Energy 2017, 137, 1186–1200. [Google Scholar] [CrossRef]
  60. World Health Organization WHO. Air Quality Guidelines for Particulate Matter, Ozone, Nitrogen Dioxide and Sulfur Dioxide; WHO: Geneva, Switzerland, 2006.
  61. ASHRAE. Guideline 14—Measurement of Energy, Demand, and Water Savings; ASHRAE: Peachtree Corners, GA, USA, 2014. [Google Scholar]
  62. Kwon, S.H.; Lee, S.C.; Kim, S.W. A Robust Item Recommendation Technique Based on Message Passing. Soc. Inf. Sci. 2012, 39, 166–171. [Google Scholar]
  63. National Institute of Environmental Research. Annual Report of Air Quality in Korea 2020; NIER: Incheon, Republic of Korea, 2021. [Google Scholar]
  64. Yun, H.S.; Um, M.J.; Cho, W.C.; Heo, J.H. Orographic Precipitation Analysis with Regional Frequency Analysis and Multiple Linear Regression. J. Korea Water Resour. Assoc. 2009, 42, 465–480. [Google Scholar] [CrossRef]
  65. Larsen, T.S.; Heiselberg, P. Single-Sided Natural Ventilation Driven by Wind Pressure and Temperature Difference. Energy Build. 2008, 40, 1031–1040. [Google Scholar] [CrossRef]
Figure 1. Annual PM2.5 concentration in major cities around the world.
Sustainability 17 04961 g001
Figure 2. (a) Overall view of the experimental space; (b) door; (c) window.
Sustainability 17 04961 g002
Figure 3. (a) Floor plan of the building under experiment; (b) floor plan and measurement points for the space under experiment.
Sustainability 17 04961 g003
Figure 4. Conceptual diagram of an equation based on the mass balance equation.
Sustainability 17 04961 g004
Figure 5. Comparison of Experiment 1 and simulation results.
Sustainability 17 04961 g005
Figure 6. Comparison of Experiment 2 and simulation results.
Sustainability 17 04961 g006
Figure 7. Appropriate ventilation methods for each case.
Sustainability 17 04961 g007
Figure 8. Database regression analysis results.
Sustainability 17 04961 g008
Table 1. Standards for indoor air pollutants: domestic and international.
South KoreaJapanHong KongSingaporeWHO
Facility TypeOfficeOfficeOfficeOfficeIndoor
Fine dust (µg/m3)150150180150-
CO2 (ppm)1000100010001000-
Formaldehyde (µg/m3)120100100120100
Airborne bacteria(CFU/m3)800-100500-
CO (ppm)10108.7910
VOCs (CFU/m3)500-600300
Table 2. Office information.
Architectural
Specifications
Dimensional ParametersAdditional Information
ConstructionReinforced concreteCompletion year 2021
Floor area26.8 m2-
Ceiling height2.7 m-
Volume72.36 m3Actual volume excluding the volume occupied by the furniture, 65.124 m3
Door area1.91 m2The door on the north wall opens and closes inward
Window effective open area0.324 m2Awning window on the south wall
Window area ratio1.21%-
Table 3. Measurement locations and elements.
Measurement Height [cm]ABCHallDoorWindowOut
50CO2, PM2.5CO2, PM2.5PM2.5
120CO2CO2
160PM2.5PM2.5PM2.5CO2, PM2.5
190CO2CO2
- Wind speedWind speedCO2, PM2.5
Table 4. Experiment schedule.
ExperimentTime [Hour:Min]Number of OccupantsDoor VentilationWindow Ventilation
109:00~09:501CloseClose
09:50~10:001OpenClose
10:00~10:501CloseClose
10:50~11:001OpenClose
11:00~11:501CloseClose
11:50~12:001OpenClose
12:00~13:000CloseClose
13:00~13:502CloseClose
13:50~14:002CloseOpen
14:00~14:501CloseClose
14:50~15:001OpenClose
15:00~15:502CloseClose
15:50~16:002CloseOpen
16:00~16:501CloseClose
16:50~17:001OpenClose
17:00~17:502CloseClose
17:50~18:002CloseOpen
209:00~09:501CloseClose
09:50~10:001CloseOpen
10:00~11:502CloseClose
11:50~12:002CloseOpen
12:00~13:000CloseOpen
13:00~13:502CloseClose
13:50~14:002OpenOpen
14:00~14:501CloseClose
14:50~15:001OpenOpen
15:00~15:501CloseClose
15:50~16:001OpenOpen
16:00~17:502CloseClose
17:50~18:002OpenOpen
Table 5. Appropriate natural ventilation time for various natural ventilation methods.
CaseNumber of OccupantsVentilation MethodTime
Interval [h]
Residence
Time [min]
Ventilation
Time [min]
11Door1573
2Window573
3Door + Window582
4Door21137
5Window1146
6Door + Window1173
72Door15010
8Window519
9Door + Window555
10Door28337
11Window8436
12Door + Window9228
Table 6. Database generated from simulation results.
Number of
Occupants
Volume
[m3]
DoorWindowDoor + Window
Residence Time [min]Ventilation Time [min]Residence Time [min]Ventilation Time [min]Residence Time [min]Ventilation Time [min]
158.5358.11.958.21.859.10.9
1.558.5354.85.255.24.857.42.6
258.5350.99.151.68.455.54.5
2.558.5346.413.647.312.752.97.1
358.5341.418.942.517.549.410.6
187.7959.90.159.90.159.90.1
1.587.7958.11.958.21.859.10.9
287.7955.94.156.23.858.02.0
2.587.7953.66.454.06.056.83.2
387.7950.99.151.68.455.54.5
1117.0660.00.060.00.060.00.0
1.5117.0659.70.359.70.359.80.2
2117.0658.11.958.21.859.10.9
2.5117.0656.53.556.73.358.31.7
3117.0654.75.355.14.957.42.6
1146.3360.00.060.00.060.00.0
1.5146.3359.90.159.90.159.90.1
2146.3359.40.659.40.659.70.3
2.5146.3358.11.958.21.859.10.9
3146.3356.83.257.030.58.41.6
1175.5960.00.060.00.060.00.0
1.5175.5960.00.060.00.060.00.0
2175.5959.90.159.90.159.90.1
2.5175.5959.20.859.20.859.60.4
3175.5958.11.9581.859.01.0
Table 7. First- and second-order correlation constants and standard deviation σ .
Ventilation
Method
T = C n n + C V V + C T = C 1 n + C 2 n 2 + C 3 n V + C 4 V + C 5 n 5 + C 6
C n C V C σ C 1 C 2 C 3 C 4 C 5 C 6 σ
Door3.66−0.073534.884140.0747.3090.8857−0.06144−0.160.0008944.32114.781
Window3.4−0.068064.52119.5636.8320.8−0.5665−0.14850.0008273.7712.895
Door + Window1.924−0.038412.49646.2233.6690.5657−0.03424−0.087090.00052.466.866
Disclaimer/Publisher’s Note: The statements, opinions and data contained in all publications are solely those of the individual author(s) and contributor(s) and not of MDPI and/or the editor(s). MDPI and/or the editor(s) disclaim responsibility for any injury to people or property resulting from any ideas, methods, instructions or products referred to in the content.

