
How Does the Digital Ecosystem Foster New Quality Productive Forces? A Dynamic QCA of Sustainable Development Pathways in China


Abstract
1. Introduction
2. Literature Review and Theoretical Framework
2.1. Digital Ecosystem and NQPFs
2.2. WSR Systems Methodology
2.3. Theoretical Framework
2.3.1. Wuli (Physics) Dimension
2.3.2. Shili (Methodology) Dimension
2.3.3. Renli (Humanity) Dimension
3. Methodology
3.1. Research Method
3.2. Research Samples and Data Collection
3.3. Measurement and Calibration
3.3.1. Outcome Variable: NQPF Development
3.3.2. Condition Variables
3.3.3. Calibration
4. Results
4.1. Necessity Analysis of Single Conditions
4.1.1. NCA Results
4.1.2. QCA Results
4.2. Sufficiency Analysis of Conditional Groupings
4.2.1. Aggregated Results
- (1)
- Application-Oriented Comprehensive WSR-Driven Configuration
- (2)
- Innovation-Oriented WR-Driven Configuration
- (3)
- Talent-Supported WS-Driven Configuration
- (4)
- Infrastructure-Supported WS-Driven Configuration
4.2.2. Inter-Group Results
4.2.3. Intra-Group Results
4.2.4. Configuration of Non-High NQPF Development
4.3. Robust Analysis
5. Conclusions and Implications
5.1. Conclusions
- Does any core element constitute a necessary condition for enhancing NQPF development? Necessity analysis via NCA and QCA confirms that none of the five conditions—digital infrastructure, digital security, digital application, digital talent, and digital innovation—serves as a single necessary condition.
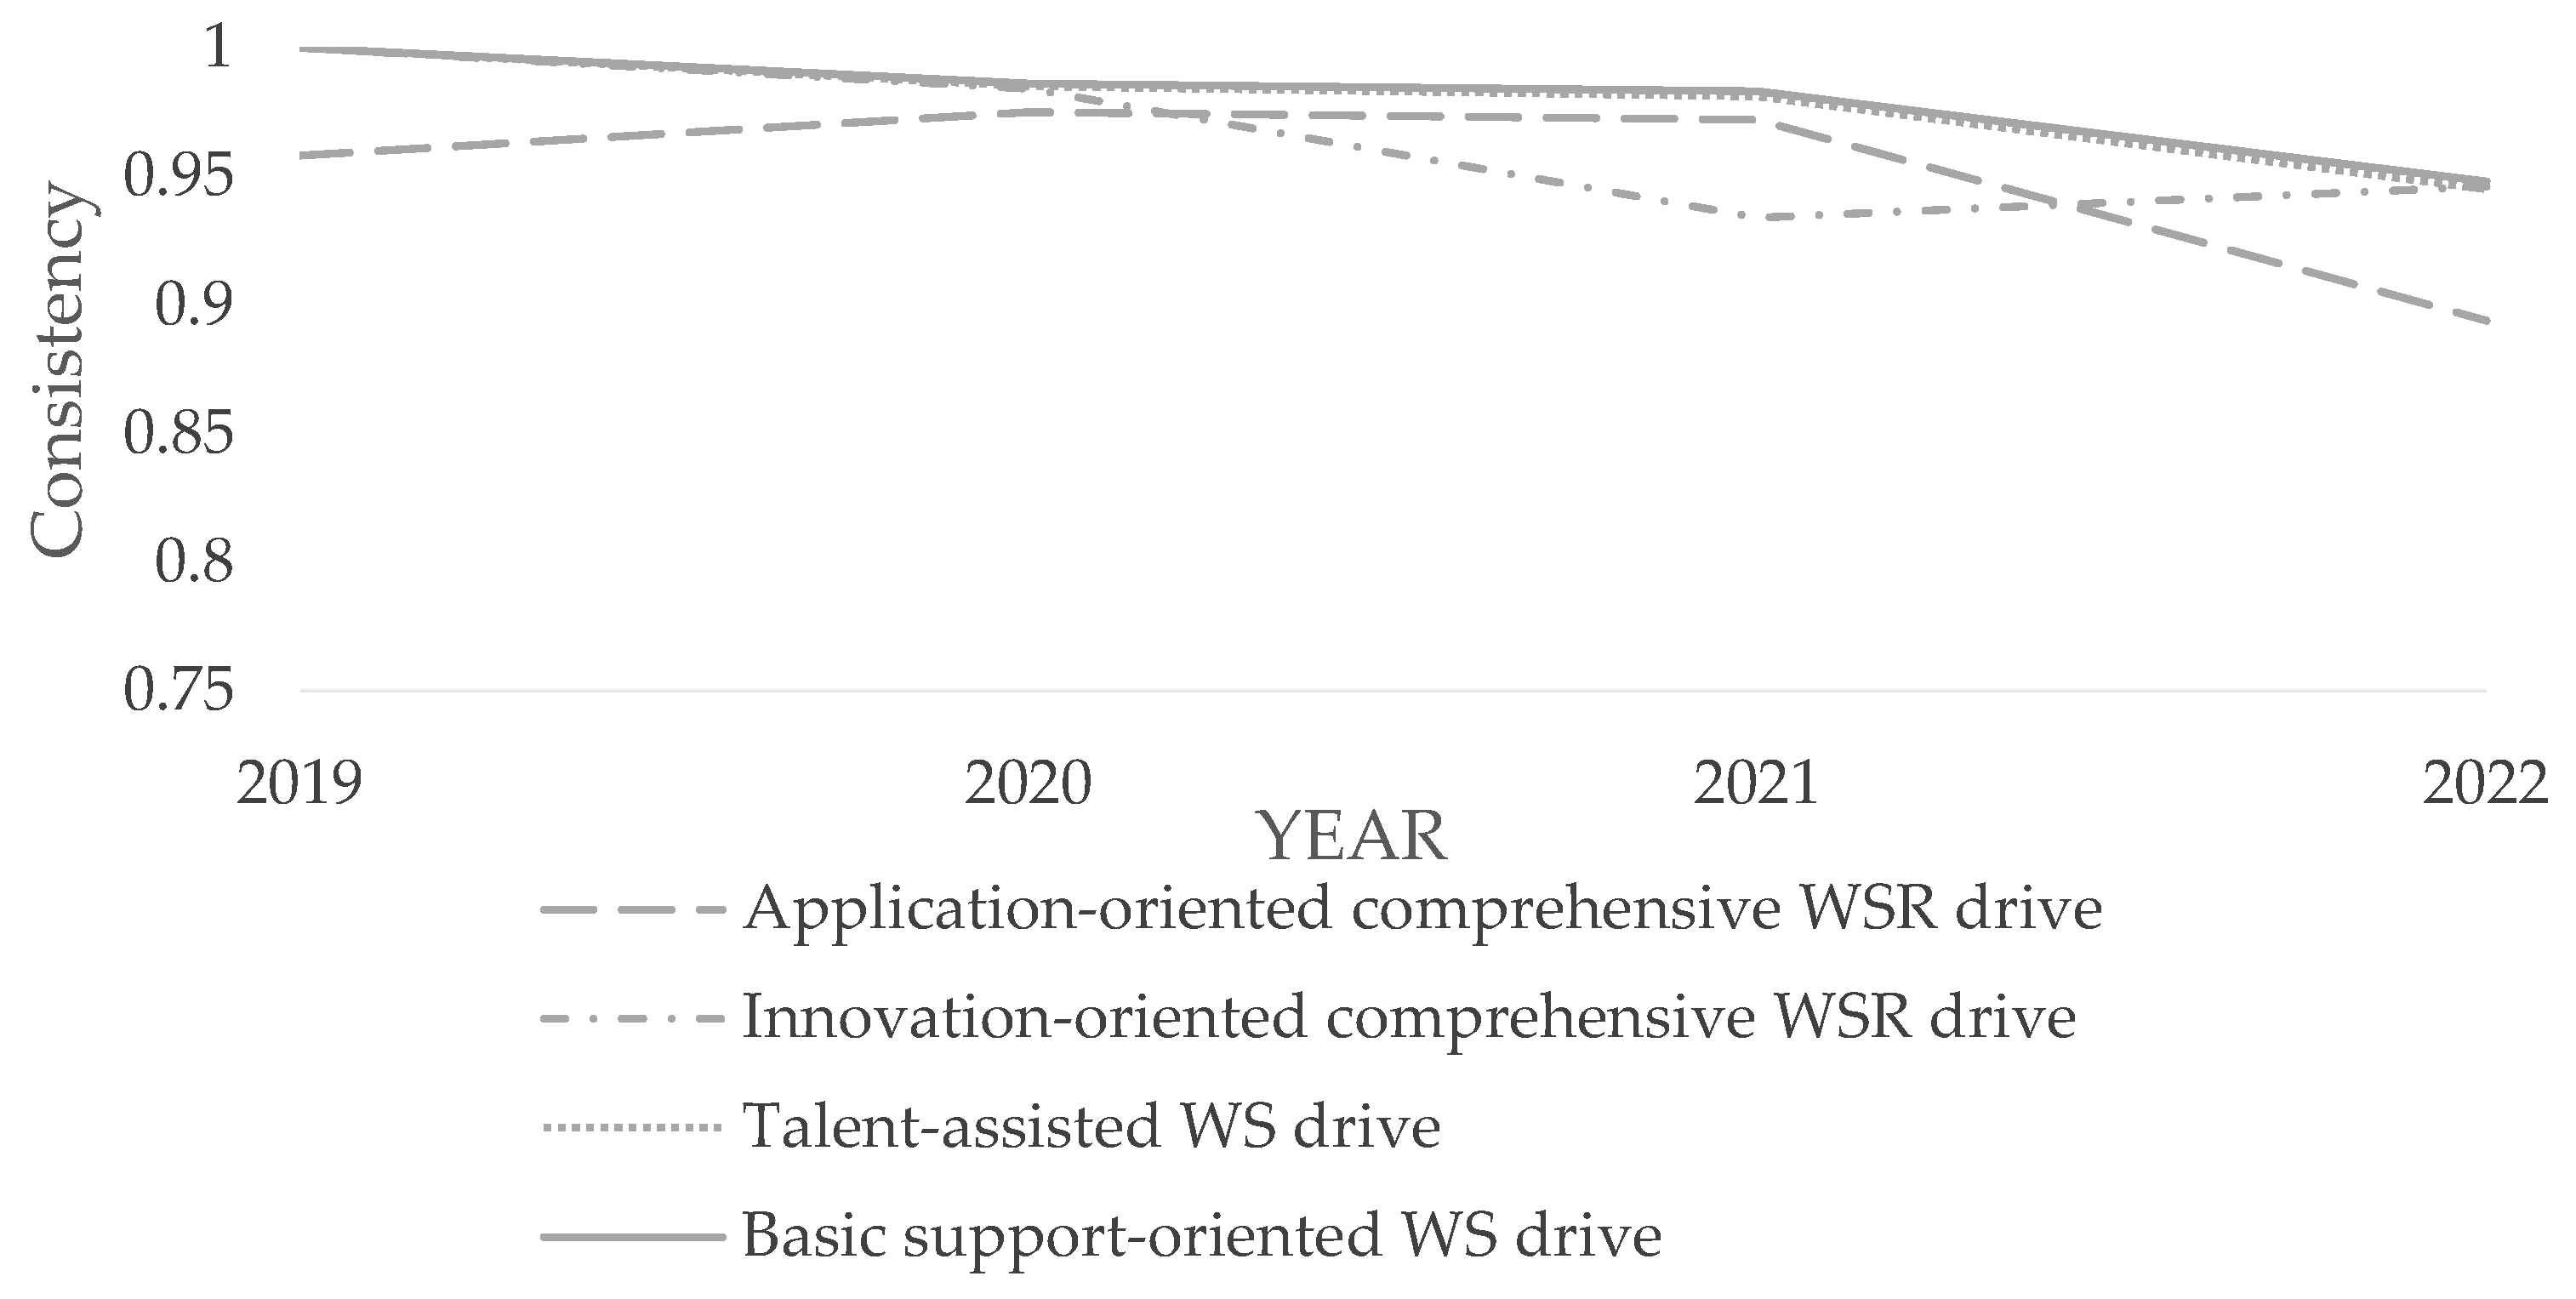
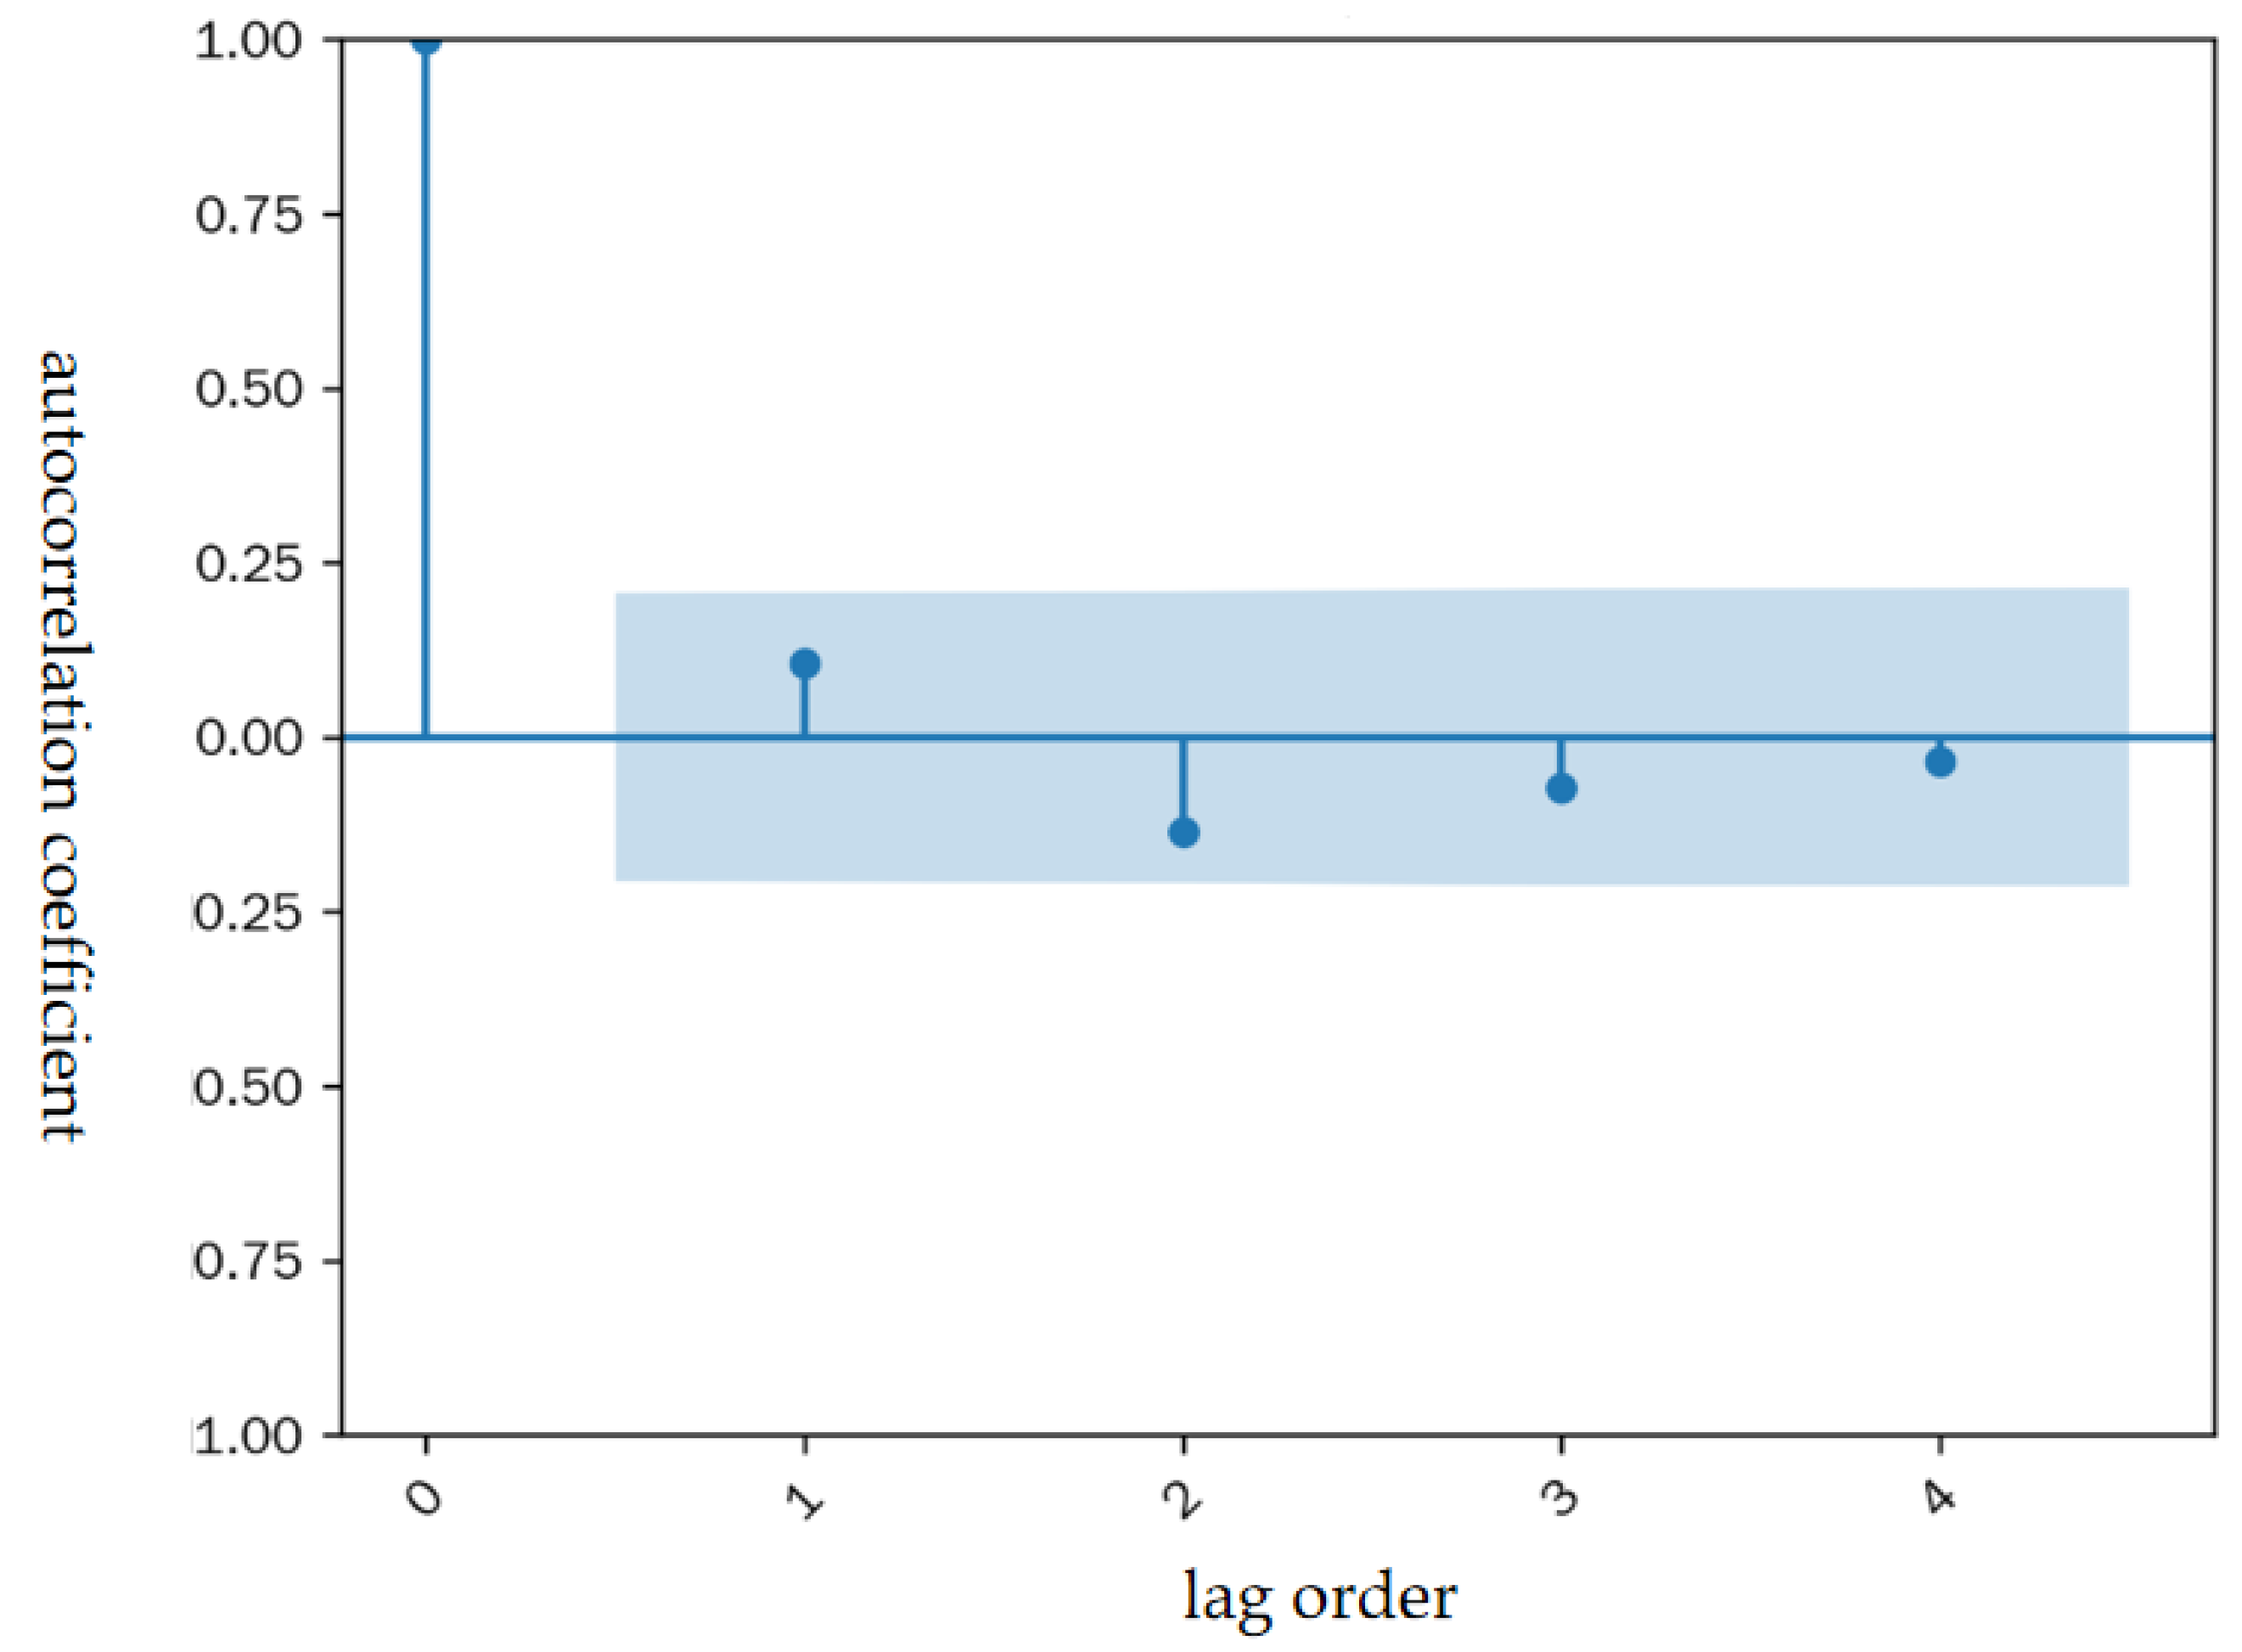
- Do temporal effects characterize the influence of mechanisms? Overall consistency did not exhibit a significant temporal effect. This indicates that the mechanism through which digital ecosystems drive NQPFs exhibits cross-period stability, unaffected by short-term policy shocks or technological disruptions.
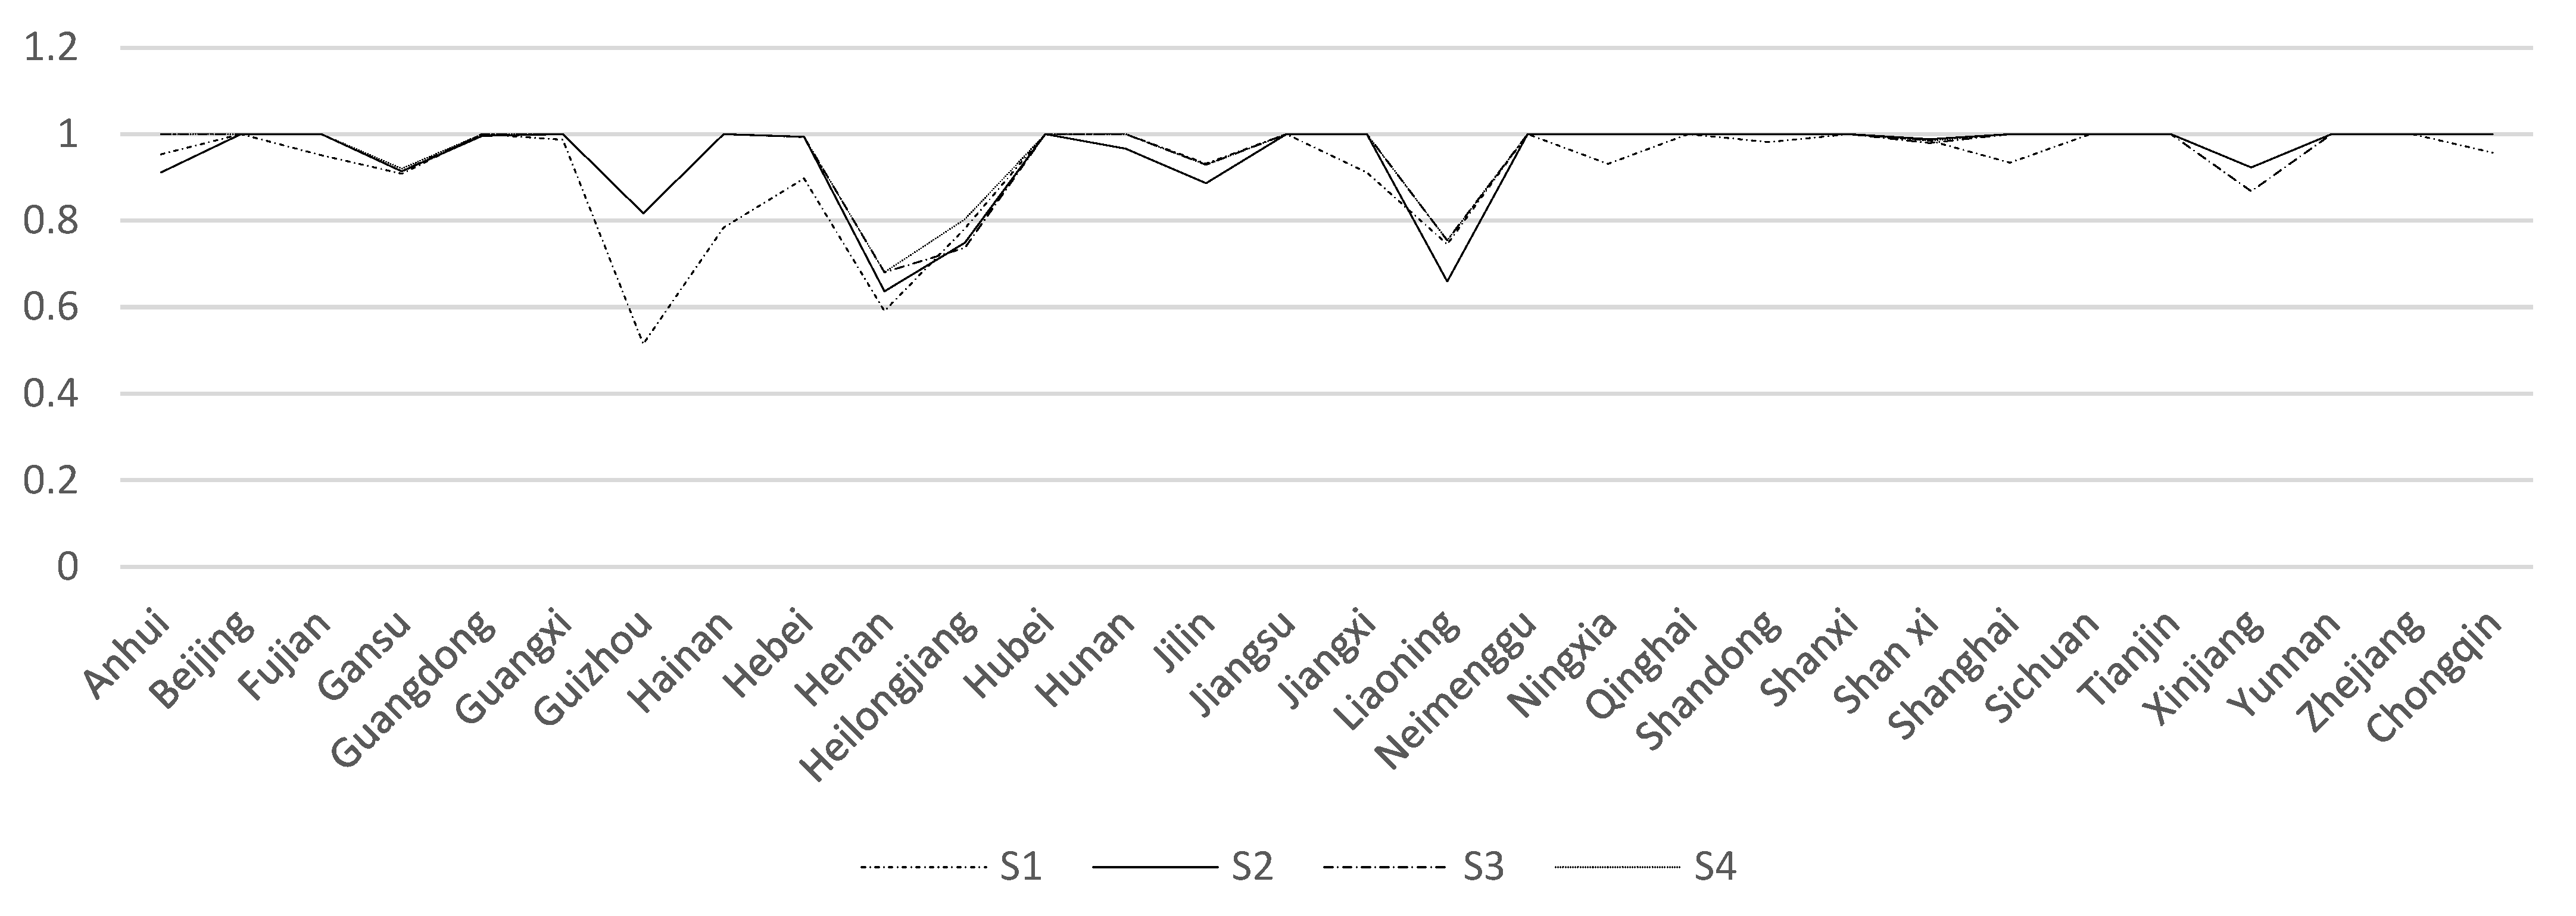
- What spatial heterogeneities exist in developmental pathways across regions, and what latent factors underlie such disparities? Kruskal–Wallis H tests (Table 8) demonstrate pronounced regional disparities. Intra-group consistency trends (Figure 6) reveal notable regional differences in configuration performance. All the configurations demonstrate their highest coverage in eastern regions (Table 9). These differences correlate with regional variations in digital infrastructure maturity, innovation ecosystem completeness, and talent agglomeration, underscoring the need for context-specific strategies.
- Application-oriented comprehensive WSR-driven configuration (S1). This pathway centers on the triad of digital infrastructure (Wuli), digital applications (Shili), and digital talent (Renli), where technological adoption and human capital act as joint drivers. By integrating foundational infrastructure (e.g., Shanghai’s AI computing platforms) with user-centric applications (e.g., One-Network Governance systems) and skilled labor, it transforms technical potential into tangible productivity gains. Unlike single-factor studies, this configuration demonstrates that infrastructure alone cannot drive NQPFs; its impact is amplified through seamless alignment with talent capabilities and real-world application scenarios.
- Innovation-oriented WR-driven configuration (S2). Anchored in digital infrastructure (Wuli), digital innovation (Renli), and digital talent (Renli), with digital security (Wuli) as a critical enabler, this pathway prioritizes risk-managed innovation. Such regions as Shandong leverage policy-supported infrastructure upgrades (e.g., 5G networks) alongside cybersecurity frameworks to foster an ecosystem where talent-driven creativity (e.g., Mount Tai Cup competitions) and secure data flows coexist. Here, digital security is not a standalone requirement but a complementary condition that unlocks innovation’s full potential, illustrating the interdependence of the Wuli and Renli dimensions.
- Talent-supported WS-driven configuration (S3). This pathway centers on a Wuli (security)–Shili (application) core engine, complemented by peripheral Renli (talent/innovation) to form a closed “security–compliance–application–adoption–talent–adaptation” loop. For instance, Jiangsu ensures secure data environments through regulatory measures, activates cross-border trade and green finance applications via digital RMB pilots, and cultivates industry-compatible talent through the Digital Craftsman initiative. Unlike comprehensive WSR paths requiring balanced development across all dimensions, S3 demonstrates that moderate Renli endowments (talent/innovation) can catalytically amplify a strong security–application core, making it viable for regions with medium talent reserves to achieve productivity gains through scenario-driven innovation and regulatory compliance.
- Infrastructure-supported WS-driven configuration (S4). This pathway relies on a Wuli (security)–Shili (application) core, supported by peripheral Wuli (infrastructure) and Renli (innovation) to create an “infrastructure–foundation–security–escort–application–penetration” progression. For example, Anhui strengthens the foundation of digital infrastructure (consolidates digital infrastructure) through province-wide government cloud platforms, advances One-Network Governance applications under secure network environments, and stimulates digital technology adoption in cultural industries via regional innovation competitions. Unlike S3’s talent-focused supplementation, S4 leverages infrastructure scale effects, making it suitable for regions with nascent infrastructure but moderate talent resources to enhance productivity through secure, application-driven incremental improvements.
5.2. Implications
- For regions characterized by the application-oriented comprehensive WSR-driven configuration (S1) (e.g., Shanghai, Guangdong), efforts should focus on deepening the integration of digital application scenarios and talent cultivation. Building industry-level digital platforms (e.g., industrial Internet, smart city hubs) can accelerate technology translation, while refining “data elements × talent” collaboration mechanisms creates a closed-loop ecosystem of “infrastructure foundation–application implementation–talent value” conversion.
- Regions with potential for the innovation-oriented comprehensive WSR-driven configuration (S2) (e.g., Shandong, Zhejiang) need to synchronize upgrades to digital innovation ecosystems and security systems. Policymakers should adopt a portfolio of “innovation tolerance–security sandbox–achievement transformation”, strengthening R&D in frontier technologies such as blockchain and AI while constructing a hierarchical digital security governance framework to balance innovative vitality and systemic stability.
- Areas at the talent-assisted WS-driven configuration stage (S3) (e.g., Jiangsu, Hubei) must prioritize digital talent agglomeration, complemented by policies enabling secure data circulation and application empowerment. Initiatives such as establishing digital economy industrial parks and talent-specific funds can attract “technology management” composite talents, while breaking down institutional barriers to data sharing unleashes the multiplicative effect of data elements on productivity.
- Midwestern regions relying on the infrastructure-assisted WS-driven configuration (S4) (e.g., Anhui, Chongqing) should first consolidate their digital infrastructure foundation, focusing on new infrastructure such as 5G base stations and computing power centers. Simultaneously advancing digital security compliance systems and localized application innovation creates a pathway of “infrastructure gap-filling–security capacity-building–application scenario incubation” for leapfrog NQPF development.
5.3. Limitations and Prospects
Author Contributions
Funding
Institutional Review Board Statement
Informed Consent Statement
Data Availability Statement
Conflicts of Interest
Abbreviations
| NQPF | New quality productive forces |
| WSR | Wuli–Shili–Renli (physics–methodology–humanity) |
References
- Xiao, W.; Kong, H.; Shi, L.; Boamah, V.; Tang, D. The Impact of Innovation-Driven Strategy on High-Quality Economic Development: Evidence from China. Sustainability 2022, 14, 4212. [Google Scholar] [CrossRef]
- Liu, Y.; He, Z. Synergistic Industrial Agglomeration, New Quality Productive Forces and High-Quality Development of the Manufacturing Industry. Int. Rev. Econ. Financ. 2024, 94, 103373. [Google Scholar] [CrossRef]
- Lv, K.; Zhu, S.; Liang, R.; Zhao, Y. Environmental Regulation, Breakthrough Technological Innovation and Total Factor Productivity of Firms: Evidence from Emission Charges of China. Appl. Econ. 2023, 56, 1235–1249. [Google Scholar] [CrossRef]
- Jia, X. Digital Economy, Factor Allocation, and Sustainable Agricultural Development: The Perspective of Labor and Capital Misallocation. Sustainability 2023, 15, 4418. [Google Scholar] [CrossRef]
- Chen, S.; Jefferson, G.H.; Zhang, J. Structural Change, Productivity Growth and Industrial Transformation in China. China Econ. Rev. 2011, 22, 133–150. [Google Scholar] [CrossRef]
- Lin, L.; Gu, T.; Shi, Y. The Influence of New Quality Productive Forces on High-Quality Agricultural Development in China: Mechanisms and Empirical Testing. Agriculture 2024, 14, 1022. [Google Scholar] [CrossRef]
- Márton, A. Steps toward a Digital Ecology: Ecological Principles for the Study of Digital Ecosystems. J. Inf. Technol. 2022, 37, 250–265. [Google Scholar] [CrossRef]
- Xu, R.; Yao, H.; Li, J. Digital Economy’s Impact on High-Quality Economic Growth: A Comprehensive Analysis in the Context of China. J. Knowl. Econ. 2024, 16, 2861–2879. [Google Scholar] [CrossRef]
- Yao, L.; Li, A.; Yan, E. Research on Digital Infrastructure Construction Empowering New Quality Productivity. Sci. Rep. 2025, 15, 6645. [Google Scholar] [CrossRef]
- Tang, J.; Zhao, X. Does the New Digital Infrastructure Improve Total Factor Productivity? Bull. Econ. Res. 2023, 75, 895–916. [Google Scholar] [CrossRef]
- Luo, G.Q.; Song, X.Y. Institutional Configuration of Digital Ecology Empowering the Cultivation of New Agricultural Productive Forces: Based on Necessary Condition Analysis and Dynamic Qualitative Comparative Analysis. China Bus. Mark. 2025, 39, 115–126. [Google Scholar] [CrossRef]
- Wen, R.; Li, Y.; Zhang, J. The Empowerment of Agricultural New Quality Productive Forces by Digital Economy: Theoretical Mechanisms and Empirical Verification. Chin. J. Eco-Agric. 2025, 33, 1–14. [Google Scholar] [CrossRef]
- Gu, J.; Zhu, Z. Knowing Wuli, Sensing Shili, Caring for Renli: Methodology of the WSR Approach. Syst. Pract. Action Res. 2000, 13, 11–20. [Google Scholar] [CrossRef]
- Wang, J.; Zhang, Y.; Huang, J. Calculation and Analysis of China’s Digital Ecology Index. E-Government 2022, 4–16. [Google Scholar] [CrossRef]
- Yan, X.N.; Liu, C. Digital Ecosystem, Contract and Competitive Environment. Stud. Social. Chin. Charact. 2024, 53–63. [Google Scholar]
- National Engineering Laboratory for Big Data Analysis and Application Technology, Peking University. Digital Ecology Index (2020–2023); National Engineering Laboratory for Big Data Analysis and Application Technology, Peking University: Beijing, China, 2024. [Google Scholar]
- Zhang, B.; Li, L. “Data Element×”Driving New Quality Productive Forces: Intrinsic Logic and Implementation Path. Contemp. Econ. Manag. 2024, 46, 1–10. [Google Scholar] [CrossRef]
- Song, A.K. The Digital Entrepreneurial Ecosystem—A Critique and Reconfiguration. Small Bus. Econ. 2019, 53, 569–590. [Google Scholar] [CrossRef]
- Wang, C.; Zhang, G. Examining the Moderating Effect of Technology Spillovers Embedded in the Intra- and Inter-Regional Collaborative Innovation Networks of China. Scientometrics 2019, 119, 561–593. [Google Scholar] [CrossRef]
- Barns, S.; Cosgrave, E.; Acuto, M.; McNeill, D. Digital Infrastructures and Urban Governance. Urban Policy Res. 2017, 35, 20–31. [Google Scholar] [CrossRef]
- Huang, Q.; Xu, C.; Xue, X.; Zhu, H. Can Digital Innovation Improve Firm Performance: Evidence from Digital Patents of Chinese Listed Firms. Int. Rev. Financ. Anal. 2023, 89, 102810. [Google Scholar] [CrossRef]
- Zheng, M.; Yan, S.; Xu, S. Digital Economy, Industry–Academia–Research Collaborative Innovation, and the Development of New-Quality Productive Forces. Sustainability 2025, 17, 318. [Google Scholar] [CrossRef]
- Beverungen, D.; Hess, T.; Köster, A.; Lehrer, C. From Private Digital Platforms to Public Data Spaces: Implications for the Digital Transformation. Electron. Mark. 2022, 32, 493–501. [Google Scholar] [CrossRef]
- Xu, Y.; Wang, R.; Zhang, S. Digital Economy, Green Innovation Efficiency, and New Quality Productive Forces: Empirical Evidence from Chinese Provincial Panel Data. Sustainability 2025, 17, 633. [Google Scholar] [CrossRef]
- Zhu, Z. Dealing with a Differentiated Whole: The Philosophy of the WSR Approach. Syst. Pract. Action Res. 2000, 13, 21–57. [Google Scholar] [CrossRef]
- Hu, H.; Qin, X.; Liu, F. The Multiple Driving Mechanisms of Entrepreneurial Quality in Digital Ecology: A Dynamic QCA Analysis Based on the Provincial Panel Data. Sci. Technol. Prog. Policy 2024, 1–12. Available online: https://kns.cnki.net/kcms2/article/abstract?v=N2LrlypoGYWwSFC1Syuf-qo8osBNVwavOrAH-lcD2HrHygzHX7-VkqVxoBkCl9d49x31uowoH2qAWrZIjpcbajgYtLorUds3EH4wOVw8R2tKTvwlosNTl6klG_opFqarz_ke5g93VwkrxZ8FXONTmNu9zbXSLWkyIwP97cFcNC13yriGBkv7tQ==&uniplatform=NZKPT&language=CHS (accessed on 16 March 2025).
- Zhang, M.; Wang, D.; Zeng, N. How to Become a Sturdy Grass Withstanding Strong Wind?—A Study on the Antecedent Configurations of Entrepreneurial Ecosystem Resilience Based on WSR Methodology. Manag. Rev. 2023, 35, 89–102. [Google Scholar] [CrossRef]
- Kou, X.; Gu, J. A Twenty-Five-Year Review of WSR Methodology: Origin, Connotation, Comparison and Outlook. Manag. Rev. 2021, 33, 3–14. [Google Scholar] [CrossRef]
- Wang, F.; Liu, X. Industrial Digitalization, Virtual Agglomeration and Development of New Quality Productive Forces: A Spatial Spillover Effect Analysis of 30 Provinces in China. Sci. Technol. Prog. Policy 2025, 42, 13–24. [Google Scholar] [CrossRef]
- Dai, W.; Lin, X. What Combination of Environmental Factors Favors Achieving High Regional Innovation Efficiency: An Exploration Based on the Wuli-Shili-Renli Systems Approach. Sci. Technol. Prog. Policy 2024, 41, 52–62. [Google Scholar] [CrossRef]
- Cao, Y.; Dai, S. Understanding and Evaluating New Quality Productive Forces in China: Based on Machine Learning. Appl. Econ. Lett. 2025, 1–7. [Google Scholar] [CrossRef]
- Guangqin, L.I.; Mengjiao, L.I. Provincial-Level New Quality Productive Forces in China: Evaluation, Spatial Pattern and Evolution Characteristics. Econ. Geogr. 2024, 44, 116–125. [Google Scholar] [CrossRef]
- Henfridsson, O.; Bygstad, B. The Generative Mechanisms of Digital Infrastructure Evolution. MIS Q. 2013, 37, 907–931. Available online: https://www.jstor.org/stable/43826006 (accessed on 16 March 2025). [CrossRef]
- Schneier, B. Secrets and Lies: Digital Security in a Networked World, 1st ed.; John Wiley & Sons: Hoboken, NJ, USA, 2015. [Google Scholar] [CrossRef]
- Mergel, I. Digital Service Teams in Government. Gov. Inf. Q. 2019, 36, 101389. [Google Scholar] [CrossRef]
- Schade, P.; Schuhmacher, M.C. Digital Infrastructure and Entrepreneurial Action-Formation: A Multilevel Study. J. Bus. Ventur. 2022, 37, 106232. [Google Scholar] [CrossRef]
- Zhou, W.; Wang, Y.; Chen, L. Research on the Driving Mode of Digital Economy Empowering Regional New Quality Productivity from the Perspective of Configuration. J. Yunnan Univ. Financ. Econ. 2025, 41, 69–79. [Google Scholar] [CrossRef]
- Ghazawneh, A.; Henfridsson, O. A Paradigmatic Analysis of Digital Application Marketplaces. J. Inf. Technol. 2015, 30, 198–208. [Google Scholar] [CrossRef]
- Gu, J.F.; Zhao, M.H.; Zhang, L.L. From Theory to Practice: Further Exploration of Human Rationality. Manag. Rev. 2021, 33, 57–63. [Google Scholar] [CrossRef]
- Bandura, A. Self-Efficacy Mechanism in Human Agency. Am. Psychol. 1982, 37, 122. [Google Scholar] [CrossRef]
- Huang, X.; Zhang, S.; Zhang, J.; Yang, K. Research on the Impact of Digital Economy on Regional Green Technology Innovation: Moderating Effect of Digital Talent Aggregation. Environ. Sci. Pollut. Res. 2023, 30, 74409–74425. [Google Scholar] [CrossRef]
- Ramdani, B.; Raja, S.; Kayumova, M. Digital Innovation in SMEs: A Systematic Review, Synthesis and Research Agenda. Inf. Technol. Dev. 2022, 28, 56–80. [Google Scholar] [CrossRef]
- Li, X.; Chen, Z.; Chen, Y. The Impact of Digital Talent Inflow on the Co-Agglomeration of the Digital Economy Industry and Manufacturing. Systems 2024, 12, 317. [Google Scholar] [CrossRef]
- Tian, Y.; Qi, K. Does Digital Transformation Promote Labor Structure Optimization in Manufacturing Enterprises? An Analysis of China’s Pilot Policy Using Time-Varying DID Model. Kybernetes 2024, 5, 5671–5698. [Google Scholar] [CrossRef]
- Shah, N.; Zehri, A.W.; Saraih, U.N.; Abdelwahed, N.A.A.; Soomro, B.A. The Role of Digital Technology and Digital Innovation towards Firm Performance in a Digital Economy. Kybernetes 2024, 53, 620–644. [Google Scholar] [CrossRef]
- Chen, Z.; Xing, R. Digital Economy, Green Innovation and High-Quality Economic Development. Int. Rev. Econ. Financ. 2025, 99, 104029. [Google Scholar] [CrossRef]
- Fiss, P.C. Building Better Causal Theories: A Fuzzy Set Approach to Typologies in Organization Research. Acad. Manag. J. 2011, 54, 393–420. [Google Scholar] [CrossRef]
- García-Castro, R.; Ariño, M.A. A General Approach to Panel Data Set-Theoretic Research. J. Adv. Manag. Sci. Inf. Syst. 2016, 2, 526. [Google Scholar] [CrossRef]
- Dul, J.; Van der Laan, E.; Kuik, R. A Statistical Significance Test for Necessary Condition Analysis. Organ. Res. Methods 2020, 23, 385–395. [Google Scholar] [CrossRef]
- Wang, J.; Wang, R.J. New-Quality Productive Forces: Indicator Construction and Spatiotemporal Evolution. J. Xi’an Univ. Financ. Econ. 2024, 37, 31–47. [Google Scholar] [CrossRef]
- Schneider, C.Q.; Wagemann, C. Set-Theoretic Methods for the Social Sciences: A Guide to Qualitative Comparative Analysis; Cambridge University Press: Cambridge, UK, 2012. [Google Scholar]
- Ragin, C.C. Redesigning Social Inquiry: Fuzzy Sets and Beyond; University of Chicago Press: Chicago, IL, USA, 2009. [Google Scholar]
- Dul, J. Necessary Condition Analysis (NCA) Logic and Methodology of “Necessary but not Sufficient” Causality. Organ. Res. Methods 2016, 19, 10–52. [Google Scholar] [CrossRef]
- Liu, J.J.; Gu, S. Research on the institutional configuration of urban digital ecological reform for the enhancement of government service efficiency: Dynamic QCA analysis based on panel data of 32 key cities. Urban Probl. 2024, 7, 58–69. [Google Scholar] [CrossRef]
- Fan, X.; Ren, S.; Liu, Y. The driving factors of green technology innovation efficiency—A study based on the dynamic QCA method. Sustainability 2023, 15, 9845. [Google Scholar] [CrossRef]
- Du, Y.Z.; Liu, Q.C.; Chen, K.W.; Xiao, R.Q.; Li, S.S. Ecosystem of Doing Business, Total Factor Productivity and Multiple Patterns of High-quality Development of Chinese Cities: A Configuration Analysis Based on Complex Systems View. Manag. World 2022, 38, 127–145. [Google Scholar] [CrossRef]
- Lu, R.Y.; Zhang, L.K.; Chen, X.L.; Zhou, D.M. The Configuration and Path of Factors Affecting the Development of Science-based Industries: A QCA Analysis Based on the Pharmaceutical Manufacturing Industry in 31 Provinces of Chinese Mainland. Sci. Technol. Prog. Policy 2022, 39, 20–28. [Google Scholar]
- Wang, Y.W.; Tan, C.H.; Song, M.L. Measurement of Knowledge Exchange Efficiency and Dynamic Configuration Analysis of Influencing Factors in Journals of Information Resource Management. J. Mod. Inf. 2024, 44, 163–177. [Google Scholar] [CrossRef]
- Plekhanov, D.; Franke, H.; Netland, T.H. Digital Transformation: A Review and Research Agenda. Eur. Manag. J. 2023, 41, 821–844. [Google Scholar] [CrossRef]


| Condition Variable | Measurement | |
|---|---|---|
| Digital infrastructure | Calculated by averaging the infrastructure, digital resources, and policy environment indicators | Infrastructure: combines the New Infrastructure Competitiveness Index, the Yunqi Index, and the Rural Digital Infrastructure Index using weighted scores |
| Digital resources: integrates the Data Circulation Index and the Open Data Index through weighted evaluation | ||
| Policy environment: assessed using the Digital Policy Index | ||
| Digital security | Assessed using the Cybersecurity Ecosystem Development Index | |
| Digital application | Calculated by averaging the Digital Government, Digital Economy, and Digital Society indices | Digital government: weighted composite of the Online Government Service Capability, Rural Governance Digitalization, and Smart Environmental Protection indices |
| Digital economy: weighted aggregation of the AI Industry Development, Big Data Industry Development, Digital Industry Electricity Consumption, Digital Economy Investor Confidence, Enterprise Digital Transformation, and Rural Economy Digitalization indices | ||
| Digital society: weighted combination of the Digital Life, Digital Inclusive Finance, Social Dispute Search, and Rural Life Digitalization indices | ||
| Digital talent | Weighted composite of the Digital Human Capital Index and the AI Developer Index | |
| Digital innovation | Quantified using the Digital Patent Index | |
| Variables | Calibration | Descriptive Statistics | ||||||
|---|---|---|---|---|---|---|---|---|
| Full Membership | Crossover | Full Non-Membership | Mean | Min | Max | SD | ||
| Outcome variable | NQPF | 0.484 | 0.217 | 0.129 | 0.255 | 0.120 | 0.550 | 0.108 |
| Condition variables | Digital infrastructure | 83.269 | 34.606 | 14.734 | 38.706 | 10.470 | 87.190 | 21.141 |
| Digital security | 57.084 | 21.921 | 12.078 | 26.628 | 10.000 | 100.000 | 17.512 | |
| Digital application | 76.617 | 38.164 | 19.573 | 42.595 | 14.980 | 92.480 | 17.881 | |
| Digital talent | 85.253 | 29.386 | 11.706 | 35.974 | 10.000 | 100.000 | 22.241 | |
| Digital innovation | 70.784 | 17.999 | 10.577 | 24.521 | 10.000 | 100.000 | 19.612 | |
| Condition Variable | Method | Accuracy | Effect Size (d) | p-Value 1 |
|---|---|---|---|---|
| Digital infrastructure | CR | 95.6% | 0.021 | 0.001 |
| CE | 100% | 0.025 | 0.000 | |
| Digital security | CR | 100% | 0.007 | 0.097 |
| CE | 100% | 0.013 | 0.037 | |
| Digital application | CR | 95.6% | 0.031 | 0.000 |
| CE | 100% | 0.024 | 0.001 | |
| Digital talent | CR | 91.1% | 0.122 | 0.000 |
| CE | 100% | 0.024 | 0.006 | |
| Digital innovation | CR | 100% | 0.008 | 0.028 |
| CE | 100% | 0.017 | 0.007 |
| Condition Variable | High NQPF Development | Non-High NQPF Development | ||||||
|---|---|---|---|---|---|---|---|---|
| Aggregated Consistency | Aggregated Coverage | Inter-Group Consistency Distance | Intra-Group Consistency Distance | Aggregated Consistency | Aggregated Coverage | Inter-Group Consistency Distance | Intra-Group Consistency Distance | |
| Digital infrastructure | 0.791 | 0.854 | 0.099 | 0.362 | 0.461 | 0.522 | 0.241 | 0.506 |
| ~Digital infrastructure | 0.557 | 0.496 | 0.068 | 0.500 | 0.871 | 0.814 | 0.104 | 0.219 |
| Digital security | 0.817 | 0.877 | 0.093 | 0.282 | 0.505 | 0.569 | 0.277 | 0.581 |
| ~Digital security | 0.599 | 0.536 | 0.041 | 0.443 | 0.891 | 0.836 | 0.074 | 0.155 |
| Digital application | 0.854 | 0.853 | 0.085 | 0.299 | 0.511 | 0.536 | 0.233 | 0.489 |
| ~Digital application | 0.535 | 0.511 | 0.131 | 0.518 | 0.860 | 0.861 | 0.110 | 0.230 |
| Digital talent | 0.818 | 0.859 | 0.159 | 0.305 | 0.507 | 0.559 | 0.162 | 0.339 |
| ~Digital talent | 0.579 | 0.529 | 0.214 | 0.472 | 0.872 | 0.834 | 0.148 | 0.311 |
| Digital innovation | 0.788 | 0.902 | 0.107 | 0.316 | 0.462 | 0.555 | 0.457 | 0.960 |
| ~Digital innovation | 0.611 | 0.520 | 0.055 | 0.437 | 0.918 | 0.819 | 0.104 | 0.219 |
| Cause-and-Effect Combinations | Year | |||||
|---|---|---|---|---|---|---|
| 2019 | 2020 | 2021 | 2022 | |||
| Situation 1 | Digital infrastructure and non-high NQPF development | Inter-group consistency | 0.554 | 0.494 | 0.331 | 0.483 |
| Inter-group coverage | 0.542 | 0.509 | 0.491 | 0.539 | ||
| Situation 2 | Digital security and non-high NQPF development | Inter-group consistency | 0.411 | 0.680 | 0.464 | 0.478 |
| Inter-group coverage | 0.498 | 0.612 | 0.583 | 0.570 | ||
| Situation 3 | Digital application and non-high NQPF development | Inter-group consistency | 0.666 | 0.482 | 0.455 | 0.458 |
| Inter-group coverage | 0.567 | 0.531 | 0.525 | 0.515 | ||
| Situation 4 | ~Digital talent and high NQPF development | Inter-group consistency | 0.676 | 0.629 | 0.549 | 0.441 |
| Inter-group coverage | 0.569 | 0.583 | 0.460 | 0.484 | ||
| Situation 5 | Digital innovation and non-high NQPF development | Inter-group consistency | 0.738 | 0.398 | 0.370 | 0.367 |
| Inter-group coverage | 0.646 | 0.500 | 0.523 | 0.511 | ||
| Condition Variable | High NQPF Development | |||
|---|---|---|---|---|
| S1 | S2 | S3 | S4 | |
| Digital infrastructure | ⏺ | ⏺ | • | |
| Digital security | • | ⏺ | ⏺ | |
| Digital application | ⏺ | ⏺ | ⏺ | |
| Digital talent | ⏺ | ⏺ | • | |
| Digital innovation | ⏺ | • | • | |
| Consistency | 0.946 | 0.976 | 0.964 | 0.978 |
| Raw coverage | 0.705 | 0.643 | 0.677 | 0.655 |
| Unique coverage | 0.067 | 0.005 | 0.040 | 0.018 |
| Inter-group consistency distance | 0.047 | 0.027 | 0.038 | 0.027 |
| Intra-group consistency distance | 0.138 | 0.098 | 0.109 | 0.092 |
| Overall coverage | 0.767 | |||
| Overall consistency | 0.938 | |||
| Variable | Coefficient | Std. Error | t-Statistic | p-Value | 95% Confidence Interval | |
|---|---|---|---|---|---|---|
| Lower bound | Upper bound | |||||
| const | −0.0019 | 0.002 | −0.830 | 0.409 | −0.006 | 0.003 |
| resid_lag | 0.0998 | 0.104 | 0.959 | 0.340 | −0.107 | 0.307 |
| Configuration | SD | Statistics | p | Cohen’s f |
|---|---|---|---|---|
| Configuration S1 | 0.250 | 7.178 | 0.028 ** | 0.575 |
| Configuration S2 | 0.266 | 8.426 | 0.015 ** | 0.640 |
| Configuration S3 | 0.255 | 8.062 | 0.018 ** | 0.620 |
| Configuration S4 | 0.260 | 8.868 | 0.012 ** | 0.664 |
| Regional | S1 | S2 | S3 | S4 |
|---|---|---|---|---|
| Eastern China | 0.774 | 0.745 | 0.705 | 0.734 |
| Central China | 0.648 | 0.639 | 0.593 | 0.618 |
| Western China | 0.477 | 0.400 | 0.387 | 0.387 |
| Condition Variable | Non-High NQPF Development | |||||
|---|---|---|---|---|---|---|
| NS1 | NS2 | NS3 | NS4 | NS5 | NS6 | |
| Digital infrastructure | ⊗ | ⊗ | • | ⊗ | ⊗ | |
| Digital security | ᳁ | ᳁ | ᳁ | |||
| Digital application | ⊗ | ⊗ | ⊗ | ⊗ | • | |
| Digital talent | ᳁ | ᳁ | ᳁ | |||
| Digital innovation | ⊗ | ⊗ | ⊗ | • | ⊗ | |
| Consistency | 0.904 | 0.900 | 0.899 | 0.932 | 0.967 | 0.960 |
| Raw coverage | 0.778 | 0.786 | 0.751 | 0.401 | 0.447 | 0.386 |
| Unique coverage | 0.016 | 0.030 | 0.011 | 0.009 | 0.006 | 0.008 |
| Inter-group consistency distance | 0.055 | 0.041 | 0.052 | 0.036 | 0.027 | 0.019 |
| Intra-group consistency distance | 0.144 | 0.144 | 0.144 | 0.127 | 0.081 | 0.098 |
| Overall coverage | 0.882 | |||||
| Overall consistency | 0.871 | |||||
| Condition Variable | High NQPF Development Original Consistency Threshold = 0.80 | High NQPF Development Original Consistency Threshold = 0.85 | ||||||
|---|---|---|---|---|---|---|---|---|
| S1 | S2 | S3 | S4 | S1 | S2 | S3 | S4 | |
| Digital infrastructure | ⏺ | ⏺ | • | ⏺ | ⏺ | • | ||
| Digital security | • | ⏺ | ⏺ | • | ⏺ | ⏺ | ||
| Digital application | ⏺ | ⏺ | ⏺ | ⏺ | ⏺ | ⏺ | ||
| Digital talent | ⏺ | ⏺ | • | ⏺ | ⏺ | • | ||
| Digital innovation | ⏺ | • | • | ⏺ | • | • | ||
| Consistency | 0.946 | 0.976 | 0.964 | 0.978 | 0.946 | 0.976 | 0.964 | 0.978 |
| Raw coverage | 0.705 | 0.643 | 0.677 | 0.655 | 0.705 | 0.643 | 0.677 | 0.655 |
| Unique coverage | 0.067 | 0.005 | 0.040 | 0.018 | 0.067 | 0.005 | 0.040 | 0.018 |
| Inter-group consistency distance | 0.047 | 0.027 | 0.038 | 0.027 | 0.047 | 0.027 | 0.038 | 0.027 |
| Intra-group consistency distance | 0.138 | 0.098 | 0.109 | 0.092 | 0.138 | 0.098 | 0.109 | 0.092 |
| Overall coverage | 0.767 | 0.767 | ||||||
| Overall consistency | 0.938 | 0.938 | ||||||
| Condition Variable | High NQPF Development PRI Threshold = 0.60 | High NQPF Development PRI Threshold = 0.65 | ||||||
|---|---|---|---|---|---|---|---|---|
| S1 | S2 | S3 | S4 | S1 | S2 | S3 | S4 | |
| Digital infrastructure | ⏺ | ⏺ | • | ⏺ | ⏺ | • | ||
| Digital security | • | ⏺ | ⏺ | • | ⏺ | ⏺ | ||
| Digital application | ⏺ | ⏺ | ⏺ | ⏺ | ⏺ | ⏺ | ||
| Digital talent | ⏺ | ⏺ | • | ⏺ | ⏺ | • | ||
| Digital innovation | ⏺ | • | • | ⏺ | • | • | ||
| Consistency | 0.946 | 0.976 | 0.964 | 0.978 | 0.946 | 0.976 | 0.964 | 0.978 |
| Raw coverage | 0.705 | 0.643 | 0.677 | 0.655 | 0.705 | 0.643 | 0.677 | 0.655 |
| Unique coverage | 0.067 | 0.005 | 0.040 | 0.018 | 0.067 | 0.005 | 0.040 | 0.018 |
| Inter-group consistency distance | 0.047 | 0.027 | 0.038 | 0.027 | 0.047 | 0.027 | 0.038 | 0.027 |
| Intra-group consistency distance | 0.138 | 0.098 | 0.109 | 0.092 | 0.138 | 0.098 | 0.109 | 0.092 |
| Overall coverage | 0.767 | 0.767 | ||||||
| Overall consistency | 0.938 | 0.938 | ||||||
Disclaimer/Publisher’s Note: The statements, opinions and data contained in all publications are solely those of the individual author(s) and contributor(s) and not of MDPI and/or the editor(s). MDPI and/or the editor(s) disclaim responsibility for any injury to people or property resulting from any ideas, methods, instructions or products referred to in the content. |
© 2025 by the authors. Licensee MDPI, Basel, Switzerland. This article is an open access article distributed under the terms and conditions of the Creative Commons Attribution (CC BY) license (https://creativecommons.org/licenses/by/4.0/).
Share and Cite
Li, Y.; Zhang, T. How Does the Digital Ecosystem Foster New Quality Productive Forces? A Dynamic QCA of Sustainable Development Pathways in China. Sustainability 2025, 17, 4935. https://doi.org/10.3390/su17114935
Li Y, Zhang T. How Does the Digital Ecosystem Foster New Quality Productive Forces? A Dynamic QCA of Sustainable Development Pathways in China. Sustainability. 2025; 17(11):4935. https://doi.org/10.3390/su17114935
Chicago/Turabian StyleLi, Yanhua, and Tingyu Zhang. 2025. "How Does the Digital Ecosystem Foster New Quality Productive Forces? A Dynamic QCA of Sustainable Development Pathways in China" Sustainability 17, no. 11: 4935. https://doi.org/10.3390/su17114935
APA StyleLi, Y., & Zhang, T. (2025). How Does the Digital Ecosystem Foster New Quality Productive Forces? A Dynamic QCA of Sustainable Development Pathways in China. Sustainability, 17(11), 4935. https://doi.org/10.3390/su17114935