

Exploring the Impact of Board Size on ESG Controversies: New Evidence from China


Abstract
1. Introduction
2. Theoretical Background and Hypotheses Development
2.1. Theoretical Background
2.1.1. Stakeholder Theory
2.1.2. Agency Theory
2.2. Literature Review and Hypotheses Development
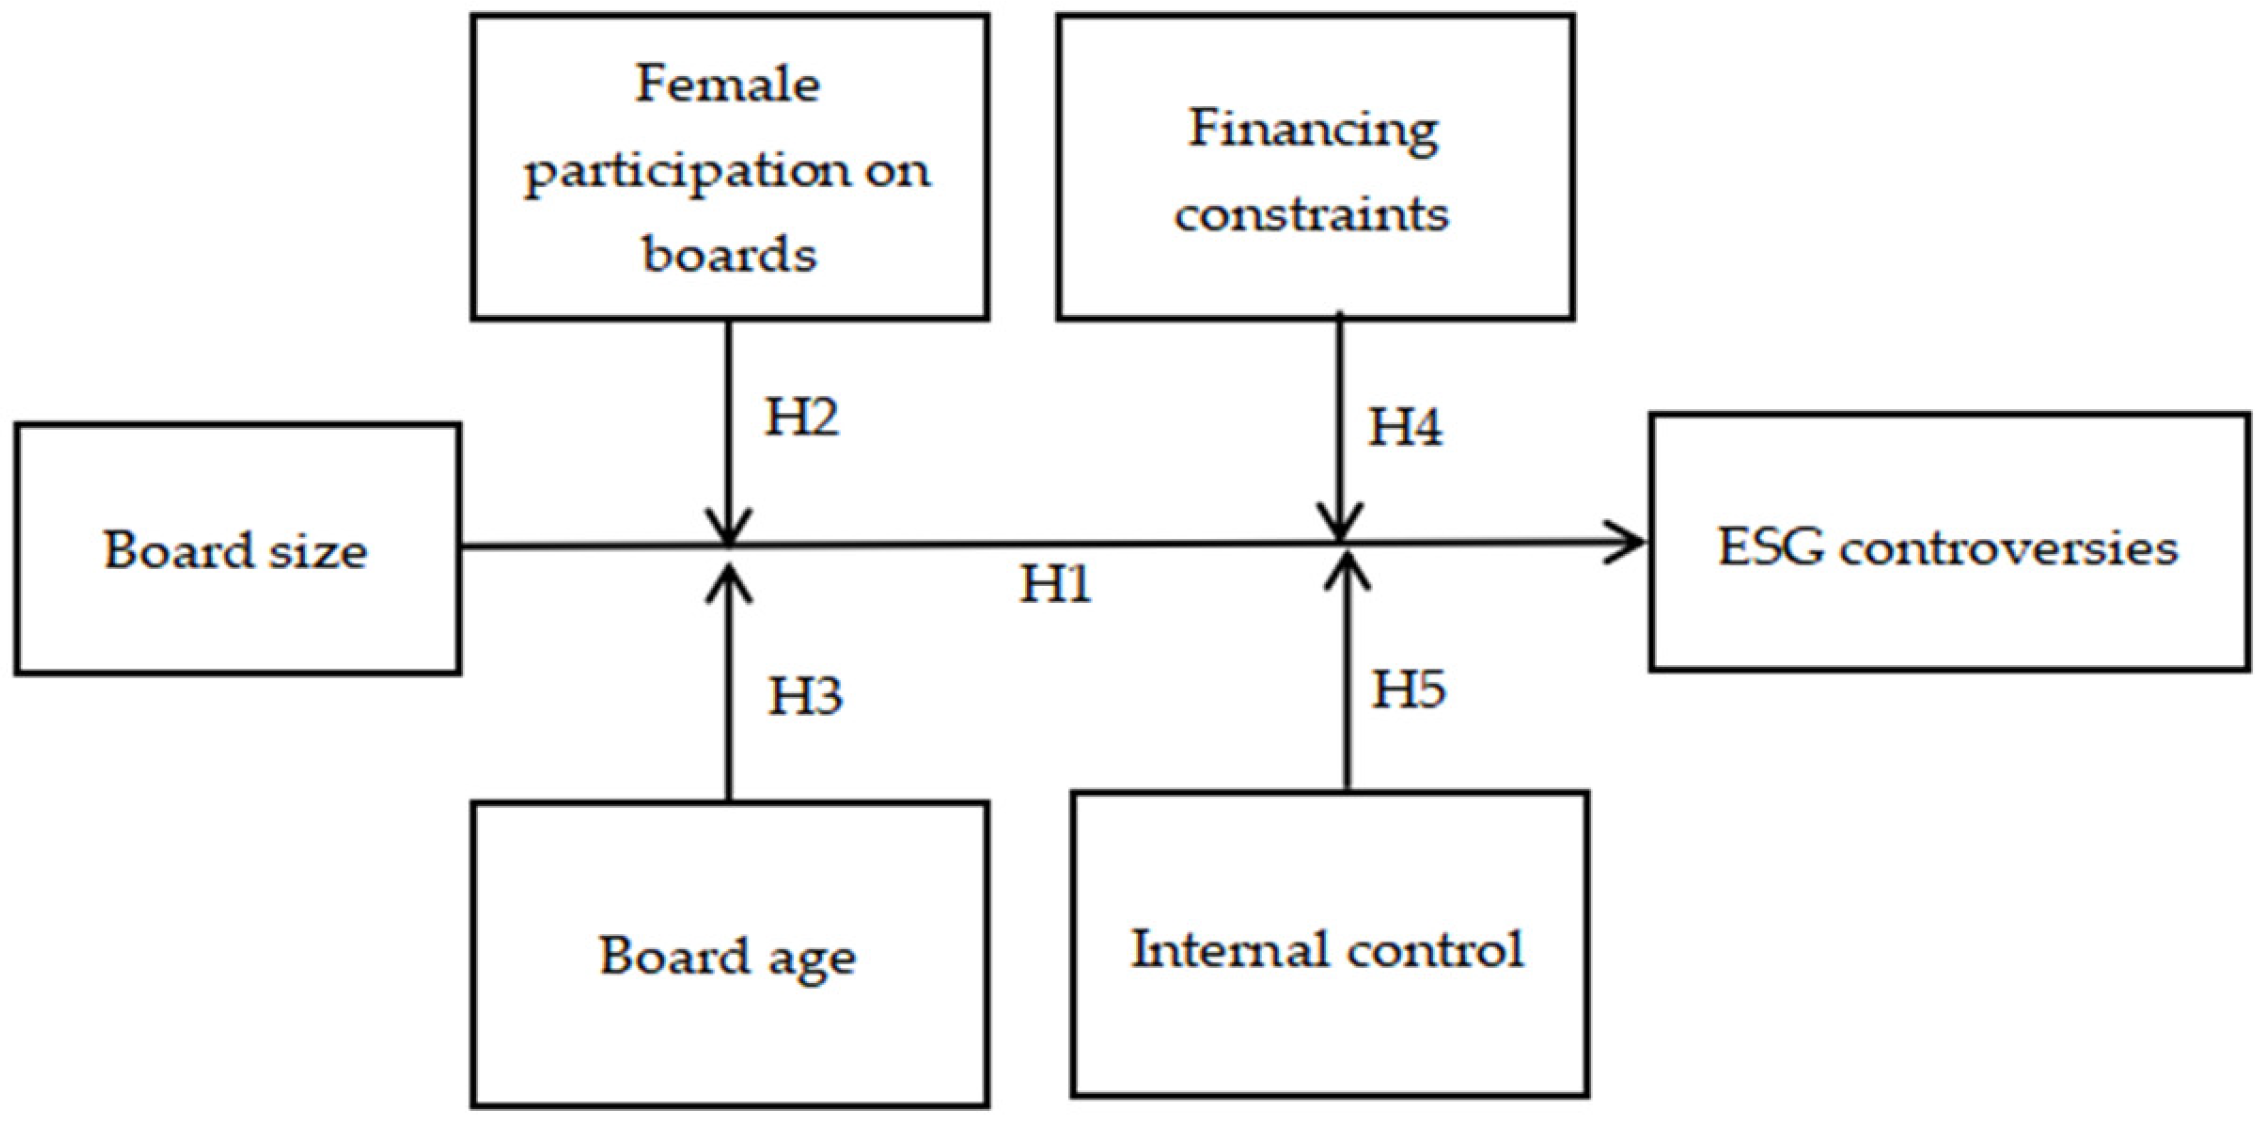
2.2.1. Board Size and ESG Controversies
2.2.2. Moderating Effect of Female Participation on Corporate Boards
2.2.3. Moderating Effect of Board Age
2.2.4. Moderating Effect of Financing Constraints
2.2.5. Moderating Effect of Internal Control
3. Methodology
3.1. Sample
3.2. Variables
3.2.1. Dependent Variable
3.2.2. Independent Variable
3.2.3. Moderators
3.2.4. Control Variables
3.3. Models
4. Results and Discussion
4.1. Descriptive Statistics
4.2. Correlation Analysis
4.3. Regression Results
4.4. Robustness Check
4.5. Moderating Effects Analysis
4.6. Heterogeneous Analysis
4.7. Additional Analysis
5. Conclusions
Author Contributions
Funding
Institutional Review Board Statement
Informed Consent Statement
Data Availability Statement
Conflicts of Interest
Appendix A

| Variable | Unmatched (U) | Mean | Bias (%) | Reduct (%) | t Test | ||
|---|---|---|---|---|---|---|---|
| Marched (M) | Treated | Control | t Value | p Value | |||
| Size | U | 24.7520 | 24.0220 | 55.5000 | 89.4000 | 14.5400 | 0.0000 |
| M | 24.7050 | 24.7830 | −5.9000 | −1.2100 | 0.2270 | ||
| Lev | U | 0.5095 | 0.4650 | 23.7000 | 96.5000 | 6.0400 | 0.0000 |
| M | 0.5054 | 0.5070 | −0.8000 | −0.1800 | 0.8580 | ||
| Roa | U | 0.0552 | 0.0686 | −18.2000 | 73.7000 | −4.4900 | 0.0000 |
| M | 0.0561 | 0.0596 | −4.8000 | −1.0600 | 0.2880 | ||
| Growth | U | 0.1765 | 0.2053 | −4.5000 | 58.2000 | −1.1800 | 0.2370 |
| M | 0.1790 | 0.1910 | −1.9000 | −0.3700 | 0.7100 | ||
| Inde | U | 0.3705 | 0.3883 | −30.4000 | 84.8000 | −7.3500 | 0.0000 |
| M | 0.3718 | 0.3745 | −4.6000 | −1.1000 | 0.2700 | ||
| Dual | U | 0.1545 | 0.2644 | −27.2000 | 75.2000 | −6.8700 | 0.0000 |
| M | 0.1601 | 0.1329 | 6.8000 | 1.6500 | 0.0990 | ||
| Top | U | 0.3949 | 0.3665 | 16.6000 | 51.3000 | 4.4100 | 0.0000 |
| M | 0.3894 | 0.4032 | −8.1000 | −1.7200 | 0.0850 | ||
References
- Xu, J.; Liu, F.; Shang, Y. R&D investment, ESG performance and green innovation performance: Evidence from China. Kybernetes 2020, 50, 737–756. [Google Scholar]
- Bruna, M.G.; Loprevite, S.; Raucci, D.; Ricca, B.; Rupo, D. Investigating the marginal impact of ESG results on corporate financial performance. Financ. Res. Lett. 2022, 47, 102828. [Google Scholar] [CrossRef]
- Bhandari, K.R.; Ranta, M.; Salo, J. The resource-based view, stakeholder capitalism, ESG, and sustainable competitive advantage: The firm’s embeddedness into ecology, society, and governance. Bus. Strategy Environ. 2022, 31, 1525–1537. [Google Scholar] [CrossRef]
- Chen, S.; Song, Y.; Gao, P. Environmental, social, and governance (ESG) performance and financial outcomes: Analyzing the impact of ESG on financial performance. J. Environ. Manag. 2023, 345, 118829. [Google Scholar] [CrossRef]
- DasGupta, R. Financial performance shortfall, ESG controversies, and ESG performance: Evidence from firms around the world. Financ. Res. Lett. 2022, 46, 102487. [Google Scholar] [CrossRef]
- Agnese, P.; Battaglia, F.; Busato, F.; Taddeo, S. ESG controversies and governance: Evidence from the banking industry. Financ. Res. Lett. 2023, 53, 103397. [Google Scholar] [CrossRef]
- Agnese, P.; Cerciello, M.; Oriani, R.; Taddeo, S. ESG controversies and profitability in the European banking sector. Financ. Res. Lett. 2024, 61, 105042. [Google Scholar] [CrossRef]
- Aouadi, A.; Marsat, S. Do ESG controversies matter for firm value? Evidence from international data. J. Bus. Ethics 2018, 151, 1027–1047. [Google Scholar] [CrossRef]
- Ghafoor, A.; Gull, A.A. Do co-opted boards protect CEOs from ESG controversies? Financ. Res. Lett. 2024, 63, 105263. [Google Scholar] [CrossRef]
- Nirino, N.; Santoro, G.; Miglietta, N.; Quaglia, R. Corporate controversies and company’s financial performance: Exploring the moderating role of ESG practices. Technol. Forecast. Soc. Change 2021, 162, 120341. [Google Scholar] [CrossRef]
- Treepongkaruna, S.; Kyaw, K.; Jiraporn, P. Shareholder litigation rights and ESG controversies: A quasi-natural experiment. Int. Rev. Financ. Anal. 2022, 84, 102396. [Google Scholar] [CrossRef]
- Xue, R.; Wang, H.; Yang, Y.; Linnenluecke, M.K.; Jin, K.; Cai, C.W. The adverse impact of corporate ESG controversies on sustainable investment. J. Clean. Prod. 2023, 427, 139237. [Google Scholar] [CrossRef]
- Xiao, H. Research progress on ESG controversies. Econ. Perspect. 2024, 65, 145–160. (In Chinese) [Google Scholar]
- Melón-Izco, A.; Ruiz-Cabestre, F.J.; Ruiz-Olalla, M.C. Diversity in the board of directors and good governance practices. Econ. Bus. Lett. 2020, 9, 97–105. [Google Scholar] [CrossRef]
- Safiullah, M.; Miah, M.D.; Azad, A.S.; Hassan, M.K. Does the board of directors influence Shariah governance in Islamic banks? Pac.-Basin Financ. J. 2024, 85, 102346. [Google Scholar] [CrossRef]
- Treepongkaruna, S.; Kyaw, K.; Jiraporn, P. ESG controversies and corporate governance: Evidence from board size. Bus. Strategy Environ. 2024, 33, 4218–4232. [Google Scholar] [CrossRef]
- Chatjuthamard, P.; Ongsakul, V.; Jiraporn, P.; Uyar, A. Corporate governance and generalist CEOs: Evidence from board size. Corp. Gov.-Int. J. Bus. Soc. 2022, 22, 148–158. [Google Scholar] [CrossRef]
- de Villiers, C.; Naiker, V.; van Staden, C.J. The effect of board characteristics on firm environmental performance. J. Manag. 2011, 37, 1636–1663. [Google Scholar] [CrossRef]
- Huang, Y.S.; Wang, C.-J. Corporate governance and risk-taking of Chinese firms: The role of board size. Int. Rev. Econ. Financ. 2015, 37, 96–113. [Google Scholar] [CrossRef]
- Fan, Y.; Li, S.; Yang, W. The impact of the percentage of female directors on corporate ESG score. Financ. Res. Lett. 2024, 63, 105376. [Google Scholar] [CrossRef]
- Ma, A.K.F.; Chen, Y. Board attributes, ownership structure, and corporate social responsibility: Evidence from A-share listed technological companies in China. Soc. Bus. Rev. 2022, 19, 181–206. [Google Scholar] [CrossRef]
- He, G.; Liu, Y.; Chen, F. Research on the impact of environment, society, and governance (ESG) on firm risk: An explanation from a financing constraints perspective. Financ. Res. Lett. 2023, 58, 104038. [Google Scholar] [CrossRef]
- Koo, J.E.; Ki, E.S. Internal control personnel’s experience, internal control weaknesses, and ESG rating. Sustainability 2020, 12, 8645. [Google Scholar] [CrossRef]
- Freeman, R.E. Strategic Management: A Stakeholder Approach; Cambridge University Press: Boston, MA, USA, 1984. [Google Scholar]
- Al Amosh, H. Exchange Rate Volatility and ESG Performance: An International Empirical Analysis. J. Corp. Account. Financ. 2024. Early View. [Google Scholar] [CrossRef]
- Kušnírová, D.; Bubelíny, O.; Ďurišová, M. Value Management: Enterprises’ Interest in Stakeholders and Its Impact on Creating Sustainable Relationships with Suppliers and Buyers. Sustainability 2024, 16, 7148. [Google Scholar] [CrossRef]
- Rathobei, K.E.; Ranängen, H.; Lindman, A. Stakeholder integration in sustainable business models to enhance value delivery for a broader range of stakeholders. Bus. Strategy Environ. 2024, 33, 3687–3706. [Google Scholar] [CrossRef]
- Talan, G.; Sharma, G.D.; Pereira, V.; Muschert, G.W. From ESG to holistic value addition: Rethinking sustainable investment from the lens of stakeholder theory. Int. Rev. Econ. Financ. 2024, 96, 103530. [Google Scholar] [CrossRef]
- Berle, A.A.; Means, G.C. The Modern Corporation and Private Property; revised edition (1967); Harvourt, Brace and World, Inc.: New York, NY, USA, 1932. [Google Scholar]
- Zhou, Z.; Yin, Y.; Zhou, M.; Cheng, H.; Pardalos, P.M. Equity-based Incentive to Coordinate Shareholder-manager Interests under Information Asymmetry. J. Ind. Manag. Optim. 2022, 18, 4447–4470. [Google Scholar] [CrossRef]
- Yan, T.; Hyman, M.R. The principal-agent problem and its mitigation: A critical historical analysis. J. Manag. Hist. 2024, 30, 615–636. [Google Scholar] [CrossRef]
- Benson, B.W.; James, H.L.; Park, J.C. Heterogeneity in the Effect of Managerial Equity Incentives on Firm Value. Financ. Rev. 2019, 54, 583–638. [Google Scholar] [CrossRef]
- Alhejji, A.I.; Khawaja, A.T. Effects of Board Size and Board Composition on Firms’ Financial Performance in Saudi Arabia. Int. Trans. J. Eng. Manag. Appl. Sci. Technol. 2021, 12, 12A12T. [Google Scholar] [CrossRef]
- Jensen, M.C. The modern industrial revolution, exit, and the failure of internal control systems. J. Financ. 1993, 48, 831–880. [Google Scholar] [CrossRef]
- Meliá-Martí, E.; Tormo-Carbó, G.; Fernández-Guadaño, J. Board gender diversity and employee productivity. The moderating role of female leaders. Eur. Res. Manag. Bus. Econ. 2024, 30, 100257. [Google Scholar] [CrossRef]
- Bosone, C.; Bogliardi, S.M.; Giudici, P. Are ESG Female? The Hidden Benefits of Female Presence on Sustainable Finance. Rev. Econ. Anal. 2022, 14, 253–274. [Google Scholar] [CrossRef]
- Meng, X.; Zhu, P. Females’ social responsibility: The impact of female executives on ESG performance. Appl. Econ. Lett. 2024, 31, 1292–1297. [Google Scholar] [CrossRef]
- Yang, T.; Huang, A.; Shang, L.-D. Diverse links: Female board representation and ESG in varied business landscapes. J. Clean. Prod. 2025, 490, 144720. [Google Scholar] [CrossRef]
- Fenoy-Castaño, C.; Martínez-Romero, M.J.; Martínez-Alonso, R. Does the Female Presence in Corporate Governance Influence the Level of Indebtedness in Agri-Food Family Firms? Agriculture 2021, 11, 1135. [Google Scholar] [CrossRef]
- Amin, A.; Ali, R.; Rehman, R.U.; Naseem, M.A.; Ahmad, M.I. Female presence in corporate governance, firm performance, and the moderating role of family ownership. Econ. Res.-Ekon. Istraz. 2022, 35, 929–948. [Google Scholar] [CrossRef]
- Brahma, S.; Nwafor, C.; Boateng, A. Board gender diversity and firm performance: The UK evidence. Int. J. Financ. Econ. 2021, 26, 5704–5719. [Google Scholar] [CrossRef]
- Menicucci, E.; Paolucci, G. Board Diversity and ESG Performance: Evidence from the Italian Banking Sector. Sustainability 2022, 14, 13447. [Google Scholar] [CrossRef]
- Gao, Y.; Tian, X.; Xu, J. Intellectual Capital, Board Diversity, and Firms’ Financial Performance: A Complex System Perspective. Systems 2024, 12, 363. [Google Scholar] [CrossRef]
- Wu, Z.; Gao, J.; Luo, C.; Xu, H.; Shi, G. How does boardroom diversity influence the relationship between ESG and firm financial performance? Int. Rev. Econ. Financ. 2024, 89, 713–730. [Google Scholar] [CrossRef]
- Oliveira, M.; Zhang, S. The trends and determinants of board gender and age diversities. Financ. Res. Lett. 2022, 46, 102798. [Google Scholar] [CrossRef]
- EmadEldeen, R.; Elbayuomi, A.F.; Elmoursy, H.; Bouaddi, M.; Basuony, M.A.K. Does Board Diversity Drive Sustainability? Evidence from UK-Listed Companies. Sustainability 2025, 17, 1177. [Google Scholar] [CrossRef]
- Jeyhunov, A.; Kim, J.D.; Bae, S.M. The Effects of Board Diversity on Korean Companies’ ESG Performance. Sustainability 2025, 17, 787. [Google Scholar] [CrossRef]
- Islam, A.R.M.; Luo, R.H. Financing constraints and investment efficiency: Evidence from a panel of Canadian forest firms. Appl. Econ. 2018, 50, 5142–5154. [Google Scholar] [CrossRef]
- Luo, H.; Islam, A.M.; Wang, R. Financing Constraints and Investment Efficiency in Canadian Real Estate and Construction Firms: A Stochastic Frontier Analysis. Sage Open 2021, 11, 21582440211031502. [Google Scholar] [CrossRef]
- Ng, Y.L.; Lau, W.T.; Soh, W.N.; Razak, N.H.A. Financial constraints of ASEAN firms: Impact alleviation by ESG pillars. Econ. Financ. Lett. 2024, 11, 126–145. [Google Scholar] [CrossRef]
- Du, Y.; Zhang, J.; Deng, H. Environmental, Social and Governance (ESG), Financing constraints, and Enterprise Value. Transform. Bus. Econ. 2023, 22, 1039–1059. [Google Scholar]
- Ho, L.; Nguyen, V.; Dang, T. ESG and firm performance: Do stakeholder engagement, financial constraints and religiosity matter? J. Asian Bus. Econ. Stud. 2024, 31, 263–276. [Google Scholar] [CrossRef]
- Xu, J.; Song, D.S.; Sim, J.W. Internal control, executive compensation and firm performance: An empirical analysis of strategic emerging enterprises. J. Comput. Theor. Nanosci. 2017, 14, 2853–2859. [Google Scholar] [CrossRef]
- Chauvey, J.N.; Naro, G. Internal control and risk management: From compliance to strategy The risk mapping case in a French insurance company. Comptab. Controle Audit 2023, 29, 85–129. [Google Scholar] [CrossRef]
- Wu, Z.; Lin, S.; Chen, T.; Luo, C.; Xu, H. Does effective corporate governance mitigate the negative effect of ESG controversies on firm value? Econ. Anal. Policy 2023, 80, 1772–1793. [Google Scholar] [CrossRef]
- Khlif, H.; Samaha, K.; Amara, I. Internal control quality and voluntary disclosure: Does CEO duality matter? J. Appl. Account. Res. 2021, 22, 286–306. [Google Scholar] [CrossRef]
- Boufounou, P.; Eriotis, N.; Kounadeas, T.; Argyropoulos, P.; Poulopoulos, J. Enhancing Internal Control Mechanisms in Local Government Organizations: A Crucial Step towards Mitigating Corruption and Ensuring Economic Development. Economies 2024, 12, 78. [Google Scholar] [CrossRef]
- LSEG ESG Scores. Available online: https://www.lseg.com/en/data-analytics/sustainable-finance/esg-scores (accessed on 12 February 2025).
- CSMAR. Available online: https://data.csmar.com/ (accessed on 10 November 2023).
- Nuswantara, D.A.; Fachruzzaman; Prameswari, R.D.; Suyanto; Rusdiyanto, R.; Hendrati, I.M. The role of political connection to moderate board size, woman on boards on financial distress. Cogent Bus. Manag. 2023, 10, 2156704. [Google Scholar] [CrossRef]
- Hadlock, C.J.; Pierce, J.R. New evidence on measuring financial constraints: Moving beyond the KZ index. Rev. Financ. Stud. 2010, 23, 1909–1940. [Google Scholar] [CrossRef]
- Xu, J.; Yin, J. Digital transformation and ESG performance: The chain mediating role of technological innovation and financing constraints. Financ. Res. Lett. 2025, 71, 106387. [Google Scholar] [CrossRef]
- Wang, S.; Zhang, X.; Cebula, R.J.; Foley, M. Cross-shareholding, Managerial capabilities, and Strategic risk-taking in enterprises: A game or a win-win? Financ. Res. Lett. 2024, 62, 105228. [Google Scholar] [CrossRef]
- Issa, A.; Hanaysha, J.R. Breaking the glass ceiling for a sustainable future: The power of women on corporate boards in reducing ESG controversies. Int. J. Account. Inf. Manag. 2023, 31, 623–646. [Google Scholar] [CrossRef]
- Shakil, M.H. Environmental, social and governance controversies: A bibliometric review and research agenda. Financ. Res. Lett. 2024, 70, 106325. [Google Scholar] [CrossRef]
- Guo, Z. Analysis of Influencing FACTORS of information Asymmetry: Evidence from Listed Companies in China. Master’s Dissertation, Chinese Academy of International Trade and Economic Cooperation, Beijing, China, 2019. [Google Scholar]
- Liu, Y.; Tang, Y.; Yang, Y. Are female directors more employee-friendly? Board gender diversity and employee benefits: Evidence from China. Front. Psychol. 2024, 15, 1285056. [Google Scholar] [CrossRef]
| Variable Type | Variable | Symbol | Measurement |
|---|---|---|---|
| Dependent variable | ESG controversies | Esgc | 100—ESG controversies scores, 0 means no controversies |
| Independent variable | Board size | LnBoard | Natural logarithm of the number of directors on the board |
| Board | The number of directors on the board | ||
| Moderating variables | Female participation on boards | Female | Percentage of female directors on the board |
| Board age | Bage | Average age of all board members | |
| Financing constraints | FC | SA index | |
| Internal control | IC | Internal control index from the DIB database | |
| Control variables | Firm size | Size | Natural logarithm of total assets |
| Firm leverage | Lev | Total debts/total assets | |
| Return on assets | Roa | Net income/total assets | |
| Sales growth rate | Growth | (Current year’s sales-last year’s sales)/last year’s sales | |
| Cash flow | Cash | Operating cash flow/total assets | |
| Independent director proportion | Inde | Percentage of independent directors on the board | |
| CEO duality | Dual | Dummy variable that takes 1 if the CEO and the chairman are the same person and 0 otherwise | |
| Shareholding concentration | Top | Percentage of shareholding of the largest shareholder |
| Variable | N | Mean | Median | Minimum | Maximum | SD |
|---|---|---|---|---|---|---|
| Esgc | 3556 | 0.8042 | 0 | 0 | 35.2900 | 4.7784 |
| Board | 3556 | 9.0408 | 9 | 5 | 15 | 2.0051 |
| Female | 3556 | 0.1771 | 0.1579 | 0 | 0.5000 | 0.1114 |
| Bage | 3556 | 51.4646 | 51.6700 | 42.8600 | 58.3600 | 3.1377 |
| FC | 3543 | −3.7632 | −3.8371 | −4.4376 | −2.4110 | 0.3803 |
| IC | 3463 | 689.3121 | 688.6200 | 338.7000 | 944.0600 | 90.1208 |
| Size | 3556 | 24.2143 | 24.0559 | 21.6806 | 28.0035 | 1.3331 |
| Lev | 3556 | 0.4762 | 0.4877 | 0.0770 | 0.8768 | 0.1918 |
| Roa | 3556 | 0.0647 | 0.0516 | −0.1247 | 0.3030 | 0.0687 |
| Growth | 3556 | 0.1721 | 0.1242 | −0.4723 | 1.6981 | 0.3176 |
| Cash | 3556 | 0.0779 | 0.0701 | −0.0881 | 0.2940 | 0.0689 |
| Inde | 3556 | 0.3838 | 0.3636 | 0.3077 | 0.6000 | 0.0613 |
| Dual | 3556 | 0.2365 | 0 | 0 | 1 | 0.4250 |
| Top | 3556 | 0.3752 | 0.3639 | 0.0782 | 0.8025 | 0.1691 |
| Variable | 1 | 2 | 3 | 4 | 5 | 6 | 7 | 8 | 9 | 10 | 11 | 12 | 13 | 14 |
|---|---|---|---|---|---|---|---|---|---|---|---|---|---|---|
| 1 Esgc | 1 | |||||||||||||
| 2 LnBoard | 0.100 *** | 1 | ||||||||||||
| 3 Female | −0.104 *** | −0.185 *** | 1 | |||||||||||
| 4 Bage | 0.094 *** | 0.178 *** | −0.358 *** | 1 | ||||||||||
| 5 FC | 0.180 *** | 0.087 *** | −0.293 *** | 0.302 *** | 1 | |||||||||
| 6 IC | 0.014 | 0.064 *** | −0.064 *** | 0.169 *** | 0.138 *** | 1 | ||||||||
| 7 Size | 0.183 *** | 0.228 *** | −0.354 *** | 0.429 *** | 0.669 *** | 0.248 *** | 1 | |||||||
| 8 Lev | 0.054 *** | 0.111 *** | −0.230 *** | 0.183 *** | 0.346 *** | 0.078 *** | 0.586 *** | 1 | ||||||
| 9 Roa | −0.023 | −0.078 *** | 0.151 *** | −0.122 *** | −0.139 *** | 0.246 *** | −0.284 *** | −0.470 *** | 1 | |||||
| 10 Growth | −0.013 | −0.047 *** | 0.063 *** | −0.126 *** | 0.014 | 0.174 *** | −0.058 *** | −0.019 | 0.402 *** | 1 | ||||
| 11 Cash | 0.021 | 0.001 | 0.070 *** | −0.038 ** | −0.079 *** | 0.107 *** | −0.161 *** | −0.329 *** | 0.612 *** | 0.165 *** | 1 | |||
| 12 Inde | 0.023 | −0.441 *** | −0.032 * | 0.110 *** | 0.148 *** | 0.051 *** | 0.096 *** | 0.043 ** | −0.003 | −0.018 | 0.007 | 1 | ||
| 13 Dual | −0.024 | −0.176 *** | 0.157 *** | −0.222 *** | −0.097 *** | −0.029 * | −0.189 *** | −0.136 *** | 0.130 *** | 0.117 *** | 0.063 *** | 0.048 *** | 1 | |
| 14 Top | 0.072 *** | 0.062 *** | −0.222 *** | 0.314 *** | 0.300 *** | 0.111 *** | 0.271 *** | 0.084 *** | −0.010 | −0.077 *** | 0.049 *** | 0.096 *** | −0.154 *** | 1 |
| Variable | (1) | (2) | (3) |
|---|---|---|---|
| Esgc | Esgc | VIF | |
| LnBoard | 3.489 ** (2.475) | 3.902 *** (3.612) | 1.38 |
| Size | −0.123 (−0.310) | 1.54 | |
| Lev | −0.781 (−0.504) | 1.20 | |
| Roa | 5.033 ** (2.018) | 1.65 | |
| Growth | 0.038 (0.106) | 1.37 | |
| Cash | −0.618 (−0.308) | 1.30 | |
| Inde | 1.869 (0.671) | 1.37 | |
| Dual | 0.053 (0.142) | 1.01 | |
| Top | −0.867 (−0.361) | 1.11 | |
| Constant | −6.783 ** (−2.215) | −5.009 (−0.513) | — |
| Year | Yes | Yes | — |
| Firm | Yes | Yes | — |
| N | 3556 | 3556 | — |
| R2 | 0.346 | 0.347 | — |
| F | 6.124 | 2.415 | — |
| Variable | (1) | (2) | (3) | (4) |
|---|---|---|---|---|
| Lagged Independent Variable | Time Span Reduction | Replacing Independent Variable | PSM | |
| LnBoard_lag | 3.457 *** (2.598) | |||
| LnBoard | 6.200 *** (2.705) | 7.205 *** (3.186) | ||
| Board | 0.456 *** (4.011) | |||
| Size | 0.152 (0.234) | 0.225 (0.229) | −0.149 (−0.375) | 0.371 (0.383) |
| Lev | −1.646 (−0.687) | −3.753 (−1.086) | −0.674 (−0.435) | −0.741 (−0.195) |
| Roa | 5.675 (1.453) | 11.575 * (1.821) | 5.108 ** (2.049) | 8.294 (1.388) |
| Growth | 0.176 (0.301) | −0.433 (−0.509) | 0.035 (0.096) | −0.076 (−0.095) |
| Cash | 0.160 (0.053) | 2.953 (0.599) | −0.595 (−0.297) | −3.008 (−0.605) |
| Inde | −3.450 (−1.005) | 1.577 (0.286) | 1.930 (0.708) | 9.776 (1.604) |
| Dual | 0.113 (0.205) | 1.305 (1.538) | 0.048 (0.126) | 0.542 (0.556) |
| Top | 1.074 (0.302) | −2.205 (−0.418) | −0.801 (−0.334) | 5.636 (1.079) |
| Constant | −8.847 (−0.561) | −16.901 (−0.699) | −0.101 (−0.011) | −30.343 (−1.265) |
| Year | Yes | Yes | Yes | Yes |
| Firm | Yes | Yes | Yes | Yes |
| N | 2688 | 1932 | 3556 | 1180 |
| R2 | 0.157 | 0.131 | 0.348 | 0.231 |
| F | 1.524 | 2.123 | 2.753 | 1.635 |
| Variable | (1) | (2) |
|---|---|---|
| Board | Esgc | |
| LnBoard | 5.861 * (1.725) | |
| IV | 0.425 *** (17.245) | |
| Size | 0.043 *** (6.334) | −0.208 (−0.494) |
| Lev | −0.020 (−0.747) | −0.687 (−0.443) |
| Roa | −0.077 * (−1.809) | 5.184 ** (2.076) |
| Growth | 0.001 (0.228) | 0.039 (0.109) |
| Cash | −0.002 (−0.057) | −0.606 (−0.303) |
| Inde | −1.151 *** (−27.562) | 4.347 (0.882) |
| Dual | −0.013 * (−1.946) | 0.074 (0.196) |
| Top | −0.090 ** (−2.209) | −0.652 (−0.270) |
| Constant | 0.703 *** (4.045) | −7.714 (−0.685) |
| Year | Yes | Yes |
| Firm | Yes | Yes |
| N | 3556 | 3556 |
| R2 | 0.149 | 0.049 |
| F | 62.788 | 5.423 |
| Kleibergen–Paap rk LM | 270.064 | |
| Cragg–Donald Wald F | 297.479 | |
| Variable | (1) | (2) | (3) | (4) |
|---|---|---|---|---|
| Esgc | Esgc | Esgc | Esgc | |
| LnBoard | 3.426 *** (3.112) | 3.463 *** (3.106) | 2.858 *** (2.608) | 4.275 *** (4.055) |
| Female | −3.091 (−1.472) | |||
| Bage | −0.021 (−0.255) | |||
| FC | −3.879 (−1.626) | |||
| IC | −0.002 (−1.351) | |||
| LnBoard × Female | −14.504 ** (−2.161) | |||
| LnBoard × Bage | 0.379 (1.629) | |||
| LnBoard × FC | 4.372 ** (2.362) | |||
| LnBoard × IC | −0.010 ** (−2.055) | |||
| Size | −0.102 (−0.256) | −0.106 (−0.264) | 0.810 (1.464) | 0.084 (0.207) |
| Lev | −0.872 (−0.562) | −0.782 (−0.504) | −0.914 (−0.604) | −0.580 (−0.373) |
| Roa | 5.082 ** (2.039) | 4.982 ** (1.991) | 2.180 (0.887) | 3.818 (1.414) |
| Growth | 0.049 (0.137) | 0.042 (0.118) | 0.146 (0.419) | 0.258 (0.723) |
| Cash | −0.589 (−0.294) | −0.659 (−0.328) | 0.276 (0.142) | 0.506 (0.254) |
| Inde | 1.416 (0.508) | 1.635 (0.585) | 1.250 (0.464) | 3.454 (1.274) |
| Dual | 0.058 (0.154) | 0.061 (0.162) | 0.157 (0.430) | 0.176 (0.474) |
| Top | −0.606 (−0.252) | −1.052 (−0.438) | −0.616 (−0.265) | −0.877 (−0.377) |
| Constant | −3.901 (−0.400) | −3.275 (−0.324) | −39.712 * (−1.926) | −10.396 (−1.042) |
| Year | Yes | Yes | Yes | Yes |
| Firm | Yes | Yes | Yes | Yes |
| N | 3556 | 3556 | 3543 | 3463 |
| R2 | 0.149 | 0.148 | 0.153 | 0.157 |
| F | 2.543 | 2.226 | 2.464 | 2.584 |
| Variable | Manufacturing Industries | Non-Manufacturing Industries | Service Industries | Heavy-Polluted Industries | Non-Heavy-Polluted Industries | High-Tech Industries | Non-High-Tech Industries |
|---|---|---|---|---|---|---|---|
| LnBoard | −1.993 (−0.954) | 18.608 *** (4.870) | 0.749 (0.830) | 11.340 ** (2.496) | 2.413 (1.598) | −1.414 (−0.634) | 11.538 *** (5.010) |
| Size | −0.596 (−0.870) | 5.435 ** (2.387) | −0.055 (−0.171) | 4.328 ** (2.340) | −1.141 ** (−2.018) | −0.794 (−1.141) | 2.473 ** (2.268) |
| Lev | −0.568 (−0.187) | −4.007 (−0.640) | 1.818 (1.496) | −4.750 (−0.652) | 0.219 (0.103) | −1.914 (−0.622) | −2.723 (−0.753) |
| Roa | 10.725 ** (2.494) | 9.859 (0.671) | −1.857 (−1.287) | 18.816 * (1.700) | 2.615 (0.772) | 8.680 ** (2.099) | 1.253 (0.183) |
| Growth | −0.257 (−0.435) | 1.070 (0.568) | 0.145 (0.608) | −1.576 (−1.000) | −0.205 (−0.411) | −0.328 (−0.538) | 0.643 (0.698) |
| Cash | −3.111 (−0.920) | −0.370 (−0.034) | 2.991 ** (2.005) | −2.516 (−0.270) | −0.410 (−0.149) | −4.056 (−1.138) | 5.229 (1.002) |
| Inde | −9.494 * (−1.686) | 24.883 *** (2.913) | −1.598 (−0.591) | 18.706 * (1.651) | −0.312 (−0.079) | −7.418 (−1.205) | 16.036 *** (2.871) |
| Dual | 0.500 (0.733) | 3.698 ** (2.063) | −0.263 (−1.070) | 2.092 (1.285) | 0.448 (0.856) | 0.292 (0.419) | 1.619 * (1.773) |
| Top | −4.724 (−1.190) | 17.564 (1.431) | 0.203 (0.090) | 5.648 (0.570) | −1.049 (−0.309) | −2.992 (−0.641) | 3.618 (0.650) |
| Constant | 24.418 (1.467) | −192.564 *** (−3.350) | −0.510 (−0.062) | −138.012 *** (−3.067) | 23.203 * (1.683) | 27.324 (1.599) | −92.396 *** (−3.478) |
| Year | Yes | Yes | Yes | Yes | Yes | Yes | Yes |
| Firm | Yes | Yes | Yes | Yes | Yes | Yes | Yes |
| N | 2111 | 840 | 605 | 879 | 2677 | 1986 | 1570 |
| R2 | 0.358 | 0.387 | 0.266 | 0.367 | 0.360 | 0.373 | 0.362 |
| F | 1.451 | 4.015 | 1.203 | 2.159 | 0.879 | 0.993 | 4.288 |
| Variable | SOEs | POEs | Eastern Regions | Central and Western Regions | Foreign-Funded Companies | Non-Foreign-Funded Companies |
|---|---|---|---|---|---|---|
| LnBoard | 8.409 *** (3.749) | −1.165 (−0.517) | 6.538 *** (3.375) | −2.343 (−1.030) | 1.102 (0.339) | 5.137 *** (3.061) |
| Size | 0.904 (0.897) | −1.097 * (−1.712) | 0.012 (0.016) | 1.363 * (1.763) | −0.459 (−0.490) | 0.530 (0.840) |
| Lev | −1.545 (−0.422) | 1.443 (0.557) | −1.455 (−0.510) | −0.412 (−0.136) | 0.218 (0.059) | −1.298 (−0.533) |
| Roa | 12.485 * (1.699) | 5.038 (1.471) | 8.954 * (1.943) | −1.497 (−0.322) | 0.583 (0.124) | 7.574 * (1.911) |
| Growth | −0.691 (−0.696) | 0.426 (0.863) | −0.386 (−0.569) | 0.576 (0.914) | −0.053 (−0.055) | −0.200 (−0.355) |
| Cash | 0.799 (0.164) | 0.079 (0.024) | −1.359 (−0.352) | 2.172 (0.638) | 0.134 (0.035) | −0.821 (−0.259) |
| Inde | 9.106 * (1.779) | −15.796 ** (−2.275) | 6.258 (1.247) | −8.020 (−1.347) | 4.145 (0.374) | 4.695 (1.101) |
| Dual | 1.734 * (1.891) | −0.547 (−0.880) | 1.506 ** (2.190) | −1.850 ** (−2.446) | −0.293 (−0.279) | 0.860 (1.458) |
| Top | −0.934 (−0.182) | 1.040 (0.214) | −2.219 (−0.500) | −0.115 (−0.024) | 14.093 (1.493) | −1.187 (−0.317) |
| Constant | −42.933 * (−1.752) | 33.940 ** (2.135) | −14.864 (−0.818) | −23.573 (−1.260) | 1.817 (0.075) | −24.252 (−1.569) |
| Year | Yes | Yes | Yes | Yes | Yes | Yes |
| Firm | Yes | Yes | Yes | Yes | Yes | Yes |
| N | 1774 | 1782 | 2688 | 868 | 210 | 3346 |
| R2 | 0.317 | 0.502 | 0.357 | 0.287 | 0.214 | 0.346 |
| F | 2.745 | 1.632 | 2.405 | 1.496 | 0.393 | 2.126 |
| Board Size | N | Esgc (Mean) |
|---|---|---|
| Small: ≤5 directors | 79 | 0 |
| Medium: 5–10 directors | 2657 | 0.5525 |
| Large: 11–17 directors | 820 | 1.6973 |
| Very large: ≥18 directors | 0 | 0 |
| Total | 3556 | 0.8042 |
Disclaimer/Publisher’s Note: The statements, opinions and data contained in all publications are solely those of the individual author(s) and contributor(s) and not of MDPI and/or the editor(s). MDPI and/or the editor(s) disclaim responsibility for any injury to people or property resulting from any ideas, methods, instructions or products referred to in the content. |
© 2025 by the authors. Licensee MDPI, Basel, Switzerland. This article is an open access article distributed under the terms and conditions of the Creative Commons Attribution (CC BY) license (https://creativecommons.org/licenses/by/4.0/).
Share and Cite
Yin, J.; Xu, J. Exploring the Impact of Board Size on ESG Controversies: New Evidence from China. Sustainability 2025, 17, 4855. https://doi.org/10.3390/su17114855
Yin J, Xu J. Exploring the Impact of Board Size on ESG Controversies: New Evidence from China. Sustainability. 2025; 17(11):4855. https://doi.org/10.3390/su17114855
Chicago/Turabian StyleYin, Jian, and Jian Xu. 2025. "Exploring the Impact of Board Size on ESG Controversies: New Evidence from China" Sustainability 17, no. 11: 4855. https://doi.org/10.3390/su17114855
APA StyleYin, J., & Xu, J. (2025). Exploring the Impact of Board Size on ESG Controversies: New Evidence from China. Sustainability, 17(11), 4855. https://doi.org/10.3390/su17114855